experimental modelling wax preparation from petroleum ... · experimental modelling wax preparation...
TRANSCRIPT
International Journal of Scientific & Engineering Research, Volume 5, Issue 1, January-2014 966 ISSN 2229-5518
IJSER © 2014 http://www.ijser.org
Experimental Modelling wax preparation from
Petroleum products and natural additives Running Title: Preparation Experimental Modeling Wax
Professor Nadira A. Hatim
Head of Prosthodontics Department
College of Dentistry-University of Mosul
Professor Dr. Amer Abdul-Rahman Taqa.
Medical scientific Department
College of Dentistry-University of Mosul
Lecturer Ahmad W. Kh. Alubaidi
Prosthodontics Department
College of Dentistry-University of Mosul
IJSER

International Journal of Scientific & Engineering Research, Volume 5, Issue 1, January-2014 967 ISSN 2229-5518
IJSER © 2014 http://www.ijser.org
ABSTRACT
Introduction: Many modelling waxes are composed of complicated mixture of
many constituents.
Aims of the study: To modify Petroleum Iraqi natural waxes (hard and soft
paraffin wax, natural and commercial beeswax) by adding some natural (gum Arabic,
rosin, Na-CMC, starch, and amaranth) and chemical (ferric oxide) to prepare new
experimental modelling waxes that can be used in prosthetic dentistry. Evaluate
physical properties according to ADA specification No. 24 and ISO 1561 in
comparison to two commercials modelling waxes (Major® and PolywaxTM).
Materials and Methods: Total samples prepared are 478 samples, and divided
into 3 groups: (1) Iraqi Petroleum natural waxes and commercial beeswax. (2) Iraqi
Petroleum natural waxes mixtures, the mixtures are either binary (Hard + soft
Paraffin) or tertiary mixtures (Beeswax). The binary mixtures are (90% + 10%) and
(80%+20%).The Tertiary mixtures are (80% + 15% + 5%) and (70% + 20% + 10%).
(3) Natural waxes and additives, the percentages of mixing are (90% natural waxes +
10 % additives) and (80% natural waxes + 20% additives). (100) samples have been
failed in flow and thermal expansion test until obtained the proper percentage of
mixing that give proper physical tests: melting point, flow, thermal expansion, and
accuracy test. Results: there were significant differences (p ≤ 0.001) between control
and experimental modelling waxes {10 (80% hard paraffin + 20% beeswax) & (90%
beeswax + 10% starch)}. The results showed that the addition of 20% Na-CMC, gum
Arabic, Starch, and rosin to hard paraffin led to decrease the maximum melting point,
flow, thermal expansion and dimensional changes but increase the minimum melting
point. Conclusions: It was concluded that the experimental modelling waxes: (80%
hard paraffin + 20% beeswax) and (90% beeswax + 10% starch) have the most nearest
properties to control and ADA specification No. 24 than other waxes.
Key Words: Paraffin, Rosin, Starch, Melting point.
IJSER

International Journal of Scientific & Engineering Research, Volume 5, Issue 1, January-2014 968 ISSN 2229-5518
IJSER © 2014 http://www.ijser.org
Introduction: Waxes form a group of thermoplastic materials which are
normally solids at room temperature but melt, without decomposition, to form mobile
liquids. They are, essentially, soft substances with poor mechanical properties and
their primary use in dentistry is to form patterns of appliances prior to casting (1).
From the early use of beeswax in the eighteenth century for making impression
to current techniques, waxes have always been among the most popular and useful of
dental materials (2,3).
The utility of dental waxes stems from several factors: they are cheap, non-
toxic, and low melting, weak solids that can be readily shaped and molded. They are
used for some of the highest precision work in dentistry, as well as cruder tasks, yet
they have the worst thermal expansion coefficient of all material used in dentistry (4,5,6). Dental waxes are very complex mixtures, perhaps containing hundreds of
compounds, mostly natural products. They are formulated by blending natural and
synthetic waxes, plus minor components such as resins, oils, and pigments, to control
the properties according to the intended use (7,8). The ultimate goal of the combination
of waxes and additives is to produce dental waxes that posses a set of given physical
properties over specified range of temperature (4).
McCrorie(9) found that many modelling waxes are composed of complicated
mixture of many constituents. It is also certain that the major component is paraffin
wax with the addition of varying amounts of higher melting point waxes such as
beeswax, carnauba wax and microcrystalline waxes.
McCrorie(10) reported that the modelling and baseplate waxes are the most
widely used dental materials. The easiness of manipulation, good sculpting properties
and simplicity of disposal of wax pattern, by boiling-out, probably account for much
of the popularity of modelling wax as a pattern material(9).
Modelling waxes are used as a pattern material, for registration of jaw
relationship and in construction of dentures (2). Heath et al.(11) stated that the
production of successful dentures necessitates the use of accurately fitting base plate
IJSER

International Journal of Scientific & Engineering Research, Volume 5, Issue 1, January-2014 969 ISSN 2229-5518
IJSER © 2014 http://www.ijser.org
materials for recording of the jaw relationship and trial insertion of the waxed-up
dentures.
Previously, two types of wax were formulated in Iraq, boxing wax (12) , and
inlay dental wax(13) from the available wax purchased from Dura Refinery Center and
other Iraqi sources.
MARTERIALS AND METHODS:
All the additives materials were prepared from the natural form as a powder
(starch, Sodium carboxymethylcellulose (Na-CMC), Gum Arabic, and Rosin). The
sieving procedure was done according to Abdullah (14) using a sieve 63 µm starts by
weighing the material. The particle size of material is made homogenous (Figure 1).
According to ADA(15), and ADA Specification No. 24 and ISO 1561(16) the coloring
agent Amaranth have been added to wax mixtures in proportion of 0.02 % at 40°C
incrementally and with continuous mixing until obtaining a uniform and desired color
that coincides with the color of commercial modeling waxes checked by naked eye.
The total number of samples that has been prepared is (478) samples. One hundred
samples failed during flow and thermal expansion tests until determining the proper
percentage of wax mixtures that give results coincide with control and ADA
specification No. 24. The final number of samples that has been used is (378) samples
(Table I).
The melting point was measured according to method reported by Vogel (17)
using Electrothermal melting point apparatus (CE, VWR, INTERNATIONAL). One
end of each of the capillary tubes had been sealed by inserting it horizontally into
extreme edge of a small Bunsen flame for a few seconds and the capillary tube is
rotated meanwhile. The prepared capillary tubes are stored in a large specimen tube.
Flow test at 40°C and 45°C was done according to ADA specification No.24 (16). The amount of force applied to the specimen is 2 kg (19.6 N) force; this load is
applied vertically to the specimen by using the standard Vicat apparatus with special
modification (Figure 2).
IJSER

International Journal of Scientific & Engineering Research, Volume 5, Issue 1, January-2014 970 ISSN 2229-5518
IJSER © 2014 http://www.ijser.org
Linear Thermal Expansion was done according to ADA specification No. 24,
2003(16). The mold was made from glass then duplicated to Aluminum (Figure 3) to
prepare the sample. The materials melted to (75 ± 5) °C by using pan and water bath.
The melted wax is then poured into a mold that has been lubricated with separating
medium (separating film for acrylic resin).The mold was preheated to (55 ±5) ºC. The
Aluminum cover preheated to (55 ± 5) º C was placed on the top of the mold, then a
weight of 90N (9kg) is placed on the top of the mold for 30 min, after that the weight
and cover were removed and excess wax trimmed away and the specimen was stored
at room temperature (20 ± 2) ºC for 24 hours before testing. The specimen is heated to
25° C and 40°C and the distance between the reference marks at the lower temperature
and change in length on heating to higher temperature is determined by electronic
digital caliper (Figure 4).
Microscopical Examination of Waxes: One milligram of wax is placed on glass
slide and heated over electric cooker until melting, then a cover slip is placed over it,
the cover slip is moved over the glass slide to scatter the wax particle and produce a
very thin layer of wax over the glass slide. The glass slide is stored at room
temperature until the wax is hardened, then examined with light microscope using the
oil lens and magnification (X=400).
Measuring the Accuracy of Experimental Modelling Wax The samples are
prepared according to ADA specification No. 24 (6 mm height and 10 mm diameter)
cylindrical in shape.
The accuracy is measured by calculating the change in height of samples after 1
hr and 24 hr at room temperature (20±2)°C, and done by taking four measurements
around the circumference and one measurement in the center of sample using
electronic digital caliper. The mean of five measurements was calculated for each
sample. The change is measured as a percentage of the initial height of the sample.
RESULTS and DISCUSSIONS: The results obtained were subjected to
statistical analyses in order to determine the best experimental modelling waxes in
groups (2 & 3). The results were obtained after the addition of coloring agents.
IJSER

International Journal of Scientific & Engineering Research, Volume 5, Issue 1, January-2014 971 ISSN 2229-5518
IJSER © 2014 http://www.ijser.org
Minimum and Maximum Melting Point (Melting range): Descriptive statistics
of minimum and maximum melting point of control and groups (1, 2 & 3) are listed in
Table (II). The results showed that all the tested samples had a melting range rather
than a sharp melting point. These results are in agreement with Craig (19) who revealed
that the waxes have a melting range rather than melting point, this can be explained on
the basis that the waxes are consist of similar types of molecules of different
molecular weights and may contain several types of molecules each having a range of
molecular weight.
Analysis of variance ANOVA (Table III) showed that there was a significant
difference (p<0.001) in the mean value of minimum and maximum melting point of
tested samples of control 1 (PolywaxTM), control 2 (Major®) and experimental groups
(2 & 3). Duncan's multiple range test, Figures (5 and 6) showed highest minimum and
maximum melting point of the experimental modeling wax 17 than others. The
experimental modeling waxes 10, 11, 14, and 15 had the most nearest maximum
melting point to control (1 & 2) than others and statistically there was no significant
difference between these waxes and control (1 & 2).
The addition of 20% Na-CMC, 20 %Gum Arabic and 20% rosin to hard
paraffin as in experimental modelling waxes 20, 21 & 22, led to raise the minimum
melting point of the hard paraffin with slight decrease in the maximum melting point.
This can be explained as these additives act as a thickener and binder agents and lead
to support the mixture during a rise in temperature (20-22).
Flow at 40ºC and 45ºC: The number of samples means and standard deviation, of
flow percentages at 40ºC and 45ºC of the tested samples of control, groups 1, 2 & 3
are listed in Table (IV). All experimental modelling waxes had flow properties that
coincide with ADA specification No.24; all flow values were located between 50%
and 90% at 45ºC which are considered as Type II dental modelling waxes (16).
Analysis of variance (ANOVA), Table (V), show that there was a significant
differences (p< 0.001) in the mean value of flow percentage at 40ºC and 45ºC of the
tested samples of control 1 (PolywaxTM), control 2 (Major®), and experimental groups
IJSER

International Journal of Scientific & Engineering Research, Volume 5, Issue 1, January-2014 972 ISSN 2229-5518
IJSER © 2014 http://www.ijser.org
(2 & 3). The results revealed that the soft paraffin had the highest flow percentage
than other experimental waxes and this may be related to its low melting point and
when the temperature raise to 40ºC and 45ºC, this temperature is near its melting
point. This is in agreement with Craig and Powers (23) who stated that the flow greatly
increases as the melting point of the wax is approached. The flow reduced more with
increasing the percentage of addition from 10% to 20% bees wax and this is in
agreement with Craig et al.(24), who stated that the addition of beeswax to paraffin
leads to raise the transition temperature slightly and thus reducing the flow.
The addition of 10% starch did not affect the flow of hard paraffin significantly
as in experimental modelling wax code (16) but when the percentage of addition
increased to 20% as in experimental modelling wax code (19) led to reduce the flow of
hard paraffin at 40ºC and 45ºC. Also, the addition of 20% Na-CMC, 20 % Gum
Arabic, and 20 % rosin to hard paraffin showed the same results. This may be
explained on the basis that these materials act as a thickening and binding agents and
lead to increase the hardness of paraffin wax thus reducing the flow (20, 25, 26).
The addition of rosin to paraffin produces the highest flow reduction than other
additives; this is due to the fact that resins are commonly added to paraffin to produce
harder material (19).
Thermal expansion: Descriptive statistics of thermal expansion values of tested
samples of control and experimental groups 1, 2, & 3 are listed in Table (VI). The
result revealed that all experimental modelling waxes had thermal expansion coincides
with ADA specification No. 24, because their expansion not exceeding 0.8% on
heating from 25ºC to 40ºC (16).
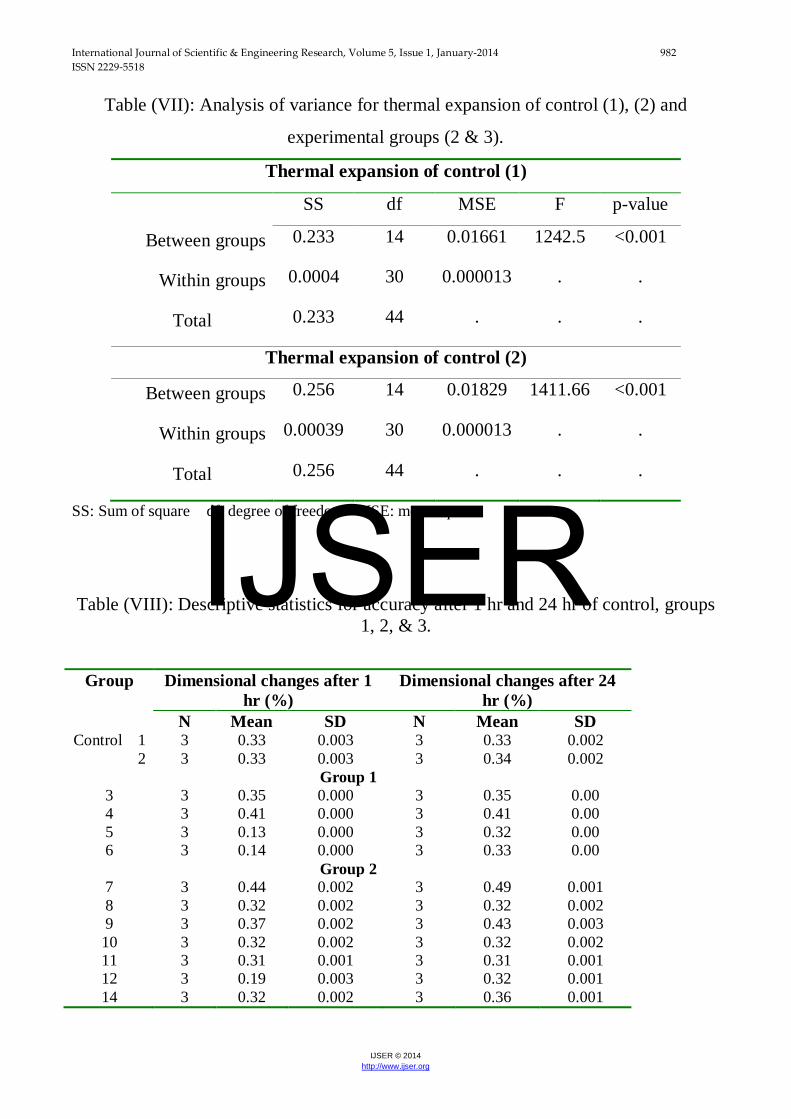
Analysis of variance (ANOVA), Table (VII), show that there was a significant
difference (p< 0.001) in the mean value of thermal expansion of tested samples of
control 1 (PolywaxTM), control 2 (Major®), and experimental groups (2 & 3).
Duncan's multiple range test, Figure (7), show that the experimental modelling
waxes 10 and 17 had the most nearest thermal expansion percentage to control (1&2)
than others. Statistically, there was no significant difference between experimental
IJSER

International Journal of Scientific & Engineering Research, Volume 5, Issue 1, January-2014 973 ISSN 2229-5518
IJSER © 2014 http://www.ijser.org
modeling wax 10 and control (2). The experimental modelling wax 9 has the highest
thermal expansion percentage than others. The experimental modelling waxes 10
(80% hp + 20% bw), 17 (90% bw + 10% starch) and 21(80% hp + 20% gum Arabic)
had the most nearest thermal expansion value to the control.
The results showed that the addition of 20% gum Arabic or rosin or Na-CMC to
hard paraffin led to reduction in the thermal expansion of hard paraffin. While the
addition of 20% starch to hard paraffin led to increase thermal expansion of hard
paraffin. This can be explained as the starch will interfere with the secondary valence
forces of hard paraffin and when the wax heated, the hydrocarbon chains become
more free to move, rotate and expand(4) .
Microscopical Examination: Figure (8) showed that the morphology of wax
crystals in hard and soft paraffin was varying from tiny needles, elongated needles and
plates like crystals. This is in agreement with many authors (23,27). The morphology of
natural beeswax crystals was varying from plate, spindle, or leaf like crystals. The
experimental modelling wax 10 (80% hp + 20% bw) showed tiny or elongated needle
like crystals under Light Microscope using the oil lens and magnification (x=400).
These crystals resembling to that seen in contro1 1(PolywaxTM) and control 2
(Major®). The experimental modelling wax 17 (90% beeswax + 10% starch) showed
plate, or spindle like crystals but not so clear as that seen in natural beeswax and this
may be due to the effect of starch that leads to coat the beeswax crystals.
Accuracy of experimental modeling waxes: The results of this study showed
that the dimensional changes of paraffin waxes were significantly higher than that of
beeswax (Table VIII). These results are in agreement with Sykora and Sutow(28) who
reported that the little flow at room temperature is often associated with higher wax
melting temperature and this has the potential to give less distortion. The addition of
20 % starch, 20% Na-CMC, 20 % Rosin and 20 % gum Arabic to hard paraffin led to
reduce the dimensional changes after 1hr and 24 hr. This may be due to the binding
properties of these materials that lead to reduce the flow at room temperature and
reduce distortion (20, 21, 22). While the addition of beeswax (10% or 20%) to hard
IJSER

International Journal of Scientific & Engineering Research, Volume 5, Issue 1, January-2014 974 ISSN 2229-5518
IJSER © 2014 http://www.ijser.org
paraffin produced slight decrease in dimensional changes. This may result from
increasing the transition temperature and hardness of the hard paraffin: beeswax
mixture and reducing the flow at room temperature (24).
Figures (9 and 10) showed that the experimental modelling waxes 7 (90% hp +
10% sp) and 9 (80% hp + 20% sp) had the highest dimensional changes after 1 hr and
24 hr than other experimental waxes. This may be due to weak secondary valence
forces between crystals of paraffin waxes (4).
Conclusions: It was concluded that the experimental modelling waxes: (80%
hard paraffin + 20% beeswax) and (90% beeswax + 10% starch) have the most nearest
properties to control and ADA specification No. 24 than other waxes.
REFERENCES:
1. McCabe JF. Anderson’s applied dental materials. 6th ed., Blackwell; 1985. P. 33-
37.
2. Combe EC. Notes on dental materials. 5th ed. Churchill Livingstone; 1986. P. 312-
317.
3. Kotsiomiti E and Kaloyannides A . Crown pattern waxes: A study of their
behavior on heating and cooling. J Prosthet Dent.1994; 71:511-516.
4. Craig RG, Eick JD, and Peyton FA: Properties of natural waxes used in dentistry. J
Dent Res.1965; 44:1308-1316.
5. Phillips RW : Skinner’s science of dental materials. 8th ed., WB Saunders,
Philadelphia; 1982. P. 382-392.
6. Craig RG : Restorative dental materials. 10th ed., St.Louis, Mosby; 1997. P. 361-
382.
7. Powers JM and Craig RG : Thermal analysis of dental impression waxes. J Dent
Res.1978; 57:37-41.
8. McMillan LC and Darvell BW: Rheology of dental waxes. Dent Mater.2000; 16:
337-350.
9. McCrorie JW: Dental modelling waxes. A new approach to formulation. Br Dent
J.1972; 132:189-192.
IJSER

International Journal of Scientific & Engineering Research, Volume 5, Issue 1, January-2014 975 ISSN 2229-5518
IJSER © 2014 http://www.ijser.org
10. McCrorie JW: Some physical properties of dental modelling waxes and of their
main constituents. J Oral Rehabil.1974; 1: 29-45.
11. Heath JR, Boru TK, and Grant AA: The stability of temporary prosthetic base
materials I: Introduction, angular changes and dimensional stability. J Oral
Rehabil.1993; 20: 363-372.
12. Al-Azzawi WH, Al-Jassim G, and Al-Mudaress MS: Iraqi boxing wax
formulation. Iraqi Dent J.1997; 20: 73-79.
13. Al –Jassim G: Iraqi inlay dental wax formulation. Iraqi Dent J.1997; 21: 5-17.
14. Abdullah MA: Evaluation of some properties of gypsum products and acrylic resin
by the use of some additives and microwave technique. MSc. Thesis, University of
Mosul 2006.
15. American Dental Association Specification (ADA): Guide to dental materials and
devices. 7th ed., Chicago, ADA; 1975. P. 83-85,181-184,251-255.
16. American Dental Association Specification No. 24 for Base plate Wax (2003).
(Chicago, III), Library Center, Council on Scientific Affairs.
17. Vogel I: Textbook of practical organic chemistry. 3rd ed., DiSc. London; 1972. P.
75, 76, 1028.
18. Al-Zubaidy IH: Accuracy of visible light custom tray material and its effect on
stress exerted on mandibular edentulous residual ridge using finite element
method. MSc. Thesis, University of Mosul 2007.
19. Craig RG: Restorative Dental materials. 8th ed., St. Louis, Mosby; 1989. P. 375-
393.
20. Food and Agricultural Organization of the United Nation/ World Health
Organization (FAO/WHO): Toxicological evaluation of some antimicrobials,
antioxidants, emulsifiers, stabilizers, flour-treatment agents, acids and bases. FAO
Nutrition meetings, Report series1967. No. 40 A, B, C.
21. Anusavice KJ: Phillip’s science of dental Materials. 10th ed. , WB Saunders Co.;
1996. P. 461-469.
IJSER

International Journal of Scientific & Engineering Research, Volume 5, Issue 1, January-2014 976 ISSN 2229-5518
IJSER © 2014 http://www.ijser.org
22. American Dental Association Division of Science (ADA Division of Science) :
Whitening toothpaste. JADA.2001; 132:1146-1147.
23. Craig RG and Powers JM: Restorative Dental Materials. 11th ed., Mosby; 2002. P.
424-448.
24. Craig RG, Eick JD, and Peyton FA: Flow of binary and tertiary mixtures of waxes.
J Dent Res.1966; 45:397-403.
25. Dhanorkar VT, Gogte BB, and Dorle AK: Rosin-based polymers in preparation of
lotions. IJPS.2003; 65:22-26.
26. Chaplin M : Water structure and Science. 1st Ed. London, South Bank University,
Applied Science; 2007.
27. Lu X, Langton M, Olofsson P, and Redelius P: Wax morphology in bitumen. J
Mater Scie. 2005; 40: 1893-1900.
28. Sykora O and Sutow EJ: Comparison of the dimensional stability of two waxes
and two acrylic resin processing techniques in the production of complete
dentures. J Oral Rehabil.1990; 17: 219-227.
Table (I): The control with experimental groups and their codes.
Control Pure waxes-
Group 1
Natural waxes
mixtures- Group 2
(Natural waxes +
additives) mixtures -
Group 3
Materials Code Materials Code Materials Code Materials Code
PolywaxTM 1 Hard
paraffin
3 90% hp + 10% sp 7 90% hp + 10
% starch
16
Major® 2 Soft
paraffin
4 90% hp + 10%
bw
8 90% bw + 10%
starch
17
Commercia
l beeswax
5 80% hp + 20 %
sp
9 90% sp + 10 %
starch
18
IJSER

International Journal of Scientific & Engineering Research, Volume 5, Issue 1, January-2014 977 ISSN 2229-5518
IJSER © 2014 http://www.ijser.org
Natural
beeswax
6 80% hp + 20 %
bw
10 80% hp + 20%
starch
19
80% bw + 20%
hp
11 80% hp + 20%
Na-CMC
20
80% bw + 20%
sp
12 80% hp + 20%
gum Arabic
21
80% sp + 20%
bw
13 80% hp + 20
% rosin
22
80% hp + 15% sp
+ 5% bw
14
70 % hp + 20 %
sp + 10 % bw
15
Hp: hard paraffin, bw: beeswax, sp: soft paraffin, Na-CMC: Sodium carboxymethylcellulose
Table (II) : Descriptive statistics for minimum and maximum melting point of control
and groups 1, 2 & 3.
Group Code Minimum Melting
point(ºC)
Maximum Melting
Point(ºC)
N Mean SD N Mean SD
Control 1
2
3 57.67 0.58 3 64.00 0.00
3 57.33 0.58 3 64.00 0.00
Group 1 3 3 58.67 0.58 3 66.67 0.58
4 3 43.33 0.58 3 50.00 0.00
5 3 64.67 0.58 3 71.33 1.15
6 3 64.33 0.58 3 70.00 0.00
Group 2 7 3 57.33 0.58 3 61.00 0.00
8 3 59.00 0.00 3 62.67 0.58
9 3 56.00 0.00 3 61.67 0.58
IJSER

International Journal of Scientific & Engineering Research, Volume 5, Issue 1, January-2014 978 ISSN 2229-5518
IJSER © 2014 http://www.ijser.org
10 3 60.00 0.00 3 64.67 0.58
11 3 58.00 0.00 3 64.33 0.58
12 3 56.33 0.58 3 60.00 0.00
13 3 46.00 0.00 3 52.33 0.58
14 3 57.33 0.58 3 64.00 0.00
15 3 57.33 0.58 3 64.00 0.00
Group 3 16 3 58.33 0.58 3 67.00 0.00
17 3 62.67 0.58 3 70.00 0.00
18 3 43.00 0.00 3 50.67 1.16
19 3 57.67 0.58 3 67.00 0.00
20 3 59.00 0.00 3 65.67 0.58
21 3 60.00 0.00 3 65.33 0.58
22 3 61.00 0.00 3 66.33 0.58
N: number of samples SD: standard deviation
Table (III): Analysis of variance for minimum and maximum melting points
Minimum melting point
Control (1) and experimental groups (2
&3).
SS df MSE F p-value
Between groups 1188.706 16 74.294 473.625 <0.001
Within groups 5.333 34 0.157 . .
Total 1194.039 50 . . .
Control (2) and experimental groups (2
& 3).
SS Df MSE F p-value
Between groups 1187.412 16 74.213 473.109 <0.001
Within groups 5.333 34 0.157 . .
Total 1192.745 50 . . .
IJSER

International Journal of Scientific & Engineering Research, Volume 5, Issue 1, January-2014 979 ISSN 2229-5518
IJSER © 2014 http://www.ijser.org
Maximum melting point
Control (1) and experimental groups
(2&3).
SS df MSE F p-value
Between groups 1178.980 16 73.686 313.167 <0.001
Within groups 8.0 34 0.235 . .
Total 1186.980 50 . . .
control (2) and experimental groups
(2&3).
SS df MSE F p-value
Between groups 1178.980 16 73.686 313.167 <0.001
Within groups 8.0 34 0.235 . .
Total 1186.980 50 . . .
SS: Sum of square df: degree of freedom MSE: mean square
Table (IV): Descriptive statistics for flow at 40 ºC and 45ºC of control,
groups 1, 2 & 3.
Group Flow at 40 ºC (%) Flow at 45ºC (%)
N Mean SD N Mean SD
Control 1 3 72.58 0.32 3 83.81 0.292
2 3 55.82 0.672 3 75.20 0.125
Group 1
3 3 49.85 0.38 3 68.98 0.13
4 3 94.53 0.45 3 95.19 0.04
5 3 66.89 0.3 3 78.75 0.53
6 3 67.51 0.43 3 80.12 0.1
IJSER

International Journal of Scientific & Engineering Research, Volume 5, Issue 1, January-2014 980 ISSN 2229-5518
IJSER © 2014 http://www.ijser.org
Group 2
7 3 61.51 0.196 3 72.32 0.23
8 3 47.36 0.099 3 64.67 0.07
9 3 70.10 0.175 3 80.61 0.423
10 3 45.45 0.199 3 63.98 0.225
11 3 47.77 0.419 3 75.74 0.074
12 3 69.62 0.365 3 85.43 0.21
14 3 66.45 0.067 3 76.07 0.298
15 3 66.32 0.261 3 76.03 0.252
Group 3
16 3 49.21 0.635 3 67.76 0.047
17 3 56.70 0.456 3 74.48 0.025
19 3 47.65 0.455 3 62.23 0.143
20 3 46.12 0.177 3 64.04 0.030
21 3 43.62 0.095 3 61.59 0.306
22 3 42.44 0.120 3 61.45 0.089
SD: standard deviation, N: number of samples
Table (V): Analysis of variance for flow at 40°C, 45°C of the control (1),(2) and
experimental groups (2 & 3).
Flow at 40 °C of control (1)
SS df MSE F p-value
Between groups 5119.81 14 365.701 3723.87 <0.001
Within groups 2.946 30 0.0982 . .
Total 5122.756 44 . . .
Flow at 40 °C of the control (2)
Between groups 4191.507 14 299.393 2463.65 <0.001
IJSER

International Journal of Scientific & Engineering Research, Volume 5, Issue 1, January-2014 981 ISSN 2229-5518
IJSER © 2014 http://www.ijser.org
Within groups 3.646 30 0.122 . .
Total 4195.153 44 . . .
Flow at 45 °C of control (1)
Between groups 2865.33 14 204.666 4386.55 <0.001
Within groups 1.4 30 0.04666 . .
Total 2866.73 44 . . .
Flow at 45 °C of control (2)
Between groups 2428.875 14 173.491 4128.56 <0.001
Within groups 1.261 30 0.04202 . .
Total 2430.136 44 . . .
SS: Sum of square df: degree of freedom MSE: mean square
Table (VI): Descriptive statistics for thermal expansion of control and experimental
groups 1, 2 & 3.
Thermal expansion (%)
Control Group Group 1 Group 2 Group 3
Code Mean±SD Code Mean±SD Code Mean±SD Code Mean±SD
1 0.27± 0.003 3 0.34±0.01 7 0.47±0.007 16 0.36±0.001
2 0.23±0.001 4 0.40±0.00 8 0.37±0.002 17 0.27±0.001
5 0.29±0.00 9 0.49±0.001 19 0.41±0.006
6 0.29±0.01 10 0.22±0.002 20 0.31±0.003
11 0.34±0.002 21 0.28±0.003
12 0.37±0.005 22 0.29±0.002
14 0.32±0.006
15 0.34±0.003
SD: standard deviation, For each subgroup 3samples
IJSER
International Journal of Scientific & Engineering Research, Volume 5, Issue 1, January-2014 982 ISSN 2229-5518
IJSER © 2014 http://www.ijser.org
Table (VII): Analysis of variance for thermal expansion of control (1), (2) and
experimental groups (2 & 3).
Thermal expansion of control (1)
SS df MSE F p-value
Between groups 0.233 14 0.01661 1242.5 <0.001
Within groups 0.0004 30 0.000013 . .
Total 0.233 44 . . .
Thermal expansion of control (2)
Between groups 0.256 14 0.01829 1411.66 <0.001
Within groups 0.00039 30 0.000013 . .
Total 0.256 44 . . .
SS: Sum of square df: degree of freedom MSE: mean square
Table (VIII): Descriptive statistics for accuracy after 1 hr and 24 hr of control, groups 1, 2, & 3.
Group Dimensional changes after 1 hr (%)
Dimensional changes after 24 hr (%)
N Mean SD N Mean SD Control 1 3 0.33 0.003 3 0.33 0.002
2 3 0.33 0.003 3 0.34 0.002 Group 1
3 3 0.35 0.000 3 0.35 0.00 4 3 0.41 0.000 3 0.41 0.00 5 3 0.13 0.000 3 0.32 0.00 6 3 0.14 0.000 3 0.33 0.00
Group 2 7 3 0.44 0.002 3 0.49 0.001 8 3 0.32 0.002 3 0.32 0.002 9 3 0.37 0.002 3 0.43 0.003 10 3 0.32 0.002 3 0.32 0.002 11 3 0.31 0.001 3 0.31 0.001 12 3 0.19 0.003 3 0.32 0.001 14 3 0.32 0.002 3 0.36 0.001
IJSER

International Journal of Scientific & Engineering Research, Volume 5, Issue 1, January-2014 983 ISSN 2229-5518
IJSER © 2014 http://www.ijser.org
15 3 0.23 0.002 3 0.24 0.001 Group 3
16 3 0.33 0.001 3 0.42 0.001 17 3 0.17 0.002 3 0.17 0.001 19 3 0.33 0.002 3 0.33 0.001 20 3 0.24 0.001 3 0.33 0.001 21 3 0.17 0.002 3 0.34 0.001 22 3 0.16 0.001 3 0.16 0.001
Rosin Starch Na-CMC Gum Arabic
Ferric Oxide red Amaranth red Ferric Oxide orange
Figure (1): Additives materials used in this study and Wax mixture at the semisolid.
Wax mixture at the semisolid
IJSER

International Journal of Scientific & Engineering Research, Volume 5, Issue 1, January-2014 984 ISSN 2229-5518
IJSER © 2014 http://www.ijser.org
Figure: (2) Different wax flow at (20 ± 2)ºC, 40 °C and 45° C from right to left side.
Cover
Mold
Holder
Figure 3: Mold for thermal expansion test made from glass and Aluminum.
Figure 4: Samples of different waxes placed under the holder of
the thermal expansion test.
IJSER

International Journal of Scientific & Engineering Research, Volume 5, Issue 1, January-2014 985 ISSN 2229-5518
IJSER © 2014 http://www.ijser.org
de d fc
g de c
b
d d efi
a
de f g h
0
10
20
30
40
50
60
70
80
Min
imum
mel
ting
poin
t(ºC
)
1 7 8 9 10 11 12 13 14 15 16 17 18 19 20 21 22
Contrl 1 Group 2 Group 3
d d f c g decb
d d ef i
a
de f g h
01020304050607080
Min
imum
mel
ting
poin
t(ºC
)
2 8 10 12 14 16 18 20 22
Control 2 Group 2 Group 3
Figure (5): Duncan's multiple range test of the minimum melting point of the controls (1) and (2) in relation to experimental modelling waxes in groups 2 & 3.
f d e d fg f cb
f f jk
a
j hi gh ij
0102030405060708090
Max
imum
mel
ting
poin
t (º
C)
1 7 8 9 10 11 12 13 14 15 16 17 18 19 20 21 22
Control 1 Group 2 Group 3
f d e d fg fc
b
f fj
k
a
j hi gh ij
0
10
20
30
40
50
60
70
80
90
Max
imum
mel
ting
poin
t (ºC
)
2 7 8 9 10 11 12 13 14 15 16 17 18 19 20 21 22
Control 2 Group 2 Group 3
Figure (6): Duncan's multiple range test of the maximum melting point of the controls (1) and (2) in relation to experimental modelling waxes in groups 2 & 3.
IJSER

International Journal of Scientific & Engineering Research, Volume 5, Issue 1, January-2014 986 ISSN 2229-5518
IJSER © 2014 http://www.ijser.org
PolywaxTM (1) Major® (2) Hard paraffin (3) Soft paraffin (4)
Natural Beeswax (6) 80% Hard paraffin +20%Beeswax (10) 90% Beeswax+10% Starch(17)
Figure (8): Microscopical examination of wax materials
c
l
j
m
a
hj
f g i
b
k
ec d
00.050.1
0.150.2
0.250.3
0.350.4
0.450.5
0.550.6
Ther
mal
exp
ansi
on (%
)
1 7 8 9 10 11 12 14 15 16 17 19 20 21 22
Control 1 Group 2 Group 3
a
l
j
m
a
hj
f g i
b
k
ec d
00.050.1
0.150.2
0.250.3
0.350.4
0.450.5
0.550.6
Ther
mal
exp
ansi
on
(%)
2 7 8 9 10 11 12 14 15 16 17 19 20 21 22
Control 2 Group 2 Group 3
Figure (7): Duncan's multiple range test of thermal expansion of controls (1) and (2) in relation to experimental modelling waxes in groups 2 & 3.
IJSER

International Journal of Scientific & Engineering Research, Volume 5, Issue 1, January-2014 987 ISSN 2229-5518
IJSER © 2014 http://www.ijser.org
Figure (9): Duncan's multiple range test of accuracy after 1 hr of the controls (1) and
(2) in relation to experimental modelling waxes in groups 2 & 3.
i
f
h
k
g f
d
h
e
j
b
i
e
c a
0
0.05
0.1
0.15
0.2
0.25
0.3
0.35
0.4
0.45
0.5
Dim
ensi
onal
cha
nges
afte
r 1 h
r (%
)
1 7 8 9 10 11 12 14 15 16 17 19 20 21 22
ControlGroup 2Group 3
k
m
h
l
g f
d
h
e
j
b
i
e
c a
0
0.05
0.1
0.15
0.2
0.25
0.3
0.35
0.4
0.45
0.5
Dim
ensi
onal
cha
nges
aft
er 1
hr (
%)
2 7 8 9 10 11 12 14 15 16 17 19 20 21 22
ControlGroup 2Group 3IJSER

International Journal of Scientific & Engineering Research, Volume 5, Issue 1, January-2014 988 ISSN 2229-5518
IJSER © 2014 http://www.ijser.org
Figure (10): Duncan's multiple range test of accuracy after 24 hr of the controls (1)
and (2) in relation to experimental modelling waxes in groups 2 & 3.
g
m
f
l
e d e
j
c
k
b
h g i
a
0
0.05
0.1
0.15
0.2
0.25
0.3
0.35
0.4
0.45
0.5
0.55
Dim
ensi
onal
cha
nges
afte
r 24
hr (%
)
1 7 8 9 10 11 12 14 15 16 17 19 20 21 22
ControlGroup 2Group 3
i
n
f
m
e d e
k
c
l
b
h g j
a
0
0.05
0.1
0.15
0.2
0.25
0.3
0.35
0.4
0.45
0.5
0.55
Dim
ensi
onal
cha
nges
aft
er 2
4 hr
(%)
2 7 8 9 10 11 12 14 15 16 17 19 20 21 22
ControlGroup 2Group 3IJSER