experimental laboratory 513.(010/011/014) raman … laboratory 513.(010/011/014) ... raman...
TRANSCRIPT
Experimental Laboratory513.(010/011/014)
Raman Spectroscopy
Graz University of Technology
Supervisors:Harald Fitzek
Institute of Electron Microscopy and NanoanalysisE-mail:harald.�[email protected]
Boril ChernevGraz Centre of Electron MicroscopyE-mail:[email protected]
Location:Steyrergasse 17/III; Room RZ03072
WS 2015/16
Contents
1 Outline 1
2 Fundamentals 2
3 Interpretation of spectra 6
4 Choosing the laser 10
5 Experimental setup and parameters 13
6 Spectral Images 16
7 Summary 18
8 Literature 18

1 Outline
Raman spectroscopy is a powerful tool for the non-destructive investigationand characterization of all kinds of materials. It has a large range of appli-cations, which span from fundamental science to in situ quality control inproduction lines. When a Raman spectrometer is combined with a confocalmicroscope (Raman microscope), it is even possible to visualize the distribu-tion of materials on the micrometer scale.
The aim of this exercise is to give you a hands on experience of the possibil-ities, pit falls and limitations of Raman spectroscopy as well as the experi-mental setup and operation of a Raman microscope. Furthermore, it shouldgive you an experience of the everyday challenges of academic research. Forthis reason a small research project is built around this laboratory exercise.You will start by measuring single spectra, 2D maps and 3D images of severalstandard samples to make yourself familiar with the instrument. After thatyou will be given a challenge, related to the research project, to be completedas best as you can with your newly acquired skills.
Students vs. Spectrometer
In our current laboratory exercise research project we are investigating thedi�erence between similar grocery products (for example Red Bull, Race,Clever Energy Drink, ...). We want to know whether we can distinguishbetween these products by Raman spectroscopy and whether a distinctionby means of spectroscopy is more accurate than a human evaluation (taste,smell, ...). For every laboratory exercise a variety of similar grocery productswill be chosen. Your goal is to develop a spectroscopic model that is ableto distinguish the products. You will then be given a set of unknown sam-ples and try to distinguish them with and without the spectrometer. Whichassessment is going to be more accurate?
1
2 Fundamentals
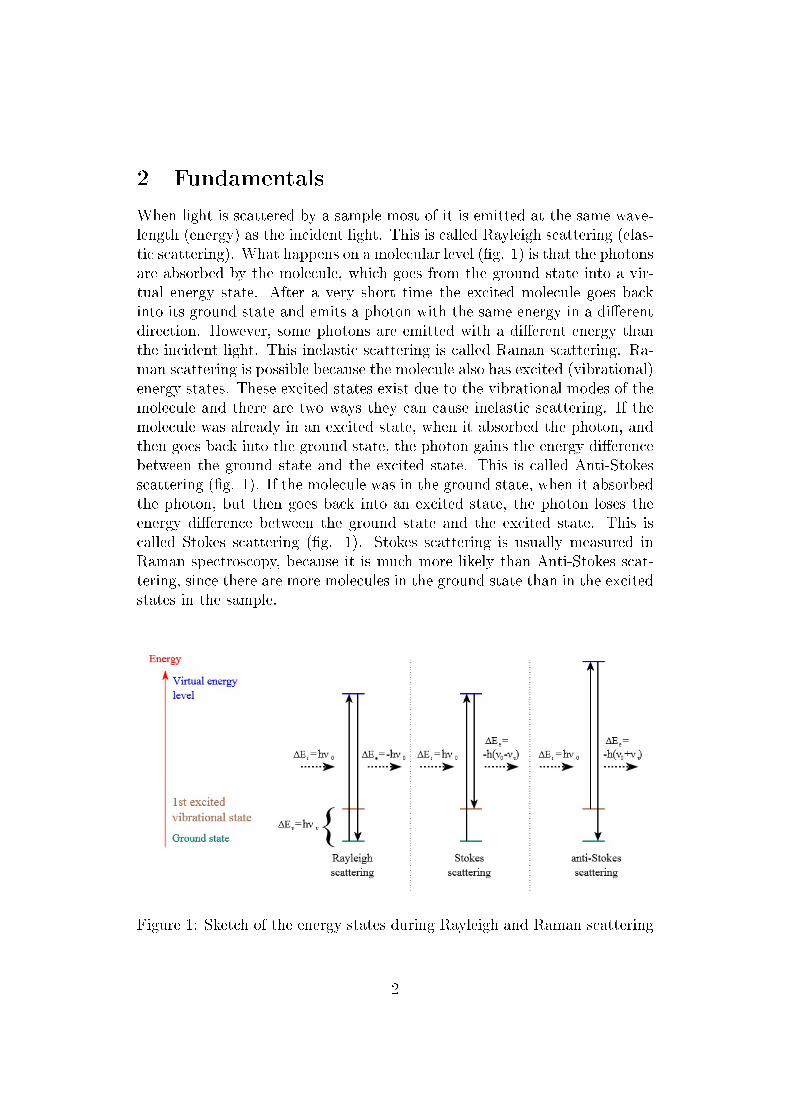
When light is scattered by a sample most of it is emitted at the same wave-length (energy) as the incident light. This is called Rayleigh scattering (elas-tic scattering). What happens on a molecular level (�g. 1) is that the photonsare absorbed by the molecule, which goes from the ground state into a vir-tual energy state. After a very short time the excited molecule goes backinto its ground state and emits a photon with the same energy in a di�erentdirection. However, some photons are emitted with a di�erent energy thanthe incident light. This inelastic scattering is called Raman scattering. Ra-man scattering is possible because the molecule also has excited (vibrational)energy states. These excited states exist due to the vibrational modes of themolecule and there are two ways they can cause inelastic scattering. If themolecule was already in an excited state, when it absorbed the photon, andthen goes back into the ground state, the photon gains the energy di�erencebetween the ground state and the excited state. This is called Anti-Stokesscattering (�g. 1). If the molecule was in the ground state, when it absorbedthe photon, but then goes back into an excited state, the photon loses theenergy di�erence between the ground state and the excited state. This iscalled Stokes scattering (�g. 1). Stokes scattering is usually measured inRaman spectroscopy, because it is much more likely than Anti-Stokes scat-tering, since there are more molecules in the ground state than in the excitedstates in the sample.
Figure 1: Sketch of the energy states during Rayleigh and Raman scattering
2

The main di�culty with Raman scattering is that only a tiny fraction (ap-proximately 10−8) of scattered photons are Raman scattered. Therefore, inRaman spectroscopy a laser is used to excite the molecule. The (monochro-matic) Rayleigh scattering is then blocked by a �lter and only the Ramanscattering is measured by a spectrometer, which is equipped with a highlysensitive photon detector (�g. 2).
Figure 2: Sketch of the stages of a Raman spectrometer
The spectrum is usually not plotted in terms of the total energy of thephotons, which is dependent on the laser wavelength, but rather as the energyshift of photons relative to the laser energy. The energy (Raman) shift isequal to the energy of the vibrational states of the molecule and independentof the laser wavelength. By convention the unit used to plot the Raman shiftis the wavenumber (cm−1).
Figure 3: Sketch of the way a Raman spectrum is plotted
3

The energies of the vibrational states contain a lot of information aboutthe sample such as the chemical composition, the stress/strain stated, crystalsymmetries and crystal quality (�g. 4). However, in most cases the chemicalcomposition is investigated by spectroscopy.
Figure 4: Information accessible by Raman spectroscopy
The dependence of the energies of the vibrational states on the chemicalcomposition can be illustrated by the simple model of the harmonic oscil-lator. If we imagine an oscillating mass (atom, or molecule fragment) thatis connected by a spring (chemical bond) and assume a harmonic oscillator,the energy states of this system can immediately be derived.
Figure 5: Harmonic oscillator; m is the mass of an atom or moleculefragment and the spring constant k is proportional to the strength of the
chemical bonds
4

For this harmonic oscillator the energy levels are given by:
ω =√
km
Ev = (v + 12) ∗ ~ ∗ ω v = 0, 1, 2, ...
For the 1. excited state (v = 1) we have as a rule of thumb that the positionof a Raman band is proportional to the square root of the bond strengthdivided by the mass of the oscillating atom. This is a good guideline forquick assessments, but obviously a real spectrum is much more complicated.Another thing that in�uences the energy of the Raman band is the vibra-tional mode. There are two major kinds of vibrations, namely stretching anddeformation (bending), which are illustrated in �gure 6. Stretching changesthe length of the chemical bond and usually requires more energy than de-formation.
Figure 6: Sketch of vibrational modes
5

3 Interpretation of spectra
The most important information that can be obtained using Raman spec-troscopy is the chemical composition of the sample. An example of theRaman spectrum of cellulose in an embedding compound is shown in �gure7. Every band in the spectrum is associated with the vibration of a chemicalbond in cellulose or the embedding compound. All bands are marked as ei-ther cellulose (C) or embedding compound (E). Additionally, for the cellulosebands the chemical bond causing the band is identi�ed.
Figure 7: Raman spectrum of cellulose and an embedding compound withband assignment
An interpretation of the spectrum like this is the ideal case. However, itis very di�cult to do and requires prior knowledge of the sample. Therefore,in most cases a simpler method of interpretation is chosen. Other methodsof spectral interpretation are (in ascending order of accuracy):
• Identifying H- and C-bonds using the harmonic oscillator approxima-tion
• Identifying functional groups by looking for group bands
• Identifying the chemical composition by comparing to a known refer-ence
6
Identifying H- and C-bonds using the harmonic oscillator approximation
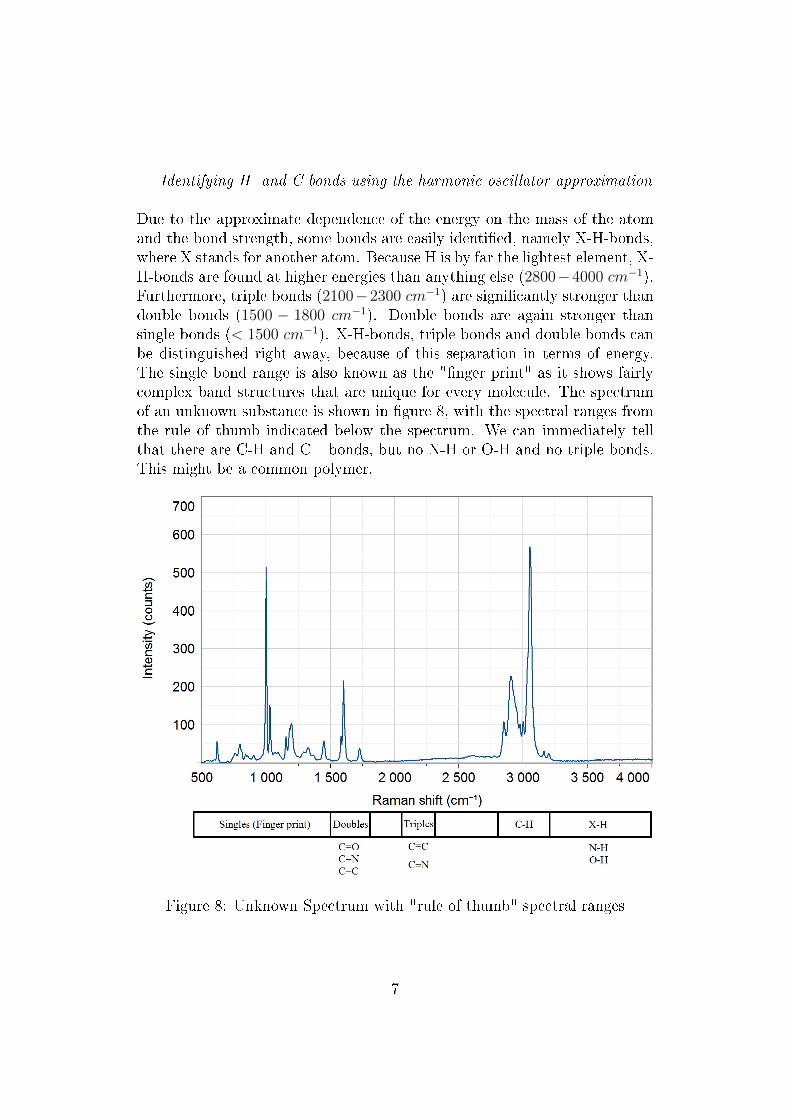
Due to the approximate dependence of the energy on the mass of the atomand the bond strength, some bonds are easily identi�ed, namely X-H-bonds,where X stands for another atom. Because H is by far the lightest element, X-H-bonds are found at higher energies than anything else (2800−4000 cm−1).Furthermore, triple bonds (2100−2300 cm−1) are signi�cantly stronger thandouble bonds (1500 − 1800 cm−1). Double bonds are again stronger thansingle bonds (< 1500 cm−1). X-H-bonds, triple bonds and double bonds canbe distinguished right away, because of this separation in terms of energy.The single bond range is also known as the "�nger print" as it shows fairlycomplex band structures that are unique for every molecule. The spectrumof an unknown substance is shown in �gure 8, with the spectral ranges fromthe rule of thumb indicated below the spectrum. We can immediately tellthat there are C-H and C= bonds, but no N-H or O-H and no triple bonds.This might be a common polymer.
Figure 8: Unknown Spectrum with "rule of thumb" spectral ranges
7

Identifying functional groups by looking for group bands
Speci�c functional groups such as aliphatic, aromatic, carbonate, etc. havecharacteristic bands that appear somewhat independent of the rest of themolecule. The next step after identifying the H-bonds and C-bonds is tolook for groups of bands that are associated with functional groups. Unfortu-nately, there are no simple rules for this procedure and identifying functionalgroups is a tedious procedure that requires experience as well as the aid ofa reference book or software. Figure 9 shows again the unknown spectrumwith two functional groups and their expected band positions. This could bepolystyrene.
Figure 9: Unknown Spectrum with possible functional groups
8
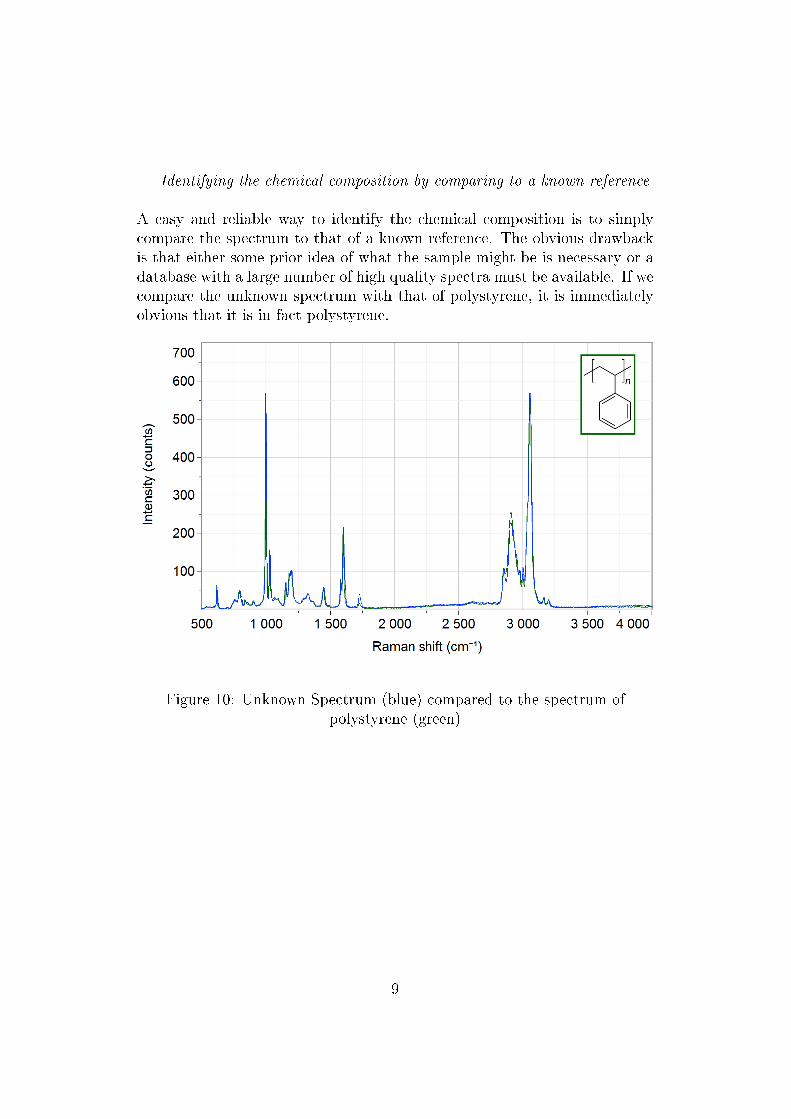
Identifying the chemical composition by comparing to a known reference
A easy and reliable way to identify the chemical composition is to simplycompare the spectrum to that of a known reference. The obvious drawbackis that either some prior idea of what the sample might be is necessary or adatabase with a large number of high quality spectra must be available. If wecompare the unknown spectrum with that of polystyrene, it is immediatelyobvious that it is in fact polystyrene.
Figure 10: Unknown Spectrum (blue) compared to the spectrum ofpolystyrene (green)
9

4 Choosing the laser
Despite the fact that the spectrum itself (frequency shift) is independent ofthe laser wavelength, the choice of the right laser is vitally important whendoing Raman spectroscopy. The following factors have to be considered whenchoosing the laser wavelength:
• Fluorescence
• Band Intensity
• Spectral resolution and range
• Spatial resolution
Fluorescence
A major problem in Raman spectroscopy is �uorescent. Since �uorescencehas in general far more intensity, it can completely mask the Raman spec-trum. Often �uorescence can be avoided by choosing the right laser wave-length, because it always occurs at the same wavelengths regardless of thewavelength of the excitation (assuming it has at least enough energy to excite�uorescence), whereas the same Raman spectrum can be measured at di�er-ent wavelengths depending on the laser wavelength (�g. 11). As �uorescencecan make the measurement impossible avoiding it is the most important fac-tor to be considered when choosing the laser wavelength.
Figure 11: The same Raman spectrum recorded at di�erent wavelengths
10

Band Intensity
Since the amount of scattered light is strongly dependent on the wavelength(IRayleigh ∝ λ−4), a smaller laser wavelength will yield signi�cantly higherband intensities. This is especially important for spectral maps, where theacquisition time per spectrum is an important issue, as well as heat sensitivesamples that require small laser powers. The relative gain of Raman signalas a function of the wavelength is shown in �gure 12.
Figure 12: E�ect of the laser wavelength on the Raman intensities; the datais normalized to a excitation at 1.064 µm
Spectral resolution and range
Both the spectral range that can be covered in one measurement and thespectral resolution depend on the laser wavelength. The spectrometer isable to cover the same wavelength range with the same resolution at everywavelength, but, as is illustrated in �gure 11, the same Raman (energy) shifttranslates to di�erent wavelength shifts depending on the laser wavelength.This is because of the inverse proportionality between energy and wavelength.Therefore, shorter laser wavelengths can cover larger spectral ranges with onemeasurement at the expense of spectral resolution, as is illustrated in �gure13.
11

Figure 13: Spectral range covered at di�erent laser wavelengths
Spatial resolution
For Raman microscopes the spatial resolution depends on the laser wave-length because of the di�raction limit and is approximately given by:
Spotsize ≈ 1.22∗λNA
NA...numerical aperture of the lens
12
5 Experimental setup and parameters
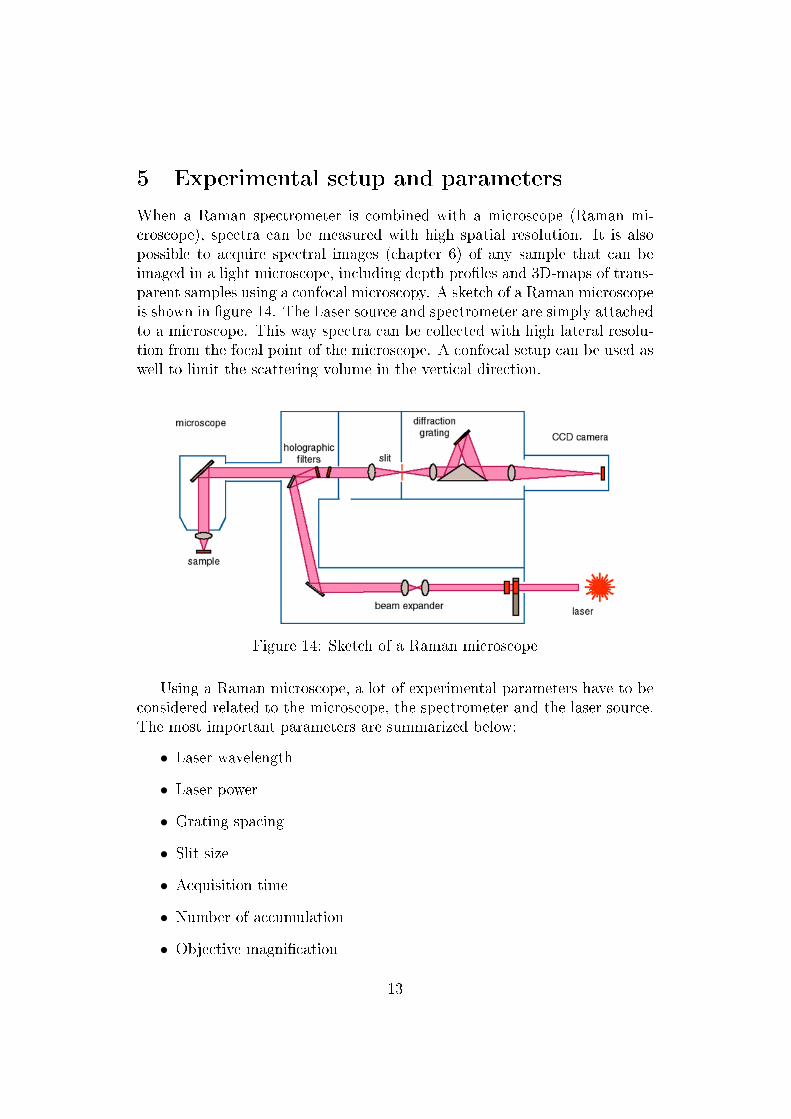
When a Raman spectrometer is combined with a microscope (Raman mi-croscope), spectra can be measured with high spatial resolution. It is alsopossible to acquire spectral images (chapter 6) of any sample that can beimaged in a light microscope, including depth pro�les and 3D-maps of trans-parent samples using a confocal microscopy. A sketch of a Raman microscopeis shown in �gure 14. The Laser source and spectrometer are simply attachedto a microscope. This way spectra can be collected with high lateral resolu-tion from the focal point of the microscope. A confocal setup can be used aswell to limit the scattering volume in the vertical direction.
Figure 14: Sketch of a Raman microscope
Using a Raman microscope, a lot of experimental parameters have to beconsidered related to the microscope, the spectrometer and the laser source.The most important parameters are summarized below:
• Laser wavelength
• Laser power
• Grating spacing
• Slit size
• Acquisition time
• Number of accumulation
• Objective magni�cation
13

• Pinhole size
• Spot size
For maps only:
• Laser scanning or stage scanning
• Step size
Laser wavelength
The laser wavelength is the most important parameter and in�uences almostanything. It has been discussed in its own chapter (chapter 4).
Laser power
A higher laser power increases the intensity of the Raman scattering andsometimes also suppresses �uorescence. Thus, the laser power should bechosen as high as possible without damaging the sample.
Grating spacing
The spacing of the grating in�uences the spectral range that can be coveredwith one measurement and the spectral resolution. A grating with morelines per mm (l/mm) will generate a spectrum with higher resolution at thecost of covering less spectral range. It is worth mentioning that increasingthe spectral resolution always decreases the intensity and will usually makehigher acquisition times necessary.
Slit size
Decreasing the slit size increases the spectral resolution; though the spacingof the grating has a far bigger in�uence. The slit size can be used to �netune the spectral resolution.
Acquisition time
The acquisition time determines the signal to noise ratio of the spectrum. Ahigher acquisition time produces a better signal to noise ratio at the cost of alonger measurement. It is important to note that the acquisition time cannotbe increased inde�nitely, because the detector will eventually saturate.
Number of accumulation
Instead of increasing the acquisition time several spectra can be accumulatedto increase the signal to noise ratio. In general it is less time consuming toincrease the acquisition time than to accumulate spectra. However, accumu-lating spectra is the only way to generate a better signal to noise ratio, if
14
the acquisition time cannot be increased anymore. Accumulating at least 2spectra is also usually done to avoid spikes from cosmic radiation. These aresharps spikes that sometimes occur when a high energy particle from cosmicradiation happens to hit the detector during the measurement. They canalso be remove by post processing of a single spectrum but using a �lter,based on the accumulation of 2 spectra, is by far the cleaner approach.
Objective
The magni�cation of the objective de�nes the spatial resolution.
Pinhole size
The size of the pinhole also in�uences the spatial resolution, especially inthe vertical direction. Making the pinhole smaller will improve the spatialresolution at the cost of intensity.
Spot size
It is possible to arti�cially increase the size of the laser spot or change itsshape by moving the laser around much faster than the acquisition time.This is very convenient when the average spectrum of a larger particle orarea is of interest.
Laser scanning or stage scanning
When acquiring a spectral map either the laser spot or the sample has to bemoved. The laser spot can only be moved over a limited distance (dependingon the objective ≈ 10− 100 µm), whereas moving the sample can introduceartifacts in the image, due to drifts and vibration.
Step size
The step size is the distance between the positions where spectra are acquiredwhen measuring a spectral image. The spatial resolution of a spectral imageis usually de�ned by the step size rather than the optical resolution of themicroscope due to time constrains (see chapter 6).
15

6 Spectral Images
A spectral image is simply an image with a spectrum in every pixel, as is illus-trated in �gure 15. Usually the spectra in a spectral image are evaluated byintegration over band intensities or some more sophisticated spectral model,in order to create a color map of the distribution of chemical components inthe sample. Other than light microscope images, which can be recorded as awhole by a camera, spectral images usually have to be measured pixel wise.
Figure 15: Sketch of a spectral image and two color maps created from itshowing di�erent chemical components
The main di�culty with spectral imaging is that a lot of spectra have tobe recorded. This means that there basically always has to be a trade-o�between the quality of the spectra and the quality of the image. For examplemeasuring a 50 × 50 µm sample at maximum spatial resolution would re-quire around 50000 spectra to be recorded. Recording a spectrum with veryhigh spectral resolution and good band intensities would require at least 10seconds, even for a sample that is ideal for Raman spectroscopy. This mea-surement would take 500000 seconds, which is about 6 days. As an example
16

of what such a trade-o� might look like, a 3D-spectral image of a layeredpolymer system is shown in �gure 16. In this case, spectra with su�cientquality to distinguish the di�erent components could be recoded with a mea-surement time of 1 second per spectrum. A bad lateral resolution (Stepsize ≈ 7 µm) was chosen, because it was already known that the sampleis a somewhat regular layered structure, whereas the almost best possibledepth resolution (Step size ≈ 1 µm) was chosen because the thicknesses ofthe layers were the main point of interest. The measurement took about 15hours.
Figure 16: Example of a 3D-spectral image of layered polymers; for thismeasurement bad lateral resolution and medium spectral quality were
chosen to ensure high depth resolution in a reasonable measurement time
17
7 Summary
After reading this introduction you should know...
• what Raman scattering is
• how it is measured
• what exactly is plotted on an axis labeled Raman shift (cm−1)
• why Raman spectroscopy is useful
• what is meant by "harmonic oscillator approximation" and "rule ofthumb spectral range"
• 3 di�erent ways to approach an unknown spectrum
• what the most important thing is when choosing the laser wavelength
• what else to consider when choosing the laser wavelength
• what a Raman microscope is
• a list of experimental parameters relevant to Raman microscopy
• what a spectral image is
• which trade-o� a spectral image requires
...and if you don't know these things by now you'll have to read the intro-duction again, read the books suggested below or have a friend google themand explain them to you.
8 Literature
1. Ferraro, John R.; Nakamoto, Kazuo and Brown, Chris W. "Introduc-tory Raman Spectroscopy", Elsevier Inc. (2003)
2. Long, Derek Albert. "The Raman E�ect - A Uni�ed Treatment of theTheory of Raman Scattering by Molecules", John Wiley & Sons (2002)
3. Grasselli, Jeanette G. and Bulkin Bernard J. "Analytical Raman Spec-troscopy", John Wiley & Sons (1991)
18