experimental investigation on acoustic effects of trailing
TRANSCRIPT
Experimental Investigation on Acoustic Effectsof Geometrical Modifications of SplitterAttenuators for Power Generation Systems
Cecilia SebastianiMüller-BBM GmbH, Robert-Koch-Strasse 11, 82152 Planegg, Germany
Carl-Christian HantschkMüller-BBM GmbH, Robert-Koch-Strasse 11, 82152 Planegg, Germany
Hans-Jakob KaltenbachTechnische Universität München - Flow Control and Aeroacoustics Group. Department of MechanicalEngineering, Boltzmannstrasse 15, 85748 Garching, Germany
AbstractHigh end splitter-type silencers represent the object of the present paper, that summarizes the resultsobtained in an experimental campaign conducted in the framework of FlowAirS Project - ITN FP7,Marie Curie Actions. Sound measurements on several fully functional splitters scaled 1:3 with Machand Reynolds number similarity to the typical conditions in gas turbine exhaust stack have beenperformed. Different trailing edge shapes including tapered and serrated extensions have been tested.Only moderate changes in the measured noise have been found, despite a reduction of the totalpressure loss that can be achieved by appropriate design of the splitter trailing edges. Considerableeffects due to the covering perforated plate have been found. The results are analyzed applying Nelsonand Morfey’s theory for obstacles in ducts, the scaling provides a good data collapsing, in particularfor the frequencies above the cut-on.
PACS no. 43.28.+h
1. Introduction
Splitter attenuators are used in a wide range of ap-plications, from HVAC systems to high-end silencersfor industry and power generation plants. The presentpaper refers to this second type and summarizes theresults obtained in an experimental campaign con-ducted in the framework of FlowAirS Project - ITNFP7, Marie Curie Actions. Usually the silencer repre-sents the last stage for noise reduction in the exhauststacks of power systems, so that any sound generateddownstream of the silencer is radiated into the openwithout any relevant attenuation. As regulations de-mand increasingly strict noise limits, silencers in ex-haust stacks need to be designed to achieve the neces-sary high acoustic insertion losses. With the upstreamnoise reduced to ever lower levels, the effect of theself-noise generated by the splitter itself - as a bluffbody immersed in the flow - becomes critical for theoverall performance of the silencing system. Because
(c) European Acoustics Association
the typical operative conditions in exhaust stacks (e.g.high temperatures, difficult access, undefined param-eters, etc.) make an in-depth study of the problemin real installations essentially impossible, a study onthe acoustic optimization of the splitter geometry hasbeen conducted under laboratory conditions.
2. Approach
The described problem has been treated from an ex-perimental point of view. Sound measurements onsplitters, equipped with several trailing edge exten-sions, have been performed in the Müller-BBM si-lencer test stand, in Planegg (Munich, Germany).
2.1. Geometry and properties of the splitter
Fully functional model splitters, configured as theytypically are for operations in flue gas stacks havebeen constructed and manufactured by BBM AkustikTechnologie, and have been used as test objects (Fig.1, 3).
The dimensioning of these model splitters de-rives from the similarity of Mach and Reynolds
Copyright© (2015) by EAA-NAG-ABAV, ISSN 2226-5147All rights reserved
669

Figure 1. Sketch of the model splitter.
Figure 2. Perforation pattern.
numbers to the working conditions of a typical stacksilencer (Mach ≈ 0.08, Reynolds referred to thesplitter thickness ≈ 200000). The small scale modelsplitters are totally functional and similar to thereal size ones with respect to absorbing materialand geometrical properties, except for the coveringperforated plates, that have the same perforationdiameter than in the real full size splitters. Thesplitters are filled with sound absorbing cushionscovered by the perforated plates. A steel plate canbe inserted between the cushion and the perforatedplate to perform tests without any significant soundabsorption by the splitters. The splitter frame isequipped with a rounded nose of semi-circular shape,made by 1 mm plates of galvanized steel (Fig. 1,3). The side walls are perforated plates with thefollowing characteristics: 1.5 mm of thickness, aperforation diameter dH = 5 mm, a distance betweenthe holes a = 8 mm (Fig. 2), which corresponds toan opening ratio equal to 35.4%. The absorbing partis made by cushions in glass fiber with a density of125 kg/m3.
In order to allow a simple trailing edge modifica-tion, several extensions have been manufactured, thatcan be attached to the downstream end of the split-ter. Different wooden extensions for blunt and taperedtrailing edges (Fig. 4) and different metal serrated ex-tensions have been tested.
Figure 3. Manufactured splitter.
Figure 4. Wooden extensions.
2.2. Test Stand
The test rig used for the measurement campaign hasbeen built in compliance with the guidelines of theISO 7235:2003(E), a sketch is provided in Fig. 5. Es-sentially, the test stand comprises three parts: a sourceroom (equipped with a loud-speaker and a silenced fanas a flow generator), a test section and a reverberationroom. The three parts are connected through a ductwith a diameter of 400 mm. Different from the sketchin Fig. 5, the connecting duct between the test sec-tion and the reverberation room includes a 90o bendand a 45o bend in the final part connecting to the re-verberation room itself. The total length of the ductbetween test section and reverberation room is about20 m.
In tables I and II the main characteristics of the re-verberation room and of the test section are reported.Under the given conditions, in compliance with theISO 3741:2010(E), the lowest one-third octave band
EuroNoise 201531 May - 3 June, Maastricht
C. Sebastiani et al.: Experimental...
670

Figure 5. Silencer Test-Stand
Table I. Reverberation room characteristics.
length [m] 8depth/length [-] 0.83height/length [-] 0.47total volume [m3] 199.6diffuser total surface [m2] 52
Table II. Test section characteristics.
length [m] 2.9width [m] 0.275height [m] 0.6cut-on frequency [Hz] 283.3
frequency that the reverberation room is suitable foris 100 Hz.
The limiting cut-on frequency is given by the cir-cular connecting duct at around 500 Hz, almost thedouble of the cut-on frequency of the rectangular testsection.
A Norsonic Nor1220 microphone, equipped withNorsonic preamplifier type 1201, mounted on a rotat-ing gallows, and a Brüel & Kjær 2260 sound level me-ter are used for the sound measurements. The soundlevel meter is a Class I instrument, with accuracy of ±1 dB (± 0.5 dB between 800 Hz and 5000 Hz in third-octave bands). The reproducibility of the reported re-sults is within ± 1.5 dB.
The 1.7 m long splitter is placed in the center ofthe test duct, in Fig. 6 a sketch of an example config-uration is shown.
The following shortcomings and limitations have tobe taken into account in the analysis of the measure-ment results:• at 40 Hz and at 125 Hz system resonances can be
detected independently of the flow speed and thetest section being empty or not;
Figure 6. Configuration of the splitter in the test duct.
• the noise due to the flow generation system, even ifwell reduced by a series of three silencers directlydownstream the fan and by one silencer at the airintake, is detectable up to 250 Hz;
• at high frequencies, starting at 6300 Hz, the back-ground noise is not controllable.
3. Measurements
3.1. Tested cases and data processing
Measurements have been performed at four differentair bulk velocities Vref derived from the flow speedmeasured on the axis of the circular duct and withthe flow rate kept as constant as possible (± 0.2 m/s)during each measurement series. The accuracy of theair speed sensor is ±1% of range, ± 3% of the mea-sured value. Table III reports these bulk velocities aswell as the corresponding Vgap in the gap betweensplitter and test section wall. Different splitters (rang-ing from full absorbing to non-absorbing splitter sidewalls) have been tested, only tests with non-absorbingsplitters (steel plate between perforated cover and ab-sorbing cushion, see Section 2.1) are reported here.Tests focus on the effect of different trailing edge ex-tensions and on the influence of covering the perfo-
EuroNoise 201531 May - 3 June, Maastricht
C. Sebastiani et al.: Experimental...
671
Table III. Bulk velocities in the circular duct Vref and inthe gap between splitter and test section side wall Vgap.
Vref Vgap
v1 [m/s] 9 12.5v2 [m/s] 11.7 16.2v3 [m/s] 14.8 20.4v4 [m/s] 17.5 24.2
rations of the outer plates to create an even (non-perforated) splitter surface. All the sound power level(PWL) values reported here are obtained via subtrac-tion of a reference PWL - that is obtained from mea-surements with empty test duct (no splitter) - fromthe PWL obtained with the tested splitter installed inthe test section. An additional correction is made forthe insertion loss due to the splitter itself. The over-all aerodynamic resistance in the empty duct and theone equipped with splitter differs, leading to differentloading of the blower; the noise of the air blower hasbeen tested at different loads, and it can be consid-ered constant for each tested velocity at the differentpressure loads involved. Table IV reports the pres-sure drops for different configurations and the average(through the different air speeds) of the pressure dropcoefficients defined as:
ζ =∆p
1/2ρV 2ref
. (1)
3.2. Sound Power Level comparison
Qualitatively comparable results are obtained for ab-sorbing and non-absorbing splitters. Fig. 7 shows thecalculated PWL for three different non-absorbing con-figurations:
• tapered wooden extension, with perforation;• blunt wooden extension, with perforation;• tapered wooden extension, with no perforation.
Spectra exhibit distinct peaks at frequencies of 400Hz, 630 Hz and 1000 Hz that do not change with flowspeed, indicating that they should be interpreted asa property of the test facility not directly related toself-noise. In the case with perforation significantlyhigher PWL levels are found in the range above 800Hz. Spectra exhibit a slight secondary peak at fre-quencies corresponding to a Strouhal number basedon the hole size of the metal perforates as:
Stperf =fpkdHVgap
(2)
where fpk is the peak frequency and dH is the diame-ter of the single perforation hole. The observed valueStperf = 0.3 is in accordance with previous findings [1].Tests with the two different wooden extensions (bluntand tapered) do not show significant differences, ex-cept for the low frequency range (up to 400 Hz), where
the tapered trailing edge shows lower PWL levels incomparison to the blunt one. It is important to re-member that the overall pressure drop induced by atapered trailing edge is lower than for a blunt one, seetable IV. The effect of tapering of the trailing edge onthe noise spectrum remains similar for the situationwith perforated plates as in the case with the perfo-rates covered, even if not shown in the present paper.
Finally, regarding the serrated extensions, no evi-dent difference is measured between the several con-figurations and the simply blunt one, so no result isshown here.
3.3. Nelson-Morfey scaling
In 1981 Nelson and Morfey [2], through an experi-mental investigation, established a relation betweenthe aerodynamic sound produced from a series of flowspoilers (orifices) in a rectangular duct and the fluc-tuation of the drag forces. Moreover they assumed adirect proportionality between the fluctuating forcesand the steady state drag force: within the propor-tional frequency band defined by (fc/α, fcα) (wherefc is the centre frequency) the ratio of the root meansquare force (FD)rms and the steady state force FDis expected to depend only on the Strouhal number.
(FD)rms = K(St)FD; (band fc/α - fcα) (3)
Nelson and Morfey suggest a scaling law - that hasbeen formulated by Oldham and Ukpoho [3] also forcircular ducts - that is based on the open area ratio σ(defined as the ratio between the constricted and thefree areas Ac/A), the constriction velocity Vgap andthe drag coefficient
CD =∆p
12ρV
2gapσ
2(1 − σ)(4)
In this context, the case under study presents a pe-culiarity: while the source region (test section) is ina rectangular duct, the transmission is through a cir-cular duct. Accordingly, the scaling laws presented inreferences [2] and [3] have been combined as shownbelow, to make them applicable to the examined case:
120 + 20 log10K(St) =
PWL− 10 log10
{ρ0A[σ2(1 − σ)]2C2
DV4gap
16c0
}(5)
for fc below the cut-on frequency, while for fc abovethe cut-on frequency:
120 + 20 log10K(St) =
PWL− 10 log10
{ρ0πA
2(St)2[σ2(1 − σ)]2C2DV
6gap
24c30d2
}
− 10 log10
[1 +
3c08rfc
](6)
EuroNoise 201531 May - 3 June, Maastricht
C. Sebastiani et al.: Experimental...
672

Table IV. Pressure drops and average pressure drop coefficients.
V ∆p Empty duct [Pa] ∆p Blunt, no perf. [Pa] ∆p Tapered, no perf.[Pa] ∆p Tapered, perf. [Pa]v1 14 62 52 60v2 27 112 90 100v3 44 180 150 168v4 62 250 210 240
ζAverage [-] 0.34 1.41 1.17 1.32
Figure 7. PWL obtained for different non-absorbing splitter configurations, plot in function of frequency (a) and Stperf
(b). blunt extension, with no perforation, tapered extension, with no perforation, tapered extension,with perforation.
where d is equal to the obstacle width, c0 is the speedof sound, r is the duct radius and St = fcd/Vgap.
Karekull, Efraimsson and Abom in [4] introduce theconcept of average duct resistance, in order to eval-uate the contribution of the propagating modes as afunction of wave number k = 2πf/c0 and duct dimen-sions. This average duct resistance is:
RPlane wave =ρ0A
8c0; k < kCut−On (7)
RCirc. d. =ρ0A
2k2(1 + 3π4rk )
48πc0; k > kCut−On (8)
where r is the duct radius. Compared to the planewave regime, equation 8 introduces a factor that forhigh frequencies converges to a component radiatingas a dipole in the free field.
Figures 9 and 10 show results that are obtainedwhen the above scaling laws are applied to the PWLdata from measurements with the following two con-figurations:
• a 92 mm width spoiler (thickness 20 mm, height600 mm) placed in the center of the test section(Fig. 8);
• a non absorbing splitter with perforated surface(same as in Fig. 7).
Figure 8. Sketch of the spoiler placed in the center of thetest duct.
It is seen that the scaled data collapse well for allvelocities tested, especially for the frequency abovethe cut-on. Karekull, Efraimsson and Abom [4] de-termine a universal slope for a generic geometry ofabout −28log(St). This dependency is not clearlyfound in the results shown in figures 9 and 10, where−28log(St) and −45log(St) slopes are drawn for com-parison. The reason of this mismatch, more evident forhigher Strouhal numbers, is unknown at the present,and maybe can be referred to the particular teststand. Regarding the slope of the spectra at high fre-
EuroNoise 201531 May - 3 June, Maastricht
C. Sebastiani et al.: Experimental...
673
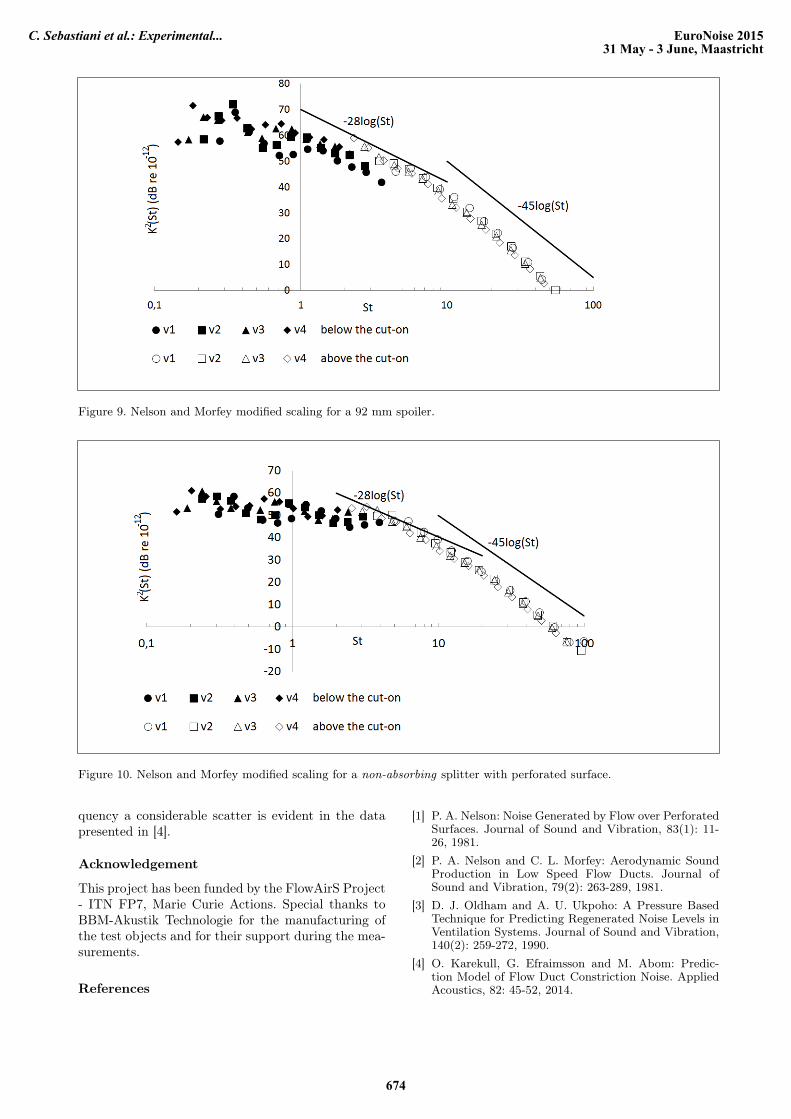
Figure 9. Nelson and Morfey modified scaling for a 92 mm spoiler.
Figure 10. Nelson and Morfey modified scaling for a non-absorbing splitter with perforated surface.
quency a considerable scatter is evident in the datapresented in [4].
Acknowledgement
This project has been funded by the FlowAirS Project- ITN FP7, Marie Curie Actions. Special thanks toBBM-Akustik Technologie for the manufacturing ofthe test objects and for their support during the mea-surements.
References
[1] P. A. Nelson: Noise Generated by Flow over PerforatedSurfaces. Journal of Sound and Vibration, 83(1): 11-26, 1981.
[2] P. A. Nelson and C. L. Morfey: Aerodynamic SoundProduction in Low Speed Flow Ducts. Journal ofSound and Vibration, 79(2): 263-289, 1981.
[3] D. J. Oldham and A. U. Ukpoho: A Pressure BasedTechnique for Predicting Regenerated Noise Levels inVentilation Systems. Journal of Sound and Vibration,140(2): 259-272, 1990.
[4] O. Karekull, G. Efraimsson and M. Abom: Predic-tion Model of Flow Duct Constriction Noise. AppliedAcoustics, 82: 45-52, 2014.
EuroNoise 201531 May - 3 June, Maastricht
C. Sebastiani et al.: Experimental...
674