experimental dynamic analysis of laminated …
TRANSCRIPT

1
ISME Journal of Mechanics and Design
Vol. 3, No.2, 2019 pp. 1-16
EXPERIMENTAL DYNAMIC ANALYSIS OF LAMINATED COMPOSITE
BEAMS
S. Moharana1, K. Khan2
1 Post Graduate Scholar, Department of Mechanical Engineering, National Institute of Technology,
Durgapur, West Bengal, 713209
2 Associate Professor, Department of Mechanical Engineering, National Institute of Technology, Durgapur,
West Bengal, 713209
*Corresponding Author: [email protected]
ABSTRACT
The experimental free vibration analysis has been carried out in the present work for different fiber
reinforced composite material laminated beams for different lamination schemes and boundary conditions of
the beams. The stresses at the top and bottom fibers are presented, and the damping parameter calculated
from the logarithmic decrement method is also presented. The experimental results are compared with the
results of finite element simulation results obtained from Ansys. For the experimental analysis the Lab VIEW
software has been used. It is observed that the nondimensional frequency for the 1st mode of vibration is
higher for carbon fiber reinforced composite laminated beam as compared to glass and aramid fiber
reinforced composite laminated beam. The stress at the bottom and top surface are more in carbon fiber than
glass and aramid fiber. The damping factor is maximum for carbon fiber reinforced composite laminated
beam.
Keywords: composite material, mechanical properties, dynamic analysis, damping factor.
1. INTRODUCTION
In today’s world, composite materials are becoming an essential part as they offer advantages like low
weight, high specific strength corrosion resistance, and high fatigue strength. Composite laminate is the
material that is not only used as structural components but also used for the thermal insulator, frictional
liner material, sound barrier, and much more application. Composite materials are suitable for making a wide variety of products from very small to very large. Starting from making an aircraft structure to small
medical equipment [1].

2
The last few decades of the second millennium faced humans with more challenges to develop advanced
engineering materials. For better resistance to corrosion and fatigue resistance, the Aerospace industry
introduced organic composite material during World War II. In early 1960 advancement in composite
material took place, significantly increasing the performance by reducing structural weight; very little
attention was given to low-cost manufacturing [2].
Carbon fiber, glass fiber, and aramid fiber are typically used as the fiber material. Many studies have
been done on these composite materials. In those studies, mechanical properties of fiber-reinforced
composites are investigated numerically experimentally and analytically.
Rajpurohit [3] mentioned a different type of composite manufacturing process that was used until now in
the world of the composite. There was a wide variety of manufacturing processes available for the
composite material, so it is complex to determine any standard process. The principal factor
is component geometry, size, and the required mechanical performance. Various processes were used for
fabrication of composite beam such as a) hand layup/wet layup b) sprat Layup c) filament winding
d) pultrusion e) resin transfer moulding f) infusion moulding etc. From the above traditional hand layup is
the simplest and low-cost process of preparation of composite material. Frangopol et al. [4] used the Tsai-
Wu failure criterion for analysing the reliability of a composite laminate plate. Fiber orientation, the
thickness of the layer, and a number have a significant effect on the reliability of fiber-reinforced composite
plates. There is also some study that deals with ballast fiber. The failure criteria
were previously mentioned, and the Monte Carlo simulation was adapted for computing the probability of
failure. Ekşi et al. [5] discussed the bending behavior of Woven Carbon, glass, and aramid Fiber Reinforced
Hybrid Composite Tube by a three-point bending test. Aramid fiber composite showed better performance
for load carrying capacity and energy-absorbing capacity. Morozov.et.al [6] used the off-axis tension test
for the determination of shear modulus of orthotropic material. In this study, the load is applied at 45˚ to
the principal axis. Orthotropic materials were taken into consideration. Mortazavian et al.[7], investigated
the tensile properties of short glass-fiber-reinforced thermoplastics both by experimentally and
analytically. Laminate analogy and modified Tsai-Hill criteria provided satisfactory predictions of elastic
modulus and tensile strength. Eksi et al. [8] compared the mechanical properties of unidirectional and
woven carbon glass and aramid fiber composite specimens by tension, compression, and shear test by the
universal testing machine. From the result of the test, the aramid fiber showed better performance in
woven fiber composite, and in unidirectional fiber specimens, carbon fiber performed better as compared
to others. Aly et al. [9] discussed the dynamic characteristic of a laminated composite beam experimentally.
He used a combined finite element and experimental approach to characterize the vibrational behavior of
composite beams. Glass fiber was used as a reinforcement material. Experiments were carried out by taking
different fiber orientation. The influence of fiber orientation on the flexural frequency was validated using
ANSYS SOFTWARE. Bassiouni et al. [10] presented the theoretical and experimental results of the dynamic
behavior of laminated composite beam (LCB). For obtaining mode shapes and natural frequencies, the finite
element model was used. And for each layer of the laminate, a separate rotational degree of freedom is
used. There was no interfacial slip or delamination, but shear deformation occurred. The effect of fiber
orientation is considered, and the experiment was carried out, and a response function was developed
using the FFT analyser. In the end, the theoretical results gave a good result with experimental. Maiti et al.
[11] investigated the higher-order shear deformation theory and the conventional first-order theory that
is used to develop a finite element method to analyse the bending and free vibration behaviour of laminated
composite beams accurately, using nine-noded isoparametric elements. Yasmeen et al. [12] determined the
damping property of the structural material by analysing modal analysis. The process of finding damping
properties such as frequency, mode shapes, damping ratio, etc. is called modal analysis. The author
estimated the following characteristic by using a cantilever beam of aluminum, brace, and acrylic glass.
Free vibration analysis and harmonic analysis are carried out by using ANSYS. The damping ratio was
calculated by half the bandwidth method. Costamilan et al. [13] investigated the damping ratio in the
carbon filament wound composite specimen by the Hilbert transform. The damping ratio was determined

3
both in the experimental and numerical approaches. The Hilbert transform calculated the logarithmic
decrement and the envelop techniques. A band-pass filter is used to isolate the first fundamental frequency
from the other mode of vibration and noise. Mevada et al. [14] experimentally investigate the structural
damping of different materials. In this experiment, the cantilever beam of different materials was used. By
the use of an accelerometer and a DAC system, time history data were plotted, and an FFT analyser
frequency response graph was generated. By viewing FFT data, one can determine the maximum frequency
and amplitude of frequency. And with the help of half bandwidth method, the damping ratio is determined.
Lavate et al. [15] investigated the vibrational behaviour of the fiber-reinforced composite beam. The
vibrational characteristic of the composite beam was studied, and the Young Modulus, Poisson’s ratio, and
shear modulus value were determined. Experimentally determined the in-plain and out of plain vibrations
and compared with the numerical value.
2. METHODOLOGY
2.1 Theoretical calculation of material properties:
Theoretically, mechanical properties are calculated by using the predefined formula in a standard
composite mechanics book [21].
The void fraction (𝒗𝒗) of the composite specimens are computed with the help of measured weight and
densities.
𝑣𝑣 = 1 −(
𝑊𝑓
𝜌𝑓)+(𝑊𝑐−𝑊𝑓)/𝜌𝑚
𝑊𝑐𝜌𝑐
(1)
Where 𝑊𝑓 ,𝑊𝑐 are the weight of the fiber and composite respectively.
The volume fraction of fiber and matrix are calculated by weight and densities of the fiber and matrix
material. It is calculated by taking the total volume of fiber and matrix to the total amount of composite.
Before starting the process, the measurement is done for both fibers and resin samples. The average weight
of the samples of fiber is taken and calculates the Density of that particular fiber. Then by subtracting
composite weight to fiber weight, resin weight is calculated. By taking the ratio of mass to density, the
volume can be calculated.
The volume fraction is defined as the weight of fiber or epoxy to the total weight of the composite.
Volume fraction fiber =𝑤𝑒𝑖𝑔ℎ𝑡 𝑜𝑓 𝑓𝑖𝑏𝑒𝑟
𝑡𝑜𝑡𝑎𝑙 𝑤𝑒𝑖𝑔ℎ𝑡 𝑜𝑓 𝑐𝑜𝑚𝑝𝑜𝑠𝑖𝑡𝑒
The volume fraction of matrix =1-volume fraction of fiber- volume fraction of void
𝜌𝑐 = 𝜌𝑓𝑣𝑓 + 𝜌𝑚𝑣𝑚 (1) ρ = Density of fiber and matrix respectively
A simple rule of mixture equation calculates calculation of elastic constant for unidirectional fiber
specimen. [21]
𝐸11 = 𝐸𝑓𝑣𝑓 + 𝐸𝑚(1 − 𝑣𝑓) (2)
Where E = Young’s modulus of the fiber composite.

4
𝐸2 =1
𝑣𝑓
𝐸𝑓+
1−𝑣𝑓
𝐸𝑚
(3)
𝜈12 = ν𝑓ν𝑓 + ν𝑚(1 − ν𝑓) (4)
Where ν= Volume fraction of fiber and matrix, respectively.
𝐺12 =1
𝑉𝑓
𝐺𝑓+1−𝛎𝑓
𝐺𝑚
(5)
𝜈12𝐸1
= 𝛎21𝐸2
(6)
𝐺23 =𝐸2
2(1−𝛎23) (7)
𝜐23 = ν12 [1+ν𝑚−
𝑣12𝐸𝑚𝐸11
1−𝑣𝑚2 +
𝑣𝑚𝑣12𝐸𝑚𝐸11
] (8)
Where m and f denote matrix and fiber, respectively.
2.2 Measurement of damping:
Various parameters such as specific damping capacity, loss factor, Q-factor and damping ratio, and models
like viscous, structural, and fluid can represent the damping. There are many methods for measuring the
damping of a vibration system. The logarithmic decrement method and bandwidth method are introduced
here.
2.2.1 Logarithmic decrement method:
This method is used to measure damping in the time domain. In this method, the free vibration
displacement amplitude history of a system to an impulse is measured and recorded. A typical free decay
curve is shown below. Logarithmic decrement is the natural logarithmic value of the ratio of two adjacent
peak values of displacement in free decay vibration.
𝛿 =1
𝑛𝑙𝑛 𝑙𝑛 (
𝑋1
𝑋𝑛+1) (9)
𝛿 =2𝜋𝜁
√1−𝜁2 (10)
𝜁 =𝛿2
√4𝜋2+𝛿2 (11)
Where ζ = damping factor and δ = logarithmic decrement.

5
Fig 2.1: (a) Half bandwidth method (b) Logarithmic decrement method
2.2.2 Half power bandwidth method:
To estimate the damping from the frequency domain, we can use a half-power bandwidth method. In this method, the frequency response amplitude of the system is obtained first corresponding to each natural
frequency; there is a peak in the response graph. Maximum amplitude/√2 or 3dB down on a log scale from the peak, two points are corresponding to half PowerPoint, as shown in the figure. Half power bandwidth represents the ratio of the frequency range between the two half-power points to the natural frequency at this mode.
𝜔2−𝜔1
𝜔𝑛= 2𝜁 (12)
Where 𝝎n, 𝝎1 and 𝝎2 are the natural frequency and Half bandwidth frequency, respectively.
3. CHARACTERIZATION OF TENSILE TEST SPECIMEN:
3.1. Preparation of the laminate’s specimen for the tensile test:
a) Preparation of mould:
The hand layup process is an open moulding process using only one mould. Here in our preparation
method, we were using glass plates in place of mould. The surface of the glass plate was thoroughly cleaned
to be ready to use by removing all dust and dirt from it.
b) Application of releasing agent:
After the mould surface has been cleaned, the releasing agent is applied. A polythene sheet is spread
on the glass plate for easy removal of the composite. Glass plate is laid on the table.
c) Preparation of matrix material:
The matrix material is prepared by using polymer resin. Lapox -12 is added with a K-6 hardener.
(Weight percentage of 10:1) The required weight of the resin was taken (such that the weight of the fibers
to the weight of the resin was 40:60) to this measured weight of the resin, hardener was added, such that
the weight of the hardener was 10% of the total weight of the resin. The resulting mixture was stirred
correctly to ensure proper mixing. The use of hardener is necessary because without hardener resin does
not cure properly. After mixing both the chemicals, it has left for some time, so that bubble form during
stirring may die out. The addition of hardener is done to facilitate the natural hardening of the composite
laminate during curing.
d) Preparation of reinforcement:
Unidirectional Carbon fiber of 240g/m2 (density 1600g/m3); glass fiber of 360 g/m2 (density
2500g/m3); aramid fiber (Kevlar) of 220 g/m2 (density 1400g/m3) are used as reinforcement. The fabric is

6
made up of fiber oriented in a single direction, i.e., longitudinal direction. Fiber mats are used for making
laminated composite specimens and are cut in three pieces each.
e) Preparation of the laminated plate:
One layer of resin is spread on the polythene sheet uniformly. Then the first layer of the mat is laid on
the resin coating and pressed the fiber against the resin for absorbance. A coating of epoxy resin was
applied uniformly on top of the fiber using a brush. Rolling was done under uniform pressure so that the
resin properly penetrates the mat. A heavy roller was used for this purpose. In our case, we are using a
composite lamina to press the layers and remove air bubbles. Then the second fiber mat of required
dimension was laid over the first one, and again uniform coating of resin was applied, followed by proper
removal of air bubbles. The process was repeated till four fiber mats were laid, one over the other (with
resin in between). Finally, a releasing sheet was placed above the top mat. Releasing sheets are provided
to ensure that the composite laminate does not stick to the glass surface. A heavyweight (in the form of
massive glass slab) was applied at the top of the laminate, and it was left to cure for 24 hours. By hand layup
process, 24 hours was taken as curing time for preparation of lamina under natural environmental
conditions, room temperature.
f) Preparation of the tensile test specimen:
The unidirectional carbon, glass, and aramid fiber reinforcement composites which consist of four
layers were used in this test. The total lamina thickness is approximately 2 mm. The unidirectional tensile
test specimens were cut out of laminates in both fiber and matrix direction, i.e., both in the longitudinal and
transverse direction according to ASTM D3039 [16].
Figure 3.1 shows the specimen dimension according to the ASTM standard. Unidirectional
Unidirectional fiber/epoxy tabs with tapered ends were locally bonded on each other side of the specimens.
These tabs allow smooth load transfer from grip to the sample, especially for ambient temperature tests.
g) Preparation of composite beam
Beams of three different fibers are fabricated with varying orientations of fiber to obtain the static
and dynamic properties of reinforcement composite. Beam specimens are prepared by hand layup process
with a curing time of 24 hours according to the ASTM standard. The beam was four-layer, each with a
dimension of 400mm*50mm*2mm for carbon and glass fiber composite specimen and thickness equal to
4 mm for aramid fiber specimen. Fiber Orientations were taken as [00]4, [00-900]2and [900-00]2. The
sufficient length of the beam was taken as 400mm, and to calculate the different parameters of analysis,
different effect lengths were to be considered and an eight-layer beam of carbon fiber with the same
dimension.
3.2. Tensile test of composite bar specimens:
The specimens are tested from beginning to failure mode. All the experiments were conducted under
displacement control conditions. The tensile test was conducted using an Instron universal testing machine
(model 8800R) according to the ASTM D3039 standard [1]. The experiment was conducted at ambient
temperature (25˚C) and 35% relative humidity. The test specimens were cut into the dog-bone shape of
250mm
56mm
15mm
Fig 3.1: The Dimension of the composite bar specimen

7
dimension 250 mm × 15 mm × 2mm and 150mm*25mm*2.1mm using a high-speed hand cutter. The figure
shows typical tensile test specimens of both directions. Three samples were tested for each composite
formulation with a load cell of 25 KN and a crosshead speed of 2 mm/min. The characterization of
specimens is done in the UTM machine. The tensile test results of the unidirectional fiber specimens are
listed below in table 3.1.
The static tensile test was purposed to determine the properties like tensile strength, young’s modulus, and
ultimate strain of unidirectional longitudinal and lateral direction at room temperature. Three specimens
of each specimen were tested. Three specimens (S.1, S.2, and S.3) of each sample were tested. Figure 3.2
shows the typical stress-strain behavior of unidirectional fiber specimens under a tensile load in a
longitudinal direction. In one plot, three specimen’s data are combined. The response is the same as
described.
Fig 3.2: Typical stress-strain behavior of unidirectional laminate under tensile loads in the longitudinal
direction at room temperature (a) Carbon fiber (b) Glass fiber (c) Aramid fiber.
The only difference is the curves showed nonlinearity behavior before reaching the maximum stress, which
is due to the nature of the plasticity of epoxy. There is a small amount of tab debonding near the gage area
at room temperature specimens. Fiber breakage is due to a weak interface between the fiber and the matrix.
Moreover, matrix cracked, and fiber pull out were observed.
In transverse tension loading, net matrix failure is observed near the gauge area. In-room temperature
specimens, there is no significant de-bonding found.
Fig 3.3: Typical stress-strain behavior of unidirectional laminate under tensile loads in the transverse
direction at room temperature. (a) Carbon fiber, (b) glass fiber and (c) Aramid fiber

8
Table 3.1: Mechanical properties of the unidirectional fiber-reinforced composite specimen from UTM
test
Reinforcement
type
Maximum
load
(kN)
Elastic
module
(GPa)
Ultimate
stress
(MPa)
Yield
stress
(MPa)
Fracture
stress
(MPa)
Poisson
ratio
Elongatio
n at break
(mm)
Carbon fiber(0°) 23.91 47.856 797.26 774.24 756.06 0.299 1.86
Glass fiber(0°) 9.59 13.604 353.88 345.12 111.11 0.280 2.54
Aramid fiber (0°) 12.06 12.671 402.15 379.33 211.67 0.320 3.57
Carbon fiber
(90°)
0.80 7.358 16.143 -- 15.441 0.028 0.482
Glass fiber(90°) 0.88 7.7476 17.615 -- 17.067 0.073 0.385
Aramid fiber
(90°)
0.57 5.332 11.500 -- 11.15 0.043 0.530
Result obtained from the test is according to the literature survey. There are some minor differences in
values as compared to literature as the traditional hand layup process manufactures composite specimens.
In both [00]4 oriented and [00-900]2 oriented unidirectional reinforcement composite specimens, carbon
composite specimens give better results than that of others. Carbon fiber has maximum strength and elastic
modulus value compared to all.
The elasticity modulus of [00]4 oriented carbon fiber composite is 6.5 times higher than that of 90º
orientation fiber. Elasticity module of [00]4 orientation glass fiber reinforced epoxy, which is 1.74 times
higher than that of [00-900]2 orientation carbon fiber reinforced epoxy. Tensile strength of 0º-orientation
carbon fiber reinforced epoxy is approximately 2.3 times higher than that of glass-reinforced; however, the
ratio of elasticity modulus of [00]4 orientation carbon fiber to that of [00]4 orientation glass fiber is 3.5. [00]4
unidirectional fiber reinforcement composite shows maximum improvement as compared to [00-900]2
orientation.
Strength ration for [00]4 carbon epoxy composite to [00-900]2 carbon composite is 49.38.and similarly
for glass fiber reinforcement composite is 20.08, and aramid fiber epoxy composite is 34.81. In both, the
case tensile test and theoretical calculation glass fiber specimen has better shear strength and higher
density compared to others. In load criteria, 0°oriented fiber gives the better result of 23.91 KN maximum
load capacity. For elongation purposes, aramid fiber in both [00]4 orientation and [00-900]2 orientation gives
marginally better results.
4. EXPERIMENTAL SETUP FOR DYNAMIC ANALYSIS:
1. The required equipments for the experiment are
1. Data acquisition system: A NI 9234 DAQ system having four input channels is used to connect the
accelerometer with the interface.
2. Accelerometer: PCB High Sensitivity (Model no: 352C33), 100mV/g, ICP® (IEPE). An accelerometer is
used for the analysis. IEPE's current excitation is used for all the sensors. Accelerometer sensitivity ranges

9
from 10 mV/g to 100 mV/cable for use with 780988-01, and 780989-01 accelerometers are PCB Low Noise
Coaxial Cable (Model No: 003C05), 10 ft. w/10-32 plug to DAC adapter.
3. Support set up: support set up consisting of 4 stands was used.
4. Pc with software: Lab VIEW software is used to analyse the real-time data.
Experimental setup
An experimental set up shown in figure 4.1 containing four bolts mounted on a base plate is fixed on an
experiment table. Then the beam of various materials is to be fixed at one end, and both ends set
respectively. An accelerometer has been attached to the cantilever and simply supported beam at the free
end and the midpoint concerning end condition to sense the acceleration data of vibration. An impact
hammer is used to oscillate the beam. After the impact beam vibrates, the accelerometer detects the data
and signal generated by a DAC device that is connected with an interface. The lab VIEW software used to
analyse the signal on the computer.
Required properties of the accelerometer are given in the DAC window shows in, and to verify whether the
block diagram is correct or not, one may run the graph in that window. Then after setting up the required
properties, run the program by giving a small amount of excitation to the beam. An experiment is conducted
with the specified beam specimen to record the data of time history (acceleration –time) and spectral
analysis plot. In spectral analysis, linear graph and power spectrum options were selected. The natural
frequency of the system can be directly observed from the power spectrum plot. The location of peak value
from the system denotes the natural frequency.
Fig 4.1: Experimental setup for vibration analysis
5. FINITE ELEMENT ANALYSIS OF BEAM SPECIMEN:
Finite element analysis of composite beams was carried out with the help of ANSYS 2016 APDL. For
modelling of the beam, both fixed-free and fixed-fixed boundary conditions of composite material, the
following procedure has been adapted. In the main menu, in the pre-processor part, the element type was
selected as structural and element selected for beam id shell 3D four-node 181.material properties were
given according to the result coming from the tensile test. The Density of the respective material was given,
as calculated. In section, the shell section was selected and then in the layup panel, the thickness was added

10
to each layer of beam and orientation of beam was selected. By using the modelling option, the beam was
generated by firstly creating key points and then creating an area by lines. The required area of the beam
was created for analysis, and then the next part was meshing. Meshing was done by selecting the global
meshing and assigns the no of division required, mesh area. After meshing, boundary conditions were
introduced as fixed-free, fixed-fixed, and simply supported, respectively. And for the static solution load
was applied as a point load at the middle and the free end for fixed-fixed and fixed-free beam, respectively.
Next was the solution panel. In solution, control chooses the modal for vibration analysis and static for
stress-strain analysis. In the analysis option, the range of frequencies and no mode required was given.
After that, by clicking the solve option, the analysis got complete. In general, post-processor, part solutions
were obtained; by taking option plot results, the solutions can be viewed.
6. RESULT AND DISCUSSION:
Table 6.1 shows the experimental damped natural frequencies obtained by free vibration test for all
composite laminated beams of 4 layers each. Figures 6.1, 6.2, and 6.3 represent the frequency response
curves obtained from the experiment of composite beams to get the damped natural frequencies. ANSYS
modelling is developed to compare the result of natural frequency.
In figure 6.1, 6.2 and 6.3 X-axis represents frequency in Hz and Y-axis amplitude.
The frequency response graphs for each beam are plotted using the Tec plot 360. Each graph represents
two frequency peaks, one for [00]4 orientation and one for [0º-900]2orientation for one boundary condition.
From figure 6.1, 6.2, and 6.3, it can be visible that for similar boundary conditions, natural frequencies are
nearly matched irrespective of fiber orientation. There is the only difference in the amplitude of the response.
For every fiber reinforcement beam, the fixed-fixed condition has a higher natural frequency than that of
fixed-free conditions.
Fig 6.1: Natural frequency peak curve of Carbon fiber (a) fixed-free (b) fixed-fixed composite beam

11
Fig6.2: Natural frequency peak curve of Glass fiber (a) fixed-free (b) fixed-fixed composite
beams
Fig 6.3: Natural frequency peak curve of aramid fiber (a) fixed-free (b) fixed-fixed composite beam
Table 6.1 represents the nondimensional value of frequency for both experimental and simulation studies.
The nondimensional factor that used for conversion is
ϖ = ω1𝐿2√
ρ
𝐸2ℎ2 (13)
Where, ϖ = Non-dimensional frequency, ω1 = natural frequency of the beams.

12
Table 6.1: Natural frequency of composite laminated beam with different boundary condition
Fiber orientation Boundary
condition
Nondimensional
frequency
(Experiment)
Nondimensional
frequency (Ansys)
Percentage of
error
Carbon fiber [00]4 Fixed free 3.151 3.464 9.960
Carbon fiber [00]4 Fixed-fixed 16.385 18.285 11.580
Carbon fiber[00-900]2 Fixed free 2.038 2.471 21.400
Carbon fiber[00-900]2 Fixed-fixed 12.214 14.099 15.430
Glass fiber, [00]4 Fixed free 1.627 1.793 10.170
Glass fiber, [00]4 Fixed-fixed 9.767 11.434 17.060
Glass fiber, [00-900]2 Fixed free 1.4036 1.548 10.330
Glass fiber, [00-900]2 Fixed-fixed 8.421 8.667 2.900
Aramid fiber[00]4 Fixed free 1.906 2.176 14.170
Aramid fiber[00]4 Fixed-fixed 12.477 13.893 11.340
Aramid fiber[00-900]2 Fixed free 1.393 1.420 1.950
Aramid fiber[00-900]2 Fixed-fixed 8.709 9.788 12.390
Natural frequencies of unidirectional fiber carbon/epoxy, Glass/Epoxy, and aramid/epoxy Fixed-free and
fixed-fixed type composite beam were measured by the modal testing method using Lab view and by
simulation using ANSYS. The results found from the experiment and simulation are presented in Table 6.1.
The experimental and simulation values were compared. The percentage error of experimental value with
programming value was calculated.
From the results of table 6.1, it has been found that the experimental results show a good agreement
with the ANSYS results (maximum difference equal 21.3% for 1st mode frequency), showing that fiber angle
influences the dynamic behavior of laminated beam. Un-damped natural frequency is considered in the
ANSYS, and damping was present in the system. So, the natural frequency from the experiment should be
less than the actual value. But the difference between both the results is reasonable.
Mode shapes of beams: Figure 6.4 shows the mode shapes of the composite laminated beam of carbon fiber with a fixed-free
boundary condition. Mode shapes of 4-layer fiber reinforcement composite laminated beam of fixed-fixed
boundary conditions are given below in figure 6.5. Natural frequencies obtained from ANSYS are more than
that of the experimental one. The graph represents the shape and amplitude of the vibration of the fixed-
fixed beam analysed in ANSYS.

13
The damping ratio is a parameter, usually denoted by ζ (zeta) , that provides a mathematical means of
expressing the level of damping in the system relative to critical damping. Damping of the specimen made
up of different materials was calculated with the help of the half-power bandwidth method.
Damping factor determination of 4 layered composite laminated beams is listed in table 6.2 from both
frequency response analysis and logarithmic decrement method.
Table 6.2: Damping factor value of the different composite specimen
Fiber orientation Boundary condition Damping factor, FFT
plot
Damping factor from
Logarithmic
decrement
Carbon fiber[00]4 Fixed free 0.060 0.051
Carbon fiber[00]4 Fixed-fixed 0.015 0.012
Carbon fiber[00-900]2 Fixed free 0.056 0.045
Carbon fiber[00-900]2 Fixed-fixed 0.011 0.012
Glass fiber[00]4 Fixed free 0.011 0.012
Glass fiber[00]4 Fixed-fixed 0.019 0.027
Glass fiber[00-900]2 Fixed free 0.025 0.021
Glass fiber[00-900]2 Fixed-fixed 0.023 0.014
Aramid fiber[00]4 Fixed free 0.045 0.045
Aramid fiber[00]4 Fixed-fixed 0.006 0.0094
Aramid fiber[00-900]2 Fixed free 0.045 0.051
Fig 6.4:1st flexural mode shapes of
cantilever type composite laminated
beam
Fig 6 5:1st flexural mode shapes of
fixed-fixed type composite laminated
beam
14
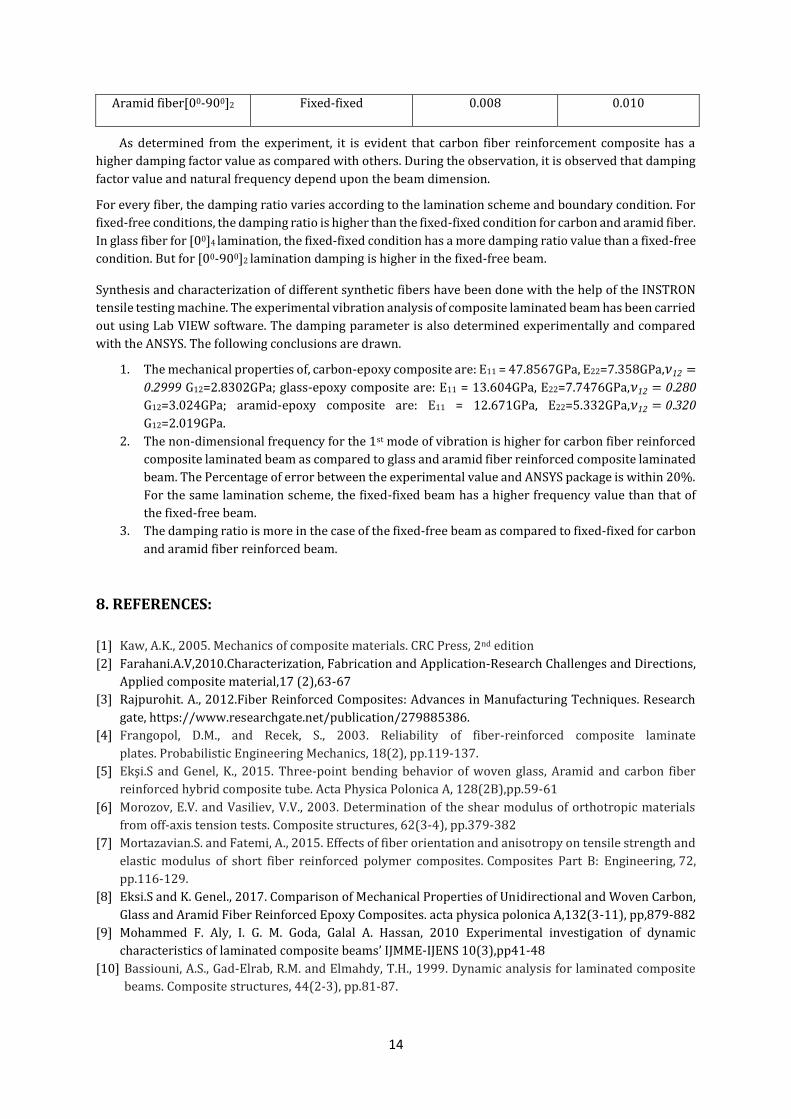
Aramid fiber[00-900]2 Fixed-fixed 0.008 0.010
As determined from the experiment, it is evident that carbon fiber reinforcement composite has a
higher damping factor value as compared with others. During the observation, it is observed that damping
factor value and natural frequency depend upon the beam dimension.
For every fiber, the damping ratio varies according to the lamination scheme and boundary condition. For
fixed-free conditions, the damping ratio is higher than the fixed-fixed condition for carbon and aramid fiber.
In glass fiber for [00]4 lamination, the fixed-fixed condition has a more damping ratio value than a fixed-free
condition. But for [00-900]2 lamination damping is higher in the fixed-free beam.
Synthesis and characterization of different synthetic fibers have been done with the help of the INSTRON
tensile testing machine. The experimental vibration analysis of composite laminated beam has been carried
out using Lab VIEW software. The damping parameter is also determined experimentally and compared
with the ANSYS. The following conclusions are drawn.
1. The mechanical properties of, carbon-epoxy composite are: E11 = 47.8567GPa, E22=7.358GPa,𝜈12 =
0.2999 G12=2.8302GPa; glass-epoxy composite are: E11 = 13.604GPa, E22=7.7476GPa,𝜈12 = 0.280
G12=3.024GPa; aramid-epoxy composite are: E11 = 12.671GPa, E22=5.332GPa,𝜈12 = 0.320
G12=2.019GPa.
2. The non-dimensional frequency for the 1st mode of vibration is higher for carbon fiber reinforced
composite laminated beam as compared to glass and aramid fiber reinforced composite laminated
beam. The Percentage of error between the experimental value and ANSYS package is within 20%.
For the same lamination scheme, the fixed-fixed beam has a higher frequency value than that of
the fixed-free beam.
3. The damping ratio is more in the case of the fixed-free beam as compared to fixed-fixed for carbon
and aramid fiber reinforced beam.
8. REFERENCES:
[1] Kaw, A.K., 2005. Mechanics of composite materials. CRC Press, 2nd edition
[2] Farahani.A.V,2010.Characterization, Fabrication and Application-Research Challenges and Directions,
Applied composite material,17 (2),63-67
[3] Rajpurohit. A., 2012.Fiber Reinforced Composites: Advances in Manufacturing Techniques. Research
gate, https://www.researchgate.net/publication/279885386.
[4] Frangopol, D.M., and Recek, S., 2003. Reliability of fiber-reinforced composite laminate
plates. Probabilistic Engineering Mechanics, 18(2), pp.119-137.
[5] Ekşi.S and Genel, K., 2015. Three-point bending behavior of woven glass, Aramid and carbon fiber
reinforced hybrid composite tube. Acta Physica Polonica A, 128(2B),pp.59-61
[6] Morozov, E.V. and Vasiliev, V.V., 2003. Determination of the shear modulus of orthotropic materials
from off-axis tension tests. Composite structures, 62(3-4), pp.379-382
[7] Mortazavian.S. and Fatemi, A., 2015. Effects of fiber orientation and anisotropy on tensile strength and
elastic modulus of short fiber reinforced polymer composites. Composites Part B: Engineering, 72,
pp.116-129.
[8] Eksi.S and K. Genel., 2017. Comparison of Mechanical Properties of Unidirectional and Woven Carbon,
Glass and Aramid Fiber Reinforced Epoxy Composites. acta physica polonica A,132(3-11), pp,879-882
[9] Mohammed F. Aly, I. G. M. Goda, Galal A. Hassan, 2010 Experimental investigation of dynamic
characteristics of laminated composite beams’ IJMME-IJENS 10(3),pp41-48
[10] Bassiouni, A.S., Gad-Elrab, R.M. and Elmahdy, T.H., 1999. Dynamic analysis for laminated composite
beams. Composite structures, 44(2-3), pp.81-87.

15
[11] Maiti, D.K. and Sinha, P.K., 1994. Bending and free vibration analysis of shear deformable laminated
composite beams by finite element method. Composite Structures, 29(4), pp.421-431
[12] Harrigan, W.C, 1998. Commercial processing of metal matrix composites, Mater.Sci. Eng. A, Vol.244,
pp.75–79
[13] Costamilan.E, A.M.Low, M.D.F. Awruch,2018 damping ratio in carbon fiber reinforcement epoxy
filament wound composites using Hilbert transform, doi 10.20944/preprints2018-1.0124.v1
[14] Mevada, H., and Patel, D., 2016. Experimental determination of structural damping of different
materials. Procedia Engineering, 144, pp.110-115
[15] Lavate .R.S, Patil. A. T, Patil A. M, Hargude. N.V, 2014. Dynamic Response Analysis of Fiber Reinforced
Composite Beam. IOSR Journal of Mechanical Civil Engineering (IOSR-JMCE) ISSN: 2278-1684, PP: 38-
47.
[16] Astm, A.S.T.M., 2014. D3039/D3039M: Standard Test Method for Tensile Properties of Polymer Matrix
Composite Materials. ASTM,08.01,1-13

16
Content of table
Table no
Title
Page no
Table 3.1 Mechanical properties of the unidirectional fiber-reinforced composite
specimen from UTM test
8
Table 6.1: The natural frequency of composite laminated beam with different boundary
condition 12
Table 6.2 Damping factor value of the different composite specimen
13
Table of figure
Figure no Title Page no
Figure 2.1 (a) Half bandwidth method (b) Logarithmic decrement method 5
Figure 3.1 The dimension of the composite bar specimen 6
Figure 3.2 Typical stress-strain behaviour of unidirectional laminate under tensile loads in
the longitudinal direction at room temperature (a) Carbon fiber (b) Glass fiber
(c) Aramid fiber
7
Figure 3.3 Typical stress-strain behaviour of unidirectional laminate under tensile loads in
a transverse direction at room temperature. (a) Carbon fiber,(b) Glass fiber and
(c) Aramid fiber
7
Figure 4.1 Experimental setup for vibration analysis 9
Figure 6.1 Natural frequency peak curve of Carbon fiber (a) fixed-free (b) fixed-fixed
composite beam
10
Figure 6.2 Natural frequency peak curve of Glass fiber (a) fixed-free (b) fixed-fixed
composite beams
11
Figure 6.3 Natural frequency peak curve of aramid fiber (a) fixed-free (b) fixed-fixed
composite beam
11
Figure 6.4 1st flexural mode shapes of cantilever type composite laminated beam 13
Figure 6.5 1st flexural mode shapes of fixed-fixed type composite laminated beam 13