experimental challenges to theories of classical ...experimental challenges to theories of classical...
TRANSCRIPT

Experimental Challenges to Theories of Classical Conditioning:Application of an Attentional Model of Storage and Retrieval
Nestor A. Schmajuk and Jose A. LarrauriDuke University
Several studies have recently challenged the accuracy of traditional models of classical conditioning thataccount for some experimental data in terms of a storage deficit. Among other results, it has been reportedthat extinction of the blocking or overshadowing stimulus results in the recovery of the response to theblocked or overshadowed stimulus, backward blocking shows spontaneous recovery, extinction of thetraining context results in the recovery from latent inhibition, interposing a delay between conditioningand testing in latent inhibition increases latent inhibition, and latent inhibition antagonizes overshadow-ing. An existing neural network model of classical conditioning (N. A. Schmajuk, Y. Lam, & J. A. Gray,1996), which includes an attentional mechanism controlling both storage and retrieval of associations, isable to quantitatively describe these results.
Keywords: recovery, blocking, overshadowing, backward blocking, super latent inhibition
In recent decades, new phenomena have been presented thatchallenge traditional theories of classical conditioning (e.g., Mack-intosh, 1975; Pearce & Hall, 1980; Rescorla & Wagner, 1972).Among other observations, Matzel, Schachtman, and Miller (1985;Kaufman & Bolles, 1981) established that extinction of the over-shadowing conditioned stimulus (CS) results in the recovery of theresponse to the overshadowed CS; Blaisdell, Gunther, and Miller(1999) showed that extinction of the blocking CS results in therecovery of the response to the blocked CS; Pineno, Urushihara,and Miller (2005) reported that a time delay interposed betweenthe last phase of backward blocking (BB) and testing results in therecovery of the response to the blocked CS; Grahame, Barnet,Gunther, and Miller (1994) reported that extinction of the contextfollowing latent inhibition (LI) results in the recovery of theresponse of the target CS; De la Casa and Lubow (2000, 2002)demonstrated that a delay interposed between conditioning andtesting results in an increased LI effect (super LI); and Blaisdell,Bristol, Gunther, and Miller (1998) showed that LI and overshad-owing counteract each other.
Several attempts to account for these results can be mentioned.For example, Van Hamme and Wasserman (1994) offered a mod-ified version of the Rescorla and Wagner (1972) model that is ableto explain recovery from overshadowing and blocking, but it is
unable to explain LI and, consequently, its recovery. Dickinsonand Burke (1996) offered a modified version of Wagner’s (1981)sometimes opponent process (SOP) theory, which describes recov-ery from overshadowing, blocking, and LI but is unable to describespontaneous recovery from BB, super LI, or the interaction be-tween LI and overshadowing. Finally, the extended comparatorhypothesis (Denniston, Savastano, & Miller, 2001) describes theLI–overshadowing interaction and provides an explanation for therecovery from BB but cannot describe super LI. In this article, weshow how an existing neural network model of classical condi-tioning (the SLG model; Schmajuk, Lam, & Gray, 1996) can beapplied to the above-mentioned results.
The Dickinson and Burke (1996) Versionof Wagner’s (1981) SOP Model
Dickinson and Burke (1996) proposed a revised version ofWagner’s (1981) SOP theory. According to the original theory, astimulus representation can be in one of three states: A1 (active),A2 (active), or I (inactive). An excitatory association between a CSand an unconditioned stimulus (US) increases when their repre-sentations are in the A1 state. After training, presentation of the CSby itself activates a representation of the US (initially in the I state)in the A2 state. An inhibitory association between a CS and a USincreases when the CS representation is in the A1 state and the USrepresentation is in the A2 state, that is, when the US is not presentbut is evoked by another CS. Whereas Wagner (1981) suggestedthat no learning occurs if the representations of two stimuli are inthe A2 state, Dickinson and Burke (1996) postulated that in thissituation an excitatory association is formed. This association isweaker, however, than that formed when both stimuli are in the A1state. In addition, whereas Wagner (1981) suggested that no learn-ing occurs if the CS is represented in the A2 state and the US ispresented in the A1 state, Dickinson and Burke (1996) postulatedthat, in this situation, an inhibitory association is formed betweenthe CS and the US.
Nestor A. Schmajuk and Jose A. Larrauri, Department of Psychologicaland Brain Sciences, Duke University.
We would like to take this opportunity to remember our dear friend andcolleague, Jeffrey Gray, who died in April 2004 and who originallysuggested we take on the challenging data presented in this article.
We thank Aaron Blaisdell, Gonzalo De la Casa, Tony Dickinson, GeoffHall, Peter Holland, and Ralph Miller for their thoughtful comments andfor sharing information about experiments and models. We also thank RickHoyle for his help with some of the statistical aspects of the article.
Correspondence concerning this article should be addressed to Nestor A.Schmajuk, Department of Psychological and Brain Sciences, Duke Uni-versity, Box 90086, Durham, NC 27708-0086. E-mail: [email protected]
Journal of Experimental Psychology: Copyright 2006 by the American Psychological AssociationAnimal Behavior Processes2006, Vol. 32, No. 1, 1–20
0097-7403/06/$12.00 DOI: 10.1037/0097-7403.32.1.1
1

Dickinson and Burke’s (1996) modified SOP model can de-scribe (a) that extinction of the context following LI results in therecovery of the response to the CS (Grahame et al., 1994), (b) thatextinction of the blocking CS results in the recovery of the re-sponse to the blocked CS (Blaisdell et al., 1999), (c) that extinctionof the overshadowing CS results in the recovery of the response tothe overshadowed CS (Matzel et al., 1985), and (d) BB (Miller &Matute, 1996), but not (e) that LI and overshadowing counteracteach other (Blaisdell et al., 1998).
Denniston et al.’s (2001) ExtendedComparator Hypothesis
According to the comparator hypothesis (Miller & Matzel,1988; Miller & Schachtman, 1985), during testing, the target CSgenerates two representations of the US: a direct one through itsown CS–US association and an indirect one through CS–Comparator CS and Comparator CS–US associations. The Com-parator CS (i.e., another CS, or the Context [CX]) is the one withthe strongest association with the target CS. When the strength ofthe direct representation is greater than the indirect one, the po-tential for responding is larger than that for inhibiting responding.Conversely, when the strength of the indirect representation isgreater than the direct one, the potential for inhibiting respondingis larger than that for responding. For example, weak responding tothe target CS in LI is the consequence of a strong direct USrepresentation, through the CS–US association, compared with astrong indirect US representation, through the combined CS–CXand CX–US associations. Attempts to confirm the predictions ofthe comparator hypothesis regarding the effect of posttrainingextinction of the Comparator CS have largely been confirmed bythe recovery experiments cited in the introduction. For instance,posttraining extinction of the context in the case of LI produces adecrease in the indirect representation of the US by reducing theCX–US association, thereby increasing responding to the target CSand decreasing LI. However, attempts to confirm predictions re-garding the effects of posttraining inflation of the Comparator CShave largely been unsuccessful (Miller, Hallam, & Grahame, 1990;but see Miller & Matute, 1996).
Because the original hypothesis was unable to describe datashowing that a blocked CS is incapable of blocking another CS(Williams, 1996)—a result that the SLG model is able to de-scribe—and that LI and overshadowing counteract each other(Blaisdell et al., 1998), Denniston et al. (2001) introduced theextended comparator hypothesis. According to this hypothesis,responding is still determined by the target CS–US associationcompared with the combined target CS–Comparator CS1 andComparator CS1–US associations. However, in addition, the ex-pression of both the target CS–Comparator CS1 and the Compar-ator CS1–US associations now reflects their effective associativestrengths, instead of absolute ones. The effective strength of thetarget CS–Comparator CS1 link is determined by contrasting thetarget CS–Comparator CS1 association with the combination ofthe target CS–Comparator CS2 association and the ComparatorCS2–Comparator CS1 association, where CS2 represents any andall stimuli with a strong association with the target CS, excludingthe Comparator CS1 and the US. In a similar way, the effectivestrength of the Comparator CS1–US link is determined by con-trasting the Comparator CS1–US association with the combination
of the Comparator CS1–Comparator CS2 association and theComparator CS2–US association. Therefore, the extended com-parator hypothesis takes into consideration the effects of higherorder stimuli in modulating the indirect representation of the US.
In addition to the correct descriptions of experimental datamentioned above, the comparator hypothesis has been successfullyapplied to overshadowing (Matzel et al., 1985), the US-preexposure effect (Matzel, Brown, & Miller, 1987), conditionedinhibition (Kasprow, Schachtman, & Miller, 1987), and BB(Miller & Matute, 1996).
Schmajuk et al.’s (1996) Model of Storage and Retrieval
Schmajuk et al. (1996) proposed a model of classical condition-ing that incorporates and extends the properties of several previousmodels. The SLG model includes (a) a recurrent system that storesCS–CS and CS–US associations and permits the generation ofinferences (Schmajuk & Moore, 1988); (b) a real-time attentionalvariable regulated not only by the novelty of the US, as in thePearce and Hall (1980) model, but also by the novelty of the CSsand the CX; and (c) an extended, real-time, modified version of theRescorla and Wagner (1972) rule that describes not only CS–USassociations but also CS–CS associations. By incorporating thesethree mechanisms, the model was intended to address some basicproperties of classical conditioning, including simple conditioning,sensory preconditioning, and LI. Then, by design, the model iscapable of replicating these basic paradigms. In addition, andwithout any further modification, the model can reproduce manyother behaviors, including the recovery results and super LI shownin the present article. A formal description of the model as a set ofdifferential equations is presented in Schmajuk et al. (1996).
As shown in Figure 1, the SLG network includes the following:1. Short-term memory and feedback. In order to allow a CS to
establish associations with other CSs or the US even when sepa-rated by a temporal gap (e.g., trace conditioning), a CS activates ashort-term memory trace, �CS, which increases over time to amaximum when the CS is present and then gradually decays backto its initial value when the CS is absent.
The output of the Short-term Memory and Feedback block inFigure 1 is proportional to �CS � BCS, where BCS is the predictionof the CS by itself, other CSs, and the CX. Because this output isactive either in the presence of a CS or when an absent CS ispredicted by other CSs or the CX, the model can describe sensorypreconditioning. In this paradigm, CS1–CS2 presentations fol-lowed by CS2–US pairings result in a CR to CS1. According to themodel, the prediction of CS2, BCS2, is activated by CS1, and BCS2
activates the prediction of the US, BUS, thereby generating a CR.2. Attention. The model assumes that animals respond to novelty
by increasing attention to environmental stimuli (Gray, 1971). Toincrease attention to the CSs when novelty is sensed, the outputs ofthe feedback system (�CS � BCS) become associated with thenormalized value of total novelty detected in the environment,Novelty’. Attentional memory, zCS, reflects the association be-tween the output of the feedback system and Novelty’. The initialvalue of zCS is zero. When Novelty’ is relatively large, zCS grad-ually becomes positive. When Novelty’ is relatively small, zCS
gradually becomes negative. The output of the Attention block inFigure 1 is proportional to XCS � zCS (�CS � BCS) when zCS � 0,
2 SCHMAJUK AND LARRAURI

and 0 otherwise. Because it is controlled by Novelty’, attention zCS
always lags behind Novelty’.Notice that because the output of the feedback system is pro-
portional to �CS � BCS, even when CS is absent but predicted byother CSs through BCS, zCS becomes modified by the value ofNovelty’. This feature of the model is important for the recoveryparadigms presented in this article.
3. Associations. The model assumes that animals build an in-ternal model of their environment (Sokolov, 1960). In the network,environmental regularities are stored in the associative system as(a) associations of each XCS with its corresponding CS, VCS1-CS1,(b) associations between XCS with other CSs, VCS1-CS2, (c) asso-ciations of XCS with CX, VCS1-CX, (d) associations of XCX of theCX with the CS, VCX-CS1, and (e) associations of XCS with the US,VCS-US. Outputs of the Associations block in Figure 1 are theaggregate predictions of the CSs (BCS), the CX (BCX), and the US(BUS) by all CSs and CX active at a given time. The prediction ofthe US, BUS, controls the output of the Associations block, theconditioned response, or CR.
Also, because the �CS � BCS output is active when the absentCS is predicted by other CSs or the CX, associations VCS1-CS2,VCS1-CX, and VCS1-US can change even in its absence.
Storage: As in the Rescorla and Wagner (1972) model, changesin associations are proportional to the difference between predictedand real values of the CS or US (CS � BCS) or (US � BUS).However, in our model, BCS and BUS do not assume negativevalues, and therefore, conditioned inhibitors are not extinguishedby CS presentations. Because the rate of change of every associ-ation is directly proportional to XCS, XCS controls the storage(formation or read-in) of the associations.
Retrieval: Because the magnitude of the aggregate predictionsBUS and BCS is proportional to XCS, XCS also controls the retrievalof those associations. Because attentional memory zCS controls themagnitude of the internal representation XCS, attention controlsstorage and retrieval of CS–CS and CS–US associations.
Simultaneous control of memory storage and retrieval is a mostimportant feature of the SLG model. This property makes the SLGmodel different from most other models of classical conditioningin which attention controls only the storage of associations. Asimilar assumption was later incorporated into the models pro-posed by McLaren and Mackintosh (2000) and Kruschke (2001).
4. Novelty’. The novelty system computes the total novelty,Novelty’, present in the environment at a given time. The noveltyof a CS or the US is computed as the absolute value of thedifference between the average observed value of the CS or the USand the average aggregate prediction of that CS or US. Totalnovelty, Novelty’, is given by the sum of the novelty of all stimulipresent or predicted at a given time, normalized between 0 and 1.
5. CR strength. As mentioned, the CR is proportional to theprediction of the US, BUS. In purely appetitive or aversive behav-iors, the model assumes that because the subject orients toward thenovel stimulus, this orienting response (OR) decreases the strengthof the CR. However, this assumption might not be completelyaccurate in conditioned emotional response (suppression) para-digms, where appetitive and aversive behaviors are combined. Inthis case, the strength of the unconditioned appetitive respondingis decreased by the CR to the aversive stimulus as well as by theOR to the novel stimulus. Because this analysis exceeds the scopeof the present article, and to make all simulated results compara-ble, no simulation includes inhibition by the OR.
The Challenging Data
In the following sections we apply the SLG model to datashowing that (a) extinction of the overshadowing CS results in therecovery of the response to the overshadowed CS (Matzel et al.,1985), (b) extinction of the blocking CS results in the recovery ofthe response to the blocked CS (Blaisdell at al., 1999), (c) a timedelay interposed between the last phase of BB and testing resultsin the recovery from blocking of the blocked CS (Pineno et al.,
Figure 1. Block diagram of the SLG (Schmajuk, Lam, & Gray, 1996) network. CS � conditioned stimulus;US � unconditioned stimulus; �CS � short-term memory trace of the CS; BCS � prediction of the CS; zCS �attentional memory; XCS � internal representation of the CS; VCS1-CS1, VCS1-CS2, . . .,VCS1-US � associationsCS1–CS1, CS1–CS2, . . ., CS1–US; CR � conditioned response.
3CHALLENGES TO THEORIES OF CLASSICAL CONDITIONING

2005), (d) extinction of the context following LI results in therecovery of the response of the target CS (Grahame et al., 1994),(e) a delay interposed between conditioning and testing results insuper LI (De la Casa & Lubow, 2000, 2002), and (f) LI andovershadowing counteract each other (Blaisdell et al., 1998). Inaddition, we show how the model can explain data that seem tocontradict some of these results. Furthermore, for each case, weshow how the modified SOP model and the extended comparatorhypothesis address the same effects. Because the modifiedRescorla-Wagner model (Van Hamme & Wasserman, 1994) doesnot predict LI, and many of its predictions can equally be derivedfrom the modified SOP model, we do not include it in ourcomparisons.
Method
Computer simulations were run with the SLG model. When the modelwas designed, we did not take into account any specific preparation (e.g.,rabbit’s eye blink conditioning, rat’s conditional emotional response); nordid we consider the experimental values (e.g., duration of the CS, salienceof the CS [defined as the CS capacity to become associated with anotherCS or the US], the duration and strength of the US, context salience,intertrial interval [ITI], trials to criterion) used in the experiments run withthose preparations. The result was a generic model of classicalconditioning.
Preliminary simulations were run with the following parameter values:K1 � .2, K2 � .2, K3 � .4, K4 � .1, K5 � .02, K6 � .005, K7 � .005, K8 �.005, K9 � .75, K10 � 0, and K11 � .15. Parameter K10 was set to 0 (insteadof .3 or .7, as used in previous studies) to eliminate the inhibitory effect ofthe OR on the CR, as indicated above. The rest of the values are similar tothose used in Schmajuk, Buhusi, and Gray (1998), Schmajuk et al. (1996),Buhusi, Gray, and Schmajuk (1998), and Schmajuk, Cox, and Gray (2001).These preliminary simulations studies showed that the model quantitativelydescribed all the challenging results listed above, excluding the interactionbetween overshadowing and LI (Blaisdell et al., 1998) for which only aqualitative approximation was attained. To provide a good quantitativedescription of this latter experiment, we modified the parameters in theequation converting the prediction of the US, BUS, into CR strength:
CR �BUS
n
BUSn � K 11
n ,
where the original n � 2 and K11 � .15 were replaced by n � 6 and K11 �.1. With these modifications, the CR function becomes more sensitive todifferences in BUS.
In this study, we (a) kept the model parameters constant even whenrunning simulations for the different experimental preparations, (b) repro-duced the different types of trials used in the experiment (CXs, CSs, andUS presented and their temporal arrangement), (c) reproduced the order ofthe trial types (e.g., preexposure followed by acquisition trials), and (d)maintained constant (within a given experiment) the ITI, the CS duration,the US duration, and the context salience. As explained below, we at-tempted to reproduce the experimental results by varying (a) the number oftrials of each type, (b) the CS salience, and (c) in some cases, the strengthof the US.
Type of Trial
The type of trial is defined by the CSs and US presented at differentpoints in time. Given an ITI with a certain number of time units (t.u.), CSsare initially presented after 30 t.u. Because time is represented as acontinuum, in the following trials, CSs are separated by the number of t.u.in the ITI.
CS Saliences
We adopted CS saliences based on the experimental data. In agreementwith Pineno et al.’s (2005, Figure 3) and Blaisdell et al.’s (1999, Figure 4)results showing that a clicker overshadows a tone and white noise coun-terbalanced, we assumed that the salience of the clicker (arbitrarily set to1) is greater than that of the tone or white noise (set to .6). On the basis ofMatzel et al.’s (1985) data showing that a 96-dB tone overshadows a1.12-W flashing light, we assumed that the salience of the tone (set to .6)is greater than that of a 1.12-W flashing light (set to .5). On the basis ofHolland’s (1999) results, in which a 78-dB tone overshadows a 6-W light,we assumed that the salience of the 6-W light is .5. In the cases of 100–120W flashing lights (Blaisdell et al., 1999; Pineno et al., 2005), we assumeda salience of .6 greater than the .5 salience used for the 1.12-W flashinglight and the 6-W light. On the basis of Blaisdell et al.’s (1998, Figure 5)results showing that a 100-W flashing light presented as the houselightswere turned off overshadows an 82-dB tone and an 82-dB white noisecounterbalanced, we assumed that their saliences are .75 and .6, respec-tively. In sum, we assumed the following saliences: clicker, 1; 100-W lightwith houselight off, .75; tone or white noise, .6; 100–120 W light, .6;1.12–6 W light, .5.
US Strength
Because in the model, the US does not predict any CS, its salience isindependent of those of the CSs. In most cases, the US is set to 1, exceptwhen the experimental methods indicate that it is relatively weak (e.g.,.7-mA shock US in Blaisdell et al. [1998] vs. 1 mA or more in the otherexperiments from the same lab; De la Casa & Lubow [2000], .1 M vs. .5M LiCl injection).
Generalization Between Contexts
In some cases in which two or more contexts were used in the experi-mental design (Pineno et al., 2005; Wheeler, Stout, & Miller, 2004), weassumed some generalization between contexts to explain the results. Thehome cage is represented by a combination of contextual elements found inthe training cage, referred to as CX1, with additional contextual stimulifound only in the home cage, referred to as CX2. We assumed that (a)when in the home cage, the salience of CX1 is .05 and the salience of CX2is .05, and (b) when in the training cage, the salience of CX1 is .1 and thesalience of CX2 is 0. We verified that similar results are obtained wheneach cage is represented by a combination of contextual stimuli specific tothat cage (CX1 or CX2) with contextual stimuli common to both (CX0).We confirmed this assumption for different combinations of contextualstimuli (e.g., CX1 � .06, CX2 � .06, and CX0 � .05; and CX1 � .06,CX2 � .06, and CX0 � .04).
In other cases in which two or more contexts were also used in theexperimental design (De la Casa & Lubow, 2000, 2002; Grahame et al.,1994), generalization between contexts is not necessary to explain theresults. However, for those experiments, we confirmed that comparableresults are obtained regardless of whether any generalization betweencontexts is assumed.
Simulation Results
The SLG model defines the value of the CR in real time. For thesimulations shown in the present article, we graph the strength of the CRat one t.u. before the time when US would be delivered on a reinforcedtrial. In addition to providing the value of the CR, the model permits theevaluation of its internal variables, such as attentional and associativevalues, which underlie the reported CR. We use these internal variables toexplain the simulation results.
4 SCHMAJUK AND LARRAURI

Amount of Liquid Consumed
In some cases, experimental data were expressed as the amount of liquidconsumed in a given time in the presence of an aversively conditionedflavor CS (conditioned taste aversion). To compare simulated and exper-imental CR values, simulated values were converted into amount of liquidconsumed by assuming that amount of liquid is proportional to the netdrive to lick. This net drive increases with the level of thirst, assumed forsimplicity to be 1, and decreases with fear, regarded as the prediction of theaversive US and represented by the CR. Therefore,
Drinking Rate �mL/s� � Thirst � Fear � 1 � CR. (1)
That is, the amount of liquid consumed by the animal in a given time, givenby Time � Drinking rate, decreases as the magnitude of the CR increases.
Time to Complete a Number of Licks
In some cases, experimental data are expressed as (the logarithm of) thetime required to complete a certain number of licks in the presence of a CSthat has been conditioned to an aversive US (conditioned emotional re-sponse). To compare simulated and experimental CR values, simulated CRvalues can be converted into time by assuming that the time to complete agiven number of licks (or to consume a given volume of liquid) is inverselyproportional to the net drive to lick. Therefore,
Time Licking �s�
� Volume of Liquid �mL/�Thirst � Fear� �mL/s. (2)
Assuming that the volume of liquid is 1 mL and the thirst is 1 mL/s (as inEquation 1), the correlation between log (time) and the value of the CRapproaches 1 when CR varies between 0 and 1. To avoid the introductionof additional parameters in the simulations, we compared the simulated CRwith data values expressed in the logarithmic form.
Comparing Experimental and Simulated Results
To compare simulated and experimental values, we transformed thevalues generated by the model into experimental values using a scalingfactor (S average experimental values/average simulated values). Be-cause the empirical data show variations in animal responsiveness evenunder similar experimental conditions, factor S changes from experiment toexperiment.
To estimate how well the simulated results describe the experimentaldata, we used 95% confidence intervals. Confidence intervals are boundedby X � t��/ 2,N�1�SX, where X is the mean of the group, SX is the standarderror of the mean, N is the number of animals in each group, and � � .05(McCall, 1970). When the experimental groups yielded significantly dif-ferent results, we verified that (a) the relationship between simulatedgroups was identical to that of the experimental groups (e.g., less responsein the blocked than in the control group) and (b) the difference betweensimulated means of the groups was greater than t��/ 2,N�1�SX. Notice that thiscriterion would include those cases in which the model showed strongereffects than the experiments. On the other hand, when the experimentalgroups showed nonsignificant differences, we verified that the differencebetween simulated means was smaller than t��/ 2,N�1�SX. In addition, becausethe model parameters and certain simulation values (e.g., ITI, CS, and USduration; US strength; CX salience) remained mostly constant, we deter-mined the range of number of trials of the different phases of eachexperiment for which all the simulated data met those criteria. The size ofthese ranges is a measure of the robustness of the simulated results.
In addition to confidence intervals, we used analyses of variance(ANOVAs) to estimate the goodness of fit of the simulated results. Becausethe model is deterministic and only provides CR values without variability,we combined the model results, interpreted as group means, with the
standard errors of the experimental data to compute F values. We consid-ered the simulated results to be correct when they yielded statisticallysignificant F values for the same effects found significant in the experi-mental data.
Results
Recovery From Overshadowing
Overshadowing refers to the decreased CR that follows simul-taneous conditioning to more than one CS (Pavlov, 1927).Whereas Kaufman and Bolles (1981) and Matzel et al. (1985)found that extinction of the overshadowing CS results in therecovery of the response to the overshadowed CS, Holland (1999)failed to obtain this effect. In this section, we address Matzel etal.’s data, and in the following section, we offer simulations for theHolland (1999) experiment that explain the different results.
Experimental data. In the first phase of Matzel et al.’s (1985)Experiment 2, rats in the OVER group received 8 presentations ofa 1.12-W flashing light and a 96-dB tone together with a foot-shock. Rats in the OVER-CONTROL (acquisition) group received8 presentations of the flashing light together with the footshockinterspersed with 8 nonreinforced presentations of the tone. Rats inthe EXTINCTION group received the same treatment as did therats in the OVER group. After this initial training, the EXTINC-TION group received 72 nonreinforced presentations of the tone,whereas the OVER and OVER-CONTROL groups stayed in theconditioning chambers for an equivalent length of time. All threegroups received one test trial to the flashing light.
The small squares (or “markers”) in Figure 2 show the Matzel etal. (1985) experimental results expressed as the mean latency tocomplete 25 licks in the presence of the CS during the test trial.Because the US is an aversive shock, a stronger CR is reflected ina longer latency. The OVER group shows overshadowing becauseits response is smaller than that of the OVER-CONTROL group,but this effect decreases in the EXTINCTION group.
Simulated results. In the OVER case, CS1 (representing the1.12-W flashing light, salience � .5) and CS2 (representing the96-dB tone, salience � .6) were presented with the US for 70
Figure 2. Recovery from overshadowing. Square markers: Data fromMatzel et al. (1985, Figure 2) showing mean latencies to complete the first5 cumulative seconds (sec) of drinking in the test context. Error bars: 95%confidence intervals. Columns: Simulated results showing the strength ofthe conditioned response to CS1 during 1 test trial, following 70 CS1-CS2-US trials and 40 CS2 trials. Simulations parameters were as follows:conditioned stimuli (CSs), 30–40 time units; CS1, salience � .5; CS2,salience � .6; unconditioned stimulus (US), 35–40 time units, strength �1; context, salience � .1; intertrial interval � 600 time units.
5CHALLENGES TO THEORIES OF CLASSICAL CONDITIONING

trials, followed by 40 nonreinforced presentations in the CX. In theOVER-CONTROL case, reinforced presentations of CS1 precedednonreinforced presentations of CS2 for 70 trials, followed by 40nonreinforced presentations of the CX. In the EXTINCTION case,CS1 and CS2 were presented with the US for 70 trials, followed by40 nonreinforced presentations of CS2. Finally, responding to CS1(the 1.12-W flashing light) was tested for 1 trial.
The columns in Figure 2 show the simulated results. As in theexperimental case, the extinction of the overshadowing CS resultsin the elimination of overshadowing. Simulated results fall withinthe 95% confidence intervals of the data (error bars). Similarresults are obtained when the number of trials is kept constant forone phase (Phase 1, 70 trials; Phase 2, 40 trials) and the number oftrials in the other phase is varied within the following ranges:Phase 1, 53–72 trials; Phase 2, 23–210 trials.
In addition, when the CR values yielded by the simulations werecombined with the standard errors of the data, overshadowing wasdemonstrated by a significant difference between the CR to CS1 inthe OVER and OVER-CONTROL groups, t(8) � 9.39, p � .01.Recovery from overshadowing was confirmed by a significantdifference between the CR in the OVER and EXTINCTIONgroups, t(10) � 5.6, p � .01. According to the model, this recoveryis complete: We found no significant difference in the CR to CS1in the OVER-CONTROL and EXTINCTION groups, t(8) � 1.90,p � .09.
The model explains the results as follows. During the first phaseof training in the OVER and EXTINCTION groups (Trials 1–70,CS1-CS2-US presentations), Novelty’ and attention to CS1 andCS2 first increase and then decrease. During these trials, associa-tions CS1–US and CS2–US and the CR increase. During thesecond phase of the experiment (Trials 71–110, presentation of theCX in the OVER group and the CX and CS2 in the EXTINCTIONgroup), Novelty’ decreases rapidly in the OVER group. In theEXTINCTION group, because CS1 and the US are predicted byCS2 and the context but now are absent, Novelty’ and attention tothe present CS (CS2) first increase and then decrease. Attention tothe absent CS (CS1) increases until the CS2–CS1 associations areextinguished and then remains constant. The CS2–US associationand CR strength strongly decrease. The CS1–US association ex-tinguishes slightly. Because attention to CS1 (zCS1) is much largerin the EXTINCTION case than in the OVER case, the CR in theEXTINCTION group is larger than in the OVER group and similarto that of the OVER-CONTROL group. Therefore, overshadowingof CS1 decreases.
Comparison with other models. According to the comparatorhypothesis (Denniston et al., 2001; Miller & Matzel, 1988; Miller& Schachtman, 1985), overshadowing of CS1 is the consequenceof strong CS1–CS2 and CS2–US associations, which increase theindirect representation of the US, thereby attenuating respondingto CS1. Extinction of CS2 following training results in decreasedCS2–US associations and the attenuation of overshadowing be-cause of the reduced indirect representation of the US.
According to the Dickinson and Burke (1996) version of Wag-ner’s (1981) SOP model, overshadowing is explained in the fol-lowing terms. The A2 representation of the US is increased by bothCSs. This increment in A2 decreases the A1 representation of theUS, thereby limiting the growth of the association of the US withCS1 and CS2. Extinction of CS2 activates the A2 representationsof both CS1 and the US. Because Dickinson and Burke assume
that associations between two stimuli in the A2 state increase, theCS1–US association will increase and CS1 will recover fromovershadowing.
Recovery From Blocking
Blocking (forward blocking) refers to the decreased CR to a CS,when this blocked CS is conditioned to a US in the presence of ablocking CS that was previously conditioned to the same US(Kamin, 1968, 1969). Blaisdell et al. (1999) found that extinctionof the blocking CS results in the recovery of the response to theblocked CS. However, Miller, Schachtman, and Matzel (1988) andHolland (1999) reported a failure to obtain recovery fromblocking.
In this section we offer simulations for the Blaisdell et al. (1999)and Holland (1999) experiments and address the apparent contra-diction between their respective data.
Experimental data 1. Blaisdell et al. (1999) reported that ex-tinction of the blocking CS results in the recovery of the responseto the blocked CS. In their Experiment 3, rats in the BLOCKINGgroups received 12 reinforced presentations of a 82-dB tone (or a82-dB white noise) followed by 4 reinforced presentations of thesame CS (the tone or the white noise) and a 84-dB click train(target CS). Rats in the OVERSHADOWING groups received 12reinforced presentations of the tone or the white noise, followed by4 reinforced presentations of a different CS (the white noise whenthe first reinforced CS was a tone and a tone when the first CS wasthe white noise) and a click train or the buzzer. The BLOCKING-EXTINCTION and OVERSHADOWING-EXTINCTION groupsreceived the treatments indicated above followed by 800 nonrein-forced presentations of the white noise or the tone in a differentcontext. The BLOCKING-CONTROL and OVERSHADOWING-CONTROL groups received the treatments indicated above fol-lowed by equivalent exposure to a different context. One test trialwith the target CS was carried out in the extinction context.
The small square markers in Figure 3 show the Blaisdell et al.(1999) experimental results expressed as the mean latency tocomplete 5 cumulative seconds of licking in the presence of theclick train (target CS) during the test trial. As before, because theUS is an aversive shock, a stronger CR is reflected in a longerlatency. The BLOCKING-CONTROL group shows blocking be-cause its CR is smaller than that of the OVERSHADOWING-CONTROL group. Instead, blocking is absent in the EXTINC-TION groups.
Simulated results 1. In the BLOCKING case, CS1 (represent-ing the tone/white noise, salience � .6) was presented with the USfor 5 trials, and CS1 and CS2 (target CS, representing the clicker,salience � 1) were presented with the US for another 20 trials. Inthe OVERSHADOWING case, the US was presented (with a CS3representing the tone/white noise, salience � .6) for 5 trials, andCS1 and CS2 were presented with the US for another 20 trials. Inaddition, both EXTINCTION groups received 200 nonreinforcedtrials with CS1 in a different context (CX2). The CONTROLgroups received 200 nonreinforced trials in CX2. In every case, wetested responding to CS2 (the clicker) in CX2.
The columns in Figure 3 show the simulated results. As in theexperimental case, the extinction of the blocking CS results indecreased blocking. Simulated results fall within the 95% confi-dence intervals (error bars). Similar results were obtained when (a)
6 SCHMAJUK AND LARRAURI

the same context was used in all phases of the simulation and (b)the number of trials was kept constant for two phases (Phase 1, 5trials; Phase 2, 20 trials; Phase 3, 200 trials) and one of the otherphases was varied within the following ranges: Phase 1, 4–129trials; Phase 2, 19–28 trials; Phase 3, 10–over 600 trials.
In addition, when the CR values yielded by the simulations werecombined with the standard errors of the data, a two-way ANOVAconducted on the CR to CS2 revealed a main effect of treatment,F(1, 42) � 6.42, p � .015, which demonstrates blocking; a maineffect of extinction, F(1, 42) � 16.38, p � .01; and an interactionbetween these factors, F(1, 42) � 4.97, p � .031, which demon-strates recovery from blocking. Planned comparisons between CRsshow blocking in control groups (BLOCKING CONTROL andOVERSHADOWING CONTROL groups show different respond-ing, F[1, 42] � 11.35, p � .01), and recovery in the blockinggroups (BLOCKING CONTROL and BLOCKING EXTINC-TION groups show different responding, F[1, 42]� 19.7, p � .01).These statistical results are similar to those obtained for the ex-perimental data.
Recovery from blocking is explained as follows. Through thefirst phase of training in both BLOCKING groups (Trials 1–5;CS1–US presentations), Novelty’ and attention to CS1 first in-crease and then decrease. During these trials, the CS1–US associ-ation and the CR increase. In the second phase of the experiment(Trials 6–25; CS1-CS2-US presentations), Novelty’ briefly in-creases and then decreases, while the same happens with attentionto CS1 and CS2. During the third part of the experiment (Trials26–225), in the BLOCKING-CONTROL group (CX2 alone),Novelty’ rapidly decreases in the new context, and attention toCS1 and CS2 does not change. In the BLOCKING-EXTINCTIONgroup (CS1 with no US), Novelty’ increases because CS2, thetraining context, and the US are predicted by CS1 but are absent.Attention to CS1 and CS2 also increase. Finally, during the testtrial (CS2), because of its increased zCS2, CS2 yields a large CR.Because attention to CS2 (zCS2) is much larger in the BLOCKING-
EXTINCTION group than in the BLOCKING-CONTROL group,the CR in the first group is larger than in the latter group andsimilar to that of the OVERSHADOWING groups. Therefore,blocking is not manifested. In short, according to the SLG model,recovery from blocking in the Blaisdell et al. (1999) experimentcan be explained in terms of the increased attention to the blockedCS when the blocking CS is extinguished. This increased attentionyields a larger CR and the recovery from blocking.
The absence of recovery in the OVERSHADOWING-EXTINCTION group is explained by the small increase of atten-tion to CS2 during the extinction phase. In this case, the overshad-owing stimulus (CS1) predicts the occurrence of both the target CS(CS2) and the US, but because the CS1–US association is muchweaker than in the blocking case, the increases in Novelty’ andattention to the target CS are smaller. Therefore, responding toCS2 after extinction of CS1 in the overshadowing case is notsignificantly increased.
Experimental data 2. In contrast to Blaisdell et al.’s (1999)and Matzel et al.’s (1985) results, Holland (1999) reported thatextinction of the blocking or the overshadowing CS does not resultin the recovery of the response to the blocked or overshadowedCS. In his Experiment 6, rats in the BLOCKING groups received64 reinforced presentations of A (a 78-dB noise or a 6-W light)followed by 32 food-reinforced presentations of A and X (the lightor the noise). Rats in the OVERSHADOWING groups received 64presentations of the US alone in the context, followed by 32reinforced presentations of A and X. Rats in the ACQUISITIONgroups received 64 reinforced presentations in the context, fol-lowed by 32 reinforced presentations of X. Following each treat-ment, the EXTINCTION groups received 512 nonreinforced pre-sentations of A, whereas the CONTROL groups receivedequivalent exposure to the same context. Testing consisted of 4averaged presentations of X (the 6-W light or the noise).
The markers in Figure 4 show the Holland (1999) experimentalresults expressed as food cup behavior during the CS X (houselightand noise counterbalanced) presentations. Because the US is an
Figure 4. Absence of recovery from blocking and overshadowing.Square markers: Data from Holland (1999, Figure 6) showing averagefood-cup behavior during the presentation of the houselight or noise. Errorbars: 95% confidence intervals. Columns: Simulated results showing thestrength of the conditioned response to CS2 during 1 test trial, following 5CS1-US trials, 20 CS1-CS2-US trials, and 200 CS1 trials. Simulationsparameters were as follows: conditioned stimuli (CSs), 30–40 time units;CS1 and CS2, saliences � .6 and .5 counterbalanced; unconditionedstimulus (US), 35–40 time units, strength � 1; context, salience � .1;intertrial interval � 400 time units.
Figure 3. Recovery from blocking. Square markers: Data from Blaisdellet al. (1999, Figure 4) showing mean latencies to complete the first 5cumulative seconds (sec) of drinking in the presence of the blocked orovershadowed stimulus. Error bars: 95% confidence intervals. Columns:Simulated results showing the strength of the conditioned response to CS2during 1 test trial, following 5 CS1-US trials or CS3-US trials, 20 CS1-CS2-US trials, and 200 CS1 trials. Simulations parameters were as follows:conditioned stimuli (CSs), 30–40 time units; CS1, salience � .6; CS2,salience � 1; unconditioned stimulus (US), 35–40 time units, strength �1; context, salience �.1; intertrial interval � 600 time units.
7CHALLENGES TO THEORIES OF CLASSICAL CONDITIONING

appetitive US, a stronger CR is reflected in stronger responding.There are no differences between CONTROL and EXTINCTIONgroups for the BLOCKING and OVERSHADOWING cases.
Simulated results 2. Blaisdell et al.’s (1999) Experiment 3 andHolland’s (1999) Experiment 6 differ in many regards, includingthe preparation (conditioned emotional response and appetitive,respectively), the type of responses (water licking vs. head jerkingto the tone CS and rearing to the light CS), the type of US(footshock vs. food), the type and intensity of the CS (82-dB toneand 84-dB clicker vs. 78-dB white noise and 6-W light), theintensity of the background noise (76 dB vs. 70 dB), ITI duration(12 min vs. 8 min), the number of trials in each phase of theexperiment (12, 4, and 800 vs. 64, 32, and 512), and the number oftest trials (1 vs. 4). An additional difference is that, whereasBlaisdell et al. used a different context for the extinction andtesting phases, Holland used the same context in all phases. Wesimulated Holland’s (1999) Experiment 6 with the same number oftrials used to simulate the Blaisdell et al. (1999) Experiment 3 butwith (a) salience of .6 for the tone and .5 for the 6-W light, (b) a400-t.u. ITI, and (c) only one context. In the BLOCKING case,CS1 (representing either the 78-dB tone, salience � .6, or the 6-Wlight, salience � .5) was presented with the US for 5 trials, andCS1 and CS2 (light or tone) were presented with the US foranother 20 trials. In the OVERSHADOWING case, the US waspresented for 5 trials, and CS1 and CS2 were presented with theUS for another 20 trials. Both EXTINCTION groups received 200nonreinforced trials with CS1 in the same context. In every case,we tested responding to CS2 on 1 trial.
The columns in Figure 4 show the simulated results. Extinctionof CS1 has no effect on the difference between the blocked andovershadowed groups. Simulated results fall within the 95% con-fidence intervals of the data (error bars). Similar results are ob-tained when the number of trials is kept constant for two phases(Phase 1, 5 trials; Phase 2, 20 trials; Phase 3, 200 trials) and oneof the other phases is varied within the following ranges: Phase 1,4–over 600 trials; Phase 2, 6–over 48 trials; Phase 3, 1–over 600trials.
In addition, when the CR values yielded by the simulations arecombined with the standard errors of the data, a two-way ANOVAconducted on the CR to CS2 revealed a main effect of treatment,F(1, 28) � 18.22, p � .01, which demonstrates blocking; no maineffect of extinction, F(1, 28) � 0.17, p � .68; and no interactionbetween these factors, F(1, 28) � 0.023, p � .88, which demon-strates no recovery from blocking. These statistical results aresimilar to those obtained for the experimental data.
According to the SLG model, the lack of recovery from block-ing and overshadowing in the Holland (1999) experiment and itspresence in the Blaisdell et al. (1999) experiment is explained asfollows. In Blaisdell et al.’s experiment, during the CS1-CS2-USphase, attention to the target CS (CS2, clicker, salience � 1)initially increases but decreases rapidly with continued training.Recovery from blocking occurs because, during the extinctionperiod, the blocking stimulus (CS1, tone and white noise counter-balanced, salience � .6) predicts the occurrence of CS2 (6-W light,salience � .5) and the US, which are not present. These uncon-firmed predictions increase Novelty’ and, subsequently, attentionto CS2 (predicted by CS1), leading to an enhanced response toCS2 after extinction of CS1. In contrast, recovery from blocking isnot obtained in Holland’s experiment because, during the CS1-
CS2-US phase, attention to CS2 increases but does not decreasesignificantly (as the CS2 is less salient than that in the Blaisdell etal. experiment). Therefore, during extinction of CS1, attention toCS2 is already high, and hence, the unconfirmed prediction of theCS2 and US does not further increase zCS2. As a result, duringtesting, responding to CS2 is almost identical in both blockinggroups.
The conclusions of the preceding analysis were confirmed byrunning several simulations with the parameters used to simulatethe Blaisdell et al. (1999) experiment, modifying only one factor ata time (duration of the ITI, CS saliences, and similar or differentcontexts for extinction and testing phases) to resemble Holland’s(1999) design. The CS saliences were shown to be the criticalfactor. When the same approach was used for Matzel et al.’s(1985) recovery from overshadowing Experiment 2, the durationof the ITI (400-t.u. ITI vs. 600-t.u. ITI) appeared to be the crucialdifference.
Comparison with other models. Blaisdell et al. (1999) sug-gested that their results show that blocking might not be a failureto acquire a CS–US association. According to the comparatorhypothesis, blocking of CS2 is the consequence of a strongCS1–US association, acquired during both phases of the experi-ment, which makes the indirect representation of the US (CS2–CS1 and CS1–US) stronger than the direct one (CS2–US), there-fore attenuating responding to CS2. Extinction of CS1 followingtraining results in decreased CS1–US associations and the attenu-ation of blocking because of the reduced indirect representation ofthe US.
According to the Dickinson and Burke (1996) version of Wag-ner’s (1981) SOP model, blocking is explained in the followingterms. The A2 representation of the US is increased by the block-ing CS. This increment in A2 decreases the A1 representation ofthe US, thereby limiting the growth of the association of the USwith the blocked CSs. Extinction of the blocking CS activates theA2 representations of both CS2 and the US, thereby increasing theCS2-US association, and CS2 will recover from blocking.
It is interesting that, in contrast to the preceding views, in theSLG model, two concurrent mechanisms are at work during block-ing: competition to gain association with the US and decreasedattention as Novelty’ decreases. Some neurophysiological andbehavioral experimental evidence seems to support these assump-tions. For instance, Mackintosh and Turner’s (1971) and Holland’s(1985) experiments with rats suggest that attention to CS2 isreduced during blocking. Similarly, Kruschke and Blair (2000)showed that, in human associative learning, blocking involvesdecreased attention. Furthermore, Baxter, Gallagher, and Holland(1999) reported that blocking is present in normal rats and in ratswith lesions of the cholinergic input to the hippocampus. Lesionedrats, however, showed faster learning than did normal rats whenthe blocked CS was used in further conditioning. They concludedthat the reduced attention to the blocked CS present in normal, butnot lesioned, rats was not the only mechanism mediating blocking.
Recovery From Backward Blocking
Whereas in blocking, CS1-US training precedes CS1-CS2-UStraining, in BB, CS1-CS2-US trials precede CS1-US trials. Firstreported in causal judgments in humans (Shanks, 1985), Miller andMatute (1996) demonstrated that, under special conditions, BB
8 SCHMAJUK AND LARRAURI

could also be obtained in animals. Recently, Pineno et al. (2005)demonstrated spontaneous recovery from BB following a retentioninterval.
Experimental data. Miller and Matute (1996) hypothesizedthat failures to obtain BB in animals were due to the fact that “cuesthat are of high biological significance are resistant to reductions intheir biological significance and consequently relatively immuneto cue competition” (p. 372). Therefore, their Experiment 2 in-cluded sensory preconditioning in the two first phases of theexperiment. The BB group received four presentations of AXfollowed by B, four presentations of A followed by B, and fourpresentations of B followed by a footshock US. One control groupreceived four presentations of A followed by C during Phase 2.Another control group remained in the training cage during Phase2. In the experiment, A was a buzzer, X was a click train, and Band C were a counterbalanced tone and white noise, respectively.
With a similar design, but with a different number of trials inPhase 2, Pineno et al. (2005) demonstrated spontaneous recoveryfrom BB following a retention interval. In this case, the BB groupreceived 4 presentations of AX followed by O, 20 presentations ofA followed by O, and 4 presentations of O followed by a footshockUS (O becomes a surrogate US). The control group received 20presentations of B followed by O, either before or after receiving4 presentations of AX followed by O, and 4 presentations of Ofollowed by a footshock US afterward. Testing to A and X waspreceded by no delay or a 15-day delay. In this experiment, A andB were a complex tone and white noise counterbalanced, X was aclick train, O was a flashing light, and the US was a footshock.Subjects in the delay condition were handled three times per weekfor 30 s and were maintained on the water deprivation schedule.The results show response recovery to the blocked stimulus afterthe delay period.
The markers in Figure 5 show that in the Pineno et al. (2005)study, the presentation of A followed by O after the presentation ofAX followed by O (BB group) decreased responding to X com-pared with the case when B was followed by O (control group) in
the no-delay case. In the delay case, however, responding to X wassimilar in the BB and control groups.
Simulated results. Computer simulations show that the SLGmodel can reproduce the Miller and Matute (1996) Experiment 2results. According to the model, responding in the BB group wasweaker, CR(X) � .0002, than in both control groups, CR(X) �.0008.
Figure 5 shows simulated results for the Pineno et al. (2005)experiment. The columns represent responding to X on a test trialfollowing 100 A-X-O trials in Context 1, 20 A-O trials or B-Otrials in Context 1, 150 O-US trials in Context 1, and 20 delaytrials in Context 2, which generalizes to Context 1 (see the Methodsection). The salience of Stimulus A (representing the 80-dB toneor the 80-dB white noise) was .6, the salience of Stimulus X(representing the 80-dB clicker) was 1, and the salience of O (a150-W flashing light) was .6. When presented on the same trial, A,X, B, O, and the US temporally overlap.
As shown in Figure 5, simulated results fall within the 95%confidence intervals of the data (error bars). Pineno et al. (2005)also established that the A–O association did not decrease duringdelay, a result also shown by our model. Similar results areobtained when the number of trials is kept constant for threephases (Phase 1, 100 trials; Phase 2, 20 trials; Phase 3, 150 trials;Phase 4, 20 trials) and one of the other phases is varied within thefollowing ranges: Phase 1, 65–117 trials; Phase 2, 18–32 trials;Phase 3, 116–over 600 trials; Phase 4, 2–over 600 trials.
In addition, when the CR values yielded by the simulations arecombined with the standard errors of the data, a two-way ANOVAconducted on the CR to X revealed a main effect of treatment, F(1,44) � 8.1, p � .01, which demonstrates BB; a main effect of delay,F(1, 44) � 9.6, p � .01; and an interaction between these factors,F(1, 44) � 5.93, p � .019, which demonstrates recovery from BBafter the delay. These statistical results are similar to those ob-tained for the experimental data.
Acquisition of backward blocking. BB is explained in thefollowing terms. During the A-X-O presentations on Phase 1(Trials 1–100), both the control and the BB groups build VA,A,VA,O, VA,X,VX,X,VX,O, VX,A, VO,O, VO,A, and VO,X associations.On Phase 2 (Trials 101–120), the BB group experiences A-O trials,and Novelty’ increases because both A and O predict X (throughVA,X and VO,X associations) and X is absent. In contrast, on Phase2, the control group experiences B-O trials, and Novelty’ increasesmore than in the BB group because B is not predicted and Opredicts A and X (through VO,A and VO,X associations) and A andX are absent. In both groups, X is predicted by O through VO,X
associations, and because Novelty’ is greater in the control than inthe BB group, attention to X, zX increases more in the controlgroup than in the BB group. On Phase 3 (Trials 121–270), bothgroups receive O-US trials and build the O–US association, VO,US.According to the model, the CR to X is proportional to (a) theattention to X, zX, (b) the X–O association, VX,O, and (c) the VO,US
association (CR zX VX,O zO VO,US). Because zX is greater in thecontrol group than in the BB group, zX(control) � zX(BB), BB ispresent, CR(control) � CR(BB).
Just as with BB, the model is also able to show forward blockingusing preconditioning of A and X with CS O. As mentioned in theprevious section, according to the SLG model, in forward block-ing, two mechanisms are at play: The blocked CS (a) gains asmaller association with the outcome O than the control (over-
Figure 5. Backward blocking. Square markers: Data from Pineno et al.(2005, Figure 3) showing mean latencies to complete the first 5 cumulativeseconds (sec) of drinking in the presence of the backward blocked stimulus.Error bars: 95% confidence intervals. Columns: Simulated results showingthe strength of the conditioned response to X during 1 test trial, following100 X-A-O trials, 20 A-O trials, 150 O-US trials, and 20 delay trials.Simulation parameters were as follows: X, 30–40 time units, salience � 1;A and B, saliences � .6; O, salience � .6; unconditioned stimulus (US),35–40 time units, strength � 1; context, saliences � .1, .05, and .05;intertrial interval � 600 time units.
9CHALLENGES TO THEORIES OF CLASSICAL CONDITIONING

shadowed) CS, and (b) accrues less attention than does the controlCS. In contrast, in BB, (a) although blocked and control (over-shadowed) CSs gain the same association with the outcome O, (b)the blocked CS accrues less attention than does the control (over-shadowed) CS. In both cases, however, responding to the blockedCS is weaker than responding to the control (overshadowed) CS.
Recovery from backward blocking. Recovery from BB is ex-plained as follows. On Phase 3 (Trials 121–270), both groupsreceive O-US trials. We first analyze what happens at the begin-ning of this phase. In the BB group, Novelty’ increases because Opredicts A and X (through VO,A and VO,X associations), and theyare absent. In contrast, in the control group, Novelty’ increasesmore than in the BB group because O predicts A, X, and B(through VO,A, VO,X, and VO,B associations), but they are absent.So, at the beginning of this phase, there is more Novelty’ in thecontrol group than in the BB group. Because Novelty’ is initiallylarger, O-US learning in the control group is faster than in the BBgroup, and Novelty’ decreases faster too. So, by the end of Phase3, attention to the Context 1 (zCX1), is smaller in the control thanin the BB group.
During the delay period, in the home cage context CX2 weassumed some generalization to CX1. In this situation, CX1 pre-dicts all the stimuli proportionally to zCX1, which as explainedabove, is smaller in the control than in the BB group. Then,because the predictions of all stimuli in the control group aresmaller than the predictions in the BB group, in the absence of allthose stimuli, Novelty’ is smaller in the control group than in theBB group. Therefore, because CX1 predicts O through VCX1,O
associations, the prediction of O, BO, becomes associated withNovelty’, and attention zO will also be smaller in the control groupthan in the BB group, zO(BB) � zO(control). Remember that, asexplained above, CR zX VX,O zO VO,US. Because zX is greater inthe control group than in the BB group, zX(control) � zX(BB),backward blocking is present before the delay, CR(control) �CR(BB). After the delay, however, the larger zO in the BB groupthan in the control group, zO(BB) � zO(control), results in theelimination of BB, CR(control) CR(BB).
A proposed modification of the model. As mentioned above, inour simulations we assumed that A, X, and O temporally over-lapped, whereas in the Pineno et al. (2005) experiment, stimulus Ofollowed A and X. Although our model suggests that O–X asso-ciations are most important to obtain BB, the present version of themodel does not have a mechanism to explain the acquisition ofsuch an association when X precedes O. However, evidence pub-lished by Ward-Robinson and Hall (1996), demonstrated backwardsensory preconditioning, a paradigm in which presentation of Apreceding X, followed by A-US presentations, results in X beingable to produce a CR. Therefore, we propose to modify the modelto describe backward sensory preconditioning in terms of a back-ward O–X association. We would replace the actual value of thepredicted X, originally used as the “teaching signal” used to buildO–X associations, by its trace, �X. This change would allow themodel to build O–X associations even when X precedes O, be-cause their traces overlap. Computer simulations run under thisassumption successfully yield BB.
Novel prediction. In addition to describing the existing data,the SLG model predicts that extinction of A in a different contextwill result in recovery from BB. Computer simulations showedincreased responding to X following 100 A-X-O trials in Context
1, 20 A-O trials or B-O trials in Context 1, 150 O-US trials inContext 2, and 20 A trials in Context 2. Although no generalizationbetween contexts was assumed in this case, similar results areobtained when this assumption is made.
Comparison with other models. According to the comparatorhypothesis, BB, like forward blocking, is the consequence of astrong A–O association, acquired during both phases of the exper-iment, which makes the indirect representation of the O (throughX–A and A–O links) stronger than the direct one (X–O link),therefore attenuating responding to X. Whereas most traditionalmodels (e.g., Mackintosh, 1975; Pearce & Hall, 1980; Rescorla &Wagner, 1972; Wagner, 1981) can explain forward blocking, theydo not address BB. According to the Dickinson and Burke (1996)version of Wagner’s (1981) SOP model, BB is explained in thefollowing terms. During the second phase of the experiment, thepresence of A, which has a within-compound association with X,will lead to a decrement in the X–O association in the experimentalgroup. Because A is absent during this second phase for the controlgroup, the X–O association will not change. Even though it canexplain the occurrence of BB, the Dickinson and Burke (1996)model cannot explain spontaneous recovery from BB. Pineno et al.(2005) suggested that spontaneous recovery from BB can beexplained in terms of the comparator hypothesis if it is assumedthat the A–X association weakens over the delay periods and theyprovided experimental evidence supporting this assumption. Adecreased A–X association results in a decreased indirect repre-sentation of O (through X–A and A–O associations), thereforerecovering responding to X. Significantly, the SLG model de-scribes the attenuation of the A–X association during both the A-Otrials and the delay period.
It is noteworthy that a model presented by Kruschke (2001;Kruschke & Blair, 2000) can also explain both BB and its spon-taneous recovery in ways similar to those offered by the SLGmodel. The model assumes error-driven attentional shifting thataccelerates learning of new associations but also protects previ-ously learned associations from retroactive interference. Accord-ing to this model, whereas forward blocking is the consequence ofa reduced X–O association, BB is the consequence of inattentionto X. If attention increases during the delay period, responding toX will recover.
As mentioned above, Miller and Matute (1996) hypothesizedthat failure to obtain BB in animals, without using sensory pre-conditioning, was due to the high biological significance of theUS. Our model agrees with the idea that there is somethingdifferent about the US in a BB arrangement. The model suggeststhat stimulus O should predict X. To do this, either O shouldoverlap with X (as in the simulations shown in Figure 5) or abackward association should be present (as in the proposed mod-ification of the model). However, the SLG model could explainBB with a shock US under the assumptions that (a) the teachingsignal used to build CS–US associations is a trace of the US andnot the US itself and (b) the US can become a predictor of CSssuch as X.
Recovery From Latent Inhibition
LI refers to the decreased CR that follows preexposure to the CS(Lubow, 1989). Recovery from LI has been reported following (a)extinction of the training context (Grahame et al., 1994), (b) US
10 SCHMAJUK AND LARRAURI

presentations in another context (Kasprow, Catterson, Schacht-man, & Miller, 1984), and (c) delayed testing (Kraemer, Randall,& Carbary, 1991). Schmajuk et al. (1996) have previously shownthat the SLG model describes these effects qualitatively, that is,without attempting to approximate the actual values reported in theexperiments. In this section, a quantitative description is offered.
Experimental data. Grahame et al. (1994) reported that extinc-tion of the training context following LI results in the recovery ofthe response to the target CS. In their Experiment 1, rats in thePRE groups were first exposed to 120 CS (78-dB white noise)presentations. Rats in the NPE groups received the same treatmentin the absence of the CS. Then, all groups received four presen-tations of the CS coterminating with a footshock US. The PRE-EXTINCTION and the NPE-EXTINCTION groups were thengiven exposure to the training context for 5 days, whereas thePRE-CONTROL and the NPE-CONTROL groups stayed in thehome cage. Testing of the CS was conducted in a third context.
The small square markers in Figure 6 show the Grahame et al.(1994) experimental results expressed as the mean latency tocomplete 5 cumulative seconds of licking in the presence of the CSduring a test trial. Because the US is an aversive shock, a strongerCR is reflected in a longer latency. The CONTROL groups showLI because the PRE group exhibits a weaker response than doesthe NPE group.
Simulated results. In the PRE case, the CS (representing the78-dB white noise, salience � .6) was presented in CX1 for 75trials, followed by 45 CS-US presentations in CX1. In the NPEcase, the CX1 was presented for 75 trials, followed by 45 CS-USpresentations in CX1. Each of these cases was followed by either(a) 120 trials in CX2 and 1 testing trial in CX3 (CONTROL) or (b)120 trials in CX1 and 1 testing trial in CX3 (EXTINCTION).
The columns in Figure 6 show the simulated results. As in theexperimental case, the extinction of the conditioning context re-sults in the attenuation of LI. Simulated results fall within the 95%
confidence intervals (error bars). According to the model, theEXTINCTION groups do not show LI because PRE respondingincreases and NPE responding decreases. Similar results are ob-tained when the number of trials is kept constant for two phases(Phase 1, 75 trials; Phase 2, 45 trials; Phase 3, 120 trials) and oneof the other phases is varied within the following ranges: Phase 1,45–113 trials; Phase 2, 45–68 trials; Phase 3, 42–205 trials.
Simulated results also fall within the confidence intervals, whensome generalization between the training context (represented byCX1 � .1, CX2 � 0, CX3 � 0), control context (represented byCX1 � .05, CX2 � .05, CX3 � 0), and test context (representedby CX1 � .05, CX2 � 0, CX3 � .05) was assumed. In this case,Phase 1 had 270 trials, Phase 2 had 30 trials, and Phase 3 had 175trials.
In addition, when the CR values yielded by the simulations werecombined with the standard errors of the data, a two-way ANOVAconducted on the CR revealed a main effect of treatment, F(1,44) � 6.27, p � .016, which demonstrates LI; no main effect ofextinction, F(1, 44) � 0.03, p � .86; and an interaction betweenthese factors, F(1, 44) � 4.09, p � .05, which demonstratesrecovery from LI after extinction. Complete recovery from LI isdemonstrated by a nonsignificant difference between the NPE-EXTINCTION and PRE-EXTINCTION groups, t(22) � 0.254,p � .80. These statistical results are similar to those obtained forthe experimental data.
LI is explained as follows. When the unpredicted CS is pre-sented for the first time in the unfamiliar CX1, Novelty’ reaches amaximum. As CS–CS, CX1–CX1, CS–CX1, and CX1–CS asso-ciations are formed during preexposure, and both CS and CX1 arebeing predicted, Novelty’ decreases (Trials 1–75, CS preexpo-sure). During conditioning (Trials 76–120), Novelty’ in the NPEgroups is large because of the unpredicted presentation of the CSand US in CX1. Instead, Novelty’ is relatively small in the PREgroups because only the US is unpredicted by CX1. BecauseNovelty’ and zCS are smaller in the PRE groups than in the NPEgroups, acquisition of VCS,US is retarded, and LI is manifested. Itshould be noticed that by the end of conditioning, Novelty’ is stilllarger in the NPE groups than in the PRE groups.
Recovery from LI is explained in the following terms. When thePRE-CONTROL group is placed in the new context CX2 (Trials121–240), in which the CS had not been presented before, zCS
remains small because a representation of the CS is not evoked byCX2. For the same reason, zCS does not change when the NPE-CONTROL group is placed in CX2 (Trials 121–240). Therefore,the resulting CR in the PRE-CONTROL group, CR �CS zCS
VCS,US, is small compared with that of the NPE-CONTROL group,and LI is preserved.
Conversely, if the PRE-EXTINCTION group is placed in thetraining context CX1 (Trials 121–240), Novelty’ increases becauseof the unconfirmed predictions of the CS and the US by CX1, andzCS increases. Attention zCS increases even when CS is absentbecause CX1 activates an image of the CS by predicting it throughthe CX1–CS association. The increased zCS in the PRE-EXTINCTION group produces a large CR. When the NPE-EXTINCTION group is placed in the training context, Novelty’and zCS decrease from their large values during conditioningbecause CX1 generates only weak predictions of the CS and US intheir absence. Because zCS and the CR increase in the PRE-
Figure 6. Recovery from latent inhibition. Square markers: Data fromGrahame et al. (1994, Experiment 1, Figure 3) showing mean latencies tocomplete the first 5 cumulative seconds (s) of drinking in the test contextin control and extinction groups. Error bars: 95% confidence intervals.Columns: Simulated results showing the strength of the conditioned re-sponse to the CS during 1 test trial, following 75 CS trials, 45 CS-US trials,and 120 CX trials. Simulation parameters were as follows: conditionedstimulus (CS), 30–40 time units, salience � .6; unconditioned stimulus(US), 35–40 time units, strength � 1; context (CX), salience � .1, intertrialinterval � 600 time units. PRE � preexposed group; NPE � nonpreex-posed group.
11CHALLENGES TO THEORIES OF CLASSICAL CONDITIONING

EXTINCTION group and decrease in the NPE-EXTINCTIONgroup, LI is attenuated.
Comparison with other models. Grahame et al. (1994) pointedout that, together with Kasprow et al.’s (1984) reminder effectsand Kraemer et al.’s (1991) spontaneous-recovery effects, theirresults suggest that LI might not be a failure to acquire a CS–USassociation. According to Miller and Schachtman’s (1985) com-parator hypothesis, LI is the consequence of a strong CS–CXassociation, acquired during preexposure, which makes the indi-rect representation of the US stronger than the direct one, thereforeattenuating responding to the CS. According to Grahame et al.(1994), extinction of the training context following training resultsin decreased CX–US associations and the attenuation of LI be-cause it reduces the indirect representation of the US.
According to the Dickinson and Burke (1996) version of Wag-ner’s (1981) SOP model, LI is the result of the preexposure to thecontext activating the representation of the CS in the A2 state,thereby decreasing the CS A1 representation and consequentlyretarding the formation of the CS–US association. Presentation ofthe context alone after conditioning activates the representations ofboth the CS and the US in the A2 state, thereby increasing theCS–US association and producing recovery from LI.
Super Latent Inhibition Effect
Although decreased LI has been reported following the proce-dures described above, an increased LI has been found followingothers (De la Casa & Lubow, 2000, 2002; Wheeler et al., 2004).
Experimental data. Using a taste aversion paradigm with rats,De la Casa and Lubow (2000, 2002) showed that LI increases aftera 21-day delay between conditioning (1 presentation of a saccharinsolution followed by an i.p. injection of LiCl) and testing (3 or 5sessions, each consisting of 5 min of access to the saccharinsolution), as compared with a 1-day delay condition. Whereas thedelay period was spent in the home cage, the experimental stagestook place in the training box. The effect, referred to as super LI,was seen only when (a) the number of preexposure trials wasrelatively large (4 vs. 2 days), (b) the delay period was introducedbetween conditioning and testing phases instead of between pre-exposure and conditioning phases, (c) all experimental stages wereconducted in different contexts, and (d) the US was relativelystrong (.4 and .5 vs. .2 M LiCl injections). These results, expressedas mean saccharin consumption, are represented by markers inFigures 7–10. Because this is a taste aversion paradigm, a strongerCR is reflected in a lower consumption.
Computer simulations. Our simulations assumed that taste-aversion conditioning follows the same associative rules of anyother CS-aversive US association. Although it is perhaps arguable(e.g., Garcia & Koelling, 1966), we assumed that the food–LiClassociation simply occurred in delay conditioning.
In the simulations, we assumed that the animals spent (a) 80acclimation trials in the home cage (CX1), where they receivedwater and related cues such as the lever, spout, and so on (CS1);(b) 30 trials in the training box (CX2), where they received 30trials of water (CS1) in the NPE condition, 30 trials of water witha flavor (CS1 and CS2) in the four PRE conditions, or 15 trials ofwater (CS1) and 15 trials of water with a flavor (CS1 and CS2) inthe two PRE conditions; (c) 8 trials of conditioning in the trainingbox (CX2), where they received water with a flavor (CS1 and CS2)
together with the US; (d) 1 or 33 delay trials in the home cage,where they received water (CS1), to simulate the 1- or 21-daydelay between conditioning and test; and (e) 3 test trials in thetraining box, where they received water and flavor (CS1 and CS2).
Large number of delay days. The columns in Figure 7 showthat, as reported by De la Casa and Lubow (2002, Experiment 1),super LI is present with 33 delay trials (representing 21 days ofdelay) but not with 1 delay trial, and 30 preexposure trials. Sim-ulated results fall within the 95% confidence intervals of the data(error bars). Similar results are obtained when the number of trialsis kept constant for three phases (Phase 1, 80 trials; Phase 2, 30trials; Phase 3, 8 trials; Phase 4, 33 trials) and one of the otherphases is varied within the following ranges: Phase 1, 80–86trials; Phase 2, 16–30 trials; Phase 3, 7–8 trials; Phase 4, 33–over600 trials.
In addition, when the CR values yielded by the simulations arecombined with the standard errors of the data, a 2 � 3 ANOVAconducted on the CR revealed a main effect of treatment, F(1,42) � 156.13, p � .01, which demonstrates LI; a main effect ofdelay, F(2, 42) � 11.61, p � .01; and an interaction between thesefactors, F(2, 42) � 3.26, p � .05, which demonstrates super LIfollowing the delay. These results are similar to those obtainedwhen the same statistical tests are applied to the experimental data.
The simulated results, showing that LI increases more after 30preexposure trials and 33 delay trials (compared with the case of30 preexposure trials and 1 delay trial) than after 15 preexposuretrials and 33 delay trials (compared with the case of 15 preexpo-sure trials and 1 delay trial), are explained as follows:
In the PRE group, preexposed to the CS for 30 trials andreceiving 33 delay trials (see gray column labeled “Long PRE” inFigure 7), Novelty’ and attention to the water, zWater, decreaseduring the trials spent in the home cage (Trials 1–80). During
Figure 7. Super latent inhibition after a postconditioning delay. Squaremarkers: Data from De la Casa and Lubow (2002, Experiment 1) showingmean saccharin consumption in groups that received no preexposure(NPE), 2 preexposure days (Short PRE), and 4 preexposure days (LongPRE) after 1 or 21 days of postconditioning delay in the home cage. Errorbars: 95% confidence intervals. Columns: Three-trial average of simulatedconsumption in groups that received no preexposure (NPE), 15 preexpo-sure trials (Short PRE), and 30 preexposure trials (Long PRE) after 1 or 33trials of postconditioning delay in the context representing the home cage.Simulation parameters were as follows: conditioned stimulus, 15–40 timeunits, salience � 1; unconditioned stimulus, 35–40 time units, strength �1; home and training context, salience � .1; intertrial interval � 500 timeunits.
12 SCHMAJUK AND LARRAURI

preexposure to the training context and the flavored water (Trials81–110), Novelty’ first increases and then decreases, attention tothe flavor, zFlavor, decreases, and zWater stays low. During condi-tioning (Trials 111–118), Novelty’ and zFlavor increase, whereaszWater, which was preexposed for a longer time than the flavor,starts lower and increases to a lower final value. During theconditioning period, the associations of the water, VWater-US, andthe flavor, VFlavor-US, with the US increase. During the delayperiod in the home cage (Trials 119–151), Novelty’, zFlavor, andzWater increase. The increase in Novelty’ is the result of theunfulfilled expectation of the US, the flavor, and the trainingcontext when the water is presented in their absence in the homecage. During the three test trials (Trials 152–154), in the absenceof the US predicted by the flavor, because attention to the flavorand the water increased in the course of the delay, the flavor–USassociation, VFlavor-US, decreases, and the water–US association,VWater-US, becomes inhibitory. In the group preexposed to the CSfor 30 trials and with 1 delay trial, during the delay period in thehome cage (Trial 119), zWater, does not change. During the threetest trials (Trials 120–122), the associations of both water, VWater-
US, and flavor, VFlavor-US, with the US simply decrease.In the NPE group (see white column labeled “NPE” in Figure 7),
during preexposure to the context and water without the flavor(Trials 81–110), the absence of the latter CS causes Novelty’ toinitially increase to a lower level than in the PRE group. However,by the end of the preexposure phase, Novelty’ ends higher in theNPE group than in the PRE group. In this case, attention to thewater, zWater, remains unchanged. During conditioning (Trials111–118), Novelty’ and zWater increase more in the NPE than inthe PRE group. During the delay period in the home cage (Trials119–151), Novelty’ and zWater decrease. Attention to the flavor,zFlavor, remains unchanged. The decrease in Novelty’ is the resultof a relatively small expectation of the flavor (water and flavorwere not preexposed together) when the water is presented in itsabsence in the home cage. During the three test trials (Trials152–154), in the absence of the US, because zWater is relativelysmall, the water–US association, VWater-US, becomes only slightlyinhibitory and does not decrease the strength of the CR relative tothe 1-delay-trial case.
Therefore, according to the SLG model, super LI is not due toa further decrease in attention to the flavor in the PRE group butto an increased attention to the stimulus representing the water andrelated stimuli, which becomes a conditioned inhibitor. Becauseattention to the water increases with 30 preexposure trials and 33delay trials, the association of the water with the US rapidlybecomes inhibitory during testing, decreasing the strength of theCR relative to the 1-delay-trial case. In contrast, as explained in thenext subsection, LI increases less (shows a smaller super LI effect)in the groups with 15 preexposure and 33 delay trials.
Large number of preexposure trials. The columns in Figure 7show that super LI is present with 30 preexposure trials and, to alesser degree, with 15 preexposure trials, after 33 delay trials (seegray column labeled “Short PRE” in Figure 7). According to themodel, the shorter preexposure period results in an increase inattention to the water, zWater, during conditioning. Because atten-tion to the water has already increased during conditioning, theeffect of the number of delay trials on attention is reduced. Boththe water and the flavor show excitatory associations with the US
during testing. Also, the reduced number of preexposure trialsresults in a smaller LI effect.
Delay period between preexposure and conditioning. The col-umns in Figure 8 show computer simulations of LI in a tasteaversion paradigm when the 33-trial delay is interposed betweenthe preexposure and the conditioning phases. Otherwise, the sim-ulations were run as described above. The columns in Figure 8show that, as reported by De la Casa and Lubow (2002, Experi-ment 3), super LI is absent when the delay is interposed betweenpreexposure and conditioning. Simulated results fall within the95% confidence intervals of the data (error bars). Similar resultsare obtained when the number of trials is kept constant for threephases (Phase 1, 80 trials; Phase 2, 30 trials; Phase 3, 33 trials;Phase 4, 8 trials) and one of the other phases is varied within thefollowing ranges: Phase 1, 72–161 trials; Phase 2, 8–81 trials;Phase 3, 21–over 600 trials; Phase 4, 5–9 trials.
In addition, when the CR values yielded by the simulations arecombined with the standard errors of the data, a two-way ANOVAconducted on the CR revealed a main effect of treatment, F(1,20) � 52.85, p � .01, which demonstrates LI; no main effect ofdelay, F(1, 20) � 0.0085, p � .93; and no interaction betweenthese factors, F(1, 20) � 0.0006, p � .98, which demonstrates thatsuper LI is absent when the delay period is interposed betweenpreexposure and conditioning. These results are similar to thoseobtained when the same statistical tests are applied to the experi-mental data.
The simulated results for the case in which super LI is notmanifested, 30 preexposure trials combined with 33 delay trialsbetween preexposure and conditioning (33-trial group), are ex-plained as follows. During the 33 delay (Trials 111–143) trials inthe home cage, attention to the flavor, ZFlavor, increased slightly,but attention to the water, zWater, barely changed. These smallincreases are the result of a relatively small increment in Novelty’.
Figure 8. Absence of super latent inhibition after a post-preexposuredelay. Square markers: Data from De la Casa and Lubow (2002, Experi-ment 3) showing mean saccharin consumption in groups that received nopreexposure (NPE) or 4 preexposure days (Long PRE) followed by 1 day(Short Delay) or 21 days (Long Delay) between preexposure and condi-tioning in the home cage. Error bars: 95% confidence intervals. Columns:Three-trial average of simulated consumption, after no preexposure (NPE)or 30 preexposure trials (Long PRE) followed by 1 trial (Short Delay) or33 trials (Long Delay) after preexposure in the context representing thehome cage. Simulation parameters were as follows: conditioned stimulus,15–40 time units, salience � 1; unconditioned stimulus, 35–40 time units,strength � 1; home and training context, salience � .1; intertrial interval �500 time units.
13CHALLENGES TO THEORIES OF CLASSICAL CONDITIONING
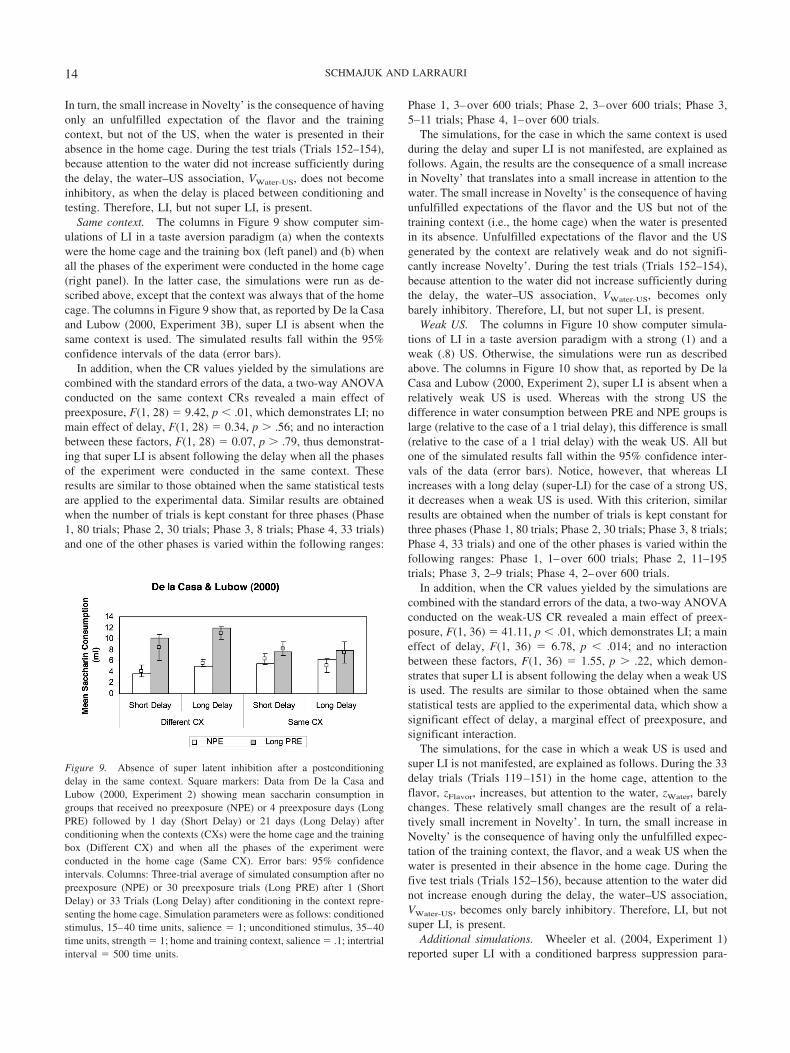
In turn, the small increase in Novelty’ is the consequence of havingonly an unfulfilled expectation of the flavor and the trainingcontext, but not of the US, when the water is presented in theirabsence in the home cage. During the test trials (Trials 152–154),because attention to the water did not increase sufficiently duringthe delay, the water–US association, VWater-US, does not becomeinhibitory, as when the delay is placed between conditioning andtesting. Therefore, LI, but not super LI, is present.
Same context. The columns in Figure 9 show computer sim-ulations of LI in a taste aversion paradigm (a) when the contextswere the home cage and the training box (left panel) and (b) whenall the phases of the experiment were conducted in the home cage(right panel). In the latter case, the simulations were run as de-scribed above, except that the context was always that of the homecage. The columns in Figure 9 show that, as reported by De la Casaand Lubow (2000, Experiment 3B), super LI is absent when thesame context is used. The simulated results fall within the 95%confidence intervals of the data (error bars).
In addition, when the CR values yielded by the simulations arecombined with the standard errors of the data, a two-way ANOVAconducted on the same context CRs revealed a main effect ofpreexposure, F(1, 28) � 9.42, p � .01, which demonstrates LI; nomain effect of delay, F(1, 28) � 0.34, p � .56; and no interactionbetween these factors, F(1, 28) � 0.07, p � .79, thus demonstrat-ing that super LI is absent following the delay when all the phasesof the experiment were conducted in the same context. Theseresults are similar to those obtained when the same statistical testsare applied to the experimental data. Similar results are obtainedwhen the number of trials is kept constant for three phases (Phase1, 80 trials; Phase 2, 30 trials; Phase 3, 8 trials; Phase 4, 33 trials)and one of the other phases is varied within the following ranges:
Phase 1, 3–over 600 trials; Phase 2, 3–over 600 trials; Phase 3,5–11 trials; Phase 4, 1–over 600 trials.
The simulations, for the case in which the same context is usedduring the delay and super LI is not manifested, are explained asfollows. Again, the results are the consequence of a small increasein Novelty’ that translates into a small increase in attention to thewater. The small increase in Novelty’ is the consequence of havingunfulfilled expectations of the flavor and the US but not of thetraining context (i.e., the home cage) when the water is presentedin its absence. Unfulfilled expectations of the flavor and the USgenerated by the context are relatively weak and do not signifi-cantly increase Novelty’. During the test trials (Trials 152–154),because attention to the water did not increase sufficiently duringthe delay, the water–US association, VWater-US, becomes onlybarely inhibitory. Therefore, LI, but not super LI, is present.
Weak US. The columns in Figure 10 show computer simula-tions of LI in a taste aversion paradigm with a strong (1) and aweak (.8) US. Otherwise, the simulations were run as describedabove. The columns in Figure 10 show that, as reported by De laCasa and Lubow (2000, Experiment 2), super LI is absent when arelatively weak US is used. Whereas with the strong US thedifference in water consumption between PRE and NPE groups islarge (relative to the case of a 1 trial delay), this difference is small(relative to the case of a 1 trial delay) with the weak US. All butone of the simulated results fall within the 95% confidence inter-vals of the data (error bars). Notice, however, that whereas LIincreases with a long delay (super-LI) for the case of a strong US,it decreases when a weak US is used. With this criterion, similarresults are obtained when the number of trials is kept constant forthree phases (Phase 1, 80 trials; Phase 2, 30 trials; Phase 3, 8 trials;Phase 4, 33 trials) and one of the other phases is varied within thefollowing ranges: Phase 1, 1–over 600 trials; Phase 2, 11–195trials; Phase 3, 2–9 trials; Phase 4, 2–over 600 trials.
In addition, when the CR values yielded by the simulations arecombined with the standard errors of the data, a two-way ANOVAconducted on the weak-US CR revealed a main effect of preex-posure, F(1, 36) � 41.11, p � .01, which demonstrates LI; a maineffect of delay, F(1, 36) � 6.78, p � .014; and no interactionbetween these factors, F(1, 36) � 1.55, p � .22, which demon-strates that super LI is absent following the delay when a weak USis used. The results are similar to those obtained when the samestatistical tests are applied to the experimental data, which show asignificant effect of delay, a marginal effect of preexposure, andsignificant interaction.
The simulations, for the case in which a weak US is used andsuper LI is not manifested, are explained as follows. During the 33delay trials (Trials 119–151) in the home cage, attention to theflavor, zFlavor, increases, but attention to the water, zWater, barelychanges. These relatively small changes are the result of a rela-tively small increment in Novelty’. In turn, the small increase inNovelty’ is the consequence of having only the unfulfilled expec-tation of the training context, the flavor, and a weak US when thewater is presented in their absence in the home cage. During thefive test trials (Trials 152–156), because attention to the water didnot increase enough during the delay, the water–US association,VWater-US, becomes only barely inhibitory. Therefore, LI, but notsuper LI, is present.
Additional simulations. Wheeler et al. (2004, Experiment 1)reported super LI with a conditioned barpress suppression para-
Figure 9. Absence of super latent inhibition after a postconditioningdelay in the same context. Square markers: Data from De la Casa andLubow (2000, Experiment 2) showing mean saccharin consumption ingroups that received no preexposure (NPE) or 4 preexposure days (LongPRE) followed by 1 day (Short Delay) or 21 days (Long Delay) afterconditioning when the contexts (CXs) were the home cage and the trainingbox (Different CX) and when all the phases of the experiment wereconducted in the home cage (Same CX). Error bars: 95% confidenceintervals. Columns: Three-trial average of simulated consumption after nopreexposure (NPE) or 30 preexposure trials (Long PRE) after 1 (ShortDelay) or 33 Trials (Long Delay) after conditioning in the context repre-senting the home cage. Simulation parameters were as follows: conditionedstimulus, 15–40 time units, salience � 1; unconditioned stimulus, 35–40time units, strength � 1; home and training context, salience � .1; intertrialinterval � 500 time units.
14 SCHMAJUK AND LARRAURI
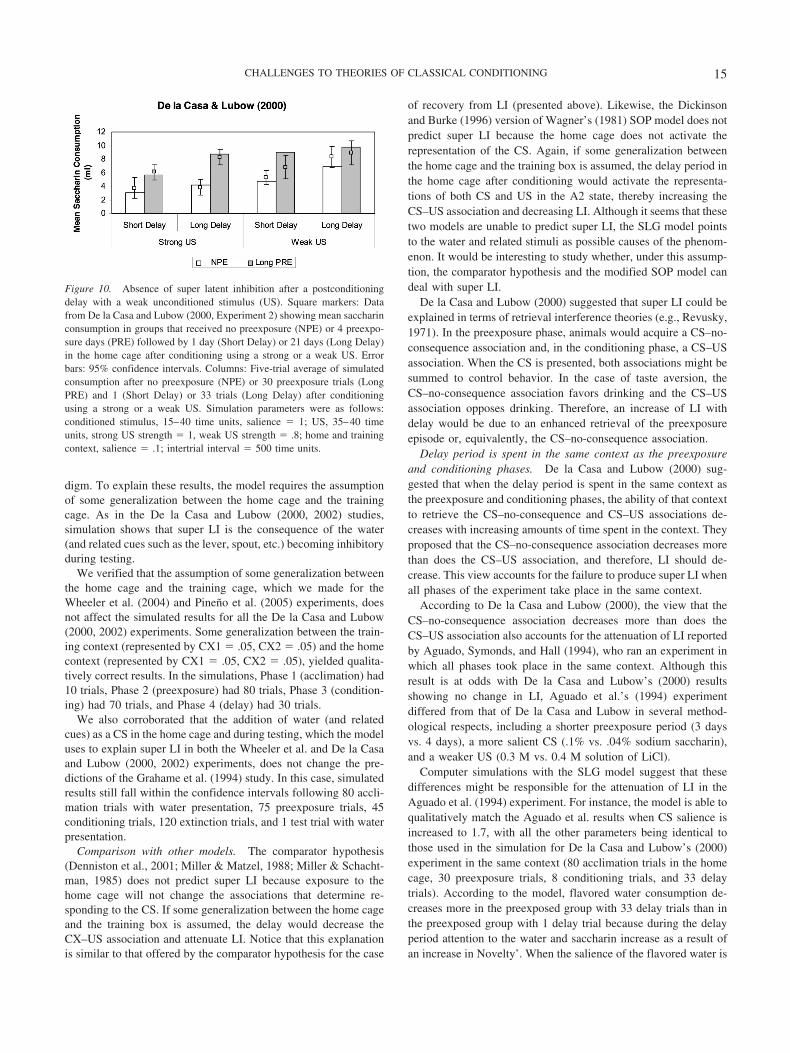
digm. To explain these results, the model requires the assumptionof some generalization between the home cage and the trainingcage. As in the De la Casa and Lubow (2000, 2002) studies,simulation shows that super LI is the consequence of the water(and related cues such as the lever, spout, etc.) becoming inhibitoryduring testing.
We verified that the assumption of some generalization betweenthe home cage and the training cage, which we made for theWheeler et al. (2004) and Pineno et al. (2005) experiments, doesnot affect the simulated results for all the De la Casa and Lubow(2000, 2002) experiments. Some generalization between the train-ing context (represented by CX1 � .05, CX2 � .05) and the homecontext (represented by CX1 � .05, CX2 � .05), yielded qualita-tively correct results. In the simulations, Phase 1 (acclimation) had10 trials, Phase 2 (preexposure) had 80 trials, Phase 3 (condition-ing) had 70 trials, and Phase 4 (delay) had 30 trials.
We also corroborated that the addition of water (and relatedcues) as a CS in the home cage and during testing, which the modeluses to explain super LI in both the Wheeler et al. and De la Casaand Lubow (2000, 2002) experiments, does not change the pre-dictions of the Grahame et al. (1994) study. In this case, simulatedresults still fall within the confidence intervals following 80 accli-mation trials with water presentation, 75 preexposure trials, 45conditioning trials, 120 extinction trials, and 1 test trial with waterpresentation.
Comparison with other models. The comparator hypothesis(Denniston et al., 2001; Miller & Matzel, 1988; Miller & Schacht-man, 1985) does not predict super LI because exposure to thehome cage will not change the associations that determine re-sponding to the CS. If some generalization between the home cageand the training box is assumed, the delay would decrease theCX–US association and attenuate LI. Notice that this explanationis similar to that offered by the comparator hypothesis for the case
of recovery from LI (presented above). Likewise, the Dickinsonand Burke (1996) version of Wagner’s (1981) SOP model does notpredict super LI because the home cage does not activate therepresentation of the CS. Again, if some generalization betweenthe home cage and the training box is assumed, the delay period inthe home cage after conditioning would activate the representa-tions of both CS and US in the A2 state, thereby increasing theCS–US association and decreasing LI. Although it seems that thesetwo models are unable to predict super LI, the SLG model pointsto the water and related stimuli as possible causes of the phenom-enon. It would be interesting to study whether, under this assump-tion, the comparator hypothesis and the modified SOP model candeal with super LI.
De la Casa and Lubow (2000) suggested that super LI could beexplained in terms of retrieval interference theories (e.g., Revusky,1971). In the preexposure phase, animals would acquire a CS–no-consequence association and, in the conditioning phase, a CS–USassociation. When the CS is presented, both associations might besummed to control behavior. In the case of taste aversion, theCS–no-consequence association favors drinking and the CS–USassociation opposes drinking. Therefore, an increase of LI withdelay would be due to an enhanced retrieval of the preexposureepisode or, equivalently, the CS–no-consequence association.
Delay period is spent in the same context as the preexposureand conditioning phases. De la Casa and Lubow (2000) sug-gested that when the delay period is spent in the same context asthe preexposure and conditioning phases, the ability of that contextto retrieve the CS–no-consequence and CS–US associations de-creases with increasing amounts of time spent in the context. Theyproposed that the CS–no-consequence association decreases morethan does the CS–US association, and therefore, LI should de-crease. This view accounts for the failure to produce super LI whenall phases of the experiment take place in the same context.
According to De la Casa and Lubow (2000), the view that theCS–no-consequence association decreases more than does theCS–US association also accounts for the attenuation of LI reportedby Aguado, Symonds, and Hall (1994), who ran an experiment inwhich all phases took place in the same context. Although thisresult is at odds with De la Casa and Lubow’s (2000) resultsshowing no change in LI, Aguado et al.’s (1994) experimentdiffered from that of De la Casa and Lubow in several method-ological respects, including a shorter preexposure period (3 daysvs. 4 days), a more salient CS (.1% vs. .04% sodium saccharin),and a weaker US (0.3 M vs. 0.4 M solution of LiCl).
Computer simulations with the SLG model suggest that thesedifferences might be responsible for the attenuation of LI in theAguado et al. (1994) experiment. For instance, the model is able toqualitatively match the Aguado et al. results when CS salience isincreased to 1.7, with all the other parameters being identical tothose used in the simulation for De la Casa and Lubow’s (2000)experiment in the same context (80 acclimation trials in the homecage, 30 preexposure trials, 8 conditioning trials, and 33 delaytrials). According to the model, flavored water consumption de-creases more in the preexposed group with 33 delay trials than inthe preexposed group with 1 delay trial because during the delayperiod attention to the water and saccharin increase as a result ofan increase in Novelty’. When the salience of the flavored water is
Figure 10. Absence of super latent inhibition after a postconditioningdelay with a weak unconditioned stimulus (US). Square markers: Datafrom De la Casa and Lubow (2000, Experiment 2) showing mean saccharinconsumption in groups that received no preexposure (NPE) or 4 preexpo-sure days (PRE) followed by 1 day (Short Delay) or 21 days (Long Delay)in the home cage after conditioning using a strong or a weak US. Errorbars: 95% confidence intervals. Columns: Five-trial average of simulatedconsumption after no preexposure (NPE) or 30 preexposure trials (LongPRE) and 1 (Short Delay) or 33 trials (Long Delay) after conditioningusing a strong or a weak US. Simulation parameters were as follows:conditioned stimulus, 15–40 time units, salience � 1; US, 35–40 timeunits, strong US strength � 1, weak US strength � .8; home and trainingcontext, salience � .1; intertrial interval � 500 time units.
15CHALLENGES TO THEORIES OF CLASSICAL CONDITIONING

1, as in the case of De la Casa and Lubow’s experiment, attentionto the water stimulus is very low, and a 33-trial delay has no effect.
Delay period is spent in a context different from the contextwhere preexposure and conditioning occur. Although De la Casaand Lubow (2000) suggested that the increase of LI with a delayis due to an enhanced retrieval of the CS–no-consequence associ-ation when delay occurs in a context, Kraemer et al. (1991)reported spontaneous recovery from LI even when the delay takesplace in a different context. In Kraemer et al.’s (1991) experiment,rats were preexposed and conditioned in groups of 3 animals butwere tested individually. Following exposure to the context, someof the groups were preexposed to a light CS, whereas others werenot. During conditioning, all groups received CS and footshock USpresentations. Animals spent the retention interval in their individ-ual home cages. Kraemer et al. (1991) reported recovery from LI.In contrast to the explanations offered by De la Casa and Lubow(2000), Schmajuk et al. (1996, Figure 25) suggested that differ-ences in the experimental design might be responsible for thediscrepancies between Kraemer et al.’s (1991) and De la Casa andLubow’s (2000) results.
Effect of US strength. De la Casa and Lubow (2000) alsoproposed that, with a higher US strength, the conditioning phase ismore easily discriminated from the preexposure and the testphases. Therefore, the test phase provides a better cue for retriev-ing the CS–no-consequence than do the CS–US associations.Therefore, super LI ensues.
Latent Inhibition and Overshadowing Counteract EachOther
Blaisdell et al. (1998, Experiment 1) showed that combined LIand overshadowing treatments attenuate the decrease in respond-ing produced by each procedure alone.
Experimental results. The LI followed by overshadowing(PRE � OVER) group received 120 presentations of stimulus Xfollowed by 10 reinforced presentations of stimuli X and A. TheOVER group received 120 presentations of stimulus Y followedby 10 reinforced presentations of stimuli X and A. The PRE �CON (LI) group received 120 presentations of X followed by 10reinforced presentations of X alone. The conditioning (CON)group received 120 presentations of Y followed by 10 reinforcedpresentations of X. Whereas A was always a 100-W flashing light,X and Y were an 82-dB white noise and an 82-dB tone,counterbalanced.
The small square markers in Figure 11 show the mean time tocomplete 5 cumulative seconds of licking in the presence of X, ameasure of its level of conditioning, during a test trial in Blaisdellet al. (1998). The results show that preexposure and overshadow-ing procedures produce more conditioning when given togetherthan when separated.
Simulated results. The PRE � OVER case received 50 pre-sentations of CS1 (representing X, counterbalanced white noiseand tone, salience � .6) followed by 15 reinforced presentations ofCS1 and CS2 (representing A, 100-W flashing light with house-lights off, salience � .75). The OVER case received 50 presenta-tions of CS3 (representing Y, counterbalanced white noise andtone, salience � .6) followed by 15 reinforced presentations ofCS1 and CS2. The PRE � CON case received 50 presentations ofCS1 followed by 15 reinforced presentations of CS1. The CON
case received 50 presentations of CS3 followed by 15 reinforcedpresentations of CS1. In each case, one test trial was carried out todetermine the response to CS1.
Like the experimental results, the simulated results, representedby the columns in Figure 11, show that preexposure and overshad-owing procedures result in more conditioning when given togetherthan when given apart. Whereas the results for the PRE � OVER,PRE � CON, and CON groups fall within the 95% confidenceintervals of the data (error bars), that is not the case for the OVERgroup.
When the CR values yielded by the simulations are combinedwith the standard errors of the data, a two-way ANOVA conductedon the CR revealed no main effect of preexposure, F(1, 36) �0.07, p � .79, and no main effect of treatment, F(1, 36) � 0.37,p � .54, but did reveal a significant interaction, F(1, 36) � 13.84,p � .01. Planned comparisons between CRs in the different groupsshow LI; stronger responding in the CON group than in the PRE �CON group, F(1, 45) � 6.8, p �.012; overshadowing; strongerresponding in the CON group than in the OVER group, F(1, 45) �4.14, p � .05; counteraction between overshadowing and latentinhibition; and stronger responding in the PRE � OVER groupthan in both the PRE � CON group, F(1, 45) � 8.03, p � .01, andthe OVER group, F(1, 45) � 5.11, p � .029. These statisticalresults, similar to those obtained for the experimental data, can beobtained with 45 to 55 trials in Phase 1 and 15 trials in Phase 2.How the model attains these relationships is explained in thefollowing paragraphs.
Responding in the conditioning (CON) group is stronger than inthe preexposure and conditioning (PRE � CON) group. Ourexplanation of this basic LI effect is the same as above (seepreceding section on Recovery From Latent Inhibition). In the caseof the PRE � CON (i.e., LI) group, when the unpredicted CS1 isfirst presented in the unfamiliar CX, Novelty’ reaches a maximum.
Figure 11. Latent inhibition and overshadowing counteract each other.Square markers: Data from Blaisdell et al. (1998, Figure 5) showing meanlatencies to complete the first 5 cumulative seconds (s) of drinking in thetest context. Error bars: 95% confidence intervals. Columns: Simulatedresults showing the strength of the conditioned response to CS1 during 1test trial, following 50 CS1 trials in Phase 1 (PRE [preexposure]) or 50 CS3trials, and 15 CS1-CS2-US or CS1-US trials in Phase 2 (OVER [overshad-owing] or CON [conditioning]). Simulation parameters were as follows:conditioned stimuli (CSs), CS1, 30–40 time units, salience � .6; CS2,30–40 time units, salience � .75; unconditioned stimulus (US), 35–40time units, strength � .5; context, salience � .1; intertrial interval � 600time units.
16 SCHMAJUK AND LARRAURI

As CS1–CS1, CX–CX, CS1–CX, and CX–CS1 associations areformed, both CS1 and CX become predicted, and the value ofNovelty’ decreases. According to the model, attention to the CS1,zCS1, lags behind the value of Novelty’, first increasing from itsinitial value of zero and then decreasing. Therefore, whereas alimited number of preexposure trials results in a decreased Nov-elty’ and an increased zCS1, a larger number of trials results in bothdecreased Novelty’ and zCS1. In the case of the CON group, theabsence of the expected CS3 during conditioning increases Nov-elty’ and results in faster acquisition of the CS1–US associationand a relatively large CR.
The smaller Novelty’ in the PRE � CON group than in the CONgroup at the beginning of conditioning explains LI, in spite of thelarger initial zCS1 in the PRE � CON group. This is because asmaller Novelty’ results in a smaller zCS1 during conditioning, inthe retardation of the formation of the CS1–US association, and arelatively small CR. A stronger LI effect, however, can be obtainedwhen both Novelty’ and zCS1 have been reduced in the preexpo-sure phase.
Responding in the CON group is stronger than in the overshad-owing (OVER) group. Again, our explanation is the same asbefore. According to the model, in both the CON and OVERgroups, Novelty’ during conditioning increases as a result of theunpredicted presentation of the CS(s) and the US and the unpre-dicted absence of CS3 that was predicted by the context. Over-shadowing is the result of the competition between CS1 and CS2to gain association with the US, which limits the CS–US associ-ation and reduces the magnitude of the CR relative to that of theCON case.
Responding in the preexposure and overshadowing (PRE �OVER) group is stronger than in the PRE � CON group. Asmentioned above, the relatively small Novelty’ in the PRE � CONgroup at the beginning of conditioning explains LI. Responding inthe PRE � OVER case increases because the introduction of CS2during conditioning increases Novelty’ and attention to CS1, zCS1,consequently increasing the CS1–US association and the magni-tude of the CR relative to that of the PRE � CON group. More-over, CS1 testing in the absence of CS2 and the US increasesNovelty’ more in the PRE � OVER group than in the PRE �CON group, further increasing zCS1 and the relative advantage ofthe CR in the PRE � OVER group.
Responding in the PRE � OVER group is stronger than in theOVER group. During preexposure, the PRE � OVER groupundergoes the same process experienced by the PRE � CONgroup (described above). Because, as indicated above, a limitednumber of preexposure trials results in a decreased Novelty’ andan increased zCS1, at the beginning of overshadowing, zCS1 islarger in the PRE � OVER group than in the OVER group.Because overshadowing is the result of the competition betweenCS1 and CS2 to gain association with the US, an increased zCS1
results in an increased internal representation of CS1, XCS1, anincreased CS1–US association, VCS1,US, and a larger CR to CS1 inthe PRE � OVER group than in the OVER group.
Notice that, because of the absence of the expected CS3 and theaddition of the unpredicted CS2 during overshadowing, the valuesof Novelty’ in the PRE � OVER and OVER groups are relativelysimilar. This similarity allows the increased zCS1 to take control ofthe results in the PRE � OVER case. In contrast, Novelty’ in theCON group is much greater than in the PRE � CON group,
thereby reducing the advantage of having an increased zCS1 andreversing the effect. In other words, responding in the PRE �OVER group is stronger than in the OVER group because of theincreased value of zCS1 after preexposure in the PRE � OVERgroup. Instead, responding in the PRE � CON (LI) group issmaller than in the CON group because, during conditioning,Novelty’ is larger in the CON group than in the PRE � CONgroup.
The number of trials for which these results are obtained islimited by the facts that (a) too many preexposure trials will reducezCS1 and the PRE � OVER group will not generate a CR strongerthan that of the OVER group, (b) too few conditioning trials willnot yield enough overshadowing or LI, and (c) too many condi-tioning trials will not yield LI.
Comparison with other models. These results cannot be ex-plained by the Dickinson and Burke (1996) model because (a) therepresentation of CS1 in the A1 state is decreased by its activationin the A2 state that results from its being predicted by the contextand (b) the representation of the US in the A1 state is decreased byits activation in the A2 state by both CS1 and CS2. Therefore, theCR generated by the PRE � OVER group will be smaller than thatin the PRE � CON and OVER groups, even if CS1 and the USbecome weakly associated in A2.
In contrast, Blaisdell et al. (1998) argued that increased respond-ing to CS1 is due to the decreased effective activation of theCX–US link, caused by the interference from the strong CS2–USassociation formed during overshadowing. Consequently, duringtesting, the context, instead of CS2, is activated by CS1 and servesas the comparator stimulus. Therefore, preexposure should resultin less overshadowing.
Savastano, Arcediano, Stout, and Miller (2003) showed how amathematical version of the extended comparator hypothesis canexplain experimental results showing that preexposure and over-shadowing cancel each other. In their simulations, responding inthe PRE � OVER group is 20% and 6% stronger than in theOVER and the PRE � CON groups, respectively, whereas in oursimulations, these ratios are 47% and 65%.
Discussion
In the present article, we have shown that the SLG modelprovides quantitative predictions of the following sets of results:(a) Extinction of the overshadowing CS results in the recovery ofthe response to the overshadowed CS (Matzel et al., 1985); (b)extinction of the blocking CS results in the recovery of the re-sponse to the blocked CS (Blaisdell et al., 1999); (c) interposing adelay between the last phase of backward conditioning and testingresults in the recovery from backward blocking (Pineno et al.,2005); (d) extinction of the context following LI results in therecovery of the response of the CS (Grahame et al., 1994); (e)interposing a delay between conditioning and testing in LI resultsin super LI (De la Casa & Lubow, 2000, 2002; Wheeler et al.,2004); and (f) LI and overshadowing counteract each other (Blais-dell et al., 1998). Apparently, the SLG model is the only one able,at this point, to explain super LI and to give an account for theopposite results reported by Blaisdell et al. (1999) and Holland(1999).
According to the model, (a) overshadowing and blocking are theconsequence of both decreased attention to the target CS and
17CHALLENGES TO THEORIES OF CLASSICAL CONDITIONING

decreased target CS–US associations resulting from competitionwith the companion CS; (b) LI results from a decreased targetCS–US association because of decreased attention to the target CS;(c) recovery from overshadowing, blocking, and LI are the resultof increased attention to the target CS following the extinction ofthe overshadowing CS, the blocking CS, and the CX, respectively;(d) BB is the result of decreased attention to the target CS; (e)recovery from BB is the consequence of increased attention to thesurrogate US; (f) super LI is the result of increased attention to aconditioned inhibitor present during testing; and (g) the counter-action between LI and overshadowing is the consequence of theincreased attention to the target CS during preexposure.
The model also generates some novel predictions. According tothe model, extinction of the blocking CS in a BB paradigm shouldresult in recovery from BB, and using less salient CSs in anexperiment like the one carried out by Blaisdell et al. (1999)should result in the absence of recovery from blocking.
To simulate the experimental data and, in particular, the differ-ences between the results of different experiments, we manipulatedthe salience of the CS and the number of trials in each phase of theexperiments while maintaining most of other parameters constantwithin paradigms. Computer simulations showed that the model isrobust for several values of CS salience and ITI duration. Simu-lated results were correct within an ample range of number of trialsin each phase of the simulations of recovery from (a) overshad-owing, (b) BB, and (c) LI. Instead, precise descriptions of super LI,recovery from blocking, and the counteraction between overshad-owing and LI were obtained within a more limited range (fewerthan 10 trials on any given phase). Given the role of these param-eters in our simulations, it would be interesting to assess experi-mentally the range of parameters (e.g., CS salience, number oftrials per phase) within which the reported results can be repli-cated. It was also found that, with the exception of the interactionbetween overshadowing and LI (Blaisdell et al., 1998), goodquantitative simulations of the experimental results are obtainedwith all but one (K10 � 0) of the original parameters of the model(Schmajuk et al., 1996).
One possible criticism of the results presented here is the lack ofcorrespondence between the number of trials in the simulationsand the experiments. This difference is due to the fact that themodel has two fundamental processes: an attentional one that is atwork mainly during preexposure and extinction/recovery phasesand an associative one that is at work mainly during conditioningand extinction. In our model, because the attentional process is toofast and the associative process is too slow, the number of preex-posure and extinction/recovery trials in the experiments is consis-tently larger (ranging from 1.6 to 2.4 times for preexposure andfrom 1.8 to 4 times for extinction/recovery), and the averagenumber of conditioning trials is consistently smaller (ranging from.09 to .67 times), than in the simulations. A model speciallydesigned for each preparation would be necessary to reduce thesedifferences.
In some cases (Pineno et al., 2005; Wheeler et al., 2004), oursimulations assumed some generalization between contexts so asto approximate the experimental results. When the same assump-tion was applied to all other cases in which two or more contextswere included in the experimental design (De la Casa & Lubow,2000, 2002; Grahame et al., 1994), similar results were obtained.For the super LI experiments (De la Casa & Lubow, 2000, 2002;
Wheeler et al., 2004), our simulations included water (and relatedcues) as a CS in the home cage and during testing. We verified thatthis assumption does not change the predictions of the Grahame etal. (1994) study.
In addition to describing the recovery from overshadowing,blocking, BB, and LI, super latent inhibition, and the counteractionbetween LI and overshadowing, the SLG model is able to explainparadigms for which the comparator hypothesis cannot account.According to Denniston et al. (2001), these paradigms include (a)spontaneous recovery, (b) external disinhibition, (c) renewal, (d)trial order effects, (e) mediated extinction, (f) sensory precondi-tioning, and (g) reinstatement. Whereas spontaneous recovery,external disinhibition, renewal, and reinstatement are explained interms of the attentional changes produced by increasing Novelty’,mediated extinction and sensory preconditioning are explained interms of a CS1 indirectly activating CS2–US associations by directactivation of CS1–CS2 associations.
In spite of its numerous correct descriptions, the SLG modelcannot explain saving effects in extinction-acquisition series (Frey& Ross, 1968; Smith & Gormezano, 1965) or overtraining extinc-tion effects (North & Stimmel, 1960). This deficiency is based onthe fact that zCS reflects the association of CS with Novelty’, whichdecreases as learning progresses, and not with its own associationswith other CSs or the US (predictive value of CS), which increaseswith increasing learning. Also, although the model is unable todescribe occasion setting (Holland, 1977), an extended versionoffered by Buhusi and Schmajuk (1996) accounts for thisphenomenon.
Besides applying the SLG model to a set of experimental resultspublished after the model was first presented, this paper introducesa new method to compare experimental and modeled results bycombining simulation results, interpreted as group means, with thestandard errors of the experimental data to compute F values. Ourtechnique allows us to apply to the simulated data the samestatistical tests that have been used to analyze the experimentalresults.
In addition to its application to the description of behavioraldata, since the SLG model is a neural network, we were able toapply it to the description of the neurophysiological basis of LI(Schmajuk et al., 2001) and the effect of pharmacological manip-ulations on LI (Schmajuk et al., 1998; Schmajuk, Gray, & Larrauri,2005). We also used it to explain the apparently contradictoryresults of (a) the effects of hippocampal lesions on LI (Buhusi etal., 1998) and (b) the effects of dopaminergic drugs on LI (Schma-juk et al., 2005). Furthermore, an extension of the SLG modelsuccessfully accounts for the neurophysiological substrates of oc-casion setting (Buhusi & Schmajuk, 1996). As mentioned above,some neurophysiological data (Baxter et al., 1999) lend support tothe idea that different mechanisms control blocking, as assumed bythe model.
A significant difference between the SLG model and the Dick-inson and Burke (1996) and Miller and Matzel (1988) theories isthat the former is an attentional-associative model while the latterones are associative-only models. Whereas the SLG model ex-plains most of the present results as retrieval effects, all thecompeting models explain the results as the consequence of asso-ciative changes. That is, whereas the SLG model explains theresults in terms of a change in attention to already establishedassociations that remain mostly unchanged, the alternative models
18 SCHMAJUK AND LARRAURI

modify existing associations, either the ones directly controllingthe CR or those used in the comparisons.
In spite of this difference, all three models agree on the impor-tance of CS–CS associations. In the SLG model, CS–CS andCS–CX associations are used to (a) compute the value of Novelty’,and (b) activate the representation of an absent CS, which thenbecomes associated with the (generally) increased value of Nov-elty’, thereby changing attention to the missing CS. In the com-parator hypothesis, CS–CS and CS–CX associations are needed tocompute the comparison value that determines the CR strength. Inthe Dickinson and Burke (1996) version of Wagner’s (1981) SOPmodel, presentation of a CS may activate, through CS–CS asso-ciations, the representations of other CSs into the A2 state.
In sum, this article shows that an attentional-associative modelof classical conditioning can explain the results of numerousstudies that have challenged the adequacy of traditional ap-proaches. Like the traditional models, our theory accounts forovershadowing, blocking, and LI in terms of a storage deficit.However, according to our view, this deficit can be overcome bythe increased attention that modulates retrieval.
References
Aguado, L., Symonds, M., & Hall, G. (1994). Interval between pre-exposure and test determines the magnitude of latent inhibition: Impli-cations for an interference account. Animal Learning & Behavior, 22,188–194.
Baxter, M. G., Gallagher, M., & Holland, P. C. (1999). Blocking can occurwithout losses in attention in rats with selective removal of hippocampalcholinergic input. Behavioral Neuroscience, 113, 881–890.
Blaisdell, A., Bristol, A., Gunther, L., & Miller, R. (1998). Overshadowingand latent inhibition counteract each other: Further support for thecomparator hypothesis. Journal of Experimental Psychology: AnimalBehavior Processes, 24, 335–351.
Blaisdell, A., Gunther, L., & Miller, R. (1999). Recovery from blockingachieved by extinguishing the blocking CS. Animal Learning & Behav-ior, 27, 63–76.
Buhusi, C. V., Gray, J. A., & Schmajuk, N. A. (1998). The perplexingeffects of hippocampal lesions on latent inhibition: A neural networksolution. Behavioral Neuroscience, 112, 316–351.
Buhusi, C. V., & Schmajuk, N. A. (1996). Attention, configuration, andhippocampal function. Hippocampus, 6, 621–642.
De la Casa, L., & Lubow, R. (2000). Super-latent inhibition with delayedconditioned taste aversion testing. Animal Learning & Behavior, 28,389–399.
De la Casa, L., & Lubow, R. (2002). An empirical analysis of the super-latent inhibition effect. Animal Learning & Behavior, 30, 112–120.
Denniston, J., Savastano, H., & Miller, R. (2001). The extended compar-ator hypothesis: Learning by contiguity, responding by relative strength.In R. R. Mowrer & S. B. Klein (Eds.), Handbook of contemporarylearning (pp. 65–117). Mahwah, NJ: Erlbaum.
Dickinson, A., & Burke, J. (1996). Within-compound associations mediatethe retrospective revaluation of causality judgments. Quarterly Journalof Experimental Psychology: Comparative and Physiological Psychol-ogy, 49B, 60–80.
Frey, P. W., & Ross, L. E. (1968). Classical conditioning of the rabbiteyelid response as a function of interstimulus interval. Journal of Com-parative and Physiological Psychology, 65, 246–250.
Garcia, J., & Koelling, R. (1966). Relation of cue to consequence inavoidance learning. Psychonomic Science, 4, 123–124.
Grahame, N., Barnet, R., Gunther, L., & Miller, R. (1994). Latent inhibi-tion as a performance deficit resulting from CS-context associations.Animal Learning & Behavior, 22, 395–408.
Gray, J. A. (1971). The psychology of fear and stress. London: Weidenfeld& Nicholson.
Holland, P. C. (1977). Conditioned stimulus as a determinant of the formof the Pavlovian conditioned response. Journal of Experimental Psy-chology: Animal Behavior Processes, 3, 77–104.
Holland, P. C. (1985). Element pretraining influences the content ofappetitive serial compound conditioning in rats. Journal of ExperimentalPsychology: Animal Behavior Processes, 11, 367–387.
Holland, P. C. (1999). Overshadowing and blocking as acquisition deficits:No recovery after extinction of overshadowing or blocking cues. Quar-terly Journal of Experimental Psychology: Comparative and Physiolog-ical Psychology, 52B, 307–333.
Kamin, L. (1968). Attention-like processes in classical conditioning. InM. R. Jones (Ed.), Miami symposium on the prediction of behavior:Aversive stimulation (pp. 9–32). Miami, FL: University of Miami Press.
Kamin, L. (1969). Predictability, surprise, attention and conditioning. In B.Campbell & R. Church (Eds.), Punishment and aversive behavior (pp.279–298). New York: Appleton-Century-Crofts.
Kasprow, W. J., Catterson, D., Schachtman, T. R., & Miller, R. R. (1984).Attenuation of latent inhibition by postacquisition reminder. QuarterlyJournal of Experimental Psychology: Comparative and PysiologicalPsychology, 36B, 53–63.
Kasprow, W. J., Schachtman, T. R., & Miller, R. R. (1987). The compar-ator hypothesis of conditioned response generation: Manifest condi-tioned excitation and inhibition as a function of relative excitatoryassociative strengths of CS and conditioning context at the time oftesting. Journal of Experimental Psychology: Animal Behavior Pro-cesses, 13, 395–406.
Kaufman, M. A., & Bolles, R. C. (1981). A nonassociative aspect ofovershadowing. Bulletin of the Psychonomic Society, 18, 318–320.
Kraemer, P., Randall, C., & Carbary, T. (1991). Release from latentinhibition with delayed testing. Animal Learning & Behavior, 19, 139–145.
Kruschke, J. K. (2001). Toward a unified model of attention in associativelearning. Journal of Mathematical Psychology, 45, 812–863.
Kruschke, J. K., & Blair, N. J. (2000). Blocking and backward blockinginvolve learned inattention. Psychonomic Bulletin & Review, 7, 636–645.
Lubow, R. (1989). Latent inhibition and conditioned attention theory. NewYork: Cambridge University Press.
Mackintosh, N. J. (1975). A theory of attention: Variations in the associa-bility of stimuli with reinforcement. Psychological Review, 82, 276–298.
Mackintosh, N. J., & Turner, C. (1971). Blocking as a function of noveltyof CS and predictability of UCS. Quarterly Journal of ExperimentalPsychology, 23, 359–366.
Matzel, L., Brown, A., & Miller, R. R. (1987). Associative effects of USpreexposure: Modulation of conditioned responding by an excitatorytraining context. Journal of Experimental Psychology: Animal BehaviorProcesses, 13, 65–72.
Matzel, L., Schachtman, T., & Miller, R. (1985). Recovery of an over-shadowed association achieved by extinction of the overshadowingstimulus. Learning and Motivation, 16, 398–412.
McCall, R. B. (1970). Fundamentals of statistics for psychology. NewYork: Harcourt Brace Jovanovich.
McLaren, I. P. L., & Mackintosh, N. J. (2000). An elemental model ofassociative learning: I. Latent inhibition and perceptual learning. AnimalLearning & Behavior, 28, 211–246.
Miller, R. R., Hallam, S. C., & Grahame, N. J. (1990). Inflation ofcomparator stimuli following CS training. Animal Learning & Behavior,18, 434–443.
Miller, R. R., & Matute, H. (1996). Biological significance in forward andbackward blocking: Resolution of a discrepancy between animal condi-
19CHALLENGES TO THEORIES OF CLASSICAL CONDITIONING

tioning and human causal judgment. Journal of Experimental Psychol-ogy: General, 125, 370–386.
Miller, R. R., & Matzel, L. (1988). The comparator hypothesis: A responserule for the expression of associations. In G. H. Bower (Ed.), Thepsychology of learning and motivation (Vol. 22, pp. 51–92). Orlando,FL: Academic Press.
Miller, R. R., & Schachtman, T. (1985). Conditioning context as anassociative baseline: Implications for response generation and the natureof conditioned inhibition. In R. R. Miller & N. E. Spear (Eds.), Infor-mation processing in animals: Conditioned inhibition (pp. 51–88). Hills-dale, NJ: Erlbaum.
Miller, R. R., Schachtman, T., & Matzel, L. (1988). [Failure to attenuateblocking by posttraining extinction of a blocking stimulus]. Unpublishedraw data.
North, A. J., & Stimmel, D. T. (1960). Extinction of an instrumentalresponse following a large number of reinforcements. PsychologicalReports, 6, 227–234.
Pavlov, I. (1927). Conditioned reflexes. London: Oxford University Press.Pearce, J., & Hall, G. (1980). A model for Pavlovian conditioning: Vari-
ations in the effectiveness of conditioned but not unconditioned stimuli.Psychological Review, 87, 332–352.
Pineno, O., Urushihara, K., & Miller, R. R. (2005). Spontaneous recoveryfrom forward and backward blocking. Journal of Experimental Psychol-ogy: Animal Behavior Processes, 31, 172–183.
Rescorla, R., & Wagner, A. (1972). A theory of Pavlovian conditioning:Variations in the effectiveness of reinforcement and non-reinforcement.In A. H. Black & W. F. Prokasy (Eds.), Classical conditioning: II.Current research and theory (pp. 64–99). New York: Appleton-Century-Crofts.
Revusky, S. (1971). The role of interference in association over delay. InW. K. Honig & P. H. R. James (Eds.), Animal memory (pp. 155–213).New York: Academic Press.
Savastano, H. I., Arcediano, F., Stout, S. C., & Miller, R. R. (2003).Interaction beween preexposure and overshadowing: Further analysis ofthe extended comparator hypothesis. Quarterly Journal of ExperimentalPsychology: Comparative and Physiological Psychology, 56B, 371–395.
Schmajuk, N. A., Buhusi, C. V., & Gray, J. A. (1998). The pharmacologyof latent inhibition: A neural network approach. Behavioural Pharma-cology, 9, 711–730.
Schmajuk, N. A., Cox, L., & Gray, J. A. (2001). Nucleus accumbens,
entorhinal cortex and latent inhibition: A neural network approach.Behavioral Brain Research, 118, 123–141.
Schmajuk, N. A., Gray, J. A., & Larrauri, J. A. (2005). A preclinical studyshowing how dopaminergic drugs administered during preexposure canimpair or facilitate latent inhibition. Psychopharmacology, 177, 272–279.
Schmajuk, N. A., Lam, Y., & Gray, J. A. (1996). Latent inhibition: Aneural network approach. Journal of Experimental Psychology: AnimalBehavior Processes, 22, 321–349.
Schmajuk, N. A., & Moore, J. (1988). The hippocampus and the classicallyconditioned nictitating membrane response: A real-time attentional-associative model. Psychobiology, 16, 20–35.
Shanks, D. R. (1985). Forward and backward blocking in human contin-gency judgment. Quarterly Journal of Experimental Psychology: Com-parative and Physiological Psychology, 37B, 1–21.
Smith, M., & Gormezano, I. (1965). Effects of alternating classical con-ditioning and extinction sessions on the conditioned nictitating mem-brane response of the rabbit. Psychonomic Science, 3, 91–92.
Sokolov, E. N. (1960). Neuronal models and the orienting reflex. InM. A. B. Brazier (Ed.), The central nervous system and behavior (pp.187–276). New York: Josiah Macy Foundation.
Van Hamme, L., & Wasserman, E. (1994). Cue competition in causalityjudgments: The role of nonpresentation of compound stimulus elements.Learning and Motivation, 25, 127–151.
Wagner, A. (1981). SOP: A model of automatic memory processing inanimal behavior. In N. E. Spear & R. R. Miller (Eds.), Informationprocessing in animals: Memory mechanisms (pp. 5–47). Hillsdale, NJ:Erlbaum.
Ward-Robinson, J., & Hall, G. (1996). Backward sensory preconditioning.Journal of Experimental Psychology: Animal Behavior Processes, 22,395–404.
Wheeler, D. S., Stout, S. C., & Miller, R. R. (2004). Interaction of retentioninterval with CS-preexposure and extinction treatments: Symmetry withrespect to primacy. Learning and Behavior, 32, 335–347.
Williams, B. (1996). Evidence that blocking is due to associative deficit:Blocking history affects the degree of subsequent associative competi-tion. Psychonomic Bulletin & Review, 3, 71–74.
Received October 16, 2004Revision received August 19, 2005
Accepted August 30, 2005 �
20 SCHMAJUK AND LARRAURI