experimental assessment of the gray cast iron production
TRANSCRIPT

EXPERIMENTAL ASSESSMENT OF THE GRAY CAST IRON PRODUCTION BY INOCULANT INJECTION
G. Reyes-Castellanos a, A. Cruz-Ramírez a,*, V. Hugo Gutiérrez-Pérez b,
J. E. Rivera-Salinas c, R. G. Sánchez-Alvarado a, E. Colin-García a
a Instituto Politécnico Nacional – ESIQIE, Metallurgy and Materials Department, Mexico City, Mexico b Instituto Politécnico Nacional – UPIIZ, Profesional Specific Training Department, Zacatecas, Mexico
c Centro de Investigación en Química Aplicada—CIQA, Department of Plastics Transformation Processing, Saltillo, Coahuila, Mexico
(Received 14 April 2020; Accepted 08 December 2020)
Abstract An initial assessment of the gray cast irons production by injecting an inoculant with a conveying gas into a molten iron bath was evaluated at a laboratory scale. A numerical simulation was carried out to determine the hydrodynamic behavior between the inoculant particles injected into the molten iron. It was determined that an optimal interaction between the particles with the molten iron occurred at a lance depth of 7 cm and for the particle sizes fine (211 to 297 μm) and medium (421 to 590 μm), and the residence time was of 0.38 and 0.4 s, respectively. The melting time was calculated at 0.0008 and 0.003 s for the particle sizes fine and medium, respectively. After the injection, the FeSi of the inoculant melted quickly, releasing the elements of the inoculant which interacted with the molten iron and formed oxides and sulfides creating nucleating sites during solidification. The injection technique allowed obtaining a type-A graphite distribution for the fine and medium particle sizes. The number of eutectic cells increased when the inoculant particle size decreased despite of the low graphitisers elements and manganese contents used in the gray cast iron manufacturing. Keywords: Gray iron; Injection; Inoculant; Eutectic cell; Numerical simulation
Corresponding author: [email protected]
Journal of Mining and Metal lurgy, Sect ion B: Metal lurgy
https://doi.org/10.2298/JMMB200414035R
Introduction 1. Gray Cast iron has been produced mainly as a
primary option for multiple automotive components during many decades because of its good properties as castability, machinability, heat conductivity, and vibration damping capacity, in combination with reasonable strength and low total cost of production [1, 2]. A high liquid iron undercooling is required to form small size micro clusters that act as stable homogeneous nuclei for graphite particles; however, such high undercooling is very difficult to achieve in common foundry practices. In gray cast iron, the nucleation of graphite is mainly carried out by inoculation which improves the graphite dispersion, increasing the nucleation of eutectic grains by heterogeneous nucleation [3]. Inoculants are alloys added in small amounts to increase the number of active nuclei for the graphite nucleation and high effective grain refinement is achieved [4, 5]. Inoculants are ferrosilicon alloys that may contain Al,
Ca, Ba, Sr, Zr, and Rare Earths, which are known as inoculant elements that promote and participate in the creation of micron-sized active compounds in the melt, to act as effective graphite nucleation sites [6]. So, inoculants are added to produce heterogeneous nucleation of these graphite flakes and obtain the desired distribution. Improving manufacturing processes for cast iron is always needed and many gray iron studies focused on theories of graphite lamellar nucleation [7, 8], pre-inoculation treatments [8, 9], microstructure and mechanical properties [10-12], and inoculation fading effect [13, 14] have been widely investigated but, few studies have been focused on the inoculant addition method. There are two main methods of inoculation: ladle and late inoculation. In the former case, the inoculant is added either to the liquid iron flow pouring into the ladle or just afterward. Late inoculation refers to treatment after the metal has left the ladle, for example, placing the fine-grain inoculant in the pouring basin (stream inoculation) or by using an insert in the mold down
J. Min. Metall. Sect. B-Metall. 57 (1) (2021) 41 - 51
gating system (in-mold inoculation) [15]. Another method barely explored consists of adding the inoculant powder by a carrier gas into the molten iron. Despite powder injection has become an important tool, metallurgical operations focused primarily on steelmaking processes. The injection efficiency depends mainly on the interaction (solid particle and conveying gas) with the liquid metal [16]. A. Derda and M. Soiński [17] added inoculants to hypo-eutectic gray cast iron by a pneumatic transportation device. They found high effectiveness and stability, based on the silicon composition changes after performing the inoculation through pneumatic injection of the powdered inoculant by argon as a carrier gas into the liquid. Other works related to the powder injection technique are focused on the lead refining process [18-20]. The injection efficiency depends mainly on the flow patterns. Particle concentration is often low; hence, their motion is determined by the fluid flow. However, particle trajectories are very important as they establish the residence time, which represents the time required for the particles leaving the lance tip until they reach the liquid surface. As residence time increases, the injected particles will have more opportunity to react with the metal bath, and higher efficiencies are achieved [18, 19]. The basic requirement for heterogeneous nucleation lies in the ability of the molten iron to wet the inoculant particles. Therefore, a highly effective inoculation is expected by injecting the inoculant by a conveying gas into the molten iron where more intimate contact between the particles and the melt will occur.
This work deals with the manufacturing of gray iron through the injection of a powder commercial inoculant with argon as conveying gas. The operational injection parameters of the physical trials were set by a computational fluid dynamics (CFD) and particle tracing study, where the residence time as a function of the lance depth was determined while compared with the theoretical melting time. The gray cast iron produced was characterized by microscopy techniques to determine the graphite flake features based on the standard ASTM A247 as well as the eutectic cell characteristics.
Experimental procedure 2.
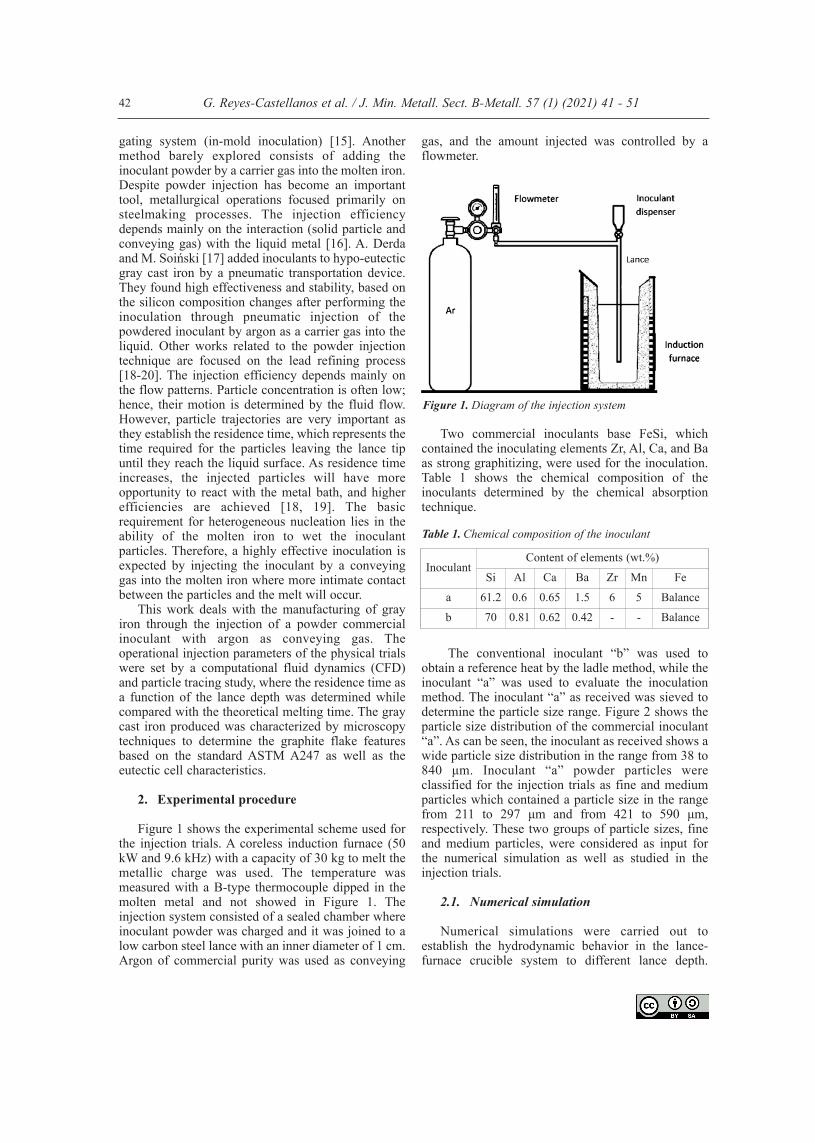
Figure 1 shows the experimental scheme used for
the injection trials. A coreless induction furnace (50 kW and 9.6 kHz) with a capacity of 30 kg to melt the metallic charge was used. The temperature was measured with a B-type thermocouple dipped in the molten metal and not showed in Figure 1. The injection system consisted of a sealed chamber where inoculant powder was charged and it was joined to a low carbon steel lance with an inner diameter of 1 cm. Argon of commercial purity was used as conveying
gas, and the amount injected was controlled by a flowmeter.
Two commercial inoculants base FeSi, which contained the inoculating elements Zr, Al, Ca, and Ba as strong graphitizing, were used for the inoculation. Table 1 shows the chemical composition of the inoculants determined by the chemical absorption technique.
The conventional inoculant “b” was used to obtain a reference heat by the ladle method, while the inoculant “a” was used to evaluate the inoculation method. The inoculant “a” as received was sieved to determine the particle size range. Figure 2 shows the particle size distribution of the commercial inoculant “a”. As can be seen, the inoculant as received shows a wide particle size distribution in the range from 38 to 840 μm. Inoculant “a” powder particles were classified for the injection trials as fine and medium particles which contained a particle size in the range from 211 to 297 μm and from 421 to 590 μm, respectively. These two groups of particle sizes, fine and medium particles, were considered as input for the numerical simulation as well as studied in the injection trials.
Numerical simulation 2.1.
Numerical simulations were carried out to
establish the hydrodynamic behavior in the lance-furnace crucible system to different lance depth.
G. Reyes-Castellanos et al. / J. Min. Metall. Sect. B-Metall. 57 (1) (2021) 41 - 51 42
Figure 1. Diagram of the injection system
Table 1. Chemical composition of the inoculant
InoculantContent of elements (wt.%)
Si Al Ca Ba Zr Mn Fea 61.2 0.6 0.65 1.5 6 5 Balanceb 70 0.81 0.62 0.42 - - Balance

Velocity fields computed were used to determine the particle motion for particles in the presence of an external field and to find the residence time of the particles injected into the liquid iron. The numerical simulation was carried out on the CFD´s module of Comsol Multiphysics software [21]. The hydrodynamic behavior of the gas-liquid was obtained with the continuity (Eq. 1) and Navier-Stokes equations (Eq. 2), whereas the tracking of the interface for the two-phase flow gas-liquid was obtained by using the phase-field method. In the solution domains, the continuity and momentum equations in the usual form were considered:
(1)
(2) Where σ1 is a deviatoric stress tensor and the field
variables, velocity u, and pressure p. The evolution of the interface was controlled by the phase-field variable (f) of the Cahn-Hilliard equation (Eq.3).
(3)
Where F/f = G is the chemical potential (Pa) and g is the mobility (m3s kg-1). Turbulence variables were obtained by the standard k model, whereas the particle trajectories were described based on the Newton´s second law with a drag force estimated using the empirical equation proposed by Khan and Richardson [22]. Particles were considered to be spherical in shape. Detailed information about the mathematical model and numerical issues can be found in [18, 22], where the same methodology was used to study the flow patterns (at lab scale) obtained during the lead and aluminum refining processes by silver and magnesium particle injection, respectively. The numerical simulation was carried out in two dimensions and the lance was located at the centerline of the furnace crucible, as can be seen in Figure 3 where the boundary conditions are also shown.
The experimental conditions and the relevant physical data used for the CFD study are given in Table 2. The numerical modeling was carried out considering that the system was isothermal at the temperature of 1450 °C. The gas velocity was determined by preliminary injection trials considering enough gas flow rate. This allowed the powder inoculant to be projected with enough kinetic energy, with the aim to overcome the liquid iron surface tension, and the particles penetration into the molten bath. The depth to which the lance was submerged varied at 3, 7, and 9 cm from the liquid bath free-surface. The previous was done to study the effect of gas injection depth on the hydrodynamic behavior, and the residence time of fine and medium size particles, injected independently. Based on the simulation results, the better lance depth was chosen for the experimental injection trials.
a) Values reported at 1450 °C [23, 24]
Melting time determination 2.2. The residence time, determined in the numerical
simulation, was complemented with the melting time calculation to understand the interaction between the
G. Reyes-Castellanos et al. / J. Min. Metall. Sect. B-Metall. 57 (1) (2021) 41 - 51 43
u
u u
0
1 ut
p
u
tF
Figure 2. Particle size distribution of the inoculant “a” Figure 3. Schematic diagram of the lance-furnace crucible
system and boundary conditions
Table 2. Parameters considered in the numerical simulation
Furnace crucible dimensions (m)
Diameter 0.12Height 0.28
8 kg iron bath (m) Bath height 0.105Lance dimensions
(m)Diameter 0.01Length 0.5
a)Density (Kg m–3)
Gray Iron 6725Argon 1.664
a)Viscosity (Pa s) Gray Iron 0.0089Argon 2.31E-05
a)Surface tension coefficient (N m–1)
Gray Iron 0.914Argon -
Gas velocity (m s–1) Argon 2.122

inoculant particles and the molten iron bath. The melting rate was determined by the relative magnitude of the resistance to transfer heat from the surrounding to the solid metal. Considering the energy balance, the rate at which heat was transferred from the environment to the solid was equal to the rate of absorption of the latent heat of fusion [19]. The environment was considered as semi-infinite because the temperature gradient in the environment was negligible [25]. The time required for the full melting of a sphere in a semi-infinite medium can be calculated with equation (4) [25].
(4)
Where: R is the radius of the sphere, TO is the initial temperature of the medium; TM represents the metal melting temperature; ρs is the density of solid; ΔHs is the latent fusion heat; km represents the thermal conductivity of the medium; Cpm is the heat capacity of the medium: ρm is the density of the medium; tf represents the melting time, and n is the form factor in heat conduction which is 2 for a sphere. For this analysis, the molten iron represented the medium and the inoculant particles, the solid.
Table 3 shows the parameters considered for the melting time determination.
Injection trials 2.3. Four heats (designated as A, B, C, and D) of gray
iron of 8 kg each were produced in an induction furnace. The base iron was prepared with gray iron scrap, low C steel, pig iron, FeSi, and high purity carbon riser to adjust the chemical composition. Table 4 shows the experimental conditions of the inoculants for the gray cast iron produced.
40 g of the commercial inoculant was used for inoculation (0.5 wt % of the mass charge) for the injection trials. The first heat (Heat A) was inoculated by the common ladle method using a higher amount (1.0 wt % of the mass charge) of a conventional inoculant (FeSi alloy - Ca-Al-Ba), while the other three were inoculated by injecting a lower amount of a more effective inoculant (FeSi alloy - Ca-Al-Ba-Zr-Mn) through an argon flow as conveying gas, using the experimental array depicted in Figure 1. Heats A and B were carried out by the particle size of the inoculant as received which comprised a wide particle size range, while for heats C and D, the particle size range was narrowed. The injection trials were carried as follows: 40 g of the inoculant as received, which included fine and medium particle size, were placed in the powder dispenser, and after reaching 1450 °C in the liquid bath, the induction furnace was shut down and then the lance was introduced into the iron bath. The valves of the injection system were opened and the inoculant was injected into the iron bath by an argon flow. After 7 s, the lance was taken away and immediately, the molten metal was transferred to a preheated ladle and then poured into green sand molds previously prepared. The following experimental parameters were kept constant during injection trials: bath temperature 1450 °C, the distance between the lance and the liquid surface 7 cm, argon gas flow rate 10 L min-1 and injection time 7 s.
Figure 4 shows the pattern used for the preparation of green sand molds, where the dimensions of the plates were 120 x 40 mm and the thickness ranged from 25.4 to 4.23 mm. The microstructural analysis was carried out to the cast plates of 12.7 and 25.4 mm of thickness for the four heats produced.
The nominal chemical composition of the four castings was analyzed by an Oxford spark emission optic spectrograph. C and S values were obtained with a LECO Carbon/Sulfur analyzer.
Samples from the as-cast plates of 12.7 and 25.4 mm thickness were obtained and the microstructural analysis was carried out by standard metallography and the optical microscope Olympus PMG-3 model. Unetched microstructure was used to evaluate the graphite flake morphology at 100x, according to the standard ASTM A247, to evaluate the size and
G. Reyes-Castellanos et al. / J. Min. Metall. Sect. B-Metall. 57 (1) (2021) 41 - 51 44
R T TH
k C t nkRtM O
S Sm pm m f
mf3
22
1 2 1 2
/ /
Radius of the particle R (μm) 125, 250Melting temperature of the inoculant TM (°C) 1 320
Temperature of the medium TO (°C) 1 450Density of the inoculant ρS (kg m-3) 2 800Latent fusion heat of the inoculant ΔHS (kJ kg-1) 839.497
Thermal conductivity of the medium km (W m-1 °C-1) 40
Heat capacity of the medium Cpm (J kg-1 °C-1) 1 047
Density of the medium ρm (kg m-3) 6 725Melting time tf (s) -Form factor in heat conduction n 2
Table 3. Parameters considered for the melting time calculation [23-26]
Table 4. Experimental conditions of the inoculants for the gray cast irons produced
HeatInoculant amount (wt %)
Particle size range (μm)
Inoculating method
A 1 As received (38 – 840) By ladleB 0.5 As received (38 – 840) Gas injectionC 0.5 Fine (211 – 297) Gas injectionD 0.5 Medium (421 – 590) Gas injection

distribution of the graphite flakes. The graphite length was determined by the software Carnoy 2.0, by selecting randomly thirty graphite flakes of three different regions for each heat and thickness. The eutectic cell size was measured according to the procedure reported by Fras and López [27] after etching the samples with Stead’s reagent (2.5 g CuCl2, 10 g MgCl2, 5 ml HCl, 250 ml ethanol) during 2.5 hours. Etched microstructures were obtained with 3% nital, and phase volume fraction measurements including graphite, pearlite, ferrite, and carbides were carried out using the image-analyzer with the software Image J 4.1. Carbides were revealed by etching 2 min with a water solution of ammonium persulfate (10% vol) [28]. Finally, four different fields of the samples were considered in the microstructural examination.
Results and discussion 3.Numerical simulation 3.1.
Figures 5, 6, and 7 show the injected inoculant
particles into the molten iron at different lance deeps of 3, 7 and 9 cm. Injection rate was 2.12 m s-1 and two particles range size were used independently (250 μm and 500 μm). Every image contained in Figures 5 to 7 shows the time proceeded after injection begun.
It can be observed from figures 5 to 7 that at the beginning of the injection, the argon jet containing the inoculant particles expanded rapidly and penetrated only a specific distance into the molten iron before rising vertically. As time proceeded, the bubble grew until it reached a size where the buoyancy forces exceeded the surface tension forces and detachment occured. For longer times, when gas bubbles passed continuously through a free surface and then bursted,
this process was accompanied by jets shooting up, after jets reached their peak height and fell due to gravity, oscillations on the free surface were induced causing its deformation by the wave propagation. Thus, the dynamics of the free surface in this stage produced the formation of droplets through way of jet drops and the bursting of the gas bubble. From figure 5 it is observed that when the lance deep was at 3 cm, the inoculant particles penetrated only a very short distance into the molten iron and the particles reached the molten iron surface very quickly, then most of the particles left the molten bath without reacting,
G. Reyes-Castellanos et al. / J. Min. Metall. Sect. B-Metall. 57 (1) (2021) 41 - 51 45
Figure 4. Pattern which contains 6 plates of 120 x 40 mm and a thickness ranging from 25.4 to 4.23 mm
Figure 5. Injected particles for a lance depth of 3 cm for different injection times to a) 250 μm and b) 500 μm particle sizes. The residence time is 0.16 s for both particle sizes
Figure 6. Injected particles for a lance depth of 7 cm for a) 250 μm and b) 500 μm particle sizes. The residence time is 0.38 and 0.4 s, respectively

decreasing the inoculant efficiency. Then, a marked effect was not observed when the particle size was incremented from fine to medium size. When the lance depth was increased to 7 cm (Figure 6), a better interaction of the particles with the molten iron regarding a lance depth of 3.0 cm was observed. During injection, some particles were agglomerates; this effect was most clearly observed when the particle size was incremented, as was reported previously [29]. As the lance depth increased until it reached 9 cm, the turbulence increased in the molten iron during the injection process, increasing the interaction between the inoculant particles and the liquid iron; however, the higher turbulence formed produces molten metal splashing that reached the upper part of the induction furnace which caused loss of material and of course, a dangerous working condition during the gray iron fabrication. The residence time indicated the time when the particles left the nozzle until a particle reached the liquid surface. From figures 5 to 7, the residence time was determined at 0.16, 0.38, and 0.48 s for the fine particles (211 to 297 μm) for a lance depth of 3, 7, and 9 cm, respectively. When the particle size increased to medium size (421 to 590 μm), the residence time was determined at 0.16, 0.40, and 0.50 s for a lance depth of 3, 7, and 9 cm, respectively. Therefore, the residence time increased when the lance depth and the particle size increased, which contributed to deeper penetration of the inoculant particles. Results from Figure 5 to 7 can be summarized as follows. When both the particle size and lance depth increased, for a fixed gas flow rate; the largest path followed by the particles within the lance in connection with its bigger particle size, allowed for the particles to preserve their
momentum when discharged. These promoted the breakup of the gas-liquid interface, letting particles descend through the liquid more easily. Hence, particle trajectories inside the molten, during its rise to the liquid free surface were larger, giving more opportunity to the particles to interact with the molten.
According to the hydrodynamic behavior, as well as the particle residence time showed in figures 5 to 7, the optimal interaction between the inoculant particles and the molten iron occurred at a lance depth of 7 cm. This lance depth was used during the experimental injection trials.
Melting time 3.2.
Inoculants are added to the melt at a high
superheat and they dissolve quickly after the addition. Wang et al [30] showed that ferrosilicon particles would reach the temperature of the melt within a fraction of a second. The melting time was calculated by applying the equation (4) and data reported in Table 3. The melting point of the inoculant used at the injection trials was 1320 °C and it was added into molten iron at 1450 °C. For the 250 μm (R = 0.000125 m) in diameter particle size, equation (5) is obtained:
(5)
The melting time was calculated by solving numerically the nonlinear equation (5). So, tf, the melting time for the 250 μm in diameter particles was 0.0008 s. For the 500 μm the melting time was 0.003 s. These calculated times represented the melting times for the fine (211 to 297 μm) and medium (421 to 590 μm) particle sizes, respectively. Figure 8 shows the relationship between the residence and melting times with the particle size.
It is observed in Figure 8 that the melting time increased when the particle size increased. Two regions were observed in Figure 8 (I and II), the first region represented the particle size range evaluated in this work, while the second region represented commercial inoculants with bigger particle size between 591 and 3000 μm that were used at industrial furnaces. Figure 8 also shows the residence time evaluated for the two particle sizes and three different injection depths. Thus, the inoculant was added to the iron bath and it quickly melted; however, the inoculating elements contained in the inoculant interacted with the oxygen and sulfur in the melt to form oxides and sulfides that allowed the graphite nucleation during solidification. The interaction between the inoculating elements with the iron bath was longer as the residence time was increased. Experiments showed that the formation of oxides/sulfides at a certain temperature in the melt or during solidification depended on the concentration of
G. Reyes-Castellanos et al. / J. Min. Metall. Sect. B-Metall. 57 (1) (2021) 41 - 51 46
Figure 7. Injected particles for a lance depth of 9 cm for a) 250 μm and b) 500 μm particle sizes. The residence time is 0.48 and 0.5 s, respectively
x4 1667 10. 5 2 3 1 21 7697 10 1 0473 10. . /x t x tf f

the deoxidizers (Al, Sr, Ca, etc.) and the sulfide forming elements (Ca, Mo, Mn, etc.) contained in the inoculant [31].
Injection trials 3.3. Table 5 shows the nominal chemical composition
of the inoculated gray irons produced. The results represent the average of five measurements. The carbon equivalent value (CE) is also reported showing that heats fabricated corresponded to hypo-eutectic gray irons.
The manganese and sulfur contents were kept low for the castings produced while the silicon content was also kept low for the castings B, C, and D. A low ability of graphitization of the produced castings due to the low amount of (Si, S, P), and manganese used in the chemical composition was expected. Therefore, the obtained graphite features and microstructural characteristics were mainly attributed to the
inoculation method and the inoculant used. Heat A was produced by a conventional ladle process with a higher inoculating amount (1.0 wt %), while the other heats were produced by the injection process with a lower inoculant (0.5 wt %) and graphitizing elements to enhance the injection process on the graphite flake formation. However, the castings produced are in the range of chemical composition for typical unalloyed cast irons [32].
The metallurgical microstructures of the produced gray cast iron are shown in Figures 9 and 10 for the sample thickness 12.7 and 25.4 mm, respectively. It is observed from Figure 9 that heat A showed a random distribution of uniform size flakes which was considered as a type-A graphite distribution based on the standard ASTM A247. This type of graphite is wanted in most of the cast iron applications. Heat B presented a type-E graphite distribution considered as an undesired distribution with preferred orientation and segregation of the graphite flakes. The heats C and D produced by injecting fine and medium inoculant particle size presented a type-A graphite distribution. It is observed that heat C contained a higher amount of graphite flakes than heat D and also the flakes were shorter in length.
The microstructural results were very similar when the sample thickness increased from 12.7 to 25.4 mm for all heats, as can be observed in Figure 10. The main difference between the microstructures obtained with a higher thickness was that the graphite flakes were longer and in a lower amount than those obtained for the thinnest thickness. Heat B showed a type-E graphite distribution for both thickness, this heat was manufactured by injecting the inoculant with the particle size as received. As it is shown in figure 2, the wide distribution of fine, medium and coarse particles reduced the effect of the inoculant, the coarsest particles presented an agglomeration while the finest particles easily floated, both behaviors aided
G. Reyes-Castellanos et al. / J. Min. Metall. Sect. B-Metall. 57 (1) (2021) 41 - 51 47
Figure 8. Melting and residence times for inoculant particles of different sizes in molten iron
Figure 9. Unetched microstructure for the 12.7 mm thickness plates of heats A, B, C, and D
Table 5. Chemical composition of the fabricated heats
Element HeatWt. % A B C D
C 2.98 2.89 2.91 2.96Si 2.25 1.73 1.28 1.2
Mn 0.174 0.282 0.411 0.439P 0.026 0.031 0.02 0.02S 0.022 0.028 0.032 0.038Ni 0.015 0.037 0.015 0.013Al 0.005 0.013 0.004 0.003Zr <0.001 0.013 0.021 0.017CE 3.74 3.48 3.41 3.43
CE: Carbon equivalent. CE = %C + 1/3%Si + 1/3%P Balance Fe

to have a low efficiency during inoculation. Table 6 summarizes the graphite flake features according to the standard ASTM A247.
It is observed from Table 6 that heat A was considered as a reference that presented the highest volume fraction of graphite for both thicknesses, followed by heat C, which presented 13.39 % of graphite in the plate of 12.7 mm. It has been reported [11] that the graphite flake volume varied from 11 to 16 % for hypo-eutectic gray cast irons with high carbon equivalent. Heat B showed the lowest volume fraction, followed by heat D. Heat B and D contained the biggest particle sizes and during the injection trials the particles were easily agglomerated aided by the hydrodynamics of the injection process; thus, an important amount of unreacted inoculant was removed before tapping the iron to the molds, decreasing the volume fraction of formed graphite. Therefore, the injection process required a fine particle size to have an adequate interaction with the molten iron to obtain a high volume fraction of graphite and a type-A graphite distribution. Despite, heats C and D presented the desired type-A graphite distribution with shorter flakes even considering the lowest silicon, manganese, and carbon contents used in the iron chemical composition.
Stead´s reagent was used to reveal the eutectic cells in gray iron. The size and number of eutectic cells directly reflected the refinement of eutectic grains. Figures 11 and 12 show the eutectic cell features for the thickness of the samples of 12.7 and 25.4 mm, respectively. The number of eutectic cells mm-2 is summarized in Table 7.
The features of the eutectic cells were influenced by the chemical composition and the inoculation technique. Carbon and silicon had important effects on the number of eutectic cells, as the chemical composition of the iron approached the eutectic point, the number of eutectic cells increased [32]. The chemical composition of the produced gray cast irons was far from eutectic with an equivalent carbon of 3.44 in average for the heats produced by the injection technique. In such a way, the eutectic cell count was mainly aided by the inoculation technique. It is evident from Figures 11 and 12, and Table 7 that the number of eutectic cells increased when the thickness decreased due to a higher cooling rate than thicker samples. Heat C produced by injecting the fine size
G. Reyes-Castellanos et al. / J. Min. Metall. Sect. B-Metall. 57 (1) (2021) 41 - 51 48
Figure 10. Unetched microstructure for the 25.4 mm thickness plates of heats A, B, C, and D
Figure 11. Eutectic cells for the 12.7 mm thickness plates of heats A, B, C, and D
Figure 12. Eutectic cells for the 25.4 mm thickness plates of heats A, B, C, and D
Heat Thickness (mm)
Graphite (%)
Flakes length (μm)
Graphite distribution
A 12.7 16.06 104.7 A25.4 16.45 118.6 A
B 12.7 11.15 68.19 E25.4 11.85 82.94 E
C 12.7 13.39 61.68 A25.4 11.88 73.91 A
D 12.7 13.21 70.44 A25.4 10.8 80.06 A
Table 6. Graphite features of the fabricated gray irons.

particles allowed obtaining the highest number of eutectic cells. The inoculant injected as fine particle size provided more nucleation sites improving the graphitization of the melt. For the developed injection trials, the number of eutectic cells decreased as the particle size of the inoculant increased. A more refined microstructure was obtained when the number of eutectic cells increased and the mechanical properties of the cast irons were enhanced [4, 33].
Figures 13 and 14 show the etched microstructure of heats produced for the thickness of the samples of 12.7 and 25.4 mm, respectively. It is observed that the cast iron matrix after inoculation treatment was fully pearlitic with very few amounts of ferrite and carbides.
The low amount of graphitiser elements (Si, P, and S) and the manganese content in the heats allowed obtaining a high amount of pearlite in the cast iron matrix. It is observed that the pearlite was finer for the 12.7 mm thickness plates because of a higher cooling rate than the 25.4 mm samples. The samples were etched with ammonium persulfate to reveal white regions attributed to carbides as cementite for the developed castings. In general, a low amount of cementite for the produced heats for both thickness was observed and Figure 15 only presents the results for the C and D heats for both thickness evaluated.
Also, it is shown that the amount of cementite slightly increased when the thickness of the casting decreased. Table 8 shows the volume fraction of phases formed in the heats produced.
The inoculating by the injection technique allowed obtaining an adequate graphite flake formation and together with the used inoculant, the free carbides
G. Reyes-Castellanos et al. / J. Min. Metall. Sect. B-Metall. 57 (1) (2021) 41 - 51 49
Table 7. Eutectic cells for the heats produced
Heat Thickness (mm) Eutectic cells (cell mm-2)A 12.7 9.37
25.4 7.25B 12.7 9.5
25.4 7.5C 12.7 14.1
25.4 11.9D 12.7 10.4
25.4 8
Figure 13. Etched microstructure for the 12.7 mm thickness plates of heats A, B, C, and D
Figure 14. Etched microstructure for the 25.4 mm thickness plates of heats A, B, C, and D
Figure 15. Etched microstructure with ammonium persulfate reveals the cementite phase (white regions) of heats C and D for the thickness of a) 12.7 mm, and b) 25.4 mm
Table 8. Volume fraction of phases formed
Heat Thickness (mm)
Graphite (%)
Pearlite (%)
Ferrite (%)
Cementite (%)
A 12.7 16.06 83.63 0 0.3125.4 16.45 83.29 0.26 0
B 12.7 11.15 88.65 0 0.225.4 11.85 87.98 0.17 0
C 12.7 13.39 85.76 0 0.8525.4 11.88 87.39 0 0.73
D 12.7 13.21 85.9 0 0.8925.4 10.8 88.45 0 0.75

formation was avoided. As a result, a lower amount of ferrite was obtained resulting in a fully pearlitic matrix. The inoculation technique promoted high eutectic cell count, with favorable graphite features, and consequently, a high amount of pearlite was obtained for the low inoculant addition.
Conclusions 4.
Gray cast irons were produced by injecting a
powder inoculant with argon as a conveying gas into a molten iron bath. The results obtained are summarized as follows:
1. Despite the low graphitisers elements and manganese contents in the gray cast iron, it was possible to obtain a type-A graphite distribution for the particle sizes fine (211 to 297 μm) and medium (421 to 590 μm).
2. The number of eutectic cells increased when the inoculant particle size and the casting thickness decreased.
3. The hydrodynamic behavior and particle paths of the inoculant particles injected into molten iron with a conveying gas were determined by numerical simulation.
4. The particles residence time was determined as a function of different lance depth and particle sizes where an optimal interaction between the inoculant particles and the molten iron occurred at a lance depth of 7 cm.
5. The inoculant injected into the iron bath quickly melted based on the melting time determination and then, the inoculating elements (Ca, Al, Mn, Zr, and Ba) were released to form oxides and sulfides that had adequate interaction with the iron bath based on the hydrodynamic behavior and the residence time.
6. The injection technique and the used inoculant promoted adequate graphite features that led to lower amounts of undercooled graphite, free cementite, and ferrite phase which could represent an attractive option for the production of gray cast iron.
Acknowledgments The authors thank the Institutions CONACyT, SNI,
and SIP-Instituto Politécnico Nacional for their assistance to the Process Metallurgy Group at ESIQIE-Metallurgy and Materials Department.
References
[1] G. Wang, X. Chen, Y. Li, Z. Liu, Materials (Basel), 11 (10) (2018).
[2] I. Riposan, M. Chisamera, S. Stan, ISIJ Int., 53 (10) (2013) 1683–1695.
[3] I. Minkoff, The Physical Metallurgy of Cast Iron. John Wiley and Sons Ltd., Norwich, England, 1983.
[4] D. Kopyciński, J. Dorula, EPD Congr. 2016, February 14-18, Nashville, USA, 2016, p. 135–142.
[5] S. Stan, M. Chisamera, I. Riposan, M. Barstow, J. Therm. Anal. Calorim., 110 (3) (2012) 1185–1192.
[6] I. Riposan, M. Chisamera, S. Stan, J. Therm. Anal. Calorim., 132 (2018) 1017-1028.
[7] I. Riposan, M. Chisamera, S. Stan, D. White, China Foundry, 6 (4) (2009) 352–357.
[8] N. Arab, Arch. Foundry Eng., 17 (4) (2017) 185–189. [9] W. Xue, Y. Li, J. Alloys Compd., 689 (2016) 408-415. [10] X. Ding, X. Li, Q. Feng, W. Matthias, S. Huang, Int. J.
Miner. Metall. Mater., 24 (8) (2017) 884–890. [11] A. Vadiraj, G. Balachandran, M. Kamaraj, Mater. and
Design, 30 (2009) 4488-4492. [12] M. Chisamera, S. Stan, I. Riposan, G. Grasmo, C.
Hartung, Int. J. of Cast Metal. Res., 24 (6) (2011) 363-369.
[13] H. González, P. Espitia, R. Sierra, Rev. Mater., 22 (2) (2017).
[14] M. Soíski, A. Wawrzyniec, Arch. Foundry Eng., 10 (2) (2010) 155-158.
[15] J. R. Brown, in Foseco Ferrous Foundryman’s Handbook. Ed. Butterworth-Heinemann, Great Britain, 2000, p. 62-69.
[16] T. Emi, H. Yin, The Howard Worner International Symposium on Injection in Pyrometallurgy, July 1-3, Melbourne Australia, 1996, p. 19-38.
[17] A. Derda-Slęzak, M. Soíski, Arch. Foundry Eng., 14 (1) (2014) 29–32.
[18] P. Gutiérrez, M. Vargas, A. Cruz, J. Romero, J. Rivera, Mater. Res., 17 (4) (2014) 838–850.
[19] P. Gutiérrez, A. Cruz, M. Vargas, E. Palacios, R. Sánchez, Trans. of Nonferrous Met. Soc. China (English Ed.), 24 (2) (2014) 544–552.
[20] P. Gutiérrez, A. Cruz, J. Romero, J. Rivera, Russ. J. Non-Ferrous Met., 56 (3) (2015) 251–260.
[21] COMSOL Multiphysics, User’s Guide, version 5.2a, Comsol Inc., 2016 (License number: 3075805).
[22] J. Rivera, V. Gutiérrez, M. Vargas, K. Gregorio, A. Cruz, F. Avalos, J. Ortíz, J. Escobedo. Mater. Res., 17 (6) (2014) 1550-1562.
[23] J. Valencia, P. Quested, in ASM Handbook, Volume 15, Casting, ASM International, 2008, p. 468–481.
[24] Cast Metals Handbook, 4th ed., American Foundrymen´s Society, Des Plaines, Illinois, 1957. p. 139-140.
[25] D. Gaskell, An Introduction to Transport Phenomena in Materials Engineering, 2nd Ed., Macmillan Publishing Company, New Jersey, 1992, p. 401-416.
[26] Technical Data Inoculant IM22, Italmagnesio, 2004. [27] E. Fraś, H. López, Int. J. Met., 4 (3) (2010) 35–61. [28] D. Pedro, R. Dommarco, Wear, 418-419 (2019) 94-101. [29] D. Langberg, M. Nilmani, Metall. Mater. Trans. B, 25
(5) (1994) 653–660. [30] C. Wang, H. Fredriksson, in 48th International Foundry
Congress, October 1-7, Varna, Bulgaria, 1981, p. 16.
G. Reyes-Castellanos et al. / J. Min. Metall. Sect. B-Metall. 57 (1) (2021) 41 - 51 50

[31] H. Muhmond, H. Fredriksson, Metall. Mater. Trans. B, 44B (2013) 286-298.
[32] D. Stefanescu, in ASM Handbook, Volume 1, Properties and Selection: Irons, Steels, and High-Performance
Alloys, ASM International, 2005, p. 16-88. [33] M. Chisamera, I. Riposan, S. Stan, C. Militaru, I.
Anton, M. Barstow, J. of Mater. Engineering and Performance, 21 (3) (2012) 331-338.
G. Reyes-Castellanos et al. / J. Min. Metall. Sect. B-Metall. 57 (1) (2021) 41 - 51 51
EKSPERIMENTALNA PROCENA PROIZVODNJE SIVOG LIVENOG GVOŽĐA POSTUPKOM UBRIZGAVANJA INOKULANATA
G. Reyes-Castellanos a, A. Cruz-Ramírez a,*, V. Hugo Gutiérrez-Pérez b,
J. E. Rivera-Salinas c, R. G. Sánchez-Alvarado a, E. Colin-García a
a Nacionalni politehnički institut – ESIKIE, Odeljenje za metalurgiju i materijale, Meksiko Siti, Meksiko b Nacionalni politehnički institut – KUPIIZ, Odeljenje za stručno usavršavanje, Zacatecas, Meksiko
c Centar za istraživanje primenjene hemije – CIQA, — CIKA, Odeljenje za preradu plastike, Saltillo, Coahuila, Meksiko
Apstrakt Inicijalna procena proizvodnje sivog livenog gvožđa postupkom ubrizgavanja inokulanata sa transportnim gasom u kalupu sa rastopljenim gvožđem je izvršena u laboratorijskim razmerama. Izvedena je numerička simulacija da bi se utvrdilo hidrodinamičko ponašanje čestica inokulanata ubrizganih u rastopljeno gvožđe. Utvrđeno je da se optimalna interakcija čestica i rastopljenog gvožđa dogodila na dubini od 7 cm za fine (211-297 μm) i srednje (421-590 μm) čestice, a vreme zadržavanja je iznosilo 0,38 s za fine i 0,4 s za srednje čestice. Vreme topljenja za fine čestice je iznosilo 0,0008 s, a za srednje čestice je iznosilo 0,003 s. Nakon ubrizgavanja FeSi inokulant se brzo istopio i oslobodio elemente inokulanta koji su stupili u interakciju sa rastopljenim gvožđem i formirali okside i sulfide stvarajući mesta nukleacije tokom očvršćavanja. Tehnika ubrizgavanja je omogućila dobijanje grafita tipa A zbog interakcije sa finim i srednjim česticama. Broj eutektičkih ćelija se povećao kada se veličina čestica inokulanta smanjila uprkos manjim količinama elemenata za grafitizaciju i sadržaju mangana koji se koriste u proizvodnji sivog livenog gvožđa. Ključne reči: Liveno gvožđe; Ubrizgavanje; Inolkulant; Eutektička ćelija; Natematička simulacija