experimental and numerical …segim.northwestern.edu/docs/internal-reports/ashari...marco salviato,...
TRANSCRIPT

Center for Sustainable Engineering of Geological and Infrastructure Materials (SEGIM)
Department of Civil and Environmental Engineering
McCormick School of Engineering and Applied Science
Evanston, Illinois 60208, USA
EXPERIMENTAL AND NUMERICAL INVESTIGATION OF
INTRA-LAMINAR ENERGY DISSIPATION AND SIZE EFFECT IN
TWO-DIMENSIONAL TEXTILE COMPOSITES
Marco Salviato, Kedar Kirane, Shiva Esna Ashari, Zden
ˇ
ek Ba
ˇ
zant,
Gianluca Cusatis
SEGIM INTERNAL REPORT No. 16-05/707E
Submitted to Composites Science and Technology May 2016

Experimental and Numerical Investigation of Intra-Laminar Energy
Dissipation and Size E↵ect in Two-Dimensional Textile Composites
Marco Salviatoa, Kedar Kiraneb, Shiva Esna Asharib, Zdenek Bazantb, Gianluca Cusatisb,⇤
aDepartment of Aeronautics and Astronautics, University of Washington, Seattle, WA 98195, USA
bDepartment of Civil and Environmental Engineering, Northwestern University, Evanston, IL 60208, USA
Abstract
Design of large composite structures requires understanding the scaling of their mechan-ical properties, an aspect often overlooked in the literature on composites.
This contribution analyzes, experimentally and numerically, the intra-laminar size e↵ectof textile composite structures. Test results of geometrically similar Single Edge Notchedspecimens made of [0�]
8
epoxy/carbon twill 2⇥2 laminates are reported. Results show thatthe nominal strength decreases with increasing specimen size and that the experimentaldata can be fitted well by Bazant’s size e↵ect law, allowing an accurate identification of theintra-laminar fracture energy of the material, Gf .
The importance of an accurate estimation of Gf in situations where intra-laminar frac-turing is the main energy dissipation mechanism is clarified by studying numerically its e↵ecton crashworthiness of composite tubes. Simulations demonstrate that, for the analyzed ge-ometry, a decrease of the fracture energy to 50% of the measured value corresponds to analmost 42% decrease in plateau crushing load. Further, assuming a vertical stress drop af-ter the peak, a typical assumption of strength-based constitutive laws implemented in mostcommercial Finite Element codes, results in an strength underestimation of the order of 70%.
The main conclusion of this study is that measuring accurately fracture energy and mod-eling correctly the fracturing behavior of textile composites, including their quasi-brittleness,is key. This can be accomplished neither by strength- or strain-based approaches, which ne-glect size e↵ect, nor by LEFM which does not account for the finiteness of the FractureProcess Zone.
Keywords: A. Textile Composites, B. Non-Linear Fracture Mechanics, C. Damage
Mechanics, D. Size e↵ect, E. Two-dimentional composites, F. Microplane model.
1. Introduction
Thanks to their outstanding specific mechanical properties, the engineering use of textile
composites is becoming broader and broader. Current applications include land, marine and
⇤Corresponding Author,Email address: [email protected] (Gianluca Cusatis)
Preprint submitted to Composites Science and Technology May 19, 2016

air transportation, wind and tidal energy production, and blast protection of civil infrastruc-
tures and vehicles [1–3]. However, design of large composite structures requires capturing
the scaling of their mechanical properties, an aspect often overlooked in the literature on
composites. This can be achieved only by abandoning the current design paradigm, which
relies on strength-based approaches incapable of predicting any scaling, and acknowledging
the quasibrittle character of these materials.
Due to the complex mesostructure characterizing textile composites (and other quasib-
rittle materials such as concrete, nanocomposites, ceramics, rocks, sea ice, and many bio-
materials, just to mention a few), the size of the non-linear Fracture Process Zone (FPZ)
occurring in the presence of a large stress-free crack is usually not negligible [4–6]. The stress
field along the FPZ is nonuniform and decreases with crack opening, due to discontinuous
cracking, crack bridging by fibers, and frictional pullout of inhomogeneities. As a conse-
quence, the fracturing behavior and, most importantly, the energetic size e↵ect associated
with the given structural geometry, cannot be described by means of the classical Linear
Elastic Fracture Mechanics (LEFM). To capture the e↵ects of a finite, non-negligible FPZ,
the introduction of a characteristic (finite) length scale related to the fracture energy and the
strength of the material is necessary [4, 7]. However, estimating accurately these material
properties is far from easy because the fracture tests usually exhibit an extreme snap-back
at peak load, with a loss of stability [7, 8].
A possible way to overcome these issues is size e↵ect testing [4, 7]. This study proposes
an experimental and numerical investigation on the e�cacy of the intra-laminar size e↵ect
testing to characterize the fracturing behavior of textile composite. It is worth remarking
here that the size e↵ect method of measuring the fracture properties is easier to implement
than other methods because only peak load measurements are necessary. The post-peak
behavior, crack tip displacement measurement, and optical measurement of the crack tip
location are not needed, and even a soft testing machine without servo-control can be used.
2. Test description
2.1. Materials
Experiments were conducted on specimens manufactured by compression molding. A
Bisphenol A diglycidyl ether (DGEBA)-based epoxy resin was chosen as polymer matrix
whereas the reinforcement was provided by a twill 2⇥2 fabric made of carbon fibers. The
2

material was characterized following the ASTM standard procedures [12] testing [0�]8
and
[45�]8
coupons under uniaxial tension. The results of this characterization are listed in Table
1.
2.2. Specimen characteristics
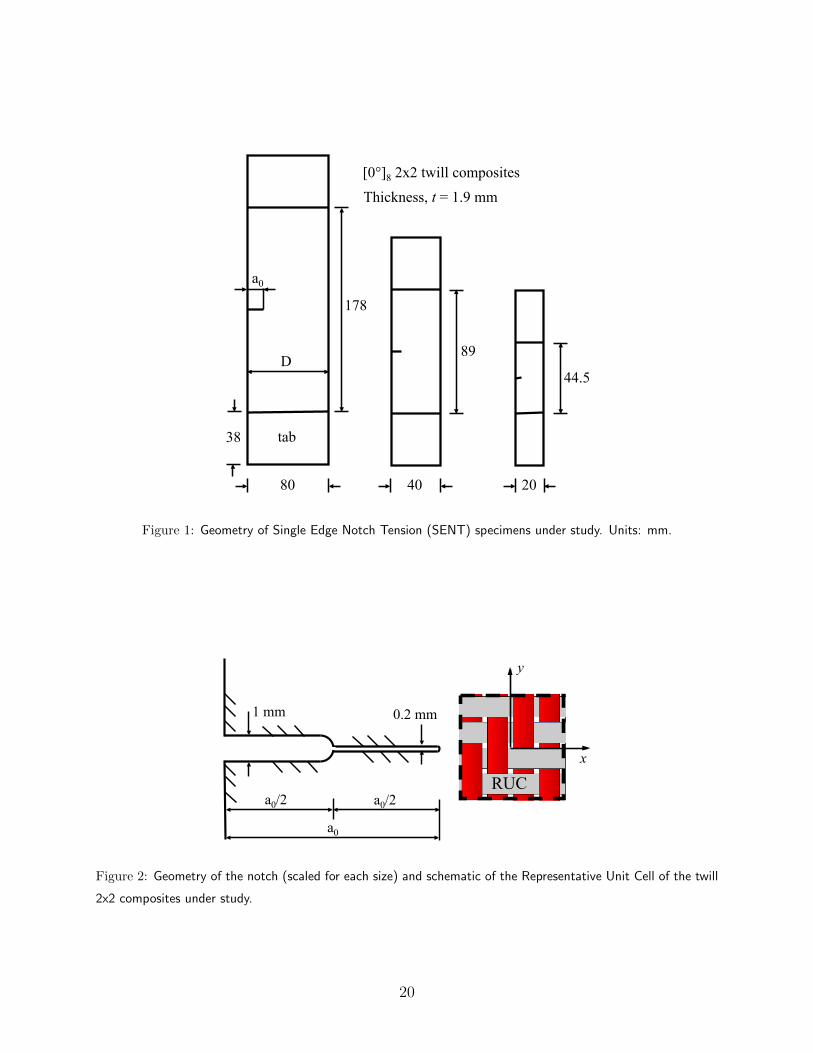
Following Bazant et al. [4, 7], intra-laminar size e↵ect tests were conducted on single-
edge-notched tension (SENT) specimens (see Figure 1), using a [0�]8
lay-up with a constant
thickness of approximately 1.9 mm. The SENT specimens were preferred to Double-Edge
Notched Tension (DENT) specimens, for which two cracks typically initiate at the notch
tips but ultimately only one of the two cracks can propagate, causing the response to be
asymmetric [13].
Specimens of three sizes (three for each size), geometrically scaled in two-dimension (see
Table 2) as 1:2:4, were tested. The first half of the notch was made by means of a diamond
coated bend saw which provided a width of roughly 1 mm whereas the second half was made
using a diamond-coated miniature blade thanks to which a width of 0.2 mm was obtained
in all cases (Figure 2). Accordingly, the resulting crack tip radius was 0.1 mm, about 70
times smaller than the size of a Representative Unit Cell (RUC) of the material. It is worth
noting that the sawing action of the blade prevented the formation of a Fracture Process
Zone (FPZ) before running the tests contrarily to common pre-fracturing procedures [14].
All the specimens were prepared with 38 mm long glass/epoxy tabs for gripping purposes.
The tab length (grip constraint) was not scaled because it has no appreciable e↵ect on the
stored energy and because fracture always occurs away from the grips.
The top surface of all the SENT specimens was treated to allow Digital Image Correlation
(DIC) analysis. A thin layer of white paint was deposited on a D ⇥D area embedding the
crack. Then, black speckles of average size 0.01 mm were spray-painted on the surface after
drying.
2.3. Testing
The tests were performed on a closed-loop servohydraulic MTS machine with 89 kN
capacity and at constant crosshead rate (stroke control). The rate was adjusted for the
di↵erent sizes to achieve roughly the same strain rate of 0.2 percent/min in the gage section.
With such settings, the test lasted no longer than approximately 10 min for all specimens.
3

Stroke, force, and loading time were recorded with a sampling frequency of 10 Hz. A DIC
system from Correlated Solutions [15] composed by a 5 MP digital camera and a workstation
for image postprocessing was used to measure the displacement field in the specimen with
an acquisition frequency of 1 Hz.
3. Experimental results
After the completion of the experiments, the load and displacement data were analyzed.
Figure 3a shows, for the various sizes, the typical load-displacement plots reported. It is
worth noting that, for the largest specimen size, these curves are almost linear up to failure,
which is an indication of pronounced brittle behavior. Conversely, a significant nonlinear
segment before the peak stress indicates hardening inelastic behavior and reduced brittleness
(or higher ductility) for the smallest specimen sizes.
After reaching the peak load, the specimens exhibited snap-back instability for all in-
vestigated sizes. As a consequence, the failures were catastrophic (dynamic), and occurred
shortly after the peak load. Damage consisting of microcracks in layers, delamination be-
tween layers before peak load and tow breakage and pull-out was observed in the tests.
Figure 3b shows the typical appearance of the specimens after failure and the test results
for the notched specimens are summarized in Table 3. The table also reports the specimen
nominal strength. This is defined as the average stress at failure based on the unnotched
cross section, �N = Pmax
/Dt.
It is worth noting that, according to strength-based criteria (such as e.g. Tsai and Wu [16]
among others), the nominal strength does not depend on the structural size. However, Table
3 does show a significant decrease of �N with increasing characteristic size of the specimen.
It is clear that strength based criteria cannot capture this trend. However, neither can
classical Linear Elastic Fracture Mechanics (LEFM) which, instead, would predict a decrease
proportional to D�1/2.
4. Discussion
4.1. Analysis of intra-laminar size e↵ect tests by Size E↵ect Law
The intra-laminar size e↵ect tests can be analyzed by means of an equivalent linear
elastic fracture mechanics approach, which results in an equation, known as type II Size
4

E↵ect Law (SEL) [4, 17], which relates the nominal strength, �N , to the characteristic size
of the structure, D.
4.1.1. Energy release rate and size e↵ect law for orthotropic materials
Following Bao et al. [19], the Mode I stress intensity factor for an orthotropic material
can be written as:
KI = �N
p⇡D↵ ⇠
�↵,�1/4L/D, ⇢
�(1)
where ↵ = a/D = dimensionless crack length, �1/4L/D = rescaled length/width ratio,
⇠ (↵,�1/4L/D, ⇢) is a dimensionless function accounting for geometric and elastic e↵ects and
⇢ and � are dimensionless elastic parameters defined as follows:
⇢ =
pE
1
E2
2G12
�p⌫12
⌫21
, � =E
2
E1
(2)
In the previous expressions, 1 and 2 represent the weft and warp yarn directions, respectively
(Figure 2) and E1
⇡ E2
, G12
, ⌫12
= ⌫21
are the in-plane elastic constants of the textile
composite.
The energy release rate can be written starting from the stress intensity factor as:
G(↵) =
s1 + ⇢
2E1
E2
p�K2
I (3)
Now, recalling Eq. (1), one can write the energy release rate as a function of relative crack
length as:
G (↵) =K2
I
E⇤ =�2
ND
E⇤ g (↵) (4)
where
E⇤ =
s2E
1
E2
p�
1 + ⇢, g (↵) = ⇡↵
⇥⇠�↵,�1/4L/D, ⇢
�⇤2
(5)
It should be noted that Eq. (5) defines an e↵ective elastic modulus, E⇤, dependent on the
orthotropic properties of the composite while g(↵) is the dimensionless energy release rate.
Thanks to the foregoing expressions, the relation between the nominal strength and the
structure characteristic size has now the same form as the isotropic case (see e.g. [4]). In
this case, the failure condition can be written [4, 17] with reference to an e↵ective crack
length as:
G (↵0
+ cf/D) =�2
ND
E⇤ g (↵) = Gf (6)
5

where Gf = initial fracture energy of the material and cf = e↵ective FPZ length, both
assumed to be material properties. It should be remarked that this equation characterizes
the peak load conditions if g0(↵) > 0, i.e. only if the structure has positive geometry [4, 17].
By approximating g(↵) with its Taylor series expansion at ↵0
and retaining only up to
the linear term of the expansion, one obtains:
�N =
sE⇤ Gf
Dg(↵0
) + cfg0(↵0
)(7)
This equation relates the nominal strength of radially scaled structures to a characteristic
size, D and it can be rewritten in the following form:
�N =�0p
1 +D/D0
(8)
where �0
= (E⇤ Gf/cfg0(↵
0
))1/2; and D0
= cfg0(↵
0
)/g(↵0
) = constant, depending on both
FPZ size and specimen geometry. Contrarily to classical LEFM, Eq. (8) is endowed with
a characteristic length scale D0
. This is the key to describe the transition from ductile to
brittle behavior with increasing structure size.
4.1.2. Fitting of experimental data by SEL
The parameters of SEL, Eq. (8), can be determined by regression analysis of experimental
data. To this aim, it is convenient to define the following:
X = D, Y = ��2
N (9)
�0
= C�1/2, D0
=C
A=
1
A (Bft)2
(10)
Eq. (8) can now be expressed in the following form:
Y = C + AX (11)
A linear regression analysis was conducted as represented in Figure 4a and provided the
following parameter estimates A = 0.305 GPa�2mm�1 and C = 2.419 GPa�2, and from Eqs.
(10a,b), D0
= 7.93 mm and �0
= 643 MPa.
The fitting of the experimental data by SEL is shown in Figure 4b where the normalized
strength, �N/�0
is plotted as a function of the normalized characteristic size D/D0
in double
logarithmic scale. The figure shows a transition from the strength criterion (plastic limit
6
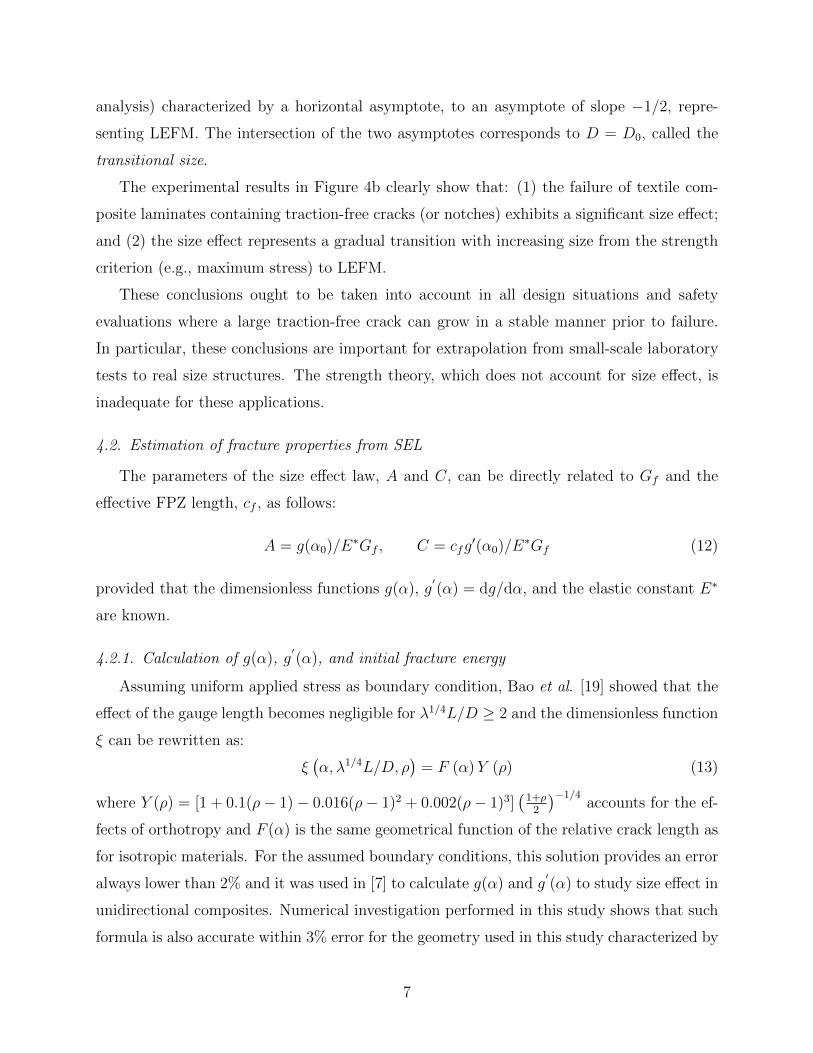
analysis) characterized by a horizontal asymptote, to an asymptote of slope �1/2, repre-
senting LEFM. The intersection of the two asymptotes corresponds to D = D0
, called the
transitional size.
The experimental results in Figure 4b clearly show that: (1) the failure of textile com-
posite laminates containing traction-free cracks (or notches) exhibits a significant size e↵ect;
and (2) the size e↵ect represents a gradual transition with increasing size from the strength
criterion (e.g., maximum stress) to LEFM.
These conclusions ought to be taken into account in all design situations and safety
evaluations where a large traction-free crack can grow in a stable manner prior to failure.
In particular, these conclusions are important for extrapolation from small-scale laboratory
tests to real size structures. The strength theory, which does not account for size e↵ect, is
inadequate for these applications.
4.2. Estimation of fracture properties from SEL
The parameters of the size e↵ect law, A and C, can be directly related to Gf and the
e↵ective FPZ length, cf , as follows:
A = g(↵0
)/E⇤Gf , C = cfg0(↵
0
)/E⇤Gf (12)
provided that the dimensionless functions g(↵), g0(↵) = dg/d↵, and the elastic constant E⇤
are known.
4.2.1. Calculation of g(↵), g0(↵), and initial fracture energy
Assuming uniform applied stress as boundary condition, Bao et al. [19] showed that the
e↵ect of the gauge length becomes negligible for �1/4L/D � 2 and the dimensionless function
⇠ can be rewritten as:
⇠�↵,�1/4L/D, ⇢
�= F (↵)Y (⇢) (13)
where Y (⇢) = [1 + 0.1(⇢� 1)� 0.016(⇢� 1)2 + 0.002(⇢� 1)3]�1+⇢2
��1/4accounts for the ef-
fects of orthotropy and F (↵) is the same geometrical function of the relative crack length as
for isotropic materials. For the assumed boundary conditions, this solution provides an error
always lower than 2% and it was used in [7] to calculate g(↵) and g0(↵) to study size e↵ect in
unidirectional composites. Numerical investigation performed in this study shows that such
formula is also accurate within 3% error for the geometry used in this study characterized by
7

�1/4L/D < 2. For ↵0
=0.2 one obtains: g(↵0
) = 1.1460 and g0(↵
0
) = 11.25. However, since
the specimens are clamped at the tabs, a uniform remote displacement rather than stress
might be a more realistic boundary condition.
In the absence of an analytical solution for displacement boundary conditions, the func-
tion g�↵,�1/4L/D, ⇢
�was calculated by Finite Element Analysis in Abaqus Implicit 6.13
[20]. 8-node biquadratic plane stress quadrilateral elements (CPS8) were adopted while the
quarter element technique [21] was used at the crack tip to provide accurate results. The
smallest element size at the tip was about a0
⇥ 10�5 leading to roughly 22, 000 elements for
the whole model. A linear elastic orthotropic constitutive model was used for the simulation
with material properties given in Table 1. The J-integral approach [22] was adopted to
estimate the energy release rate in the presence of a uniform displacement, u0
, applied in
correspondence to the tabs, treated as rigid parts. Then, the related load, P , was computed
and used to calculate the corresponding dimensionless energy release g by means of Eq. (6).
In order to compute g0(↵), various dimensionless crack lengths in the close neighborhood
of the initial crack value ↵0
= 0.2 were considered, namely ↵ = 0.1950, 0.1975, 0.2025 and
0.2050. As can be noted from Figure 5a, linear interpolation provided a very accurate fit
of the numerical data with Y = g(↵) = 2.8352X + 0.0886 and X = ↵. According to this
analysis one has g(↵0
) = 0.6556 and g0(↵
0
) = 2.8352. Since the specimens are geometrically
scaled, these results apply to all the considered sizes.
From Eqs. (12a,b), the initial fracture energy and the e↵ective FPZ length can be cal-
culated: one has Gf = 73.7 N/mm, cf = 1.81 mm, for uniform displacement BCs; and
Gf = 130 N/mm, cf = 4.07 mm for uniformly applied remote stress. Clearly, the boundary
conditions have a non-negligible e↵ect which requires further investigation carried out here-
inafter through a combined approach integrating numerical analysis and DIC measurements.
4.3. Calibration of computational models through size e↵ect tests
Intra-laminar size e↵ect is a key factor for damage tolerance design of large textile com-
posite structures, the assessment of which requires accurate fracture models. These models
ought to be able to capture the size e↵ect, so that the tests described in the foregoing sections
could be used to provide data for calibration and validation. To clarify this point, the size
e↵ect tests were simulated by means of two recently proposed models for textile compos-
ites, namely the Spectral Sti↵ness Microplane Model (SSMM) [9] and the Microplane Triad
Model (MTM) [10, 11] for which the calibrated parameters are listed in Appendix.
8
4.3.1. Microplane modeling of textile composites
In the formulations used in this investigation, the constitutive laws are expressed in
terms of stress and strain vectors acting on planes of several orientations within the material
meso-structure, following the framework of microplane theory [24–26]. Then, a variational
principle is applied to relate the microplane stresses at the mesoscale to the continuum tensors
at the macroscale. Thanks to these features, the models can easily capture various physical
inelastic phenomena typical of fiber and textile composites such as matrix microcracking,
micro-delamination, crack bridging, pullout, and debonding (for more details, refer to [9–
11]).
To ensure objective numerical results in the presence of strain localization, both formu-
lations employ the crack band model proposed by Bazant et al. [23]. In this approach, the
width of the damage localization band, wc, is considered as a material property. This width
is also equal to the mesh size, he, which is here chosen as 2 mm. A change in the element size
requires the scaling of the post-peak response of the material such that the fracture energy
remain unchanged. Thanks to the crack band model, a characteristic size of the material
is inherently embedded in the formulations, which is a key feature to correctly describe the
transition from ductile to brittle behavior.
It is worth mentioning here that the post-peak responses of the present microplane for-
mulations are somewhat di↵erent. In SSMM, the softening in weft or warp direction occurs
in the form of an exponential decay whereas, in MTM, the first initial drop in stress is con-
sidered to be followed by a small plateau, and then by an exponential decay. In the latter
case, the initial drop captures the assumed initial straightening of the fibers after matrix
microcracking. In the absence of direct experimental observations on the softening response
of composite materials, both types of post-peak behavior were considered in this contribu-
tion. However, both softening laws can be characterized by the initial fracture energy, Gf ,
and the total fracture energy, GF as depicted in Figure 6a,b. The total fracture energy, GF ,
corresponds to the total area under the stress-strain curve multiplied by the characteristic
size (or width) of the crack band whereas the initial fracture energy, Gf , is related only
to the initial part of the curve. It is worth observing that for common specimen sizes, the
size e↵ect tests provide information only on the initial fracture energy. This is because, for
lab-scale structures of quasibrittle materials, the stress at peak load in the FPZ still remains
in the initial steep portion of the post-peak stress-displacement curve, while the tail portion
9

is reached only after the load is reduced substantially [27, 28].
4.3.2. Simulation of size e↵ect tests
Finite element models for all three SENT coupons were built in Abaqus Explicit [20] and
uniaxial tensile simulations were performed to fit the peak loads. For all the considered sizes,
the displacement field measured during the tests by DIC was applied as boundary conditions
in finite element simulations. For this purpose, the relative displacement with respect to the
left side of the specimens; i.e. the side that contains the crack mouth, was computed along
two sections at the top and bottom of the crack plane at a distance of D/2 for each specimen
of each size. This distance was chosen far enough from the crack plane to avoid the need for
any assumption on the applied boundary conditions. Afterwards, the displacement di↵erence
between top and bottom points was calculated through the normalized experimental time
and the average values for each size were obtained and applied on top of the numerical
specimens. Figure 5b illustrates the applied boundary condition for the largest specimen at
five di↵erent average loads P .
The crack band width he used in the simulations was 2 mm whereas a very fine seed
spacing of 0.2 mm had to be used in the direction of crack growth, to capture correctly
the stress profile in the ligament. The fracture energy that was indirectly measured from
size e↵ect tests was incorporated in the models by calibrating the material point response.
Namely, the post-peak response of the two models was calibrated to dissipate approximately
the initial fracture energy measured by size e↵ect tests with imposed remote displacements,
with Gf = 74.2 N/mm for the SSMM and Gf = 72.1 N/mm for the MTM.
Table 4 reports, for the coupons of di↵erent size, a comparison between the predicted and
measured structural strengths. It can be seen that, for both models, predictions agree very
well with experiments. Needless to say that had the models been calibrated with the initial
fracture obtained by applied remote stresses, the peak loads would be greatly overestimated.
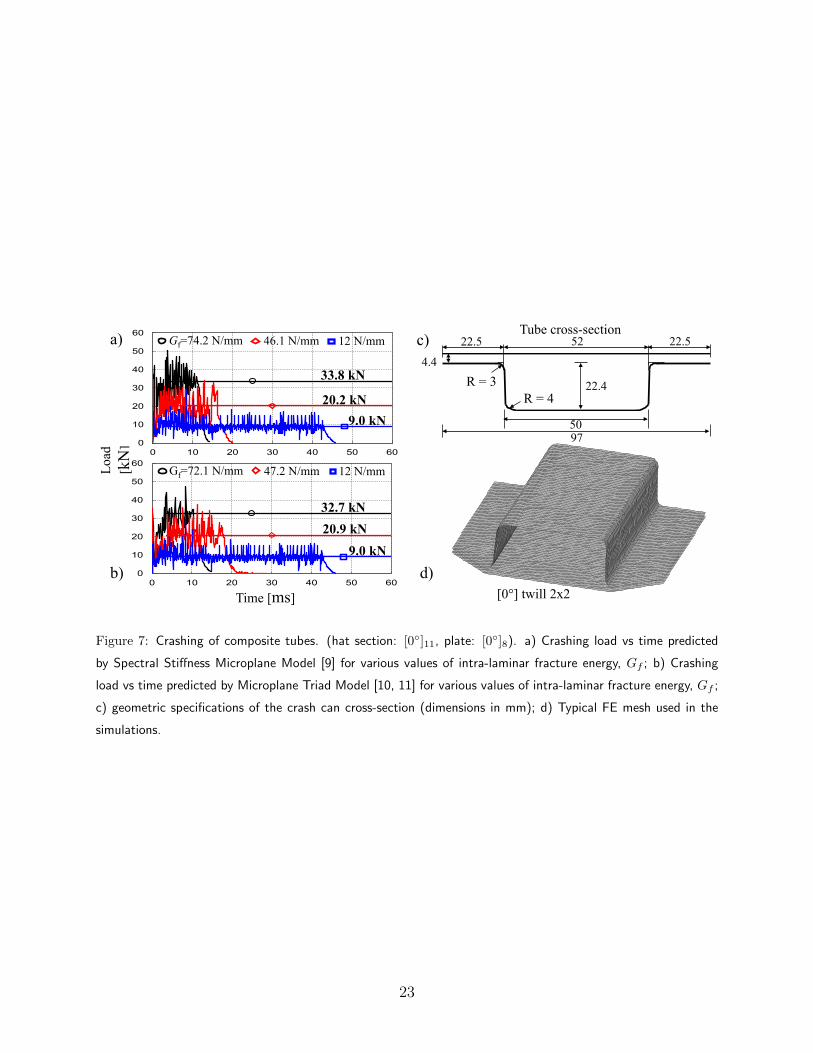
4.4. Importance of size e↵ect in crashworthiness applications
To clarify the importance of measuring Gf accurately and modeling the fracturing of
textile composites correctly, the microplane formulations were used to predict the energy
absorbed during the impact of composite crash cans, a situation in which intra-laminar
fracture was reported to be the main failure mechanisms. Figure (7c) shows the geometry
of the structure under study consisting of a hat section tube and a reinforcing plate glued
10
together by a toughened epoxy glue. The lay-up configuration was [0�]11
for the hat section
tube and [0�]8
for the plate. The composite tubes, accurately fixed at the bottom, were
impacted by a flat mass of 74.4 kg at the velocity of 4.6 m/s in a drop tower.
The crush can was modeled in Abaqus Explicit [20] using a mesh of triangular shell el-
ements of 2 mm (see Figure (7d)). All the degrees of freedom of the nodes at the bottom
section were fixed while an initial velocity field of 4.6 m/s was prescribed to the impacting
mass consisting of rigid shell elements. The general contact algorithm provided by Abaqus
Explicit [20] was used while element deletion was adopted to avoid excessive element dis-
tortion during the simulation. The elements were deleted as soon as the dissipated energy
in tension reached 99% of the fracture energy or when the magnitude of the maximum or
minimum principal strains reached 0.45.
The comparison between experimental and numerical results is reported in Table 5 in
terms of plateau reaction force on the plate. As can be noted, a very satisfactory agreement is
found for both formulations using the fracture energy estimated from size e↵ect. As the table
shows, the experimental plateau load, i.e. the reaction force on the plate once the crushing
process is stabilized, is 35.6 kN whereas the predicted values are 33.8 kN for SSMM and 32.7
for the MTM. It should be highlighted here that these results represent a pure prediction
based on the calibration and validation through uniaxial tests as well as size e↵ect tests only.
No adjustment of any of the parameters of the models was done, making the reported results
even more remarkable.
Then, to study the importance of Gf on the crashing predictions, simulations were done
for the following additional cases: Case 2: fracture energy approximately half of the measured
value, and Case 3: fracture energy corresponding to an almost vertical drop in stress after
the peak (equal to about 12 N/mm assuming 2 mm as element size). Since, in the latter case,
also the shape of the post-peak is predefined, no di↵erence between the two formulations
was expected and the simulation was run only with the Spectral Sti↵ness Microplane Model
(Figure 6c reports examples of the stress-strain curves for SSMM for all cases). As can be
noted from Table 5 and Figures 7a,b, the simulations revealed a huge e↵ect of the fracture
energy for both models. In facts, a decrease of the initial fracture energy to about 50%,
Case 2, diminished the crushing load to almost a half. Case 3, typical of strength-based
constitutive laws implemented in most commercial Finite Element codes, resulted into an
underestimation of the crushing load of the order of 70% for an element size of 2 mm. It is
11
worth remarking that, assuming the stress always drops vertically after the peak, inevitably
makes the fracture energy dependent on the element size. Accordingly, the error in Case 3 is
mesh dependent and the predicted load decreases with decreasing element size and increases
for increasing element size.
5. Conclusions
This paper presents and discusses an experimental and numerical investigation on the
intra-laminar size e↵ect of textile composites. Based on the results presented in this study,
the following conclusions can be formulated:
1. The experimental investigation shows a remarkable size e↵ect in geometrically-scaled
textile composite structures failing by intra-laminar fracture propagation. This aspect,
too often overlooked in the literature on composites, is the determining factor for
damage tolerance design of large composite structures;
2. The tests agree with Size E↵ect Law (SEL) proposed by Bazant [4, 24], according
to which the fracturing behavior of geometrically scaled structures exhibits a smooth
transition from ductile to purely brittle (LEFM type) with increasing structure size;
3. Size e↵ect tests can be used to determine the fracture characteristics of the composite
provided that a) the orthotropic properties of the material are taken into account and
b) realistic boundary conditions are assumed for the calculation of the dimensionless
energy release rate. The size e↵ect method of measuring the fracture properties is
easier to implement than other methods because only peak load measurements are
necessary: the post-peak behavior, crack tip displacement measurement and optical
measurement of crack tip location are not needed, and even a soft testing machine
without servo-control can be used. According to this approach, the initial fracture
energy Gf of the investigated carbon twill 2x2 composite was identified to be 73.7
N/mm whereas the e↵ective Fracture Process Zone (FPZ) length, cf was 1.81 mm.
This length is comparable to the size of one tow;
4. The applicability of SEL to measure the fracture properties of the material was ver-
ified numerically by means of two recently proposed microplane models for textile
composites [9–11]. Both formulations matched the size e↵ect data using the Gf -value
estimated by SEL;
12
5. Compared to the experimental results on the axial progressive crushing behavior of
composite crush cans, the models calibrated with the measured fracture energy pro-
vided an excellent prediction of the crushing load. Further, a parametric study showed
that, for both models, a decrease of Gf to about 50% of the measured value can reduce
the crushing load to almost a half. The assumption of a vertical drop of the stress after
the peak, typical of strength-based constitutive laws, resulted into an underestimation
of the order of 70% for an element size of 2 mm. The error in this latter case is mesh
dependent;
6. The foregoing results suggest that measuring accurately Gf and modeling correctly
the fracturing of textile composites, including their quasi-brittleness, is the key in all
situations which require accurate prediction of energy absorption (such as crashwor-
thiness analysis) or scaling of mechanical properties. This can be accomplished neither
by strength-based approaches, which completely neglect the size e↵ect, nor by LEFM,
which does not account for the finiteness of the FPZ.
Acknowledgments
This material is based upon work supported by the Department of Energy under Coopera-
tive Award Number DE-EE0005661 to the United States Automotive Materials Partnership,
LLC and sub-award SP0020579 to Northwestern University. The work was also partially
supported under NSF grant No. CMMI-1435923.
References
[1] Chou T.W. Microstructural Design of Fibre Composites. Cambridge University Press, NewYork, 1992.
[2] Daniel I.M., Ishai O. Engineering Mechanics of Composite Materials. New York: OxfordUniversity Press, 1992.
[3] Bogdanovich A.E., Pastore C.M. Mechanics of Textile and Laminated Composites. Chapmanand Hall, London, 1996.
[4] Bazant Z.P., Planas J., Fracture and Size E↵ect in Concrete and Other Quasibrittle materials,CRC Press, 1998.
[5] Mollenhauer D, Iarve EV, Kim R, Langley B., Examination of ply cracking in compositelaminates with open holes: a Moire interferomic and numerical study. Composites Part A2006;37: 282-94.
[6] Green B.G., Wisnom M.R., Hallet S.R., An experimental investigation into the tensile strengthscaling of notched composites, Composites - Part A 2007;38:867-78.
[7] Bazant Z.P., Daniel I.M., Li Z. Size E↵ect and Fracture Characteristics of Composite Lami-nates J. Eng. Mater. Technol. 1996;118(3): 317–324.
13
[8] Cusatis G., Beghini A. Bazant Z.P. Spectral Sti↵ness Microplane Model for Quasibrittle Com-posite Laminates-Part I: Theory J Appl Mech 2008; 75:0210091–8.
[9] Salviato M., Esna Ashari S., Cusatis G., Spectral sti↵ness microplane model for damage andfracture of textile composites, Composite Structures 2016;137:170-184.
[10] Kirane K., Salviato M., Bazant Z.P. Microplane triad model for simple and accurate predictionof orthotropic elastic constants of woven fabric composites J Compos Mater, 2016; 50:1247-1260.
[11] Kirane K., Salviato M., Bazant Z.P. Microplane-Triad Model for Elastic and Fracturing Be-havior of Woven Composites ASME Journal of Applied Mechanics, 2016; 84:0410061-14.
[12] ASTMD3039 Standard Test Method for Tensile Properties of Polymer Matrix CompositeMaterials 2014.
[13] Bazant Z.P., Tabbara M.R. Bifurcation and Stability of Structures with Interacting Propa-gating Cracks. Int. J. of Fracture 1992;53:273-289.
[14] ASTMD5045 Standard Test Methods for Plane-Strain Fracture Toughness and Strain EnergyRelease Rate of Plastic Materials 1999.
[15] Correlated Solutions, Columbia, USA. http://www.correlatedsolutions.com[16] Tsai S.W., Wu E.M. A General Theory of Strength for Anisotropic Materials J Compos Mater
1972;5:58–80.[17] Bazant Z.P., Size E↵ect in Blunt Fracture: Concrete, Rock, Metal Int. J. Eng. Mech.
1984;110:518-535.[18] Bazant, Z.P., and Cedolin, L. Stability of Structures: Elastic, Inelastic, Fracture and Damage
Theories, Oxford University Press, New York 1991. (2nd ed. Dover Publ.; 3rd ed. WorldScientific Publishing, Singapore–New Jersey–London 2010), Section 11.9.
[19] Bao G., Ho S., Suo Z., Fan B. The Role of Material Orthotropy in Fracture Specimens forComposites Int J Solid Structures 1992;29: 1105-1116 and Corrigenda: Int J Solid Structures1992;29: 2115.
[20] ABAQUS, v., 2013. ABAQUS Users Manual, Ver. 6.13-1. Hibbit, Karlson and Sorenson, Paw-tucket, RI.
[21] Barsoum R.S. Application of Quadratic Isoparametric Finite Elements in Linear FractureMechanics. Int. J. Fracture 1974;10:603-605.
[22] Rice, J.R. A path independent integral and the approximate analysis of strain concentrationsby notches and cracks. J. Appl Mech ASME 1968;35:379-386.
[23] Bazant Z.P., Oh B.H. Crack band theory for fracture of concrete. Matriaux et construction1983;16(3):155–177.
[24] Bazant, Z.P. Microplane model for strain-controlled inelastic behavior. Chapter 3 in “Mechan-
ics of Engineering Materials.” ed. by C. S. Desai and R. H. Gallagher, J. Wiley, London, 1984;45–59.
[25] Bazant Z.P., Oh B. H. Microplane model for progressive fracture of concrete and rock, J. Eng.Mech., ASCE, 1985; 111:559–582.
[26] Caner F.C., Bazant Z.P. Microplane Model M7 for Plain Concrete. I: Formulation J. Eng.Mech., ASCE, 2013;139:1714–1723.
[27] Cusatis G., Schau↵ert E. A. Cohesive crack analysis of size e↵ect. Eng Fract Mech2009;76:2163–2173.
[28] Hoover, C.G., and Bazant, Z.P. (2014). “Cohesive crack, size e↵ect, crack band and work-of-fracture models compared to comprehensive concrete fracture tests.” Int. J. of Fracture 187(1), pp. 133-143.
14
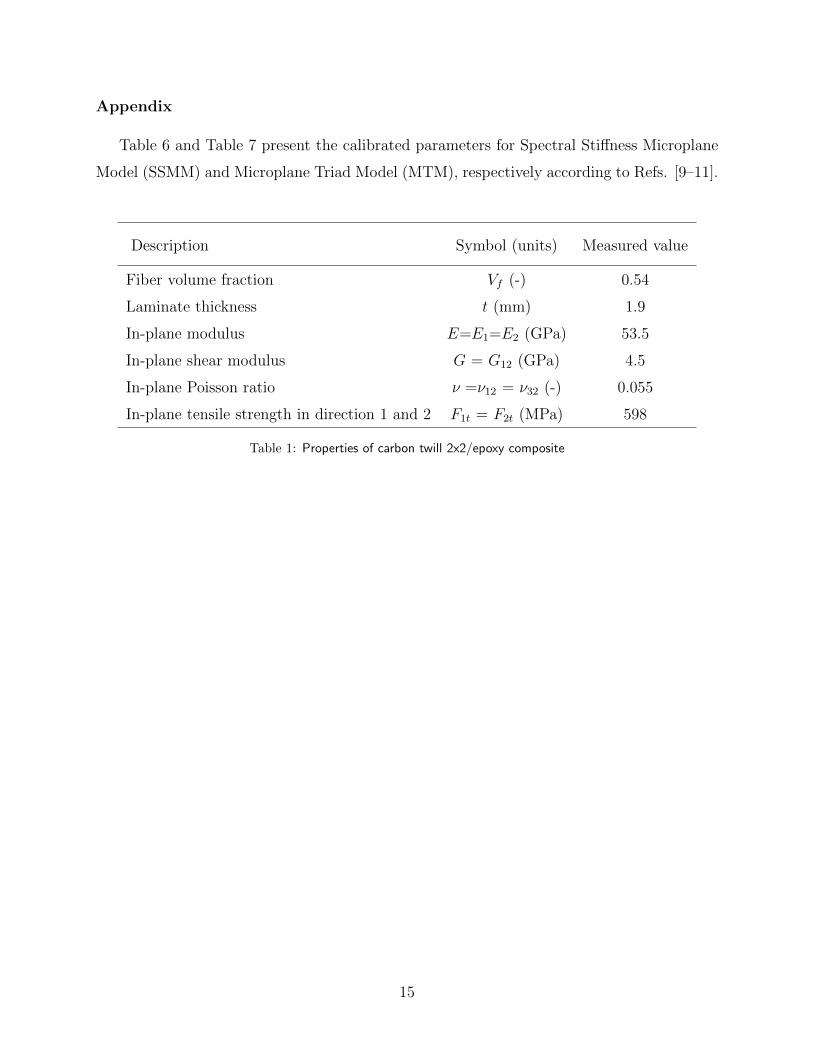
Appendix
Table 6 and Table 7 present the calibrated parameters for Spectral Sti↵ness Microplane
Model (SSMM) and Microplane Triad Model (MTM), respectively according to Refs. [9–11].
Description Symbol (units) Measured value
Fiber volume fraction Vf (-) 0.54
Laminate thickness t (mm) 1.9
In-plane modulus E=E1
=E2
(GPa) 53.5
In-plane shear modulus G = G12
(GPa) 4.5
In-plane Poisson ratio ⌫ =⌫12
= ⌫32
(-) 0.055
In-plane tensile strength in direction 1 and 2 F1t = F
2t (MPa) 598
Table 1: Properties of carbon twill 2x2/epoxy composite
15

Size Width, Gauge length, Length, Crack length, Thickness,
D L L = L+ 2Lt a0
t
Small 20 44.5 120.5 4 1.9
Medium 40 89.0 165.0 8 1.9
Large 80 178.0 254.0 16 1.9
Units: mm. Tab length Lt = 38 mm for all investigated sizes.
Table 2: Geometrical specifications of the SENT specimens under study
Specimen gauge length, Specimen width, Max, load Nominal strength
L (mm) D (mm) Pmax (kN) �N (MPa)
44.5 20
13.17 350.27
12.67 336.81
13.42 356.91
89.0 40
16.58 220.48
18.69 248.54
19.83 263.70
178.0 80
30.17 200.60
29.60 190.81
29.65 197.14
Table 3: Results of tensile tests on Single End Notched Specimens.
16
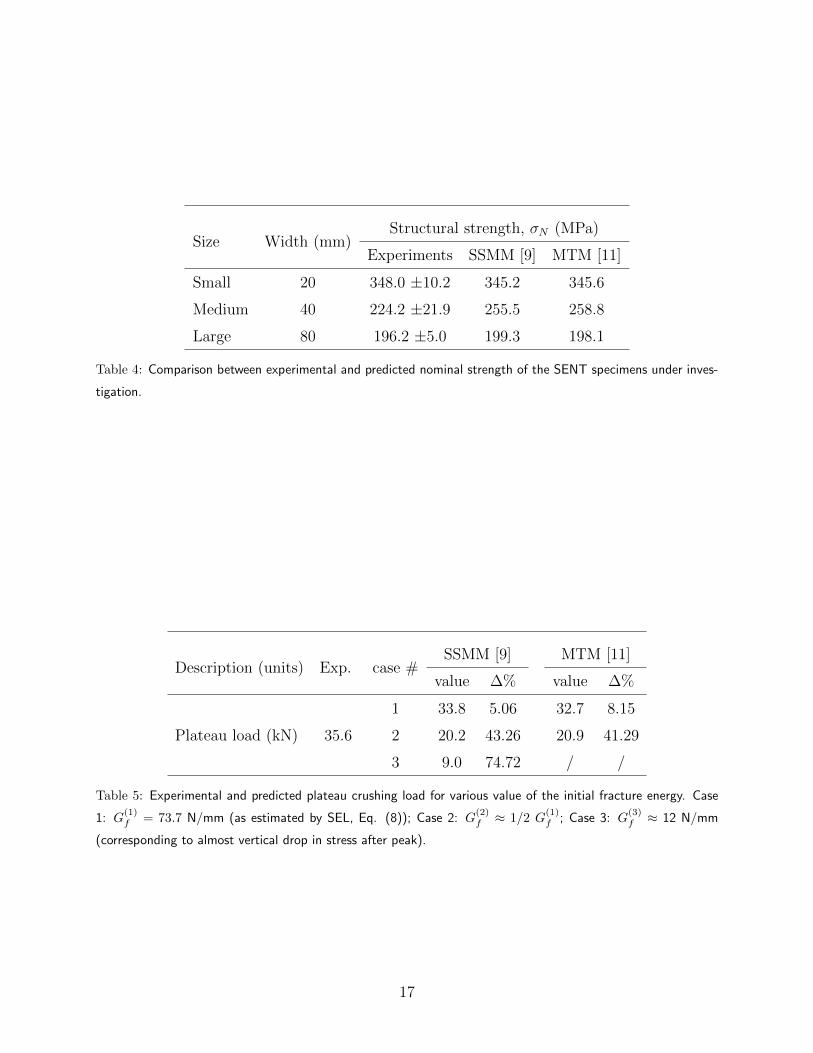
Size Width (mm)Structural strength, �N (MPa)
Experiments SSMM [9] MTM [11]
Small 20 348.0 ±10.2 345.2 345.6
Medium 40 224.2 ±21.9 255.5 258.8
Large 80 196.2 ±5.0 199.3 198.1
Table 4: Comparison between experimental and predicted nominal strength of the SENT specimens under inves-
tigation.
Description (units) Exp. case #SSMM [9] MTM [11]
value �% value �%
Plateau load (kN) 35.6
1 33.8 5.06 32.7 8.15
2 20.2 43.26 20.9 41.29
3 9.0 74.72 / /
Table 5: Experimental and predicted plateau crushing load for various value of the initial fracture energy. Case
1: G(1)f = 73.7 N/mm (as estimated by SEL, Eq. (8)); Case 2: G(2)
f ⇡ 1/2 G(1)f ; Case 3: G(3)
f ⇡ 12 N/mm
(corresponding to almost vertical drop in stress after peak).
17

Mode Description Symbol (units) Calibrated value
12
mode 1 elastic eigenvalue �(1) (GPa) 61.85
mode 2 elastic eigenvalue �(2) (GPa) 50.71
microplane peak stress in tension s(12)
0
(MPa) 400
parameter governing post-peak softening in tension k(12)
bt (-) 30.60⇥ 10�3
parameter governing post-peak softening in tension a12t (-) 0.75
microplane peak stress in compression c(12)
0
(MPa) 405
parameter governing post-peak softening in compression k(12)
bc (-) 30.60⇥ 10�3
parameter governing post-peak softening in compression ac12 (-) 0.75
4
mode 4 elastic eigenvalue �(4) (GPa) 8.10
microplane stress in tension at start of non-linear boundary s(4)
0
(MPa) 45
exponent governing pre-peak non-linearity in tension and compression p (-) 0.3
strain at starting of post-peak softening in tension k(4)
at (-) 124.6⇥ 10�3
parameter governing post-peak softening in tension k(4)
bt (-) 120.15⇥ 10�3
microplane stress in compression at start of non-linear boundary c(4)
0
(MPa) 45
strain at starting of post-peak softening in compression k(4)
ac (-) 124.6⇥ 10�3
parameter governing post-peak softening in compression k(4)
bc (-) 120.15⇥ 10�3
3
mode 3 elastic eigenvalue �(3) (GPa) 10.82
microplane peak stress in tension s(3)
0
(MPa) 90
strain at starting of post-peak softening in tension k(3)
at (-) 4.0⇥ 10�3
parameter governing post-peak softening in tension k(3)
bt (-) 20⇥ 10�3
microplane peak stress in compression c(3)
0
(MPa) 90
strain at starting of post-peak softening in compression k(3)
ac (-) 4.0⇥ 10�3
parameter governing post-peak softening in compression k(3)
bc (-) 20⇥ 10�3
5
mode 5 elastic eigenvalue �(5) (GPa) 7.20
microplane stress in tension at start of non-linear boundary s(5)
0
(MPa) 45
exponent governing pre-peak non-linearity in tension and compression p (-) 0.3
strain at starting of post-peak softening in tension k(5)
at (-) 124.6⇥ 10�3
parameter governing post-peak softening in tension k(5)
bt (-) 120.15⇥ 10�3
microplane stress in compression at start of non-linear boundary c(5)
0
(MPa) 45
strain at starting of post-peak softening in compression k(5)
ac (-) 124.6⇥ 10�3
parameter governing post-peak softening in compression k(5)
bc (-) 120.15⇥ 10�3
Table 6: Calibrated parameters of Spectral Sti↵ness Microplane Model (SSMM).
18
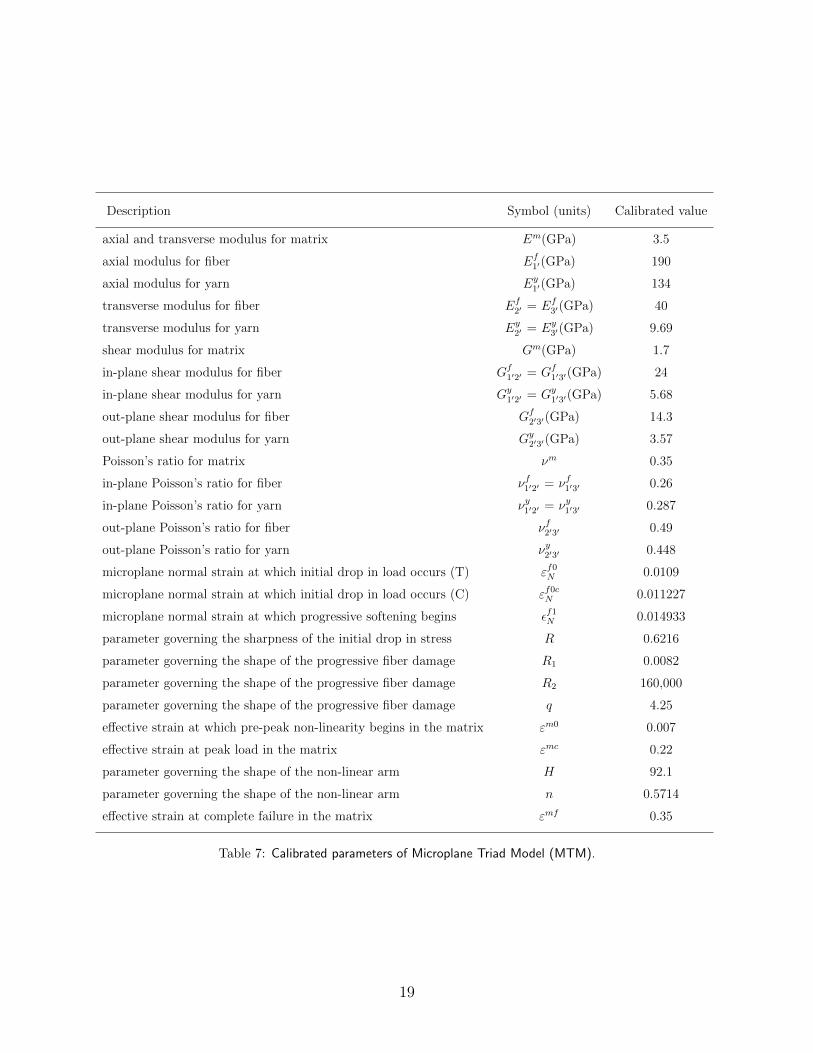
Description Symbol (units) Calibrated value
axial and transverse modulus for matrix Em(GPa) 3.5
axial modulus for fiber Ef1
0(GPa) 190
axial modulus for yarn Ey1
0(GPa) 134
transverse modulus for fiber Ef2
0 = Ef3
0(GPa) 40
transverse modulus for yarn Ey2
0 = Ey3
0(GPa) 9.69
shear modulus for matrix Gm(GPa) 1.7
in-plane shear modulus for fiber Gf1
02
0 = Gf1
03
0(GPa) 24
in-plane shear modulus for yarn Gy1
02
0 = Gy1
03
0(GPa) 5.68
out-plane shear modulus for fiber Gf2
03
0(GPa) 14.3
out-plane shear modulus for yarn Gy2
03
0(GPa) 3.57
Poisson’s ratio for matrix ⌫m 0.35
in-plane Poisson’s ratio for fiber ⌫f1
02
0 = ⌫f1
03
0 0.26
in-plane Poisson’s ratio for yarn ⌫y1
02
0 = ⌫y1
03
0 0.287
out-plane Poisson’s ratio for fiber ⌫f2
03
0 0.49
out-plane Poisson’s ratio for yarn ⌫y2
03
0 0.448
microplane normal strain at which initial drop in load occurs (T) "f0N 0.0109
microplane normal strain at which initial drop in load occurs (C) "f0cN 0.011227
microplane normal strain at which progressive softening begins ✏f1N 0.014933
parameter governing the sharpness of the initial drop in stress R 0.6216
parameter governing the shape of the progressive fiber damage R1
0.0082
parameter governing the shape of the progressive fiber damage R2
160,000
parameter governing the shape of the progressive fiber damage q 4.25
e↵ective strain at which pre-peak non-linearity begins in the matrix "m0 0.007
e↵ective strain at peak load in the matrix "mc 0.22
parameter governing the shape of the non-linear arm H 92.1
parameter governing the shape of the non-linear arm n 0.5714
e↵ective strain at complete failure in the matrix "mf 0.35
Table 7: Calibrated parameters of Microplane Triad Model (MTM).
19
D
a0
80
38 tab
178
40
89
20
44.5
[0°]8 2x2 twill composites
Thickness, t = 1.9 mm
Figure 1: Geometry of Single Edge Notch Tension (SENT) specimens under study. Units: mm.
a0/2 a0/2
0.2 mm 1 mm
a0
RUC
y
x
Figure 2: Geometry of the notch (scaled for each size) and schematic of the Representative Unit Cell of the twill
2x2 composites under study.
20

b)
c)
d)
e)
a)
0
5
10
15
20
25
30
35
0 0.5 1 1.5 2 2.5
Load
, Pm
ax [k
N]
Displacement, u [mm]
D = 20 mm
40 mm
80 mm
D
Figure 3: a) Typical load-displacement curves of [0�]8 geometrically-scaled SENT specimens of various sizes,
showing decreasing nonlinearity increasing specimen dimensions. Typical failure patterns of Single Edge Notched
specimens for width b) D = 20 mm, c) D = 40 mm and d) D = 80 mm. e) Magnification of fracture surface for
the large size specimen showing extensive tow failure and pull-out.
-1.25
-1.00
-0.75
-0.50
-0.25
0.00
0.25
-1.2 -0.6 0.0 0.6 1.2 1.8 2.4log(D/D0)
2 1
Strength criterion
σN = Bft (1+D/D0)-1/2
Dlog(σ N
/ σ0)
b)
0
5
10
15
20
25
30
35
0 20 40 60 80 100X = D [mm]
Y = σ N
-2 [G
Pa-2
]
Y = 2.419 + 0.305X Bfu = 0.643 [GPa] D0 = 7.93 [mm]
D
a)
Figure 4: Size e↵ect study. a) Linear regression analysis to characterize the size e↵ect parameters. b) Measured
size e↵ect for [0�]8 twill 2x2 laminates.
21

X = ,
0.19 0.195 0.2 0.205 0.21
Y=
g(,
)
0.63
0.64
0.65
0.66
0.67
0.68
FEA
R2 = 0.9999
Y= 2.8352 X + 0.0886
a) b)
0 20 40 60 800
0.2
0.4
0.6
0.8
Distance [mm]
Disp
lace
men
t [m
m]
P =7.7 kNP =14.0 kNP =20.1 kNP =25.4 kNP =29.8 kN
Figure 5: a) Calculation of the dimensionless energy release rate g(↵0) by linear interpolation of FEA. b) Applied
boundary conditions in FEA simulations of the largest size specimen for di↵erent average loads P .
0
200
400
600
800
0 0.1 0.2 0.3
12.0 N/mm
46.1 N/mm
Gf=74.2 N/mm
εy
σ y
[MPa
]
0
200
400
600
800
0 0.1 0.2 0.3
WF
he Wf
Gf=Wf he=74.2 N/mm
a) b)
εy
σy σy
Figure 6: a) Typical stress-strain curve in pure tension for the Spectral Sti↵ness Microplane Model [9]. The
initial fracture energy Gf is calibrated adjusting the post-peak softening response of the material. b) Typical
stress-strain curves in tension provided by [9] for di↵erent values of the initial fracture energy: 1) Gf = 73.7
N/mm, 2) Gf = 46.1 N/mm and 3) Gf = 12.0 N/mm (corresponding to almost vertical drop of stress after the
peak).
22
0
10
20
30
40
50
60
0 10 20 30 40 50 60
Load
[k
N]
Time [ms]
b)
a)
d) [0°] twill 2x2
c) 4.4
R = 4 R = 3
97
22.4
Tube cross-section 52 22.5 22.5
50 0
10
20
30
40
50
60
0 10 20 30 40 50 60
Gf=74.2 N/mm 46.1 N/mm 12 N/mm
33.8 kN
20.2 kN 9.0 kN
Gf=72.1 N/mm 47.2 N/mm 12 N/mm
32.7 kN 20.9 kN
9.0 kN
Figure 7: Crashing of composite tubes. (hat section: [0�]11, plate: [0�]8). a) Crashing load vs time predicted
by Spectral Sti↵ness Microplane Model [9] for various values of intra-laminar fracture energy, Gf ; b) Crashing
load vs time predicted by Microplane Triad Model [10, 11] for various values of intra-laminar fracture energy, Gf ;
c) geometric specifications of the crash can cross-section (dimensions in mm); d) Typical FE mesh used in the
simulations.
23