experimental and numerical methods to characterize...
TRANSCRIPT

20
Experimental and Numerical Methods to Characterize Electrical Behaviour of Carbon
Fiber Composites Used in Aeronautic Industry
Alexandre Piche, Ivan Revel and Gilles Peres EADS Innovation Works
France
1. Introduction
Carbon Fiber Reinforced Plastic materials are widely used in aeronautic industry because of their high strength to weight ratio, to replace metallic parts. As these materials are not as conductive as metal, there is an increasing need to characterize their electromagnetic properties in order to understand and anticipate direct or indirect effects of lightning and functional current return. Multilayer composite materials present a strong anisotropy due to the different type of material properties and fibers orientation. This has for consequence to create privileged paths for current circulation and possible voltage drops inside the material. The level of accuracy needed on electrical property of a CFRP part strongly depends on the way the CFRP material is electrically solicited (direct current injection, induced effects, illumination…) and consequently on its location and its function inside the aircraft structure. In addition, this level of accuracy depends also increasingly of the development stage of the aircraft: foreground project, mature design, certification, maintenance. For the above reasons, the importance of having adapted and flexible means of characterization becomes crucial. This chapter is divided in two main sections. The first section presents a general review of the main experimental techniques allowing electrical characterization of CFRP materials. The second starts by reporting existing numerical models of CFRP materials. Then, we present an original approach to simulate current distribution within the composite layup.
2. Electrical characterization of CFRP materials
We present in this part the main experimental techniques of electrical characterization of CFRP materials. Extracted electrical conductivity from measurements is sensitive to the technology of composite (orientation of plies, fiber to resin density ratio, percolation, manufacturing process…) but also to the measurement method itself. Indeed, the way to measure the electrical conductivity depends on the final objective. The most appropriate measurement technique is the one reproducing as close as possible the way the current circulates when the sample faces an electromagnetic excitation. We describe in the following the theoretical basis, the approximations/limitations and the standard use for the three main techniques:
www.intechopen.com

Advances in Composite Materials - Analysis of Natural and Man-Made Materials
482
• “Four points”: extraction of equivalent conductivity from resistance measurement in selected directions.
• TEM cell: extraction of equivalent “radial” conductivity from shielding effectiveness measurement.
• Magnetic probe: extraction of equivalent “circular” conductivity from magnetic field attenuation.
2.1 “Four points” method This method is based on a DC electrical resistance measurement consisting in injecting a
constant current with a stabilized power supply. The injection is achieved by the way of
electrodes in contact with the sample. To control the surface across the current is injected
and minimize contact resistances, some metal deposition is done on the section. It shall be
sufficiently conductive to be equipotential and have the lowest contact resistance with the
CFRP surface. To improve that connection, it is possible to tighten the sample into a metallic
vise.
Fig. 1. “Four points” method
The measure of the voltage drop allows deriving the resistance, R=U/I. From this resistance,
an electrical conductivity σu, corresponding to the effective conductivity in the direction u
(defined as the axis of the sample from one metallization to another), is extracted
considering a homogeneous material of thickness d and a section S:
u
d
RSσ = (1)
This method is typically used to determine the conductivity along fibers (σx), the
conductivity perpendicular to the fibers within plies (σy), and the conductivity between
plies (σz). This requires manufacturing of specific samples with unidirectional plies at least
for σx and σx extraction. To avoid manufacturing of dedicated samples, it is possible to
combine measurement results with an analytical model [1-3] taking into account of the non-
uniform current distribution in the sample in order to obtain the right conductivity in the
required direction.
www.intechopen.com

Experimental and Numerical Methods to Characterize Electrical Behaviour of Carbon Fiber Composites Used in Aeronautic Industry
483
2.2 Transverse Electro-Magnetic (TEM) cell The Transverse Electro-Magnetic Cell (TEM) is a coaxial structure which ensures the
propagation of plane waves in the frequency band going from 100 kHz up to 1 GHz. It is a
mean to characterize shielding effectiveness of materials and to extract equivalent “radial”
conductivity. The term “Radial” denotes the fact that the device forces the current to
circulate in the material from the internal to the external diameter of the cell, effectively in a
radial way.
Fig. 2. TEM cell
The principle consists in measuring the insertion losses for a given material. We determine
the S21 parameter with and without presence of the sample to take into account the
imperfections of the cell. The sample connects the internal and the external metal conductors
acting as a resistance in parallel (i.e. resistance RL).
Fig. 3. Low frequency electric diagram of TEM cell
We determine the resistance RL with the measurement of insertion losses (IL). If we note
respectively PoutA and PoutB the transmitted power to the port 2 with and without presence of
the sample, we have:
2
8 50G
out A
VP = × Ω (2)
2
2
1
2 50 502
GoutB
L
VP
R
= × Ω ⎛ ⎞Ω+⎜ ⎟⎝ ⎠ (3)
www.intechopen.com

Advances in Composite Materials - Analysis of Natural and Man-Made Materials
484
2
1
501
2
outB
out A
L
PIL
PR
⎛ ⎞⎜ ⎟⎜ ⎟= = Ω⎜ ⎟+⎜ ⎟⎝ ⎠ (4)
Assuming the composite homogeneous and the current uniformly distributed in the thickness d (i.e. no skin effect so f << 1/d²πμ0σrad), we can deduce the conductivity σrad from the resistance RL.
ext
int
1ln
2rad
L
R
dR Rσ Π
⎛ ⎞= ⎜ ⎟⎝ ⎠ (5)
This effective conductivity results from a complex combination between conductivities along fibers, perpendicular to the fibers within plies and between plies. Measurements with TEM cell are well adapted to address illumination threats as HIRF (High Intensity Radiated Fields).
2.3 Magnetic probe This technique consists in measuring the normal magnetic field with and without the presence of the composite material via two loops.
Fig. 4. Magnetic probe
A judicious configuration of the probe makes possible to write the attenuation of the normal H field as a first order low-pass filter whose cut-off frequency fc at -3dB is inversely proportional to the “circular” conductivity σcir. The term “circular” denotes the fact that the device forces the current to circulate in the plan of the sample around a center coinciding with the center of the probe, effectively in a circular way. If we suppose that the composite is homogeneous and that the currents induced by the emission loop (of radius a) are uniform in the thickness d (no skin effect), we can write:
2
0 0
1.4 1C
cir cir
fad dσ σΠ Π= μ μ2 (6)
0
1.4cir
Cadfσ Π= μ (7)
www.intechopen.com

Experimental and Numerical Methods to Characterize Electrical Behaviour of Carbon Fiber Composites Used in Aeronautic Industry
485
As for TEM extracted conductivity, the conductivity derived from magnetic probe results from a complex current flow along and perpendicular to the fibers and between plies. For standard CFRP materials, it is observed that both conductivities are similar and allow predicting with a good accuracy the resistance of any large quasi-isotropic sample whatever the excitation way (except in particular cases of injection versus layup). This is even true when dealing with CFRP covered with metallic lightning protection layer.
2.4 Synthesis We summarize in the following table typical conductivity values of aeronautic composite materials.
Conductivity Range (S/m)
σx 40000
σy 200
σz 0.1 / 10
σrad 5000 /20000
σcir 5000 /20000
Table 1. Standard conductivity values
Experimental approach for electrical characterization has two main drawbacks. First, the knowledge of the conductivity σx, σy and σz is most of the time insufficient to predict the resistance of different materials, layups and excitations because these conductivities are solicited in a complex manner. In addition, experimental characterization of CFRP is costly and needs many specific samples. For these reasons, numerical simulation appears to be an interesting way to support electrical characterization and moreover to understand electrical behaviour of CFRP material facing complex current distribution.
3. Modelling of CFRP materials
3.1 Existing models of CFRP materials We first present a non exhaustive review of CFRP material models or modelling techniques published in the literacy. First, Lenning [4] describes an analysis technique to predict lightning current paths in a CFRP sample and voltage drops between plies. He has developed a quasi-static Finite Difference Time Domain method (FDTD) able to treat anisotropic materials. He is interested in the conductance mechanisms in thickness and highlights its non linear behaviour. A FDTD approach is also used by Kitaygorsky [5] in order to determine the current density into a composite. Benzaid [6] presents a different method to model a thin multilayer composite panel in frequency domain. He uses an impedance matrix which connects the tangential components of magnetic and electric fields at each interface and he assumes a negligible conductivity in thickness. Several works [1; 7-9] deal with the modelling of the electromechanical behaviour of CFRP materials under tensile loading. Indeed, mechanical deformation and electrical resistance of CFRP are coupled (i.e. carbon fibers are strained and broken gradually under mechanical loading inducing an increase of the electrical resistance). The material is inherently a sensor of its own damage state; its integrity could be estimated by monitoring the resistance change. In this context, Park [7] introduces the concept of “electrical ineffective length” δec
www.intechopen.com

Advances in Composite Materials - Analysis of Natural and Man-Made Materials
486
which is the typical length over which a broken fiber regains its current-carrying capability due to electrical contacts between fibers (i.e. average distance between adjacent contact points). Then, Park uses a Monte Carlo technique to handle the random distribution of the contact points. Replacing them with contact resistors, the composite is thus modelled by a DC network circuit and solved with Kirchhoff’s rules.
Fig. 5. Current density in a CFRP panel (FDTD approach)
Fig. 6. DC network circuit of a carbon fiber layer
Finally, Zhang [10] studies the effective electrical properties of a conductive fibrous network consisting of short coated fibers. The methodology proposed can be used to predict electrical behaviour of fibrous materials including nanotubes. Short fibers are modelled as randomly distributed cylinders with thin conductive coating layers. The effective conductivity is deduced from a finite element discretization scheme. Monte Carlo simulations are performed to quantify the impact of the different material settings (fiber ratio, thickness of the coating layer, fibers orientation). From our side, we have decided to develop a numerical model to better understand conduction mechanisms in CFRP and support material qualification process. This model that differs from those reported before is presented in the next section.
3.2 Numerical wired approach for modelling CFRP materials 3.2.1 General principle Multilayer composite materials are made of different plies of carbon fibers with various orientations to achieve the required thickness and mechanical strength. The most common sequence of plies in aeronautic industry is 0°/45°/90°/-45°, the composite being then considered as quasi-isotropic (QI). We have developed a numerical approach to simulate the current distribution within the composite and assess the consecutive voltage drops between
I
I
Fibers direction
Random distribution of electrical contacts between fibers
www.intechopen.com
Experimental and Numerical Methods to Characterize Electrical Behaviour of Carbon Fiber Composites Used in Aeronautic Industry
487
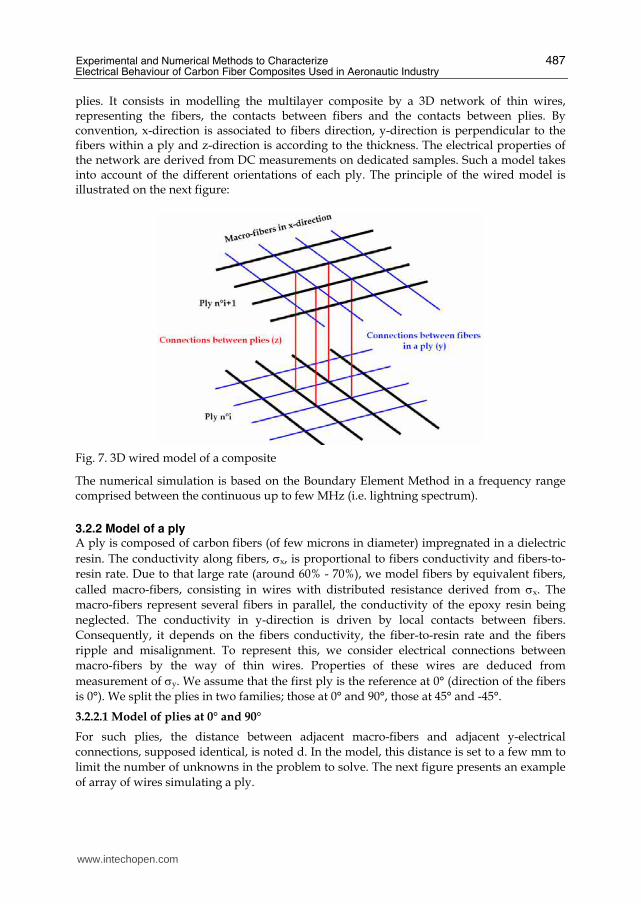
plies. It consists in modelling the multilayer composite by a 3D network of thin wires, representing the fibers, the contacts between fibers and the contacts between plies. By convention, x-direction is associated to fibers direction, y-direction is perpendicular to the fibers within a ply and z-direction is according to the thickness. The electrical properties of the network are derived from DC measurements on dedicated samples. Such a model takes into account of the different orientations of each ply. The principle of the wired model is illustrated on the next figure:
Fig. 7. 3D wired model of a composite
The numerical simulation is based on the Boundary Element Method in a frequency range comprised between the continuous up to few MHz (i.e. lightning spectrum).
3.2.2 Model of a ply A ply is composed of carbon fibers (of few microns in diameter) impregnated in a dielectric
resin. The conductivity along fibers, σx, is proportional to fibers conductivity and fibers-to-
resin rate. Due to that large rate (around 60% - 70%), we model fibers by equivalent fibers,
called macro-fibers, consisting in wires with distributed resistance derived from σx. The
macro-fibers represent several fibers in parallel, the conductivity of the epoxy resin being
neglected. The conductivity in y-direction is driven by local contacts between fibers.
Consequently, it depends on the fibers conductivity, the fiber-to-resin rate and the fibers
ripple and misalignment. To represent this, we consider electrical connections between
macro-fibers by the way of thin wires. Properties of these wires are deduced from
measurement of σy. We assume that the first ply is the reference at 0° (direction of the fibers
is 0°). We split the plies in two families; those at 0° and 90°, those at 45° and -45°.
3.2.2.1 Model of plies at 0° and 90°
For such plies, the distance between adjacent macro-fibers and adjacent y-electrical
connections, supposed identical, is noted d. In the model, this distance is set to a few mm to
limit the number of unknowns in the problem to solve. The next figure presents an example
of array of wires simulating a ply.
www.intechopen.com

Advances in Composite Materials - Analysis of Natural and Man-Made Materials
488
Fig. 8. Numerical model of a ply at 0° and 90°
The linear resistance of a ply in the fibers direction is given by 1/Wxepσx, where Wx is the dimension of the sample in the y-direction and ep is the thickness of the ply. Then, the distributed resistance (Ω/m) of a macro-fiber is:
1x xx
x p x x p x p x
N NR
W e N de deσ σ σ= = = (8)
The linear resistance of a ply perpendicular to the fibers direction is given by 1/Wyepσy, where Wy is the dimension of the sample in the x-direction. Then, the distributed resistance (Ω/m) of a single connection between 2 macro-fibers is:
1y yy
y p y y p y p y
N NR
W e N de deσ σ σ= = = (9)
The electrical conductivities σx and σy are derived from DC measurements on unidirectional bar samples in which we force the current to flow respectively in the fibers direction and perpendicular to the fibers within a ply.
3.2.2.1 Model of plies at 45° and -45°
For such plies, the distance between adjacent macro-fibers and adjacent y-electrical connections, supposed identical, is equal to d√2/2. This choice is driven by the objective to create at the end z-connections the most simple and repetitive (purely vertical, parallel and equidistant) as possible. The next figure presents the modelling of a ply at 45° (or -45°). For these plies, the distributed resistance of the macro-fibers, Rx, and the y-electrical connections between macro-fibers, Ry, becomes:
2 2, x y
p x p x
R Rde deσ σ= = (10)
www.intechopen.com
Experimental and Numerical Methods to Characterize Electrical Behaviour of Carbon Fiber Composites Used in Aeronautic Industry
489
Fig. 9. Numerical model of a ply at 45° (or -45°)
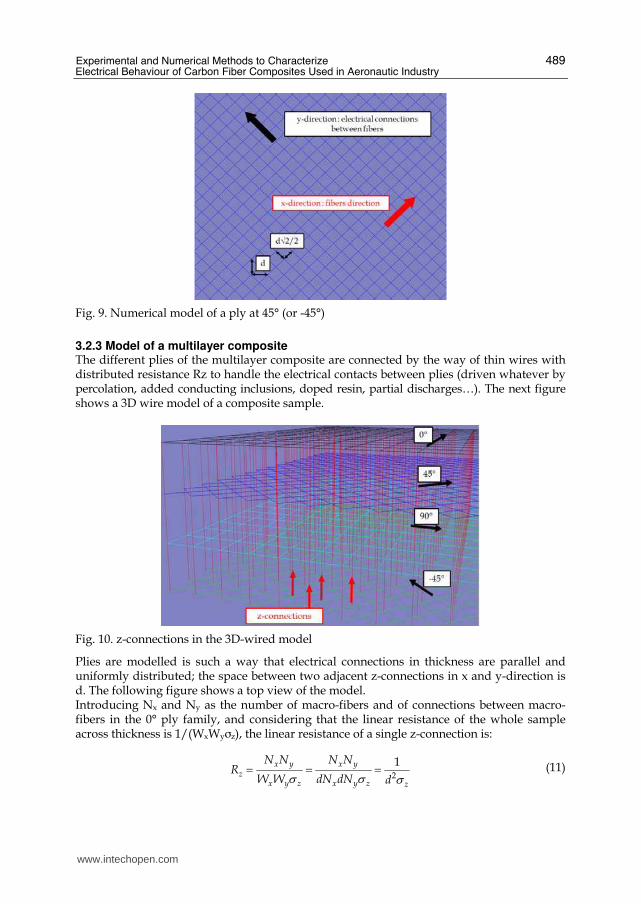
3.2.3 Model of a multilayer composite The different plies of the multilayer composite are connected by the way of thin wires with distributed resistance Rz to handle the electrical contacts between plies (driven whatever by percolation, added conducting inclusions, doped resin, partial discharges…). The next figure shows a 3D wire model of a composite sample.
Fig. 10. z-connections in the 3D-wired model
Plies are modelled is such a way that electrical connections in thickness are parallel and uniformly distributed; the space between two adjacent z-connections in x and y-direction is d. The following figure shows a top view of the model. Introducing Nx and Ny as the number of macro-fibers and of connections between macro-fibers in the 0° ply family, and considering that the linear resistance of the whole sample across thickness is 1/(WxWyσz), the linear resistance of a single z-connection is:
2
1x y x yz
x y z x y z z
N N N NR
W W dN dN dσ σ σ= = = (11)
www.intechopen.com

Advances in Composite Materials - Analysis of Natural and Man-Made Materials
490
Fig. 11. Top view of the model
This relation is valid if the physical thickness of the sample, Lφ, is kept in the numerical model. The thickness of one ply is typically around 200μm (indeed between 120 and 260µm depending on the grade) and the distance between adjacent plies is of the order of few tens of μm. Consequently, the distance between adjacent plies is enlarged (typically 1mm) to ease the distinction for model building stage and for post-processing. If we note Lnum the numerical thickness of the sample, the linear resistance of a single z-connection, Rz, becomes:
2z
num z
LR
L d
ϕσ= (12)
We have checked that the artificial increase of the material thickness has no influence on the results until several MHz. It is important to underline two main assumptions on which the model is based. First, the extraction of the z-direction conductivity is based on the hypothesis that contacts between plies are distributed all over the surface. As a consequence, a model based on that conductivity could be not relevant if contacts in the σz characterization sample were few and inhomogeneous. Secondly, we do not take into account of non linear behaviour of electrical contacts between adjacent plies, due to pre-existing contacts improved by the current or to partial discharges initiated by voltage drops. As a consequence, σz is considered in the model as an equivalent or effective conductivity, constant whatever the current injected. Note however that this model can nevertheless be used to assess sensitivity of results with respect to these assumptions.
3.2.4 Validation of the model with experimental characterization We present in this part some validations of the wired approach in both DC and frequency domain on a composite having 12 plies (sequence: 0/90/0/90/0/90/90/0/90/0/90/0).
3.2.4.1 Extraction of electrical conductivities
As explained, the model is built knowing electrical conductivities σx, σy and σz extracted thanks to the 4 points method on dedicated samples.
www.intechopen.com

Experimental and Numerical Methods to Characterize Electrical Behaviour of Carbon Fiber Composites Used in Aeronautic Industry
491
Fig. 12. Composite samples for extraction of σx, σy and σz
We use unidirectional bar samples (length L = 15cm, width W = 2cm, e = 3mm) to extract conductivities σx and σy by forcing the current to flow respectively in fibers direction and perpendicular to them. For σz, we use square samples (S = 4cmx4cm, e = 3mm), forcing the current to flow across the thickness. Conductivities obtained are reported below:
40490 S/mxXmeas
L
We Rσ< >= =< > (13)
200 S/myYmeas
L
We Rσ< >= =< > (14)
1.3 S/mzZmeas
e
S Rσ< >= =< > (15)
These conductivities have been obtained with injected currents of the order of 100mA.
3.2.4.2 Validation in DC
The validation presented consists in a comparison between calculated and measured DC resistances of a rectangular composite sample (13cmx9.5cmx3mm, 12 plies). Several local metal depositions have been done on each edge to allow current injection and exit in various configurations. The metallization is done on the top, the lower part and the edge of the material. During these tests, the injected current is 100mA.
Fig. 13. Rectangular composite sample with local metallizations
www.intechopen.com

Advances in Composite Materials - Analysis of Natural and Man-Made Materials
492
Fig. 14. Wired model of the composite sample
Calculated and measured resistances for several configurations are reported in the next table:
Resistance (mΩ)
Configuration Calculated Measured Difference
point A – point D 49.7 57.4 7.7
point B – point D 47.7 54.6 6.9
point D – point E 45.6 52.6 7
point B – point E 40.2 45.9 5.7
point C – point F 37.8 43.9 6.1
Table 2. Comparison between measured and calculated resistances
We observe on average a difference of 15% between measurements and numerical results. This could be partly explained by the contact resistances (metallization and measurement setup).
3.2.4.3 Validation in frequency domain
We have also assessed relevance of numerical predictions in frequency domain for two different configurations. In the configuration 1, a bar sample (length L = 15cm, width W = 2cm, thickness e = 3mm, sequence 0/90/0/90/0/90/90/0/90/0/90/0) is powered by a voltage generator in a circuit loop (15cmx5cm). The current (a few mA) is injected by the way of a network analyser. The following picture presents the setup of the configuration 1. We focus on the real part of the impedance seen from the source (Zin) because it is sensitive to the current repartition in the material only (when the imaginary part is controlled by the injection loop, what is not our concern in that case). Due to the sequence of plies, the sample geometry and the injection setup, the current flows only along the fibers of the 6 plies at 0° (that coincides with the sample axis and directly joins one metallization to the other). We compare the measured impedance to the calculated one using our model.
www.intechopen.com

Experimental and Numerical Methods to Characterize Electrical Behaviour of Carbon Fiber Composites Used in Aeronautic Industry
493
Fig. 15. Setup of the configuration 1
Fig. 16. Real part of the impedance (measurements vs simulation), configuration 1
We observe a very good correlation between calculation and measurement until few MHz.
We note also a constant real part of the impedance up to few 100 kHz. Indeed, in DC the current is uniformly distributed in the whole section so the real part of the impedance is equal to the resistance of the sample (RDC=L/(6eplyWσx) =123.5mΩ). When the frequency increases, the current concentrates on edges so the effective section of the material decreases
and the real part (i.e. the equivalent resistance) increases. This is illustrated on the next figure where we present current cartography on the sample modelled using a thin surface.
www.intechopen.com

Advances in Composite Materials - Analysis of Natural and Man-Made Materials
494
Fig. 17. Current distribution in the sample with a surface model at 10MHz
In configuration 2, we use the rectangular sample presented in figure 13. The current (a few mA) is also injected by the way of a network analyser.
Fig. 18. Setup of the configuration 2
The current has to flow perpendicular to the fibers direction to join the exit point. We compare again the real part of the impedance seen from the source.
www.intechopen.com

Experimental and Numerical Methods to Characterize Electrical Behaviour of Carbon Fiber Composites Used in Aeronautic Industry
495
Fig. 19. Real part of the impedance (measurements vs simulation), configuration 2
The difference between measurements and numerical results at low frequency are discussed in section 3.2.4.2. In conclusion, the model developed is relevant until few MHz that suits with an application to lightning problems.
4. Conclusion
We have presented different experimental and numerical methods to characterize the electric behaviour of carbon fiber composites used in aeronautic industry. Standard experimental techniques allowing electrical characterization of CFRP materials have been described with their approximations. As extracted electrical conductivity depends on the measurement method itself, it is necessary to understand how the material is crossed by the current in order to select the appropriate method(s). Moreover, experimental characterization is sometimes not sufficient to understand how the material is solicited and moreover it is quite expensive when dealing with CFRP materials. The numerical model presented in that chapter has been initially developed to support test definition and material characterization [11]. Thus, this approach is well adapted to assess sensitivity of results (sample resistance, current distribution…) with parameters as the layup, the different conductivities or the hypothesis of contact homogeneity. More recently [12], this model has been used to support the understanding of the dynamical electrical behaviour of CFRP materials during a short circuit with objective to estimate current levels and to adapt protection devices.
5. References
[1] Park J. B., Hwang T. K., Kim H. G., Doh Y. D. “Experimental and numerical study of the electrical anisotropy in unidirectional carbon-fiber-reinforced polymer composite”, Smart Mater. Struct. 16 (2007) 57-66.
www.intechopen.com

Advances in Composite Materials - Analysis of Natural and Man-Made Materials
496
[2] Busch R, Ries G, Werthner H, Kreiselmeyer G, Saemann-Ischenko G “New aspects of the mixed state from six-terminal measurements on Bi2Sr2CaCu2Ox single crystals”, 1992, Phys. Rev. Lett. 69 522–5.
[3] J. L., Espinoza O. J. S., Baggio-Saitovitch E “Influence of the anisotropy in the c-axis resistivity measurements of high-Tc superconductors”, 1999, Physica C 315 271–7.
[4] Lenning F. E. “Analysis of Lightning Current Flow in Anisotropic CFRP using Finite Differencing Methods” I03-50 CEM Proceedings, International Conference on Lightning and Static Electricity, September 16-19, 2003, Blackpool, England.
[5] Kitaygorsky J, Elliott J. R., Kamihara N, Satake K, Yamamoto K “Modeling the Effects of Anisotropic Material Properties on Lightning-Induced Current Flow in Structures Containing Carbon Fiber Reinforced Plastic”, International Conference on Lightning and Static Electricity, September 15-17, 2009, Pittsfield, Massachusetts, USA.
[6] Bensaid S “Contribution à la caractérisation et à la modélisation électromagnétique et thermique des matériaux composites anisotropes“, Thèse de Doctorat de l’Université de Nantes, 2006.
[7] Park J. B., Okabe T and Takeda N “New concept for modeling the electromechanical behaviour of unidirectional carbon-fiber-reinforced plastic under tensile loading”, Smart Mater. Struct. 12 105–14.
[8] Xia Z, Okabe T, Park J. B., Curtin W. A. and Takeda N “Quantitative damage detection in CFRP composites: coupled mechanical and electrical models”, Compos. Sci. Technol. 63 1411–22.
[9] Gillet A, Olivier P, Al Maghribi A, El Sawi I “Prediction of electrical properties of an aeronautic composite”, JNC16, Toulouse, France (2009).
[10] Zhang T, Yi Y. B. “Monte Carlo simulations of effective electrical conductivity in short-fiber composites”, Journal of applied physics 103, 014910 (2008).
[11] Piche A, Revel I, Peres G “Numerical modelling of multilayer composite materials for lightning problems in aircraft applications”, EMC Europe 2010, September 13-17, 2010, Wroclaw, Poland.
[12] Piche A, Andissac D, Revel I “Dynamic electrical behaviour of a composite material during a short circuit”, EMC Europe 2011, to be published.
www.intechopen.com

Advances in Composite Materials - Analysis of Natural and Man-Made MaterialsEdited by Dr. Pavla Tesinova
ISBN 978-953-307-449-8Hard cover, 572 pagesPublisher InTechPublished online 09, September, 2011Published in print edition September, 2011
InTech EuropeUniversity Campus STeP Ri Slavka Krautzeka 83/A 51000 Rijeka, Croatia Phone: +385 (51) 770 447 Fax: +385 (51) 686 166www.intechopen.com
InTech ChinaUnit 405, Office Block, Hotel Equatorial Shanghai No.65, Yan An Road (West), Shanghai, 200040, China
Phone: +86-21-62489820 Fax: +86-21-62489821
Composites are made up of constituent materials with high engineering potential. This potential is wide as wideis the variation of materials and structure constructions when new updates are invented every day.Technological advances in composite field are included in the equipment surrounding us daily; our lives arebecoming safer, hand in hand with economical and ecological advantages. This book collects original studiesconcerning composite materials, their properties and testing from various points of view. Chapters are dividedinto groups according to their main aim. Material properties are described in innovative way either for standardcomponents as glass, epoxy, carbon, etc. or biomaterials and natural sources materials as ramie, bone, wood,etc. Manufacturing processes are represented by moulding methods; lamination process includes monitoringduring process. Innovative testing procedures are described in electrochemistry, pulse velocity, fracturetoughness in macro-micro mechanical behaviour and more.
How to referenceIn order to correctly reference this scholarly work, feel free to copy and paste the following:
Alexandre Piche, Ivan Revel and Gilles Peres (2011). Experimental and Numerical Methods to CharacterizeElectrical Behaviour of Carbon Fiber Composites Used in Aeronautic Industry, Advances in CompositeMaterials - Analysis of Natural and Man-Made Materials, Dr. Pavla Tesinova (Ed.), ISBN: 978-953-307-449-8,InTech, Available from: http://www.intechopen.com/books/advances-in-composite-materials-analysis-of-natural-and-man-made-materials/experimental-and-numerical-methods-to-characterize-electrical-behaviour-of-carbon-fiber-composites-u