experimental and numerical fem-based determinations of
TRANSCRIPT

HAL Id: hal-02524818https://hal.archives-ouvertes.fr/hal-02524818
Submitted on 16 Dec 2020
HAL is a multi-disciplinary open accessarchive for the deposit and dissemination of sci-entific research documents, whether they are pub-lished or not. The documents may come fromteaching and research institutions in France orabroad, or from public or private research centers.
L’archive ouverte pluridisciplinaire HAL, estdestinée au dépôt et à la diffusion de documentsscientifiques de niveau recherche, publiés ou non,émanant des établissements d’enseignement et derecherche français ou étrangers, des laboratoirespublics ou privés.
Experimental and numerical FEM-based determinationsof forming limit diagrams of St14 mild steel based on
Marciniak-Kuczynski modelM. Mianroodi, Guillaume Altmeyer, Siham Touchal
To cite this version:M. Mianroodi, Guillaume Altmeyer, Siham Touchal. Experimental and numerical FEM-based deter-minations of forming limit diagrams of St14 mild steel based on Marciniak-Kuczynski model. Journalof Mechanical Engineering and Sciences, Universiti Malaysia Pahang, 2019, 13 (4), pp.5818-5831.�10.15282/jmes.13.4.2019.08.0464�. �hal-02524818�

Journal of Mechanical Engineering and Sciences
ISSN (Print): 2289-4659; e-ISSN: 2231-8380
Volume 13, Issue 4, pp. 5818-5831, December 2019
© Universiti Malaysia Pahang, Malaysia
DOI: https://doi.org/10.15282/jmes.13.4.2019.08.0464
5818
Experimental and numerical FEM-based determinations of forming limit diagrams of
St14 mild steel based on Marciniak-Kuczynski model
M. Mianroodi1*, G. Altmeyer2, S. Touchal1
1 ICube laboratory, University of Strasbourg, CNRS, 4 Rue Boussingault,
67000 Strasbourg, France
Phone: +33368852955 *Email: [email protected]
2 Laboratoire de Mécanique Gabriel Lamé, Université de Tours, Université d’Orléans,
INSA Centre Val de Loire, Polytech Tours, 7 avenue Marcel Dassault BP40, 37004 Tours,
France
ABSTRACT
Forming Limit Diagrams (FLD) are used to design metal sheet processes and to choose
appropriate material according to their formability. Development of simple and robust
methods to determine the formability domain is then a major industrial issue. Marciniak-
Kuczynski (M-K) plastic instability criterion is a classical and common approach used to
predict numerical FLD. A convergence of the experimental conditions and theoretical M-K
hypotheses is investigated. This analysis leads in the proposition of a simple experimental
procedure based on classical instrumented biaxial testing machines to reproduce M-K in-
plane loading conditions. Experimental results are compared with numerical simulations
based on a finite element method implantation of M-K model. This versatile implementation
allows the coupling of the plastic instability criterion in ABAQUS with a large range of
material behaviors. Application of these experimental and numerical procedures on
commercial St14 mild steel leads to the relative differences between lower experimental
points and numerical forming limits predictions that do not exceed 4% and 10% in the case
of uniaxial and equibiaxial tension for initial prescribed defect ratio of 0.99 and 0.95, and
22% in the case of plane tension. These procedures constitute ways easily implementable in
the industry to obtain FLD at reduced costs that show good correlations between
experimental results and numerical M-K predictions.
Keywords: Forming limit diagram; Marciniak-Kuczynski; formability; finite element
method; biaxial tensile tests.
INTRODUCTION
In industrial practice, formability of metal sheets is limited by critical phenomena such as
diffuse necking and strain localization. To avoid scrapping of defective parts, it is important
to understand how the forming process is performed and to get numerical tools to predict
where the critical areas of necking and fracture are located. The forming process can then be

M. Mianroodi et. al / Journal of Mechanical Engineering and Sciences 13(4) 2019 5818-5831
5819
analyzed and optimized before manufacturing tools, leading to time-saving, to the reduction
of the costs and to a global improvement of the quality of products.
The origin of analysis of the forming limits was given in the 1940’s. The first
presentation, which includes a diagram similar to the typical Forming Limit Diagrams (FLD),
was published by Gansamer in 1946 [1]. The concept of FLDs, as it is known today, was
developed after different experimental tests and analytical investigations [2-6]. Marciniak
and Kuczynski then developed a forming limit prediction model for strain localization,
referred to M-K in this study [7]. After deep experimental investigations on the relations
between strain localization and geometrical and structural heterogeneities, M-K model is
based on the supposed existence of initial geometrical imperfections in the sheet. Each sheet
is represented with two regions: region A with uniform thickness and region B with
geometrical imperfections. These imperfections may take the form of initial thickness
heterogeneities or equivalent structural imperfections. During the forming process, the strain
localization is supposed to occur in the imperfection zone. Some improvements have been
proposed to this model in the expansion domain by taking into account the effects of the
orientation of the band [8]. Strengths of this model are its ability to deal with a large class of
materials including time-dependent materials and the possibility to implement it in Finite
Element simulation software to simulate sheet metal forming processes [9-13]. This criterion
is formulated with several hypotheses such as in plane loading and plane stress state, while
the straining path of the safe zone may be chosen linear or not. On another hand, different
experimental procedures have been developed to determine FLD. Among the most popular
normalized methods, Nakazima and Marciniak tests are based on controlled stretching of a
metal flank maintained on a die by a blankholder and submitted to the action of a moving
punch [14-15]. Geometrical and mechanical observations of the specimen and of the loading
conditions show out of plane stress and strain states, non-linear strain paths and strain
gradients in the thickness of the sheet. Although these testing procedures are well
representative of the complex straining conditions met during deep-drawing processes, one
may observe the differences between the hypotheses used for the formulation of theoretical
strain localization criteria and the conditions really encountered during experimental
determination of FLD by classical tests based on punching of a sheet. Comparison of
theoretical and experimental FLD results is then a sensitive question. To overcome these
issues, a rapprochement between theoretical and experimental conditions is proposed in this
paper by considering experimental determination of FLD from biaxial testing facilities. The
aim of this paper is to bridge the differences between theoretical and experimental conditions
used to determine FLD, to procure a new set of experimental data for St14 mild steel and to
compare them with numerical predictions. After the presentation of the considered steel,
FEM based M-K model formulation is developed. In the end, an experimental procedure
including sheet heterogeneities obtained with modern experimental facilities based on multi-
axial testing and on digital image correlation is presented.
PRESENTATION AND MATERIAL MODELING OF ST14 MILD STEEL
The material presented in this paper is a commercial low carbon St14 mild steel, composed
of Iron, Carbon, Copper, Manganese, Phosphorous, Sulfur, Aluminum and Nitrogen. It is
selected by industrial partners for its good machinery, deep drawing and stamping properties.

Experimental and numerical FEM-based determinations of forming limit diagrams of St14 mild steel based
on Marciniak-Kuczynski model
5820
This mild steel is easy to weld using any type of welding methods. The chemical composition
is given in Table 1.
Table 1. Chemical composition (wt%) of St14 mild steel [16].
C Si Mn P S Al N (ppm)
0.02 0.004 0.222 0.007 0.004 0.058 30
A classical approach is followed to model elastoplastic behavior of St14 mild-steel. Details
may be found in Lemaitre and Chaboche [17] and are briefly given in this section. A
multiplicative decomposition of the transformation gradient F using a reversible elastic part
and an irreversible plastic one leads to: F = Fe. Fp, where Fe and Fp denote respectively the
elastic and plastic parts of the transformation gradient. Differentiation of this transformation
gradient leads then to the definition of the velocity gradient L: L = F. F−1. Deep-drawing of
metal sheets is generally characterized by small elastic deformations e observed before
plastic deformations. Transformation tensor F can then be approximated with: Fe =(1 + e). R, where R denotes the elastic rotation operator. Introducing this expression in the
definition of the velocity gradient, one may obtain: L = R. R−1 + e° + R. Fp. (Fp)−1. R−1,
where e° is an objective measure of the elastic strain rate. In the following simulations,
Jaumann derivative will be used for convenience reasons as it is implemented in ABAQUS
FEM software. The total strain rate is the symmetric part of the velocity gradient. Its additive
decomposition into elastic and plastic parts leads to the following expression of the plastic
strain rate: Dp = D − e°. For FLD determination, it is common to apply the load in the
principal directions of anisotropy, leading to a null elastic spin. A simplified formulation of
the material laws, close to the small strain formulation, may then be used. When these loading
conditions are not observed, equations may be written in a rotated frame leading to the same
simplified expressions of the material behavior. Following a phenomenological approach
based on thermodynamically irreversible processes detailed in Lemaitre and Chaboche [17],
elasto-viscoplastic relations are developed to represent phenomena observed during cold
forming of metal sheets, as for example the evolution of hardening or the sensibility to the
loading rate. In this work, the evolution of the time-dependent hardening is obtained by using
a classical power law:
𝑅 = 𝑅0 + 𝑘ϵnϵm (1)
where R0, m, n and k are respectively the hardening constant, strain rate sensitivity exponent,
strain hardening exponent and strength constant [18]. Identification of material parameters
of this model for St14 mild steel has been carried out and the results are given in Table 2.
Table 2. Mechanical properties of St14 mild steel [18,19].
E
(GPa)
𝛎 𝛒
(𝐤𝐠/𝐦𝟑)
𝛔𝐞
(MPa)
𝛔𝐦
(MPa)
k
(MPa)
n m
210 0.3 7860 145 500 660 0.19 0.012

M. Mianroodi et. al / Journal of Mechanical Engineering and Sciences 13(4) 2019 5818-5831
5821
Further details about the finite transformation framework and plasticity modeling may be
found in [20]. Different procedures have been developed to study the formability of such
steel sheets. Some of them are purely experimental while others are based on analytical
models or are based on purely numerical approaches. In the next sections, two procedures
based on experimental and numerical approaches will be applied to the determination of FLD
for St14 mild steel.
MARCINIAK-KUCZYNSKI MODEL AND NUMERICAL SIMULATION
Plastic instabilities are largely influenced by imperfections that may be present in structures.
According to multi-zones models, localization is expected to produce in regions of the metal
sheet affected by such common defects. Nature of these defects may, for example, be related
to the composition of the alloy, to grain sizes and repartitions, to geometrical heterogeneities,
to residual stresses or more generally to material imperfections [21]. In M-K approach, an
equivalent geometrical defect is defined to reproduce the destabilizing effects of all present
imperfections regardless of their real nature. A band of reduced thickness is then defined in
M-K model partitioning a local space of the metal sheet into two regions as shown in Figure
1: region A is a region with nominal thickness t while the region B is affected by a thickness
reduction tB in a band of width wB.
Figure 1. Definition of zones A and B in M-K model [22].
This user-defined defect is represented and introduced in the model by the initial thickness
ratio 𝑓0 defined by:
𝑓0 =𝑡0
𝐵
𝑡0 (2)
with 𝑡0 and 𝑡0𝐵 are the initial thicknesses of the sheet and inside the band. Common values of
the initial thickness ratio 𝑓0 are comprised between 0.95 and 0.999 [23]. When 𝑓0 tends to 1,
the sheet tends to a geometrical initially homogeneous domain, leading to higher formability
predictions. No localization can be predicted with this model for a homogeneous metal sheet.
This imperfect sheet is then loaded following different loading paths to investigate its
formability limits. In this paper, a constant and linear loading rate in forces space is chosen
to be consistent with experimental conditions. Noting 𝐹1 and 𝐹2 the major and minor forces
taken in the longitudinal (rolling) and tangential directions, the loading ratio 𝛼 is defined by:
𝛼 =𝐹2
𝐹1 (3)

Experimental and numerical FEM-based determinations of forming limit diagrams of St14 mild steel based
on Marciniak-Kuczynski model
5822
The values of 𝛼 are chosen between 0 and 1, respectively representing uniaxial tension and
equibiaxial tension. In contraction domain, formability limits are shown to be influenced by
the initial orientation of the imperfection band. For a given loading path, different
orientations of the band have then to be envisaged and simulated to detect the most critical
situation leading to the lower formability prediction. Current position of the band can be
expressed as a function of the initial orientation of the band and the strain state [8,24]:
𝑡𝑎𝑛(𝜃) = 𝑒𝑥𝑝(𝜖1 − 𝜖2)𝑡𝑎𝑛(𝜃0) (4)
Strain and stress states are computed and stored for each loading step. Observation of relative
evolutions of the mechanical fields inside and outside the imperfection band shows a superior
increase of the strain rate in the band. This phenomenon leads to a concentration of the strain
inside the band and then to the strain localization. Different localization indicators may then
be constructed to predict localization. In this paper, the out-of-plane strain rate ratio is used
as a strain localization measure. Localization is predicted when this ratio exceeds a user-
predefined value [18]:
𝑆𝑀𝐾 =𝜖33
𝐵
𝜖33𝐴 (5)
It can be shown that the value of this threshold may be taken in a range of, for example, 5 to
10 and that its choice should not influence strain localization predictions as strain rate evolves
exponentially in zone B near localization. Predictions are then not sensitive to this parameter,
but high values of the threshold may lead to numerical instabilities. Different methods may
be set up to implement the M-K model, from purely analytical developments to FEM
simulation. In this paper, this second choice has been favored and ABAQUS software has
been used for numerical applications. A 180 mm x 180 mm length and 1 mm thickness metal
plate modeled on ABAQUS and loaded using a loading ratio α defined in the force space.
The principle load is equal to 400MPa. A geometrical imperfection is introduced in this band
using M-K approach is characterized by its initial thickness ratio and orientation. Different
initial values of these parameters which are used for the simulations are represented in Table
3. One point in the corner of this plate is fixed by Encastre boundary condition and the
displacement of the bottom side is blocked in the transversal direction and the right side is
blocked in the longitudinal direction. Using these loading conditions, evolutions of strain and
strain rate tensors are then stored for two representative elements respectively taken in zones
A and B of a mesh with 21600 linear hexahedral mesh of type C3F8R elements mesh. The
FLDs typical configurations are obtained for particular principal strains ratios as illustrated
below in Figure 3 for α = 0 and an orientation band equal to θ = 20°.

M. Mianroodi et. al / Journal of Mechanical Engineering and Sciences 13(4) 2019 5818-5831
5823
(a) θ = 0° (b) θ = 20°
Figure 2. Strain-Time curves for α = 0.4, θ = 0° (a) and θ = 20° (b).
Figure 3. Max strain for α = 0, θ = 20°.
The simulation continues until reaching the strain localization criterion. Critical strains
values are stored at localization and reported in the FLD represented in Figure 4 for three
different orientations band 0°; 20° and 40°. Shapes of FEM based FLD and sensibility to the
initial orientation of the band are consistent with classical results based on analytical
developments. Formability predictions are for instance influenced by θ in contraction
domain. Final numerical FLD is constructed by selecting the lower points for each loading
path.
Table 3. Numerical properties of the imperfection zone B.
𝐰𝟎𝐁 (mm) 𝐭𝟎
𝐁 (mm) 𝒇𝟎 𝛉
10 0.90 0.90 0° - 40°
10 0.95 0.95 0° - 40°
10 0.99 0.99 0° - 40°

Experimental and numerical FEM-based determinations of forming limit diagrams of St14 mild steel based
on Marciniak-Kuczynski model
5824
Figure 4. Numerical FLD obtained with a FEM based M-K model for different values of
orientation band θ.
EXPERIMENTAL PROCEDURE FOR DETERMINATION OF FLD USING
MULTI-AXIAL TENSILE TESTS
Experimental studies constitute a direct and efficient way to determine FLD. Several testing
procedures have been designed to study sheet metal forming. Among them, Nakazima [14]
and Marciniak tests are probably the most popular and are defined by international standards
such as ASTM E2218-02 and ISO 12004-2:2008 [25-27]. Following these tests, specimens
with different geometries are placed in a stamping press or a testing device equipped
respectively with hemispherical or cylindrical punches [28-30]. These tests require the
presence of specifically developed testing machines, of stamping presses or of special devices
developed to adapt existing tensile machines and the use of several geometries to reproduce
the different strain ratio from uniaxial tensile test to equibiaxial conditions. During the test,
out of plane loads are imposed to the specimen, generating strain gradients in the thickness
direction that are not taken into account in the formulation of classical strain localization
criteria. Other convenient experimental procedures in which the load is applied in the
longitudinal and tangential directions of the sheet during all the test may be used to get closer
experimental and theoretical loading conditions and strain and stress fields [31-32].

M. Mianroodi et. al / Journal of Mechanical Engineering and Sciences 13(4) 2019 5818-5831
5825
Figure 5. Schematic Zwick Biaxial tensile test machine [33-34].
Biaxial traction test is a simple way to investigate the materials behavior under loading and
requires only the presence of biaxial testing machine, specific cross specimens, and digital
image correlation chain to record the displacement field during the test [35]. A Zwick
universal testing machine is used at CAN company to perform the different tests, imposing
different stress or force ratios to reproduce the different loading paths of the FLD, as
represented in Figure 5. For applying the load on flat plates or cruciform specimen in two
different directions, this type of machine is required [36]. The type of load is applied in
compression or tension-type. The load must be applied continuously, symmetrically and the
center of the specimen must stay in the center of the testing machine during the test. This
machine has four arms to apply forces. These forces are applied by hydraulic actuators.
Typically, they used a servo and piston to control system. Schematic of the biaxial tensile
machine is shown in Figure 5. One cross specimen 180 mm x 180 mm, cut in a 1 mm thick
metal sheet by a Siemens 828D CNC machine, is used for every loading condition. The
geometry of them is not specific to the loading path. Some imperfections are preexisting in
the metal sheets due for example to crystallographic effects or to roughness after rolling
operations. These imperfections may be seen as factors favoring the initiation of strain
localization and then as factors equivalent to a preexisting defect. To explore the influence
of M-K initial imperfection hypothesis, imperfection bands are cut in some specimens to
reproduce the geometrical imperfection with a defect ratio 𝑓0 of 0.95.
At the beginning of the test, a 10 N preloaded is applied to each side of the specimen.
Loads are then applied in both directions according to the force loading ratio 𝛼. This ratio is
made varying from 0 to 1 by increments of 0.1 to obtain the different points of the FLD. The
test is continued until strain localization or failure. An example of a load is given in Figure
6. In this case, a force is applied after the preload step up to 400 N in the longitudinal direction
of the sheet during 1.426 s corresponding to a loading ratio 𝛼 of 0.

Experimental and numerical FEM-based determinations of forming limit diagrams of St14 mild steel based
on Marciniak-Kuczynski model
5826
Figure 6. Force-Time curve for experimental test.
Full-field measurement techniques are based on the comparison of the digital image of the
specimen before and after applying a load increment. Displacement and strain fields are then
estimated using and Digital Image Correlation techniques [37-38]. This technic can be
applied to FLD predictions [39-40]. In our study, 25 images of 6Mpx are recorded every
second by an Aramis 3D camera with a timer and are then analyzed using GOM DIC software
to determine the critical strains at localization. Experimental results of FLD obtained for St14
thin sheets and the influence of the introduction of an initial defect in the sheet will be
discussed in the last section.
COMPARISON OF EXPERIMENTAL AND NUMERICAL FLD PREDICTIONS
FOR ST14 MILD STEEL
When designing experimental procedure and numerical simulation, particular attention has
been paid on the reproduction of similar in-plane loading and boundary conditions. With such
close hypothesis, results of experimental and numerical approaches can now be compared on
the commercial nuance of St14 mild steel presented in previous sections.
Numerical FEM-based M-K results are reported in Figure 7 for two initial defect ratio
of 0.95 and 0.99. With a ratio of 0.95, the curve may be approximated by two lines by joining
the predicted limit points at localization. These lines are respectively a decreasing one in the
contraction domain and another one increasing in the expansion. The lower value is given by
the intersection of these lines for plane tension (PT). Noticeable values of major strain at
localization are respectively 0.44, 0.18 and 0.28 for uniaxial tension (UT), plane tension and
equibiaxial expansion (EE). Another curve is obtained for a ratio of 0.99. This curve is
situated above the previous one and values of the major strains of 0.66, 0.22 and 0.36 are
reported for UT, PT, and EE. On Figures 8 and 9, original experimental results are also
plotted for a comparison with a ratio defect of 0.99 and 0.95 respectively. For a ratio of 0.99,
localization is predicted above a major strain of 0.52 for uniaxial traction load. For the rest
of the domain, scatter in results is observable. An interesting line passing close to points with
major strains from 0.45 near uniaxial tension to 0.4 near equibiaxial expansion is observable.
M. Mianroodi et. al / Journal of Mechanical Engineering and Sciences 13(4) 2019 5818-5831
5827
Figure 7. Numerical FLD results for f0=0.95 and f0=0.99.
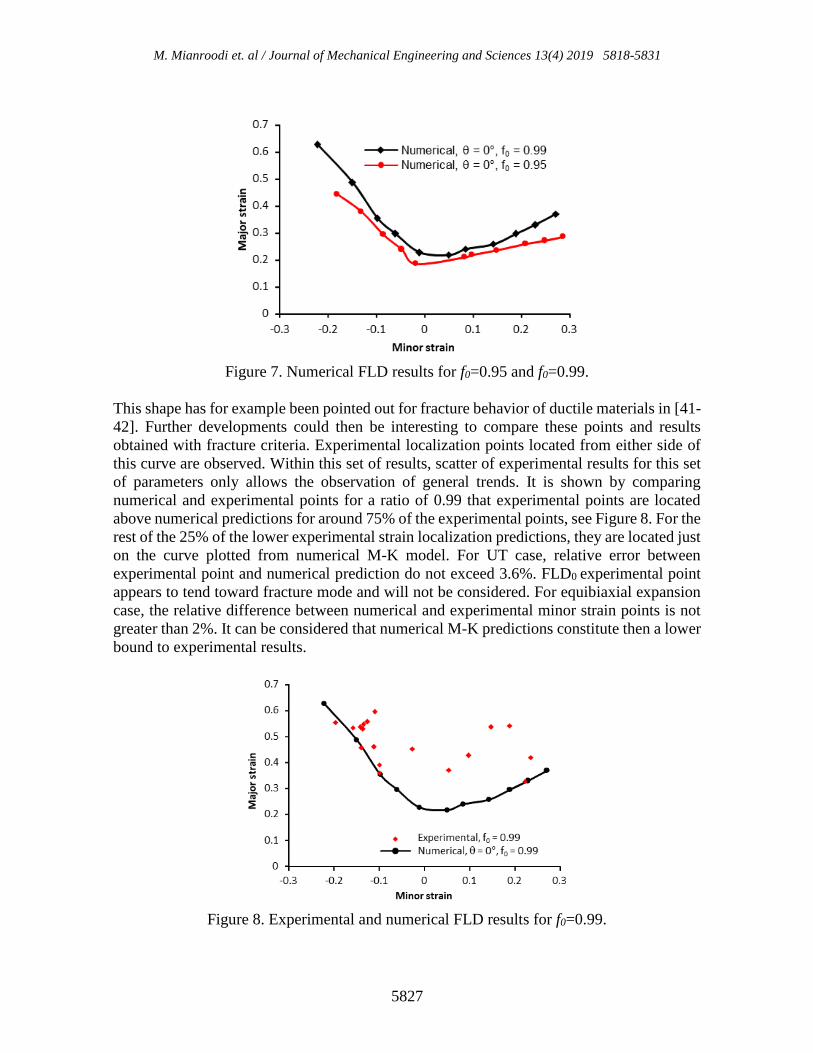
This shape has for example been pointed out for fracture behavior of ductile materials in [41-
42]. Further developments could then be interesting to compare these points and results
obtained with fracture criteria. Experimental localization points located from either side of
this curve are observed. Within this set of results, scatter of experimental results for this set
of parameters only allows the observation of general trends. It is shown by comparing
numerical and experimental points for a ratio of 0.99 that experimental points are located
above numerical predictions for around 75% of the experimental points, see Figure 8. For the
rest of the 25% of the lower experimental strain localization predictions, they are located just
on the curve plotted from numerical M-K model. For UT case, relative error between
experimental point and numerical prediction do not exceed 3.6%. FLD0 experimental point
appears to tend toward fracture mode and will not be considered. For equibiaxial expansion
case, the relative difference between numerical and experimental minor strain points is not
greater than 2%. It can be considered that numerical M-K predictions constitute then a lower
bound to experimental results.
Figure 8. Experimental and numerical FLD results for f0=0.99.

Experimental and numerical FEM-based determinations of forming limit diagrams of St14 mild steel based
on Marciniak-Kuczynski model
5828
For a ratio of 0.95, the results are largely less dispersed (see Figure 9). Minimal values of the
major strain at localization of 0.46, 0.22 and 0.28 are observed respectively for UT, PT, and
EE loading ratios. These ratios are in good accordance with the previously discussed
numerical results. In fact, experimental points might be classed in two groups. A first group
could be constituted by points situated near two lines joining UT-PT and PT-EE experimental
predictions. Another one is grouping upper points located near a line joining UT and EE
predictions. Relative errors between experimental and numerical results are 10%, 22% and
8% respectively for UT, PT and EE. For a defect ratio of 0.95, a good correlation between
numerical and the first group of experimental results is still observable. Excluding one
experimental point, numerical predictions constitute a lower bound to experimental results.
Figure 9. Experimental and numerical FLD results for f0 = 0.95.
CONCLUSIONS
Two complementary approaches have been developed to study strain localization occurring
in commercial St14 mild steel sheets during forming operations. These experimental and
numerical approaches are designed to study the formability of metal sheets by reproducing
the same planar loading and boundary conditions. The experimental procedure is based on
conventional biaxial tensile testing machine instrumented with DIC devices for displacement
field measurement. It allows the determination of FDL without requiring any development
of specific FLD mounting or the use of specific FLD testing machine. Strain localization is
studied on experimental specimens with initial defects introduced by a digital milling
machine. The second approach relies on a numerical FEM implantation of Marciniak-
Kuczynski model. In this procedure, strain localization is expected to appear in zone
presenting an initial thickness defect. The fully 3D finite transformation framework is
implemented in ABAQUS FEM software. This implementation is versatile and easily
adaptable to a large class of materials including elasto-plastic or visco-plastic behaviors. This
numerical procedure allows strain localization predictions using material parameters

M. Mianroodi et. al / Journal of Mechanical Engineering and Sciences 13(4) 2019 5818-5831
5829
commonly available from datasheets without being sensitive to damage parameters
identification strategies.
Experimental and numerical procedures are then applied and compared on St14 mild
steel. A set of original experimental results is proposed in this paper. Both give close results
for sheets presenting initial defect ration of 0.95. Relative errors between experimental and
numerical results are 10%, 22% and 8% respectively for uniaxial tension (UT), plane tension
(PT) and equibiaxial expansion (EE). For an initial ratio of 0.99, relative errors between
experimental and numerical results are below 4% and 2% respectively for UT and EE, but
experimental results do not seem being significant for PT. Application of these experimental
and numerical procedures on commercial St14 mild steel leads then to limited relative
differences between lower experimental points and numerical forming limits predictions. The
numerical one is slightly more conservative and seems then suitable for estimating FLD with
a safety coefficient. For smaller initial defects, further developments should be carried out to
relate results with fracture criteria.
REFERENCES
[1] Gamsamer M. Strength and Ductility. Trans. ASM. 1946.
[2] Keeler SP, Backofen WA. Plastic instability and fracture in sheets stretched over rigid
punches. Trans. ASM. 1963; 56:25-48.
[3] Keeler SP. Determination of forming limits in automotive stampings. Sheet Metal
Industries. 1963; 42:683-91.
[4] Goodwin GM. Application of strain analysis to sheet metal forming problems in the
Press Shop. SAE Technical Paper: 60:767-774; 1968.
[5] Altmeyer G, Abed-Meraim F, Balan T. Comparison of forming limit diagrams
predicted with different localization criteria. Steel Research International. 2008;
79(1):24-31.
[6] Abed-Meraim F, Balan T, Altmeyer G. Investigation and comparative analysis of
plastic instability criteria: Application to forming limit diagrams. The International
Journal of Advanced Manufacturing Technology. 2014; 71(5-8):1247-1262.
[7] Marciniak Z, Kuczynski K. Limit strains in the process of stretch forming sheet metal.
International Journal of Mechanical Sciences. 1967; 613-620.
[8] Hutchinson JW, Neale KW, Needleman A. Sheet Necking-I. Validity of plane stress
assumption of the long-wave length approximation. Mechanics of Sheet Metal
Forming. 1978; 116-126.
[9] Marciniak Z, Kuczynski K, Pokora T. Influence of the plastic properties of a material
on the forming limit diagram for sheet metal in tension. International Journal of
Mechanical Sciences. 1973;15:789-805.
[10] Marciniak Z. Sheet Metal Forming Limits. In: Koistinen D.P., Wang NM, editors.
Mechanics of Sheet Metal Forming. Springer, Boston, MA, 1978, 215-235.
[11] Koistinen DP, Wang NM. Mechanics of sheet metal forming: material behavior and
deformation analysis. Plenum Press New York, Springer US, 1978.
[12] Banabic D. A review on recent developments of M-K model. Computer Methods in
Materials Science. 2010; 10(4):225-237.
[13] Banabic D. Sheet metal forming, Springer, 2010.

Experimental and numerical FEM-based determinations of forming limit diagrams of St14 mild steel based
on Marciniak-Kuczynski model
5830
[14] Nakazima K, Kikuma T, Hasuka K. Study on the formability of steel sheets. Yamata
Technical Report: 264:8517-8530; 1968.
[15] Marciniak Z, Duncan JL, Hu SJ. Mechanics of sheet metal forming. Butterworth
Heinemann, Oxford, 2002.
[16] Toroghinejad M, Dini G. Effect of Ti-micro alloy addition on the formability and
mechanical properties of a low carbon (ST14) steel. International Journal of Iron &
Steel Society of Iran. 2006; 3:1-6.
[17] Lemaitre J, Chaboche JL. Mechanics of Solid Materials. Cambridge University Press,
1990.
[18] Evangelista SH, Lirani J, A Al-Qureshi H. Implementing a modified Marciniak-
Kuczynki model using the FEM for the simulation of sheet metal deep drawing.
Journal of Materials Processing Technology. 2002; 130-131:135-144.
[19] Robert Laminage SA Robert 2 St14 Pressing Steel DC04 DIN1.0338 technical
datasheet. Retrieved from http://www.robertlaminage.ch ; 11 June 2018.
[20] Altmeyer G. Modélisation théorique et numérique des critères d’instabilité plastique.
Application à la prédiction des phénomènes de striction et de localisation lors
d’opérations de mise en forme par emboutissage. Dissertation, Arts et Métiers
ParisTech, 2011.
[21] Ghosh AK. Strain localization in the diffuse neck in sheet metal. Metallurgical and
Mater Transactions B. 1974; 5(7):1607-1616.
[22] Altmeyer G, Abed-Meraim F, Balan T. Investigation of some localization criteria and
their relevance to prediction of forming limit diagrams. Steel Research International.
2010; 81(9):1364-1367.
[23] Butuc MC, da Rocha AB, Gracio JJ, Duarte JF. A more general model for forming
limit diagrams prediction. Journal of Materials Processing Technology. 2002; 125-
126:213-218.
[24] Cao J, Yao H, Karafillis A. Prediction of localized thinning in sheet metal using a
general anisotropic yield criterion. International Journal of Plasticity. 2000; 16:1105-
1129.
[25] Xu L, Chen L, De Cooman B, Steglich D, Barlat F. Hole expansion of advanced high
strength steel sheet sample. International Journal of Material Forming. 2010; 3:247-
250.
[26] ASTM E2218-02 Standard Test Method for Determining Forming Limit Curves.
ASTM International, West Conshohocken, PA; 2008.
[27] International organization for standardization ISO 12004-2:2008 Metallic materials -
Sheet and strip - Determination of forming-limit curves - Part 2: Determination of
forming-limit curves in the laboratory; 2008.
[28] Hotz W, Timm J. Experimental determination of forming limit curves (FLC). P. Hora
(Ed.), Procedings of the 7th Numisheet Conference and Workshop, Interlaken,
Switzerland, 271-278; 2008.
[29] Banabic D, Lazarescu L, Paraianu L, Ciobanu I, Nicodim I, Comsa DS. Development
of a new procedure for the expermimental determination of the forming limit Curves.
CIRP Annals Manufacturing Technology. 2013; 255-258.
[30] Chu X. Caractérisation expérimentale et prédiction de la formabilité d’un alliage
d’aluminium en fonction de la température et de la vitesse de déformation.
Dissertation, INSA de Rennes, 2013.

M. Mianroodi et. al / Journal of Mechanical Engineering and Sciences 13(4) 2019 5818-5831
5831
[31] Song X, Leotoing L, Guines D, Ragneau E. Investigation of the forming limit strains
at fracture of AA5086 sheets using an in-plane biaxial tensile test. Engineering
Fracture Mechanics. 2016; 163:130-140.
[32] Song X, Leotoing L, Guines D, Ragneau E. Characterization of forming limits at
fracture with an optimized cruciform specimen:Application to DP600 steel sheets.
International Journal of Mechanical Sciences. 2017; 126:35-43.
[33] Zwick Roell technical datasheet. Retrieved from https://www.zwickroell.com.
[34] Alejandro D, Escarpita A, Cardenas D, Elizalde H, Ramirez R, Probst O. Biaxial
Tensile Strength Characterization of Textile Composite Materials. INTECH, 2012;
83-106.
[35] Tasan CC, Hoefnagels JPM, Dekkers ECA, Geers MGD. Multi-axial deformation
setup for microscopic testing of sheet metal to fracture. Experimental Mechanics.
2012; 52: 669-678.
[36] Vempati SR, Brahama Raju K, Venkata Subbaiah K. Simulation of Ti-6Al-4V
cruciform welded joints subjected to fatigue load using XFEM. Journal of Mechanical
Engineering and Sciences. 2019; 13: 5371-5389.
[37] Haris A, Tay TE, Tan VBC. Experimental analysis of composite bolted joints using
digital image correlation. Journal of Mechanical Engineering and Sciences. 2017; 11:
2443-2455.
[38] Samantaray BB, Mohanta CK. Analysis of industrial flame characteristics and
constancy study using image processing technique. Journal of Mechanical
Engineering and Sciences. 2015; 9: 1604-1613.
[39] Brunet M, Mguil-Touchal S, Morestin F. Numerical and experimental analysis of
necking in 3d sheet forming processes using damage variable. International Applied
Mechanics. 1997; 45:205-214.
[40] Wang K, Carsley JE, He B, Li J, Zhang L. Measuring limit strains with digital image
correlation analysis. Journal of Materials Processing Technology. 2014; 5:1120-
1130.
[41] Martinez-Donaire AJ, Garcia-Lomas FJ, Vallellano C. New approaches to detect the
onset of localised necking in sheets under through-thickness strain gradients.
Materials & Design. 2014; 57:135-145.
[42] Centeno G, Martinez-Donaire AJ, Morales-Palma D, Vallellano C, Silva MB,
Martins PAF. Novel experimental techniques for the determination of the forming
limits at necking and fracture, Materials forming and machining. Ed. Davim JP.,
Woodhead publishing in mechanical engineering, 2015.