experimental and characterization techniques for lsmo...
TRANSCRIPT

Chapter 3
Experimental And
Characterization Techniques For
LSMO Nanoparticles


Chapter 3
Centre For Interdisciplinary Research, DYPU, Kolhapur 70
3.1 Introduction
This chapter focuses on the synthesis and experimental techniques
employed for characterizations. There are many routes in the synthesis of
MNPs. However, synthesis of the sample in single phase is the most
imperative part of the research work. According to the literature survey,
several methods have been embraced for the synthesis of LSMO which are
reviewed in last chapter. In current research work, SPM LSMO NPs are
synthesized by combustion method due to enormous advantages which has
been discussed in below. The different analytical techniques used for phase
analysis, composition study, elemental analysis, structural and morphological
analysis of the prepared samples are described with principle and working.
3.2 Experimental
3.2.1 Mechanism of combustion method
Combustion synthesis (CS) is a versatile, simple and rapid process,
which allows efficient synthesis of a variety of nanomaterials. In this process
mainly a self-sustained reaction in homogeneous solution of different
oxidizers (e.g., metal nitrates) and fuels (e.g., urea, glycine, hydrazides) takes
place. It occurs at low temperature which offers a unique mechanism via a
highly exothermic redox reaction to produce oxides. Mainly, depending on
the type of the precursors, and on conditions used for the process
organization, the CS may occurs as either volume or layer-by-layer
propagating combustion modes. Several processing factors such as C/H ratio
(type of fuel), the fuel to oxidizer ratio (F/O), and the water content of the
precursor mixture and the ignition temperature mainly influences the
combustion reaction.
CS is also recognized as self-propagating high-temperature synthesis
(SHS). In CS there is the exothermic oxidation of a fuel. The word
„combustion‟ itself suggests flaming (gas-phase), smouldering heterogeneous
Chapter 3
Centre For Interdisciplinary Research, DYPU, Kolhapur 71
as well as explosive reaction. In this method, the powder characteristics such
as crystallite size, surface area, size distribution and nature of agglomeration
are basically controlled by enthalpy or flame temperature generated during
combustion which itself dependent on the nature of the fuel and fuel-to-
oxidizer ratio [1]. Main advantages of CS are (i) Use of relatively simple
equipment (ii) Formation of high-purity products (iii) Stabilization of
metastable phases (iv) Formation of different sizes such as micro, nano and
shape like spherical, hexagonal and rod like products. Uniform distribution of
dopants takes place through the host material due to the atomic mixing of the
reactants in the initial solution. This method has been proven to be a best
technique to achieve various types of oxides at the nanometre scale and is
used for a variety of technological applications and this broad range of oxides
is prepared with an eye on their magnetic, mechanical, dielectric, catalytic,
optical and luminescent characteristics. Out of various combustion sub types
the solution combustion (SC) method of preparing oxide materials is a fairly
recent development compared to SSC or SHS techniques. In present research
SC is employed for synthesis of LSMO NPs.
The important parameters of combustion that have been broadly
studied are: type of flame, combustion temperature, evolved gases, air-fuel-
oxidant ratio and chemical composition of the precursor reagents. The
characteristic of the SC method is, after initiation locally, the self- sustained
propagation of a reaction wave through the heterogeneous mixture of
reactants. Under controlled conditions, SC reaction, generates a peculiar kind
of burning or smoldering type flame, depending on the used fuel and oxidizer-
fuel ratio. The burning flame may be capable of endure for seconds or even
minutes, while the smoldering flame does not rise or is extinguished in a few
seconds. The type of flame in the combustion plays a vital role in controlling
the particle size of as-synthesized materials. There are four important
temperatures which can affect the reaction mechanism and final product

Chapter 3
Centre For Interdisciplinary Research, DYPU, Kolhapur 72
properties during the CS reaction. These are initial temperature, ignition
temperature, adiabatic flame temperature and maximum flame temperature.
Initial temperature is defined as the average temperature of the reagent
solution before the reaction is ignited. Ignition temperature is the point at
which the combustion reaction is dynamically activated without an additional
supply of external heat. Adiabatic flame temperature represents the maximum
combustion temperature achieved under adiabatic conditions. And the
maximum flame temperature is the highest temperature reached in the actual
configuration, i.e., under conditions that are not adiabatic [2].
Evolution of gases is another important parameter which affects on
combustion reaction. Mainly, in CS, the powder morphology, particle size and
surface area are directly related to the amount of gases that escape during
combustion. The difference in particle size, using different fuels, depends on
the number of moles of gaseous products released during combustion. Pores
between the particles are produced when gases breaks large clusters. In this
process one of the most important parameters in determining the properties of
synthesized material is fuel-oxidant ratio. A fuel is a substance capable of
breaking and burning the CH bonds (electrons acceptor). An oxidant is a
substance which helps in burning, supplying oxygen (electrons donor) [3].The
effect of gases on the morphology of the particles is studied by the oxidant
fuel ratio. Excellent quality product homogeneity is accomplished by the use
of chemical precursors intimately mixed. The type and amount of chemicals
used in the reactions influences on the characteristic features of the resultant
powders. The solubility of the fuel, the presence of water and type of fuel
used, are essential. Mainly, in solution, mixtures of metal nitrates (oxidizers)
and urea or glycine (fuel) are broken down quickly via deflagration burning or
combustion. To realize the highly exothermic nature of this reaction, concepts
used in propellant chemistry were used. A solid propellant contains an
oxidizer like ammonium perchlorate and a fuel like carboxyl terminated
Chapter 3
Centre For Interdisciplinary Research, DYPU, Kolhapur 73
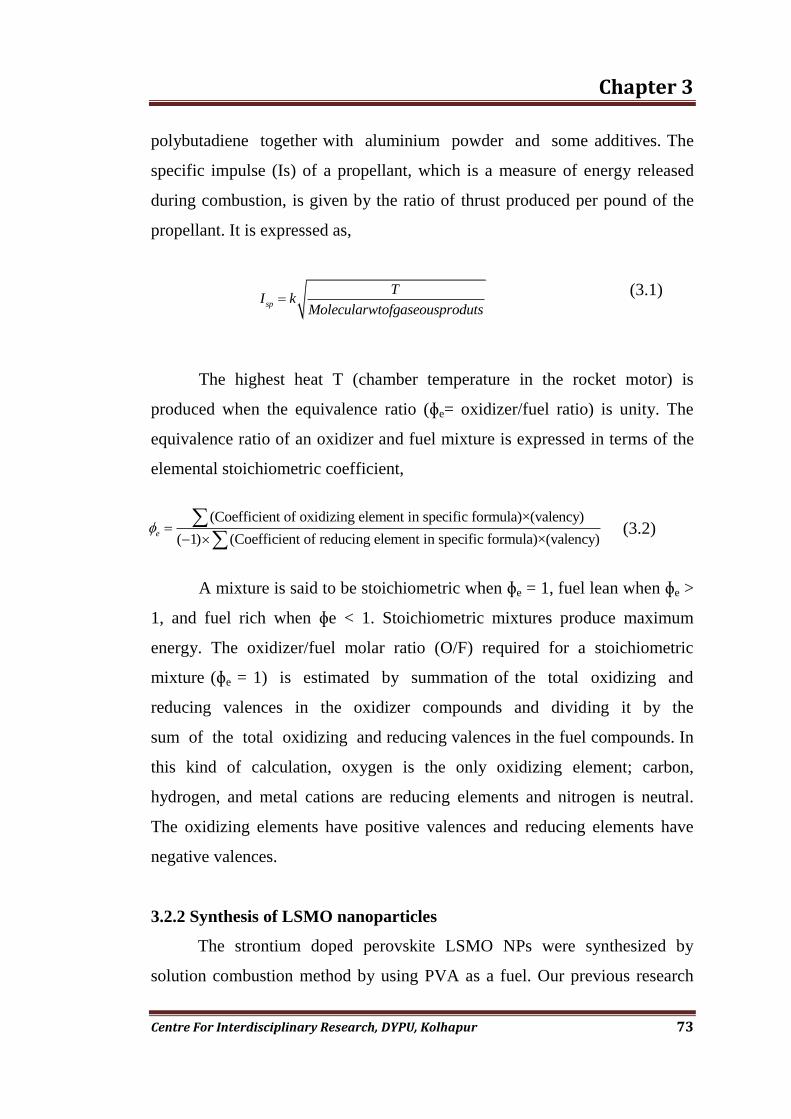
polybutadiene together with aluminium powder and some additives. The
specific impulse (Is) of a propellant, which is a measure of energy released
during combustion, is given by the ratio of thrust produced per pound of the
propellant. It is expressed as,
(3.1)
The highest heat T (chamber temperature in the rocket motor) is
produced when the equivalence ratio (ɸe= oxidizer/fuel ratio) is unity. The
equivalence ratio of an oxidizer and fuel mixture is expressed in terms of the
elemental stoichiometric coefficient,
(3.2)
A mixture is said to be stoichiometric when ɸe = 1, fuel lean when ɸe >
1, and fuel rich when ɸe < 1. Stoichiometric mixtures produce maximum
energy. The oxidizer/fuel molar ratio (O/F) required for a stoichiometric
mixture (ɸe = 1) is estimated by summation of the total oxidizing and
reducing valences in the oxidizer compounds and dividing it by the
sum of the total oxidizing and reducing valences in the fuel compounds. In
this kind of calculation, oxygen is the only oxidizing element; carbon,
hydrogen, and metal cations are reducing elements and nitrogen is neutral.
The oxidizing elements have positive valences and reducing elements have
negative valences.
3.2.2 Synthesis of LSMO nanoparticles
The strontium doped perovskite LSMO NPs were synthesized by
solution combustion method by using PVA as a fuel. Our previous research
(Coefficient of oxidizing element in specific formula)×(valency)
( 1) (Coefficient of reducing element in specific formula)×(valency)e
sp
TI k
Molecularwtofgaseousproduts

Chapter 3
Centre For Interdisciplinary Research, DYPU, Kolhapur 74
work reported that PVA fuel as a potential candidate for preparation of LSMO
in biomedical field [4-5].
La (NO3)3·6H2O, Sr (NO3)2.4H2O and Mn
(NO3)2·4H2O were used as the starting reactant precursors and were obtained
from Sigma Aldrich (99.9%). The stoichiometric amounts of all these
precursors which act as oxidants were dissolved separately in double distilled
water (DDW) under constant stirring for about 10 minute to form the solution
of uniform mixture of 0.1 M. The solution of PVA was prepared by same way
by dissolving in DDW under constant stirring about an hour. The mixture was
then kept in beaker and stirred for 30 min at 100 ºC to achieve the
homogenous solution. The solution was then converted in to yellowish gel
which was further subjected to hot plate preheated to 300 ºC. During this
process, foams of LSMO produced along with sparks. Foam does not initiate
ignition only helps to sustain combustion. At the time of ignition CO2, H2O
and N2 gases evolved which were responsible for combustion to escape the
foam, yielding a voluminous fluffy black coloured product. The maximum
exothermic temperature of the redox reaction was reached between 1000-
1500 ºC.
Assigning the +4, +1, +3, +2 and +2 valencies to the C, H, La3+
, Sr2+
,
and Mn2+
, reducing elements, respectively, the -2 valency to O2-
oxidizer and
assuming nitrogen with the valence 0, 4 then the ɸe is determined according to
the equation (3.2). For this stoichiometric combustion (ɸe =1), 2.29% of the
PVA solution is required to balance the oxidation and reduction valences in
the solution. The resulting black coloured powder crushed with mortar and
pestle, annealed at 800 ºC for 5 hour, and then used for further
characterization. The possible combustion reaction is as follows:
(3.3)
3 3 3 2 3 2 2 4 2
0.7 0.3 3 2 2 2
0.7La (NO ) + 0.3Sr (NO ) + Mn (NO ) + 2.29(-C H O) + 1.5O
La Sr MnO + 4.58H O + 2.35N + 4.58CO

Chapter 3
Centre For Interdisciplinary Research, DYPU, Kolhapur 75
3.3 Characterization techniques
In order to investigate different properties of LSMO NPs various
characterization techniques are required. Different techniques provide
different information, some about chemical and physical properties, and
others about structure, morphology and geometry. The different techniques
are used in the present work which includes X-ray Diffraction (XRD), Fourier
Transform Infrared Spectroscopy (FT-IR), Inductively Coupled Plasma
Optical Emission Spectroscopy (ICP OES), Field Emission Scanning Electron
Microscopy (FE-SEM), Vibrating sample Magnetometer (VSM),
Transmission electron microscopy (TEM), Zeta measurement, Dynamic light
scattering (DLS) and Induction Heating system etc.
3.3.1 Structural and phase analysis
3.3.1.1 XRD
XRD is a versatile non-destructive technique which is one of the
important fundamental tools employed in solid state chemistry and materials
science. This technique is used to identify crystalline phase, chemical
composition, strain state, grain size preferred orientation and defect structure.
X-rays are the electromagnetic radiations having wavelength 1 A˚ The basic
principles of X-ray diffraction are found in classic textbooks, e.g. by
Cullity [8] and Guinebretiere [9].
The diffraction of X-rays mainly occurs only when the wavelength
of the wave motion is of the same order of magnitude as the repeat distance
between scattering centres. The scientist Bragg studied the diffraction from
crystalline material and formulated the mathematical expression known as
Bragg‟s law and is expressed as [10],
(3.4)
2 sind n
Chapter 3
Centre For Interdisciplinary Research, DYPU, Kolhapur 76
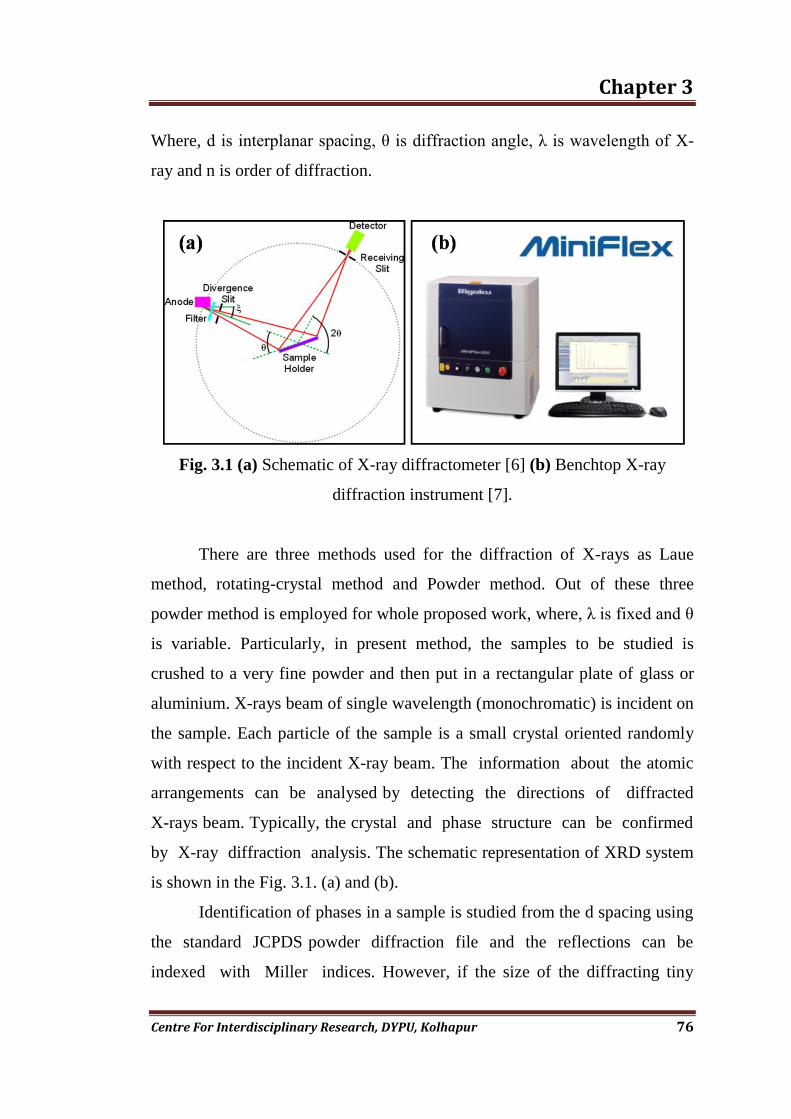
Where, d is interplanar spacing, θ is diffraction angle, λ is wavelength of X-
ray and n is order of diffraction.
Fig. 3.1 (a) Schematic of X-ray diffractometer [6] (b) Benchtop X-ray
diffraction instrument [7].
There are three methods used for the diffraction of X-rays as Laue
method, rotating-crystal method and Powder method. Out of these three
powder method is employed for whole proposed work, where, λ is fixed and θ
is variable. Particularly, in present method, the samples to be studied is
crushed to a very fine powder and then put in a rectangular plate of glass or
aluminium. X-rays beam of single wavelength (monochromatic) is incident on
the sample. Each particle of the sample is a small crystal oriented randomly
with respect to the incident X-ray beam. The information about the atomic
arrangements can be analysed by detecting the directions of diffracted
X-rays beam. Typically, the crystal and phase structure can be confirmed
by X-ray diffraction analysis. The schematic representation of XRD system
is shown in the Fig. 3.1. (a) and (b).
Identification of phases in a sample is studied from the d spacing using
the standard JCPDS powder diffraction file and the reflections can be
indexed with Miller indices. However, if the size of the diffracting tiny

Chapter 3
Centre For Interdisciplinary Research, DYPU, Kolhapur 77
crystal is small, there is no more complete destructive interference at θ±dθ,
which broadens the peak corresponding to diffracted beam in proportion to
the size of the tiny crystal and that can be used to calculate the particle size.
The relation for the same is given by Debye Scherrer formula,
(3.5)
Where, D is particle size, θ is diffraction angle, λ the wavelength of X-rays
and is Full Width at Half Maxima (FWHM).
Fig. 3.2 A typical XRD pattern LSMO NPs.
The phase composition, lattice parameter and the mean size of the
crystallites of LSMO NPs were determined by XRD (RIGAKU Miniflex 600)
equipped with a crystal monochromator employing Cu-Kα radiation of
wavelength 1.54 Å and applied scanning rate of 3ºmin-1
, ranged from 20 to
80°. The patterns were analysed by X'Pert High score software and compared
with standard JCPDS (reference code: 00-051-0409). The average crystallite
size was calculated from the broadening of the XRD peaks using the
Scherrer‟s equation. Fig. 3.2 show a typical XRD pattern of LSMO NPs.
0.9
cosD

Chapter 3
Centre For Interdisciplinary Research, DYPU, Kolhapur 78
3.3.1.2 FT-IR
The main aim of this technique is to find the changes in the intensity of
beam of infrared radiation as a function of wavelength or frequency after it
interacts with the specimen. Quantitative and qualitative measurements of the
organic and inorganic samples can be determined with this technique. The
spectra provides information about the identification of the chemical bonds in
molecule by recording an infrared absorption spectrum that is like a molecular
"fingerprint" [11-13]. In biomedicine the MNPs must be coated with organic
or inorganic material in order to enhance stability, dispersibility and
biocompatibility. The FT-IR analysis helps to understand the successful
attachment of coating agent on the surface off MNPs. The schematic of the
FT-IR spectrometer is shown in Fig. 3.3 (a).
Fig. 3.3 (a) Block diagram of optical FT-IR Spectrometer [14], (b) FT-IR
spectrum of LSMO NPs.
Michelson interferometer is generally used in FT-IR spectrometry. The
interferometer consists of two perpendicularly plane mirrors, one of which
can travel in a direction perpendicular to the plane. A semi-reflecting film,
known as beam splitter, bisects the planes of these two mirrors. The beam
splitter material is decided according to the region to be examined. For the
Chapter 3
Centre For Interdisciplinary Research, DYPU, Kolhapur 79
mid- or near-infrared regions materials like germanium or iron oxide are
covered onto an „infrared-transparent‟ substrate as like potassium bromide or
caesium iodide to produce beam splitters. In this technique mainly, a chemical
substance shows selective absorption in the infrared region. The wavelength
of absorption depends on relative masses of the atoms, force constants of the
bonds and geometry of atoms. Then the molecules of the chemical substance
vibrate at many rates of vibrations, giving rise to close packed absorption
bands. The IR absorption spectrum may extend over a wide range of
wavelength. In spectrum each band corresponds to the characteristic
functional groups and bonds present in a compound.
FT-IR spectra of the synthesized LSMO NPs were collected on a
Perkin Elmer spectrometer model no. 783 USA. FT-IR spectrum of a LSMO
NPs is shown in Fig. 3.3 (b).
3.3.2 Elemental analysis
3.3.2.1 ICP OES
ICP/OES is one of the most powerful and popular analytical technique
for the determination of traces elements. In this method when plasma energy
is given to an analysis sample from outside, the component elements (atoms)
are excited. When the excited atoms return to low energy position, emission
rays (spectrum rays) are released and the emission rays that correspond to the
photon wavelength are measured. The element type is determined based on
the position of the photon rays, and the content of each element is determined
based on the rays intensity.
To generate plasmas first, argon gas is supplied to torch coil, and high
frequency electric current is applied to the work coil at the tip of the torch
tube. Using the electromagnetic field created in the torch tube by the high
frequency current, argon gas is ionized and plasma is generated. This plasma
has high electron density and temperature (10000K) and this energy is used in
Chapter 3
Centre For Interdisciplinary Research, DYPU, Kolhapur 80
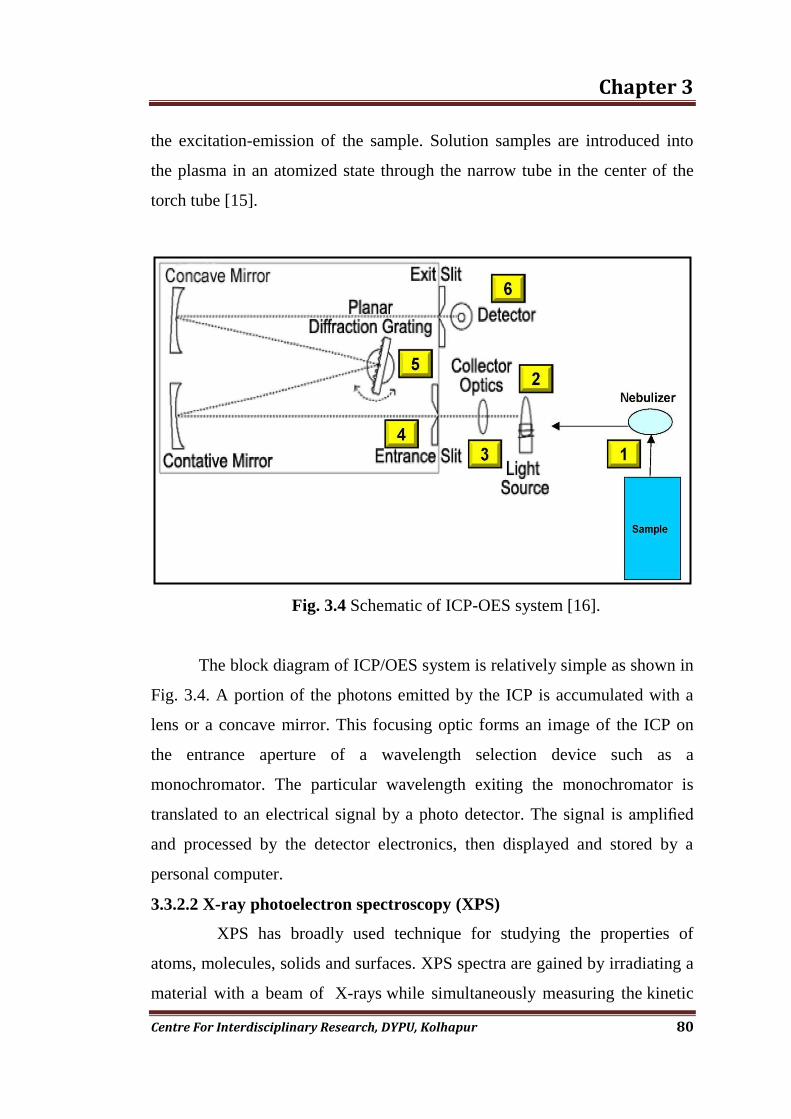
the excitation-emission of the sample. Solution samples are introduced into
the plasma in an atomized state through the narrow tube in the center of the
torch tube [15].
Fig. 3.4 Schematic of ICP-OES system [16].
The block diagram of ICP/OES system is relatively simple as shown in
Fig. 3.4. A portion of the photons emitted by the ICP is accumulated with a
lens or a concave mirror. This focusing optic forms an image of the ICP on
the entrance aperture of a wavelength selection device such as a
monochromator. The particular wavelength exiting the monochromator is
translated to an electrical signal by a photo detector. The signal is amplified
and processed by the detector electronics, then displayed and stored by a
personal computer.
3.3.2.2 X-ray photoelectron spectroscopy (XPS)
XPS has broadly used technique for studying the properties of
atoms, molecules, solids and surfaces. XPS spectra are gained by irradiating a
material with a beam of X-rays while simultaneously measuring the kinetic
Chapter 3
Centre For Interdisciplinary Research, DYPU, Kolhapur 81
energy and number of electrons that escape from the top 0 to 10 nm of the
material being analyzed. It is based on the principle of photoelectric effect. In
the working of XPS, electrons are released from the sample as a result of a
photoemission process. An electron is emitted from an atomic energy level by
an X-ray photon, mostly from an Al-Kα or Mg-Kα primary source, and its
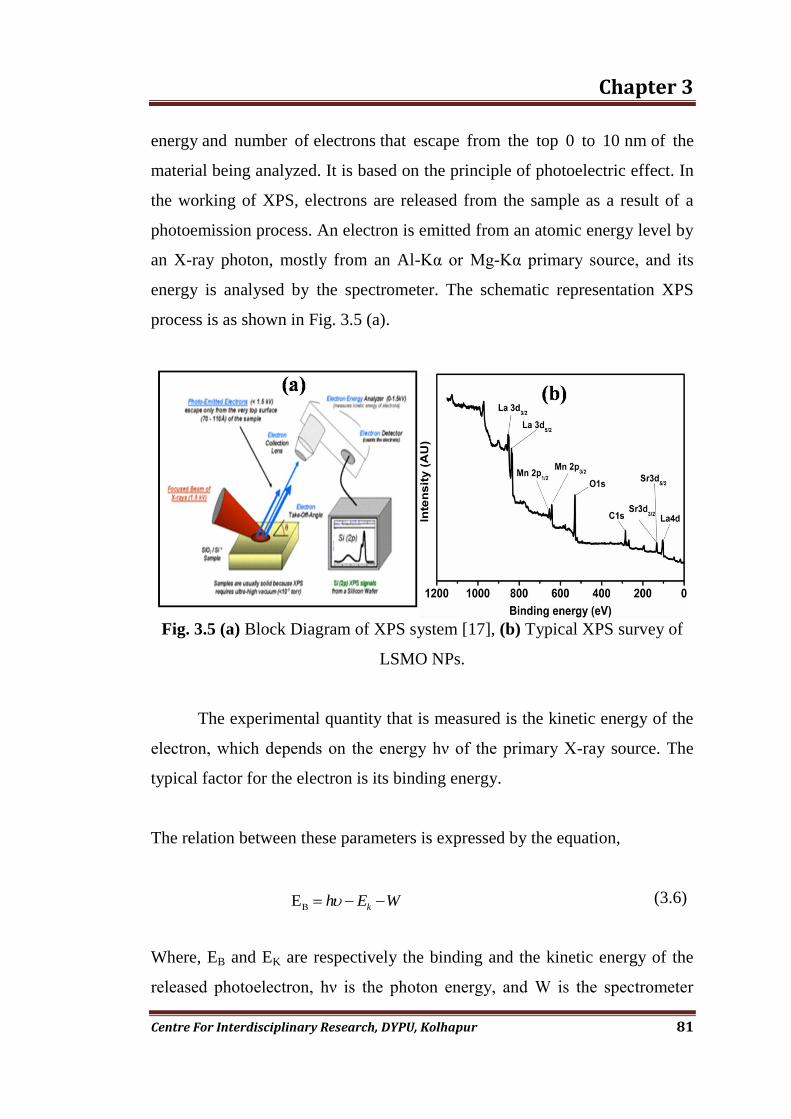
energy is analysed by the spectrometer. The schematic representation XPS
process is as shown in Fig. 3.5 (a).
Fig. 3.5 (a) Block Diagram of XPS system [17], (b) Typical XPS survey of
LSMO NPs.
The experimental quantity that is measured is the kinetic energy of the
electron, which depends on the energy hν of the primary X-ray source. The
typical factor for the electron is its binding energy.
The relation between these parameters is expressed by the equation,
(3.6)
Where, EB and EK are respectively the binding and the kinetic energy of the
released photoelectron, hν is the photon energy, and W is the spectrometer
B E kh E W

Chapter 3
Centre For Interdisciplinary Research, DYPU, Kolhapur 82
work function. In a first approximation, the work function is the major
difference between the energy of the Fermi level EF and the energy of the
vacuum level EV, which is the zero point of the electron energy scale,
(3.7)
This quantity has been calculated by calibration for the spectrometer used.
From Equation (3.7) it is obvious that only binding energies lower than the
exciting radiation (1486.6 eV for Al-Kα and 1253.6 eV for Mg-Kα) are
probed. Each element has a distinguishing electronic structure and thus a
characteristic XPS spectrum. Fig. 3.5 (b) shows the XPS spectrum of LSMO.
3.3.3 Morphological Study
3.3.3.1 FE-SEM
Field emission microscopy (FEM) is a powerful tool used in materials
science to investigate molecular surface structures and their electronic
properties. In FE-SEM a field-emission cathode in the electron gun
provides narrower probing beams at low as well as high electron energy.
It consists of a metallic sample in the form of a sharp tip and a conducting
fluorescent screen enclosed in ultrahigh vacuum. This typical arrangement
over SEM results in to improved spatial resolution and minimized
sample charging and damage. In actual working process electrons are
liberated from a field emission source and accelerated in a high electrical field
gradient. In the high vacuum region these so-called primary electrons are
focussed and deflected by electronic lenses to produce a narrow scan beam
that bombards the object. As a result secondary electrons are emitted from
each spot on the object. The angle and velocity of these secondary electrons
communicates to the surface structure of the object. A detector collects the
secondary electrons and produces an electronic signal. This signal is
F VW E E

Chapter 3
Centre For Interdisciplinary Research, DYPU, Kolhapur 83
amplified and transformed to a video scan-image. Then images can be
displayed on monitor and processed further. Fig. 3.6 (a) represents schematic
of the FESEM system. Fig. 3.6 (b) shows FE SEM image of LSMO NPs.
Fig. 3.6 (a) Schematic of the FESEM system [18], (b) FE SEM images of
LSMO NPs.
3.3.3.2 TEM
TEM is one of the important technique based on the use of electrons
rather than light to examine the structure and behaviour. The TEM image
gives more depth knowledge of morphology and direct estimation of its
size distribution of the nanomaterials. This method has been used for high
resolution imaging as well as chemical and structure study on atomic level.

Chapter 3
Centre For Interdisciplinary Research, DYPU, Kolhapur 84
Fig. 3.7 (a) Ray diagram of Transmission electron microscope [20], (b) TEM
images of LSMO NPs.
Schematic 3.7 (a) shows ray diagram for transmission electron
microscope. In actual working of TEM, an electron gun at the top produces
the stream of monochromatic electrons. This stream of electrons is focused to
a small, thin, coherent beam by the use of two coherent lenses. When a beam
of electrons bombards on the sample, part of it gets transmitted. This
transmitted portion is focused by the objective lens into an image. There is a
mandatory requisite of sample for TEM analysis is, it must be thin enough to
allow the electrons to be transmitted. The recommended thickness of the
material for TEM is about 0.5 μm. For Preparation of sample for TEM
analysis, the sample to be analyzed is dispersed in some dispersive media
(inert to powder) to form colloidal solution, then a drop of solution is kept on
a conducting grid of copper or silver (sq. size is ~1 μm) and dried. This dried
grid is then act as specimen for analysis using TEM. In present work, the
shape, size and uniformity of the NPs were measured by TEM and high
resolution TEM (HR-TEM) with TECNAI F20 Philips operated at 200 KV.
The typical TEM image of LSMO NPs is shown Fig. 3.7 (b) [19].
Chapter 3
Centre For Interdisciplinary Research, DYPU, Kolhapur 85
3.3.4 Colloidal stability Study
3.3.4.1 Zeta potential
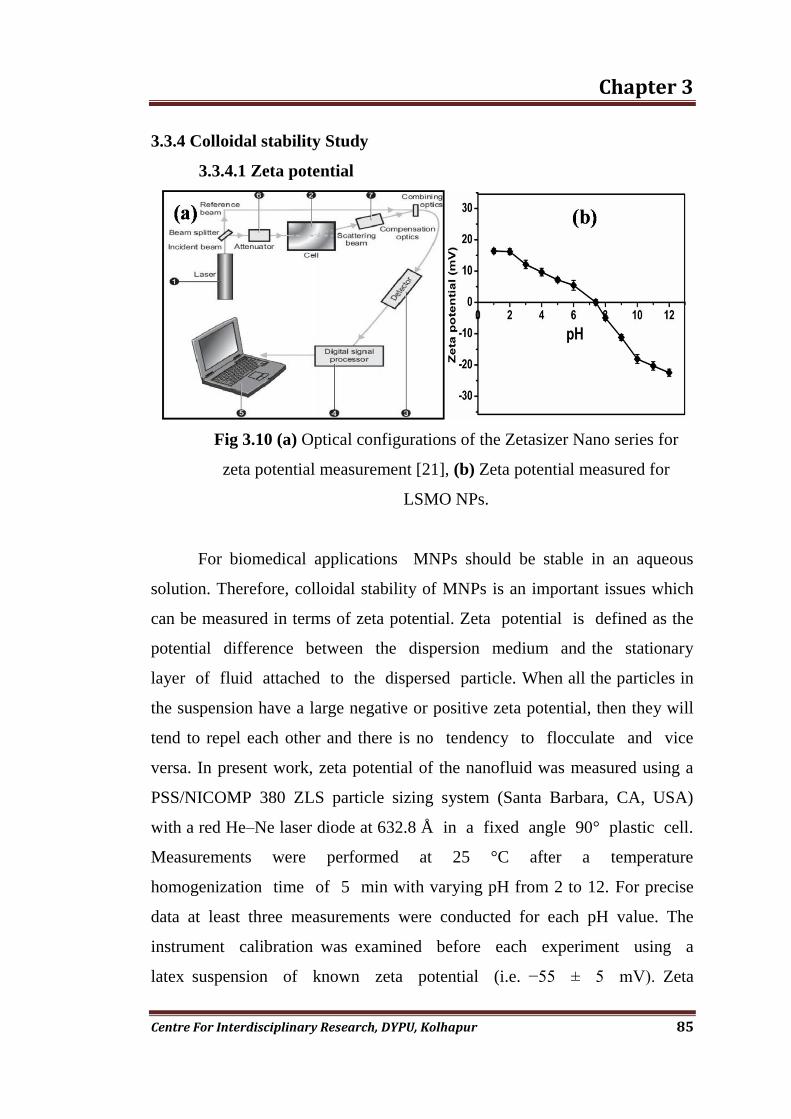
Fig 3.10 (a) Optical configurations of the Zetasizer Nano series for
zeta potential measurement [21], (b) Zeta potential measured for
LSMO NPs.
For biomedical applications MNPs should be stable in an aqueous
solution. Therefore, colloidal stability of MNPs is an important issues which
can be measured in terms of zeta potential. Zeta potential is defined as the
potential difference between the dispersion medium and the stationary
layer of fluid attached to the dispersed particle. When all the particles in
the suspension have a large negative or positive zeta potential, then they will
tend to repel each other and there is no tendency to flocculate and vice
versa. In present work, zeta potential of the nanofluid was measured using a
PSS/NICOMP 380 ZLS particle sizing system (Santa Barbara, CA, USA)
with a red He–Ne laser diode at 632.8 Å in a fixed angle 90° plastic cell.
Measurements were performed at 25 °C after a temperature
homogenization time of 5 min with varying pH from 2 to 12. For precise
data at least three measurements were conducted for each pH value. The
instrument calibration was examined before each experiment using a
latex suspension of known zeta potential (i.e. −55 ± 5 mV). Zeta

Chapter 3
Centre For Interdisciplinary Research, DYPU, Kolhapur 86
potential is not measurable directly but it can be estimated using
theoretical models and an experimentally- determined electrophoretic
mobility or dynamic electrophoretic mobility. Fig. 3.10 (a) shows block
diagram for zeta potential measurement.
Major application of zeta potential is to determine surface charge of
NPs. Derivations show that the zeta potential is the double-layer potential
close to the particle surface. The liquid layer of a particle in suspension
migrating in an electric field moves at the same velocity as the surface
(shear surface). This shear surface occurs well within the double layer, likely
at a location roughly equivalent to the Stern surface. Although, the precise
location of the surface of shear is not known, it is assumed to be within a
couple of molecular diameters of the actual particle surface for smooth
particles. This thickness is associated with the zeta potential and
determines the ion atmosphere near a surface [22].
Electroacoustic phenomena and electrokinetic phenomena are the
typical sources of data for estimation of zeta potential. As the magnitude
of zeta potential gives an indication of the potential stability of colloidal
system. If all the particles in suspension have a larger negative or
positive zeta potential then they will tend to repel each other and there
is no tendency to flocculate. However, if the particles have lower zeta
potential values then there is no force to prevent the particles aggregation.
The general dividing line between stable and unstable suspensions is usually
taken at either +30mV or -30mV. Particles with zeta potentials more
positive than +30mV or more negative than -30mV are generally
considered stable. Fig. 3.10 (b) represents zeta potential for measured for
LSMO NPs.
Chapter 3
Centre For Interdisciplinary Research, DYPU, Kolhapur 87
3.3.4.2 DLS
This technique is one of the most popular method in nanotechnology
used to determine the size of particles in suspension [23]. Particles suspended
in liquids show Brownian motion due to random collisions with solvent
molecules. It causes the particles to diffuse through the medium. The
diffusion coefficient D is inversely proportional to the particle size.
According to the Stokes-Einstein equation,
D=kBT/6πηa (3.8)
Where, a is the radius of the beads, kB is the Boltzmann constant, T is the
temperature in Kelvin degrees (in this experiment it will be considered as if it
is taking place at room temperature) and η is the viscosity of the
solvent.
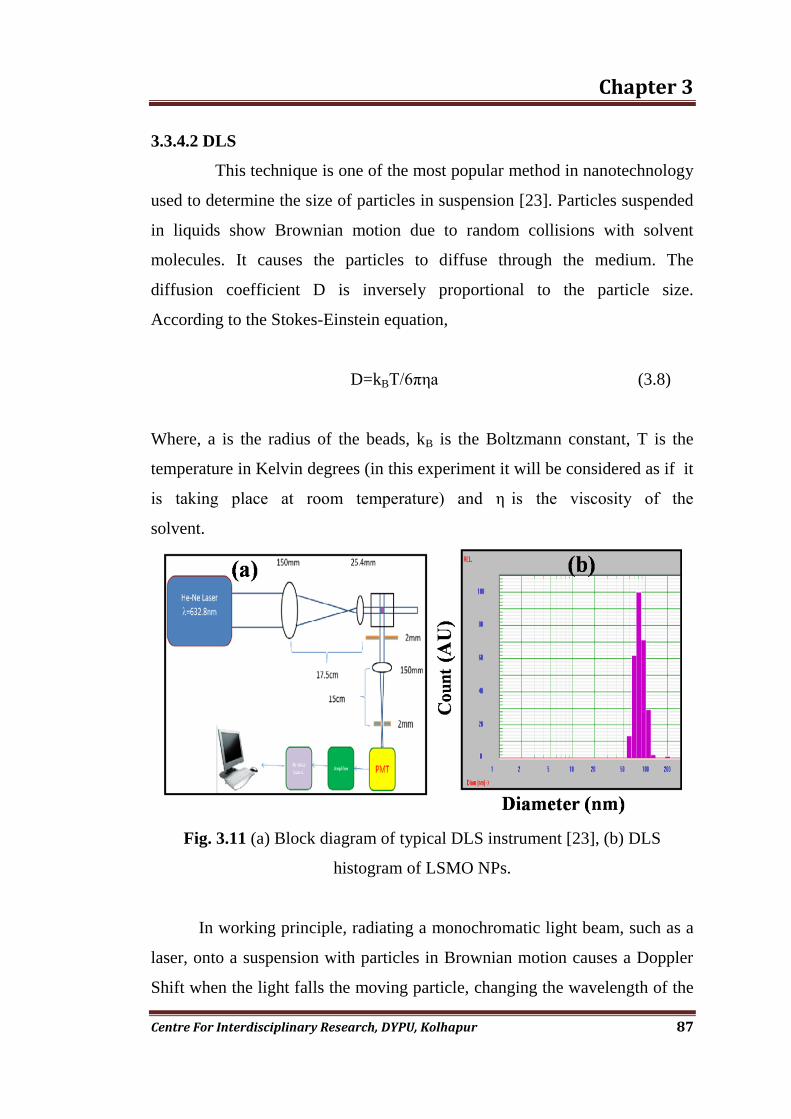
Fig. 3.11 (a) Block diagram of typical DLS instrument [23], (b) DLS
histogram of LSMO NPs.
In working principle, radiating a monochromatic light beam, such as a
laser, onto a suspension with particles in Brownian motion causes a Doppler
Shift when the light falls the moving particle, changing the wavelength of the

Chapter 3
Centre For Interdisciplinary Research, DYPU, Kolhapur 88
incoming light. This change is associated to the size of the particle. It is
probable to calculate the size distribution of particles and give a description of
the particle‟s motion in the suspension medium, measuring the diffusion
coefficient of the particle and using the autocorrelation function.
In present case, DLS of the LSMO NPs were measured using a
PSS/NICOMP 380 ZLS particle sizing system (Santa Barbara, CA, USA)
with a red He–Ne laser diode at 632.8 Å in a fixed angle 90° plastic
cell. All measurements were carried out at 25.0 + 0.1ºC using a circulating
water bath. Cylindrical cells of 10 mm diameter were used in all of the
light scattering experiments. Fig. 3.11 (a) shows block diagram of typical
DLS instrument and Fig. 3.11 (b) shows DLS histogram of LSMO NPs.
3.3.5 Magnetic Characterizations
3.3.5.1 VSM
Fig. 3.12 (a) Schematic of VSM showing the overall assembly [24], (b)
Magnetic measurement of as prepared LSMO NPs at temperature 27 ºC.
VSM is used to measure materials entire magnetic behaviour. Using
this method the magnetic characteristics of sample as a function of applied
field at different temperatures and as a function of temperature at different
applied field strengths can be measured. Operating principle of VSM is based
Chapter 3
Centre For Interdisciplinary Research, DYPU, Kolhapur 89
on Faraday's Law of Induction [25]. It states that a changing magnetic flux
through the circuit will produce an electric field in any closed circuits.
This can be expressed as,
(3.9)
Where, N is the number of turns of wire in the coil, A is area coil, and θ is
the angle between the B field and the direction normal to the coil
surface. In VSM measurements the sample to be analysed is placed in a
constant magnetic field. If the sample is magnetic, this constant magnetic
field will magnetize the sample by aligning the magnetic domains or
the individual magnetic spins, with the applied field. Due to applied
magnetic field the magnetic dipole moment of the sample will create the
magnetic field around the sample. The oscillatory motion of the magnetized
sample will induce a voltage in the detection coils [26]. This voltage can be
used to identify a high resolution and accuracy by means of suitable
associated electronics. The induced voltage is proportional to the sample‟s
magnetization, which can be varied by changing the dc magnetic field
produced by the electromagnet. For application in biomedicine super-
paramagnetic behaviour of MNPs at room temperature is one of the essential
criteria. Field cooled zero field cooled measurements with the help of
Superconducting Quantum Interference Device (SQUID) i. e. SQUID -VSM
can gives the accurate data of about the blocking temperature of the sample.
The blocking temperature of the material can gives the information about the
superparamagnetism. Fig. 3.12 show vibrating sample magnetometer (a) and
magnetic measurements of LSMO NPs (b).
- cosd
N BA Jdt

Chapter 3
Centre For Interdisciplinary Research, DYPU, Kolhapur 90
3.3.6 Biocompatibility study: Cytotoxicity assays
In the biomedical field especially, NPs are being utilized in diagnostic
and therapeutic tools to better understand, detect, and treat human diseases.
Human exposure to NPs is predictable as NPs become more extensively used
and, as a result, nanotoxicology research is recently focusing attention.
However, while the number of NPs, types and applications continues to
increase, studies to distinguish their effects after exposure and to address their
potential toxicity are few in comparison. For medical use exposure to NPs
involves intentional contact or administration; therefore, understanding the
properties of NPs and their effect on the body is vital before clinical use can
occur. For NPs to be used in clinical area, it is necessary that nanotoxicology
research uncovers and understands how these multiple factors influence the
toxicity of NPs so that their undesirable properties can be avoided [28].
Fig. 3.13 Schematic of cytotoxicity test [27].
Chapter 3
Centre For Interdisciplinary Research, DYPU, Kolhapur 91
Selection of the appropriate cytotoxicity assay is crucial to the
accurate assessment of NPs toxicity. Several assays can be used to study the
toxic effects of NPs on cell cultures, including lactate dehydrogenase (LDH)
leak-age,3-(4,5-dimethylthiazol-2-yl)-2,5-diphen-yltetrazolium bromide
(MTT) assay, Trypan blue Dye exclusion (TBDE) assay (and identification
of cytokine/ chemokine production etc. In deciding the correct assay, all
potential interferences must be considered to avoid obtaining false-positive
and false negative results. Interactions between the NPs and the chosen dye
have been cited as a major potential interference leading to inaccurate results.
In present investigation MTT and TBDE assays have been used to study
cytotoxicity. In TBDE assays cell viability analysis is done with trypan blue
dye exclusion staining. Cells were routinely counted manually with a
hemocytometer. Now a days advanced programmed instrumentation has been
introduced to supplement this traditional technique with the efficiency and
reproducibility of automated sample handling, computer control and advanced
imaging. The conventional method of performing TBDE analysis involves
manual staining and use of a hemocytometer for counting. Recent advances
in instrumentation have led to a number of fully automated systems that can
enhance the output and accuracy of this technique.
The MTT assay is a colorimetric assay for measuring cell viability.
The reduction of MTT (tetrazolium salts) is now extensively believed as a
reliable way to observe cell proliferation. The yellow tetrazolium MTT (3-
(4, 5-dimethylt hiazolyl-2)-2,5-di phenyltetrazoli um bromide) is reduced by
metabolically active cells through dehydrogenase enzymes, and make
reducing equivalents such as NADH and NADPH. The consequential
intracellular purple formazan can be solubilized and measured by
spectrophotometrically. The cell proliferation rate can be calculated by using
MTT cell proliferation assay. When metabolic events initiate apoptosis or
necrosis it results into the reduction in cell viability. The number of stages
Chapter 3
Centre For Interdisciplinary Research, DYPU, Kolhapur 92
involved in assay has been minimized as much as possible to expedite sample
dispensation. The MTT reagent give ups low background absorbance values
in the absence of cells. Fig 3.13 shows schematic of cytotoxicity tests [27].
Cancer cells are more resilient towards NPs toxicity than normal cells
due to an increased rate of proliferation and metabolic activity. The difference
in toxic effects is even observed for NPs of the same material. Therefore,
selection of the appropriate cell type based on target introduction methods of
nanomaterials is an essential issue in cytotoxicity assays [29]. In the case of
biomedical applications, NPs are often introduced into the human body
through the intravenous, subcutaneous, intra-muscular or intraocular pathway.
Based on the variety of affected organs, numerous cell types ranging from
endothelium, blood, spleen, liver, nervous system, heart and kidney are all
of interest in NPs cytotoxicity studies [30].
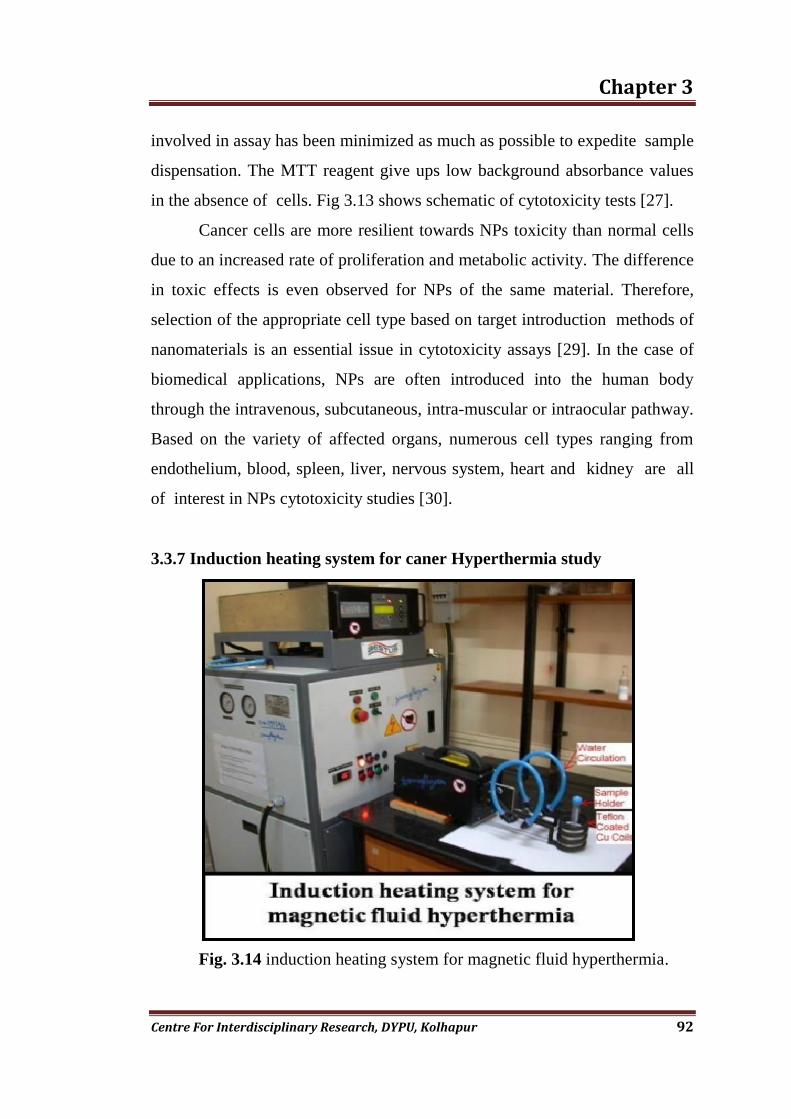
3.3.7 Induction heating system for caner Hyperthermia study
Fig. 3.14 induction heating system for magnetic fluid hyperthermia.

Chapter 3
Centre For Interdisciplinary Research, DYPU, Kolhapur 93
Heating ability of MNPs for cancer hyperthermia therapy has been
studied with induction heating system. Induction heating characteristics of
samples for hyperthermia application were carried out in Eppendorf tube
using instrument (Easy Heat 8310, Ambrell, UK).The coil having 6 cm
diameter (4turns) consisted of loops of copper (Cu) pipe was cooled by water
circulation in coil to keep the temperature constant. Suspensions of NPs were
prepared in DDW as well as different physiological media and placed at the
centre of the coil.
Particularly, magnetic induction heating system has generated a
growing interest in the medical field and oncology. Induction Heating offers a
controllable and localized method of heat without contact to the parts
(components) being heated [31-32]. It has been studied that the malignant
cells are more sensitive and responsive to induced heat than normal
cells. Using particular range of frequency and magnetic field strength, a
heating coil of a given shape and size in conjunction with other methods can
apply a hyperthermia effect on tumour cells. The basic principle of working
of induction heating is based on the faradays law, “The amount of voltage
created is equal to the change in magnetic flux divided by the change in
time”. The greater the change in the magnetic field, the larger will be amount
of voltage.
In this system, a source of high frequency electricity is used to drive a
large alternating current through a coil. This coil is known as the work coil
(Fig. 3.14). The passage of current through this coil generates a very
intense and rapidly changing magnetic field in the space within the work
coil. The work piece to be heated is placed within this intense alternating
magnetic field [33]. The intense alternating magnetic field inside the work
coil repeatedly magnetises and de-magnetises the crystals to be analysed. This
rapid flipping of the magnetic domains causes considerable friction and
heating inside the material.
Chapter 3
Centre For Interdisciplinary Research, DYPU, Kolhapur 94
References
[1] K. C. Patil, S. T. Aruna, T. Mimani, Curr. Opin in Solid State Mater.
Sci. 6 (2002) 507.
[2] “Instrumental methods of analysis”, sixth edition, V. Nostrand, H.
Willard, Dean and Frank A. Settle, Jr., Wadsworth publishing company,
Belmont, CA (1981).
[3] A. B. Salunkhe, V. M. Khot, M. R. Phadatare, S. H. Pawar, J. Alloys
Compd. 514 (2012) 91.
[4] N. D. Thorat, K. P. Shinde, S. H. Pawar, K. C. Barick, C. A. Betty, R. S.
Ningthoujam, Dalton Trans. 41 (2012) 3060.
[5] S. V. Jadhav, D. S. Nikam, V. M. Khot, N. D. Thorat, M. R. Phadatare,
R. S. Ningthoujam, A. B. Salunkhe, S. H. Pawar, New J. Chem. 37
(2013) 3121.
[6] http://pd.chem.ucl.ac.uk/pdnn/inst1/bgbtano1.gif
[7] http://www.rigaku.com/sites/default/files/miniflex.jpg
[8] “Elements of X-ray Diffraction”, Addison-Wesley Publishing
Company, Inc. Massachusetts, B. D. Cullity (1956).
[9] “X-ray Diffraction by Polycrystalline Materials”, ISTE Ltd, Lavoisier,
London W1T 5DXR, UK, R. Guinebretiere (2006).
[10] “Characterization of nanophase materials”, Wiley-VCH; 1st ed edition,
Z. L. Wang, (2000).
[11] “Infra-red Characteristics Group Frequencies”, Chichester, New York,

Chapter 3
Centre For Interdisciplinary Research, DYPU, Kolhapur 95
Brisbane, Toronto, G. Socrates, John Wiley & Sons, (1980).
[12] “Chemical Infra-red Fourier Transform Spectroscopy”, Academic Press,
New York, R. R. Griffiths, (1972).
[13] “Infra-red and Raman Spectra of Inorganic and Co-ordination
Compounds”, Third ed., John Wiley, New Jersey, K. Nakamoto, (2008).
[14] http://www.gasesmag.com/Assets/images/0109/art3fig10.gif.
[15] “Ency.of Analy. Chemi.”, R. A. Meyers (Ed.) X. Hou , B. T. Jones
(1999) pp. 9468.
[16] http://coloradomtn.edu/wp-
ontent/uploads/2013/09/tal_instrument_basics_page_1.jpg
[17] http://upload.wikimedia.org/wikipedia/commons/thumb/f/f2/System2.gif/350p
x-System2.gif.
[18] http://eqdb.nrf.ac.za/sites/default/files/styles/equipment_image/public/e
quipment/images/SplutteringSystem.png?itok=8TJHvbJ7
[19] “Introduction to conventional transmission electron Microscopy” M. De
Graef, (2003).
[20] http://www.nanoscience.gatech.edu/zlwang/image/research/tem/fig1.jpg
[21] http://www.pcimag.com/ext/resources/PCI/Home/Images/pci0410-
Malvern-F1-lg.jpg
[22] P. C. Hiemenz, R. Rjagopalan, Principles of Colloid and Surface
Chemistry. 3rd
Ed. Marcel Dekker, New York, (1997).
[23] B. J. Berne, R. Pecora, Dynamic Light Scattering, Wiley, New York,
Chapter 3
Centre For Interdisciplinary Research, DYPU, Kolhapur 96
(1976).
[24] http://www.nims.go.jp/apfim/gif/HighSensitiveVSM.gif
[25] A. Niazi, P. Poddar, A. K. Rastogi, A precision, Curr. Sci. (2000).
[26] S. R. Hoon, Eur. J. Phys. 4 (1983) 6147.
[27] http://www.bioantares.com/uploads/Cyto_test.jpg
[28] N. Lewinski, V. Colvin, R. Drezek, small 4 (2008) 26.
[29] B. Díaz, C. Sánchez-Espinel, M. Arruebo, Small 4 (2008) 2025.
[30] A. Nemmar, M. F. Hoylaerts, P. H. Hoet, Am. J. Respir. Crit. Care Med.
166 (2002) 998.
[31] J. P. Fortin, C. Wilhelm, J. Servais, C. Menager, J. C. Bacri, F. Gazeau,
J. Am. Chem. Soc. 129 (2007) 2628.
[32] J. H. Lee, J. Jang, J. Choi, S. H. Moon, S. H. Noh, J. Kim, J. G. Kim, S.
Kim, K. Park, J. Cheon, Nat. Nanotechnol. 6 (2011) 418.
[33] R. Hergt, S. Dutz, R. Muller, M. Zeisberger, J. Phys.: Condens. Matter
18 (2006) S2919.