experiment p-6 friction force - neulog sensors | … · 2016-01-19 · experiment p-6 friction...
TRANSCRIPT
Experiment P-6 Friction Force Ver 3.4.6
1
Experiment P-6
Friction Force
Objectives To learn about the relationship between friction force, normal
force and friction coefficient. To observe changes in the friction force within different surfaces
and different masses. To calculate the friction coefficients (static and kinetic) in these
different conditions.
Modules and Sensors PC + NeuLog application
USB-200 module
NUL-211 Force logger sensor
Equipment and Accessories
Rough and smooth wooden block with hook
20 cm of thread
1000 g mass
500 g mass
The items above are included in the NeuLog Mechanics kit,
MEC-KIT.
Experiment P-6 Friction Force Ver 3.4.6
2
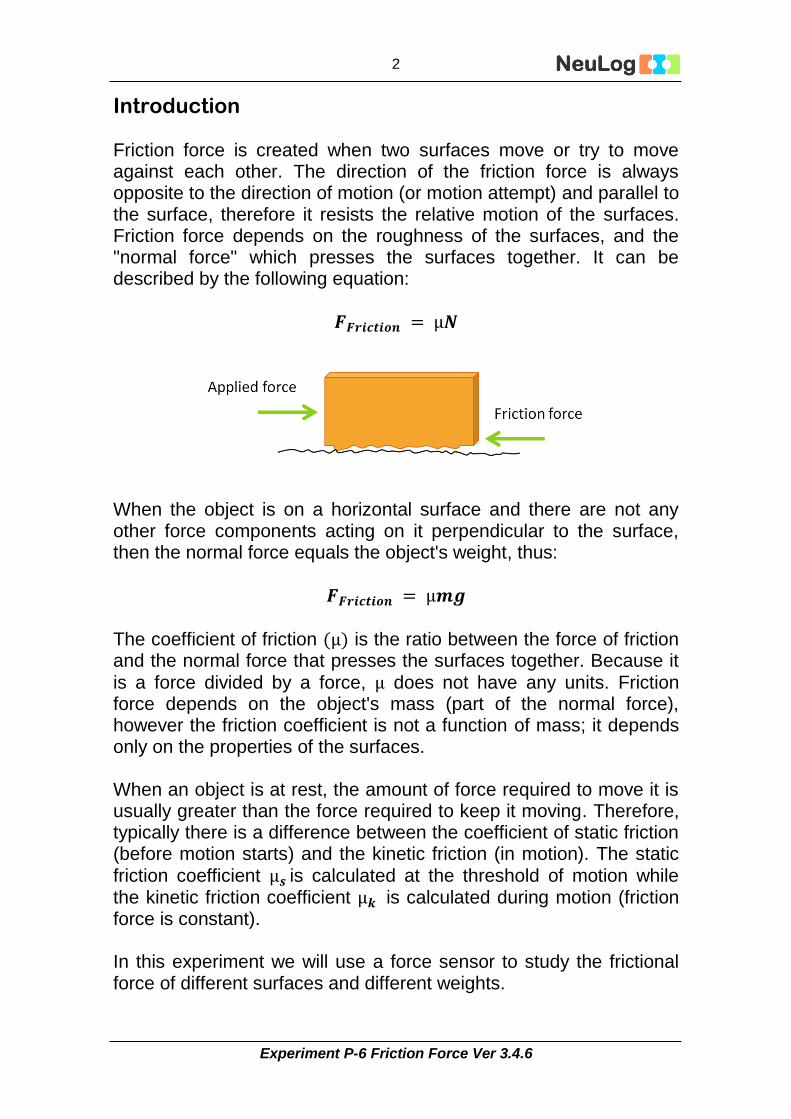
Introduction Friction force is created when two surfaces move or try to move against each other. The direction of the friction force is always opposite to the direction of motion (or motion attempt) and parallel to the surface, therefore it resists the relative motion of the surfaces. Friction force depends on the roughness of the surfaces, and the "normal force" which presses the surfaces together. It can be described by the following equation:
When the object is on a horizontal surface and there are not any other force components acting on it perpendicular to the surface, then the normal force equals the object's weight, thus:
The coefficient of friction is the ratio between the force of friction and the normal force that presses the surfaces together. Because it is a force divided by a force, does not have any units. Friction force depends on the object's mass (part of the normal force), however the friction coefficient is not a function of mass; it depends only on the properties of the surfaces. When an object is at rest, the amount of force required to move it is usually greater than the force required to keep it moving. Therefore, typically there is a difference between the coefficient of static friction (before motion starts) and the kinetic friction (in motion). The static friction coefficient is calculated at the threshold of motion while the kinetic friction coefficient is calculated during motion (friction force is constant). In this experiment we will use a force sensor to study the frictional force of different surfaces and different weights.
Experiment P-6 Friction Force Ver 3.4.6
3
Procedure Experiment setup
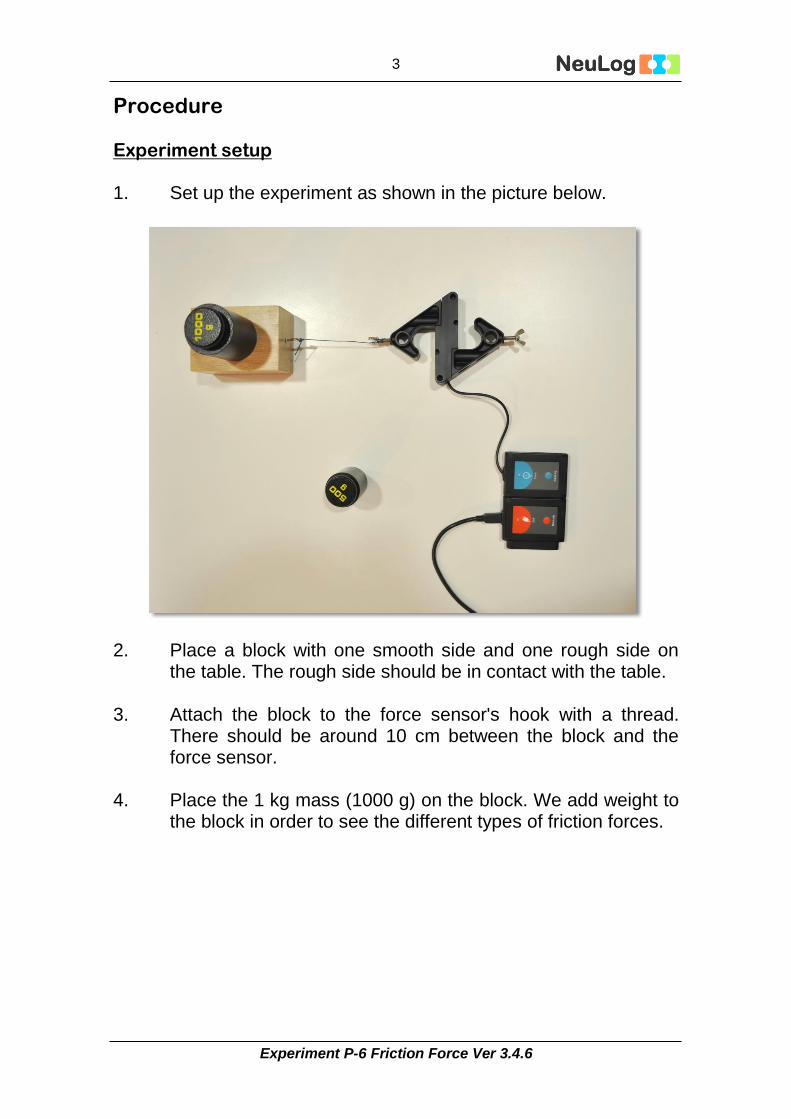
1. Set up the experiment as shown in the picture below.
2. Place a block with one smooth side and one rough side on
the table. The rough side should be in contact with the table.
3. Attach the block to the force sensor's hook with a thread. There should be around 10 cm between the block and the force sensor.
4. Place the 1 kg mass (1000 g) on the block. We add weight to
the block in order to see the different types of friction forces.
Experiment P-6 Friction Force Ver 3.4.6
4
Sensor setup
5. Connect the USB module to the PC.
6. Connect the force sensor to the USB-200 module.
Note:
The following application functions are explained in short. It is recommended to practice the NeuLog application functions (as described in the user manual) beforehand.
7. Run the NeuLog application and check that the force sensor is identified.
Experiment P-6 Friction Force Ver 3.4.6
5
Settings
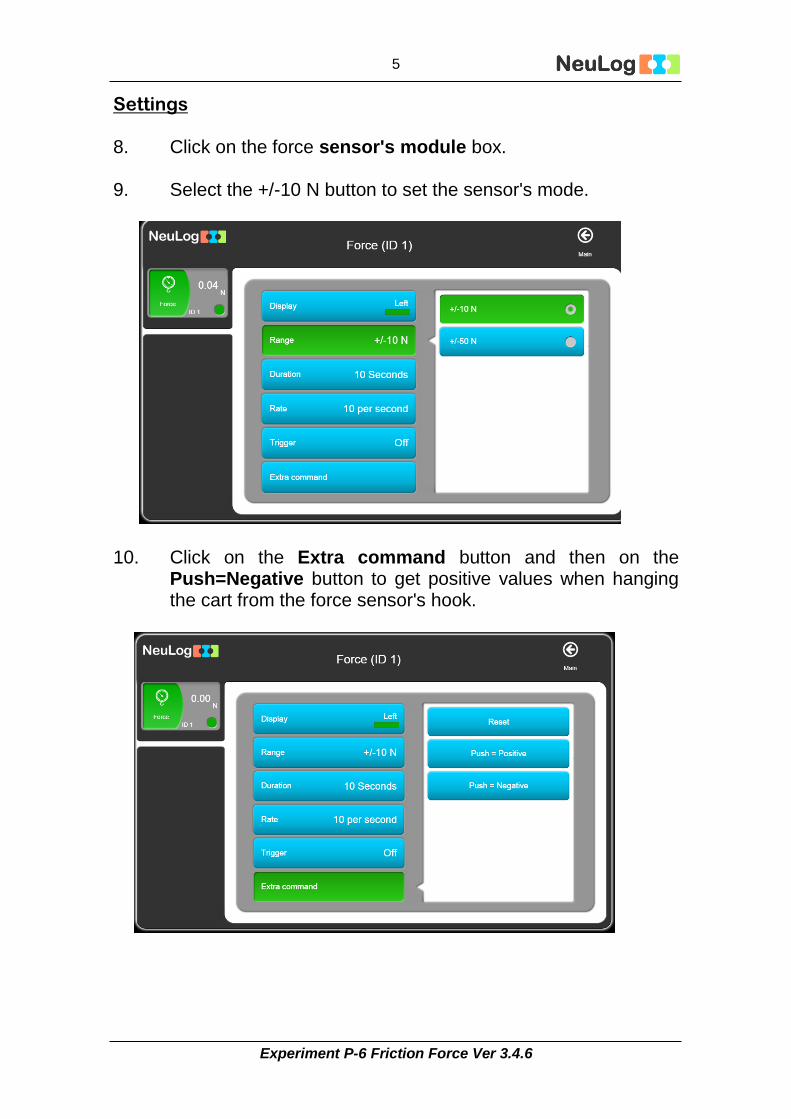
8. Click on the force sensor's module box.
9. Select the +/-10 N button to set the sensor's mode.
10. Click on the Extra command button and then on the
Push=Negative button to get positive values when hanging the cart from the force sensor's hook.
Experiment P-6 Friction Force Ver 3.4.6
6
11. Click on the icon to go back to the graph.
12. Click on the Run Experiment icon and set the:
Experiment duration to 5 seconds Sampling rate to 50 per second
Experiment P-6 Friction Force Ver 3.4.6
7
Testing and measurements
Note:
The orientation of the sensor is very important. Before each measurement, hold the sensor in the same position you will use for the specific experiment and zero it.
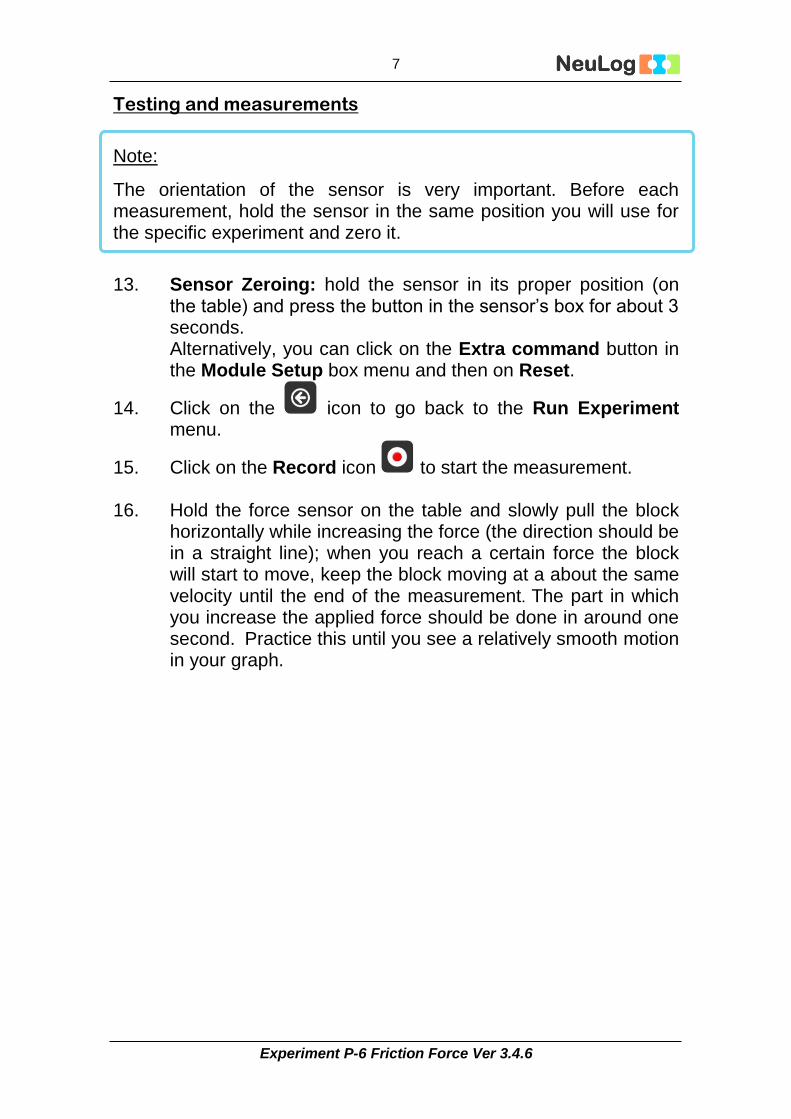
13. Sensor Zeroing: hold the sensor in its proper position (on the table) and press the button in the sensor’s box for about 3 seconds. Alternatively, you can click on the Extra command button in the Module Setup box menu and then on Reset.
14. Click on the icon to go back to the Run Experiment menu.
15. Click on the Record icon to start the measurement.
16. Hold the force sensor on the table and slowly pull the block horizontally while increasing the force (the direction should be in a straight line); when you reach a certain force the block will start to move, keep the block moving at a about the same velocity until the end of the measurement. The part in which you increase the applied force should be done in around one second. Practice this until you see a relatively smooth motion in your graph.
Experiment P-6 Friction Force Ver 3.4.6
8
17. If needed, click on the Zoom Fit icon .
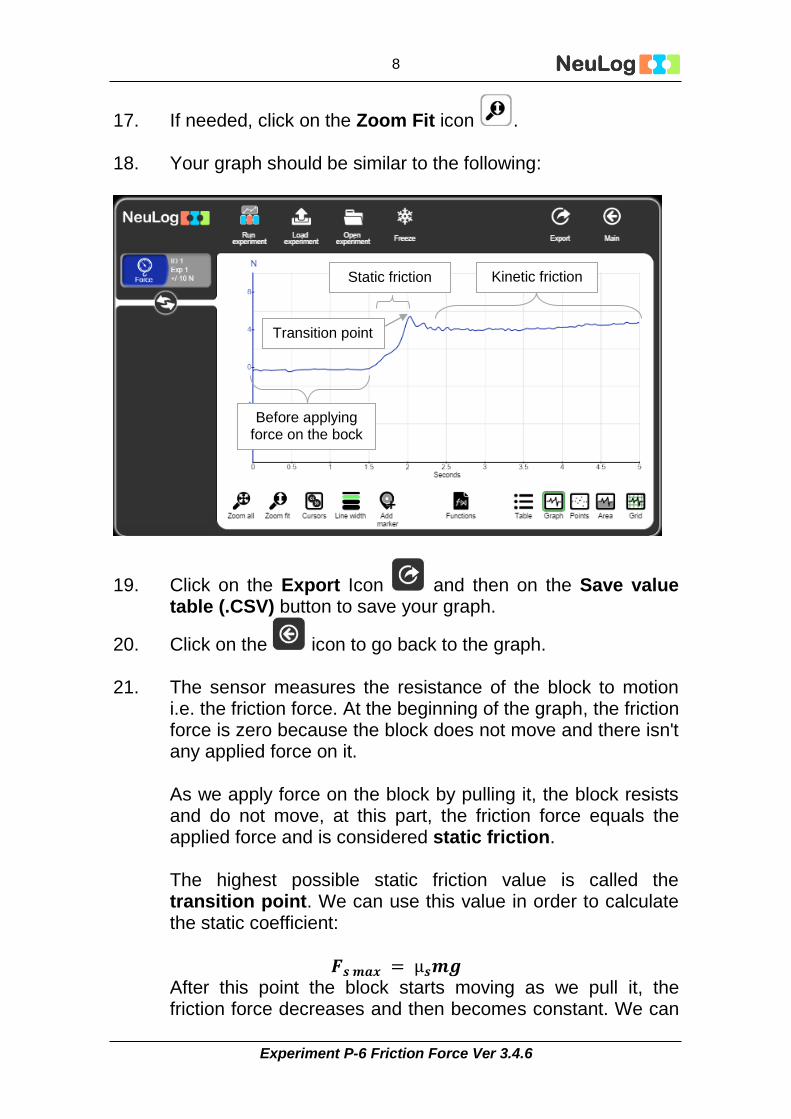
18. Your graph should be similar to the following:
19. Click on the Export Icon and then on the Save value table (.CSV) button to save your graph.
20. Click on the icon to go back to the graph.
21. The sensor measures the resistance of the block to motion i.e. the friction force. At the beginning of the graph, the friction force is zero because the block does not move and there isn't any applied force on it.
As we apply force on the block by pulling it, the block resists and do not move, at this part, the friction force equals the applied force and is considered static friction. The highest possible static friction value is called the transition point. We can use this value in order to calculate the static coefficient:
After this point the block starts moving as we pull it, the friction force decreases and then becomes constant. We can
Before applying force on the bock
Transition point
Kinetic friction Static friction
Experiment P-6 Friction Force Ver 3.4.6
9
use the friction value at this range to calculate the kinetic friction coefficient:
22. It is recommended to repeat every measurement three times.
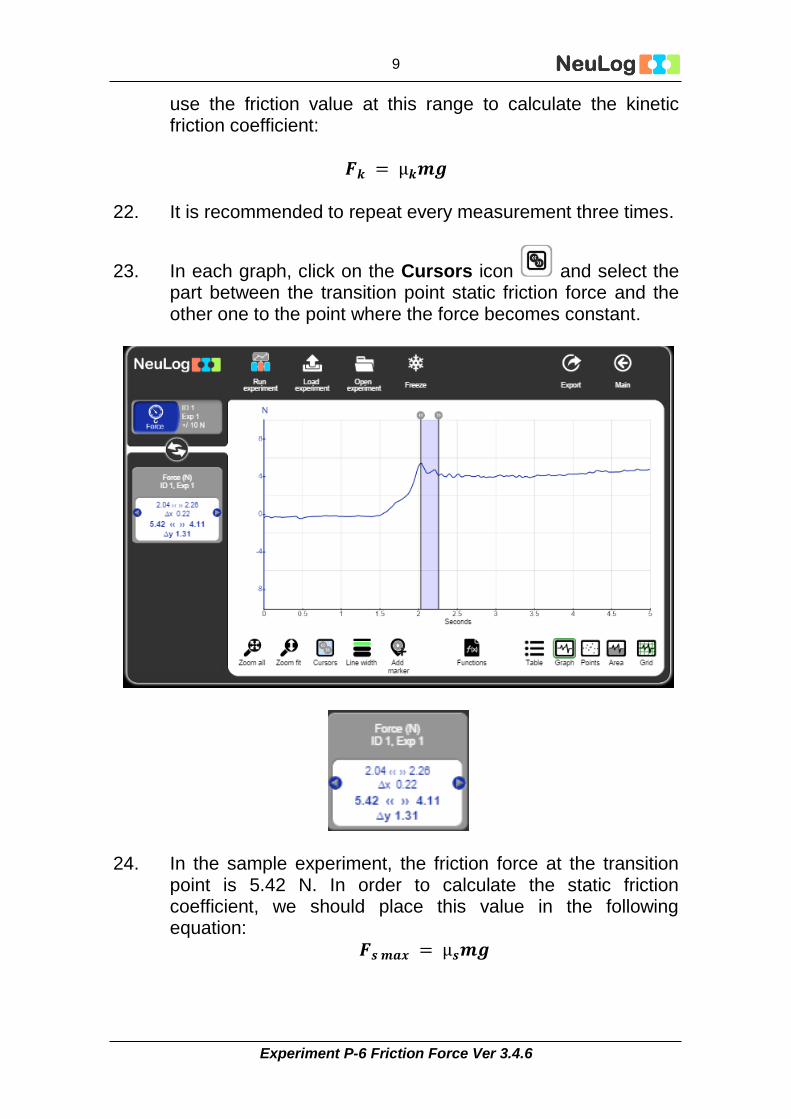
23. In each graph, click on the Cursors icon and select the part between the transition point static friction force and the other one to the point where the force becomes constant.
24. In the sample experiment, the friction force at the transition point is 5.42 N. In order to calculate the static friction coefficient, we should place this value in the following equation:
Experiment P-6 Friction Force Ver 3.4.6
10
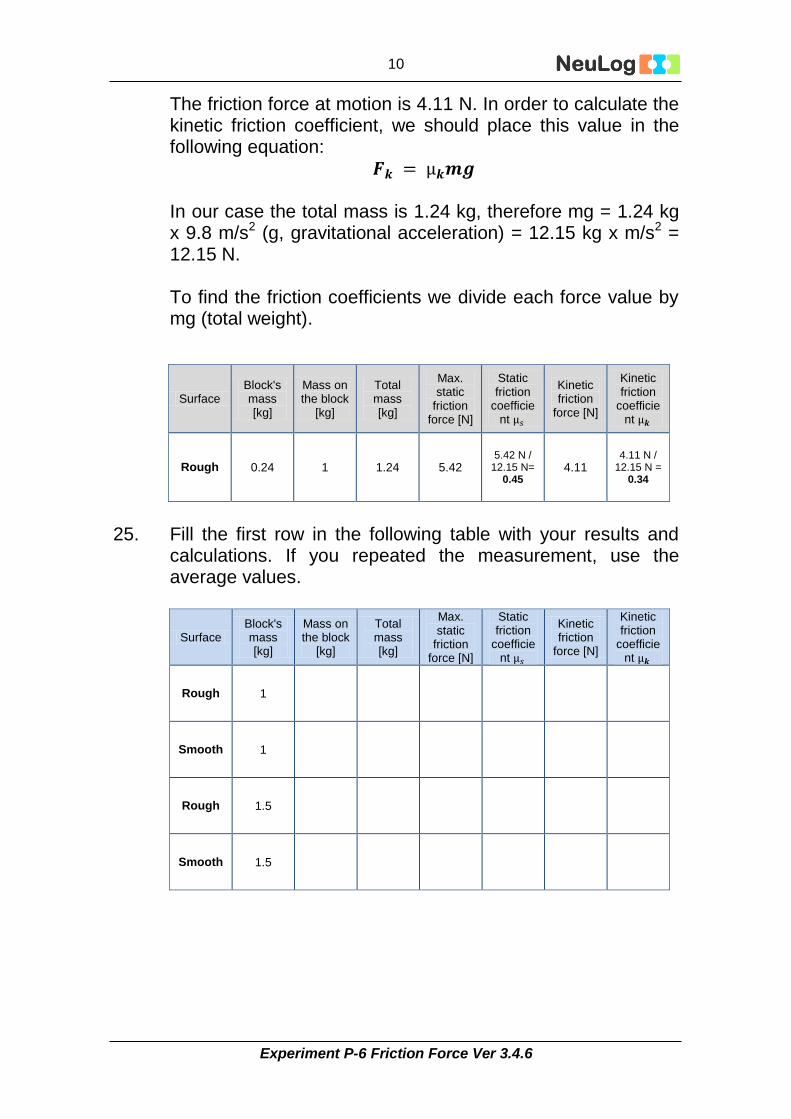
The friction force at motion is 4.11 N. In order to calculate the kinetic friction coefficient, we should place this value in the following equation:
In our case the total mass is 1.24 kg, therefore mg = 1.24 kg x 9.8 m/s2 (g, gravitational acceleration) = 12.15 kg x m/s2 = 12.15 N.
To find the friction coefficients we divide each force value by mg (total weight).
Kinetic friction
coefficient
Kinetic friction
force [N]
Static friction
coefficient
Max. static
friction force [N]
Total mass [kg]
Mass on the block
[kg]
Block's mass [kg]
Surface
4.11 N / 12.15 N =
0.34 4.11
5.42 N / 12.15 N=
0.45 5.42 1.24 1 0.24 Rough
25. Fill the first row in the following table with your results and
calculations. If you repeated the measurement, use the average values.
Kinetic friction
coefficient
Kinetic friction
force [N]
Static friction
coefficient
Max. static
friction force [N]
Total mass [kg]
Mass on the block
[kg]
Block's mass [kg]
Surface
1 Rough
1 Smooth
1.5 Rough
1.5 Smooth
Experiment P-6 Friction Force Ver 3.4.6
11
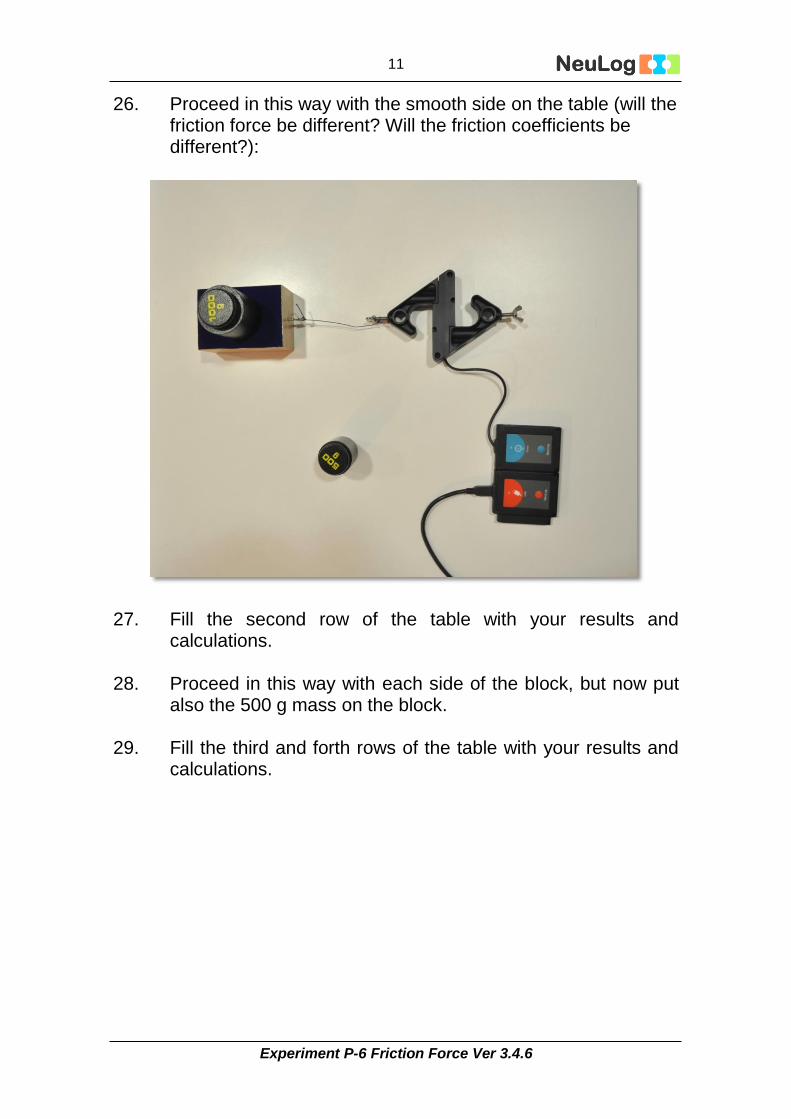
26. Proceed in this way with the smooth side on the table (will the friction force be different? Will the friction coefficients be different?):
27. Fill the second row of the table with your results and
calculations.
28. Proceed in this way with each side of the block, but now put also the 500 g mass on the block.
29. Fill the third and forth rows of the table with your results and
calculations.
Experiment P-6 Friction Force Ver 3.4.6
12
Summary questions
1. Compare the following values you received. If there is a difference between the values, explain it:
a. Static vs. kinetic friction coefficients in each measurement.
b. Friction coefficients of the rough surface vs. the smooth surface (with the 1000 g).
c. Friction coefficients of the rough surface with the 1000
g mass vs. the same surface with the 1500 g mass.
2. Think about what would happen in a world without friction. What would happen if you tried to walk? What would happen if you slide an object across the ground?