experiencing*engaging*educaon* feb46,2015* · projectbased*learning* •...
TRANSCRIPT

Experiencing Engaging Educa.on Feb 4-‐ 6, 2015
Mia A. Papas, PhD Behavioral Health and Nutri.on Department
College of Health Sciences [email protected]

Project-‐Based Learning
• Team based, problem-‐solving ac.vity
• Delivering a product that is: – Significant – Clearly communicated – Useful

Big data: Small projects • Objec.ve: – Explore large datasets of secondary data
– Pose a testable research ques.on
– Visualize the analysis with mul.ple tools • Sta.s.cal soXware: JMP
– Communicate/present the results

3P’s Approach to Science Educa.on
• Problem Posing
• Problem Solving
• Peer Persuasion
h]p://bioquest.org/the-‐3-‐peas-‐concept/

HLPR632: Applied Data Analysis Objec.ves: 1) Provides an overview of descrip.ve and
inferen.al sta.s.cs needed to interpret health related data
2) Apply sta.s.cs needed to analyze and evaluate health-‐related literature and conduct public health research

Epidemiology
Distribu.on and Determinants of Health and Disease in Human Popula.ons
Study of…. To enable….
Preven.on and Control of Health Problems
Last JM: A Dic-onary of Epidemiology, 4th ed. New York, Oxford University Press, 2000.

Epidemiology and the 3Ps • Problem Posing – Addressing an e.ologic ques.on of public health relevance
• Problem Solving – Using epidemiologic methods to design studies and analyze data
• Peer Persuasion – Interpreta.on of evidence and communica.on of results

Posing the right ques.on?

Developing a research ques.on: FINER (Hulley et al., 2007)
F: Feasibility – Sufficient resources in terms of .me, staff, and funding; Use of
appropriate study design; Manageable in scope; Adequate sample size; Trained research staff
I: Interes.ng – Interes.ng as a researcher or collaborator; Inves.gator’s mo.va.on to
make it interes.ng N: Novel
– Thorough literature search; New findings or extension of previous findings; Guidance from mentors and experts
E: Ethical – Following ethical guidelines; Regulatory approval from Ins.tu.onal
Review Board R: Relevant
– Influence on clinical prac.ce; furthering research and health policy

Problem Solving • Tes.ng the hypothesis using exis.ng secondary data sources
• “Drowning in data, but thirs.ng for informa.on”
• Sta.s.cs provides the key to unlock and make sense of data


JMP Sta.s.cal soXware
• JMP is a freely available sta.s.cal soXware program for students and faculty at UD
• JMP has a graph builder app that creates, edits and views graphs right on your iPad
• JMP works in both MAC and Windows formats


Secondary Data Sources • US Census Bureau • Na.onal Health Interview Survey • Na.onal Center for Health Sta.s.cs • Behavioral Risk Factor Surveillance Survey • Youth Risk Behavior Survey • Na.onal Immuniza.on Survey • World Health Organiza.on

Raw Data for Analysis

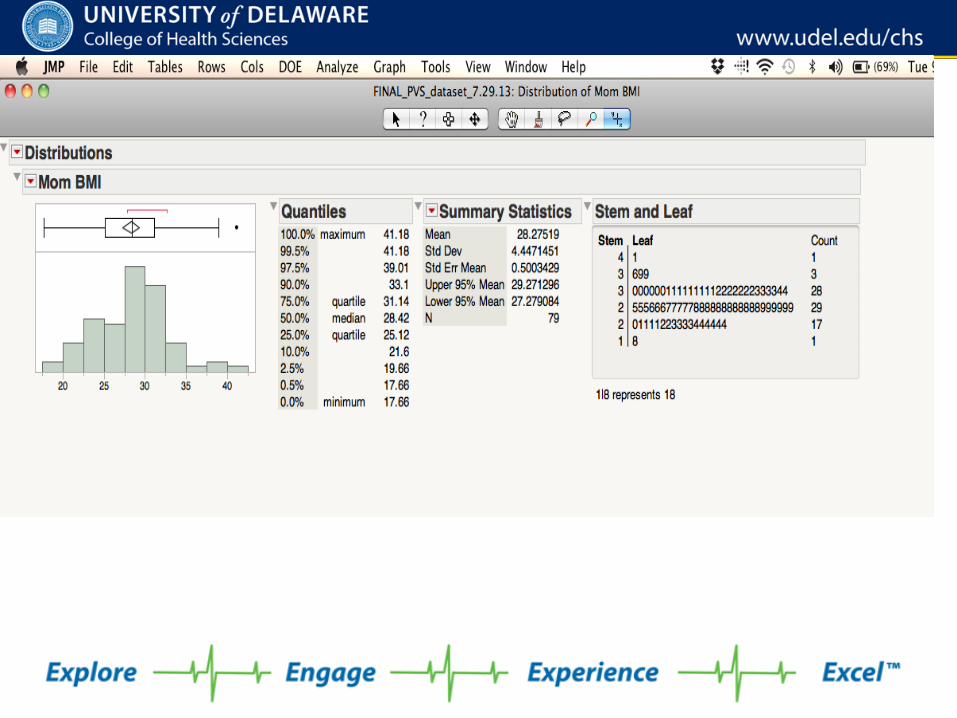
Data Analysis • Descrip.ve Sta.s.cs – Summarize and report on individual variables – Numbers and graphs – What is the mean body mass index of study par.cipants?
– Examples: • Mean BMI of study sample • Graphics and summary sta.s.cs

Data Analysis, cont.
• Inferen.al sta.s.cs – Asking a ques.on about the associa.on between two variables
– Does maternal body mass index differ by child’s gender?


Peer Persuasion
• Appropriately communica.ng results
• Produce and present “the virtual poster”
• Engage in peer discussion

The specific aims of the inves5ga5on were to: 1. Examine the prevalence of poor diet, lack of physical ac.vity,
unhealthy weight loss behaviors, and obesity in a popula.on sample of adolescents in the United States.
2. Explore differences in these factors between adolescents with and without disabili.es.
Purpose
Introduc5on
Results
Conclusions and Recommenda5ons 1. Adolescents with a broad range of disabilities are more likely to be
obese and engage in unhealthy weight loss behaviors that those without disabilities.
2. Provision of successful weight loss strategies that address barriers for healthy dieting and physical activity for this population is critical to develop effective prevention programs.
Study Sample and Measures
• Childhood obesity remains a major public health concern.
• Children with disabilities have a higher prevalence of obesity compared to children without disabilities.
• Due to physical and environmental barriers, children with disabilities may have a difficult time controlling their weight leading to a higher prevalence of obesity.
• 22% (1986/9775) of all survey participants reported an emotional or physical disability.
• Compared to adolescents without disabilities, adolescents with disabilities were more likely to:
1. Be obese (OR=1.7; 95% CI: 1.3, 2.1) 2. Actively try and lose weight (OR=1.3; 95% CI: 1.1, 1.6) 3. State that they were overweight (OR=1.4; 95% CI: 1.2, 1.6)
Figure 1. Prevalence of unhealthy weight loss strategies by disability status for 9775 adolescent study par5cipants in 2011 YRBS
* p-value < 0.05, ** p-value < 0.01
Table 1 . Odds ra5os (OR) and 95% confidence intervals (CI) for associa5ons among diet, physical ac5vity and disability for 9775 adolescent study par5cipants in 2011 YRBS
Disability (n=1986)
No Disability (n=7789)
OR
95% CI
% (95% CI) % (95% CI) Physical Activity Days per week active at least 60 minutes **
0 days 20 (16, 24) 13 (11, 15) 1.0 ref >= 1 day & < 5 days 42 (38, 45) 35 (34, 37) 0.8 0.6, 1.0
>= 5 days 38 (34, 43) 52 (49, 54) 0.5 0.4, 0.6 Hours per day watch television **
< 2 hours 49 (45, 54) 43 (40, 46) 1.0 ref >= 2 hours 51 (46, 55) 57 (54, 60) 0.8 0.7, 0.9
Hours per day play video games < 2 hours 46 (40, 51) 45 (42, 48) 1.0 ref
>= 2 hours 54 (49, 60) 55 (52, 58) 1.1 0.9, 1.3 Dietary Consumption Fruit Juice (100% fruit juice) **
Never 29 (25, 33) 24 (21, 26) 1.0 ref >=1 time in the past week 71 (67, 75) 76 (74, 79) 0.8 0.6, 0.9
Soda (not including diet soda) Never 24 (21, 27) 21 (18, 23) 1.0 ref
>=1 time in the past week 76 (73. 79) 79 (77, 82) 0.8 0.7, 1.1 Fruit **
Never 19 (16, 23) 12 (11, 14) 1.0 ref >=1 time in the past week 81 (77, 84) 88 (86. 89) 0.6 0.5, 0.7
Green Salad ** Never 43 (38, 48) 39 (35, 42) 1.0 ref
>=1 time in the past week 57 (52, 62) 61 (58, 65) 0.8 0.7, 1.0 Other Vegetables **
Never 22 (17, 27) 15 (13, 18) 1.0 ref >=1 time in the past week 78 (73, 83) 85 (82, 87) 0.7 0.5, 0.9
!"#
$$#$!#
%#
&#'#
"#
(#
$"#
$(#
!"#
!(#
)*+,-*.*/0#12#)*+,-*.*/0#
Fast in the Past 24 Hrs
Take Diet Pills, Powders
or Liquids
Vomit or Take Laxatives
Percen
t (%)
* p-value < 0.05, ** p-value < 0.01
**
** **
Figure 2. Associa5on (OR and 95% CI) between number of unhealthy weight loss behaviors and obesity by disability status for 9775 adolescent study par5cipants in 2011 YRBS
1 2 3
Number of Unhealthy Weight Loss Behaviors
Disability No Disability
4.5
1.0
0.8
15.0
1.4
2.5
8.0 Data from 2011 US National Youth Risk Behavior Surveillance Survey among US high school students in North Carolina, North Dakota, Rhode Island, and Delaware. Unhealthy weight loss behaviors included fasting within the past 24 hours, taking diet pills, powders, or liquids, or vomiting/taking laxatives. Obesity was defined as an age and gender adjusted body mass index (BMI) at or above the 95th percentile Disability was defined as at least one positive response to: 1) “Do you have any physical disabilities or long-term health
problems (long-term means 6 months or more)?” 2) “Do you have any long-term emotional problems or learning
disabilities (long-term means 6 months or more)?”

Session Objec.ves 1. Work in teams to develop a testable hypothesis
using the available data
2. Analyze data and produce data tables and graphs
3. Communicate results

Case study

Problem Posing 1. Background informa.on
– Measles Case Defini.on • h]p://www.cdc.gov/measles/hcp/index.html
– Current Measles Outbreak • h]p://www.cdc.gov/measles/cases-‐outbreaks.html
– History of Vaccines • h]p://www.historyofvaccines.org/content/.melines/measles
Problem Solving • What data are available that might shed light on the current measles outbreak?
• What ques.ons can we ask of that data?
• How can we best analyze that data to produce meaningful sta.s.cs?

Datasets
• Two datasets: – Dataset 1 has 3 variables
• Year (2000 to 2014) • Number of measles cases • Percent of children immunized
– Dataset 2 is a subset of data from the 2012 Na.onal Immuniza.on Survey

Na.onal Immuniza.on Survey 2011
• Telephone survey (27,305 households)
• Asks about vaccina.on coverage of children aged 19 to 35 months in the household
• Demographic characteris.cs, household characteris.cs and vaccina.on coverage data are included in the dataset
Data Explora.on
• Examine data • Pose ques.ons • Develop hypothesis • Test hypothesis • Interpret data

Variables • HH_MCV – Number of measles containing shots (None=0, at least one=1,
all=2) • AGE_GRP – Age Group of child (19-‐23 months=1, 24 – 29 months=2, 30 –
35 months=3) • BF_ENDR06 – Dura.on in days of breasteeding • CBF_01 – Was child ever breasted (yes=1/no=2) • EDUC_1 -‐ Maternal educa.on (< 12 years=1, 12 years=2, > 12 years=3,
college=4) • FRSTBRN -‐ First born child (yes=2/no=1) • INCPORAR -‐ (income to poverty ra.o) • M_AGEGRP – age of mother (<=19=1, 20-‐29=2, >=30 years=3) • RACE_K -‐ (White only=1, black only=2, Other plus mul.ple race=3) • SEX -‐ (Male=1/female=2) • STATE -‐ (FIPS CODE)

Variable Defini.on • Income-‐to-‐poverty ra.os represent the ra.o of family or unrelated individual income to their appropriate poverty threshold. Ra.os below 1.00 indicate that the income for the respec.ve family or unrelated individual is below the official defini.on of poverty, while a ra.o of 1.00 or greater indicates income above the poverty level. A ra.o of 1.25, for example, indicates that income was 125 percent above the appropriate poverty threshold” (U.S. Census Bureau, 2004).

Peer Persuasion • Final Product
– Develop a virtual poster using powerpoint that communicates the results
– Use graphs and numbers to present analy.c informa.on

Have Fun!