experiences of fgd and fgc at oxpp-v3.ppt - ieaghg 1/experiences of fgd and... · performance data...
TRANSCRIPT

Flue-gas Cleaning Processes for CO Capture fromFlue gas Cleaning Processes for CO2 Capture from Oxyfuel Combustion - Experience of FGD and FGC at 30 MWthOxyfuel Combustion Pilot
1st IEA Oxyfuel Combustion ConferenceCottbus, Germany, September 8-11, 2009
Dr. Jinying Yan, Dr. Richard Faber*, Dr. Jürgen Jacoby, Dr. Marie Anheden, Rainer GieringVattenfall Research and Development ABThomas Schmidt Gerhard Ross Felix StarkThomas Schmidt, Gerhard Ross, Felix StarkBabcock Noell GmbHDaniel KoselVattenfall Europe Generation AG & Co. KG
© Vattenfall AB
Outlines
• Background
• Description of the FGD and FGC systems
M i f d f l diti• Main performance under oxyfuel conditions
• Understanding oxyfuel related issues
• Ongoing work
• ConclusionsConclusions
© Vattenfall AB 2
Background (1)g ( )
Purposes of the test program:
• Investigation of the performance of WFGD system under oxyfuel combustion conditions for CO2 capture by Vattenfall.
• Adjustment of the common FGD design by Babcock Noell to cope• Adjustment of the common FGD-design by Babcock Noell to cope with:
- The strict requirements for the operation with very high removal efficiency and prevention of air in-leakage into the flue gas systemefficiency and prevention of air in leakage into the flue gas system.
- The unknown impacts of high CO2 partial pressure of the flue gas.
• Testing of the removal efficiencies of FGD and FGC systems.
© Vattenfall AB 3
Background (2)g ( )
The evaluation of FGD and FGC mainly includes:
Flue gas Characterisation• Flue gas Characterisation
• Achievable removal efficiencies for most important acidic gas components
• Major mass and energy balance of the system including emission characteristics
Sl h i t d b d t ( ) ti (FGD)• Slurry chemistry and by-product (gypsum) properties (FGD)
• Composition and chemistry of condensate (FGC)
© Vattenfall AB 4
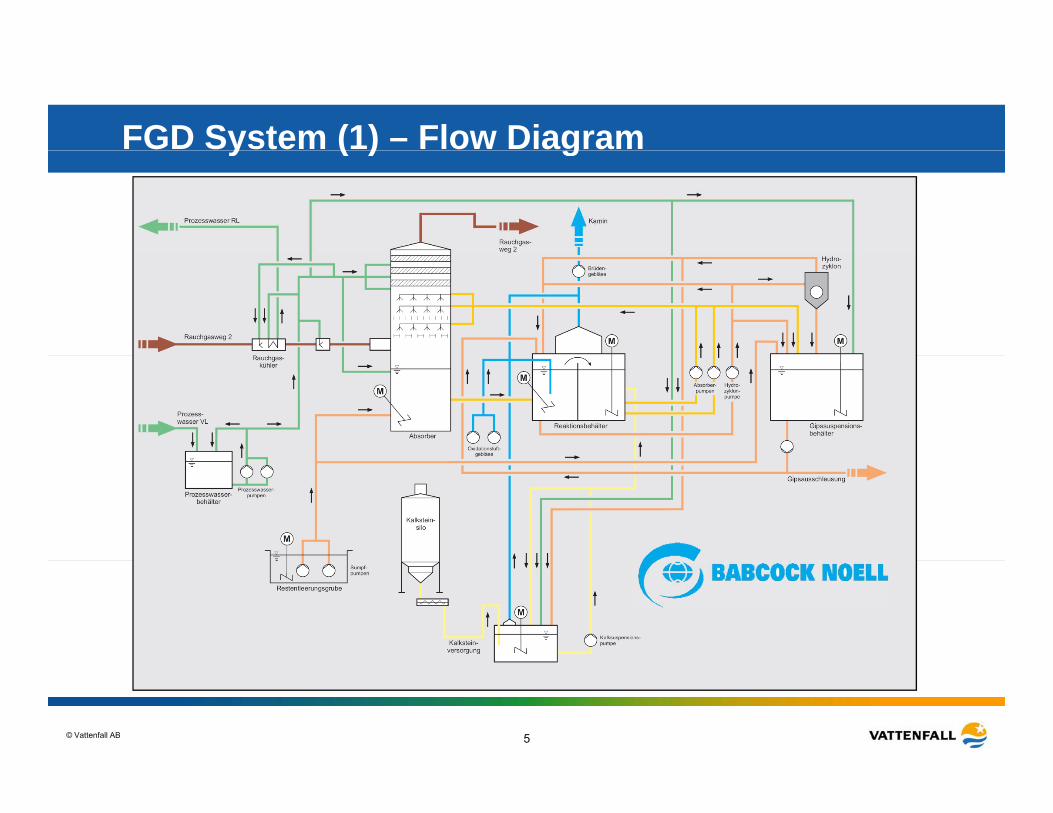
FGD System (1) – Flow Diagramy ( ) g
© Vattenfall AB 5
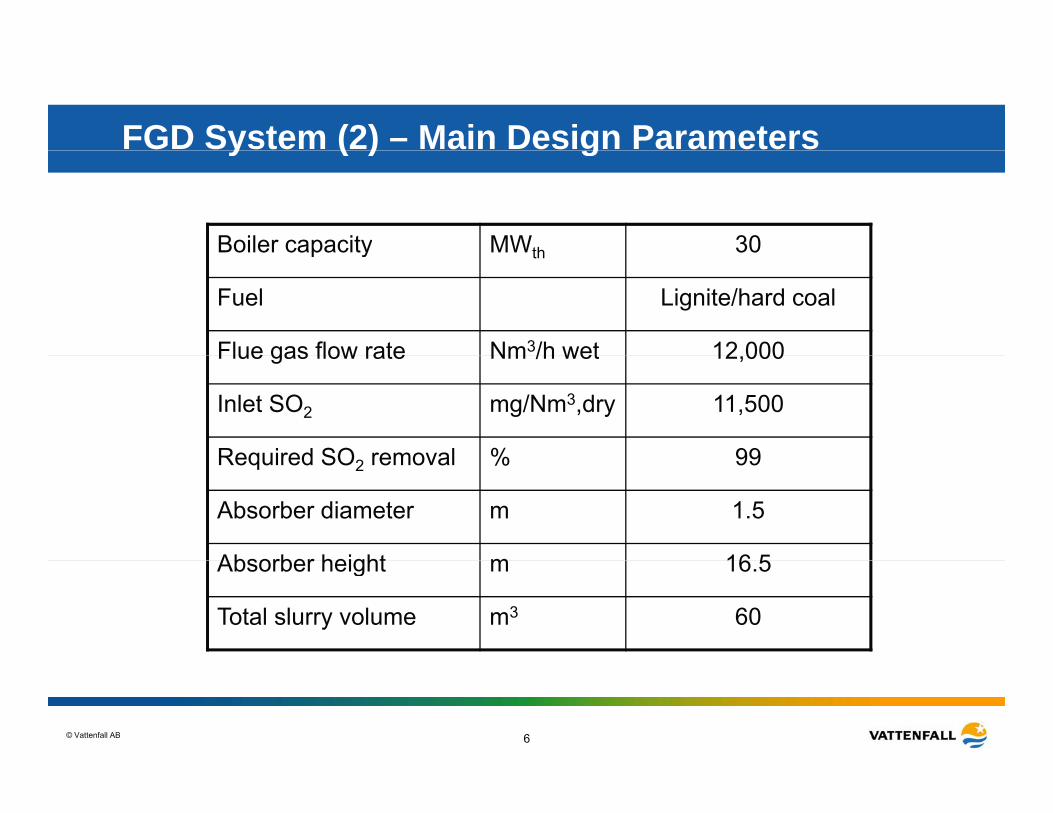
FGD System (2) – Main Design Parametersy ( ) g
Boiler capacity MWth 30p y th
Fuel Lignite/hard coal
Flue gas flow rate Nm3/h wet 12 000Flue gas flow rate Nm /h wet 12,000
Inlet SO2 mg/Nm3,dry 11,500
Required SO removal % 99Required SO2 removal % 99
Absorber diameter m 1.5
Absorber height m 16 5Absorber height m 16.5
Total slurry volume m3 60
© Vattenfall AB 6
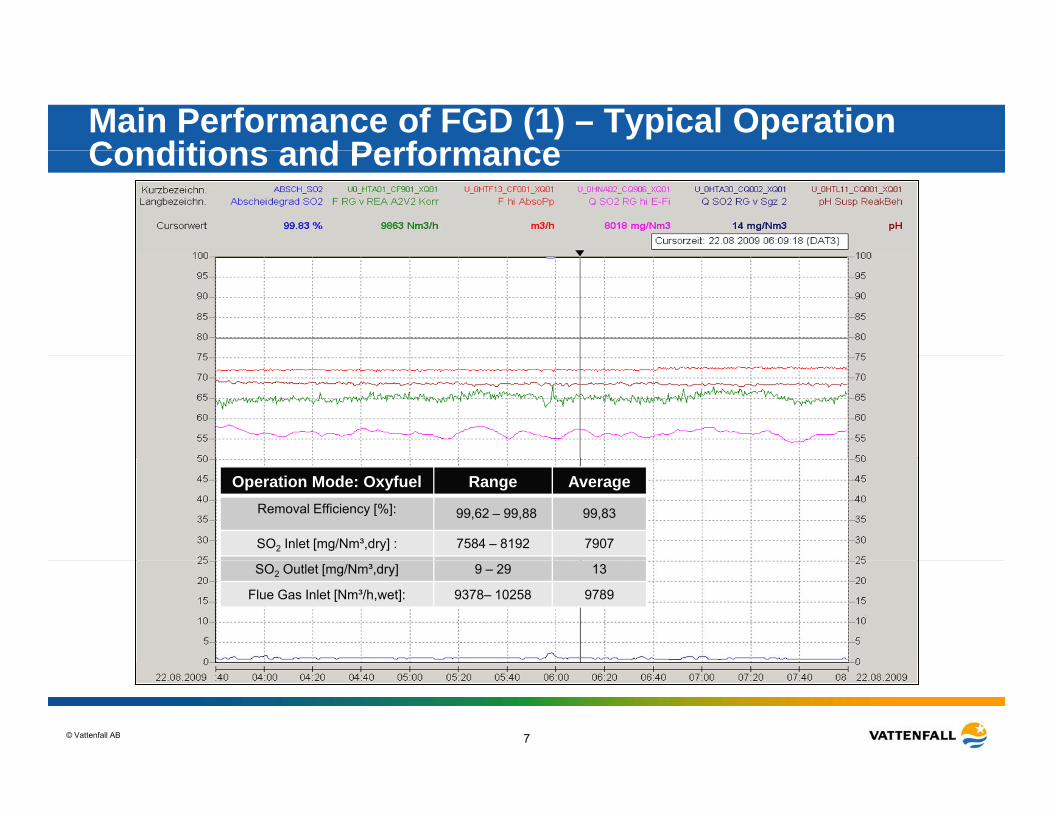
Main Performance of FGD (1) – Typical Operation Conditions and PerformanceConditions and Performance
Main Performance of FGD (1) – Acid Gas Removal
Operation Mode: Oxyfuel Range AverageRemoval Efficiency [%]: 99,62 – 99,88 99,83
SO2 Inlet [mg/Nm³,dry] : 7584 – 8192 7907
SO2 Outlet [mg/Nm³,dry] 9 – 29 13
Flue Gas Inlet [Nm³/h,wet]: 9378– 10258 9789
© Vattenfall AB 7
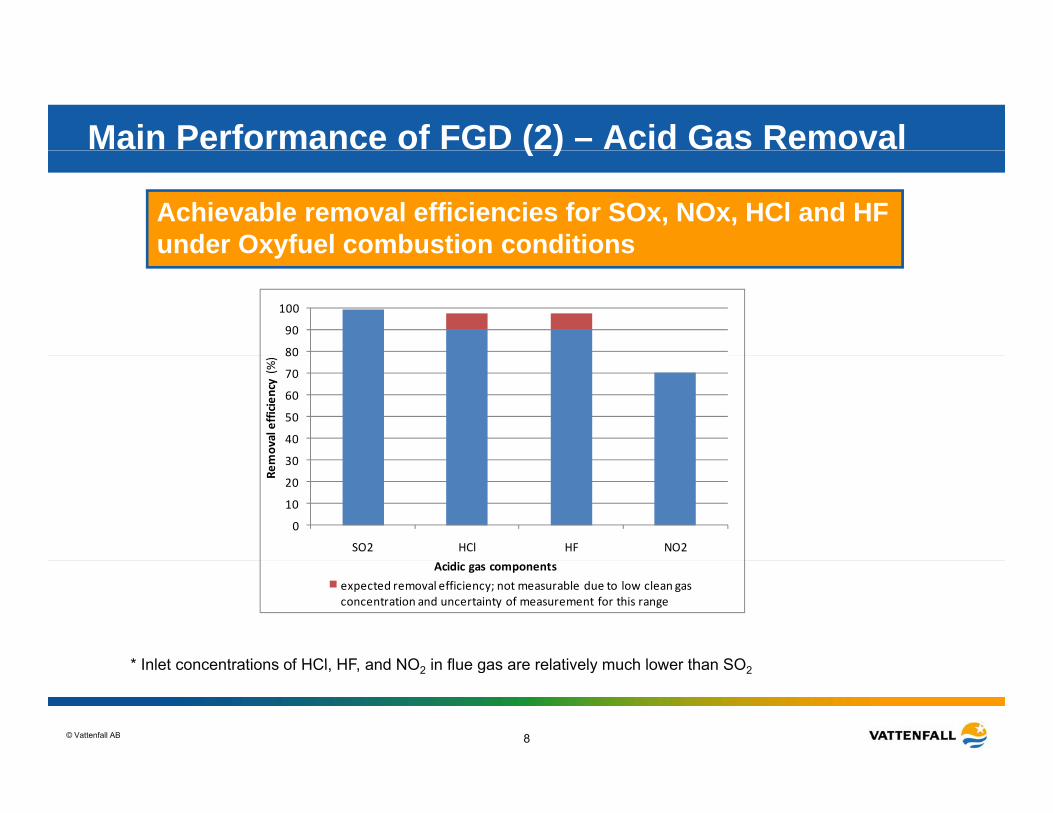
Main Performance of FGD (2) – Acid Gas Removal( )
Achievable removal efficiencies for SOx, NOx, HCl and HF under Oxyfuel combustion conditions
80
90
100
under Oxyfuel combustion conditions
30
40
50
60
70
80
moval efficiency(%)
0
10
20
30
SO2 HCl HF NO2
Rem
* Inlet concentrations of HCl HF and NO in flue gas are relatively much lower than SO
Acidic gas components
expected removal efficiency; not measurable due to low clean gas concentration and uncertainty of measurement for this range
© Vattenfall AB 8
Inlet concentrations of HCl, HF, and NO2 in flue gas are relatively much lower than SO2

Main Performance of FGD (3) – Slurry Chemistry( ) y y
• The gypsum quality is acceptable and should be carefully controlled when slurry pH is maintained in higher levels.
• The concentration of HCO3- in liquid phase may be varied with
slurry pH in a relatively large range compared with other components
Gypsum content % > 98
C CO3 (TGA) % < 0 6
components.
CaCO3 (TGA) % < 0.6
SO42- mg/l 1600 - 1700
HCO3- mg/l 100 - 2503 g
NO3- mg/l 200 - 230
Cl- mg/l 1400 - 1600
© Vattenfall AB 9
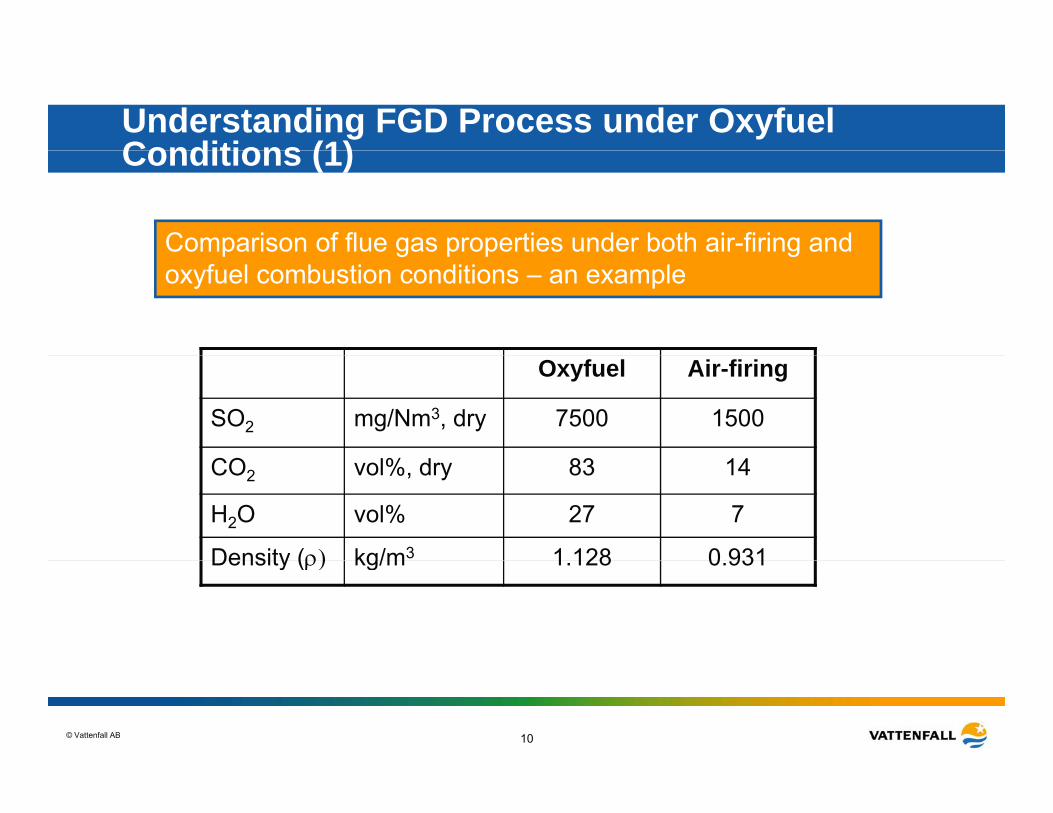
Understanding FGD Process under Oxyfuel Conditions (1)Conditions (1)
Comparison of flue gas properties under both air-firing and p g p p goxyfuel combustion conditions – an example
Oxyfuel Air-firing
SO2 mg/Nm3, dry 7500 1500
CO %CO2 vol%, dry 83 14
H2O vol% 27 7
Density ( kg/m3 1 128 0 931Density ( kg/m 1.128 0.931
© Vattenfall AB 10
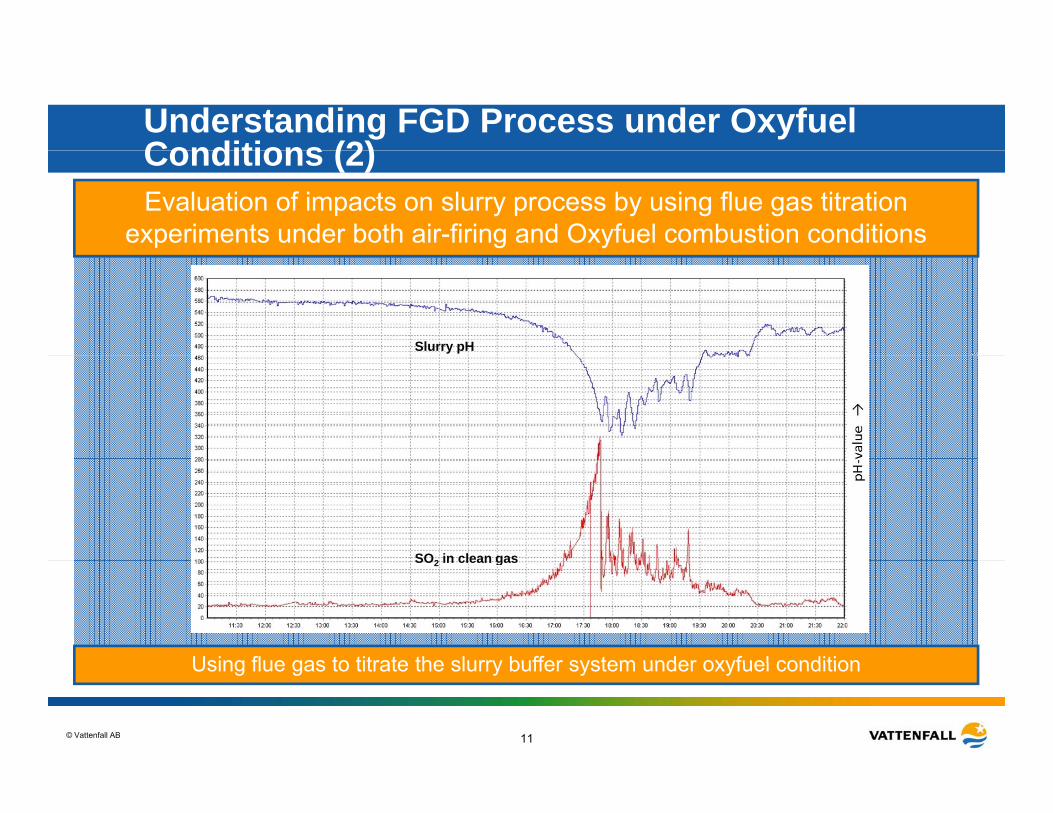
Understanding FGD Process under Oxyfuel Conditions (2)Conditions (2)Evaluation of impacts on slurry process by using flue gas titration
experiments under both air-firing and Oxyfuel combustion conditions
Slurry pH
SO2 in clean gasSO2 in clean gas
Using flue gas to titrate the slurry buffer system under oxyfuel condition
© Vattenfall AB 11
Using flue gas to titrate the slurry buffer system under oxyfuel condition
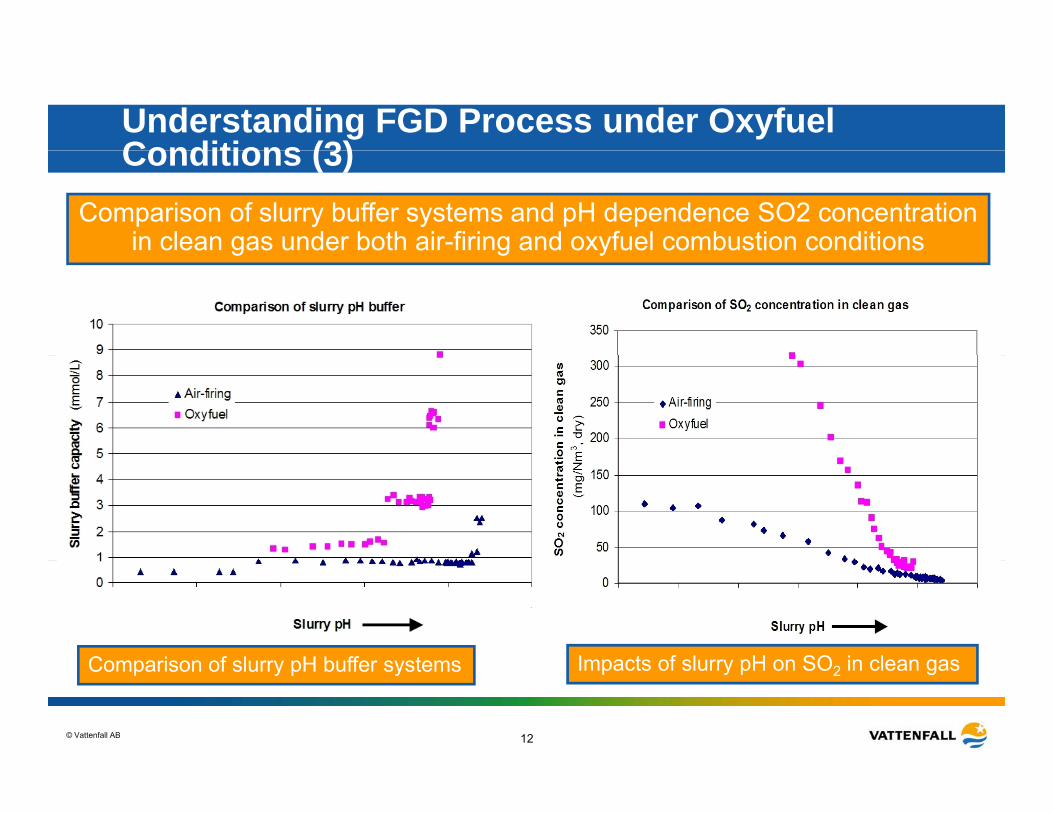
Understanding FGD Process under Oxyfuel Conditions (3)Conditions (3)
Comparison of slurry buffer systems and pH dependence SO2 concentration in clean gas under both air-firing and oxyfuel combustion conditionsg g y
Comparison of slurry pH buffer systems Impacts of slurry pH on SO in clean gas
© Vattenfall AB 12
Comparison of slurry pH buffer systems Impacts of slurry pH on SO2 in clean gas
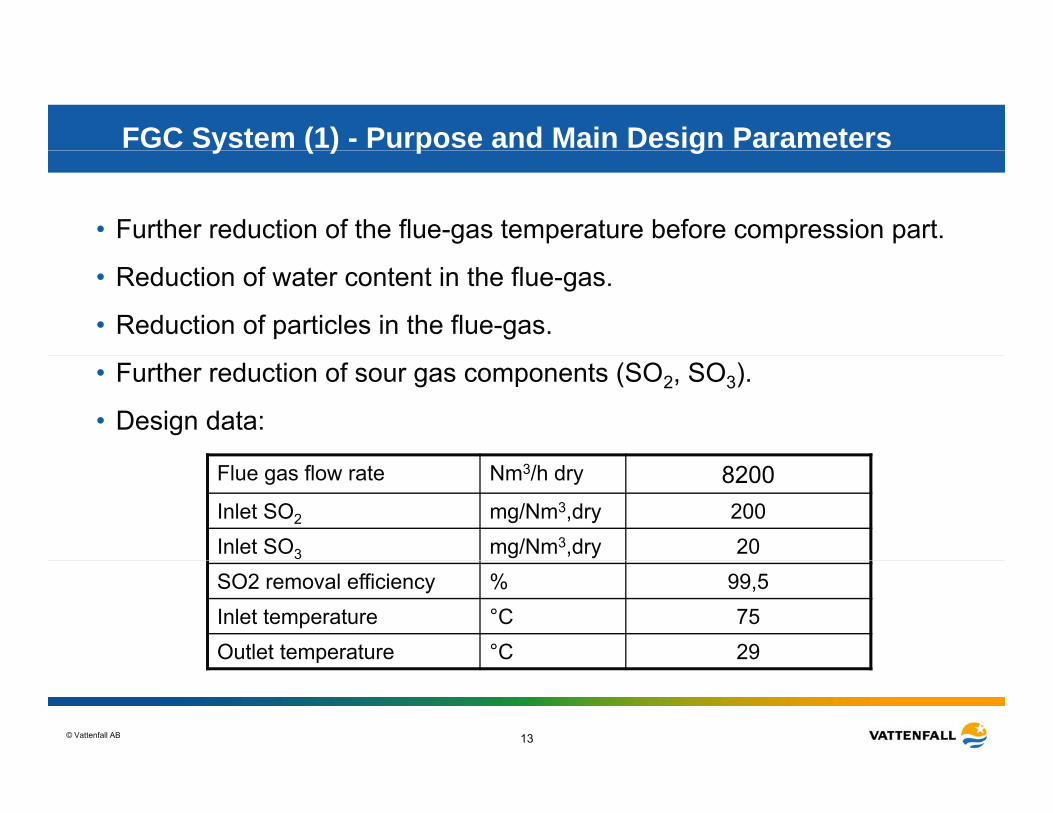
FGC System (1) - Purpose and Main Design Parameters y ( ) p g
• Further reduction of the flue-gas temperature before compression part.
• Reduction of water content in the flue-gas.
• Reduction of particles in the flue-gas.
• Further reduction of sour gas components (SO2, SO3).
• Design data:
Flue gas flow rate Nm3/h dry 8200Inlet SO2 mg/Nm3,dry 200Inlet SO3 mg/Nm3,dry 20SO2 removal efficiency % 99,5Inlet temperature °C 75Outlet temperature °C 29
© Vattenfall AB 13
p
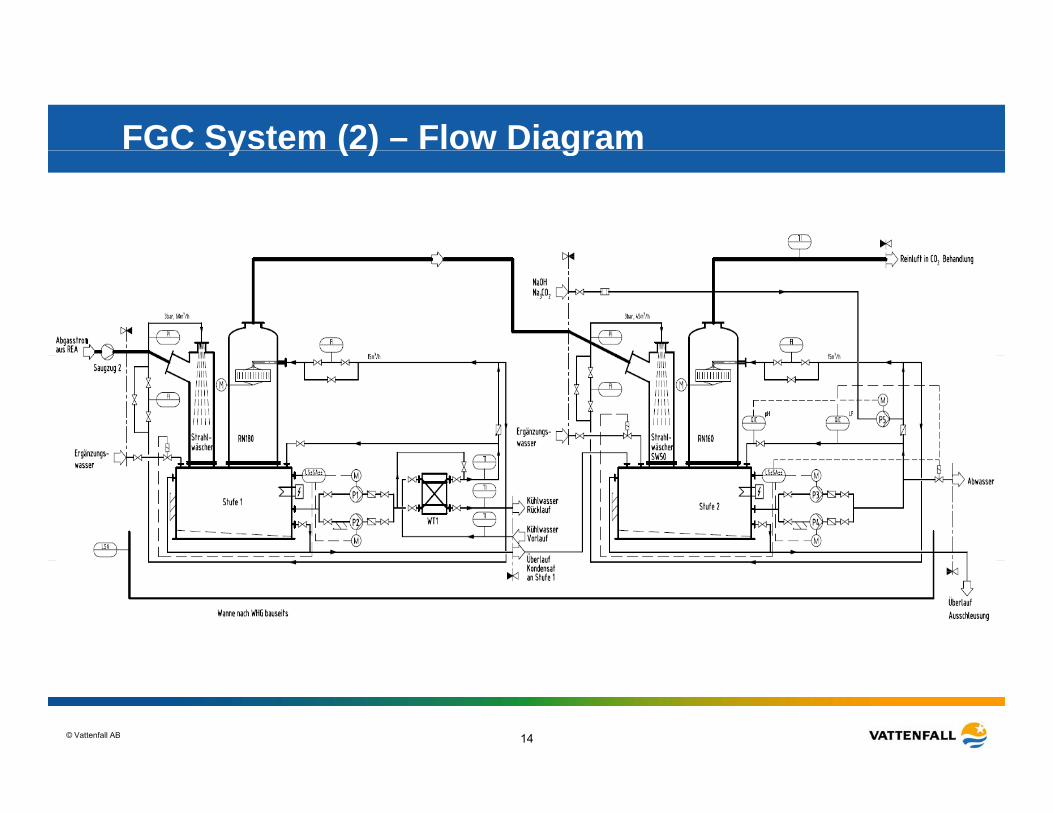
FGC System (2) – Flow Diagramy ( ) g
© Vattenfall AB 14
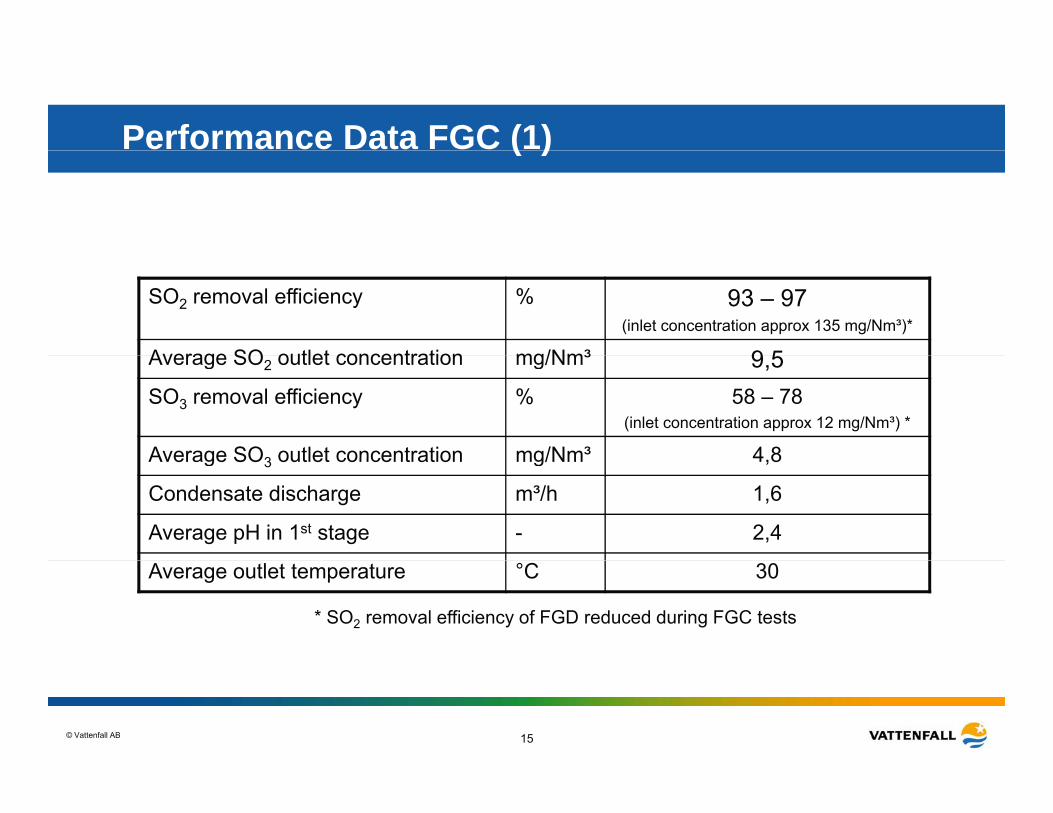
Performance Data FGC (1)( )
SO2 removal efficiency % 93 – 97(inlet concentration approx 135 mg/Nm³)*
Average SO outlet concentration mg/Nm³ 9 5Average SO2 outlet concentration mg/Nm³ 9,5SO3 removal efficiency % 58 – 78
(inlet concentration approx 12 mg/Nm³) *
Average SO3 outlet concentration mg/Nm³ 4 8Average SO3 outlet concentration mg/Nm 4,8
Condensate discharge m³/h 1,6
Average pH in 1st stage - 2,4
Average outlet temperature °C 30
* SO2 removal efficiency of FGD reduced during FGC tests
© Vattenfall AB 15
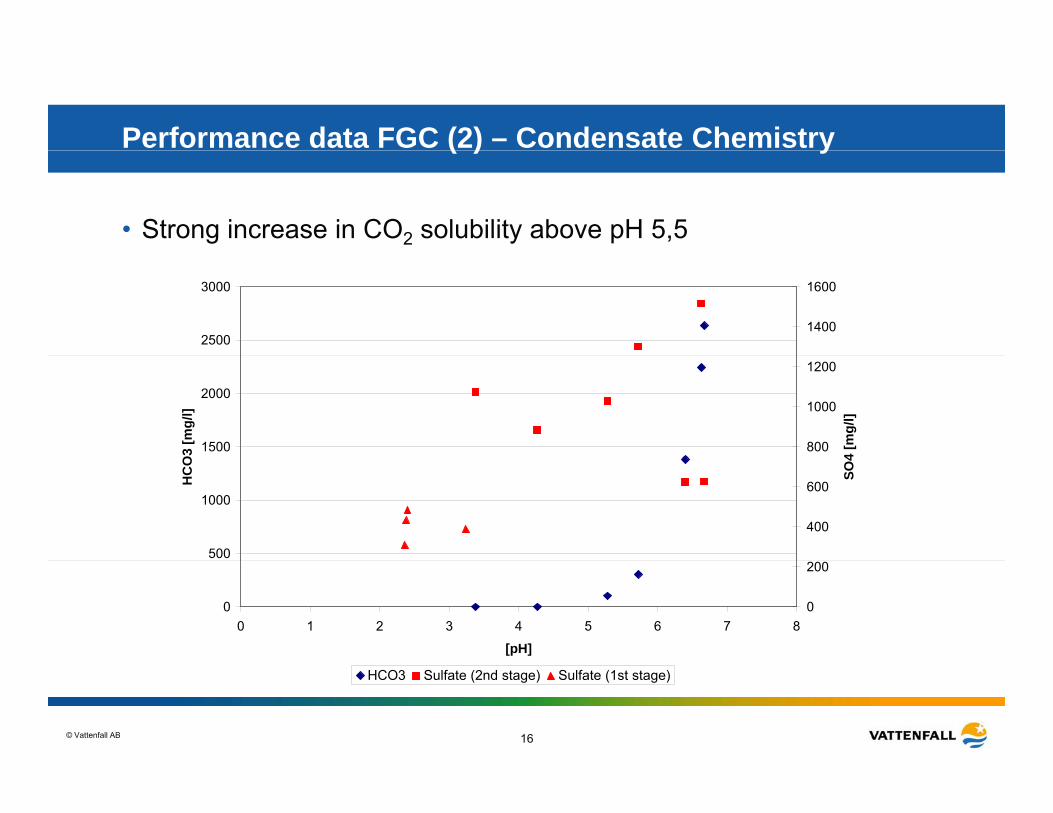
Performance data FGC (2) – Condensate Chemistry( ) y
• Strong increase in CO2 solubility above pH 5,5
2500
3000
1400
1600
1500
2000
O3
[mg/
l]
800
1000
1200
4 [m
g/l]
500
1000
HC
O
400
600
SO4
00 1 2 3 4 5 6 7 8
[pH]
0
200
© Vattenfall AB 16
HCO3 Sulfate (2nd stage) Sulfate (1st stage)
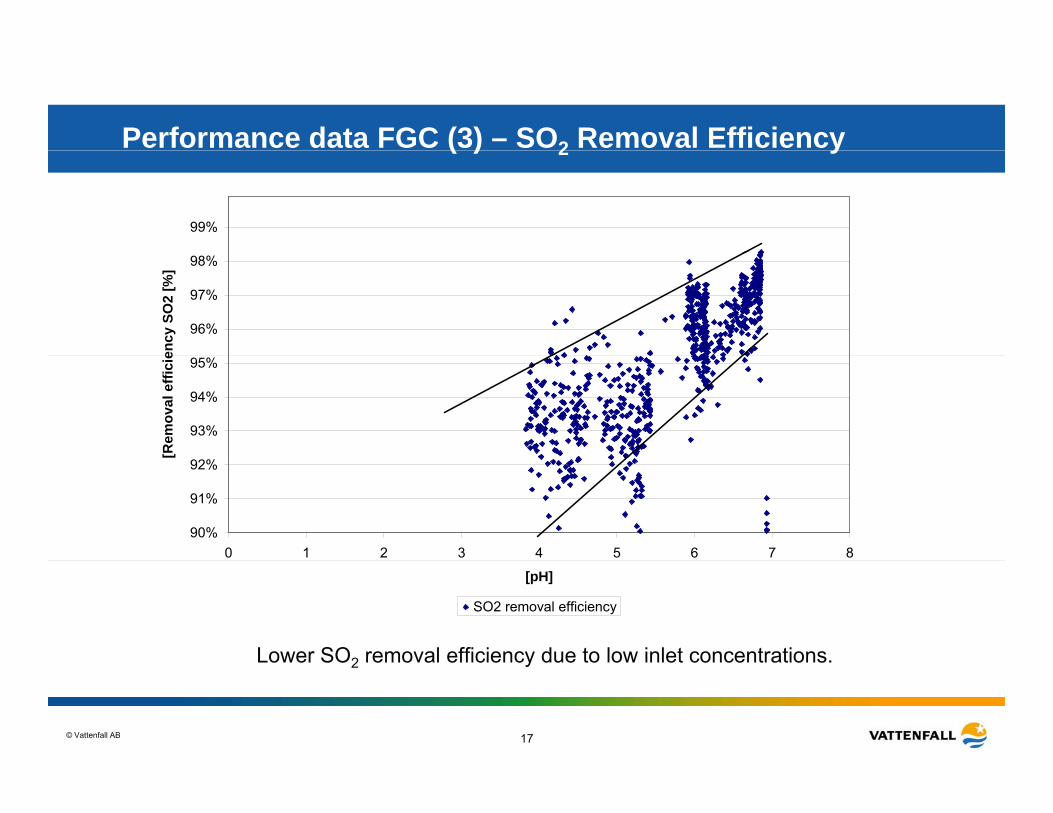
Performance data FGC (3) – SO2 Removal Efficiency( ) 2 y
99%
96%
97%
98%
ency
SO
2 [%
]
93%
94%
95%
[Rem
oval
effi
cie
90%
91%
92%
0 1 2 3 4 5 6 7 8
Lower SO2 removal efficiency due to low inlet concentrations.
[pH]
SO2 removal efficiency
© Vattenfall AB 17
2 y
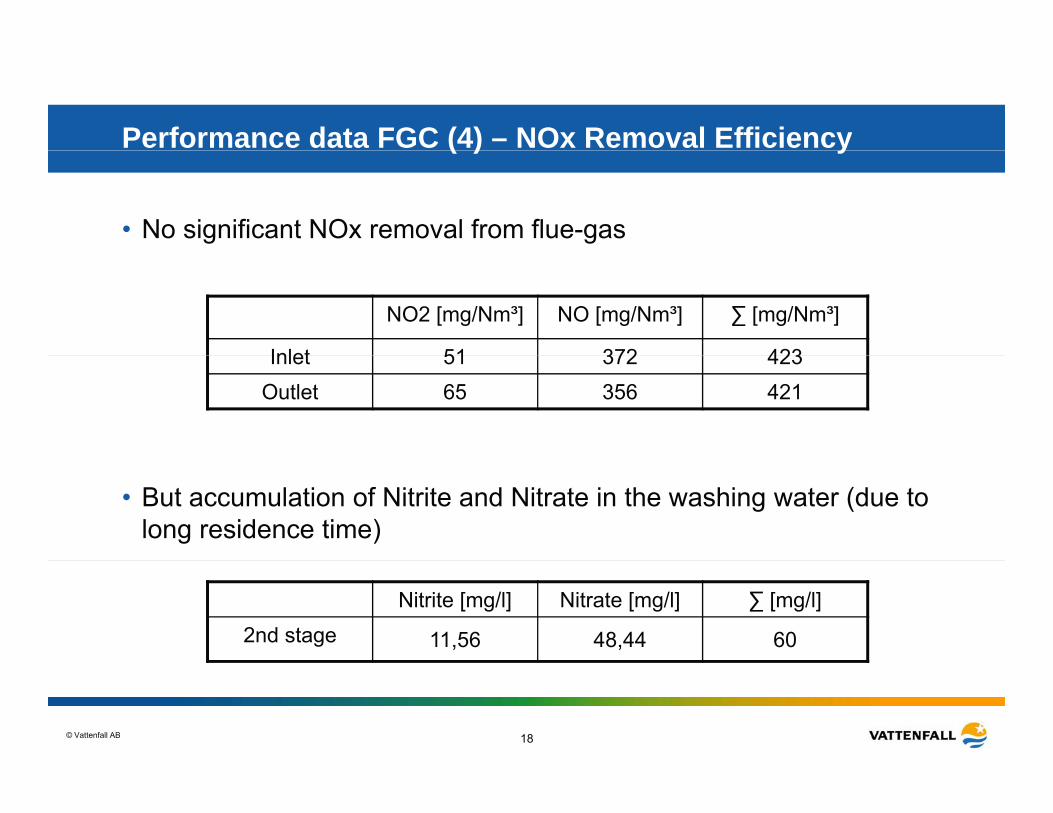
Performance data FGC (4) – NOx Removal Efficiency
• No significant NOx removal from flue-gas
( ) y
NO2 [mg/Nm³] NO [mg/Nm³] ∑ [mg/Nm³]
Inlet 51 372 423Inlet 51 372 423Outlet 65 356 421
• But accumulation of Nitrite and Nitrate in the washing water (due to long residence time)
Nitrite [mg/l] Nitrate [mg/l] ∑ [mg/l]2nd stage 11,56 48,44 60
© Vattenfall AB 18

Ongoing workg gFor FGD:• Mass balance evaluation for important flue gas components such p g p
as CO2, emission regulated components and air in-leakage,
• Optimisation of the FGD system to reduce the “mass transfer work” required by the high removal efficiency,work required by the high removal efficiency,
• Technology transfer to demonstration applications,
For FGC:• Continued investigation on influence of operating conditions on
removal efficiency and cooling performance,
L t it i f i ( i ll i h t h )• Long-term monitoring of corrosion (especially in heat exchanger),
• Optimisation of FGC system to improve cooling duty and removal efficiency.
© Vattenfall AB 19

Conclusions
- Known flue gas cleaning techniques work also for oxyfuel,
High removal efficiencies of most acid gases are achievable with very low- High removal efficiencies of most acid gases are achievable with very low residual concentrations (over 99% for SO2) in clean flue gas with good by-product quality,
- External oxidation process works well to prevent air-inleakage into the flue- External oxidation process works well to prevent air-inleakage into the flue gas system,
- High CO2 partial pressure in flue gas has significant impacts on the slurry buffer system – increasing in pH buffer capacity and changing the pH bufferbuffer system increasing in pH buffer capacity and changing the pH buffer profiles,
- Strong increase of CO2 solubility at pH above pH 5,5 in FGC,
GC f- Importance to monitor corrosion in FGC due to low pH of condensate,
- Further development may focus on optimisation of the absorption process to enhance the mass transfer in order to reduce energy consumption.
© Vattenfall AB 20
Thank you!
© Vattenfall AB

Understanding FGD Process under Oxyfuel Conditions (4)Conditions (4)
• FGD should be transferred from air-firing conditions to oxyfuel combustion conditions during the start-up procedure. S• Slurry is the slowest process during the transition period. However, it does not very significantly affect the SO2 removal.
CO2CO2
H2O
Slurry T
O2
© Vattenfall AB 22
Transition profiles of FGD from air-firing to oxyfuel combustion

Performance data FGC- Fluegas temperaturesg p
T e m p e r a t u r e s
3 8
3 4
3 6
2 8
3 0
3 2
2 2
2 4
2 6
1 8
2 0
1 0 . 0 6 . 0 9 1 0 . 0 6 . 0 9 1 0 . 0 6 . 0 9 1 0 . 0 6 . 0 9 1 1 . 0 6 . 0 9 1 1 . 0 6 . 0 9 1 1 . 0 6 . 0 9 1 1 . 0 6 . 0 9 1 1 . 0 6 . 0 9 1 2 . 0 6 . 0 9 1 2 . 0 6 . 0 9 1 2 . 0 6 . 0 9
U 0 H U B 1 0 C T 0 0 1 [ ° C ] U 0 H U B 1 0 C T 0 0 2 [ ° C ] U 0 H U B 2 0 C T 0 0 1 [ ° C ] U 0 H U B 2 0 C T 0 0 2 [ ° C ]
© Vattenfall AB 23
U 0 U 0 C 0 0 [ C ] U 0 U 0 C 0 0 [ C ] U 0 U 0 C 0 0 [ C ] U 0 U 0 C 0 0 [ C ]
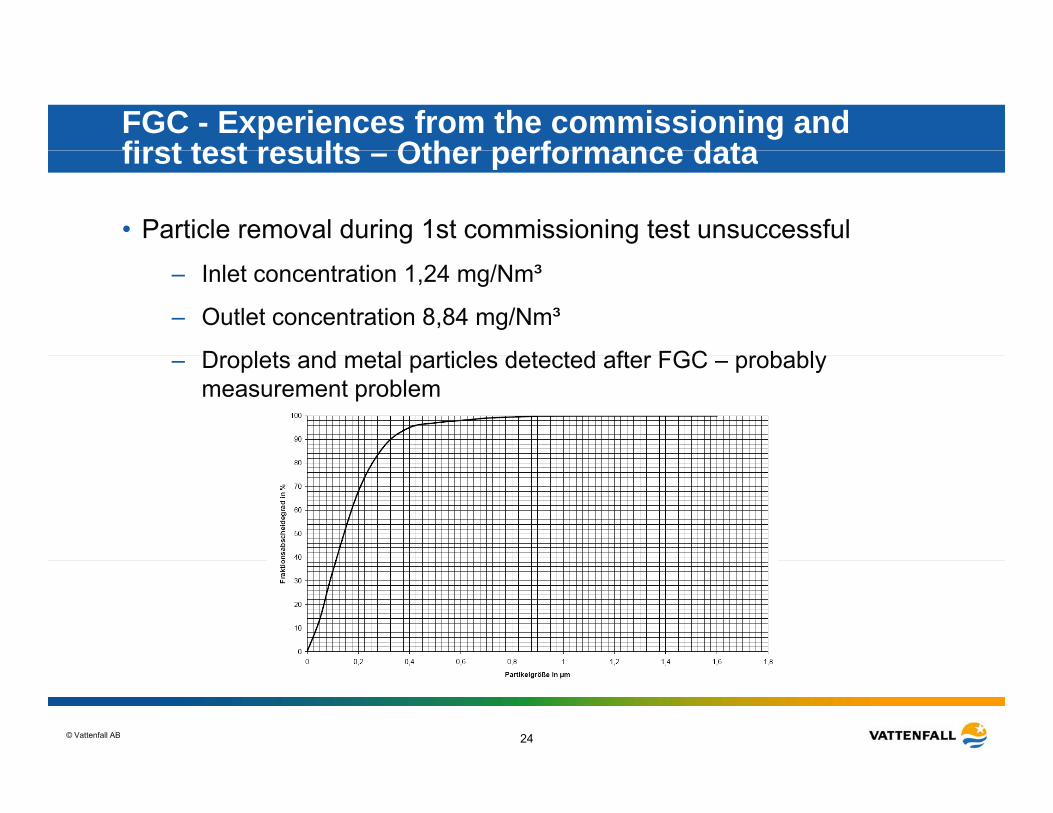
FGC - Experiences from the commissioning and first test results Other performance datafirst test results – Other performance data
• Particle removal during 1st commissioning test unsuccessful– Inlet concentration 1,24 mg/Nm³
– Outlet concentration 8,84 mg/Nm³
Droplets and metal particles detected after FGC probabl– Droplets and metal particles detected after FGC – probably measurement problem
© Vattenfall AB 24
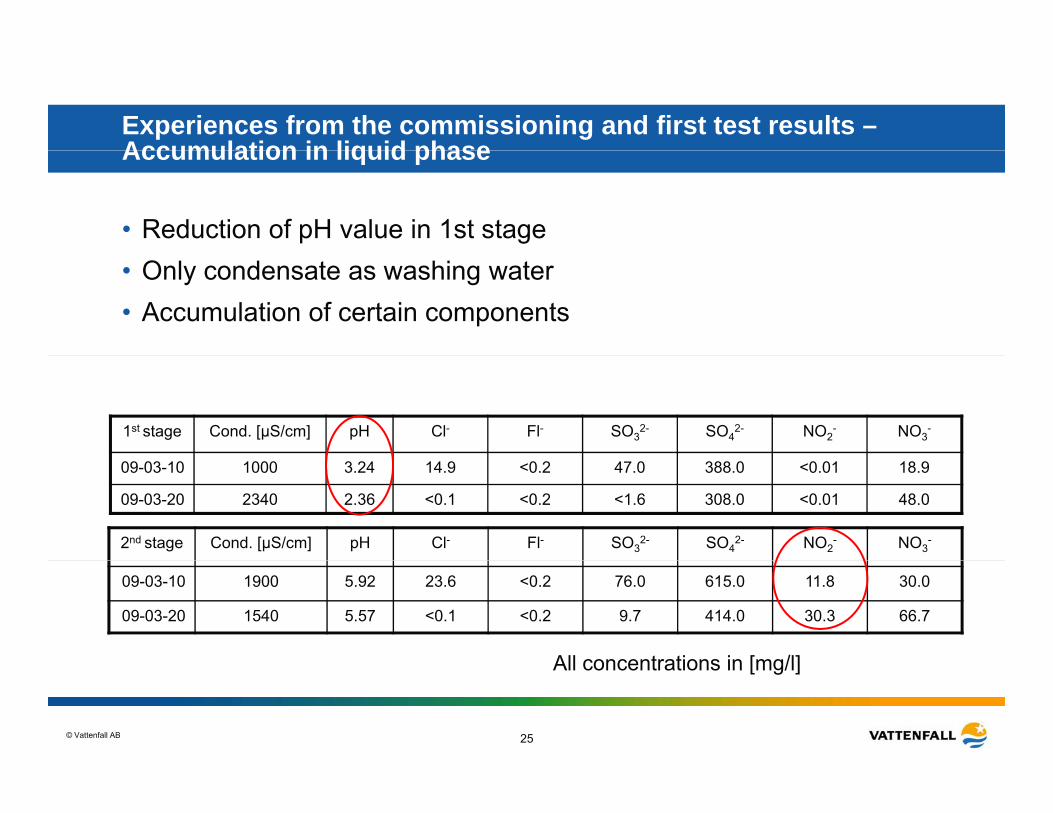
Experiences from the commissioning and first test results –Accumulation in liquid phaseAccumulation in liquid phase
• Reduction of pH value in 1st stage• Only condensate as washing water• Accumulation of certain components
1st stage Cond. [μS/cm] pH Cl- Fl- SO32- SO4
2- NO2- NO3
-
09-03-10 1000 3.24 14.9 <0.2 47.0 388.0 <0.01 18.9
09-03-20 2340 2.36 <0.1 <0.2 <1.6 308.0 <0.01 48.0
2nd stage Cond. [μS/cm] pH Cl- Fl- SO32- SO4
2- NO2- NO3
-
09-03-10 1900 5.92 23.6 <0.2 76.0 615.0 11.8 30.0
09-03-20 1540 5.57 <0.1 <0.2 9.7 414.0 30.3 66.7
All concentrations in [mg/l]
© Vattenfall AB 25
All concentrations in [mg/l]