experiences of education, health and care plans - gov.uk · experiences of education, health and...
TRANSCRIPT

Experiences of Education, Health and Care plans: a survey of parents and young people Research report
March 2017
Lorna Adams, Angus Tindle, Sabrina Basran, Sarah Dobie and Dominic Thomson, IFF Research; Dr Deborah Robinson and Dr Claire Shepherd, University of Derby

2
Contents List of figures 5
List of tables 8
Glossary of terms 9
Executive summary 11
Key findings in brief 11
Background and aims 12
Method 13
Overall experience of the process (Chapter 2) 15
Involvement in the process (Chapter 3) 16
Awareness of information, advice and support (Chapter 4) 20
Perceptions of the quality of the EHC plan (Chapter 5) 21
Overall variation in experiences by groups with different characteristics 24
1. Introduction 27
1.1. The policy context to Education, Health and Care plans 27
1.1.1. Introduction 27
1.1.2. The Children and Families Act, 2014 30
1.1.3. Service standards associated with Education, Health and Care plans 31
1.1.4. What is already known about the efficacy of the EHC plan process? 32
1.2. Aims of the survey 34
1.3. Survey methodology 35
1.3.1. Who was invited to take part in the survey 35
1.3.2. How potential survey participants were identified 35
1.3.3. How parents and young people took part 35
1.3.4. How the questionnaire was designed 37
1.4. Profile of parents and young people who responded 39
1.5. Analysis approach 41
1.6. Limitations of the survey 43
1.7. About this report 44
1.8. Acknowledgements 44

3
2. Overall experience of the process 45
2.1. Introduction 45
2.2. Overall satisfaction with the experience of the process 46
2.2.1. Variations in satisfaction by local authority 49
2.3. Reasons that parents and young people gave for being satisfied or dissatisfied 53
2.4. Extent to which getting an EHC plan was a positive experience for the child/young person 56
2.5. Confidence that EHC plan will achieve agreed outcomes 59
2.5.1. Variations in confidence in the EHC plan by local authority 62
2.6. Summary 66
3. Involvement in the process 68
3.1. Introduction 68
3.1.1. Having a previous Statement of SEN 70
3.1.2. Who started the process 71
3.1.3. Number of requests to get an EHC plan 74
3.1.4. Ease of starting the process 76
3.2. Length of the process 78
3.3. Experiences of being involved in the process 82
3.4. Extent to which the process is family-centred 88
3.5. Agreeing on the needs and support described in the EHC plan 89
3.6. Overall score for degree of ease or difficulty of the process of getting the EHC plan 91
3.7. Inclusion of children and young people in the process 94
3.7.1. Taking steps to include the child/young person 94
3.7.2. Providing support 97
3.8. Experiences of working with professionals 99
3.9. Summary 103
Starting the process 103
Length of the process 103
Experiences of being involved in the process 103
Characteristics associated with more positive or negative process experiences 104

4
4. Awareness of information, advice and support 105
4.1. Introduction 105
4.2. Awareness and receipt of information, advice and support 106
4.2.1. Types of information, advice and support used 111
4.3. Information on and use of Personal Budgets 113
4.4. Reviewing the EHC plan 114
4.5. Disagreement and complaints 115
4.5.1. Awareness and use of different complaints and appeals processes 117
4.6. Summary 119
5. Perceptions of the quality of the EHC plan 120
5.1. Views on the content of the EHC plan 120
5.2. Meeting specific EHC plan requirements 123
5.2.1. Preparations for the future 126
5.3. Impact of the EHC plan 127
5.3.1. Short-term impacts 127
5.3.2. Future / longer-term impacts 130
5.4. Overall impact of the EHC plan 134
5.5. Summary 136
Views on the content of the EHC plan 136
Meeting specific requirements of the EHC plan 136
Impact of the EHC plan 136
Characteristics associated with more positive or negative perceptions of EHC plan quality 137
6. Conclusions 138
Appendix A – Questionnaire sent to parents 141
Appendix B – Questionnaire sent to young people 157
Appendix C – Initial and reminder letters sent to parents and young people 171
Appendix D – Frequently asked questions: enclosed with each letter 176
Appendix E – Number of responses by local authority 177
Appendix F – LA data with confidence levels 181

5
List of figures Figure 2.1: Overall satisfaction with process of getting an EHC plan 46
Figure 2.2: Overall satisfaction with process of getting an EHC plan by local authority (line graph) 51
Figure 2.3: Overall satisfaction with process of getting an EHC plan by local authority (map) 52
Figure 2.4: Most common responses to the open-ended question of what worked well about the process of getting and EHC plan 53
Figure 2.5: Supporting verbatim for the most common positive themes for what worked well during the process of getting an EHC plan 54
Figure 2.6: Most common responses to the open-ended question of what did not work well about the process of getting an EHC plan 55
Figure 2.7: Supporting verbatim for the most common negative themes for what did not work so well during the process of getting an EHC plan 55
Figure 2.8: Extent to which getting an EHC plan was a positive experience for the child/young person 57
Figure 2.9: Extent to which believe that the help/support described in the EHC plan will achieve agreed outcomes 60
Figure 2.10: Confidence that EHC plan will achieve agreed outcomes by local authority (line graph) 64
Figure 2.11: Confidence that EHC plan will achieve agreed outcomes by local authority (map) 65
Figure 3.1: How the process of getting the EHC plan started 72
Figure 3.2: Whether or not the EHC plan was received after the first request 74
Figure 3.3: The ease of starting the process 77
Figure 3.4: Length of process for getting an EHC plan – excluding those not giving a timescale 80
Figure 3.5: Experiences of parents and young people being involved in the process of getting the EHC plan 83

6
Figure 3.6: Ease of being involved in the process of getting the EHC plan 86
Figure 3.7: Extent to which needs and circumstances of the family were taken into account during the EHC plan process 88
Figure 3.8: Degree of ease/difficulty in agreeing the needs and support described in the EHC plan 90
Figure 3.9: Combined score for each element of the EHC plan process 92
Figure 3.10: Combined ‘ease of the process’ scores for subgroups of parents and young people 93
Figure 3.11: Whether or not steps were taken to include the child/young person in meetings and encourage their participation during the process of getting the EHC plan 95
Figure 3.12: Whether support was offered to the child/young person in the process of getting the EHC plan 98
Figure 3.13: Parent and young people’s views on working with others throughout the process 100
Figure 4.1: Proportion of parents and young people who were told about and received information, advice and support during the process of getting and EHC plan 107
Figure 4.2: Whether or not the parent or young person was told about or received information, advice and support – by age of child 108
Figure 4.3: Proportions of parents and young people who have either heard of or used various sources of information, advice and support 111
Figure 4.4: Proportion of parents and young people who were given the option of having a Personal Budget and those who went on to take up the offer of a Personal Budget 113
Figure 4.5: Proportion of respondents who were told how their EHC plan would be reviewed 114
Figure 4.6: Proportion of parents and young people who said they had been informed by their local authority about the complaints and appeals procedures 116
Figure 4.7: Proportions of parents and young people who were either told about or used various complaints and appeals channels and the Mediation Service 117
Figure 5.1: Extent to which parents’ and child/young persons’ wishes and opinions were included in the EHC plan 121

7
Figure 5.2: Extent to which the EHC plan is easy for the parent and child/young person to understand 123
Figure 5.3: Extent to which EHC plan includes preparations for the child/young person’s next move in life 126
Figure 5.4: Extent to which the EHC plan has already made a difference to children/young people and their family 128
Figure 5.5: Perceptions on the future impact of the EHC plan 131
Figure 5.6: Overall views on the help and support outlined in the EHC plan 135

8
List of tables Table 1.1: Profile of parents and young people who responded to the survey 39
Table 3.1: Whether previously had a Statement of Special Educational Needs before getting the EHC plan, by age of child/young person 70
Table 3.2: Whether got the EHC plan after the first request, by age of child/young person 75
Table 3.3: Length of EHC plan process, by whether had a previous SEN Statement or not 81
Table 3.4: Whether steps taken to help the child/young person understand what took place and why, by age of the child/young person 85
Table 3.5: Whether or not steps were taken to include the child/young person or parent in meetings and encourage their participation, by age of the child/young person 96
Table 3.6: Whether or not different services worked together to make the EHC plan, by age of the child/young person 102
Table 4.1: Characteristics associated with accessing information, advice and support during the EHC plan process 110
Table 4.2: Number of sources of information, advice and support that parents and young people had heard of and used: split by the age of child/young person with the EHC plan 112
Table 5.1: Agreement with statement about wishes and opinions, by age 121
Table 5.2: Whether the nursery, school or college named in the EHC plan was the one asked for during the drafting process 124
Table 5.3: Agreement with statements about the extent to which the EHC plan has already made a difference, by age 129
Table 5.4: Agreement with statements about future impact of the EHC plan, by age 132

9
Glossary of terms The following terms are used in this report:
Education, Health and Care plan (EHC plan): This is a statutory document. An EHC plan details the education, health and care support that is to be provided to a child or young person who has a Special Educational Need or a disability (SEND). It is drawn up by the local authority after an EHC needs assessment of the child or young person has determined that an EHC plan is necessary, and after consultation with relevant partner agencies.
Independent supporter: A person recruited locally by a voluntary or community sector organisation to help families going through an EHC needs assessment and the process of developing an EHC plan. This person is independent of the local authority and will receive training, including legal training, to enable him or her to provide this support.
Information, Advice and Support Services (IASS): Information, Advice and Support Services provide impartial information, advice and support to children and young people with SEND, and their parents, about the SEND system to help them play an active and informed role in their education and care. Although funded by local authorities, Information, Advice and Support Services are run either at arm’s length from the local authority or by an independent (usually voluntary) organisation to ensure children, their parents and young people have confidence in them.
Local Offer: The Local Offer is a comprehensive, accessible and up-to-date online resource provided by local authorities. Local authorities in England are required to set out in their Local Offer information about provision they expect to be available across education, health and care for children and young people in their area who have SEND, including those who do not have Education, Health and Care (EHC) plans. Local authorities must consult locally on what provision the Local Offer should contain.
Mainstream education setting: In this report, this indicates a nursery, school or college that is not a specialist education setting (for a definition of ‘specialist education setting’, see below).
Mixed education setting: In this report, this indicates that a child or young person is in a mainstream school, college etc. but is sometimes taught separately in a base or facility specifically for children/young people with SEND.
Personal Budget: A Personal Budget is an amount of money identified by the local authority to deliver provision set out in an EHC plan where the parent or young person is involved in securing that provision. The funds can be held directly by the parent or young person, or may be held and managed on their behalf by the local authority, school,

10
college or other organisation or individual and used to commission the support specified in the EHC plan.
Special Educational Needs (SEN): A child or young person has SEN if they have a learning difficulty or disability which calls for special educational provision to be made for him or her. A child of compulsory school age or a young person has a learning difficulty or disability if he or she has a significantly greater difficulty in learning than the majority of others of the same age, or has a disability which prevents or hinders him or her from making use of educational facilities of a kind generally provided for others of the same age in mainstream schools or mainstream post-16 institutions.
Specialist education setting: A school which is specifically organised to make special educational provision for pupils with SEN.

11
Executive summary
Key findings in brief
• Two thirds of parents and young people were satisfied with the overall process of getting an EHC plan and a similar proportion agreed that it would achieve the outcomes agreed for the child or young person (over one in ten were dissatisfied and just under one in ten disagreed respectively);
• Half found that starting the EHC plan process was easy, whereas almost one quarter found this to be difficult. Among those with no previous SEN Statement, around eight in ten got their EHC plan after their first request;
• Two thirds of parents and young people were informed about the information, advice and support available. The majority of those informed went on to use it and use was related to a better experience;
• The majority of parents agreed that their own wishes and opinions were included in the EHC plan. It was less common to report that the wishes and opinions of the child or young person were included, but this varied by age (from three in ten for those under five to seven in ten for those aged 16-25);
• Three quarters said that the nursery, school or college named in their EHC plan was the one they asked for in the drafting process (5% agreed on a second or third choice or an alternative option and 4% said the named institution was not wanted);
• More respondents thought that their EHC plan had been provided after the 20-week target had passed. Official statistics show the majority of new plans were provided by 20 weeks. The difference may reflect respondents timing the process from an earlier point, imprecisions in respondents’ estimates, and plans exempt from the 20-week timeframe being included in the survey data;
• Almost three quarters agreed that their EHC plan led to the child or young person getting the help and support that they need; over two-thirds agreed it has improved the child/young person’s experience of education. Respondents were more likely to agree (for both measures) the longer the plan had been in place;
• Over half of respondents were positive about their plan’s future impact regarding community participation, independent living, and identifying aspirations; just under half were positive about finding work. Around one in ten provided a negative response to these questions.
• There were variations in experiences of the EHC needs assessment and planning process and the resultant EHC plan by local authority and by a number of characteristics (e.g. the age of the child/young person; whether the child/young person previously had a SEN Statement, and the types of needs that the EHC plan was perceived to cover).

12
Background and aims
An Education, Health and Care plan (EHC plan) sets out the education, health and care support that is to be provided to a child or young person aged 0-25 years who has Special Educational Needs (SEN) or a disability (SEND). It is drawn up by the local authority after an Education, Health and Care (EHC) needs assessment of the child or young person has determined that an EHC plan is necessary, and after consultation with relevant partner agencies and with children, young people and parents.
EHC plans, and the needs assessment process through which these are made, were introduced as part of the Children and Families Act 2014. The Act, and an accompanying SEND Code of Practice1, sets out how local authorities must deliver these, including:
• Developing and maintaining these collaboratively with children, young people and parents;
• Supporting children, young people and parents to participate fully;
• Focusing on securing the best possible outcomes for the child/young person;
• Enabling participation by relevant partner agencies, to enable joined-up provision.
The SEND accountability framework established in 20152 sets out an approach for assessing SEND provision in conjunction with the Act and SEND Code of Practice. The framework provides structure for improving outcomes and experiences for children, young people and their families and, when applied, seeks to show how the system is performing, hold partners to account and support self-improvement. The framework applies at the local and national levels and to independent assessments of the EHC plan process – such as those carried out by Ofsted.
In this context, the Department for Education commissioned a survey of parents and young people with an EHC plan, in order to build a representative national (and, where the data allows, local) picture of how parents and young people in England were experiencing the EHC needs assessment and planning process and the resultant EHC plans.
The aim was to assess whether delivery of the EHC needs assessments and planning process and the resultant EHC plans reflected the intentions set out in the Children and
1 The SEND Code of Practice: 0-25 years details the legal requirements for key bodies – local authorities, health bodies, and education settings - involved in the EHC needs assessment and planning process and sets out statutory guidance for compliance. The 2014 Code replaces the 2001 Code of Practice – the latter still applies to those with a SEN Statement. More detail on the content of the SEND Code of Practice is provided in Chapter 1 of the report. 2 The ‘SEND: supporting local and national accountability’ framework

13
Families Act 2014 and the accompanying SEND Code of Practice. The findings would help inform the SEND accountability framework.
To achieve these aims the survey sought to answer the following questions:
• To what extent do children, young people and families experience the EHC needs assessment and planning process as they are intended to be experienced;
• How satisfied are children, young people and families with the EHC needs assessment and planning process and the resultant EHC plan; and
• To what extent does this vary by local authority and by groups with different characteristics?
The findings presented here and throughout the main report explore parents’ and young people’s responses to the survey questions. The report also explores where experiences of the EHC needs assessment and planning process varied for groups with different characteristics, applying a bivariate analysis approach3. The report only highlights such differences where these are statistically significant4.
Method
The survey focused on children and young people with an EHC plan that had been created in the calendar year 2015 (the most recent full calendar year at the time of the survey).
Children and young people with 2015 EHC plans were identified via two official databases: the National Pupil Database, which contains detailed information about pupils in schools and colleges in England; and the Individualised Learner Record, containing details of learners in publicly funded further education. This identified 65,172 individuals with an EHC plan put in place in 2015.
To maximise the accessibility of the survey, families of children and young people identified as having an EHC plan were offered the opportunity to complete it online, via a paper questionnaire and by telephone. An Easy Read version was also made available as were face-to-face interviews and interviews in languages other than English. All
3 Bivariate analysis has been carried out to identify statistically significant differences in responses to questions by subgroups compared with all parents and young people surveyed, and/or between subgroups. A multivariate analysis to identify which subgroups may have had particularly positive or negative experiences of the EHC needs assessment and planning process, looking at responses across multiple subgroups is being undertaken and will be made available in a separate report. 4 For further information on the analysis approach, see the Technical Report published with this document.

14
communications were designed to be accessible and considerate of the potentially sensitive nature of the questionnaire content.
Families of children and young people were initially contacted by letter, inviting them to take part in an online survey. Where the child or young person named on the EHC plan was aged 16-25 years, the survey invitation was initially addressed to them directly; where they were aged under 16, the initial invitation was addressed to the parent or carer. After four weeks, those who had not responded were sent a reminder letter, again providing details of the online survey but this time also including a paper questionnaire booklet and a reply-paid envelope. After a further two weeks, all non-responders for whom a telephone number was available were approached to take part over the telephone.
A total of 13,643 responses were received between 25th July and 28th November 2016. The sample achieved was very similar in profile to the original population. Weights have been applied to the survey data to correct for the few respects in which the profiles differed5. This was done to create a nationally representative picture of parents and young people’s experiences of the EHC needs assessments, planning process and resultant EHC plans in England. The survey questions explored both positive and negative aspects of parent and young people’s experiences6.
Limitations of the survey
• The survey covers the views and opinions of parents and young people – the data collected therefore reflects their perceptions of what took place rather than facts;
• As only those with an EHC plan put in place in 2015 were surveyed, the data does not reflect any changes/improvements in provision since;
• Chapter 2 reports on variations in experience by geography at the local authority level. This analysis covers two thirds of local authorities in England due to an insufficient number of responses (less than 50) from the remaining third of local authorities;
• The survey includes only those with an EHC plan in place at the time of fieldwork. It therefore excludes anyone who may have requested an EHC needs assessment or plan and been refused7.
5 The accompanying Technical Report published with this document contains further detail on the sampling and weighting approaches applied in this study. 6 The questionnaire is presented in the Appendices to this report. 7 A DfE study on SEND disagreement resolution arrangements has explored such experiences. See Cullen, M.A. et al (2017) Review of arrangements for disagreement resolution (SEND), Department for Education.
15
More detail on the methodological approach for the survey can be found in the accompanying Technical Report, available separately8.
Overall experience of the process (Chapter 2)
Parents and young people were asked to rate different aspects of their experiences of the EHC needs assessment and planning process and the resultant EHC plan, to get a sense of their experience overall. This covered satisfaction with the whole experience and with participation in the process, their confidence that the help/support described in the EHC plan will achieve the agreed outcomes, and also open questions on what did and did not go well during the process.
• Around two-thirds of parents and young people expressed satisfaction with the overall process of getting an EHC plan (66% said they were satisfied)9;
• Just under two-thirds agreed that the help/support described in the EHC plan will achieve the agreed outcomes for the child/young person (62% agreed); and
• Two-fifths felt the process was a positive experience for the child/young person and one in ten felt it was negative. Just over half said that it was neither a positive nor negative experience (23%) or that they did not know (23%). The proportion agreeing that it was a positive experience increased with the age of the child/young person.
When asked an open question about what went well during the EHC needs assessment and planning process10, parents and young people were most likely to mention that they had acquired the funding or assistance that the child or young person needed; or that the support received from staff at the school or college had been positive.
When asked an open question about what didn’t work well, parents and young people mostly mentioned that the process had worked for them. The second most common response was that the process took too long and the third most common reply related to difficulties in getting the help/support needed to meet the needs of the child or young person. This latter issue was more prevalent where the EHC plan was for a young person aged 16-25 years.
There were variations by local authority, both in the proportion of parents and young people who said that they were satisfied with the overall EHC plan process and in the
8 The Technical Report has been published alongside this document. 9 Please see relevant chapters/sections in the main report body for the full set of responses given to each of the questions discussed in the Executive Summary. 10 What worked well and what worked less well were both asked as free text questions, allowing the parent or young person to say whatever they wished.

16
proportion of parents and young people who agreed that the help/support described in their EHC plan would achieve the outcomes agreed. There was no obvious geographic clustering of the higher and lower performing local authority areas on either measure.
Involvement in the process (Chapter 3)
Starting the process
In nearly two-thirds of cases (63%), the child or young person had transferred from a Statement of Special Educational Needs (SEN) to an EHC plan and for these respondents it was the local authority’s responsibility to initiate an EHC needs assessment to begin the transition.
Those without a previous SEN Statement (non-transfers) were asked how many times they requested an EHC plan. Among these, around eight in ten (83%) got their EHC plan following their first request; for one in seven (15%), more than one request was made11. The likelihood of getting an EHC plan following the first request decreased as the age of the child/young person increased.
Parents and young people were asked how easy or difficult they found it to start the process of getting an EHC plan. The start of the process requires an EHC needs assessment for those with or without a SEN statement (the local authority had responsibility for initiating the assessment for the latter). Overall, parents and young people’s ratings of how easy or difficult it was to start the process were moderately positive: 50% rated it as very easy/easy; 23% as very difficult/difficult. Finding the process difficult to start was more common among those without a previous SEN Statement: nearly two-fifths (38%) rated this as very difficult/difficult.
Length of the process
The Children and Families Act 2014 and SEND Regulations 2014 set a statutory timescale for the EHC plan to be issued within 20 weeks of the initial request12. Official
11 There are a number of reasons for a request for an EHC plan being made more than once, for example the child or young person’s needs not being considered severe enough, following an initial EHC needs assessment, to warrant an EHC plan in addition to existing or revised SEN support. A change in circumstance can lead to a request for an EHC plan being granted the second or third time round by the local authority. It is worth noting that those surveyed only include parents and young people with an EHC plan in 2015, so the analysis in this report does not include the experiences of those who may have requested but not received an EHC assessment or plan. A DfE research report on SEND disagreement resolution explores the views of people with this experience. See Cullen, M.A. et al (2017) Review of arrangements for disagreement resolution (SEND), Department for Education.. 12 According to the SEND Code of Practice, the EHC plan must be issued within 20 weeks, from the point of an EHC needs assessment being requested (or a child/young person is brought to the local authority’s

17
statistics based on local authority data returns show the majority (59%) of new plans in 2015 were provided by 20 weeks.
All parents and young people were asked how long they thought the whole EHC process took – from the point at which the EHC plan was requested, up to getting the EHC plan agreed. A considerable proportion (over one in four) of respondents were unable to answer, but among those who could, it was more common for parents and young people to report the 20-week deadline being missed (62%) than being met (38%)13. The difference in figures may reflect parents/young people and local authorities using a different starting point when timing the 20-week period14, imprecisions in respondents’ estimates (since they were asked to think back to between six and 18 months), and plans exempt from the 20-week timeframe being included in the survey data.
Where the 20-week deadline was reported to have been missed, the most common response option chosen was 21-24 weeks / around six months (25% of parents/young people who could give a timescale). Twenty per cent of those who could give a timescale chose the ‘more than 10 months’ response option. Some of the cases taking more than 20 weeks will have been exempt from the target15. Where there was no previous SEN Statement in place, respondents were more likely to think that the process took longer than 20-weeks.
Experiences of being involved in the process
Parents and young people were asked a range of questions to establish whether they had experienced the process as intended (i.e. as set out in the SEND Code of Practice). This covered:
• Perceived ease/difficulty of being involved in the process;
• The extent to which their family’s personal circumstances and needs were taken into account during the process;
attention) to the final EHC plan being issued. The timescale was 26-weeks up until September 2014. There are some exemptions to this requirement, however, in light of exceptional circumstances as per the Special Educational Needs and Disability Regulations 2014. 13 This excludes those who did not know how long the process took, or preferred not to say. Please see relevant chapters/sections in the main report body for the full set of responses given to each of the questions discussed in the Executive Summary. Note that responses to this question reflect parent and young people’s perceptions of the length of the process, from the point at which the EHC plan was requested, up to getting the EHC plan agreed. The findings differ from official local authority statistics on the length of the process (see section 3.2 for more details). 14 For example, parents might have considered the 20-week period to have started when they made a request to a teacher, whereas local authorities may have considered it to have started when the request was brought to their attention (as per the SEND Code of Practice). 15 Among those who said that it took longer than 20 weeks to receive the EHC plan, we do not know the proportion who may have had exceptional circumstances as this question was not asked.

18
• The extent to which the time and effort put into the process was considered reasonable by parents;
• Communication throughout the process;
• Steps taken to involve the child/young person in the process and aid their understanding of what was happening and why;
• Perceived ease/difficulty of agreeing on the content of the EHC plan; and
• Experiences of working with professionals during the process and the extent to which staff were considered to be knowledgeable.
Overall, parents and young people were most positive about it being easy to agree the EHC plan content; about it being easy to be involved in the process overall; about efforts being made to listen to the child/young person and understand their views; and about staff being knowledgeable about the process. They were least positive about the child/young person being given choices of how to take part in the process; and about steps being taken to help the child/young person understand what was happening and why; the proportion of positive responses increased with the age of the individual for whom the plan was for.
We now look at some aspects of involvement in the EHC process in more detail.
Ease of being involved: Parents and young people’s ratings of how easy or difficult it was to be involved in the EHC plan process were relatively positive: 57% rated it as very easy/easy; 18% as very difficult/difficult. It was more common to rate involvement as very easy/easy when a SEN Statement had previously been in place; where it took one request to get an EHC plan; or where the process was completed within 20 weeks. Ratings were also more favourable where the EHC plan was perceived to address a combination of education, health and care needs by the parent/young person (as opposed to addressing education needs only)16.
Process characteristics: Three quarters (75%) of parents and young people reported that the process was family-centred, in that their family’s personal needs and circumstances were taken into account at least some of the time (48% said this
16 The questionnaire asked parents and young people to identify the types of need they perceived to be addressed by the EHC plan – education only, education and care, education and health, health and care, and education, health and care needs. Some children who are eligible for an EHC plan will not have substantive health and/or care needs.

19
happened most or all of the time, 28% some of the time). One in eight (13%) said that it did not happen at all17.
Just under three-quarters (72%) reported that the time and effort involved in getting an EHC plan was reasonable (51% of parents said this was the case most or all of the time, 22% said some of the time). Views were similar on the extent to which communication throughout the process was clear (74% of parents and young people said this was the case: 47% most or all of the time, 27% some of the time). Although still positive overall, parents and young people were slightly less likely to report that steps were taken to help the child/young person understand what took place and why (57% of parents and young people said this was the case: 35% said steps were taken most or all of the time, 23% some of the time); the proportion of positive responses increased with the age of the individual for whom the plan was for.
Inclusion of children and young people in the process: It was relatively common for parents and young people to report that effort had been made to listen to the child/young person and understand their views (58%) and that the child/young person had been included in meetings (51%). It was slightly less common for parents and young people to report the child/young person being asked if they wanted to take part (44%) and much less common for them to be given choices of how to take part (19%). Again, the likelihood of all four of these steps having been taken increased with the age of the child/young person; they were also more prevalent where the child/young person had a SEN Statement in place previously.
Regarding specific steps taken to support the inclusion of the child/young person, two-fifths (41%) had been offered support when needed from an ‘advocate’ (someone to help the child/young person make their views known)18; around a fifth had been offered visual aids (21%) or communication aids (18%). Around one in ten parents and young people said they had needed these forms of support but had not been offered them (12% for an advocate, 10% for visual aids, and 10% for communication aids).
Agreeing on the EHC plan content: Parents and young people’s ratings of how easy or difficult it had been to agree on the needs and support described in the EHC plan were particularly positive, relative to our other findings: 62% rated it as very easy/easy; 17% as very difficult/difficult. It was more common to rate this as very easy/easy where the
17 The remainder said that they did not know, or preferred not to say. Again, please see relevant chapters/sections in the main report body for the full set of responses given to each of the questions discussed in the Executive Summary. 18 The SEND Code of Practice: 0-25 years states that it is the local authority’s responsibility to ensure an offer of such support is made and put into place if the child/young person needs it. ‘Advocates’ can be family members or a professional.

20
process of getting the EHC plan was completed within 20 weeks, or in cases where the EHC plan was provided following the first request. Ratings were also more favourable where the EHC plan was perceived to address a combination of education, health and care needs (as opposed to education needs only) 19.
Experiences of working with professionals: Ratings of the professionals encountered during the process were positive. Four-fifths of parents reported that the staff they were dealing with were knowledgeable about the process to some extent at least (82% said this was the case; 56% most or all of the time; 26% some of the time). Nearly three-quarters of parents and young people reported that different services worked together to make the EHC plan, to some extent at least (74% said this was the case; 48% most or all of the time; 25% some of the time). This was more common where the EHC plan was perceived to cover education, health and care needs, here 84% reported different services working together (61% said this was the case most or all of the time, 23% some of the time). The proportion of positive responses became lower as the age of the child/young person increased. Results concerning knowledgeable professionals and services working together were more positive where the process of getting the EHC plan was completed within 20 weeks.
Awareness of information, advice and support (Chapter 4)
The SEND Code of Practice states that local authorities must ensure that families are made aware of sources of information, advice and support so that families can make use of them if they wish. The survey explored whether or not parents and young people were informed generally about information, advice and support available and whether they used this; it also looked at awareness and use of specific sources: the Local Offer, the Information, Advice and Support Service (IASS), and the local Independent Supporter Service20.
Two-thirds of parents and young people (66%) said they had been informed about the information, advice and support available generally during the EHC plan process. The majority of those informed (81%) had gone on to use this. Awareness – and consequently usage – decreased with the age of the child/young person. Of the specific
19 The questionnaire asked parents and young people to identify the types of need they perceived to be addressed by the EHC plan – education only, education and care, education and health, health and care, and education, health and care needs. Some children who are eligible for an EHC plan will not have substantive health and/or care needs. 20 For full definitions of these, see the Glossary section in Chapter 1.

21
sources of information, advice and support explored, awareness and usage were highest for IASS21 (55% aware; 26% used) and the Local Offer (43% aware; 14% used).
The right to request a Personal Budget will have been available for all respondents22. Fewer than one in five (18%) recalled being offered a Personal Budget; of those saying they were not given the option, over half (55%) felt certain they had not been offered one (with the remainder unsure). Among those offered a Personal Budget, take-up was relatively low (just 28% of those offered one took up the offer).
Just over half (54%) said they had been told how their EHC plan would be reviewed. Awareness of this decreased with age of the child/young person; and was lower among those who had taken more than one attempt to get an EHC plan.
Similarly, just over half (54%) said they had been informed by their local authority about the complaints and appeal procedures they could use if unhappy about the EHC plan process. Again, awareness decreased with age of the child/young person. The proportion of parents and young people who actually used the complaints, mediation, and SEND Tribunal appeal procedures was one in twenty for each (5%).
Perceptions of the quality of the EHC plan (Chapter 5)
The survey also included a number of questions exploring perceptions of the quality of the EHC plan. These focused on the content of the EHC plan such as how easy or difficult it was to understand; the extent to which it included the wishes of the parent, child or young person; and the short and (anticipated) longer-term impacts of the EHC plan, based on the help and support set out in it.
Views were particularly positive about the wishes and opinions of parents being included in the EHC plan, and the EHC plan being easy for parents to understand; but much less positive about the EHC plan being easy for the child/young person to understand, or the child/young person understanding what the EHC plan is for. Views on the impacts of the EHC plan tended to be relatively positive, albeit more so regarding shorter-term impacts experienced already than regarding anticipated future ones.
21 During the cognitive testing phase, some parents mentioned that they had difficulties differentiating between the Information, Advice and Support Service (IASS) and the Independent Supporter Service (ISS). The final questionnaire included a definition of the SEND IASS to help respondents differentiate. 22 The SEND Code of Practice: 0-25 years states that young people and parents of children who have EHC plans have the right to request a Personal Budget, which may contain elements of education, social care and health funding. It is the local authority’s responsibility to provide information about the option of having a Personal Budget – for example via the Local Offer.

22
Views on the content of the EHC plan
The majority of parents (80%) agreed that their own wishes and opinions were included in the EHC plan. It was less common to agree that the wishes and opinions of the child or young person had been included (55% agreed). Approaching one-fifth (17%) felt that neither the parents’ nor the child/young person’s wishes/opinions had been included.
Similarly, the majority of parents (74%) agreed the EHC plan was easy for them to understand. It was much less common to agree that the EHC plan was easy for the child or young person to understand (26% of parents and young people agreed) or to agree that the child or young person understood what the EHC plan was for (36% of parents and young people agreed). As might be expected, levels of agreement with these latter two statements increased with the age of the child/young person.
Agreement that both the parents’ and the child/young person’s wishes and opinions had been included was more prevalent where a SEN Statement had been in place previously. Where the EHC plan was for a young person aged 16-25, it was much more common to agree that their wishes and opinions had been included, that the EHC plan was easy for them to understand, and that they understand what the EHC plan is for.
Meeting specific requirements of the EHC plan
The Children and Families Act 2014 requires that parents and young people be able to request that a particular nursery, school or college be named in their EHC plan. Eight in ten (78%) reported that the nursery, school or college named in their EHC plan was the one they asked for in the drafting process; 4% said the named nursery, school or college was not one they wanted and 2% said it was their second or third choice. The requested nursery, school or college not being named was more prevalent where the child/young person attended a specialist education setting at the time of the survey; where the parent/young person requested an EHC plan more than once; where the process of getting an EHC plan took over 10 months; or where the EHC plan was created in local authority areas identified as having high levels of SEND Tribunal appeals23.
23 Analysis on areas with high/low numbers of SEND Tribunal appeals has been calculated at the local authority level, as the number of registered SEND Tribunal appeals in the 2015/16 academic year, per 10,000 of the population aged 0-18 in 2015. The data used was the most up-to-date available at the time of analysis. The population of young people aged 0-18 has been taken as the best available proxy of the potential total number of appeals per local authority area. The appeals considered are those based on refusal to carry out the EHC needs assessment. While the time periods used do not exactly match up – the 2015/16 academic year and 2015 calendar year – SEND Tribunal data is only available on an academic

23
The EHC plan is also required to be forward-looking, including preparations for transition points in the child or young person’s life. Three-fifths of parents and young people (60%) agreed that their EHC plan included preparations for their next move in life; 17% disagreed. It was more common to agree where the EHC plan was perceived to cover education, health and care needs; or where a SEN Statement had been in place previously. Agreement also increased with the child/young person’s age.
Impact of the EHC plan
Views on the likely impacts of the EHC plan were most positive regarding shorter-term impacts experienced already. Nearly three-quarters (73%) agreed that the EHC plan has resulted in the child/young person getting the help/support they need; two-thirds (67%) agreed it has improved the child/young person’s experience of education; and three-fifths of those whose EHC plan addressed health needs (62%) agreed it has improved the child/young person’s health or wellbeing24. The one shorter-term impact about which findings were less positive was that the EHC plan’s help/support had helped the family to have the life they want to lead (46% agreed; 21% disagreed).
It was more common for parents and young people who reported that the EHC plan had been put in place 12 or more months before the survey, to agree with all four statements on the short-term impacts of the EHC plan, compared with those who said the EHC plan had been put in place less than 6 months before. Views were also more favourable on all four of these shorter-term impacts where the EHC plan was perceived to cover education, health and care needs; where the EHC plan was for an older child/young person (aged 11+); where there was no SEN Statement previously in place; or where the 20-week EHC plan process deadline was met.
Views were moderately positive where respondents were asked to anticipate future impacts. Respondents were more likely to answer that they did not know about the future compared to questions on shorter-term impacts. Over half of parents and young people agreed that the EHC plan will improve the child/young person’s chances of fully participating in the wider community (57% agreed); of independent living in adult life (55% agreed); and identifying their aspirations for the future (53% agreed). Nearly half (47%) also agreed that it would improve their chances of getting paid or unpaid work. Agreement regarding these future impacts was higher where there was a SEN Statement
year basis, and given the potential lag between going through the EHC needs assessment and planning process it was felt that using this data was a sufficiently accurate proxy for the time period for the survey.
24 The remainder said that they disagreed, did not know, preferred not to say or that the question was not applicable. Similar proportions disagreed as said they did not know/preferred not to say for a number of these impact questions. Please see relevant chapters/sections in the main report body for the full set of responses given to each of the questions discussed in the Executive Summary.

24
previously in place; or where the 20-week EHC plan process deadline was met; but lower where the EHC plan was for a 16-25 year-old.
Overall, three-fifths of parents and young people (62%) agreed the help and support set out in the EHC plan will achieve the outcomes agreed; and half (51%) agreed it will help the child/young person achieve what they want to in life. Agreement with both statements was higher where the 20-week EHC plan process deadline was met. Agreement that the help and support set out in the EHC plan will achieve the outcomes was also higher where the plan was for a child aged under five; or where there had been a previous SEN Statement. Agreement that the EHC plan will help the child/young person achieve what they want to in life was higher where the EHC plan addressed education, health and care needs, but views on this were polarised where the EHC plan was for a 16-25 year-old.
Overall variation in experiences by groups with different characteristics
There were a number of characteristics associated with more positive, or more negative experiences of the EHC needs assessment and planning process and the resultant EHC plan. Some of the most notable, in that they recur throughout the survey findings, were as follows.
Whether the child/young person has been transferred from a SEN Statement to an EHC plan: transfers were more likely to rate involvement in the process as very easy/easy (this might be expected given those with statements did not have to secure an assessment and were automatically transitioned to an EHC plan). They were also more likely to report various steps being taken to include the child/young person in the process, to say that the EHC plan included preparations for the child/young person’s next move in life, and they tended to be more positive concerning future outcomes being achieved. By comparison, those with no SEN Statement previously in place were more likely to feel that starting the process had been very difficult/difficult; and to report the 20-week deadline being missed. However, these individuals tended to be more positive about the outcomes already achieved by the EHC plan.
Where the 20-week EHC plan process deadline was met, it was more common to rate involvement in the process as very easy/easy; and views on specific aspects of the process (e.g. communication during the process, the amount of time and work involved) were more favourable. This group of parents and young people were more likely to report that staff involved had been knowledgeable about the process; that different services had worked together to make the EHC plan; and that it had been very easy/easy to agree on the EHC plan content. Within this group there also tended to be more positive perceptions of both the outcomes already achieved; and the likelihood of future outcomes being achieved.

25
Those who had received any form of information, advice and support during the process were more likely to rate involvement in the process as very easy/easy; were more likely to report the process being family-centred, the amount of time / work involved being reasonable, and steps being taken to help the child/young person understand what took place and why. They were also more likely to say it had been very easy/easy to agree on the EHC plan content.
Among young people aged 11 to 25, although it was more common to report steps being taken to include them in the process and their wishes/opinions being included in the EHC plan, views on the impacts of the EHC plan were much more mixed. Among those aged 16-25, while there were more positive perceptions of short-term impacts, there tended to be more negative perceptions of the likelihood of future outcomes being achieved. There was also lower awareness of processes for reviewing the EHC plan content, and complaints and appeal procedures. Where the EHC plan was for a child aged under 5, it was more common for the parent to report that: it had been easy to start the process of getting an EHC plan; their family’s needs and circumstances were taken into account; different services were working together to create the EHC plan; and it was more common for them to be told about (and use) information, advice and support.
Where the EHC plan was perceived to address education, health and care needs25, it was more common for the parent/young person to rate involvement in the process as very easy/easy; and again, views on a number of specifics – such as communication during the process and the amount of time and work involved – were also more favourable. These parents and young people were more likely to report that different services had worked together to make the EHC plan; that it had been very easy/easy to agree on the EHC plan content; and that the EHC plan included preparations for the child/young person’s next move in life. There also tended to be more positive perceptions of the outcomes already achieved by the EHC plan.
Where the child/young person with an EHC plan had particular types of need – for example it was the case that EHC plans for children or young people with profound and multiple learning difficulties were more likely to be obtained after the first request; were more likely to have found it easy/very easy to start the process; to report that the family’s needs and circumstances were taken into account most or all of the time; and to have been offered or used a Personal Budget. Those with a physical disability or severe learning difficulty were also more likely to report that the family’s needs and circumstances were taken into account most or all of the time; while those with severe
25 The questionnaire asked parents and young people to identify the types of need they perceived to be addressed by the EHC plan – education only, education and care, education and health, health and care, and education, health and care needs. Some children who are eligible for an EHC plan may not have substantive health and/or care needs.

26
learning difficulties were also more likely to have been offered or used a Personal Budget.

27
1. Introduction This chapter sets out the background to the survey, first exploring key developments and reforms in SEND policymaking. It then goes on to present the methodological approach to the survey, including who was interviewed, how the survey was carried out and the number of responses received, breaking these down by key characteristics. It also notes some key limitations to the approach used. Lastly, this chapter sets out reporting conventions used throughout.
1.1. The policy context to Education, Health and Care plans
1.1.1. Introduction
The Children and Families Act 2014 initiated significant systemic reforms to policy for Special Educational Needs and disabilities (SEND). It sought to enable a more joined-up, personalised, co-productive approach that placed children, young people and their families at the heart of system. The Act’s implementation was designed to deliver positive outcomes for children and young people in the areas of education, health, employment and independent living through building on personal aspirations and providing contingent support. Arguably, the development of Education, Health and Care plans (EHC plans)26 to replace the statementing process was one of the most significant practical vehicles for delivering these principles to service users (children, young people and their families).
For this reason, the Department for Education (DfE) commissioned IFF Research and the University of Derby to design, pilot and roll out a national survey tool that would explore the experiences of service users and their views on the impact of EHC plans.
This is a timely and important project. As discussed below, the recent history of SEND reform in England illustrates that the experience of service users is not always consistent with the policy intentions. The intention of reform and legislation has certainly been clear over a sustained period.
The 1970 Education (Handicapped Children) Act secured the right of all children to schooling through eradicating the concept of ‘uneducability’ from the system and replacing ‘rehabilitation’ with a ‘right to education’.
The Warnock Report (DES, 1978) sought to replace more limited ‘medical’ labelling with a broader and more flexible concept of Special Educational Needs (SEN) so as to make
26 An Education, Health and Care plan replaces a statement of SEN. It is a legally binding summary of the provision that is to be made for an individual in response to their needs and aspirations. It focusses on positive outcomes in the areas of health, education, employment and independent living and how those will be supported. Throughout this report we use the term ‘EHC plan’.

28
educational concerns central to decisions about provision and placement. The intention was to secure a more holistic and multi-professional approach to needs assessment where provision for an individual would be designed in relation to ‘his abilities as well as his disabilities’ (DES, 1978, p37) through a SEN Statement which has a legal status. This SEN Statement sets out the needs of the child and the special educational provision required to meet them.
The 1981 Education Act further developed recommendations about the needs assessment process. It provided a definition for SEN and outlined the service standards required of local education authorities (LEAs), including keeping parents informed. Parental rights to appeal LEA decisions were provided. Two further requirements were included, that of assessments being completed within six months of a request and the requirement for yearly reviews. Importantly, the right of children with SEN to mainstream provision was strengthened.
The SEN Code of Practice (DfE 2001) outlined in clearer and more illustrative terms the requirements for LEAs. These emphasised the importance of a clear strategy to identify, assess and support children with SEN in ways that engaged parents and children and drew upon rigorous self-evaluation.
This progression in SEN policy and legislation, alongside wider policy and legislation to eliminate discrimination against disabled people – such as the Disability Discrimination Act, 1995; the Special Educational Needs and Disability Act, 2001; the Equality Act, 2010; Removing Barriers to Achievement, DfES, 2004 – have signalled a move toward a system of assessment and provision that reflects a social model of disability27.
However, there have been concerns about the extent to which positive outcomes resulting from these reforms were being experienced by service users. The Lamb Inquiry (2009) produced troubling accounts of the real experiences of children, young people and their families and revealed inconsistencies in the quality and scope of provision across various local authorities. In the field of education specifically, other evidence suggested that the system was leading to low aspirations for learners with SEND (Ofsted, 2010). Concerns were also voiced about the overly complex and fractured context for assessment and provision (Macbeath et al., 2004) and difficulties created by ambiguous and variable local policies; parents/caregivers were tasked with navigating disparate services in ways that were stressful and time-consuming (Gough et al., 2014).
Lamb (2009) and Ofsted (2010) argued that where the system had failed, this was a consequence of a lack of attention to outcomes and impact. Other commentators
27 In broad terms, a ‘social’ model of disability recognises that discrimination against those with disabilities is a product of society, and caused by the way society is organised and operates. This compares to the traditional ‘medical’ model of disability which identifies individuals’ disabilities and needs, i.e. the impairment or health condition, as the cause of any ‘problems’.

29
identified problems in the de-prioritisation of SEND reform in favour of a standards agenda (Runswick-Cole, 2011) and a failure to pursue a long-term vision for SEND that interconnected with wider educational reform (Norwich and Eaton, 2015). The Lamb Inquiry led to 51 recommendations for action underpinned by:
the clear message [that] parents need to be listened to more and the system needs to be more ambitious for their children…We need a radical overhaul of the system. Lamb, 2009, p.1
Its recommendations are summarised below:
The Lamb Inquiry. An analysis of Themes emerging from the 51 recommendations
Theme Recommendation
Substantial enhancement of partnership with parents in the construction of provision
4, 13, 26, 27
Substantial enhancement of the rights of parents to appeal and to have their views heard
15, 29, 41, 47, 48,
Substantial improvements to information for parents about the services available to them and support in accessing them (e.g. re-establishment of parent partnership services) so as to support choice and participation
3, 17, 18, 20, 46
Extension of accountability and monitoring process to ensure consistency and comprehensiveness of quality provision
19, 24, 25, 37,38, 39, 49
Extension of scope (e.g. Pupil Referral Units required to produce an SEN policy)
16, 51
Extension of accountability and monitoring processes to capture information on vulnerable groups (such as excluded pupils, progress of SEND pupils in relation to peers)
12, 14, 36, 43
Substantial enhancement of high aspirations in relation to attendance, social outcomes, participation and attainment in education.
2, 11, 31
Strengthening children and young peoples’ right to voice their opinion and to appeal through the SEND Tribunal process
30,
Substantial developments to the prevention of bullying and discrimination.
9, 10
Improvements to the commissioning process. 22, 23

30
Having examined the recommendations resulting from the Lamb Inquiry, the next sections look at other policy reforms and recent developments.
1.1.2. The Children and Families Act, 2014
These recommendations made by Lamb (2009) have had a substantial impact on the significant reforms central to Part 3 of the Children and Families Act 2014. The Act outlines the service standards for schools, local authorities, clinical commissioning groups, health and care providers and other stakeholders. Key concerns of the Lamb Inquiry are central to the Act, in that it:
• Seeks to give children, young people and their families, more presence and power; and
• Emphasises the importance of aspiration and high expectations for children and young people with SEN so that they might have the fullest, most participative and independent life possible.
The replacement of the SEN statutory assessment and statementing process with EHC plans marks one of the most significant practical reforms within the Act. Local authorities are required to develop, maintain or transition EHC plans in ways that are collaborative and should position services users as co-constructors and equal partners. The option of of a Personal Budget (which families are expected to have power in managing) enhances the empowering qualities of EHC plans.
Although the Children and Families Act seeks to drive provision towards a person-centred, inter-agency, user-led model, some argue that it represents, not radical reform, but a tightening up of existing policy and practice (Norwich and Eaton, 2015). In addition, considerable challenges remain in translating the intention of the Act into practice. For instance, Corrigan (2014) notes the difference between espousing a person-centred assessment approach and in fact achieving it.
Evidence suggests that a more significant change may be needed to existing structures for the move toward a person-centred process to be achieved in actuality. For example, Bajwa-Patel and Devecchi’s (2014) survey of parents’ choice of school found that there is a difference between a genuine choice and stating a preference: parents reported that in reality, despite stating a preference, they had little genuine choice as to which school their child attended. This finding may reflect the dilemmas that local authorities face in mediating parental choice with structural and resource limitations in the system (Clark, 2010).

31
1.1.3. Service standards associated with Education, Health and Care plans
The 2014 Children and Families Act (Part 3, Section 19) requires local authorities to:
• Enable the full participation of children, young people and their families in the construction of EHC plans: placing their views, wishes and feelings at the centre of the process;
• Provide the information and support that children, young people and their families may need in order to participate in such processes. (for example, by publishing the Local Offer, which itself should be reviewed and redeveloped in the light of parental feedback);
• Work with families to secure the best possible outcomes in health, education, wellbeing, employment and independent living with a clear focus on outcomes that are appropriate and measurable;
• Design systems and strategies that enable communication and collaboration with the broadest possible range of stakeholders so that cohesive, effective and personalised provision can be designed and implemented.
At every point during the EHC plan process there must be communication between parents, children and young people, schools and other relevant bodies. A key principle (but not a stipulation) is that there should be one point of contact: service users should not have to repeat information to multiple providers and hence information sharing is essential. Families, children and young people should experience the process as timely, participative, streamlined and positive in terms of the focus on future aspirational goals.
In addition, the SEND Code of Practice (DfE and DoH, 2015, paras 9.44, 9.61 and 9.69) provides:
• A recommended timeline within an overall statutory timescale for completion of an EHC plan, stipulating that the process must be achieved within 20 weeks (from the EHC plan being requested to its final version), unless there are exceptional circumstances;
• Detailed guidance to local authorities concerning the principles involved in writing an EHC plan and the sections required, which must give attention to the construction of:
• Clear articulation of outcomes (that are specific, relevant and measurable)
• A similarly clear articulation of how provision from education, health and care will come together to secure those outcomes
• Clear focus on the child/young person’s capabilities

32
• Clear focus on planning for the future (e.g. in thinking earlier about transition points), accessibility and a clear review date.
• Ensuring that the EHC needs assessment and planning process is designed to evidence and enable the core principles of the Code of Practice and the Act.
The SEND accountability framework established in 201528 sets out an approach for assessing SEND provision. The framework provides structure for improving outcomes and experiences for children, young people and their families and when applied seeks to show how the system is performing, hold partners to account and support self-improvement. The framework applies at the local and national levels and to independent assessments of the EHC plan process – such as those carried out by Ofsted. The approach set out in the framework, along with the Children and Families Act 2014 and SEND Code of Practice, informed and underpinned the development of this survey and its focus on understanding parents’ and their children, and young people’s experiences of the EHC needs assessment and planning process.
1.1.4. What is already known about the efficacy of the EHC plan process?
The previous sections of this chapter have looked at the reforms and context which led to to the implementation of the EHC assessment and planning processes. In the remainder of this chapter we look at the existing data available on the implementation of these, as the context in which the survey was commissioned.
The Pathfinder projects enabled trials of particular aspects of proposed reform.29 Twenty Pathfinder sites were established across 31 local authorities to trial EHC plans, Personal Budgets and services for children and young people from birth to age twenty-five. Though the intention was to build the legislative framework around Pathfinder findings, this did not happen in practice given that the projects were incomplete at the time that legislation went to Parliament. However, Spivack et al. (2014) usefully reported on the work of five Pathfinder areas in their development of the EHC plan process. There were key positive findings, in that:
• Professionals reported that the EHC plan process placed more emphasis on gathering together existing reports from across education, health and care; was a more family-centred and integrated process (involving face to face structured discussions or a ‘team around the child’ (TAC) approach) and involved more co-production with a focus on outcomes; and
28 The ‘SEND: supporting local and national accountability’ framework 29 Detailed in the coalition’s Green Paper (DfE, 2011).

33
• Local authority professionals also reported a range of benefits including reduced duplication for families, reduced bureaucracy, a more holistic approach and increased multi-agency working.
However, there were challenges identified, including:
• The time required to enact the process being significantly greater in the case of families new to the system where past relationships or established assessments could not be drawn on;
• A tension between managing sufficient and consistent multi-agency working whilst meeting time limits;
• Difficulties created by inadequate information sharing; and
• The additional time taken to plan resources for the EHC plan, including allocation of the Personal Budget.
Aside from the limitations inherent in reporting on only five of the twenty pathfinder sites, other criticisms have been levelled at attempts to trial and evaluate EHC plans thus far, for example, Black and Norwich (2013) report that the EHC plan process has not been fully trialled for children in Early Years settings, for young people in further education and for service users new to the system. Galton and Macbeath (2015) are critical of the evaluations carried out by Spivack at al. (2014; 2013) in terms of their not having captured accounts of the experiences of service users.
Skipp and Hopwood (2016) were commissioned by the DfE to carry out a small-scale qualitative study of user experiences of the EHC plan process. Seventy seven parents and fifteen young people (in four local authorities) were interviewed to identify their personal satisfaction with the EHC plan process and explore what factors seemed to be implicated in satisfaction and dissatisfaction. The overall findings suggested that parents and young people were reasonably satisfied with the EHC plan process. Respondents found the process to be a welcome shift to a more joined-up approach and participatory process. Generally, the EHC plan process was seen as being more positive than the statementing process which it had replaced.
Skipp and Hopwood (2016) also identified several ways in which the EHC plan process needed to be improved. Most notably, some providers were struggling to set out a clear locally agreed multi-agency process and implement a more outcomes-focused approach. Parents needed more help and support with understanding the EHC plan process as well as the wider SEND system. However,Skipp and Hopwood also emphasised the limitations of the study in terms of its small sample size and the omission of post-16 provision from the sample, as well as issues with quantifying and comparing ‘satisfaction’ scores provided by parents and children.
Within this context, the need for a large national survey of children and young people and families that captures a comprehensively varied sample – in terms of age, gender,

34
ethnicity, location, type of need, time in the system and placement context – is clearly signalled as a way of better understanding the impact of reforms on diverse service users’ experiences.
1.2. Aims of the survey The remainder of this chapter describes the approach to the survey and profiles the sample of parents and young people who participated.
The aim of the survey was to build a representative national and (where the data allowed) local picture of parents’ and young people’s experiences of the EHC needs assessment and planning process and their views of the resultant EHC plans. This evidence was needed to help to determine whether the delivery of EHC plans properly reflected the intentions set out in the Children and Families Act 2014 and the accompanying SEND Code of Practice, and therefore to support the SEND accountability framework.
To achieve this purpose, the survey aimed to answer three overaching research questions:
• To what extent do children, young people and families experience the EHC needs assessment and planning process as they are intended to be experienced;
• How satisfied are children, young people and families with the EHC needs assessment and planning process and the resultant EHC plan; and
• To what extent does this vary by local authority and by groups with different characteristics?

35
1.3. Survey methodology The survey fieldwork was carried out from 25th July to 28th November 2016. A total of 13,643 parents and young people took part.
1.3.1. Who was invited to take part in the survey
The survey focused on children and young people with an EHC plan that was created in the calendar year 201530 (when the survey took place, this was the most recent full calendar year). Using this data meant that parents and young people had their EHC plan in place for long enough to be able to give their views on what effects it had had so far, while at the same time, the EHC needs assessment process was recent enough for parents and young people to remember it. The survey only collected data from families who had an EHC plan in place in 2015 – it did not include those who had requested an EHC plan but been unsuccessful in obtaining one.
1.3.2. How potential survey participants were identified
The sample was drawn from two official databases: the National Pupil Database (NPD), a dataset which contains detailed information about pupils in schools and colleges in England; and the Individualised Learner Record (ILR) which records information on learners in publically-funded further education. These databases identified 65,172 children and young people who had an EHC plan put in place in 201531 and these cases formed the starting sample for the survey.
1.3.3. How parents and young people took part
To maximise the accessibility of the survey, families of children and young people identified as having an EHC plan put in place in 2015 were offered the opportunity to complete the survey online, via a paper questionnaire and by telephone (more detail is available in the Technical Report). An EasyRead format was also made available as were face-to-face interviews and interviews in another language. All communications
30 The EHC plan policy was introduced in 2014. The time period for this study is therefore fairly early on in the policy implementation process. Also due to the time period, those eligible to participate in the study included a proportion of parents and young people who had gone through the process of transferring from a SEN Statement to an EHC plan. 31 This figure is known not to be entirely accurate because of a degree of ‘block reclassification’ where education providers have mistakenly re-categorised all their SEND pupils as having an EHC plan. Estimates produced from the survey (based on the proportion of parents and young people stating that they did not have an EHC plan) suggests that this figure is closer to 53,000.

36
were designed to be accessible and considerate of the potentially sensitive nature of the questionnaire content.
Letters were sent to the families of the 65,172 children and young people identified as having an EHC plan in 201532. Letters were only sent to those in the NPD and ILR samples that met the following conditions: they had been identified as having an EHC plan in place in 2015 via an ‘EHC plan marker’ on the sample; they had consented to being contacted for research purposes; and both telephone and address information was available, to ensure they could be contacted.
These letters explained the purpose of the survey and how the survey data would be used, and invited the recipient to take part initially by accessing an online survey. It also offered individuals the chance to contact IFF Research or DfE if they sought further information or clarification on the study, and/or wished to ‘opt out’ of the study (which would mean they received no further contact about it).
In the majority of cases the child/young person with the EHC plan was under the age of 16, and hence the invitation letters and telephone calls were in the first instance addressed to their parent or carer. However, in the remainder of cases the EHC plan was for a young person aged 16 or over. In these instances, the young person themselves was invited to take part33.
Where the survey invitation was sent to the parent or carer, they were invited to consult the child or young person with the EHC plan about their responses to the survey, if they felt this was appropriate. There was also one section of the questionnaire sent to parents/carers that focused on the experiences of the child or young person from the child/young person’s perspective. Within this section, parents/carers were encouraged to answer the questions with the child/young person’s input, or to answer the questions from the perspective of the child/young person.
Where the survey invitation was sent to the young person, they were invited to complete the questionnaire either themselves, or – if they preferred – with the participation of their parent/carer, or with their parent/carer answering on their behalf34.
32 This is slightly lower than 70,005 EHC plans recorded in the DfE’s SEN2 data. This is likely to be due to individuals who are missing from the NPD because they have not yet started school, are not in school or are in some independent schools not covered by the NPD, and/or are not recorded on the ILR. For further discussion of this see the separate Technical Report. 33 This approach was taken in accordance with the SEND Code of Practice: 0-25 years which states that young people over the compulsory school age (16 or over) are to be given responsibilities over the EHC needs assessment and planning process, with support from parents and other bodies as needed. 34 The questionnaire included a question to establish who had completed both this section, and the questionnaire overall.

37
Four weeks after the initial invitation letter was sent, those who had not responded were sent a reminder letter. This letter contained details for accessing the online survey, but also included a paper questionnaire booklet and a reply-paid envelope, providing individuals with the option of taking part in this way.
After a further two weeks, IFF Research attempted to contact by telephone all non-responders for whom a telephone number was held (in some instances, we had a postal address for the child/young person, but it was not possible to establish their telephone number).
The overall response rate to the survey was 21% of the starting sample (13,643 responses from a starting sample of 65,172). The adjusted response rate (taking account of the proportion of records in the starting sample that were incorrectly flagged as having an EHC plan35) was 24%.
A key point to note about responses to the young person survey is that the majority of responses come from a parent or carer on behalf of the young person. This does not undermine the validity of these results and may reflect factors such as the nature of the needs the young person had or the extent of their involvement in the EHC plan process (and therefore their ability to answer the questions). Overall, of the 13,643 responses received:
• 10,675 were from parents/carers answering principally about their own experiences of the EHC plan process (on behalf of a child/young person aged under 16)
• 2,246 were from parents/carers answering on behalf of a young person aged 16+; and;
• 722 were from young people aged 16+ answering about their own experiences.
1.3.4. How the questionnaire was designed
The questionnaire was designed by IFF Research and Derby University. It asked parents and young people about their experiences of the EHC needs assessment and planning process and the resultant EHC plans, with a particular focus on aspects where the SEND Code of Practice sets out what the process should be like.36 There were two slightly
35 See the Technical Report for further details. 36 This focus on whether parents and young people had experienced specific elements set out in the SEND Code of Practice: 0-25 years was in part informed by the findings of Skipp & Hopwood (2016) Mapping user experience of the Education, Health and Care plan process: a qualitative study. Their qualitative study established that parents tended to score individual components of the process (referral, assessment etc.)

38
different versions of the questionnaire – one for young people aged 16+, and one for parents/carers. The survey questions explored both positive and negative aspects of parents’ and young people’s experiences37.
The questionnaire was reviewed by a panel of experts38. It was also tested in detail with 36 young people and their parents, to check whether the question wordings were understood properly, and whether the questions were relevant to parents’ and young people’s experiences . The testing exercise also made it possible to:
• Explore the parent or young person’s experience of the whole questionnaire (especially their thoughts on whether they thought the questionnaire allowed them to accurately and fairly present their feelings about the process of getting an EHC plan);
• Check whether the questionnaire worked in online, paper and telephone formats;
• Obtain feedback from parents and young people on the letters that would be sent to parents and young people to introduce the survey.
The questionnaire and letters were revised on the basis of the feedback. All of the survey materials were tested again in a large-scale pilot, in which 317 parents and young people were interviewed39. This exercise also explored which combinations and sequences of survey methodologies obtained the best response rate. Final changes were then made before the main stage of the survey. This report describes the results of the main stage of the survey.
The questionnaires and letters used in the survey are included in the Appendices to this report. Further details of how the survey was carried out are given in a separate Technical Report.
differently to how they scored their satisfaction with the process overall. It also found that parents’ overall satisfaction varied according to their degree of understanding of what the process should be like – meaning that parents could express high levels of satisfaction with an experience of the process that did not appear to be in line with the Code. 37 Versions of the parent/carer and young person questionnaires are presented in the Appendices to this report. 38 From Derby University, the DfE project team and its Advisory Group. 39 For this pilot, we interviewed parents and young people where there was an EHC plan put in place in 2014. This was to save for the main stage of fieldwork, all of the sample of parents and young people where there was an EHC plan put in place in 2015.

39
1.4. Profile of parents and young people who responded Having set out our approach, we now turn to the profile of those who responded to the survey. Table 1.1 below describes the profile of parents and young people who took part.
Table 1.1: Profile of parents and young people who responded to the survey
Profile
Number of respondents
As a percentage of parents and young people who took part in the survey
Who answered the questionnaire
Parent/carer of a child aged 0-15 10,675 78%
Young person aged 16+ 722 5%
Parent/carer answering on behalf of a young person aged 16+
2,246 16%
Gender of child/ young person
Male 9,704 71%
Female 3,756 28%
Age of child/ young person
Under 5 years 1,087 8%
5 – 10 years 4,931 36%
11 – 15 years 4,690 34%
16 – 25 years 2,935 22%
Ethnicity of child/young person
White 10,845 79%
Black and Minority Ethnic 2,281 17%
Prefer not to say 517 4%
Education setting (attended at time of survey / after EHC plan provided)
Specialist 4,999 37%
Mixed 2,247 16%
Mainstream 5,428 40%
Not in education* 259 2%
Educated at home 90 1%
Don’t know / Prefer not to say 620 5%
Whether had SEN Statement previously
Transferred from SEN Statement 8,513 62%
No SEN Statement previously 4,412 32%

40
Profile
Number of respondents
As a percentage of parents and young
people who took part in the survey
Perception of types of need covered by the EHC plan**
Education 12,682 93%***
Health 6,377 47%
Social care 6,483 48%
Primary SEND type
Autistic Spectrum Disorder 3,389 24%
Speech, Language and Communication Needs 1,706 13%
Social, emotional & mental health 1,592 12%
Moderate Learning Difficulty 1,529 11%
Severe Learning Difficulty 1,288 9%
Physical Disability 763 6%
Specific Learning Difficulty 634 5%
Other Difficulty/Disability 522 4%
Profound & Multiple Learning Difficulty 426 3%
Hearing Impairment 289 2%
Visual Impairment 194 1%
Multi-Sensory Impairment 48 *%
SEN support but no specialist assessment of type of need 25 *%
Not given (data missing on sample) 1,238 9%

41
Profile
Number of respondents
As a percentage of parents and young
people who took part in the survey
Region
East Midlands 1,221 9%
East of England 1,415 10%
London 1,894 14%
North East 845 6%
North West 1,908 14%
South East 2,551 19%
South West 1,342 10%
West Midlands 1,211 9%
Yorkshire and The Humber 1,256 9% NB – not all figures add up to 100% as the data has been taken from survey responses – for example excludes ‘don’t know’ responses.
* EHC plans are required to cover the child/young person’s education needs. The proportion of children/young people not in education is based on self-reported respondent data. The majority of these responses (69%) are from those aged 16-25, so it is feasible that they might have left formal education at the time of the survey, or for younger children, in cases where they waiting for education provision to start. ** This is based on parent and young people’s perceptions of the needs covered in the EHC plan. It was a multiple-answer question and therefore percentages do not sum to 100%.
*** As above, EHC plans are required to cover the child/young person’s education needs. This figure is based on parent and young people’s perceptions of the needs covered in the EHC plan and subsequently does not total 100%. It may also reflect cases where a child under 5 is waiting for education provision to start or the young person has left formal education.
The survey dataset was weighted so that the profile of achieved interviews is similar to that of the starting sample. This process is discussed in more detail in the Technical Report.
1.5. Analysis approach Once the survey data had been collected, it was reviewed to ensure no mistakes had been made during the data entering process e.g. logic checks of questionnaire routing and response options. Any open-ended responses to questions were also reviewed and ‘coded’ into themes (where possible an existing code was used – known as ‘back-coding’).

42
A set of data tables were then produced to a specification agreed in advance with the DfE. This formed the cornerstone of the analysis process. As part of this, cross-tabulations were undertaken to enable bivariate analysis by key subgroups, and allow any variation in experience to be identified. Using this process, the data was analysed by the following subgroups:
• Age of child / young person;
• How long the EHC assessment process took, from the point at which the EHC plan was requested, up to getting the EHC plan agreed (as perceived by the parent/young person);
• Whether or not the child / young person had a SEN Statement in place previously;
• Whether or not the EHC plan was received after the first request;
• Types of need the parent/young person perceived to be covered by the EHC plan, particularly comparing EHC plans which are perceived to cover education, health and social care with EHC plans covering education only;
• Primary SEND type (taken from the sample source, i.e. the NPD/ILR);
• Length of time that the plan has been in place for at the time of interview;
• Region;
• Ethnicity of the child / young person;
• Number of EHC plans issued by the local authority in 2015, taken from SEN2 data;
• Number of appeals to a SEND Tribunal per 10,000 of 0-18 population in a local authority40; and
• Level of deprivation per local authority, calculated using the 2015 English Indices of Deprivation data41, particularly comparing the top and bottom quintiles.
40 Analysis on areas with high/low numbers of SEND Tribunal appeals has been calculated at the local authority level, as the number of registered SEND Tribunal appeals in the 2015/16 academic year, per 10,000 of the population aged 0-18 in 2015. The data used is the most current available at the time of analysis. The population group has been taken as the best feasible proxy of the population of the potential total number of appeals per local authority area i.e. all those aged 0-18 who may be eligible for an EHC plan, and considers appeals as a result of refusal to carry out the EHC needs assessment. While the time periods used do not exactly match up – the 2015/16 academic year and 2015 calendar year – SEND Tribunal data is only available on an academic year basis, and given the potential lag between going through the EHC needs assessment and planning process it was felt that using this data was a sufficiently accurate proxy for the time period for the survey. 41 English Indices of Deprivation (2015).

43
The data tables were analysed with consideration given to the original research objectives and the questions that the research set out to answer.
Comparisons between these subgroups are only reported on in the text if they are statistically significant. Significance is measured at the 95 per cent confidence level42. A statistically significant difference suggests genuine variation in the experiences of individuals with certain characteristics. However from this analysis it is not possible to identify whether or not the characteristic is the cause of the difference in experience, merely that there is a relationship/correlation in the data.
Multivariate analysis to explain the extent of variation in experiences accounted for by different characteristics once others are controlled for is covered in a separate report.
For reasons of conciseness, not all significant relationships are highlighted in the report and are generally outlined where they relate to relevant themes and contribute to key findings.
Further detail on the analysis approach is set out in the Technical Report.
1.6. Limitations of the survey The survey covers the views and opinions of parents and young people about how the EHC plan worked for them. The survey took place some months43 after respondents were issued with their EHC plan and, while this enabled them to answer questions about the impact of the plan, their recall of some events or details during the EHC process may have been affected. The data collected therefore reflects perceptions of what took place rather than concrete facts, and may vary from the opinions of professionals and/or official statistics.
It is also worth noting that, although this report contains some analysis at the local authority level, in some cases the numbers of interviews achieved per authority were quite small meaning that figures need to be interpreted with some caution. As a general rule we have not reported on findings at a local authority level where the number of survey completions was less than 50, and caution is needed where the number of responses is between 50 and 100 in a local authority (see Appendix E for a breakdown of
42 Bivariate analysis has been carried out to identify statistically significant differences in responses to questions by subgroups compared with all parents and young people surveyed, and/or between subgroups. 43 The survey was completed around 6 months after for those who received their EHC plan at the end of 2015 and up to around 18 months for those who received their EHC plan at the start of 2015.

44
the range of survey responses received per local authority and the Technical Report for a detailed analysis on response rates by local authority).
Finally, this report only reflects the experiences of those who had an EHC plan put in place in 2015. It does not include the views of those who had requested an EHC needs assessment or plan but had been refused at the time of the survey. A DfE study on SEND disagreement resolution arrangements has explored such experiences and is available separately44.
1.7. About this report This report is organised into 4 chapters of findings;
• Chapter 2 looks at measures relating to the overall experience of the EHC plan process;
• Chapter 3 looks at aspects of the process of getting an EHC plan in more detail;
• Chapter 4 looks at use of support and appeal processes; and
• Chapter 5 looks at perceptions of the quality of the EHC plan produced.
Figures in charts may not sum to 100% due to rounding, or because survey participants were able to select more than one answer in response to a question (i.e. in these cases responses may sum to more than 100%).
1.8. Acknowledgements We would like to thank all the parents, children and young people who took part in the survey for their time and for sharing their views and experiences. The survey would not have been possible without their willingness to talk about their experiences of the EHC needs assessment and planning process, often sharing sensitive information.
We are also grateful to Michael Dale, Rosalyn Harper, Max Stanford, Andre Imich and the SEND Unit at the Department for Education (DfE), and the DfE’s expert Advisory Group for their support throughout the survey, and their feedback on the report.
44 See Cullen, M.A. et al (2017) Review of arrangements for disagreement resolution (SEND), Department for Education.

45
2. Overall experience of the process
2.1. Introduction This chapter looks at overall measures of satisfaction with the process of getting an Education, Health and Care Plan (EHC plan). It focuses on responses to three key questions:
• Overall how satisfied or dissatisfied parents and young people said they were with the whole experience of getting their EHC plan;
• The extent to which parents and young people agreed that taking part in the process of getting their EHC plan was a positive experience for the child/young person; and
• The extent to which parents and young people agreed that the help/support described in the EHC plan will achieve the agreed outcomes.
The chapter looks at variation in responses to these three questions by characteristics of the family and the young person.
It also explores the degree of variation in the proportion of parents and young people with positive experiences by local authority. While the SEND Code of Practice lays out a number of guiding principles, local authorities have some discretion in how they deliver EHC plans locally. It is therefore interesting to look at survey responses by local authority to identify any variation by geography.
Later chapters look at individual aspects of the process and of the quality of EHC plans in more detail.

46
2.2. Overall satisfaction with the experience of the process This chapter starts by looking at survey respondents’ overall satisfaction with the experience of the process. Two thirds of parents and young people (66%) stated that they were satisfied with the overall experience of getting an EHC plan. Of all parents and young people, a quarter (24%) stated that they were very satisfied (Figure 2.1). However, while the majority were satisfied, a minority (15%) were dissatisfied with the process.
Figure 2.1: Overall satisfaction with process of getting an EHC plan
Overall satisfaction with getting an EHC plan was lower for cases involving older children than younger ones. Satisfaction levels were highest in cases where the EHC plan was for a child aged under 5 (74% compared with 53% of cases where the young person was aged 16-25).
The proportion of parents and young people reporting that they were satisfied with the process was similar for both cases where a SEN statement was in place and where it was not. However, in cases where no SEN Statement was previously in place, parents and young people were significantly more likely to report being dissatisfied with the whole experience (21% compared with 13%).
Parent and young people’s satisfaction with the whole experience of getting an EHC plan also varied by the following characteristics (Table 2.1):
• Ethnicity: It was more common among children and young people from a BME ethnic background, for the parent or young person to report being satisfied with
7%8% 13% 42% 24%
5%1%
Overall satisfaction with whole experience ofgetting an EHC plan
Very Dissatisfied Dissatisfied Neither / nor SatisfiedVery Satisfied Don't Know Prefer not to say
Base: All parents and young people (13,643)
Satisfied: 66%Dissatisfied: 15%

47
the whole experience of getting an EHC plan (71% compared with 65% of those from a White ethnic background).
• SEND type: It was more common for children/young people with speech, language and communication needs to report being satisfied with the whole experience of getting an EHC plan (74% compared with 66% of all children/young people); and for children/young people with a specific learning difficulty to report being dissatisfied (21% compared with 15% of all children/young people).
• Type of need covered in the EHC plan: Parents and young people were more likely to report being satisfied with the whole experience where the child/young person’s EHC plan covered education, health and care needs (76% compared with 61% of cases where the EHC plan covered education needs only).
There were also some geographic variations in overall satisfaction levels by:
• Levels of deprivation: Parents and young people in the 20 per cent most deprived neighbourhoods were more likely to report being satisfied overall, with the rate of satisfaction decreasing consistently with levels of deprivation (70% compared with 61% in the 20 per cent least deprived neighbourhoods).
• Volume of SEND Tribunals: Satisfaction levels were also higher among those living in a local authority area with no SEND Tribunal appeals (74% compared with 60% of those in an area with 5 or more SEND Tribunal appeals appeals per 10,000 of the population aged 0-18).

48
Table 2.1: Overall satisfaction with process of getting an EHC plan by characteristics
Base
Overall satisfaction with process of getting an EHC plan
Satisfied Dissatisfied
All % (13,643) 66% 15%
SEN Statement in place previously
Yes, transfer from SEN Statement
% (8,513) 65% 13%
No, new to SEN assessment
% (4,412) 67% 21%
Age of child/young person
Aged under 5 % (1,087) 74% 14%
Aged 16-25 % (2,935) 53% 14%
Ethnicity BME % (2,255) 71% 11%
White % (10,845) 65% 16%
SEND type Speech, language and communication needs
% (1,706) 74% 11%
Specific learning difficulty % (634) 63% 21%
Types of need that EHC plan perceived to cover
Education, health and care
% (4,640) 76% 10%
Education only % (4,683) 61% 19%
Levels of deprivation
20 per cent most deprived neighbourhoods
% (3,010) 70% 10%
20 per cent least deprived neighbourhoods
% (2,575) 61% 21%
Volume of SEND Tribunals
Local authority area with no SEND Tribunal appeals
% (348) 74% 7%
Local authority area with 5 or more SEND Tribunal appeals per 10,000 of the population aged -0-18
% (1,234) 60% 22%

49
2.2.1. Variations in satisfaction by local authority
As Figure 2.2 shows, there were variations in the proportion of parents and young people who said that they were satisfied with the overall experience of the EHC plan process by local authority45.
This survey was conducted among parents and young people receiving their EHC plan in 2015 when EHC plans were relatively new. This meant that in some areas, the overall number of parents and young people who had been through the process was quite small and this in turn meant that the number of survey responses achieved in a number of local authorities was small. This means:
• That there are some local authorities where it is not possible to report accurate findings at all (results are not reported here for those in which fewer than 50 interviews were achieved46, although results for all local authorities are available with confidence intervals in Appendix F);
• That the ‘confidence intervals’ around the findings for many local authorities are quite wide. In Figure 2.2, the local survey result is shown with a blue dot and the confidence interval around the result is shown by the vertical line running through the dot. Generally, these lines are longer in the areas where fewer interviews were achieved. The confidence intervals shown are those for the 95% confidence level, hence for each local authority finding we can be 95% confident that the ‘true’ finding would lie somewhere between the top and bottom of the vertical line. We have also calculated confidence intervals at 90% confidence level.47.
However even with these notes of caution, there are some local authorities were parents and young people are more likely to be satisfied or dissatisfied. In Figure 2.2, local authorities for which we have sufficient sample sizes have been grouped into those where the levels of satisfaction of parents and young people are:
• Significantly lower than average at the 95% confidence level;
• Significantly lower than average at the 90% confidence level (but not at the 95% confidence level);
• Significantly higher than average at the 95% confidence level;
45 The data should not be used in isolation as a means of assessing individual local authority performance in the EHC needs assessment and planning process. Our survey explored parents’ and young people’s perceptions of their experiences of the EHC needs assessment and planning process. Their feedback is therefore just one (important) indicator of quality of service. 46 See Appendix E for more details. 47 The 90% confidence-level intervals are not presented in the chart alongside the confidence intervals at the 95% confidence level, in order to make the chart easier to read.

50
• Significantly higher than average at the 90% confidence level (but not at the 95% confidence level).
With the exception of those whose results are not shown (because fewer than 50 interviews were achieved), the remaining local authorities have results that are not sufficiently different from the average result to have confidence that the difference is real (at either the 90% or 95% level).
As Figure 2.2 shows, there are 13 local authorities where the proportion of parents and young people who were satisfied was significantly lower than average at the 95% or 90% confidence level and 16 where the proportion was significantly higher than average at the 95% or 90% confidence level.
Figure 2.3 shows the same data in a map format. This shows that there was no obvious geographic clustering of the higher and lower performing areas.

Figure 2.2: Overall satisfaction with process of getting an EHC plan by local authority (line graph)
0%5%
10%15%20%25%30%35%40%45%50%55%60%65%70%75%80%85%90%95%
100%
Ric
hmon
d up
on T
ham
esTr
affo
rdSo
mer
set
Shef
field
Surre
yC
hesh
ire E
ast
Che
shire
Wes
t and
Che
ster
Nor
folk
East
Sus
sex
Ham
pshi
reH
ertfo
rdsh
ireN
orth
Tyn
esid
eBe
xley
Ealin
gN
orth
umbe
rland
Wok
ingh
amBa
rnet
Brig
hton
and
Hov
eD
erby
Hou
nslo
wR
edca
r and
Cle
vela
ndSo
uth
Tyne
side
Cor
nwal
lC
oven
tryD
evon
Wor
cest
ersh
ireG
louc
este
rshi
reH
arin
gey
Sund
erla
ndC
alde
rdal
eLi
verp
ool
Sout
h G
louc
este
rshi
reBi
rmin
gham
Bren
tBr
isto
l City
of
Der
bysh
ireN
orth
Yor
kshi
reN
orth
ampt
onsh
ireN
ottin
gham
shire
Tow
er H
amle
tsC
ambr
idge
shire
Gre
enw
ich
Milt
on K
eyne
sR
ochd
ale
Wirr
alD
orse
tLe
ices
ters
hire
Lew
isha
mM
edw
aySo
uthw
ark
York
Bury
East
Rid
ing
of Y
orks
hire
Gat
eshe
adLa
ncas
hire
Leed
sSu
tton
Cro
ydon
Dud
ley
Esse
xTo
tal
Hilli
ngdo
nSt
oke-
on-T
rent
Wan
dsw
orth
War
ringt
onBe
dfor
dBr
omle
yKe
ntN
ewca
stle
upo
n Ty
neR
othe
rham
Wes
t Sus
sex
Bour
nem
outh
Buck
ingh
amsh
ireLa
mbe
thLi
ncol
nshi
reSt
ockt
on-o
n-Te
esW
est B
erks
hire
Hav
erin
gIs
le o
f Wig
htKi
rkle
esO
xfor
dshi
reSh
rops
hire
Suffo
lkSw
indo
nW
akef
ield
Wal
tham
For
est
Wilt
shire
Bath
and
Nor
th E
ast S
omer
set
Brad
ford
Leic
este
rSa
ndw
ell
Wal
sall
Bolto
nC
entra
l Bed
ford
shire
Dur
ham
Not
tingh
amSt
affo
rdsh
ireM
anch
este
rPl
ymou
thSt
ockp
ort
Sout
hend
-on-
Sea
Wig
anC
umbr
iaEn
field
Torb
ayW
arw
icks
hire
Hac
kney
Luto
nR
edbr
idge
Har
row
95% confident that lower than average
90% confident that lower than average
95% confident that higher than average
90% confident that higher
than average
Base: All parents and young people (13,643); Bases for each local authority range from 50 to 360

Figure 2.3: Overall satisfaction with process of getting an EHC plan by local authority (map)
95% confident that higher than average90% confident that higher than averageAround average90% confident that lower than average95% confident that lower than averageData not shown (bases lower than 50)

53
2.3. Reasons that parents and young people gave for being satisfied or dissatisfied
Parents and young people were asked in the survey to rate their overall satisfaction or dissatisfaction with the overall experience of getting an EHC plan on a scale. Towards the end of the questionnaire, parents and young people were also given the opportunity to respond to open-ended questions about what had worked well and what had not worked well during the EHC needs assessment and planning process. Responses to these questions were coded into themes48.
When asked about what went well during the process of getting an EHC plan, one in five parents and young people (21%) spontaneously said that they had acquired the funding or assistance that the child or young person needed, as shown in Figure 2.4. One in seven parents and young people (14%) highlighted the support received from staff at the school or college as being particularly positive. Just under one in ten parents and young people (9%) spontaneously said that they were kept informed or were provided with clear information.
Figure 2.4: Most common responses to the open-ended question of what worked well about the process of getting an EHC plan
48 Responses to these two questions were recorded verbatim. Once the fieldwork period had finished, code frames were drawn up to reflect the common themes which emerged for these questions. While coding of qualitative data is useful to get a sense of recurring themes in the verbatim, it does not fully reflect the nuances and detail of each parent/young person’s verbatim response.
16%11%
5%4%
3%4%4%
5%7%
8%9%
14%21%
Prefer not to sayDon't Know
Nothing / Not applicableOther
Child was allowed inputServices/Staff were helpful/understanding
Support from LA/Social Services/IASSOrganisations worked well together
Process was quick/easyWas listened to/allowed input into support
We were kept informed/given clear informationSupport from school/college/teaching staffAcquired funding/assistance child needed
Base: All parents and young people (13,643)

54
Around one in ten (11%) said that they did not know what had gone well and 16% preferred not to say. One in twenty (5%) said that ‘nothing’ had gone well during the EHC plan process.
Figure 2.5 below gives some examples of quotes from parents and young people in relation to some of the main themes mentioned.
Figure 2.5: Supporting verbatim for the most common positive themes for what worked well during the process of getting an EHC plan
When asked about what didn’t work well during the process of getting an EHC plan, one in five parents and young people (19%) spontaneously said that everything was fine and did not raise any negative issues. A similar proportion (20%) preferred not to answer this question, and one in ten gave a response of ‘don’t know’.
However, fifteen percent of parents and young people spontaneously mentioned that the process took too long while one in eight (13%) felt that they had faced difficulty in getting the needs of the child/young person met. Just under one in ten parents and young people (9%) spontaneously said that staff lacked knowledge or that they had received poor quality information and advice. The ten most commonly mentioned negative issues identified from the thematic analysis are shown in Figure 2.6.
Acquired the funding / assistance that the
child / young person needed
Support from school / college / teaching staff
Was kept informed / provided with clear
information
Theme Supporting verbatim
“My son gets the one to one support he really needs in a unit in a school that he wouldn't have been able to access without the EHC plan.”
“The final outcome of the EHC plan was worth the copious amounts of work required to get it as my son has the support he needed for last year.”
“We've got a very good relationship with the school which helped the process. Because of the school's involvement it just seemed quite smooth.”
“My child's school was very helpful and knowledgeable about applying for the EHC plan. Once getting the help from EHC plan everything went very well, and I have been very pleased with the help given.”
“The whole process worked well. We had a good team of professionals who, even though this was a new thing, kept us as parents involved and informed -especially the child psychologists and our SENCO worker.”
“All the help that he [the young person] received, explaining everything to him considering that he has learning difficulties.”

55
Figure 2.6: Most common responses to the open-ended question of what did not work well about the process of getting an EHC plan
Figure 2.7 gives some examples of the comments made by parents and young people in some of the most commonly mentioned areas.
Figure 2.7: Supporting verbatim for the most common negative themes for what did not work so well during the process of getting an EHC plan
20%10%
3%5%
6%6%6%
7%8%
9%13%
15%19%
Prefer not to say
Don't Know
Other
Confusing and complicated process
Badly organised
Lack of sympathy / customer care
Stressful and frustrating process
Lack of information and guidance
Poor communication - had to chase them
Staff lacking knowledge/poor quality advice
Difficulty meeting child's needs
The whole process takes too long
Nothing / everything was fine
Base: All parents and young people (13,643)
The whole process takes too
long
Difficulty meeting child’s needs
Staff lacking knowledge / poor quality information
and advice
Theme Supporting verbatim
“The amount of time [taken to get the EHC plan] caused me to miss important time in school. This caused me to miss the whole of Year 10 meaning I was only [able] to complete 4 subjects for my GCSE's at my SEN school.”
“It is a long drawn out process and the people who deal with EHC plan's were struggling at the start of the process. It was very difficult to get answers quickly to any questions I had.”“The school doesn't meet basic needs - like a basic daily therapy, a one-to-one therapy with the child. The staff support is not enough - people are not properly trained.”
“The early years at primary school it was difficult to get the support needed. This did have an impact on my education and self confidence.”
“As [my child] was one of the first children to apply and be awarded a Plan under the new scheme, some staff were not always sure as to what was happening or what the new 'process' would involve.”
“A number of health and education professionals were involved. Several of them did not have the required expertise and knowledge needed to complete the EHCplan. It required dedication and long hours of hard work on our behalf, to bring the required evidence together.”

56
A greater proportion of parents and young people spontaneously mentioned the length of the process as something that they felt did not work well in situations where the EHC plan was for a child aged 15 or under than when the EHC plan was for a young person aged 16 or older (16% versus 10%). Conversely, the proportion of parents and young people spontaneously reporting that they faced difficulties meeting the child / young person’s needs was greater in situations where the EHC plan was for a young person aged 16 or older than when the EHC plan was for a child aged 15 or younger (17% versus 12%).
Similarly a greater proportion mentioned difficulties with staff lacking knowledge and poor communication in cases where the EHC plan was for a child aged under 5 compared with when it was for a 16-25 year old (11% and 12% compared with 7% each respectively).
Parents and young people in the 20 per cent most deprived local authority areas were twice as likely to mention that the whole process took too long in their view than parents and young people in the 20 per cent least deprived neighbourhoods (20% versus 11%). Compared to those in the least deprived neighbourhoods, parents and young people in the 20 per cent most deprived neighbourhoods were also approximately three times as likely to mention that staff lacked knowledge / they received poor quality information and advice (12% versus 5%) and that the process was badly organised (9% versus 3%).
It was also more common for parents and young people to spontaneously mention one or more things they felt did not work well during the process in cases where the EHC plan had been received outside of the 20-week timescale, more than one request had been made before receiving the EHC plan, where no SEN Statement was in place previously, and in cases where the EHC plan covered education needs only (as opposed to education, health and care needs)49.
2.4. Extent to which getting an EHC plan was a positive experience for the child/young person
Parents and young people were asked whether or not they felt that taking part in the process of getting the EHC plan was a positive experience overall for the child or young person. Where parents felt it was appropriate, this information was obtained directly from the child/young person, in other cases parents provided their own perception of the extent to which the experience was positive for the child/young person.
Two fifths of parents and young people (41%) felt that the process of getting an EHC plan was a positive experience for the child/young person while 9% disagreed that this was the case (Figure 2.8).
49 In that the proportion saying ‘nothing/everything was fine’ was lower for these subgroups.

57
However, the results also show a relatively high level of uncertainty in answering this question. Close to a quarter (23%) thought that the experience was neither positive nor negative and almost a quarter of parents and young people felt unable to answer this question (23%). Not being able to answer the question seemed to reflect the age of the child/young person concerned as this was more likely where the EHC plan covered a younger child (33% for EHC plans covering children aged under 5 compared with 15% for young people aged 16-25).
Figure 2.8: Extent to which getting an EHC plan was a positive experience for the child/young person
It was more common for those who had transferred from a SEN Statement to agree that the experience of getting an EHC plan was positive for the child/young person (45% compared with 32% of those without a SEN Statement previously).
Levels of agreement also consistently increased with the age of the child/young person with an EHC plan (cases involving under 5 year olds: 28%, 5-10 year olds: 35%, 11-15 year olds: 45%, 16-25 year olds: 50%).
Agreement that taking part in getting the EHC plan was a positive experience for the child/young person also varied by the following characteristics (Table 2.2):
• Ethnicity: It was more common parents and young people to agree that the experience was positive in cases where the child/young person was from a BME background (49% compared with 39% of those from a White ethnic background).
4%
5% 23% 26% 15% 23%
4%
Taking part in getting the EHC plan was apositive experience for the child/young
person
Strongly Disagree Disagree Neither / nor AgreeStrongly Agree Don't Know Prefer not to say
Base: All parents and young people (13,643)
Agree: 41%Disagree: 9%

58
• SEND type: Where the child/young person had a visual impairment or a moderate learning difficulty, it was more common for parents and young people to agree that taking part in getting an EHC plan was a positive experience for the child/young person (53% and 51% respectively, compared with 41% of all parents/young people).
• Type of need covered in the EHC plan: Where the EHC plan covered education, health and care needs it was more common for parents and young people to report that the experience was positive for the child/young person (46% compared with 38% of cases where the EHC plan covered education needs only).
There were also some geographic variations in that parents and young people in the 20 per cent most deprived neighbourhoods were more likely to agree that the experience was positive for the child/young person and levels of agreement decreased with decreasing levels of deprivation (46% in the 20 per cent most deprived neighbourhoods compared with 34% in the 20 per cent least deprived neighbourhoods).

59
Table 2.2: Extent to which getting an EHC plan was a positive experience for the child/young person by characteristics
Base
Extent to which getting an EHC plan was a positive experience
for the child/young person
Agree Disagree
All % (13,643) 41% 9%
SEN Statement in place previously
Yes, transfer from SEN Statement
% (8,513) 45% 9%
No, new to SEN assessment
% (4,412) 32% 10%
Age of child/young person
Aged under 5 % (1,087) 28% 4%
Aged 5-10 % (4,931) 35% 7%
Aged 11-15 % (4,690) 45% 10%
Aged 16-25 % (2,935) 50% 14%
Ethnicity BME % (2,255) 49% 6%
White % (10,845) 39% 10%
SEND type Visual impairment % (194) 53% 7%
Moderate learning difficulty % (1,529) 51% 7%
Types of need that EHC plan perceived to cover
Education, health and care
% (4,640) 46% 7%
Education only % (4,683) 38% 10%
Levels of deprivation
20 per cent most deprived neighbourhoods
% (3,010) 46% 7%
20 per cent least deprived neighbourhoods
% (2,575) 34% 11%
2.5. Confidence that EHC plan will achieve agreed outcomes So far, this chapter has explored how satisfied or dissatisfied parents and young people said they were with the whole experience of getting their EHC plan; the extent to which parents and young people agreed that taking part in the process of getting their EHC plan

60
was a positive experience for the child/young person; and variations in responses to these two questions by subgroup and geography.
The final overall measure covered in this chapter relates to the extent to which parents and young people were convinced by the quality of the EHC plan that they received: measured by the help/support set out in the EHC plan. Overall three-fifths of parents and young people agreed that the help/support described in the EHC plan will achieve the outcomes for the child/young person that they had agreed. This demonstrates a reasonably high degree of confidence in the efficacy of the EHC plans secured although 9% of parents and young people disagreed that their EHC plan would achieve agreed outcomes and a relatively large proportion were unsure (Figure 2.9).
Figure 2.9: Extent to which believe that the help/support described in the EHC plan will achieve agreed outcomes
the
In cases where there was no SEN Statement in place previously, it was more common for parents and young people to agree that the help/support in the EHC plan will achieve the agreed outcomes (69% compared with 58% of those who had transferred from a SEN Statement).
Levels of agreement with this statement decreased with the age of the child/young person. Three-quarters (74%) of parents and young people agreed that the help/support would achieve the agreed outcomes where the child was aged under 5, compared with half (49%) of parents and young people agreeing where the young person was aged 16-25.
4%
6% 15% 45% 17% 12%
1%
The help/support described in the EHC planwill achieve the outcomes you have agreed
Strongly Disagree Disagree Neither / nor AgreeStrongly Agree Don't Know Prefer not to say
Base: All parents and young people (13,643)
Agree: 62%Disagree: 9%

61
There were also variations in opinions by the following characteristics (Table 2.3):
• SEND Type: In cases involving children/young people with a visual impairment or speech, language and communication needs, parents and young people were more likely to agree that the help/support in the EHC plan will achieve the agreed outcomes (74% and 67% respectively compared with 62% of all children/young people).
• Type of need covered in the EHC plan: Where EHC plans covered education, health and care needs, parents and young people were more likely to agree that the help/support described in the EHC plan will achieve the agreed outcomes (72% compared with 56% of cases where the EHC plan covered education needs only).
Parents and young people in a local authority area with no SEND Tribunal appeals were also more likely to agree that the help/support in the EHC plan will achieve the agreed outcomes (65% compared with 59% of those in a local authority area with 5 or more SEND Tribunal appeals per 10,000 of the population aged 0-18).

62
Table 2.3: Extent to which believe that the help/support described in the EHC plan will achieve agreed outcomes by characteristics
Base
Extent to which believe that the help/support described in the EHC plan will achieve agreed
outcomes
Agree Disagree
All % (13,643) 62% 9%
SEN Statement in place previously
Yes, transfer from SEN Statement
% (8,513) 58% 10%
No, new to SEN assessment
% (4,412) 69% 9%
Age of child/young person
Aged under 5 % (1,087) 74% 6%
Aged 5-10 % (4,931) 70% 7%
Aged 11-15 % (4,690) 59% 11%
Aged 16-25 % (2,935) 49% 12%
SEND type Visual impairment % (194) 74% 3%
Speech, language and communication needs
% (1,706) 67% 6%
Types of need that EHC plan perceived to cover
Education, health and care
% (4,640) 72% 6%
Education only % (4,683) 56% 11%
Volume of SEND Tribunals
Local authority area with no SEND Tribunal appeals
% (348) 65% 7%
Local authority area with 5 or more SEND Tribunal appeals per 10,000 of the population aged -0-18
% (1,234) 59% 11%
2.5.1. Variations in confidence in the EHC plan by local authority
As with responses to the question on overall satisfaction with the experience of getting the EHC plan, parents’ and young people’s confidence in their EHC plan were analysed by local authority, to identify any geographic variation in levels of agreement that the

63
EHC plan content would achieve the agreed outcomes for the child/young person. There were variations by local authority in the proportion of parents and young people who agreed with this, as is shown in Figure 2.10. This Figure takes the same approach as used for presenting overall satisfaction earlier (see section 2.2.1). The results for all local authorities where more than 50 responses were achieved are shown and confidence intervals (at the 95% level) are indicated by the vertical lines. Local authorities have been grouped into those where the proportion of parents and young people agreeing that the help/support outlined in their EHC plan will achieve the agreed outcomes is significantly higher than average at 95% confidence, higher than average at 90% confidence, significantly lower than average at 95% confidence and lower than average at 90% confidence.
There were a total of 7 local authorities where levels of agreement were significantly lower than average at the 95% or 90% confidence level and 7 where levels of agreement were significantly higher than average at the 95% or 90% confidence level.
Figure 2.11 shows the same data in a map format. As with overall satisfaction, this shows that there was no obvious geographic clustering of the higher and lower performing areas.

Figure 2.10: Confidence that EHC plan will achieve agreed outcomes by local authority (line graph)
0%
10%
20%
30%
40%
50%
60%
70%
80%
90%
100%
Sout
h Ty
nesi
deW
orce
ster
shire
Nor
th T
ynes
ide
Ric
hmon
d up
on T
ham
esSh
effie
ldTr
affo
rdD
evon
War
ringt
onG
reen
wic
hC
hesh
ire E
ast
Ealin
gBe
xley
Bour
nem
outh
Cov
entry
Wirr
alC
alde
rdal
eSt
ockt
on-o
n-Te
esSu
nder
land
Wok
ingh
amBr
omle
yD
erby
Hou
nslo
wLe
wis
ham
Milt
on K
eyne
sN
orth
ampt
onsh
ireN
ottin
gham
shire
Som
erse
tSu
rrey
Wal
sall
Barn
etH
ertfo
rdsh
ireLi
verp
ool
Cro
ydon
East
Rid
ing
of Y
orks
hire
Hilli
ngdo
nEa
st S
usse
xG
ates
head
Leic
este
rshi
reN
orfo
lkN
orth
Yor
kshi
reBe
dfor
dBi
rmin
gham
Bren
tC
ambr
idge
shire
Dor
set
Esse
xLe
ices
ter
Oxf
ords
hire
Plym
outh
Red
car a
nd C
leve
land
Roc
hdal
eSa
ndw
ell
Che
shire
Wes
t and
Che
ster
Dud
ley
Glo
uces
ters
hire
Tota
lIs
le o
f Wig
htSu
ffolk
Bris
tol C
ity o
fBu
ckin
gham
shire
Bury
Cor
nwal
lH
amps
hire
Kent
Leed
sSo
uthw
ark
Swin
don
Wak
efie
ldW
alth
am F
ores
tBa
th a
nd N
orth
Eas
t Som
erse
tD
erby
shire
Hav
erin
gLa
ncas
hire
Man
ches
ter
Med
way
Sutto
nW
est B
erks
hire
Wilt
shire
Cen
tral B
edfo
rdsh
ireR
othe
rham
Shro
pshi
reSt
ockp
ort
Tow
er H
amle
tsW
igan
Brig
hton
and
Hov
eD
urha
mN
ewca
stle
upo
n Ty
neEn
field
Har
inge
yLi
ncol
nshi
reLu
ton
Red
brid
geYo
rkKi
rkle
esSo
uthe
nd-o
n-Se
aTo
rbay
Bolto
nN
orth
umbe
rland
Stok
e-on
-Tre
ntW
ands
wor
thW
arw
icks
hire
Hac
kney
Not
tingh
amW
est S
usse
xH
arro
wBr
adfo
rdLa
mbe
thSo
uth
Glo
uces
ters
hire
Cum
bria
Staf
ford
shire
95% confident that lower than average
90% confident that lower than average
95% confident
that higher than
average
90% confident that higher than
average
Base: All parents and young people (13,643); Bases for each local authority range from 50 to 360

Figure 2.11: Confidence that EHC plan will achieve agreed outcomes by local authority (map)
95% confident that higher than average90% confident that higher than averageAround average90% confident that lower than average95% confident that lower than averageData not shown (bases lower than 50)

66
2.6. Summary Two thirds of parents and young people (66%) stated that they were satisfied with the whole experience of getting an EHC plan; a quarter were very satisfied. A minority (15%) were dissatisfied, however, and a similar proportion (13%) said they were neither satisfied nor dissatisfied.
Two fifths of parents and young people (41%) felt that taking part in the process of getting an EHC plan was a positive experience for the child/young person while 9% disagreed that this was the case. Almost a quarter (23%) said that they neither agreed nor disagreed with this statement and another quarter (23%) were unable to answer this question; was more common where the plan was for a younger child.
Overall three-fifths of parents and young people (62%) agreed that the help/support described in the EHC plan will achieve the outcomes that they had agreed for the child or young person, while 9% disagreed that this is the case, and 15% neither agreed nor disagreed.
There were variations in response to these questions about the overall experience by characteristics of the child/young person with an EHC plan. In cases where the EHC plan covered younger children, parents were more likely to report being satisfied with the whole experience, that the experience was positive for the child, and to agree that the help/support outlined in the EHC plan will achieve the agreed outcomes. Responses were also more positive for cases where a SEN Statement had previously been in place.
When asked an open question about what went well during the process of getting an EHC plan, parents and young people were most likely to spontaneously mention that they had acquired the funding or assistance that the child or young person needed; or that the support received from staff at the school or college had been positive.
When asked what didn’t work well, around a fifth (19%) of parents and young people said they had nothing to report / everything had worked fine. Regarding aspects that parents and young people felt had not worked well, they were most likely to spontaneously mention that the process took too long in their view; that they had faced difficulty getting the needs of their child or young person met; or that staff lacked knowledge or that they had received poor quality information and advice. Parents and young people were more likely to spontaneously report facing difficulties meeting the child / young person’s needs where the EHC plan was for a young person aged 16 or over.

67
There were variations by local authority, both in the proportion of parents and young people who said that they were satisfied with the overall EHC plan process; and to a lesser extent in the proportion of parents and young people who agreed that the help/support described in their EHC plan would achieve the outcomes agreed. There was slightly less variation by local authority for the latter question. There was no obvious geographic clustering of the higher and lower performing areas on either measure.

68
3. Involvement in the process
3.1. Introduction The Children and Families Act 2014 sets out areas for consideration for local authorities, as part of carrying out their duties for children and young people with SEND. Under the Act, local authorities must have regard to:
• The views, wishes and feelings of the child/young person, and the child’s parents;
• The importance of the child/young person, and the child’s parents, participating as fully as possible in decisions, and being provided with the information and support necessary to enable participation in those decisions; and
• The need to support the child/young person, and the child’s parents, in order to facilitate the development of the child or young person and to help them achieve the best possible educational and other outcomes, preparing them effectively for adulthood.
This statutory requirement is also reflected in the SEND Code of Practice: one of its core principles - ‘participating in decision making’ - states that local authorities must ensure that children, their parents and young people are involved in discussions and decisions about their individual support and about local provision; and that early years providers, schools and colleges should also take steps to ensure that young people and parents are actively supported in contributing to needs assessments and in developing and reviewing EHC plans. Similarly the Code also sets out that children, young people and parents should be supported to participate in decisions, for example through the provision of necessary information, advice and support; and that children, young people and parents should be involved in planning, commissioning and reviewing services through the Local Offer.
This chapter explores parents and young people’s reports of their involvement in the process of getting an EHC plan. The first section considers the experiences of parents and young people in starting the process and how long it took to get the EHC plan – including:
• Whether the child or young person had a SEN Statement in place previously;
• Where the child or young person did not have SEN Statement in place previously, who started the process of getting an EHC plan, and how many requests it took to get an EHC plan;
• Overall, how easy or difficult parents and young people felt it had been to start the process of getting an EHC plan; and

69
• How long it had taken to get the EHC plan, from the point at which the EHC plan was requested, up to getting the EHC plan agreed.
The chapter then examines what it was like to be involved in the process of getting an EHC plan – in particular:
• The amount of time and effort involved for parents, and the extent to which this was considered reasonable;
• How clear the communication about the EHC plan was during the process;
• To what extent steps were taken to help the child, young person or parent understand what took place during the process and why; and
• Overall, how easy or difficult parents and young people found it to be involved in the process of getting an EHC plan.
The chapter also examines parent’s and young people’s views on the process of arriving at the EHC plan content. It covers the extent to which parents and young people felt the process had been family-centred, i.e. taking the needs and circumstances of the child/young person and their family into account. It also describes how easy or difficult parents and young people felt it had been to agree the needs and support described in the EHC plan.
The chapter then discusses how well the process worked in making the child/young person and/or their parent an active participant – for example, by making an effort to listen to them and understand their opinions; by including them in meetings; giving them choices of how to take part; and by providing support in the form of advocates/supporters, visual aids or communication aids, where these were needed.
Finally, the chapter examines parent’s and young people’s experiences of the professionals they worked with, including whether staff were knowledgeable about the EHC plan process, and whether different services (education, health and care services) worked together to make the EHC plan.

70
3.1.1. Having a previous Statement of SEN
As this survey focused on those who had received an EHC plan in the 2015 calendar year, some children and young people with EHC plans were transferred from a SEN Statement to an EHC plan. The survey therefore included a question to establish whether or not the child/young person had a SEN Statement previously50. Almost two-thirds (63%) of parents and young people reported that the child/young person had a Statement of SEN in place before receiving their EHC plan. Parents and young people were not always certain about whether they had a SEN Statement previously – 5% stated that they did not know.
As would be expected, the likelihood of having a SEN Statement previously increased with the age of the child/young person involved, as Table 3.1 shows:
Table 3.1: Whether previously had a Statement of Special Educational Needs before getting the EHC plan, by age of child/young person
All Age of child/young person with EHC
plan
Under 5 5 – 10 11-15 16-25
% % % % %
Base: All parents and young people (13,643) (1,087) (4,931) (4,690) (2,935)
Child/young person had a SEN Statement before getting the EHC plan
63 25 46 72 91
Child/young person did not have an SEN Statement previously
32 64 47 24 6
Don’t know 5 10 6 4 3
Prefer not to say 1 1 1 1 *
Whether or not a SEN Statement was in place previously also varied by:
• Education setting: Where the EHC plan was for a child/young person attending a mixed or specialist education setting, parents and young people were more likely
50 This question has been used to report the findings in the earlier sections of this chapter (sections 3.1.2 abd 3.1.3) based on those without a SEN Statement in place previously. Those who answered ‘don’t know’ or ‘prefer not to say’ have been excluded from the base. This gives a total unweighted base of 4,112 for thes sections.

71
to report a SEN Statement being in place previously (70% and 68% respectively compared with 55% of those attending a mainstream education setting).
• SEND type: It was more common for children/young people with severe learning difficulties, a visual impairment, hearing impairment or profound and multiple learning difficulties to have had a SEN Statement previously (77%, 75%, 73% and 72% respectively compared with 63% of all children/young people).
3.1.2. Who started the process
Where the child/young person did not have a Statement of SEN in place before receiving their EHC plan, parents and young people were asked about the start of the EHC plan process51. Of the one-third (32%) of parents and young people with no Statement of SEN in place previously52, 36% stated that they started the process of getting an EHC plan themselves (Figure 3.1). Just over two-fifths (43%) of these parents and young people reported that the process had been started by another party, and one in five (19%) indicated that themselves and another party had been equally responsible for starting the process. Most commonly the other party involved in initiating the process was the child/young person’s school or college (cited by 46% of all parents and young people without a SEN Statement previously), followed by a health professional (17%) and a local authority (9%).
51 For those with a previous SEN Statement in place, the process will have been initiated by the local authority. Cognitive testing of the survey questionnaire highlighted that respondents where the child/young person had a statement of SEN in place before receiving their EHC plan struggled to answer questions relating to the start of the process as the transition from a statement of SEN to an EHC plan was not always distinct or clear-cut. Based on this finding, the decision was made to only ask questions relating to the start of the process among respondents where the child/young person did not have a previous statement of SEN. 52 As noted earlier, the data presented here is on an unweighted base of 4,112 individuals saying they did not have a Statement of SEN previously.

72
Figure 3.1: How the process of getting the EHC plan started
Overall – setting aside whether the parent/young person or the organisation started the process – the education provider was involved in starting the EHC needs assessment and planning process for 68% of all parents and young people without a SEN Statement previously and a health professional involved for 25%53.
Who had started the process of getting the EHC plan varied by54:
• Education setting: Where the EHC plan was for a child/young person attending a mixed education setting, parents and young people were more likely to report that the process was initiated by the education provider (75% compared with 69% of those attending a mainstream setting and 65% of those attending a specialist education setting).
• Age: Where the EHC plan was for a child aged under 5, parents and young people were more likely to report that a health professional was involved in starting the process (37% compared with 25% of all parents and young people
53 Other ways of initiating the process mentioned by very small proportions of parents and young people surveyed, were: the child made a request to the school, local authority or a health professional (2%), the parent made a request to the school, local authority or a health professional (1%), a joint decision was made by parent and school / health professional / social services (1%), or the parent/young person was approached by a charity/support group (16 responses from parents and young people without a SEN Statement previously, less than 1%). 54 This data is based on those who said that they did not have a SEN Statement previously and excludes don’t know and prefer not to say responses to this question.
1%
3%
9%
13%
17%
24%
32%
46%
Don't Know
Other
My local authority approached me/my familyabout getting an EHC plan
I made a request to a health professional
A health professional approached my localauthority about getting an EHC plan
I made a request to my local authority
I made a request to my/my child's school orcollege
My/my child's school approached me/myfamily about getting an EHC plan
Education provider involved in initiating: 68%Health professional involved in initiating: 25%
Initiated by parent / young person: 36%
Initiated by another party: 43%
Both equally: 19%
Base: All parents and young people without a statement in place before the EHC plan (4,412)

73
with a SEN Statement previously) and significantly less likely to report that the education provider had been involved in starting the process (45% compared with 68%). The education provider was more commonly involved in starting the process where the child was aged 5-10 or 11-15 years (72% and 77% respectively, compared with 68% of all parents and young people with a SEN Statement previously).

74
3.1.3. Number of requests to get an EHC plan
Parents and young people with no SEN Statement previously in place were also asked how many requests they had made to get the EHC plan55. Just over eight in ten (83%) received the EHC plan after the first request (Figure 3.2). However in 15% of cases where there was no SEN Statement in place, families had to make more than one request to secure their EHC plan. In most of these cases, parents and young people received their EHC plan after the second request although a small proportion made three or more requests.
Figure 3.2: Whether or not the EHC plan was received after the first request
Looking just at cases where no previous SEN Statement was in place, parents and young people who initiated the process of getting an EHC plan themselves were less likely to report receiving their EHC plan after the first request (76% compared with 89% of cases initiated by another party).
55 Technically, what parents and young people are requesting at this point is an EHC needs assessment, rather than an actual EHC plan. At the cognitive testing stage, however, parents and young people found it more intuitive to talk in terms of requesting an EHC plan – and so this phrasing was used in the questionnaire and is reflected in how findings are reported. Again, for those with a previous SEN Statement in place, the process will have been initiated by the local authority.
83%
11%4% 2%
Yes, thiswas the first
request
No, we'vehad to try
twice
No, we'vehad to try 3+
times
Don't know
Base: All parents and young people without a SEN Statement in place before the EHC plan (4,412)
Base: All parents and young people (13,643)
5%
32%
63%
Prefer not to say
Don't Know
No
Yes
Whether had SEN Statement before getting EHC plan:
Whether made more than one request to get EHC plan:

75
The likelihood of getting an EHC plan after the first request also decreased with age, as Table 3.2 shows. Almost one in ten EHC plans for 11-15 year olds (9%) were only secured after three or more requests.
Table 3.2: Whether got the EHC plan after the first request, by age of child/young person
All Age of child/young person with EHC
plan
Under 5 5 – 10 11-15 16-25
% % % % %
Base: All parents and young people where no previous SEN Statement was in place
(4,412) (710) (2,387) (1,136) (179)
Yes, received on first request 83 94 84 73 73
No, we’ve had to try twice 11 4 10 16 15
No, we’ve had to try three or more times
4 1 3 9 4
Don’t know 2 1 2 1 7
Prefer not to say * * * * 1
It was also the case that EHC plans for children or young people with profound and multiple learning difficulties were more likely to be obtained after the first request (in 95% of these cases where there was not a previous SEN Statement in place, the EHC plan was obtained after the first request). These cases account for a relatively small proportion of all EHC plans (1% were cases where the child/young person did not have a SEN Statement previously and had profound and multiple learning difficulties). Children and young people with a specific learning difficulty were significantly less likely to obtain the EHC plan after the first request (75% compared with 83% of all cases without a SEN Statement previously)56.
56 It is worth noting that as the respondents surveyed only include those with an EHC plan in 2015: the analysis in this section, and indeed the report, will not consider the experiences of those parents and young people who may have requested an EHC plan – whether once or more than once – where this request was not eventually met.

76
3.1.4. Ease of starting the process
This chapter has so far focused on how the process of getting the EHC plan was started, in cases where the child/young person did not have a SEN Statement previously. This section now looks at perceptions of the effort involved in starting the process. All parents and young people (regardless of whether they had a previous SEN Statement or not) were asked how easy or difficult overall they found it to start the process of getting an EHC plan to get a sense of how they found the process at the beginning of their involvement, regardless of how, or by whom, the process had been started.
Where the child/young person was being transferred from a SEN Statement, the process should have been initiated automatically by their local authority. Nevertheless, a minority of respondents with previous SEN statements still perceived starting the process as difficult and so we have reported the findings in relation to all respondents, i.e. for SEN statement transfers and for those not transferring.
Half of all parents and young people (50%) reported that they found it easy (34%) or very easy (16%) to start the process of getting an EHC plan but just under a quarter (23%) said it was difficult or very difficult (Figure 3.3). Previous qualitative research conducted for the Department for Education57 similarly found instances of difficulties with starting the process, due to variations in the referral approach to enter the process, the threshold levels to enter it and the extent of evidence required in support of the initial referral. The research found that for these reasons, repeat requests for an EHC plan were relatively frequent in a small qualitative sample (although, as reported in the previous section, this research finds that parents and young people made more than one request in just 15% of cases where there was no previous SEN Statement in place).
57 Skipp & Hopwood (2016) Mapping user experience of the Education, Health and Care plan process: a qualitative study.

77
Figure 3.3: The ease of starting the process
Starting the process appears to have been harder for those not transferring from a SEN statement, which might be expected given the requirement for local authorities to automatically initiate transfers for those with statements (63% of those surveyed) to EHC plans. Where the child/young person had no previous SEN Statement, parents and young people were more likely to find it difficult or very difficult (38% compared with 16% of cases with a previous SEN Statement).
In cases where there was no previous SEN Statement in place, it was clear that the involvement of third parties sometimes made it easier to get the process started. In cases where the parent/young person had no previous SEN Statement and initiated the process themselves, 53% found it difficult or very difficult to start the process, compared with 25% of cases where there was no SEN Statement in place and another party was involved in starting the process.
Some differences in the reported ease of starting the process were also evident by family characteristics such as:
• Age: It was more common to report finding it easy or very easy to start the process where the EHC plan was for a child/young person under 5 than for children/young people of all other ages (61% compared with 50% of children and young people in general).
• SEND type: Parents and young people were more likely to find it easy or very easy to start the process in cases where the child/young person had a profound
10% 14% 13% 34% 16% 7%
5%
1%
How easy or difficult was it for you/your childto start the process of getting an EHC plan?
Very Difficult Difficult Neither / nor EasyVery Easy Don't Know Not applicable Prefer not to say
Base: All parents and young people (13,643)
Easy: 50%Difficult: 23%

78
and multiple learning difficulty (61% compared with 50% of children and young people in general).
There were also some small geographic variations that were evident in terms of:
• Volume of SEND Tribunals: Parents and young people in a local authority with no SEND Tribunal appeals were more likely to report finding it easy or very easy to start the process (58% compared with 46% of parents and young people in areas with more than 5 appeals per 10,000 of the population of 0-18 year-olds).
3.2. Length of the process The Children and Families Act 2014 and SEND Regulations 2014 set a statutory timescale, which, at the time of the survey was up to 20-weeks (five months) for getting an EHC plan (the timescale was 26-weeks up until September 2014).
The official statistics that are based on local authority data returns58 show close to three in five (59%) new EHC plans made in 2015 being issued within the 20-week timescale (excluding cases of exceptional circumstances, which are exempt from this requirement, as per the Special Educational Needs and Disability Regulations 2014). These data also indicate that in 2015, a fifth (19%)59 of new EHC plans were issued under exceptional circumstances i.e. the 20-week timescale did not have to be met. When exceptional cases are included, the proportion of new EHC plans in 2015 being issued within the 20-week timescale as reported in the official data reduces to 56%60.
Parents and young people were asked how long the whole process took, from the point at which the EHC plan was requested, up to getting the EHC plan agreed. They were not asked whether exceptional circumstances had meant their plan was exempt from the 20-week target as this would have been difficult for them to comment on. As Figure 3.4 shows, just over a quarter (27%) of respondents said that they did not know how long the process took, and it was more common for respondents to say that the 20-week timescale had been missed rather than met61. Just under half of all parents and young people stated that the whole process of getting an EHC plan took longer than 20 weeks (44%) and just over a quarter (27%) gave a timeframe within 20 weeks. Parents and young people who reported the process taking longer than 20 weeks (five months) most
58 Statements of SEN and EHC plans: England, 2016 (DfE, 2016) 59 Data from the 2017/16 SFR 60 Statements of SEN and EHC plans: England, 2016 (DfE, 2016) 61 Previous qualitative research conducted for the Department for Education found parents experiencing delays in getting the final EHC plan issued was sometimes due to disagreements over EHC plan content or over the nursery, school or college named in the EHC plan; or sometimes without any reason being given to the parent. Mapping user experiences of the Education, Health and Care process: a qualitative study, by Amy Skipp & Vicky Hopwood, ASK Research (Research Report, Department for Education, April 2016).

79
commonly reported that it took between 21 and 24 weeks, or approximately 6 months (18%); a slightly smaller proportion stated that it took more than 10 months (14%).
The survey results show a different perspective on timeframes to those provided by local authorities in the official data. This may reflect differences between when parents/young people and local authorities started timing the process. For example, parents might have considered the 20-week period to have started when they made a request to a teacher, whereas local authorities may have considered it to have started when the request was brought to their attention later (as allowed in the SEND Code of Practice). It may also reflect some recall difficulties for survey respondents when estimating the duration of a process that ended between six and 18 months ago. Furthermore, parents and young people were not asked whether exceptional circumstances had been applied to the timeframes of their plan (as this would have been difficult for them to comment on), and so the survey data does not reflect the proportion of plans that would have been exempt from the 20-week target.
Figure 3.4: Length of process for getting an EHC plan – including those not giving a timescale
Figure 3.5 presents data on how long the process took excluding parents/young people who were unable to provide an answer. This analysis shows that just over three-fifths of those who gave a timescale stated that the whole process of getting an EHC plan took longer than 20 weeks (62%) and just under two-fifths (38%) gave a timeframe within 20 weeks.
27%
18%
5%7%
14%
27%
1%
Up to 20weeks
Between 21and 24weeks /around 6months
Around 7months
Around 8-10months
More than10 months
Don't know Prefer not tosay
Within target
timescale
Base: All parents and young people (13,643)
Outside target
timescaleEHCP process within 20 week timescale: 27%EHCP process outside of 20 week timescale: 44%

80
Figure 3.5: Length of process for getting an EHC plan – excluding those not giving a timescale
The length of time taken to secure an EHC plan varied by whether or not a SEN Statement was in place previously, with parents and young people new to the SEN system more likely to have experienced a longer process62 (Table 3.3).
The difficulties in establishing a start and end point to the EHC plan process in cases where a previous SEN Statement was in place were also evident (35% of these parents and young people felt unable to state the length of the process compared to 9% of those where there was no previous SEN Statement).
Of those able to state how long the process took, 45% of parents and young people where there was a previous SEN Statement in place reported that the EHC plan was delivered within 20 weeks compared to 28% of those where there was no previous SEN Statement.
62 Note that prior to September 2015 the 20-week timescale applied only to new EHC plans and not to transfers from a SEN Statement, which had a 16-week timescale. This was extended to 20-weeks as of September 2015 in recognition that local authorities were struggling to meet the 16-week deadline.
38%
25%
7%10%
20%
Up to 20 weeks Between 21 and24 weeks /
around 6 months
Around 7 months Around 8-10months
More than 10months
Within target
timescale
Base: All parents and young people able to provide a timeframe for receiving the EHC plan (9,832)
Outside target
timescaleEHC plan process within 20 week timescale: 38%EHC plan process outside of 20 week timescale: 62%

81
Table 3.3: Length of EHC plan process, by whether had a previous SEN Statement or not
All Whether or not had a SEN Statement
in place
Yes No
% % %
Base: Parents and young people able to specify the length of the process
(13,643) (8,513) (4,412)
Up to 20-weeks 27 29 26
21-24 weeks / around 6 months 18 16 24
Around 7 months 5 4 8
Around 8-10 months 7 6 10
More than 10 months 14 10 22
Don’t know 27 35 9
Prefer not to say 1 1 *
Total more than 20 weeks 44 35 65
As mentioned earlier, some parents and young people reported that it took more than one attempt to receive their EHC plan. Those who received their EHC plan on the first attempt were more likely to report receiving their EHC plan within the 20-week timescale (31% of those able to give a timeframe compared with 15% of those who had to try more than once to get the EHC plan). In cases where multiple attempts were made, it is possible that the outcome of each individual attempt was given within 20 weeks but that parents and young people have considered their full journey when providing an estimate of the timeframe involved.
There were wide geographic variations in the proportion of plans delivered within the 20-week timeframe. Considering just those cases where parents and young people were able to state how long the process of getting an EHC plan took, the proportion of EHC plans delivered within 20-weeks varied by local authority from 8% to 63%.63 Geographic
63 Local authorities where fewer than 50 interviews were achieved have been excluded from this analysis. The mean average proportion of EHC plans delivered within 20-weeks was 38%, and the median proportion was also 38%.64 Views given by parents only.

82
variations were also evident by volume of SEND Tribunals: parents and young people in a local authority with no SEND Tribunal appeals were more likely to get the EHC plan within 20 weeks (51% of those able to state a timeframe compared with 27% of parents and young people in areas with more than 5 appeals per 10,000 of the population of 0-18 year-olds).
3.3. Experiences of being involved in the process This chapter has explored parents’ and young people’s views on how the process was started, how easy or difficult they found this and how long the process took. We now examine parents’ and young people’s views on what it was like to be involved in the EHC assessment and planning process. Specifically, we asked:
• Whether parents felt that the amount of time and work they had to put into getting the EHC plan was reasonable;
• Whether parents and young people felt communication about the EHC plan was clear throughout the process;
• Whether steps were taken to help the child/young person understand what took place and why.
Responses to these questions are presented in Figure 3.6.
As well as these questions focusing on these specifics, parents and young people were asked a question on how easy or difficult they found it to be involved in the EHC plan process overall (see Figure 3.7).

83
Figure 3.6: Experiences of parents and young people being involved in the process of getting the EHC plan
Almost three-quarters of parents felt that the amount of time and work that they had to put into getting an EHC plan was reasonable at least for some of the time (51% most or all of the time, 22% some of the time).64 However a fifth (20%) felt that it was not reasonable.
Where the process had been longer, parents were more likely to consider that the time and work that they had had to invest was unreasonable. Where EHC plans were finalised within 20 weeks, 9% of parents considered the amount of time and work that they put in to be unreasonable; where the process took more than 10 months, 52% of parents felt this was the case. Similarly, when the EHC plan was obtained after the first request, 25% felt that the amount of time and work that they put in was unreasonable compared with 53% in cases where multiple requests were made.
In keeping with the fact that EHC plan processes were generally shorter for those who transferred from a previous SEN Statement, where the child/young person had a previous SEN Statement parents were less likely to report that the time and work put into the process was unreasonable (15% compared with 29% of cases with no previous SEN Statement).
64 Views given by parents only.
35%
47%
51%
23%
27%
22%
28%
21%
20%
11%
4%
5%
4%
2%
2%
Steps were taken to help you/your childunderstand what took place and why
Communication about the EHC plan was clearthroughout the process
The time and work that you had to put intogetting the EHC plan was reasonable
Yes, most or all of the time Yes, some of the time No Don't know Prefer not to say
Base: All parents and young people (13,643)
Base: All parents and young people (13,643)
Base: All parents (10,675)
Yes: 72%
Yes: 74%
Yes: 57%
84
There was also variation in parents’ perceptions of the amount of work that they needed to put in by the types of need covered in the EHC plan: parents of children whose EHC plan covered education, health and care needs were less likely to report that the time and work put into the process by them was unreasonable (15% compared with 24% of parents of children whose EHC plan covered education needs only).
Variations were also found by levels of deprivation: it was more common for parents and young people in the 20 per cent least deprived areas to report that the time and work put into the process by them was unreasonable (27% compared with 15% in the most deprived areas).
Views of parents and young people about the communication received during the EHC plan process were mixed. Around three-quarters (74%) felt that communication was clear at least some of the time (47% felt it was clear most or all of the time and 27% that it was clear some of the time). A fifth (21%) felt that it was not clear at all (Figure 3.5).65
Parents and young people who reported their EHC plan was delivered within the target timeframe of up to 20 weeks were more likely to report that communication about the EHC plan was always or mostly clear throughout the process (63% compared with 25% of those reporting it took more than 10 months to get the EHC plan).
Where the EHC plan covered education, health and care needs it was more common for parents and young people to report that communication about the EHC plan was clear most or all of the time throughout the process (58% compared with 40% of cases where the EHC plan covered education needs only).
Parents and young people had mixed views as to whether steps were taken to help the child/young person understand what took place and why during the process of getting their EHC plan (Figure 3.5). A third (35%) reported that this happened most or all of the time, just under a quarter (23%) that it happened some of the time and 28% that it did not happen at all.
The age of the child/young person involved played a role in the likelihood to feel that steps were taken to help them understand what took place and why with agreement stronger in cases involving older children/young people as Table 3.4 shows. However even in cases where the EHC plan was for a young person aged 16-25, only two fifths (43%) of parents and young people agreed that these steps were taken most or all of the time.
65 Views given by parents and young people.

85
Table 3.4: Whether steps taken to help the child/young person understand what took place and why, by age of the child/young person
All
Age of child/young person with EHC plan
Under 5 5 – 10 11-15 16-25
% % % % %
Base: All parents and young people (13,643) (1,087) (4,931) (4,690) (2,935)
Steps were taken to help the child/young person understand what took place and why
Yes, most or all of the time 35 25 30 37 43
Yes, some of the time 23 14 21 25 25
No 28 38 34 25 20
Don’t know 11 12 11 11 10
Prefer not to say 4 10 5 2 2
Likelihood to feel that steps were taken to help the child/young person understand the EHC plan process also varied by the type of needs covered by the EHC plan. Where the child/young person had a visual impairment or a moderate learning difficulty, it was more common to report that steps were taken most or all of the time to help the child/young person understand the process (45% and 43% respectively compared with 35% of children and young people in general). It was also more common where the EHC plan covered education, health and care needs (43% reported steps being taken to help the child/young person to understand the process most or all of the time compared with 30% of cases where the EHC plan covered education needs only, and 31% of cases where the EHC plan covered education and health needs).
Across all three of these measures of involvement in the process – whether the amount of time and work that parents put in was considered reasonable, whether communication was clear and whether steps were taken to help the child/young person to understand the process – there were geographic variations in terms of:
• Levels of deprivation: Parents and young people living in the 20 per cent most deprived areas were:
• More likely to report that the time and work put in was reasonable most or all of the time (54% compared with 46% in the 20 per cent least deprived areas);

86
• More likely to report that communication about the EHC plan was clear most or all of the time (51% compared with 43% of those in the 20 per cent least deprived areas); and
• More likely to report that steps were taken to help the child/young person understand the process most or all of the time (39% compared with 30% of those in the 20 per cent least deprived areas).
• Volume of SEND Tribunals: Parents in a local authority with no SEND Tribunal appeals were more likely to report that:
• The time and work put into the process was always or mostly reasonable (69% compared with 44% of parents in local authorites with 5 or more SEND per 10,000 of the population of 0-18 year-olds).
• That communication about the EHC plan was clear most or all of the time (55% compared with 41% of those in areas with 5 or more SEND Tribunal appeals per 10,000 of the population of 0-18 year-olds).
• That steps were taken to help the child/young person most or all of the time (44% compared with 31% of those in areas with 5 or more SEND Tribunals per 10,000 of the population of 0-18 year-olds).
Overall, close to six in ten parents and young people (57%) said that they found it easy (41%) or very easy (16%) to be involved in the overall process of getting the EHC plan. Around a fifth (18%) found it either difficult (12%) or very difficult (6%), as Figure 3.7 shows.
Figure 3.7: Ease of being involved in the process of getting the EHC plan
6%12% 15% 41% 16% 6%
3%
1%
How easy or difficult was it for you/your childto be involved in the overall process of
getting an EHC plan?
Very Difficult Difficult Neither / nor EasyVery Easy Don't Know N/A Prefer not to say
Base: All parents and young people (13,643)
Easy: 57%Difficult: 18%

87
As well as finding it harder to start the process (see section 3.1.4), parents and young people involved with EHC plans for children/young people without a previous SEN Statement were also more likely to find involvement with the process difficult (26% compared with 15% of those cases where there was a previous SEN Statement).
Where the child/young person had a specific learning difficulty (such as dyslexia or dyspraxia), parents and young people were more likely to report finding it easy or very easy to be involved in the process of getting the EHC plan (27% compared with 18% of children and young people in general).
Those who were more likely to report that the process was easy or very easy included:
• Those who received their EHC plan after the first request (61% compared with 36% of those who had to make more than one request to get the EHC plan).
• Those who reported getting the EHC plan within the 20-week timeframe (75% compared with 57% of those who reported the EHC plan process took 6-10 months and 33% of those who reported it took more than 10 months).
Parents and young people in a local authority with no SEND Tribunal appeals were more likely to report the child/young person found it easy or very easy to be involved in the overall process (69% compared with 52% of those in local authority areas with more than 5 appeals per 10,000 of the population of 0-18 year-olds).

88
3.4. Extent to which the process is family-centred As well as establishing their level of direct involvement in the EHC plan process, parents and young people were asked the extent to which they felt the process was family-centred i.e. whether it took their family’s personal needs and circumstances into account.
Three-quarters (75%) of parents and young people felt that their family’s personal circumstances were taken into account during the process to some extent at least. Nearly half (48%) reported that this happened most or all of the time and close to three in ten (28%) said that this happened some of the time. Around one in ten parents and young people reported that their family’s needs and circumstances were not taken into account during the process (13%) or that they did not know (10%), as Figure 3.8 shows.
Figure 3.8: Extent to which needs and circumstances of the family were taken into account during the EHC plan process
Parents and young people were more likely to report that their family’s needs and circumstances were taken into account most or all of the time in cases of EHC plans for younger children. In 55% of cases of EHC plans for children/young people aged under 5 parents felt that their needs and circumstances were taken into account most or all of the time compared with 50% of cases where the EHC plan was for a child/young person aged 5-10, 44% of cases where the EHC plan was for a child person aged 11-15, and 48% of cases where the EHC plan was for a young person aged 16-25.
It was also slightly more common among children and young people from a White ethnic background, for the parent or young person to report that their family’s needs and
48% 28% 13% 10%
2%Your/your child's and your family's personalneeds and circumstances were taken into
account in the process
Yes, most or all of the time Yes, some of the time No Don't know Prefer not to say
Base: All parents and young people (13,643)
Yes: 75%

89
circumstances were taken into account most or all of the time (50% compared with 44% of those from a BME background).
Variation was also evident in terms of the type of needs covered by the EHC plan:
• Where the EHC plan covered education, health and care needs, the parent or young person was more likely to report that their family’s needs and circumstances were always or mostly taken into account (60% compared with 40% of cases where the EHC plan covered education needs only).
• Where the child/young person with an EHC plan had profound and multiple learning difficulties, a physical disability or severe learning difficulty, it was more common for parents and young people to report that the family’s needs and circumstances were taken into account most or all of the time (55%, 54% and 53% respectively compared with 48% of children and young people in general).
It was more common for parents and young people in a local authority area with no SEND Tribunal appeals to feel that their family’s needs and circumstances were taken into account most or all of the time (59% compared with 41% of those in areas with more than 5 appeals per 10,000 of the population of 0-18 year-olds).
3.5. Agreeing on the needs and support described in the EHC plan
Having looked at experiences of involvement in the EHC needs assessment and planning process, this section of the chapter explores how easy or difficult parents and young people found it to be involved in agreeing on the content of the EHC plan.
Over six in ten (62%) parents and young people found it easy (44%) or very easy (17%) to agree on the needs and support described in the EHC plan. Almost a fifth (17%) found it difficult (11%) or very difficult (7%) (Figure 3.9).

90
Figure 3.9: Degree of ease/difficulty in agreeing the needs and support described in the EHC plan
In cases where parents and young people stated that the EHC plan covered education, health and care needs they were more likely to have found it easy or very easy to agree on the needs and support described in the EHC plan (71% compared with 57% of cases where the EHC plan covered education needs only).
Parents and young people were also more likely to report difficulties in agreeing needs and support in cases were there was no previous SEN Statement (22% compared with 15% where the child/young person had a previous SEN Statement).
The ease or difficulty in agreeing the needs and support to be included in the EHC plan can clearly have a bearing on how long the overall process takes. Parents and young people who reported that the EHC plan was delivered within the 20-week timeframe were more likely to report that they found it easy or very easy to agree on the needs in the EHC plan (76% compared with 61% of parents and young people who reported the EHC plan process took 6-10 months and 40% who reported it took more than 10 months).
Similarly, parents and young people who made more than one request to get the EHC plan were more likely to report finding it difficult or very difficult to agree on the needs and support in the EHC plan (34% compared with 21% of those who got the EHC plan on the first attempt).
Parent and young people’s views on the ease of agreeing needs and support were also linked to their perceptions of the quality of the EHC plan:
7% 11% 12% 44% 17% 6%
2%
1%
How easy or difficult was it for you/your childto agree on the needs and support described
in the EHC plan?
Very Difficult Difficult Neither / nor EasyVery Easy Don't Know N/A Prefer not to say
Base: All parents and young people (13,643)
Easy: 62%Difficult: 17%

91
• Parents and young people who agreed the help/support in the EHC plan will achieve the agreed outcomes were more likely to have found it easy or very easy to agree on the needs and support described in the EHC plan (77% compared with 22% of parents and young people who disagreed that the EHC plan with achieve the agreed outcomes).
• Parents and young people who agreed the help/support in the EHC plan will help the child/young person achieve what they want to in life were more likely to have found it easy or very easy to agree on the needs and support in the EHC plan (75% compared with 26% of parents and young people who disagreed that the EHC plan will achieve this).
Some geographic variations were also evident in terms of perceived ease or difficulty in agreeing the help/support described in the EHC plan.
• Parents and young people in a local authority with no SEND Tribunal appeals were more likely to find it easy or very easy to agree on the needs described in the EHC plan (71% compared with 55% of those in areas with 5 or more SEND Tribunal appeals per 10,000 of the population aged 0-18).
• Parents and young people in the 20 per cent least deprived areas were more likely to report finding it difficult or very difficult to agree on the the needs and support in the EHC plan (21% compared with 14% of those in the 20 per cent most deprived areas).
3.6. Overall score for degree of ease or difficulty of the process of getting the EHC plan
This chapter has covered three key measues of how easy or difficult parents and young people found different stages of the process of getting the EHC plan:
• Ease of starting the process of getting an EHC plan;
• Ease of being involved in the process; and
• Ease of agreeing on the needs and support described in the EHC plan.
A combined ‘ease of the process’ score was generated for each respondent by combining parent and young people’s views on each of these three elements. A numerical value was assigned to the scale from 2 for ‘very easy’ to minus 2 for ‘very difficult’. The numerical values were then added together to generate a combined score across these three aspects of the process; the highest possible total score was 6 and the lowest was minus 6.

92
Parents and young people gave an average ‘ease of the process’ rating of 1.4 across the three questions, indicating that overall the process was found by parents and young people to be positive (Figure 3.10)
Figure 3.10: Combined score for each element of the EHC plan process
The combined scores for different subgroups of parents and young people are shown in the figure overleaf. A score above zero (i.e. a ‘plus’ score) indicates a positive experience overall: the larger the number and closer to 6, the ‘top’ score, the more positive the experience. A score below zero (i.e. a ‘minus’ score) indicates a negative experience overall, with the experience being more negative the larger the number and closer to minus 6 it is. A score of zero indicates a neither positive nor negative i.e. a neutral overall experience.
Agree strongly +2Agree +1Neither agree nor disagree 0Disagree -1Disagree strongly -2
Ease of starting the process of getting an EHC
plan
Ease of being involved in the process of getting an
EHC plan
Ease of agreeing the needs and support
described in the EHC plan
0.38 0.54 0.60
Ease of being involved in the process of getting an
EHC plan
1.4
COMBINED SCORE

93
Figure 3.11: Combined ‘ease of the process’ scores for subgroups of parents and young people
1.6
0.9
1.3
-0.8
2.6
1.1
-0.8
1.9
1.4
1.3
1.2
1.5
1.1
1.5
1.5
1.3
2.0
1.5
1.4
1.0
0.7
-6.0 -4.0 -2.0 0.0 2.0 4.0 6.0
SEN Statement in place previously
No SEN Statement previously
EHC plan received at first request
EHC plan required more than one request
EHC plan received within 20 weeks
EHC plan received after 6-10 months
EHC plan received after more than 10 months
Child aged under 5
Child/young person aged 5-10
Child/young person aged 11-15
Child/young person aged 16-25
20% most deprived areas
20% least deprived areas
Attend a specialist education setting
Attend a mixed education setting
Attend a mainstream education setting
EHC plan: education, health and care needs
EHC plan: education and care needs
EHC plan: education and health needs
EHC plan: education needs only
EHC plan: health needs and care needs
% of all EHC plans that subgroup accounts for<1%
34%
12%
13%
34%
39%
16%
37%
18%
24%
21%
34%
36%
8%
30%
27%
26%
5%
32%
63%
14%
Base: All parents and young people (13,643)

94
3.7. Inclusion of children and young people in the process To adhere to the principle of ‘Participating in decision making’ the SEND Code of Practice states that local authorities must ensure that children, their parents and young people are involved in discussions and decisions about their individual support and about local provision. This includes:
• Ensuring the child’s parents or the young person are fully included in the EHC needs assessment process from the start, are fully aware of their opportunities to offer views and information, and are consulted about the content of the EHC plan.
The survey included questions to better understand parent and young people’s experiences of being included in the EHC needs assessment and planning process. This section explores whether or not children and young people reported the following steps being taken to include them in the process:
• People making an effort to listen to the child/young person and to understand their opinions;
• The child/young person being included in meetings;
• The child/young person being asked if they wanted to take part in meetings;
• The child/young person being given choices of how to take part in meetings;
• Aids being offered to help the child/young person to take part – communication aids, visual aids, or the help of an advocate/supporter.
3.7.1. Taking steps to include the child/young person
Around half of parents and young people reported that effort had been made to listen to the child/young person and understand their views (58%) and that the child/young person had been included in meetings (51%). It was slightly less common for parents and young people to report the child/young person being asked if they wanted to take part (44%) and much less common for them to be given choices of how to take part (19%), as Figure 3.12 shows. On this final point, it is worth noting that a substantial minority (17%) said that giving the child/young person choices of how to take part was not applicable, suggesting they felt there was no need for such choices to be offered.

95
Figure 3.12: Whether or not steps were taken to include the child/young person in meetings and encourage their participation during the process of getting the EHC plan
The likelihood of all four of these steps having been taken increases with the age of the child/young person, as Table 3.5. shows. In around three-quarters of cases relating to plans for 16-25 year olds, parents and young people felt that efforts were made to listen to the young person and a similar proportion reported that the young person was included in meetings.
19%
44%
51%
58%
47%
36%
31%
22%
15%
14%
5%
12%
17%
1%
11%
1%
3%
6%
2%
7%
You were/your child was given choices ofhow to take part
You were/your child was asked if you/theywanted to take part in meetings
You were/your child was included in meetings
People made an effort to listen to you/yourchild and understand your/their opinions
Yes No Don't Know Not applicable Prefer not to sayBase: All parents and young people (13,643)

96
Table 3.5: Whether or not steps were taken to include the child/young person or parent in meetings and encourage their participation, by age of the child/young person
All Age of child/young person with
EHC plan
Under 5 5–10 11-15 16-25
% % % % %
Base: All parents and young people (13,643) (1,087) (4,931) (4,690) (2,935)
People made an effort to listen to you/your child and understand your/ their opinions
58 30 46 67 73
You/your child was included in meetings 51 22 32 62 76
You/your child was asked if you/they wanted to take part in meetings
44 16 25 55 68
You/your child were given choices of how to take part
19 7 12 24 26
Where the child/young person had a previous SEN Statement, parents and young people were more likely to report all four steps being taken than where there was no previous SEN Statement in place (made an effort to listen: 64% compared with 47%; included in meetings: 60% compared with 34%; asked if wanted to take part in meetings: 51% compared with 30%; given choices of how to take part: 23% compared with 11%). In part this reflects the relationship between age and having a previous SEN Statement (but even taking this into account there is still a difference between those who did and did not have a previous SEN Statement)66.
It was also more common for parents and young people from a white ethnic background to report an effort being made to listen to the child/young person and the child/young person being asked if they wanted to take part in meetings, than those from a BME background (60% compared with 54%; 45% compared with 39% respectively).
66 For example, if we take those aged under 5, those with a previous SEN Statement are more likely to report all four steps being taken than where there was no previous SEN Statement in place (made an effort to listen: 41% compared with 25%; included in meetings: 34% compared with 17%; asked if wanted to take part in meetings: 24% compared with 12%; given choices of how to take part: 13% compared with 4%). The same is true of those aged 5-10 (made an effort to listen: 49% compared with 44%; included in meetings: 37% compared with 26%; asked if wanted to take part in meetings: 29% compared with 21%; given choices of how to take part: 16% compared with 9%). Similar patterns are evident – albeit to a lesser extent – for those aged 11-15 (made an effort to listen: 69% compared with 65%; included in meetings: 64% compared with 55%; given choices of how to take part: 25% compared with 20%) and 16-25 (included in meetings: 77% compared with 69%).
97
Where the parent themselves stated that they had a learning difficulty or disability it was more common for them to report three of these steps being taken than where the parent had no learning difficulty or disability (included in meetings: 54% compared with 43%; asked if wanted to take part in meetings: 44% compared with 36%; given choices of how to take part: 22% compared with 16%).
Parents and young people who said that the EHC plan was delivered within the 20-week timeframe were more likely to report all four of these steps being taken than those saying that it took more than 10 months (made an effort to listen: 65% compared with 47%; included in meetings: 54% compared with 43%; asked if wanted to take part in meetings: 47% compared with 36%; given choices of how to take part: 22% compared with 13%).
However at the same time, parents and young people who had to make more than one request to get an EHC plan were more likely to report two of these steps being taken than those who got their EHC plan after the first request (included in meetings: 39% compared with 33%; asked if wanted to take part in meetings: 37% compared with 28%).
Parents and young people in a local authority area with no SEND Tribunal appeals were more likely to report two of these steps being taken than those in areas with more than 5 appeals per 10,000 of the population of 0-18 year-olds (included in meetings: 54% compared with 45%; given choices of how to take part: 22% compared with 15%).
3.7.2. Providing support
To get a sense of the extent to which the child/young person’s involvement in the EHC plan process had been facilitated, parents and young people were also asked whether support was offered to the child/young person during the process. Three forms of support were asked about: communication aids, visual aids or an ‘advocate’/supporter.
Figure 3.13 shows that it was most common for parents and young people to report that the child/young person was offered support from an ‘advocate’ – someone to help the child/young person make their views known (41%) – than for visual aids (21%) or communication aids (18%) to be used during the process of getting the EHC plan. For the most part, this is simply because higher proportions of parents and young people reported not needing visual aids (35%) or communication aids (38%) than not needing an advocate (17%).
For each type of support, around one in ten parents and young people reported that the support had been needed but had not been offered (an advocate: 12%, visual aids: 10%, communication aids:10%). This means that in between a quarter and a third of cases where there was a need for these types of support it was not offered.

98
Figure 3.13: Whether support was offered to the child/young person in the process of getting the EHC plan
Where the EHC plan process took longer or involved more than one request, parents and young people were more likely to find that they did not get support that they needed:
• Parents and young people who reported that the EHC plan process took more than 10 months were more likely to report needing, but not being offered support, than those reporting that it took within the 20-week timeframe (20% required but were not offered an advocate compared with 8%; 16% required but were not offered visual aids compared with 8%; 14% required but were not offered communication aids compared with 7%).
• Parents and young people who had made more than one request to get an EHC plan were more likely to report not being offered support than those who received their EHC plan after one request (22% required but were not offered an advocate compared with 12%; 17% required but were not offered visual aids compared with 11%; 15% needed but were not offered communication aids compared with 9%).
18%
21%
41%
10%
10%
12%
38%
35%
17%
31%
30%
28%
3%
3%
3%
Communication aids were used (e.g.electronic devices, picture communications
(PECS), sign language
Visual aids were used (e.g. pictures, symbols)
You were/your child was offered support fromsomeone, to help them make your/their views
known (an 'advocate' or 'supporter')
Yes No, and your child did need thisNo, and your child did not need this Don't know / Not applicablePrefer not to say
Base: All parents and young people (13,643)
No: 48%
No: 46%
No: 28%

99
Parents and young people in a local authority area with more than 5 appeals per 10,000 of the population of 0-18 year-olds were more likely to state that they needed but were not offered an advocate (14%, compared with 9% of those in areas with no SEND Tribunal appeals).
3.8. Experiences of working with professionals In previous sections we have reported on parent and young people’s views on the extent and nature of their involvement in the process of getting an EHC plan, and whether they felt that steps had been taken to aid the involvement of the child/young person during the EHC needs assessment and planning process. The survey also included questions to understand parent and young people’s views of the professionals and staff that they worked with.
The Children and Families Act 2014 and Care Act 2014 place requirements on local authorities to work in partnership and cooperation with other service providers – including education and training services and care and healthcare services – where it benefits the wellbeing of children and young people with SEND. Previous qualitative research conducted for the Department for Education67 found that parents tended to be more satisfied where the process built up a complete picture of the child/young person, in a manner that went beyond a purely academic context; while dissatisfaction was sometimes associated with a lack of meaningful input from Health and Social Services. The study also established that, while individual staff were a key factor in influencing whether parents were satisfied with their experience of the process, the skills and experience of staff deployed at key points of the process was variable from one service agency to another.
Parent’s and young people’s views on the professionals they worked with during the process are shown in Figure 3.14. Specifically, parents and young people were asked how knowledgeable staff were about the EHC plan process; and whether or not different services (i.e. education, health and care services) worked together to make the EHC plan.
67 Skipp & Hopwood (2016) Mapping user experience of the Education, Health and Care plan process: a qualitative study.

100
Figure 3.14: Parent and young people’s views on working with others throughout the process
Four-fifths of parents reported that the staff they were dealing with were knowledgeable about the process to some extent at least (82%). Over half (56%) reported that this was the case most or all of the time and just over a quarter (26%) that it was the case some of the time. Around one in eight parents and young people (13%) reported that staff were not knowledgeable about the process.
48%
56%
25%
26%
13%
13%
12%
4%
2%
2%
Different services (i.e. education, health andcare services) worked together to make the
EHC plan
The staff you were dealing with wereknowledgeable about the process
Yes, most or all of the time Yes, some of the time No Don't know Prefer not to say
Base: All parents and young people (13,643)
Base: All parents (10,675)
Yes: 82%
Yes: 74%

101
Parents and young people who found that getting an EHC plan took a long time or involved multiple requests were much less likely to find that staff were knowledgeable:
• Parents and young people who said that the EHC plan process took within the required 20-weeks were more likely to report that staff were knowledgeable (90%, compared with 68% of those saying that it took more than 10 months).
• Parents and young people who got their EHC plan after the first request were more likely to report that staff were knowledgeable than those who had to make more than one request to get an EHC plan (83% compared with 71%).
Where the EHC plan covered education, health and care needs, it was more common for the parent or young person to report that staff were knowledgeable (88%, compared with 80% of cases where the EHC plan covered education and health needs and 79% of cases where the EHC plan covered education needs only).
Parents and young people in a local authority area with no SEND tribunal appeals were more likely to report that staff were knowledgeable (88%, compared with 76% of those in areas with more than 5 appeals per 10,000 of the population of 0-18 year-olds).
Close to three-quarters of parents and young people reported that different services worked together to some extent at least (74%) (Figure 3.14). Just under half (48%) reported that this happened most or all of the time and a quarter (25%) that this happened some of the time.68
Where the EHC plan covered education, health and care needs, it was more common for the parent or young person to report that different services worked together (84%, compared with 75% of cases where the EHC plan covered education and health needs, 76% of cases where the EHC plan covered education and care needs, and 72% of cases where the EHC plan covered health and care needs).
Where the child/young person had no previous SEN Statement, parents and young people were more likely to report that different services worked together (82%, compared with 69% of those with a previous SEN Statement).
68 Skipp & Hopwood (2016) Mapping user experience of the Education, Health and Care plan process: a qualitative study found qualitative evidence from practitioners of various barriers to health and care providers engaging in the process, including limited process guidance for non-education based providers; a lack of organisational change to effectively include health and care within process delivery; and difficulties for health professionals in meeting the statutory deadlines for completing the EHC needs assessment process.

102
Parents and young people also felt that the different services worked together better for cases involving younger children than older ones as is shown in Table 3.6 below:
Table 3.6: Whether or not different services worked together to make the EHC plan, by age of the child/young person
All Age of child/young person with
EHC plan
Under 5 5 – 10 11-15 16-25
% % % % %
Base: All parents and young people (13,643) (1,087) (4,931) (4,690) (2,935)
Different services (i.e. education, health and care services) worked together to make the EHC plan
Yes, most or all of the time 48 62 54 44 41
Yes, some of the time 25 25 25 26 25
No 13 7 10 15 17
Don’t know 12 5 9 14 17
Prefer not to say 2 1 2 2 2
Some differences in perceptions were also evident by type of SEND. Where the child/young person’s primary special educational need was a multi-sensory impairment or a profound and multiple learning difficulty, it was more common for the parent or young person to report that different services worked together (86% and 81% respectively, compared with 74% of parents and young people overall).
Parents and young people who reported that the EHC plan process took within the required 20-weeks were more likely to report that different services worked together (81%, compared with 69% of those reporting that it took more than 10 months).

103
3.9. Summary
Starting the process
In nearly two-thirds of cases (63%), the child or young person had been transferred from having a Statement of SEN previously to an EHC plan.
Among those with no previous SEN Statement, around eight in ten (83%) got their EHC plan after their first request; for one in seven (15%), however, more than one request had been made.
Half (50%) of parents and young people found it very easy/easy to start the EHC plan process; however close to a quarter (23%) rated it as very difficult/difficult. Among those who had made more than one request to get an EHC plan, however, two-thirds (67%) felt that starting the process had been very difficult/difficult. Finding the process difficult to start was also more common among those without a previous SEN Statement: nearly two-fifths (38%) rated this as very difficult/difficult.
In cases where the parent/young person had no previous SEN Statement and initiated the process themselves, 53% found it difficult or very difficult to start the process, compared with 25% of cases where there was no SEN Statement in place and another party was involved in starting the process.
Length of the process
While the official data from local authorities show that most new EHC plans in 2015 were provided within the 20-week target, parents and young people who were able to give a timeframe reported that it was more common for the 20-week target to be missed (62%) than met (38%). The difference may reflect respondents and local authorities timing the process from different starting points, imprecisions in respondents’ estimates, and plans exempt from the 20-week timeframe being included in the survey data.
Where there was no previous SEN Statement in place, the process was more likely to take longer than the 20-week requirement: in these cases, nearly three-quarters of those able to give a timescale (72%) reported it taking longer than 20-weeks.
Experiences of being involved in the process
When asked a range of questions to establish whether they experienced the process as intended, parents and young people were most positive about it being easy to agree the EHC plan content (62% rated it as very easy/easy); about it being easy to be involved in the process overall (57% rated this as very easy/easy); about efforts being made to listen to the child/young person and understand their views (58% reported this being the case);

104
and about staff being knowledgeable about the process (56% said this had always or mostly happened).
They were least positive about steps being taken to help the child/young person understand what was happening and why (35% said this had always or mostly happened) and about the child/young person being given choices of how to take part in the process (only 19% said this had happened). Other findings also relate to a lack of tailoring to the individual child or young person: around one in ten parents and young people said they had needed some specific forms of support during the process but had not been offered them (an advocate: 12%, visual aids: 10%, communication aids:10%).
Characteristics associated with more positive or negative process experiences
Those with no SEN Statement previously in place were more likely to feel that starting the process had been very difficult/difficult; and to report the 20-week deadline being missed. Conversely, those who had transferred from a SEN Statement were more likely to rate involvement in the process as very easy/easy; and were more likely to report various steps being taken to include the child/young person in the process.
Where the 20-week EHC plan process deadline was met, it was more common to rate involvement in the process as very easy/easy; and views on a number of specifics (e.g. communication during the process, the amount of time and work involved) were more favourable. These parents and young people were more likely to report that staff involved had been knowledgeable about the process; that different services had worked together to make the EHC plan; and that it had been very easy/easy to agree on the EHC plan content.
Among older children/young people, it was more common to report steps being taken to include them in the process and their wishes/opinions being included in the EHC plan. Where the EHC plan addressed education, health and care needs, it was more common for the parent/young person to rate involvement in the process as very easy/easy; and again, views on a number of specifics – such as communication during the process and the amount of time and work involved – were also more favourable. These individuals were more likely to report that different services had worked together to make the EHC plan; and that it had been very easy/easy to agree on the EHC plan content.

105
4. Awareness of information, advice and support
4.1. Introduction This chapter looks at levels of awareness and uptake of a variety of information, advice and support services available to those going through the process of getting an EHC plan. The services discussed are:
• SEND Information, Advice and Support Service (IASS) – these services provide free, impartial information, advice and support, to children and young people with SEND, and their parents, about the SEND system to help them play an active and informed role in their education and care. Although funded by local authorities, Information, Advice and Support Services are run either at arm’s length from the local authority or by an independent (usually voluntary) organisation to ensure children, their parents and young people have confidence in them.
• The Local Offer – a comprehensive, accessible and up-to-date online resource provided by local authorities, setting out all the provision that they expect to be available for children and young people with SEND, including those who do not have an EHC plan in place.
• The Local Independent Supporter Service – an independent supporter is a person recruited locally by a voluntary or community sector organisation to help families going through the EHC needs assessment and planning process. Independent supporters act independently of the local authority and receive training to enable them to provide this support.
Parents and young people were asked whether they had heard of any of these information, advice and support services and whether they had used any of these – or other unspecified sources.
Young people and parents of children who have an EHC plan also have the right to request a Personal Budget69. This is an amount of money identified by the local authority to deliver provision set out in an EHC plan where the parent or young person is involved in securing that provision. The funds can be held directly by the parent or young person, or may be held and managed on their behalf by the local authority, school, college or other organisation or individual and used to commission the support specified in the EHC plan. Parents and young people were asked whether they were given the option of
69 The SEND Code of Practice: 0-25 years states that young people and parents of children who have EHC plans have the right to request a Personal Budget, which may contain elements of education, social care and health funding. It is the local authority’s responsibility to provide information about the option of having a Personal Budget – for example via the Local Offer.

106
having a Personal Budget and if they were, whether or not this option was taken up. To help distinguish the Personal Budget from other types of financial support, the survey included the following definition: “A Personal Budget is funding given to people with support needs (or to their carers) to give them more control over how their care and support is provided.”
The final part of the chapter looks at levels of awareness among parents and young people of the process for making a complaint, mediation services, and the process for appealing to a SEND Tribunal.
4.2. Awareness and receipt of information, advice and support
Previous qualitative research conducted for the Department for Education70 identified unbiased, independent support and advice as a key need for parents when dealing with a ‘stressful’ and ‘daunting’ process – particularly since it enabled parents to check from an independent source whether the process they were experiencing was ‘right’.
Parents and young people were asked if they were told that there was someone they could go to if they needed information, advice and support during the process of getting an EHC plan, and if so, whether they had received any such support.
Two-thirds (66%) of parents and young people were told there was someone they could go to if they needed information, advice and support during the process of getting an EHC plan. Of these, eight in ten (81%) went on to take up some form of information, advice and support. As shown in Figure 4.1, this equates to just over half (54%) of all parents and young people surveyed.
70 Skipp & Hopwood (2016) Mapping user experience of the Education, Health and Care plan process: a qualitative study.

107
Figure 4.1: Proportion of parents and young people who were told about and received information, advice and support during the process of getting an EHC plan
Figure 4.2 shows that the likelihood of a parent or young person being told about or receiving information, advice and support decreased as the age of the child/young person involved increased. The proportion of people told about information, advice and support was higher where the EHC plan was for a child aged under 5 compared to cases where it was for a young person aged 16-25 (74% compared with 57%).
Likewise, the proportion of people who actually used some form of information, advice and support was also higher where the EHC plan was for a child aged under 5 compared to where the EHC plan was for a young person aged 16-25 (64% compared with 45%). That said, the proportion of those who were told about information, advice and support who then went on to use it was very similar across all age groups. This suggests that the lower use of information, advice and support in cases involving older age groups is more a result of these parents and young people not being fully informed, rather than a lack of need or interest.
54%
66%
9%
23% 10%
34%
YesNoDon't knowPrefer not to sayNot told about where to go if needed information, advice, support
Base: All parents and young people (13,643)
Told about:
Received:

108
Figure 4.2: Whether or not the parent or young person was told about or received information, advice and support – by age of child
In cases where the child/young person did not previously have a SEN Statement in place, parents and young people were significantly more likely to report having used some form of information, advice and support (61% compared to 50% of cases who had transferred from a SEN Statement to an EHC plan).
As Table 4.1 shows, accessing information, advice and support was strongly associated with having a more positive experience of getting an EHC plan in terms of:
• Receiving the the EHC plan after the first request;
• Feeling that the time and work put into the process of getting an EHC plan was always or mostly reasonable;
• Perceptions that steps were taken most or all of the time to help the child/young person understand what took place and why;
• Finding it easy or very easy to be involved in the EHC plan process;
• Reporting that the family’s needs and circumstances were taken into account during the EHC plan process;
• Finding it easy to agree the needs and support described in the EHC plan;
• Reporting that staff were knowledgeable most or all of the time; and
• Reporting that different services worked together most or all of the time.
74% 71%65%
57%64%
60%
50%45%
Under 5 5 to 10 11 to 15 16 to 25Age of child/young person
Told aboutReceived
Base: All parents and young people (13,643)

109
Relatedly, parents and young people who were told about information, advice and support with the process were more likely to say they were offered an advocate (and conversely those who were not told about information, advice and support were more likely to say that they needed but were not offered an advocate for the child/young person).

110
Table 4.1: Characteristics associated with accessing information, advice and support during the EHC plan process
All Accessing information, advice and support Received
information, advice and
support
Told about support but
did not access it
Not told about
support at all
% % % %
Base: All parents and young people 13,643 7,319 1,271 3,172
EHC plan received after one request 71 83 86 80 76
Considered the amount of effort that parents had to put into the process to be reasonable72
51 60 50 31
Consider that steps were taken to help the child/young person understand what took place and why
35 45 30 16
Found it easy or very easy to be involved in the process 57 69 58 36
Agreed that the family’s needs and circumstances were taken into account during the process
48 60 45 26
Found it easy or very easy to agree the needs and support described in the EHC plan
62 72 61 42
Reported that staff were knowledgeable all or most of the time
56 67 51 33
Reported that different services worked well together all or most of the time
48 60 43 29
Needed but were not offered an advocate for the child/young person to participate fully in the process
12 7 12 24
71 Base is those not transferred from a SEN Statement (4,412). 72 Base is all parents (10,675).

111
4.2.1. Types of information, advice and support used
As well as a general question about whether they were signposted to information, advice and support (covered in the previous section), parents and young people were also asked about whether they had heard of and used specific services – the Information, Advice and Support Service (IASS), the Local Offer73, and the local Independent Supporter Service74 (Figure 4.3). Of these three services explored, awareness was highest for the SEND Information, Advice and Support Service (IASS). Over half (55%) of parents and young people had heard of IASS, two-fifths (43%) had heard of the Local Offer and one-fifth (20%) had heard of the local Independent Supporter Service.
IASS was also the most used service. One-quarter (26%) of parents and young people said they had used IASS. This compares with one in seven parents and young people who had made use of the Local Offer (14%) and one in fourteen (7%) who used the local Independent Supporter Service.
Figure 4.3: Proportions of parents and young people who have either heard of or used various sources of information, advice and support
73 The questionnaire contained the following explanatory text to define the Local Offer and aid survey respondent’s understanding: “The Local Offer (a document or website that from your local authority that tells you what help is available for children and young people with SEND)”. 74 During the cognitive testing phase, some parents mentioned that they had difficulties differentiating between the Information, Advice and Support Service (IASS) and the Independent Supporter Service (ISS). The final questionnaire included a definition of the IASS.
12%
7%
44%
7%
14%
26%
5%
7%
19%
20%
43%
55%
Prefer not to say
Don't know
None of these
The local Independent SupporterService
The Local Offer
SEND Information, Advice andSupport Service (IASS)
Heard ofUsed
Base: All parents and young people (13,643)

112
At an overall level:
• 36 per cent had heard of two or more services;
• 33 per cent had heard of only one of the services;
• 19 per cent had not heard of any of the three support services;
• 12 per cent did not know or preferred not to say
Almost half of all parents and young people had not used any of these three support options (44%). Three in ten (28%) had used one, and one in eleven (9%) had used two or more.
As shown in Table 4.2, the proportion of parents and young people who had not heard of any of the three support options was lower where the EHC plan was for a child/young person aged under 16 compared to where the EHC plan was for a young person aged 16-25 (16% compared with 29%).
Table 4.2: Number of sources of information, advice and support that parents and young people had heard of and used: split by the age of child/young person with the EHC plan
Age of child/young person with EHC plan
Heard of Used
All Under
16 16 – 25 All Under 16 16 – 25
% % % % % %
Base: All parents and young people
(13,643) (10,708) (2,935) (13,643) (10,708) (2,935)
None 19 16 29 44 41 54
One 33 33 30 28 29 21
Two or more 36 39 28 9 10 6
Reflecting this difference in levels of awareness, the proportion of parents and young people who had not used any sources of information, advice and support was lower where the EHC plan was for a child/young person aged under 16 compared to where the EHC plan was for a young person aged 16-25 (41% compared with 54%).

113
4.3. Information on and use of Personal Budgets As well as asking about awareness and use of information, advice and support services the survey also explored whether parents and young people had been given the option of a Personal Budget during the EHC plan process and whether or not this had been taken up. As noted previously, parents and young people have a right to request a Personal Budget; it is the local authority’s responsibility to provide information about the option of having a Personal Budget, though they do not have to offer a Personal Budget as part of the EHC plan process.
One-fifth (18%) of parents and young people reported being given the option of having a Personal Budget. Of these, nearly three in ten (28%) took up this offer: amounting to 5% of all parents and young people with an EHC plan (Figure 4.4).
Figure 4.4: Proportion of parents and young people who were given the option of having a Personal Budget and those who went on to take up the offer of a Personal Budget
Of the 82% of parents and young people who did not say they were given the option of having a Personal Budget, just under half (45% of all parents and young people) said definitively that this option was not given to them. The majority of the remaining parents and young people said they either didn’t know what a Personal Budget was (22% of all parents and young people) or did not know if they were given the option of having one (14%).
Personal Budgets were more commonly offered to, and subsequently taken up by, children and young people with certain types of SEND than others. Those with severe
5%
18%
12%
45% 22% 14%
82%
YesNoDon't know what a Personal Budget isDon't know if I or my child was given the option of having onePrefer not to sayNot told about where to go if needed information, advice, support
Base: All parents and young people (13,643)
Given the option:
Taken up:

114
learning difficulties (22% given the option; 9% taken up) and profound and multiple learning difficulties (30% given the option; 12% taken up) were more likely to have been offered or used a Personal Budget than parents and young people as a whole (18% given the option; 5% taken up).
4.4. Reviewing the EHC plan This chapter has so far reported on parent and young people’s awareness and use of different sources of information, advice and support – both general and specific – and of the offer of a Personal Budget. Another aspect of the EHC needs assessment and planning process that the survey asked about was the review of the EHC plan. Local authorities are required to review EHC Plans every 12 months to monitor the child or young person’s progress towards the outcomes specified. Reviews must take into account the views and feelings of the young person or parent and child75. According to previous qualitative research conducted for the Department for Education76, parents’ satisfaction with the process was influenced by whether or not there were clear monitoring and reviewing processes set out, and details of actions to take if they didn’t feel happy with how their EHC plan was being implemented.
The survey asked parents and young people if they had been told how the EHC plan will be reviewed. Just over half (54%) of parents and young people said they had been told this.
Parents of younger children were more likely to have been informed about the review process, as shown in Figure 4.5. The proportion of parents and young people informed about the review process was higher where the EHC plan was for a child aged under 5 compared to where the EHC plan was for a young person aged 16-25 (64% compared with 36%).
The proportion of those who said they were informed about how the EHC plan would be reviewed was lower for parents and young people who got an EHC plan following more than one request (58% compared with 66% for those who received it following their first request).
75 Children and Famlies Act 2014, Section 44. 76 Skipp & Hopwood (2016) Mapping user experience of the Education, Health and Care plan process: a qualitative study.

115
Figure 4.5: Proportion of respondents who were told how their EHC plan would be reviewed
4.5. Disagreement and complaints Parents and young people were also asked whether their local authority had informed them of the complaints and appeals procedures they could use, which ways of complaining or appealing they had heard about, and which they had used during the process of getting an EHC plan. Responses to these questions are covered in this section.
Just over half (54%) of parents and young people thought that they had been informed by the local authority about the complaints and appeals procedures that they could use if they were unhappy with any part of the process of getting an EHC plan.
As shown in Figure 4.6, the proportion of parents and young people who reported being informed about the complaints and appeals procedures was lower where the EHC plan was for a young person aged between 16 and 25 compared to for a child/young person aged under 16 (40% compared with 58%). In cases relating to older children/young people, it was more common for parents and young people to say that they were not informed about the complaints and appeals process and also that they didn’t know.
64% 62%
52%
36%
Under 5 5 to 10 11 to 15 16 to 25Age of child / young person
Base: All parents and young people (13,643)

116
Figure 4.6: Proportion of parents and young people who said they had been informed by their local authority about the complaints and appeals procedures
Parents and young people in local authority areas with no SEND Tribunal appeals were significantly less likely to report that they had been informed about complaints and appeals procedures they could use if unhappy with any part of the process (48% compared with 59% of those in local areas with 5 SEND Tribunal appeals per 10,000 in the 0-18 population).
58%
40%
27%34%
14%
25%
1% 1%
Under 16 16 to 25Age of child/young person who the EHC plan is for
Yes No Don't Know Prefer not to say
Base: All parents and young people (13,643)

117
4.5.1. Awareness and use of different complaints and appeals processes
A minority of parents and young people were aware of each of the different options for complaining or appealing during the process of getting the EHC plan77. Overall, awareness of the process for making a complaint was greater than either the mediation service or the process for appealing to a SEND Tribunal, as shown in Figure 4.7. Two-fifths (42%) of parents and young people said that they had been told about the process for making a complaint, 39% reported being told about the process for appealing to a SEND Tribunal and 31% had been told about the mediation service. Just over a quarter of parents and young people (28%) said they had been told about none of these options.
Figure 4.7: Proportions of parents and young people who were either told about or used various complaints and appeals channels and the mediation service
77 Note that this survey contacted parents and young people with an EHC plan and subsequently the complaints and appeals data reported will not reflect the views of those who had been refused an EHC needs assessment or plan at the time of the survey. A separate DfE research study explores the experiences of such parents and young people and the services provided to resolve SEND disagreements. See Cullen, M.A. et al (2017) Review of arrangements for disagreement resolution (SEND), Department for Education.
12%
9%
69%
5%
5%
5%
5%
17%
28%
39%
31%
42%
Prefer not to say
Don't know
None of these
The process for appealing to a SENDTribunal
The mediation service
The process for making a complaint
Told aboutUsed
Base: All parents and young people (13,643)

118
The proportion of parents and young people who actually used each of these complaints and appeals procedures and the mediation service was equal across all three - one in twenty (5%).

119
4.6. Summary In broad terms, awareness was highest for information, advice and support; was moderately high for complaints / appeals processes and the EHC plan review process; while the incidence of recalling being offered a Personal Budget was relatively low.
More specifically, two-thirds of parents and young people (66%) had been informed about the information, advice and support available during the EHC plan process. The majority of those informed (81%) had gone on to use it. Use of information, advice and support was associated with a more positive experience of the EHC plan process in a number of different ways. Awareness – and consequently usage – decreased with the age of the child. Of the specific sources available, awareness and usage were highest for IASS (55% aware; 26% used) and the Local Offer (43% aware; 14% used).
Fewer than one in five (18%) recalled being offered a Personal Budget; of those not given the option, over half (55%) felt certain they had not been offered one. Among those offered a Personal Budget, take-up was relatively low (28%).
Just over half (54%) said they had been told how they EHC plan would be reviewed. Awareness decreased with age of the child/young person; and was lower among those who had made more than one request to get an EHC plan.
Similarly, just over half (54%) said they had been informed by their local authority about the complaints and appeal procedures they could use if unhappy about the EHC plan process. Again, awareness decreased with the age of the child/young person.

120
5. Perceptions of the quality of the EHC plan EHC plans are intended to meet the needs of children and young people to secure the best possible outcomes and effectively prepare them for adulthood. This chapter examines parents’ and young people’s perceptions of the quality78 and impact of their EHC plan across four areas:
• The quality of the content in terms of understanding of the EHC plan, including the extent to which parents and young people felt their wishes and opinions were included in the EHC plan and the extent to which they agreed that it was easy to understand;
• Whether the EHC plan met two requirements relating to naming the nursery, school or college that parents and young people asked for during the process of drafting the EHC plan;
• The extent to which the EHC plan included preparations for the child/young person’s next move in life (e.g. to college, apprenticeship or work);
• The perceived impact of the EHC plan including the difference that the help and support outlined in the EHC plan had already made, and parent’s and young people’s views on what difference it is likely to make in the future; and
• Their views on the overall impact of the help and support outlined in the EHC plan.
It ends with a discussion about the subgroups that were more likely to agree with these indicators of perceived quality, with particular reference to how this differs according to how long the process of getting the EHC plan took79.
5.1. Views on the content of the EHC plan This section explores parents’ and young peoples’ views on the quality of the EHC plan in relation to the extent their wishes and opinions were included and their ratings of how easy the EHC plan was for them to understand.
78 The data collected in this survey reflects parent and young peoples’ perceptions of what took place during the EHC needs assessment and planning process rather than concrete facts, and may vary from the opinions of professionals and/or official statistics. 79 Please note that this is based on parent and young people’s own reports of how long it took to receive an EHC plan from the point at which the EHC plan was requested up to getting the EHC plan agreed.

121
The vast majority of parents agreed/strongly agreed that their wishes and opinions were included in the EHC plan (80%) whilst 8% disagreed/strongly disagreed (see Figure 5.1). Parents and young people were less likely to agree/strongly agree that the child/young person’s wishes and opinions had been taken into account (55%), and a slightly higher proportion disagreed/strongly disagreed (14%).
Figure 5.1: Extent to which parents’ and child/young persons’ wishes and opinions were included in the EHC plan
In cases where the child/young person was aged 11-15 or 16-25, parents and young people were more likely to agree that the child/young person’s wishes and opinions were included than in those where the child with the EHC plan was aged 5-10 or under 5 (62% and 70% compared with 44% and 29% respectively, as shown in Table 5.1).
Table 5.1: Agreement with statement about wishes and opinions, by age
Extent to which parents/young people agree that…
All Age of the child/young person with an EHC plan
Under 5 5-10 11-15 16-25
% % % % %
Base: All parents and young people (13,643) (1,087) (4,931) (4,690) (2,935)
The child/young persons’ wishes and opinions were included in the EHC plan
55 29 44 62 70
Base: all parents and young people (13,643)
Base: All parents and young people (13,643)
3%
5%8% 47% 33%
3%1%
Parents' wishes and opinions were includedin the EHC plan
5%8%12% 38% 16% 14%
5%
Child/young persons' wishes and opinionswere included in the EHC plan
Strongly Disagree Disagree Neither / nor AgreeStrongly Agree Don't Know Prefer not to say
Agree: 80%Disagree: 8%
Agree: 55%Disagree: 14%

122
Combining parent’s and children/young people’s responses about whether their wishes and opinions were included showed that in just over half of cases it was reported that both the wishes of the parent and the child/young person had been included in the EHC plan (52%). Over one-quarter of parents reported that only their wishes and opinions had been included in the EHC plan (28%) while in 17% of cases it was reported that neither the parents’ or child/young persons’ wishes were included.
Looking specifically at the child/young persons’ wishes and opinions, agreement that they had been included in the EHC plan was higher where the child/young person had a Statement of SEN in place before receiving their EHC plan compared with those that had not (60% compared with 45%).
Moving on to the ease of understanding the EHC plan, almost three-quarters of parents agreed that their child’s EHC plan was easy for them to understand (74%, 12% disagreed, see Figure 5.2).
A smaller proportion of parents and young people agreed that the EHC plan was easy for the child/young person to understand (26%), with more than one-third disagreeing (36%). Around one in six neither agreed nor disagreed (17%).
Again, levels of agreement were higher in cases where the EHC plan was for a child/young person in the upper age brackets, with the proportion agreeing that the EHC plan is easy to understand rising to 40% in cases were the young person was aged 16-25 (compared with 19% of cases involving 5-10 year olds and 29% of 11-15 year olds). However, even where the young person was aged 16-25, a significant proportion disagreed (32%, 11% disagreeing strongly).
Parents and young people were also asked about the extent to which children/young people understood what their EHC plan is for. Overall, 36% agreed and 29% disagreed, again with agreement higher where the EHC plan was for a young person aged 16-25 (53% compared with 24% of 5-10 year olds).

123
Figure 5.2: Extent to which the EHC plan is easy for the parent and child/young person to understand
Parents and young people were less likely to agree with these statements in cases where it took more than 10 months to get the EHC plan, compared to those that received their EHC plan within 20-weeks. The vast majority (89%) of parents who reported that the process of getting the EHC plan took up to 20-weeks agreed that their views were included in the EHC plan, compared to just over-two thirds (69%) of those reporting the process took over 10 months. This difference was also particularly prominent when examining parents’ responses about their own understanding of the EHC plan (85% among those that received the EHC plan within 20-weeks agreed compared with 62% of those where it took more than 10 months).
5.2. Meeting specific EHC plan requirements Parents and young people were also asked some more specific questions about the content of their EHC plan: whether their EHC plan named the nursery, school or college that parents and young people asked for during the process of drafting the EHC plan, and the extent to which it included preparations for the child/young person’s next move in life.
The Children and Families Act 2014 outlined that parents/young people have the right to request a particular school, college or other institution to be named in their EHC plan, and that their local authority must comply with this preference unless the education institution is unsuitable for the child/young person or if their attendance would be
Base: All parents and young people (13,643)
3%
8% 11% 50% 24%
3%1%
Your child's EHC plan is easy for you tounderstand
14% 22% 17% 20% 7% 16%
5%Your EHC plan is easy for you (thechild/young person) to understand
12% 17% 14% 26% 10% 16%
4%You/your child understands what the EHC
plan is for
Strongly Disagree Disagree Neither / nor AgreeStrongly Agree Don't Know Prefer not to say
Base: All parents (10,675)
Agree: 36%Disagree: 29%
Agree: 74%Disagree: 12%
Agree: 26%Disagree: 36%

124
incompatible with the efficient education of others or the efficient use of resources. Previous qualitative research conducted for the Department for Education80 identified this can be a source of tension within parents’ experiences of the process.
For the majority of parents and young people the nursery, school or college named in the EHC plan was the institution that they asked for during the process of drafting the EHC plan (78%, see Table 5.2). Just under one in 10 reported that the nursery, school or college named in their child’s EHC plan was not one that they asked for (9%) – more specifically:
• 4 per cent reported that the institution was not one they wanted at all,
• 3 per cent agreed another option,
• 2 per cent reported the education setting was their second or third choice, and
• Less than 1 per cent of parents decided that the best option was for their child to be educated at home.
Table 5.2: Whether the nursery, school or college named in the EHC plan was the one asked for during the drafting process
%
Base: All parents and young people (13,643)
Yes 78
No, it was the second or third choice 2
No, the named education institution was not wanted 4
No, and another option was agreed 3
No, and it was decided that the best option was for the child/young person to be educated at home
*
Don’t know 11
Prefer not to say 2
Where the child/young person was attending a specialist education setting, parents and young people were more likely to report that the EHC plan did not name the education provider that they asked for (11% compared with 6% in a mainstream setting and 9% in mixed provision).
80 Skipp & Hopwood (2016) Mapping user experience of the Education, Health and Care plan process: a qualitative study.

125
There were certain characteristics associated with the EHC plan not naming the nursery, school or college that the parent or young person had asked for during the drafting process. This was more common where the parent or young person:
• Had made more than one request to get the EHC plan (15% compared with 10% of those who did not);
• Reported that the process of getting the EHC plan took more than 10 months compared with those where the length of process took up to 20-weeks (15% compared with 7%); and/or
• Had not been told about or received information, advice and support during the process of getting their EHC plan compared to parents who did (14% compared with 7%).
These parents were also slightly more likely to be in a local authority with more than five SEND Tribunal appeals per 10,000 of the 0-18 population than the overall population (11% compared with 9%).
Conversely, in cases where the EHC plan named the nursery, school or college asked for during the drafting process, parents and young people were more likely to agree that the help/support described in the EHC plan will achieve the outcomes agreed (67% versus 44%); and more likely to be satisfied with the whole experience of getting the EHC plan (71% versus 43%).

126
5.2.1. Preparations for the future
Another key requirement of EHC plans is that they are forward looking and include preparation for important transition points in the child/young person’s life.The local authority is expected to ensure that every EHC plan review at Year 9 and thereafter includes a focus on preparing for adulthood81.
Three-fifths of parents and young people agreed that the EHC plan included preparations for the child/young person’s next move in life (e.g. to secondary school, college, apprenticeship or work) (60%), whilst 17 per cent disagreed (Figure 5.3).
Figure 5.3: Extent to which EHC plan includes preparations for the child/young person’s next move in life
Agreement was higher where the child/young person was aged 11-15 or 16-25 years old, compared to where the child was aged 5-10 (64% for 11-15 and 63% for 16-25 year olds compared with 55%). There were also a number of other notable subgroup differences:
• Agreement was higher where the child/young person had a Statement of SEN in place previously compared to those that did not have a SEN Statement (63% compared with 53%);
81 The SEND Code of Practice: 0-25 years
5%12% 11% 38% 22% 9%
3%
The EHC plan includes preparations foryour/your child's next move in life (e.g. to
college, apprenticeship or work)
Strongly Disagree Disagree Neither / nor AgreeStrongly Agree Don't Know Prefer not to say
Base: All parents and young people (13,643)
Agree: 60%Disagree: 17%

127
• Those with EHC plans covering education, health and care needs were more likely to agree than those with EHC plans covering education needs only (70% compared with 54%);
• Parents and young people in the 20 per cent most deprived neighbourhoods were more likely to agree, with the rate of agreement decreasing consistently with levels of deprivation (65% compared with 56% in the 20 per cent least deprived neighbourhoods).
5.3. Impact of the EHC plan The SEND Code of Practice emphasises that with high aspirations and the right support, the vast majority of children and young people can achieve success in adult life and outlines four key areas in which local authorities, education providers and their partners can help children/young people realise their ambitions: higher education and employment, independent living, participating in society, and being as healthy as possible in adult life82.
This section focuses on the extent to which parents and young people felt that the help and support outlined in the EHC plan had already made a difference, and their views on what the help and support may help to achieve in these four areas in the future.
5.3.1. Short-term impacts
Overall, the majority of parents and young people were positive about the help and support outlined in the EHC plan and the difference it had already made.
The majority of parents and young people agreed that the EHC plan had already made a difference to the child/young person getting the help and support that they need (73%) with one in nine disagreeing with this statement (11%), as shown in Figure 5.4.
Similarly, over two-thirds (67%) agreed that the help and support outlined in the EHC plan had improved the child/young person’s experience of education, whilst 12% disagreed. Parents and young people were more likely to agree where the child/young person was attending mainstream or mixed education settings (70% and 69% respectively compared with 65% where the child/young person was in a specialist education setting). Parents and young people were also more likely to agree in cases where the EHC plan named the nursery, school or college that they had asked for during
82 The SEND Code of Practice: 0-25 years

128
the drafting process compared to those that reported the EHC plan named another education institution (71% versus 50%).
Among those with EHC plans covering health needs, just under two-thirds agreed that the help and support in the EHC plan had improved the child/young person’s health or wellbeing (62%, 12% disagreed).
However, parents and young people were less likely to agree that the help/support in the EHC plan had helped them and their family to have the life they want to lead (46%) with one in five disagreeing (21%).
Figure 5.4: Extent to which the EHC plan has already made a difference to children/young people and their family
For all of these statements, parents and young people were more likely to agree if:
• Their EHC plan covered education, health and care needs, when compared to the average (80% agreed that the EHC plan has led to the child/young person getting the help and support they need compared with 73% of parents and young people overall);
• The process of getting the EHC plan took up to 20-weeks, compared to parents/young people who reported the process took longer;
• The child/young person did not have a Statement of SEN before receiving their EHC plan compared to those that did have a SEN Statement; and
3%
8% 19% 34% 29%
4%
3%
1%The help/support in the EHC plan has
improved your/your child's health/wellbeing
Strongly Disagree Disagree Neither / nor AgreeStrongly Agree Don't Know Not applicable Prefer not to say
7% 14% 22% 29% 17%5%
4%
1%The help/support in the EHC plan has helpedyou and your family have the life you want to
lead
5%8% 14% 34% 33%
5% 2%The help/support in the EHC plan has
improved your/your child's experience ofeducation
4%6%11% 38% 35%
4% 1%The EHC plan has led to the child getting the
help/support they need
Base: Respondents whose EHCP covers health needs (6,399)
Base: All parents and young people (13,643)

129
• Parents and young people lived in the 20 per cent most deprived neighbourhoods, with the rate of agreement decreasing consistently with levels of deprivation.
Parents and young people were also more likely to agree with the statements about the short term impact of the EHC plan if the child with the EHC plan was aged under 10 compared to those in the older age brackets (11-15 and 16-25), regardless of whether they had previously had a Statement of SEN or not (see Table 5.3).
Table 5.3: Agreement with statements about the extent to which the EHC plan has already made a difference, by age
Extent to which parents/young people agree that…
All Age of the child/young person with an EHC plan
Under 5 5-10 11-15 16-25
% % % % %
Base: All parents and young people (13,643) (1,087) (4,931) (4,690) (2,935)
The EHC plan has led to you/your child getting the help and support you/they need
73 84 80 69 61
The help/support in the EHC plan has improved your/your child’s experience of education
67 74 75 62 56
The help/support in the EHC plan has helped you and your family have the life you want to lead
46 54 51 41 44
Base: All parents and young people where the child/young person’s EHC plan covered health needs
(6,377) (628) (2,375) (2,079) (1,318)
The help/support in the EHC plan has improved your/your child’s health or wellbeing
62 67 70 58 54
The EHC plans that parents and young people were discussing had been in place for different lengths of time at the point when they were interviewed. Those whose plans were issued at the beginning of 2015 had had their plans for at least 18 months whereas those issued towards the end of 2015 had had their plans for closer to 6 months. It was more common for parents and young people who reported that the EHC plan had been put in place 12 or more months before the survey, to agree with all four statements on the short-term impacts of the EHC plan, compared with those who said the EHC plan had

130
been put in place less than 6 months before the survey (see Table 5.4). This is perhaps because there had been a longer time for them to observe the impact of the plan.
Table 5.4: Agreement with statements about the extent to which the EHC plan has already made a difference, by how long ago the EHC plan was put in place at the time of the survey
Extent to which parents/young people agree that…
All How long ago the EHC plan was put in place
Less than 6 months ago
6 – 11 months
ago
12 + months
ago
% % % %
Base: All parents and young people (13,643) (874) (1,800) (9,233)
The EHC plan has led to you/your child getting the help and support you/they need
73 61 70 75
The help/support in the EHC plan has improved your/your child’s experience of education
67 50 61 69
The help/support in the EHC plan has helped you and your family have the life you want to lead
46 41 40 47
Base: All parents and young people where the child/young person’s EHC plan covered health needs
(6,377) 412 866 4375
The help/support in the EHC plan has improved your/your child’s health or wellbeing
62 51 57 64
5.3.2. Future / longer-term impacts
Parents and young people were also asked for their views on the likely future impacts of the EHC plan for the child/young person. In comparison to their views on the short-term impacts of the EHC plan, parents and young people were less positive about what difference the EHC plan is likely to make in future and correspondingly more likely to report that they did not know what the future impact would be (see Figure 5.5).
Levels of agreement and disagreement were fairly consistent across all four statements, as was the proportion of neither agree nor disagree responses (ranging from 13%-15%).

131
For instance, parents and young people were most likely to agree that the EHC plan will improve the child/young person’s chances of fully participating in the wider community (57%, 12% disagreed) and a similar proportion agreed that the EHC plan will improve the child/young person’s chances of living independently in adult life (55%, 11% disagreed).
Just over half also agreed that their EHC plan will help identify the child/young person’s aspirations for the future (53%, 12% disagreed) whilst smaller but significant proportions neither agreed nor disagreed or did not know (14% and 16% respectively).
Parents and young people were least likely to agree that the EHC plan would improve the child/young person’s chances of getting paid or unpaid work (47%). A similar proportion to the above statements disagreed (13%) though a slightly larger proportion of parents and young people neither agreed nor disagreed or did not know (15% and 19%).
Figure 5.5: Perceptions on the future impact of the EHC plan
Agreement with all four of the statements about future impact of the EHC plan was lower among parents and young people where the child/young person with the EHC plan was older (see Table 5.5). For instance, agreement that the EHC plan is likely to improve the child/young person’s chances of fully participating in the wider community was lower where the EHC plan was for a young person aged 16-25 compared to where it was for a child aged under 5 (45% compared with 67%). This difference was equally marked in terms of agreement that the EHC plan is likely to improve the child/young person’s chances of living independently in adult life (44% of young people aged 16-25 compared with 62% of under 5 year olds). A previous qualitative study conducted for the
Base: All parents and young people (13,643)
4%9% 15% 31% 16% 19%
5%
1%Improve your/their chance of getting paid (or
unpaid) work
Strongly Disagree Disagree Neither / nor AgreeStrongly Agree Don't Know Not applicable Prefer not to say
3%9% 14% 36% 17% 16%
4%
1%
Identify your/their aspirations for the future
4%7% 13% 35% 20% 16%
4%
1%Improve your/their chances of living
independently in adult life
3%8% 14% 38% 19% 14%
3%
1%Improve your/their chances of fully
participating in the wider community

132
Department for Education83 found a number of possible explanations for this variation – including provision sometimes being perceived to be too basic for older young people, or later identification of needs having limited the progress that the young person was able to make.
Table 5.5: Agreement with statements about future impact of the EHC plan, by age
Extent to which parents/young people agree that the EHC plan will help…
All Age of the child/young person with an EHC plan
Under 5 5-10 11-15 16-25
% % % % %
Base: All parents and young people (13,643) (1,087) (4,931) (4,690) (2,935)
Improve the child/young person’s chances of fully participating in the wider community
57 67 65 54 45
Improve the child/young person’s chances of living independently in adult life
55 62 62 53 44
Identify the child/young person’s aspirations for the future
53 55 57 52 45
Improve the child/young person’s chance of getting paid (or unpaid) work
47 48 51 46 39
A pattern also appears when examining the rate of agreement according to levels of deprivation. At the first three statements, agreement was between seven and eight percentage points higher in the 20 per cent most deprived neighbourhoods (60%, 58%, 56% respectively) compared to the 20 per cent least deprived neighbourhoods (52%, 51%, 48% respectively), with the difference falling to six percentage points when parents and young people were asked about the extent to which the EHC plan will improve the their/their child’s chance of getting paid or unpaid work (50% agreed in the 20 per cent most deprived areas compared with 44% in the 20 per cent least deprived neighbourhoods).
83 Skipp & Hopwood (2016) Mapping user experience of the Education, Health and Care plan process: a qualitative study.

133
In addition, agreement was between 8 and 11 percentage points higher where the parent/young person reported that the whole process of getting an EHC plan had taken place within 20-weeks compared to those that reported it had taken more than 10 months, and 9 to 12 percentage points higher where the child/young person with the EHC plan had previously had no Statement of SEN compared with those that did (see Table 5.6).
Table 5.6: Agreement with statements about future impact of the EHC plan, by length of the process and whether a SEN Statement was previously in place
Extent to which parents/young people agree that the EHC plan will help…
All Length of the process
Whether or not had a SEN Statement previously
Up to 20
weeks
More than 10 months
No SEN Statement previously
Transfer from SEN Statement
% % % % %
Base: All parents and young people
(13,643) (3,714) (1,931) (4,112) (8,513)
Improve the child/young person’s chances of fully participating in the wider community
57 63 52 64 52
Improve the child/young person’s chances of living independently in adult life
55 61 51 62 51
Identify the child/young person’s aspirations for the future
53 59 48 58 49
Improve the child/young person’s chance of getting paid (or unpaid) work
47 52 44 53 43
Unlike the statements relating to the shorter-term impacts of the EHC plan, agreement on the future impacts of the EHC plan did not vary by how long ago the EHC plan was put in place.

134
5.4. Overall impact of the EHC plan This chapter has reported on different measures of the quality of the EHC plan, in terms of its content and also how impactful parents and young people felt the help/support described in the EHC plan would be in the short and longer term. Looking more broadly at the help and support outlined in the EHC plan, parents and young people were asked about their views about whether it will achieve the agreed outcomes and help the child/young person to achieve what they want to in life.
The majority of parents and young people agreed that the help and support outlined in the EHC plan will achieve the agreed outcomes (62%) whilst less than one in ten disagreed (9%, see Figure 5.6).
Agreement that the EHC plan will achieve the outcomes agreed was higher where the EHC plan was for a child/young person in the lower age brackets compared to 16-25 year olds (74% agreed where the child was aged under 5 compared with 49% in cases where the plans were for 16-25s). Agreement that the plan will achieve the agreed outcomes also varied by the length of the process of getting the EHC plan (71% where the process took up to 20-weeks compared with 53% where it took more than 10 months) as well as whether the child/young person had a Statement of SEN beforehand, regardless of the age of the child (58% compared with 69% where the child/young person did not previously have a SEN Statement).
Just over half agreed that the help and support outlined in the EHC plan will help the child/young person achieve what they want to in life (51%, 9% disagreed), with a significant proportion reporting that they did not know (21%).

135
Figure 5.6: Overall views on the help and support outlined in the EHC plan
The extent to which parents and young people agreed that the EHC plan will help them/their child to achieve what they want to in life also varied by the length of the process and the numbers and types of need covered by the EHC plan:
• Parents and young people who reported that the process of getting their EHC plan took up to 20-weeks were more likely to agree compared to those that reported it took more than 10 months (58% compared with 46%);
• Those with EHC plans covering education, health and care needs were more likely to agree than those with EHC plans covering education needs only (59% compared with 47%).
Agreement was higher where the young person with the EHC plan was aged 16-25 (55% compared with 48% of under 5 year olds). However, it is also worth noting that the views of this group were more polarised as they were also more likely to disagree that the EHC plan will help them/the young person to achieve what they want to in life (14% where the young person was aged 16-25 compared with the average of 9%).
In cases where the EHC plan named the nursery, school or college asked for during the drafting process, parents and young people were more likely to agree that the help/support described in the EHC plan will achieve the outcomes agreed (67% versus 44%); and more likely to agree that the help/support described in the EHC plan will help the child/young person achieve what they want to in life (54% versus 38%).
Base: All parents and young people (13,643)
4%
6% 15% 45% 17% 12%
1%
1%
Achieve the outcomes agreed
3%
5% 15% 35% 17% 21%
4%
Help you/your child achieve what you/theywant to in life
Strongly Disagree Disagree Neither / nor AgreeStrongly Agree Don't Know Not applicable Prefer not to say
Extent to which the help/support included in the EHCplan will…
Agree: 51%
Disagree: 9%
Disagree: 9%
Agree: 62%

136
5.5. Summary
Views on the content of the EHC plan
Views were particularly positive about the wishes and opinions of parents being included in the EHC plan, and the EHC plan being easy for parents to understand; but much less positive about the EHC plan being easy for the child/young person to understand, or the child/young person understanding what the EHC plan is for.
While the majority of parents (80%) agreed that their own wishes and opinions were included in the EHC plan, it was less common to agree that the wishes and opinions of the child or young person had been included (55%). Close to a fifth (17%) felt that neither the parent’s nor the child/young person’s wishes/opinions had been included.
Similarly, while the majority of parents (74%) agreed the EHC plan was easy for them to understand, it was much less common to agree that the EHC plan was easy for the child or young person to understand (26% of parents/young people) or to agree that the child or young person understands what the EHC plan is for (36% of parents/young people).
Meeting specific requirements of the EHC plan
The Children and Families Act 2014 requires that parents and young people be able to request that a particular nursery, school or college be named in their EHC plan. Eight in ten (78%) reported that the nursery, school or college named in their EHC plan was the one they asked for in the drafting process. In cases where the EHC plan named the nursery, school or college asked for during the drafting process, parents and young people were more likely to agree that the help/support described in the EHC plan will achieve the outcomes agreed (67% versus 44% of those whose plan did not name the institution asked for in the drafting process); and more likely to be satisfied with the whole experience of getting the EHC plan (71% versus 43%).
The EHC plan is also required to be forward-looking, including preparations for transition points in the child or young person’s life. Three-fifths of parents and young people (60%) agreed that their EHC plan includes preparations for their next move in life; 17% disagreed.
Impact of the EHC plan
Views on the likely impacts of the EHC plan tended to be relatively positive, albeit more so regarding shorter-term impacts experienced already than regarding anticipated future ones where parents and young people were more likely to answer neither agree nor disagree or ‘don’t know’.

137
Nearly three-quarters (73%) agreed that the EHC plan has resulted in the child/young person getting the help/support they need; two-thirds (67%) agreed it has improved the child/young person’s experience of education; and three-fifths of those whose EHC plan addressed health needs (62%) agreed it has improved the child/young person’s health or wellbeing.
Views were moderately positive regarding anticipated future impacts. Over half of parents and young people agreed that the EHC plan will improve the child/young person’s chances of fully participating in the wider community (57% agreed); of independent living in adult life (55% agreed); and identifying their aspirations for the future (53% agreed). Nearly half (47%) also agreed that it would improve their chances of getting paid (or unpaid) work.
Overall, three-fifths of parents and young people (62%) agreed the help and support set out in the EHC plan will achieve the outcomes agreed; and half (51%) agreed it will help the child/young person achieve what they want to in life.
Characteristics associated with more positive or negative perceptions of EHC plan quality
Those who had transferred from a SEN Statement previously were more likely to say that the EHC plan includes preparations for the child/young person’s next move in life; and there tended to be more positive perceptions of the likelihood of future outcomes being achieved among this group. There tended to be more positive perceptions of the outcomes already achieved amongst those with no SEN Statement.
Where the 20-week EHC plan process deadline was met, there tended to be more positive perceptions of both the outcomes already achieved; and the likelihood of future outcomes being achieved.
Among older children/young people, views on the impacts of the EHC plan were very mixed. While there were more positive perceptions of short-term impacts among those aged 16-25, there tended to be more negative perceptions of the likelihood of future outcomes being achieved among this group.
Where the EHC plan addressed education, health and care needs, it was more common for the parent/young person to report that the EHC plan included preparations for the child/young person’s next move in life. There also tended to be more positive perceptions of the outcomes already achieved by the EHC plan.

138
6. Conclusions This chapter briefly summarises the main conclusions that can be drawn from the research.
The overall experience
For the most part, the parents and young people surveyed had a generally positive view of the EHC needs assessment and planning process suggesting that it was working well for the majority. For instance, two-thirds were satisfied with the overall process and a similar proportion thought that their plan would achieve the outcomes agreed for the child or young person. Respondents were less sure about the process being a positive experience for the child/young person though: two-fifths felt it was positive, one in ten felt it was negative, with just over half being either neutral or unsure (i.e. said it was neither a positive nor negative experience or didn’t know). Furthermore, the proportion agreeing that it was a positive experience increased with the age of the child/young person.
Within the overall experience ratings there are some significant differences when comparing groups, in particular children compared to young people, those transferred from a SEN Statement compared to those entering a SEN assessment for the first time, and some local authorities when compared to the national average. These indicate points where the EHC process could have been experienced more equitably, yet on other measures, such as area deprivation, ethnicity and types of SEN, the overall satisfaction results were similarly positive.
Involvement in the process
Just under half of those not transferred from a SEN Statement found the EHC process easy to start, whilst two-fifths found this to be difficult.
Over eight in ten reported only making one request for an EHC plan, yet a substantial minority of parents and young people (one in seven of those with no prior SEN Statement in place) had to make more than one request. Making more than one request is associated with more negative experiences of the EHC needs assessment and planning process.
Reports of the 20-week plan completion deadline being missed were common, particularly among those not transferred from a SEN Statement. Where this deadline was met, parents and young people were more likely to report feeling positively about the process e.g. in terms of the ease of involvement in the process, amount of work involved and of agreeing the EHC plan content, and having more positive perceptions of outcomes.

139
While almost half of parents and young people agreed that their family’s personal needs and circumstances were taken into account in the process most or all of the time, for many parents and young people this only happened some of the time (over one in four) or not at all (over one in ten).
The process appeared to be working reasonably well in attempting to listen to the child/young person and understand their views, but it appears that tailoring of inclusion approaches to individual children/young people could be better. Around a fifth reported being given choices regarding how to take part, and around one in ten reported not having received the support they needed to participate (an advocate, or visual or communication aids) sometimes amounting to around a third with a need in this area.
Over six in ten parents and young people found it easy or very easy to agree on the needs and support described in the EHC plan. This proportion dropped significantly for those reporting that their plan was provided within 6-10 months or more.
Experiences of the process appeared to be most-aligned with the policy intentions where the EHC plan was perceived to address education, health and care needs. There is also evidence of more positive experiences of aspects of the process (such as it being easy to initiate, feeling the family’s needs and circumstances were taken into account, and experiencing different services working together to create the EHC plan) where the EHC plan was for a child aged under 5.
Awareness of information, advice and support
Just over half of parents and young people stated that they were told how the EHC plan would be reviewed. Parents of younger children were more likely to have been informed about the review process.
Just over half of all parents and young people received information, advice and support but those that did were more likely to report positive experiences across a number of different measures. Levels of use of IASS, the Local Offer and the local Independent Supporter Service were all relatively low.
Only 5 per cent of families had taken up a Personal Budget. Fewer than a fifth of families and young people reported being made aware that this was an option; among those offered a Personal Budget, 28% took up this offer.
Perceptions of the quality of the EHC plan
Overall, three-fifths of parents and young people agreed that the help/support described in the EHC plan will achieve the outcomes that they had agreed.

140
Views were particularly positive about the wishes and opinions of parents being included in the EHC plan, and the EHC plan being easy for parents to understand; but much less positive about the EHC plan being easy for the child/young person to understand, or the child/young person understanding what the EHC plan is for, however this seemed to reflect age of child/young person with respondents more likely to agree the older the child/young person was.
Views on the likely impacts of the EHC plan tended to be relatively positive, albeit more so regarding shorter-term impacts experienced already than regarding anticipated future ones. For each of the perceived short-term impact measures, the proportions providing positive answers decreased with the age of the child/young person. Where the EHC plan was in place for a young person aged 16-25, there tended to be more negative perceptions of the likelihood of future outcomes (fully participating in the community, having improved chances of living independently in adult life, identifying future aspirations and having improved chances of getting work) being achieved.
Discussion
The national survey results show that the EHC assessment and planning process and the resultant plans were working for the majority who received plans in 2015. The positive overall satisfaction rating based on the whole sample was broadly consistent in important subgroups including those in the most deprived areas, ethnic minorities and for those with different types of SEN. There were less positive results for some questions which tended to reflect higher levels of neutral or ‘don’t know’ responses rather than high proportions of negative answers. The views of these ‘neutral or dissatisfied’ families indicate where further progress can be made. For example, when answering an open question about what could have gone better, the most commonly raised points related to duration of process, meeting the child/young person’s needs and staff knowledge and advice.
Variability in results by geography and for particular groups also suggests where local areas should consider whether further development is required after accounting for progress since 2015 and 2016. These include: some difficulties starting the process for those not transferring from a SEN statement; communicating and meeting the 20-week timeframe; improving awareness and take-up of information advice and support; communicating how plans will be reviewed; involving children in the process, ensuring they understand the process and the resultant plan; and addressing the less positive perceptions of the process and impact of plans for those aged 16-25.

141
Appendix A – Questionnaire sent to parents
1
What is this? This questionnaire is for parents or carers of children and young people aged 0-15 years who have received an Education, Health and Care Plan (an “EHCP”). We want to learn about your experiences of getting an EHCP.
Why should I respond? Your views are very important as they will help the government understand how the process of getting an EHCP can be improved. This research is being done by IFF Research and the University of Derby for the Department for Education.
What is an EHCP? It is a legal document that describes how children’s education, health and social care needs will be met, to help them achieve agreed goals. For some, the EHCP will replace a statement of special educational needs.
Your experience of getting an Education, Health and Care Plan
Please answer the questions in relation to your child, or the child you care for, who is named on the covering letter.
This questionnaire is for you to complete as the parent or carer. Section H (starting on page 10) focuses on your child’s experiences. You can fill in Section H for your child or, if you prefer, you can ask them to answer it, or fill it in
together.
There are no right or wrong answers. If there are any questions you do not wish to answer or feel unable to answer then please leave these blank. The questionnaire will
take 10 to 15 minutes to complete.
The responses you give will be confidential. They will not be used publicly in any way that identifies you, your child’s school/college or your local authority. Completing the
survey will not impact on your child’s EHCP
Thank you for participating in this survey.
How to answer the questionnaire
For more information contact:
Dominic Thomson at IFF Research on 0800 0147 353 or at [email protected].
Michael Dale at the Department for Education on 0132 534 0493 or at [email protected].
It is possible to answer these questions in a different way, for example by completing a telephone interview. Please contact IFF Research using the contact details above if you would like to arrange this. ID: #########
P/C

142
2
Before we begin, we want to double check that the questionnaire is relevant to you.
Section A
years months
Q2. Roughly how long ago was this EHCP put in place? Please estimate and write in the boxes below
Please read the instructions about how to answer each question:
Most of the questions can be answered by ticking the box or boxes that apply to you, as shown here.
Q3. Did your child have a statement of special educational needs before they had an EHCP?Please tick one answer
Yes No Don’t know Prefer not to say
You don’t need to fill in the next section.
Please go to Section C on page 3.
Continue to Section B.
Q1. Do you have an Education, Health and Care Plan (EHCP) in place for your child? Please tick one answer
It sounds like you don’t need to fill in any more of this questionnaire. We might ask you to fill in a questionnaire another time, when you have an
EHCP in place for your child.
Please carry on and fill in this
questionnaire.
Yes Don’t knowNo

143
3
The next questions are about starting the process of getting an EHCP.
Section B
A health professional (e.g. health visitor, GP) approached my local authority about getting an EHCP
My child’s school approached me/my family about getting an EHCP
Other (please write in)
Don’t know
Prefer not to say
I made a request to my child’s school
I made a request to my local authority
My local authority approached me/my family about getting an EHCP
I made a request to a health professional (e.g. health visitor, GP)
My child made a request to the school, local authority or a health professional (e.g. health visitor, GP)
Q4. How did the process of getting the EHCP start? Please tick all that apply
Your views on taking part in the processThe next questions are about your experience of being part of the process of getting an EHCP.
Section C
Yes No Don’t know Prefer not to say
Please answer the next question
about information, advice and
support.
Please go to Question 8.
Q6. Were you told there was someone you could go to if you needed information, advice or support during the process of getting an EHCP?Please tick one answer
Yes, this was the first attempt
No, I’ve had to try three or more times
No, I’ve had to try twice Prefer not to say
Don’t know
Q5. Was this your first attempt to get an EHCP for this child?Please tick one answer

144
Q7. Did you receive any information, advice or support during the process of getting an EHCP?Please tick one answer
Yes No Don’t know Prefer not to say
Q8. Below are some sources of information, advice or support. Which of these have you heard of and which of these did you use (if any) during the process of getting an EHCP?Please tick all that apply, in each column
The Local Offer (a document or website from your local authority that tells you what help is available for children and young people with SEN)
Someone from the SEND Information, Advice and Support Service (SENDIASS, previously known as the Parent Partnership Service)
The local Independent Supporter Service
If you have used another source of support, please write in their role and the name of the organisation
…heard of this …used this
Or tick here if none of these apply
Tick here if you don’t know
4
c. Communication about the EHCP was clear throughout the process
b. Different services (i.e. education, health and care services) worked together to make the EHCP
Yes, most or all of the
time
Yes, some of the time
NoDon’t know
a. Your and your family’s personal needs and circumstances were taken into account in the process
Prefer not to say
Q9. To what extent did the following happen during the process of getting an EHCP?Please tick one answer for each row

145
e. The staff you were dealing with were knowledgeable about the process
Yes, most or all of the
time
Yes, some of the time
NoDon’t know
d. Steps were taken to help your child understand what took place and why
Prefer not to say
Q9 cont’d. To what extent did the following happen during the process of getting an EHCP?Please tick one answer for each row
f. The time and work that you had to put into getting an EHCP was reasonable
5
Q10. How long did the whole process take? (This is from the point at which the EHCP was requested, up to getting the EHCP agreed).Please tick one answer
Up to 20 weeks Around 8-10 months
Don’t know
Between 21 and 24 weeks/around
6 monthsAround 7 months
More than 10 months
Your views on the EHCPThe next questions are about what you think of the EHCP itself.
Section D
a. Your child’s EHCP is easy foryou to understand
Strongly agree
Agree Neither / nor
Disagree Strongly disagree
Don’t know
Q11. How much do you agree or disagree with the following statements about the EHCP?Please tick one answer for each row
b. The EHCP includes preparations for your child’s next move in life (e.g. to secondary school, college, apprenticeship or work)

146
6
Q14. A Personal Budget is funding given to people with support needs (or to their carers) to give them more control over how their care and support is provided.Were you given the option of having a Personal Budget?Please tick one answer
Yes No Don’t know what a Personal Budget is
Don’t know if I was given the option of having one
Please answer the next
question.Please go to Question 16.
Q15. Did you take up this Personal Budget?Please tick one answer
Yes No Don’t know
a. Your wishes and opinions were included in the EHCP
b. Your child’s wishes and opinions were included in the EHCP
Strongly agree
Agree Neither / nor
Disagree Strongly disagree
Don’t know
Not applicable
Q12. How much do you agree or disagree with the following statements about the EHCP?Please tick one answer for each row
Q13. During the process of drafting the EHCP, you were asked which nursery, school or college you would prefer your child to attend. Does the EHCP name the nursery, school or college that you asked for?Please tick one answer
Yes No, we agreed another option
Don’t know
No, the named nursery/school/college was our
second or third choice
No, we decided that the best
option was for my child to be educated at
home
No, the named nursery/school/college was not one we wanted

147
7
Your views on the likely impact of the EHCPThe next questions are about what you think the impacts of the EHCP are likely to be on you, your child and your family.
Section E
Q18. How much do you agree or disagree that the help/support described in the EHCP will achieve the outcomes you have agreed?(Outcomes are benefits or differences you are hoping to achieve). Please tick one answer
Strongly agree
Agree Neither/ nor
Disagree Strongly disagree
Don’t know
Not applicable
a. The EHCP has led to your child getting the help/support they need
b. The help/support in the EHCP has improved your child’s experience of education
c. The help/support in the EHCP has improved your child’s health or wellbeing
d. The help/support in the EHCP has helped you and your family to have the life you want to lead
Strongly agree
Agree Neither/ nor
Disagree Strongly disagree
Don’t know
Not applicable
Q17. How much do you agree or disagree with the following statements about what difference the EHCP has already made?Please tick one answer for each row
Q16. Have you been told how the EHCP will be reviewed?Please tick one answer
Yes No Don’t know

148
8
Disagreements and complaintsThe next few questions are about the mediation process and whether you knew how to appeal against the EHCP.
Section F
Q20. Were you informed by the local authority about the complaints and appeals procedures that you could use if you were unhappy with any part of the process?Please tick one answer
Yes No Don’t know
a. You think the EHCP will help to improve your child’s chances of living independently in adult life
b. You think the EHCP will help to improve your child’s chances of fully participating in the wider community
c. You think the EHCPwill help to improve your child’s chance of getting (paid or unpaid) work
d. You think the EHCP will help your child to identify their aspirations for the future
Strongly agree
Agree Neither/ nor
Disagree Strongly disagree
Don’t know
Not applicable
Q19. How much do you agree or disagree with the following statements about what difference the EHCP is likely to make in future?Please tick one answer for each row

149
9
Q23. Overall, how satisfied or dissatisfied are you with the whole experience of getting the EHCP? Please tick one answer
Very satisfied
Satisfied Neither / nor
Dissatisfied Very dissatisfied
Don’t know
Q21. Below are some ways of complaining or appealing. Which of these were you told about and which of these did you use (if any) during the process of getting an EHCP?Please tick all that apply, in each column
The process for making a complaint
The Mediation Service
The process for appealing to a Tribunal
…you were told about this
…you used this
Or tick here if none of these apply
Tick here if you don’t know
Your overall experience as a parent or carerIn the next few questions we would like you to sum up how you feel about your overall experience of getting the EHCP.
Section G
a. Start the process of getting an EHCP
b. Be involved in the overall process of getting an EHCP
c. Agree on the needs and support described in the EHCP
Very easy
Easy Neither/ nor
Difficult Very difficult
Don’t know
Not applicable
Q22. How easy or difficult was it to…?Please tick one answer for each row

150
10
Q26. Please let us know who has answered this section by ticking one answer below.Please tick one answer
The parent or carer on behalf of the young person
You, the young person the EHCP was created
for
You, the young person together with your parent or
carer
Section H Your child’s views The next few questions are about your child’s experience of getting an Education, Health and Care Plan (“EHCP”).
If you think they will be able to fill in this section themselves, then it is fine for you to ask them to answer it. Or, if you prefer, you could fill in this section with them.
If this isn’t possible, then please fill it in yourself, to tell us how youthink your child has experienced the process.
Q25. Thinking about your experience of getting the EHCP, what didn’t work well for you? Please write in
Q24. Thinking about your experience of getting the EHCP, what worked well for you? Please write in

151
a. You were offered support from someone, to help you make your views known (an ‘advocate’ or supporter)
c. Visual aids were used (e.g. pictures, symbols)
b. Communication aids were used (e.g. electronic devices, picture communications (PECS), sign language)
Yes
No, and you did
need this
No, and you didn’t
need this
Don’t know / not
applicable
Q28. And did the following things happen when you were taking part in the process of getting your EHCP?Please tick one answer for each row
Your child’s views
These questions are about your experience of taking part in the process of getting your EHCP.
11
Q29.Overall, how much do you agree or disagree that taking part in getting your EHCPwas a positive experience for you?Please tick one answer
Strongly agree
Agree Neither / nor
Disagree Strongly disagree
Don’t know
a. You were included in meetings
c. You were given choices about how to take part (e.g. attending in person, using a video, or online such as by Skype)
d. People made an effort to listen to and understand your opinions
Yes NoDon’t know
Not applicable
b. You were asked if you wanted to take part in meetings
Q27. Did the following happen when you were taking part in the process of getting your EHCP? (By “you”, we mean the child.)Please tick one answer for each row

152
a. You understand what the EHCP is for
b. The EHCP is easy for you to understand
c. Your wishes and opinions were included in the EHCP
Strongly agree
Agree Neither / nor
Disagree Strongly disagree
Don’t know
Q30. How much do you agree or disagree with the following statements about your EHCP?Please tick one answer for each row
12
Your child’s views
Thinking about the EHCP itself…
Your child’s views
The next question is about what effect you think your EHCP will have on your life.
If you are the child, please now ask your parent or carer to complete the next section of the questionnaire, or fill it in with them.
Q32. What is your home postcode?Please write in the boxes below
About you and your childThe final questions are for you, as the parent or carer, to fill in. They are about you and your child with an EHCP.
Section I
Q31. Overall, how much do you agree or disagree that the help and support included in the EHCP will help you achieve what you want to in life?Please tick one answer
Strongly agree
Agree Neither / nor
Disagree Strongly disagree
Don’t know

153
Q33. What is your child’s date of birth?Please write in the boxes below
D D M M YY
Q34. What is their gender?Please tick one answer
Male Female Other Prefer not to say
Q35. Which of the following best describes your child’s ethnic background?Please tick one answer
Any white background
White:
White and Black Caribbean
White and Black African
White and Asian
Mixed:
Indian
Pakistani
Bangladeshi
Asian or Asian British:
Any other Asian background
Caribbean
African
Any other Black background
Black or Black British:
Chinese
Prefer not to say
Chinese or other ethnic group:
Other (please write in)
Q36. What are your child’s special educational needs (e.g. autism, Down’s Syndrome, Prader-Willi etc.)? Please write in
13

154
14
Other (please write in)
Visual impairment or blindness
Severe learning difficulties (including having little or no speech, needing support with daily activities, needing life-long support)
Hearing impairment or deafness
Physical disability(e.g. issues with movement or other functions that impact on day-to-day life, cerebral palsy)
Profound and multiple learning difficulties (PMLD)
Autistic spectrum disorder(e.g. autism, Asperger’s syndrome)
Multi-sensory impairment (e.g. hearing and visual impairment)
Specific learning difficulty(e.g. dyslexia, dyspraxia)
Social, emotional and mental health issues
Speech, language and communication needs
Moderate learning difficulties(including basic literacy and numeracy skills, speech and language delay, problems concentrating, under-developed social, emotional and personal skills)
Prefer not to say
Don’t know
Q37. Does your child have special educational needs in any of the following areas?Please tick all that apply
a. Health needs
b. Social care needs
c. Education needs
Yes No Don’t know
Q38. Which of the following types of needs are covered by your child’s EHCP?Please tick one answer for each row

155
Other (please write in)
15
Young offenders’ institute
School or academy
Nursery / pre-school
Prefer not to say
Not in education
Don’t know
Play scheme or playgroup
Educated at home
College
Alternative provision e.g. pupil referral unit (PRU), e-learning centre
Q42. Are you the parent or carer of another dependent child or young person aged 0-25 years with a special educational need?Please tick one answer
Prefer not to sayYes No
Q41. Do you consider yourself to have a learning difficulty or disability?Please tick one answer
Prefer not to sayYes No Don’t know
Prefer not to say
Specialist (specifically for children with special educational needs)
Don’t know
Mixed specialist/mainstream (this means your child is in a mainstream school, college etc. but is sometimes taught separately in a base or facility specifically for children with special educational needs)
Mainstream
Q40. Is this school, college, or other educational setting your child is attending…Please tick one answer
Q39. What type of school, college, or other educational setting is your child attending now?Please tick one answer

156
16
Q43. The Department for Education may conduct follow up research about EHCPs. Would you be willing to take part in this follow up research? Please tick one answer
Yes No
What to do nextSimply return this questionnaire in the post using the pre-paid envelope provided. You do not need a stamp.
If you would like any more information about Education, Health and Care Plans, you can find information about your local Special Educational Needs and Disabilities Information Advice and Support Service by visiting www.iassnetwork.org.uk.
Thank you very much for taking part in this important survey.
Q45. We will be able to learn more about the EHCP reforms and how to improve services by linking your answers from these questions to other information that the Department for Education uses, for example your child’s examination results.
Like everything else you have told us, the information will be completely confidential and used for research purposes only. Names and addresses are never included in the results and no individual will be identified from the research.
Do you give permission for your answers to be linked to other information the Department for Education uses?Please tick one answer
Yes No
Q44. IF YES at Q43, please can you (the parent/carer) provide a mobile number, a landline number and your email address, so you can be contacted?
Please write in your landline number(s), including the area code:
Please write in your mobile number(s):
Please write in your email address:

157
Appendix B – Questionnaire sent to young people
1
What is this? This questionnaire is for young people aged 16 and over who have received an Education, Health and Care Plan (an “EHCP”). We want to learn about your experiences of getting an EHCP.
Why should I respond? Your views are very important as they will help the government understand how the process of getting an EHCP can be improved. This research is being done by IFF Research and the University of Derby for the Department for Education.
What is an EHCP? It is a legal document that describes how young people’s education, health and social care needs will be met, to help them achieve agreed goals. For some, the EHCP will replace a statement of special educational needs.
Your experience of getting an Education, Health and Care Plan
This questionnaire is for you to complete but you can fill it in with help from someone else like a parent or carer. If you prefer, your parent or carer can complete it instead.
There are no right or wrong answers. If there are any questions you do not wish to answer or feel unable to answer then please leave these blank. The questionnaire will
take 10 to 15 minutes to complete. Completing the survey will not impact on your EHCP.
The responses you give will be confidential. They will not be used publicly in any way that identifies you, your school/college or your local authority.
Thank you for participating in this survey.
How to answer the questionnaire
For more information contact:
Dominic Thomson at IFF Research on 0800 0147 353 or at [email protected].
Michael Dale at the Department for Education on 0132 534 0493 or at [email protected].
It is possible to answer these questions in a different way, for example by completing a telephone interview. Please contact IFF Research using the contact details above if you would like to arrange this. ID: #########
Please read the instructions about how to answer each question:
Most of the questions can be answered by ticking the box or boxes that apply to you, as shown here.
YP

158
3
Q2. Do you have an Education, Health and Care Plan (EHCP) in place? Please tick one answer
It sounds like you don’t need to fill in any more of this questionnaire. We might ask you to fill in a questionnaire
another time, when you have an EHCP in place.
Please carry on and fill in this
questionnaire.
Yes Don’t knowNo
Before we begin, we want to double check that the questionnaire is relevant to you.
Section A
Q3. Roughly how long ago was this EHCP put in place? Please estimate and write in the boxes below
years months
Q1. Please let us know who is answering this questionnaire by ticking one answer below.Please tick one answer
You, the young person the EHCPwas created for
You, the young person together with your
parent or carer
The parent or carer on behalf of the young
person
If you are the parent or carer answering the questionnaire on
behalf of the young person, please try to answer the questions from the young person’s point of view.
Q4. Did you have a statement of special educational needs before you had an EHCP?Please tick one answer
Yes No Don’t know Prefer not to say
You don’t need to fill in the next section.
Please go to Section C on page 4.
Continue to Section B.

159
4
The next questions are about starting the process of getting an EHCP.
Section B
Q5. How did the process of getting the EHCP start? Please tick all that apply
A health professional (e.g. GP) approached my local authority about getting an EHCP
My school approached me/my family about getting an EHCP
Other (please write in)
Don’t know
Prefer not to say
I made a request to my school/college
I made a request to my local authority
My local authority approached me/my family about getting an EHCP
I made a request to a health professional (e.g. GP)
My parent made a request to the school, local authority or a health professional (e.g. GP)
Your views on taking part in the processThe next questions are about your experience of being part of the process of getting an EHCP.
Section C
Q7. Were you told there was someone you could go to if you needed information, advice or support during the process of getting an EHCP?Please tick one answer
Yes No Don’t know Prefer not to say
Please answer the next question
about information, advice and
support.
Please go to Question 9.
Yes, this was the first attempt
No, I’ve had to try three or more times
No, I’ve had to try twice Prefer not to say
Don’t know
Q6. Was this your first attempt to get an EHCP?Please tick one answer

160
Q8. Did you receive any information, advice or support during the process of getting an EHCP?Please tick one answer
Yes No Don’t know Prefer not to say
d. Steps were taken to help you understand what took place and why
5
Yes, most or all of the
time
Yes, some of the time
NoDon’t know
Prefer not to say
b. Different services (i.e. education, health and care services) worked together to make the EHCP
c. Communication about the EHCPwas clear throughout the process
a. Your and your family’s personal needs and circumstances were taken into account in the process
Q10. To what extent did the following happen during the process of getting an EHCP?Please tick one answer for each row
Q9. Below are some sources of information, advice or support. Which of these have you heard of and which of these did you use (if any) during the process of getting an EHCP?Please tick all that apply, in each column
The Local Offer (a document or website from your local authority that tells you what help is available for children and young people with SEN)
Someone from the SEND Information, Advice and Support Service (SENDIASS, previously known as the Parent Partnership Service)
The local Independent Supporter Service
If you have used another source of support, please write in their role and the name of the organisation
…heard of this …used this
Or tick here if none of these apply
Tick here if you don’t know

161
a. You were included in meetings
b. You were asked if you wanted to take part in meetings
c. You were given choices about how to take part (e.g. attending in person, using a video, or online such as by Skype)
d. People made an effort to listen to and understand your opinions
Yes NoDon’t know
Not applicable
Q11. Did the following happen when you were taking part in the process of getting your EHCP? (By “you”, we mean the young person.)Please tick one answer for each row
6
a. You were offered support from someone, to help you make your views known (an ‘advocate’ or supporter)
c. Visual aids were used (e.g. pictures, symbols)
b. Communication aids were used (e.g. electronic devices, picture communications (PECS), sign language)
Yes
No, and you did
need this
No, and you didn’t
need this
Don’t know / not
applicable
Q12. And did the following things happen when you were taking part in the process of getting your EHCP?Please tick one answer for each row
Q13.Overall, how much do you agree or disagree that taking part in getting your EHCPwas a positive experience for you?Please tick one answer
Strongly agree
Agree Neither / nor
Disagree Strongly disagree
Don’t know

162
7
Your views on the EHCPThe next questions are about what you think of the EHCP itself.
Section D
Q14. How long did the whole process take? (This is from the point at which the EHCP was requested, up to getting the EHCP agreed).Please tick one answer
Up to 20 weeks
Around 8-10 months
Don’t know
Between 21 and 24 weeks/around
6 monthsAround 7 months
More than 10 months
a. You understand what your EHCP is for
b. Your EHCP is easy for you to understand
Strongly agree
Agree Neither / nor
Disagree Strongly disagree
Don’tknow
c. Your wishes and opinions were included in the EHCP
d. The EHCP includes preparations for your next move in life (e.g. to college, apprenticeship or work)
Q15. How much do you agree or disagree with the following statements about the EHCP?Please tick one answer for each row
Q16. During the process of drafting the EHCP, you were asked which school or college you would prefer to attend. Does the EHCP name the school or college that you asked for?Please tick one answer
Yes
No, I agreed
another option
Don’t know
No, the named school/college was
my second or third choice
No, I decided that the best option was
to be educated at home
No, the named school/
college was not one I wanted

163
8
Q17. A Personal Budget is funding given to people with support needs (or to their carers) to give them more control over how their care and support is provided.Were you, or your parent/carer, given the option of having a Personal Budget?Please tick one answer
Yes No Don’t know what a Personal Budget is
Don’t know if I was given the option of having one
Please answer the next
question.Please go to Question 19.
Q18. Did you or your parent/carer take up this Personal Budget?Please tick one answer
Yes No Don’t know
Your views on the likely impact of the EHCPThe next questions are about what you think the impacts of the EHCP are likely to be on you and your family.
Section E
a. The EHCP has led to you getting the help/support you need
b. The help/support in the EHCP has improved your experience of education
c. The help/support in the EHCP has improved your health or wellbeing
Strongly agree
Agree Neither/ nor
Disagree Strongly disagree
Don’t know
Not applicable
Q19. Have you been told how the EHCP will be reviewed?Please tick one answer
Yes No Don’t know
Q20. How much do you agree or disagree with the following statements about what difference the EHCP has already made?Please tick one answer for each row

164
9
Q21. How much do you agree or disagree that the help/support described in the EHCP will achieve the outcomes you have agreed?(Outcomes are benefits or differences you are hoping to achieve). Please tick one answer
Strongly agree
Agree Neither/ nor
Disagree Strongly disagree
Don’t know
Not applicable
a. You think the EHCP will help to improve your chances of living independently in adult life
b. You think the EHCP will help to improve your chances of fully participating in the wider community
c. You think the EHCPwill help to improve your chance of getting (paid or unpaid) work
d. You think the EHCP will help you to identify your aspirations for the future
Strongly agree
Agree Neither/ nor
Disagree Strongly disagree
Don’t know
Not applicable
Q22. How much do you agree or disagree with the following statements about what difference the EHCP is likely to make in future?Please tick one answer for each row
Q20 cont’d. How much do you agree or disagree with the following statements about what difference the EHCP has already made?Please tick one answer
d. The help/support in the EHCP has helped you and your family to have the life you want to lead
Strongly agree
Agree Neither/ nor
Disagree Strongly disagree
Don’t know
Not applicable

165
10
Disagreements and complaints The next questions are about the mediation process and whether you knew how to appeal against the EHCP.
Section F
Q23. Were you informed by the local authority about the complaints and appeals procedures that you could use if you were unhappy with any part of the process?Please tick one answer
Yes No Don’t know
Q24. Below are some ways of complaining or appealing. Which of these were you told about and which of these did you use (if any) during the process of getting an EHCP?Please tick all that apply, in each column
The process for making a complaint
The Mediation Service
The process for appealing to a Tribunal
…you were told about this
…you used this
Or tick here if none of these apply
Tick here if you don’t know
Your overall experience In the next few questions we would like you to sum up how you feel about your overall experience of getting the EHCP.
Section G
a. Start the process of getting an EHCP
b. Be involved in the overall process of getting an EHCP
c. Agree on the needs and support described in the EHCP
Very easy
Easy Neither/ nor
Difficult Very difficult
Don’t know
Not applicable
Q25. How easy or difficult was it to…?Please tick one answer for each row

166
11
Q27. Overall, how satisfied or dissatisfied are you with the whole experience of getting the EHCP? Please tick one answer
Very satisfied
Satisfied Neither / nor
Dissatisfied Very dissatisfied
Don’t know
Q29. Thinking about your experience of getting the EHCP, what didn’t work well for you? Please write in
Q28. Thinking about your experience of getting the EHCP, what worked well for you? Please write in
Strongly agree
Agree Neither / nor
Disagree Strongly disagree
Don’t know
Q26. Overall, how much do you agree or disagree that the help and support included in the EHCP will help you achieve what you want to in life?Please tick one answer

167
12
About youThe final questions are for you, the young person with an EHCP.
Section I
Q32. What is your gender? Please tick one answer
Male Female Other Prefer not to say
Q31. What is your date of birth?Please write in the boxes below
D D M M YY
Q30. What is your home postcode? (By “you”, we mean the young person.)Please write in the boxes below
Any other Asian background
Any other Black background
Other (please write in)
Any white background
White:
White and Black Caribbean
White and Black African
White and Asian
Mixed:
Indian
Pakistani
Bangladeshi
Asian or Asian British:
Caribbean
African
Black or Black British:
Chinese
Prefer not to say
Chinese or other ethnic group:
Q33. Which of the following best describes your ethnic background?Please tick one answer

168
13
Q34. What are your special educational needs (e.g. autism, Down’s Syndrome, Prader-Willi etc.)? Please write in
Q35. Do you have special educational needs in any of the following areas?Please tick all that apply
Other (please write in)
Visual impairment or blindness
Severe learning difficulties (including having little or no speech, needing support with daily activities, needing life-long support)
Hearing impairment or deafness
Physical disability(e.g. issues with movement or other functions that impact on day-to-day life, cerebral palsy)
Profound and multiple learning difficulties (PMLD)
Autistic spectrum disorder(e.g. autism, Asperger’s syndrome)
Multi-sensory impairment (e.g. hearing and visual impairment)
Specific learning difficulty(e.g. dyslexia, dyspraxia)
Social, emotional and mental health issues
Speech, language and communication needs
Moderate learning difficulties(including basic literacy and numeracy skills, speech and language delay, problems concentrating, under-developed social, emotional and personal skills)
Prefer not to say
Don’t know

169
Other (please write in)
Q37. What type of school, college, or other educational setting are you attending now?Please tick one answer
Young offenders’ institute
School or academy
Prefer not to say
Not in education
Don’t know
Educated at home
College
Alternative provision e.g. pupil referral unit (PRU), e-learning centre
University / higher education
Q38. Is this school, college, or other educational setting you are attending…Please tick one answer
Prefer not to say
Specialist (specifically for young people with special educational needs)
Don’t know
Mixed specialist/mainstream (this means you are in a mainstream school, college etc. but are sometimes taught separately in a base or facility specifically for young people with special educational needs)
Mainstream
14
a. Health needs
b. Social care needs
c. Education needs
Yes No Don’t know
Q36. Which of the following types of needs are covered by your EHCP?Please tick one answer for each row

170
15
Q41. We will be able to learn more about the EHCP reforms and how to improve services by linking your answers from these questions to other information that the Department for Education uses, for example your examination results.
Like everything else you have told us, the information will be completely confidential and used for research purposes only. Names and addresses are never included in the results and no individual will be identified from the research.
Do you give permission for your answers to be linked to other information the Department for Education uses?Please tick one answer
Yes No
Q40. IF YES at Q39, please can you provide a mobile number, a landline number and your email address, so you can be contacted?
Please write in your landline number(s), including the area code:
Please write in your mobile number(s):
Please write in your email address:
What to do nextSimply return this questionnaire in the post using the pre-paid envelope provided. You do not need a stamp.
If you would like any more information about Education, Health and Care Plans, you can find information about your local Special Educational Needs and Disabilities Information Advice and Support Service by visiting www.iassnetwork.org.uk
Thank you very much for taking part in this important survey.
Q39. The Department for Education may conduct follow up research about EHCPs. Would you be willing to take part in this follow up research? Please tick one answer
Yes No

171
Appendix C – Initial and reminder letters sent to parents and young people

172

173

174

175

176
Appendix D – FAQs enclosed with letter

177
Appendix E – Number of responses by local authority The table below sets out the ranges of the number of survey responses received by local authority. Local authority data presented in this report excludes local authorities with less than 50 survey completions.
More than 200 survey responses received per local authority Kent Hertfordshire Hampshire Leicestershire Surrey Cumbria Lincolnshire Essex Birmingham Cambridgeshire Leeds Lancashire West Sussex Durham More than 100 survey responses received per local authority Wiltshire Gloucestershire Manchester Derbyshire North Yorkshire Nottinghamshire Northamptonshire Oxfordshire Worcestershire Milton Keynes Norfolk Medway Cornwall Staffordshire Stockport Buckinghamshire East Sussex Bradford Shropshire Plymouth Cheshire West and Chester Bristol City of Croydon

178
Warwickshire 100 to 50 survey responses received per local authority Warrington Calderdale Wirral Sunderland Southwark Suffolk Gateshead Cheshire East Hillingdon Kirklees West Berkshire Lambeth South Gloucestershire York Bath and North East Somerset Rotherham Brent Redbridge Wigan Barnet Bournemouth Torbay Walsall Bexley Southend-on-Sea Bedford Devon Bolton Rochdale Wakefield East Riding of Yorkshire Derby Stockton-on-Tees Bromley Ealing Liverpool Bury Northumberland Trafford Sutton Greenwich Harrow Redcar and Cleveland

179
Newcastle upon Tyne Enfield Havering Hackney Lewisham Somerset Dorset Tower Hamlets Brighton and Hove Dudley Leicester South Tyneside Isle of Wight Waltham Forest Coventry Swindon Haringey Luton Nottingham Sandwell Stoke-on-Trent Wokingham Sheffield Wandsworth Central Bedfordshire Hounslow North Tyneside Richmond upon Thames Less than 50 survey responses received per local authority Solihull Knowsley North Lincolnshire Barnsley Merton Sefton Camden Herefordshire Portsmouth Salford Bracknell Forest Kingston upon Thames Southampton Doncaster North East Lincolnshire Thurrock

180
Blackburn with Darwen Telford and Wrekin Peterborough Tameside Islington Kingston upon Hull City of Wolverhampton Blackpool Middlesbrough Barking and Dagenham Newham Reading Slough Halton Windsor and Maidenhead North Somerset St. Helens Poole Oldham Darlington Hartlepool Hammersmith and Fulham Westminster Rutland Kensington and Chelsea Isles Of Scilly City of London

181
Appendix F – Measures of perceived quality of plan by local authority with confidence levels Two local authorities have had their data blanked for anonymity reasons (base below 3).
ꜝ Low base - exercise caution when interpreting results
Local authority Unweighted total Total
Satisfaction of parent/child/young person with the whole experience of getting the
EHC plan
Satisfied Dissatisfied
Value Upper Bound
Lower Bound Value Upper
Bound Lower Bound
Unweighted row 13643 13643 8970 2128 Total 13643 13642 8999 2080 66% 67% 65% 15% 16% 14% Barking and Dagenham 31ꜝ 31 25 1 80% 92% 68% 3% 8% 0% Barnet 78 80 45 11 56% 66% 46% 14% 21% 7% Barnsley 45ꜝ 49 30 10 60% 73% 47% 21% 32% 10% Bath and North East Somerset 81 71 50 6 71% 79% 63% 9% 14% 4% Bedford 75 69 47 10 69% 78% 60% 14% 21% 7% Bexley 76 59 34 14 58% 67% 49% 23% 31% 15% Birmingham 244 317 199 55 63% 68% 58% 17% 21% 13% Blackburn with Darwen 36ꜝ 61 45 5 75% 88% 62% 9% 18% 0% Blackpool 33ꜝ 45 34 3 76% 89% 63% 6% 13% 0% Bolton 74 78 58 6 74% 83% 65% 8% 13% 3% Bournemouth 78 78 54 11 69% 78% 60% 14% 21% 7% Bracknell Forest 42ꜝ 42 25 4 60% 73% 47% 10% 18% 2% Bradford 125 119 86 15 72% 79% 65% 12% 17% 7% Brent 80 97 61 14 63% 72% 54% 15% 22% 8% Brighton and Hove 61 56 35 12 62% 73% 51% 22% 31% 13%

182
Local authority Unweighted total Total
Satisfaction of parent/child/young person with the whole experience of getting the
EHC plan
Satisfied Dissatisfied
Value Upper Bound
Lower Bound Value Upper
Bound Lower Bound
Bristol City of 104 100 65 20 65% 73% 57% 20% 27% 13% Bromley 69 65 45 9 69% 78% 60% 14% 21% 7% Buckinghamshire 127 98 69 13 70% 77% 63% 13% 18% 8% Bury 68 96 65 5 67% 77% 57% 6% 11% 1% Calderdale 99 84 52 14 62% 70% 54% 16% 22% 10% Cambridgeshire 238 201 129 26 64% 69% 59% 13% 17% 9% Camden 44ꜝ 59 40 4 68% 81% 55% 7% 14% 0% Central Bedfordshire 51 43 33 5 76% 86% 66% 12% 20% 4% Cheshire East 90 79 43 18 54% 63% 45% 23% 30% 16% Cheshire West and Chester 105 101 56 30 56% 64% 48% 29% 37% 21% City of London Cornwall 129 99 61 22 62% 69% 55% 23% 29% 17% Coventry 58 75 46 17 61% 72% 50% 22% 32% 12% Croydon 104 131 88 25 67% 75% 59% 19% 26% 12% Cumbria 257 212 163 21 77% 81% 73% 10% 13% 7% Darlington 20ꜝ 22 16 1 70% 88% 52% 5% 14% 0% Derby 70 66 39 16 59% 69% 49% 24% 33% 15% Derbyshire 168 141 88 31 62% 68% 56% 22% 27% 17% Devon 75 74 45 11 61% 71% 51% 14% 21% 7% Doncaster 40ꜝ 46 36 4 79% 90% 68% 9% 17% 1%

183
Local authority Unweighted total Total
Satisfaction of parent/child/young person with the whole experience of getting the
EHC plan
Satisfied Dissatisfied
Value Upper Bound
Lower Bound Value Upper
Bound Lower Bound
Dorset 62 56 36 12 65% 75% 55% 21% 30% 12% Dudley 61 45 30 7 67% 77% 57% 16% 24% 8% Durham 205 219 157 21 72% 77% 67% 10% 14% 6% Ealing 69 79 45 15 57% 67% 47% 19% 27% 11% East Riding of Yorkshire 71 49 32 6 66% 75% 57% 13% 19% 7% East Sussex 126 110 63 28 57% 64% 50% 25% 31% 19% Enfield 64 74 57 5 76% 85% 67% 6% 11% 1% Essex 254 230 153 35 66% 71% 61% 15% 19% 11% Gateshead 91 85 55 19 65% 73% 57% 22% 29% 15% Gloucestershire 181 184 112 29 61% 67% 55% 16% 21% 11% Greenwich 66 45 29 7 64% 73% 55% 15% 22% 8% Hackney 63 70 54 3 78% 87% 69% 5% 10% 0% Halton 28ꜝ 32 26 2 80% 93% 67% 7% 15% 0% Hammersmith and Fulham 19ꜝ 18 12 4 63% 82% 44% 21% 37% 5% Hampshire 355 293 174 72 59% 63% 55% 25% 29% 21% Haringey 54 55 34 7 61% 72% 50% 13% 21% 5% Harrow 66 63 53 2 84% 92% 76% 3% 7% 0% Hartlepool 20ꜝ 28 23 1 81% 97% 65% 5% 14% 0% Havering 64 57 41 9 71% 81% 61% 15% 23% 7% Herefordshire 44ꜝ 51 37 5 72% 84% 60% 10% 18% 2%

184
Local authority Unweighted total Total
Satisfaction of parent/child/young person with the whole experience of getting the
EHC plan
Satisfied Dissatisfied
Value Upper Bound
Lower Bound Value Upper
Bound Lower Bound
Hertfordshire 360 335 201 71 60% 64% 56% 21% 25% 17% Hillingdon 90 95 63 8 67% 76% 58% 9% 14% 4% Hounslow 51 61 36 10 59% 71% 47% 16% 25% 7% Isle of Wight 60 43 30 5 70% 80% 60% 11% 17% 5% Isles Of Scilly Islington 34ꜝ 49 29 8 59% 74% 44% 17% 29% 5% Kensington and Chelsea 8ꜝ 10 8 1 79% 100% 53% 11% 31% 0% Kent 591 546 373 78 68% 71% 65% 14% 16% 12% Kingston upon Hull City of 34ꜝ 42 25 4 59% 74% 44% 9% 18% 0% Kingston upon Thames 42ꜝ 38 26 8 67% 79% 55% 21% 32% 10% Kirklees 90 120 85 14 71% 79% 63% 11% 17% 5% Knowsley 47ꜝ 67 48 7 72% 84% 60% 11% 19% 3% Lambeth 87 95 67 13 70% 79% 61% 14% 20% 8% Lancashire 210 275 182 41 66% 72% 60% 15% 19% 11% Leeds 219 215 142 30 66% 71% 61% 14% 18% 10% Leicester 61 91 66 11 73% 83% 63% 13% 21% 5% Leicestershire 270 278 181 37 65% 70% 60% 13% 17% 9% Lewisham 63 59 38 12 64% 74% 54% 20% 29% 11% Lincolnshire 257 223 154 31 69% 74% 64% 14% 18% 10% Liverpool 69 87 55 11 62% 72% 52% 13% 20% 6%

185
Local authority Unweighted total Total
Satisfaction of parent/child/young person with the whole experience of getting the
EHC plan
Satisfied Dissatisfied
Value Upper Bound
Lower Bound Value Upper
Bound Lower Bound
Luton 54 59 48 3 80% 89% 71% 6% 12% 0% Manchester 169 212 160 19 76% 82% 70% 9% 13% 5% Medway 131 156 102 20 66% 73% 59% 13% 18% 8% Merton 45ꜝ 48 27 10 56% 69% 43% 20% 30% 10% Middlesbrough 33ꜝ 36 33 1 91% 100% 82% 3% 8% 0% Milton Keynes 146 161 103 23 64% 71% 57% 14% 19% 9% Newcastle upon Tyne 65 76 51 5 68% 78% 58% 6% 11% 1% Newham 30ꜝ 31 17 8 53% 69% 37% 25% 39% 11% Norfolk 146 128 69 33 54% 61% 47% 26% 32% 20% North East Lincolnshire 39ꜝ 42 33 1 80% 91% 69% 3% 8% 0% North Lincolnshire 47ꜝ 42 30 5 72% 83% 61% 12% 20% 4% North Somerset 27ꜝ 28 16 6 57% 73% 41% 22% 36% 8% North Tyneside 50 44 24 14 54% 66% 42% 32% 43% 21% North Yorkshire 163 139 86 24 62% 68% 56% 18% 23% 13% Northamptonshire 161 170 109 24 64% 71% 57% 14% 19% 9% Northumberland 68 56 31 16 56% 66% 46% 28% 37% 19% Nottingham 54 60 46 3 76% 86% 66% 6% 12% 0% Nottinghamshire 162 142 88 24 62% 68% 56% 17% 22% 12% Oldham 23ꜝ 27 19 4 70% 87% 53% 13% 25% 1% Oxfordshire 152 120 84 11 70% 76% 64% 9% 13% 5%

186
Local authority Unweighted total Total
Satisfaction of parent/child/young person with the whole experience of getting the
EHC plan
Satisfied Dissatisfied
Value Upper Bound
Lower Bound Value Upper
Bound Lower Bound
Peterborough 35ꜝ 44 27 8 62% 77% 47% 18% 29% 7% Plymouth 115 133 99 9 74% 81% 67% 7% 11% 3% Poole 24ꜝ 23 13 5 54% 71% 37% 23% 38% 8% Portsmouth 44ꜝ 39 29 6 76% 87% 65% 16% 25% 7% Reading 29ꜝ 47 23 3 48% 65% 31% 7% 16% 0% Redbridge 79 83 67 7 80% 88% 72% 8% 13% 3% Redcar and Cleveland 66 59 35 12 59% 69% 49% 20% 28% 12% Richmond upon Thames 50 57 24 21 43% 55% 31% 38% 50% 26% Rochdale 74 78 49 15 64% 74% 54% 19% 27% 11% Rotherham 81 67 45 10 67% 76% 58% 15% 22% 8% Rutland 10ꜝ 11 4 3 40% 67% 13% 30% 55% 5% Salford 43ꜝ 50 33 10 66% 79% 53% 19% 29% 9% Sandwell 54 55 40 8 72% 82% 62% 15% 23% 7% Sefton 45ꜝ 33 17 9 52% 64% 40% 27% 38% 16% Sheffield 52 53 27 19 51% 63% 39% 36% 47% 25% Shropshire 118 96 67 13 70% 77% 63% 14% 19% 9% Slough 29ꜝ 26 19 2 75% 89% 61% 8% 16% 0% Solihull 48ꜝ 49 31 13 62% 74% 50% 27% 38% 16% Somerset 63 57 28 17 49% 60% 38% 30% 40% 20% South Gloucestershire 82 78 49 17 64% 73% 55% 22% 30% 14%

187
Local authority Unweighted total Total
Satisfaction of parent/child/young person with the whole experience of getting the
EHC plan
Satisfied Dissatisfied
Value Upper Bound
Lower Bound Value Upper
Bound Lower Bound
South Tyneside 61 71 43 12 61% 72% 50% 17% 25% 9% Southampton 42ꜝ 61 32 15 52% 66% 38% 24% 36% 12% Southend-on-Sea 76 76 58 10 76% 84% 68% 13% 20% 6% Southwark 95 91 60 10 66% 74% 58% 11% 16% 6% St. Helens 26ꜝ 34 22 8 65% 82% 48% 23% 38% 8% Staffordshire 129 113 85 14 75% 81% 69% 12% 17% 7% Stockport 129 134 102 12 76% 82% 70% 9% 13% 5% Stockton-on-Tees 70 91 62 8 68% 78% 58% 9% 15% 3% Stoke-on-Trent 54 54 36 8 66% 77% 55% 15% 23% 7% Suffolk 93 85 59 14 70% 78% 62% 16% 22% 10% Sunderland 96 97 59 15 61% 70% 52% 16% 22% 10% Surrey 258 249 130 66 52% 57% 47% 27% 32% 22% Sutton 67 62 42 10 68% 78% 58% 17% 25% 9% Swindon 56 53 38 10 72% 82% 62% 19% 28% 10% Tameside 35ꜝ 60 35 12 59% 74% 44% 20% 32% 8% Telford and Wrekin 36ꜝ 49 37 4 76% 89% 63% 8% 16% 0% Thurrock 39ꜝ 39 24 5 62% 75% 49% 13% 22% 4% Torbay 77 72 54 7 76% 84% 68% 10% 16% 4% Tower Hamlets 62 108 68 16 63% 74% 52% 15% 23% 7% Trafford 68 60 27 24 44% 54% 34% 41% 51% 31%

188
Local authority Unweighted total Total
Satisfaction of parent/child/young person with the whole experience of getting the
EHC plan
Satisfied Dissatisfied
Value Upper Bound
Lower Bound Value Upper
Bound Lower Bound
Wakefield 72 95 67 5 71% 80% 62% 6% 11% 1% Walsall 77 61 44 6 72% 80% 64% 10% 16% 4% Waltham Forest 59 49 35 6 71% 81% 61% 12% 19% 5% Wandsworth 52 67 45 8 67% 79% 55% 12% 20% 4% Warrington 100 106 72 13 67% 75% 59% 13% 19% 7% Warwickshire 102 111 86 4 77% 84% 70% 4% 7% 1% West Berkshire 89 78 54 12 69% 77% 61% 15% 21% 9% West Sussex 206 186 128 27 69% 74% 64% 15% 19% 11% Westminster 15ꜝ 22 10 8 45% 68% 22% 35% 57% 13% Wigan 79 76 58 1 77% 85% 69% 1% 3% 0% Wiltshire 186 160 113 17 71% 77% 65% 11% 15% 7% Windsor and Maidenhead 28ꜝ 21 11 6 51% 66% 36% 30% 44% 16% Wirral 98 117 76 21 64% 73% 55% 18% 25% 11% Wokingham 54 50 29 10 58% 69% 47% 19% 28% 10% Wolverhampton 34ꜝ 44 32 3 73% 87% 59% 6% 13% 0% Worcestershire 151 131 79 17 61% 68% 54% 13% 18% 8% York 82 73 46 11 63% 72% 54% 16% 23% 9%

189
Local authority Unweighted total Total
Overall agreement that the help support in the EHC plan will help the child/young person achieve
what they want to in life
Agree Disagree
Value Upper Bound
Lower Bound Value Upper
Bound Lower Bound
Unweighted row 13643 13643 6985 1203 Total 13643 13642 6993 1204 51% 52% 50% 9% 9% 9% Barking and Dagenham 31ꜝ 31 21 0 68% 82% 54% 0% 0% 0% Barnet 78 80 45 6 56% 66% 46% 8% 13% 3% Barnsley 45ꜝ 49 25 6 51% 64% 38% 11% 19% 3% Bath and North East Somerset 81 71 37 3
53% 62% 44% 4% 8% 0% Bedford 75 69 31 6 45% 55% 35% 8% 13% 3% Bexley 76 59 28 9 47% 56% 38% 15% 22% 8% Birmingham 244 317 165 36 52% 58% 46% 12% 16% 8% Blackburn with Darwen 36ꜝ 61 24 7 40% 55% 25% 12% 22% 2% Blackpool 33ꜝ 45 19 3 42% 57% 27% 6% 13% 0% Bolton 74 78 44 8 57% 67% 47% 11% 17% 5% Bournemouth 78 78 37 5 48% 58% 38% 6% 11% 1% Bracknell Forest 42ꜝ 42 18 2 43% 56% 30% 5% 11% 0% Bradford 125 119 63 6 53% 61% 45% 5% 8% 2% Brent 80 97 51 3 53% 63% 43% 3% 6% 0% Brighton and Hove 61 56 25 6 45% 56% 34% 11% 18% 4% Bristol City of 104 100 51 7 51% 59% 43% 7% 11% 3% Bromley 69 65 29 8 44% 54% 34% 13% 20% 6% Buckinghamshire 127 98 46 8

190
Local authority Unweighted total Total
Overall agreement that the help support in the EHC plan will help the child/young person achieve
what they want to in life
Agree Disagree
Value Upper Bound
Lower Bound Value Upper
Bound Lower Bound
47% 54% 40% 8% 12% 4% Bury 68 96 50 6 52% 63% 41% 6% 11% 1% Calderdale 99 84 43 8 52% 60% 44% 9% 14% 4% Cambridgeshire 238 201 108 18 54% 59% 49% 9% 12% 6% Camden 44ꜝ 59 38 5 65% 78% 52% 8% 15% 1% Central Bedfordshire 51 43 23 6 54% 66% 42% 13% 21% 5% Cheshire East 90 79 41 9 52% 61% 43% 11% 17% 5% Cheshire West and Chester 105 101 55 11 54% 62% 46% 10% 15% 5% City of London * 0 0
0% #DIV/0!
#DIV/0! 0% #DIV/0
! #DIV/0
! Cornwall 129 99 46 7 47% 54% 40% 8% 12% 4% Coventry 58 75 33 12 43% 55% 31% 15% 23% 7% Croydon 104 131 74 10 56% 65% 47% 8% 13% 3% Cumbria 257 212 118 13 56% 61% 51% 6% 8% 4% Darlington 20ꜝ 22 10 1 45% 64% 26% 5% 14% 0% Derby 70 66 32 5 48% 58% 38% 7% 12% 2% Derbyshire 168 141 77 14 55% 61% 49% 10% 14% 6% Devon 75 74 34 7 45% 55% 35% 10% 16% 4% Doncaster 40ꜝ 46 25 4 55% 69% 41% 9% 17% 1% Dorset 62 56 31 5 56% 67% 45% 10% 16% 4% Dudley 61 45 22 7 49% 59% 39% 15% 22% 8%

191
Local authority Unweighted total Total
Overall agreement that the help support in the EHC plan will help the child/young person achieve
what they want to in life
Agree Disagree
Value Upper Bound
Lower Bound Value Upper
Bound Lower Bound
Durham 205 219 115 23 52% 58% 46% 11% 15% 7% Ealing 69 79 41 12 52% 62% 42% 15% 23% 7% East Riding of Yorkshire 71 49 25 3 52% 61% 43% 7% 12% 2% East Sussex 126 110 51 9 46% 53% 39% 8% 12% 4% Enfield 64 74 37 3 50% 61% 39% 5% 10% 0% Essex 254 230 109 18 47% 52% 42% 8% 11% 5% Gateshead 91 85 43 10 51% 60% 42% 12% 18% 6% Gloucestershire 181 184 98 18 53% 59% 47% 10% 14% 6% Greenwich 66 45 23 3 52% 62% 42% 7% 12% 2% Hackney 63 70 45 2 64% 75% 53% 3% 7% 0% Halton 28ꜝ 32 20 3 62% 78% 46% 10% 20% 0% Hammersmith and Fulham 19ꜝ 18 14 2 79% 95% 63% 11% 23% 0% Hampshire 355 293 153 35 52% 56% 48% 12% 15% 9% Haringey 54 55 26 5 46% 58% 34% 9% 16% 2% Harrow 66 63 42 3 66% 76% 56% 4% 8% 0% Hartlepool 20ꜝ 28 15 1 55% 75% 35% 5% 14% 0% Havering 64 57 27 3 47% 57% 37% 6% 11% 1% Herefordshire 44ꜝ 51 28 7 54% 67% 41% 14% 23% 5% Hertfordshire 360 335 146 47 44% 48% 40% 14% 17% 11% Hillingdon 90 95 48 6 51% 60% 42% 6% 10% 2%

192
Local authority Unweighted total Total
Overall agreement that the help support in the EHC plan will help the child/young person achieve
what they want to in life
Agree Disagree
Value Upper Bound
Lower Bound Value Upper
Bound Lower Bound
Hounslow 51 61 33 8 54% 66% 42% 14% 23% 5% Isle of Wight 60 43 22 5 51% 61% 41% 10% 16% 4% Isles Of Scilly * * 0
50% #DIV/0!
#DIV/0! 0% #DIV/0
! #DIV/0
! Islington 34ꜝ 49 20 6 41% 56% 26% 12% 22% 2% Kensington and Chelsea 8ꜝ 10 7 1 68% 98% 38% 11% 31% 0% Kent 591 546 283 36 52% 55% 49% 7% 9% 5% Kingston upon Hull City of 34ꜝ 42 24 3 55% 70% 40% 6% 13% 0% Kingston upon Thames 42ꜝ 38 18 3 47% 60% 34% 8% 15% 1% Kirklees 90 120 80 8 67% 76% 58% 7% 12% 2% Knowsley 47ꜝ 67 37 6 55% 68% 42% 9% 16% 2% Lambeth 87 95 67 2 70% 79% 61% 2% 5% 0% Lancashire 210 275 123 23 45% 51% 39% 8% 11% 5% Leeds 219 215 102 22 48% 54% 42% 10% 13% 7% Leicester 61 91 52 6 57% 68% 46% 7% 13% 1% Leicestershire 270 278 120 37 43% 48% 38% 13% 17% 9% Lewisham 63 59 38 2 65% 75% 55% 4% 8% 0% Lincolnshire 257 223 114 15 51% 56% 46% 7% 10% 4% Liverpool 69 87 42 7 48% 59% 37% 8% 14% 2% Luton 54 59 36 6 61% 73% 49% 11% 18% 4% Manchester 169 212 118 15

193
Local authority Unweighted total Total
Overall agreement that the help support in the EHC plan will help the child/young person achieve
what they want to in life
Agree Disagree
Value Upper Bound
Lower Bound Value Upper
Bound Lower Bound
56% 63% 49% 7% 10% 4% Medway 131 156 78 9 50% 58% 42% 6% 10% 2% Merton 45ꜝ 48 21 7 43% 56% 30% 14% 23% 5% Middlesbrough 33ꜝ 36 22 0 61% 76% 46% 0% 0% 0% Milton Keynes 146 161 84 15 52% 59% 45% 9% 13% 5% Newcastle upon Tyne 65 76 51 6 68% 78% 58% 7% 13% 1% Newham 30ꜝ 31 18 2 59% 75% 43% 7% 15% 0% Norfolk 146 128 58 14 45% 52% 38% 11% 15% 7% North East Lincolnshire 39ꜝ 42 19 2 45% 59% 31% 5% 11% 0% North Lincolnshire 47ꜝ 42 21 2 49% 61% 37% 4% 9% 0% North Somerset 27ꜝ 28 11 4 38% 54% 22% 14% 26% 2% North Tyneside 50 44 18 4 40% 52% 28% 8% 14% 2% North Yorkshire 163 139 76 14 55% 61% 49% 10% 14% 6% Northamptonshire 161 170 81 20 47% 54% 40% 12% 16% 8% Northumberland 68 56 23 9 41% 51% 31% 16% 23% 9% Nottingham 54 60 26 5 43% 55% 31% 8% 14% 2% Nottinghamshire 162 142 69 17 49% 56% 42% 12% 16% 8% Oldham 23ꜝ 27 17 1 61% 79% 43% 4% 11% 0% Oxfordshire 152 120 62 9 52% 59% 45% 7% 10% 4% Peterborough 35ꜝ 44 17 5 39% 54% 24% 11% 20% 2% Plymouth 115 133 68 14

194
Local authority Unweighted total Total
Overall agreement that the help support in the EHC plan will help the child/young person achieve
what they want to in life
Agree Disagree
Value Upper Bound
Lower Bound Value Upper
Bound Lower Bound
51% 59% 43% 11% 16% 6% Poole 24ꜝ 23 14 1 61% 78% 44% 4% 11% 0% Portsmouth 44ꜝ 39 19 3 50% 63% 37% 7% 13% 1% Reading 29ꜝ 47 26 3 56% 73% 39% 7% 16% 0% Redbridge 79 83 50 6 59% 69% 49% 7% 12% 2% Redcar and Cleveland 66 59 27 6 45% 55% 35% 11% 17% 5% Richmond upon Thames 50 57 25 10 43% 55% 31% 18% 27% 9% Rochdale 74 78 39 8 51% 61% 41% 11% 17% 5% Rotherham 81 67 30 6 45% 54% 36% 9% 14% 4% Rutland 10ꜝ 11 4 0 40% 67% 13% 0% 0% 0% Salford 43ꜝ 50 26 6 52% 65% 39% 12% 21% 3% Sandwell 54 55 26 4 48% 60% 36% 8% 14% 2% Sefton 45ꜝ 33 14 3 43% 55% 31% 8% 15% 1% Sheffield 52 53 11 9 20% 30% 10% 17% 26% 8% Shropshire 118 96 51 7 53% 61% 45% 7% 11% 3% Slough 29ꜝ 26 12 0 47% 63% 31% 0% 0% 0% Solihull 48ꜝ 49 20 10 40% 52% 28% 20% 30% 10% Somerset 63 57 25 5 44% 55% 33% 10% 16% 4% South Gloucestershire 82 78 35 8 46% 55% 37% 11% 17% 5% South Tyneside 61 71 27 9 37% 48% 26% 13% 21% 5% Southampton 42ꜝ 61 30 6

195
Local authority Unweighted total Total
Overall agreement that the help support in the EHC plan will help the child/young person achieve
what they want to in life
Agree Disagree
Value Upper Bound
Lower Bound Value Upper
Bound Lower Bound
49% 63% 35% 10% 18% 2% Southend-on-Sea 76 76 36 5 48% 58% 38% 7% 12% 2% Southwark 95 91 51 5 56% 65% 47% 6% 10% 2% St. Helens 26ꜝ 34 17 3 50% 67% 33% 8% 17% 0% Staffordshire 129 113 71 8 63% 70% 56% 7% 11% 3% Stockport 129 134 74 9 55% 63% 47% 7% 11% 3% Stockton-on-Tees 70 91 43 12 47% 58% 36% 13% 20% 6% Stoke-on-Trent 54 54 27 3 50% 62% 38% 6% 12% 0% Suffolk 93 85 44 4 52% 61% 43% 5% 9% 1% Sunderland 96 97 46 17 48% 57% 39% 18% 25% 11% Surrey 258 249 143 22 57% 62% 52% 9% 12% 6% Sutton 67 62 35 5 57% 67% 47% 7% 12% 2% Swindon 56 53 29 7 54% 65% 43% 12% 19% 5% Tameside 35ꜝ 60 37 5 63% 78% 48% 9% 18% 0% Telford and Wrekin 36ꜝ 49 35 4 70% 84% 56% 8% 16% 0% Thurrock 39ꜝ 39 20 2 51% 65% 37% 5% 11% 0% Torbay 77 72 38 7 54% 64% 44% 9% 15% 3% Tower Hamlets 62 108 57 9 53% 65% 41% 8% 14% 2% Trafford 68 60 23 7 39% 49% 29% 12% 19% 5% Wakefield 72 95 41 4 43% 53% 33% 4% 8% 0% Walsall 77 61 34 4

196
Local authority Unweighted total Total
Overall agreement that the help support in the EHC plan will help the child/young person achieve
what they want to in life
Agree Disagree
Value Upper Bound
Lower Bound Value Upper
Bound Lower Bound
56% 65% 47% 6% 10% 2% Waltham Forest 59 49 25 4 52% 63% 41% 9% 15% 3% Wandsworth 52 67 33 2 49% 61% 37% 4% 9% 0% Warrington 100 106 58 10 54% 63% 45% 10% 15% 5% Warwickshire 102 111 59 5 53% 62% 44% 5% 9% 1% West Berkshire 89 78 44 6 56% 65% 47% 7% 12% 2% West Sussex 206 186 99 11 53% 59% 47% 6% 9% 3% Westminster 15ꜝ 22 11 1 52% 75% 29% 5% 15% 0% Wigan 79 76 43 4 57% 66% 48% 5% 9% 1% Wiltshire 186 160 87 9 54% 60% 48% 6% 9% 3% Windsor and Maidenhead 28ꜝ 21 14 3 66% 81% 51% 15% 26% 4% Wirral 98 117 55 16 47% 56% 38% 13% 19% 7% Wokingham 54 50 24 5 49% 61% 37% 10% 17% 3% Wolverhampton 34ꜝ 44 24 0 54% 69% 39% 0% 0% 0% Worcestershire 151 131 61 12 47% 54% 40% 9% 13% 5% York 82 73 40 6 55% 64% 46% 8% 13% 3%

197
Local authority Unweighted total Total
Agreement that taking part in getting the EHC plan was a positive experience for the child/young
person
Agree Disagree
Value Upper Bound
Lower Bound Value Upper
Bound Lower Bound
Unweighted row 13643 1364
3 5500 1273
Total 13643 1364
2 5551 1252
41% 42% 40% 9% 9% 9% Barking and Dagenham 31ꜝ 31 14 1 46% 61% 31% 3% 8% 0% Barnet 78 80 32 9 40% 50% 30% 11% 17% 5% Barnsley 45ꜝ 49 20 6 40% 53% 27% 11% 19% 3% Bath and North East Somerset 81 71 33 4
47% 56% 38% 5% 9% 1% Bedford 75 69 20 6 29% 38% 20% 9% 15% 3% Bexley 76 59 25 6 43% 52% 34% 10% 16% 4% Birmingham 244 317 129 30 41% 47% 35% 9% 12% 6% Blackburn with Darwen 36ꜝ 61 32 5 52% 67% 37% 9% 18% 0% Blackpool 33ꜝ 45 22 3 48% 64% 32% 6% 13% 0% Bolton 74 78 41 5 52% 62% 42% 7% 12% 2% Bournemouth 78 78 30 9 39% 48% 30% 11% 17% 5% Bracknell Forest 42ꜝ 42 12 4 29% 41% 17% 10% 18% 2% Bradford 125 119 54 12 46% 54% 38% 10% 15% 5% Brent 80 97 52 8 54% 64% 44% 8% 13% 3% Brighton and Hove 61 56 14 7 24% 33% 15% 12% 19% 5% Bristol City of 104 100 34 8 34% 42% 26% 8% 13% 3% Bromley 69 65 33 8 50% 60% 40% 13% 20% 6% Buckinghamshire 127 98 28 10 29% 36% 22% 10% 14% 6%

198
Local authority Unweighted total Total
Agreement that taking part in getting the EHC plan was a positive experience for the child/young
person
Agree Disagree
Value Upper Bound
Lower Bound Value Upper
Bound Lower Bound
Bury 68 96 47 4 49% 60% 38% 4% 8% 0% Calderdale 99 84 33 8 40% 48% 32% 10% 15% 5% Cambridgeshire 238 201 81 25 41% 46% 36% 12% 15% 9% Camden 44ꜝ 59 28 4 48% 61% 35% 6% 12% 0% Central Bedfordshire 51 43 26 4 60% 71% 49% 8% 14% 2% Cheshire East 90 79 32 9 41% 50% 32% 12% 18% 6% Cheshire West and Chester 105 101 39 13 38% 46% 30% 12% 17% 7% City of London * 0 0
0% #DIV/0!
#DIV/0! 0% #DIV/0
! #DIV/0
! Cornwall 129 99 25 9 26% 32% 20% 9% 13% 5% Coventry 58 75 30 6 40% 51% 29% 8% 14% 2% Croydon 104 131 58 9 44% 53% 35% 7% 11% 3% Cumbria 257 212 98 11 46% 51% 41% 5% 7% 3% Darlington 20ꜝ 22 10 2 46% 65% 27% 10% 22% 0% Derby 70 66 26 6 40% 50% 30% 9% 15% 3% Derbyshire 168 141 58 16 41% 47% 35% 11% 15% 7% Devon 75 74 22 12 29% 38% 20% 16% 23% 9% Doncaster 40ꜝ 46 23 3 51% 65% 37% 7% 14% 0% Dorset 62 56 24 4 44% 55% 33% 8% 14% 2% Dudley 61 45 19 4 43% 53% 33% 8% 14% 2% Durham 205 219 95 16 43% 49% 37% 8% 11% 5%

199
Local authority Unweighted total Total
Agreement that taking part in getting the EHC plan was a positive experience for the child/young
person
Agree Disagree
Value Upper Bound
Lower Bound Value Upper
Bound Lower Bound
Ealing 69 79 35 13 44% 54% 34% 16% 24% 8% East Riding of Yorkshire 71 49 19 4 38% 47% 29% 9% 14% 4% East Sussex 126 110 33 15 30% 37% 23% 14% 19% 9% Enfield 64 74 39 8 53% 64% 42% 11% 18% 4% Essex 254 230 85 16 37% 42% 32% 7% 10% 4% Gateshead 91 85 33 9 39% 48% 30% 11% 17% 5% Gloucestershire 181 184 79 19 43% 49% 37% 10% 14% 6% Greenwich 66 45 23 2 52% 62% 42% 5% 9% 1% Hackney 63 70 41 1 58% 69% 47% 2% 5% 0% Halton 28ꜝ 32 20 1 62% 78% 46% 3% 9% 0% Hammersmith and Fulham 19ꜝ 18 9 2 52% 72% 32% 10% 22% 0% Hampshire 355 293 97 43 33% 37% 29% 15% 18% 12% Haringey 54 55 25 8 45% 57% 33% 15% 23% 7% Harrow 66 63 43 5 68% 78% 58% 8% 14% 2% Hartlepool 20ꜝ 28 13 1 45% 65% 25% 5% 14% 0% Havering 64 57 27 2 47% 57% 37% 4% 8% 0% Herefordshire 44ꜝ 51 18 6 36% 49% 23% 11% 19% 3% Hertfordshire 360 335 102 45 30% 34% 26% 13% 16% 10% Hillingdon 90 95 45 8 48% 57% 39% 9% 14% 4% Hounslow 51 61 26 6 43% 55% 31% 10% 17% 3%

200
Local authority Unweighted total Total
Agreement that taking part in getting the EHC plan was a positive experience for the child/young
person
Agree Disagree
Value Upper Bound
Lower Bound Value Upper
Bound Lower Bound
Isle of Wight 60 43 18 4 42% 52% 32% 10% 16% 4% Isles Of Scilly * 0 0
0% #DIV/0!
#DIV/0! 0% #DIV/0
! #DIV/0
! Islington 34ꜝ 49 16 4 33% 47% 19% 9% 18% 0% Kensington and Chelsea 8ꜝ 10 4 4 43% 74% 12% 36% 66% 6% Kent 591 546 210 48 38% 41% 35% 9% 11% 7% Kingston upon Hull City of 34ꜝ 42 14 0 33% 47% 19% 0% 0% 0% Kingston upon Thames 42ꜝ 38 10 4 26% 37% 15% 11% 19% 3% Kirklees 90 120 59 8 50% 59% 41% 6% 10% 2% Knowsley 47ꜝ 67 27 6 40% 53% 27% 9% 16% 2% Lambeth 87 95 56 6 58% 67% 49% 6% 10% 2% Lancashire 210 275 96 22 35% 41% 29% 8% 11% 5% Leeds 219 215 95 20 44% 50% 38% 9% 12% 6% Leicester 61 91 48 6 53% 64% 42% 7% 13% 1% Leicestershire 270 278 94 38 34% 39% 29% 14% 18% 10% Lewisham 63 59 27 2 46% 57% 35% 4% 8% 0% Lincolnshire 257 223 99 15 44% 49% 39% 7% 10% 4% Liverpool 69 87 31 2 35% 45% 25% 3% 7% 0% Luton 54 59 27 5 45% 57% 33% 9% 16% 2% Manchester 169 212 95 11 45% 52% 38% 5% 8% 2% Medway 131 156 61 11 39% 46% 32% 7% 11% 3%

201
Local authority Unweighted total Total
Agreement that taking part in getting the EHC plan was a positive experience for the child/young
person
Agree Disagree
Value Upper Bound
Lower Bound Value Upper
Bound Lower Bound
Merton 45ꜝ 48 23 2 47% 60% 34% 4% 9% 0% Middlesbrough 33ꜝ 36 15 1 43% 58% 28% 3% 8% 0% Milton Keynes 146 161 60 13 37% 44% 30% 8% 12% 4% Newcastle upon Tyne 65 76 38 2 50% 61% 39% 3% 7% 0% Newham 30ꜝ 31 14 1 45% 61% 29% 4% 10% 0% Norfolk 146 128 46 19 36% 43% 29% 15% 20% 10% North East Lincolnshire 39ꜝ 42 19 4 46% 60% 32% 10% 18% 2% North Lincolnshire 47ꜝ 42 17 3 41% 53% 29% 6% 12% 0% North Somerset 27ꜝ 28 10 3 37% 53% 21% 12% 23% 1% North Tyneside 50 44 14 8 32% 43% 21% 18% 27% 9% North Yorkshire 163 139 55 19 39% 45% 33% 14% 19% 9% Northamptonshire 161 170 75 16 44% 51% 37% 9% 13% 5% Northumberland 68 56 19 6 34% 44% 24% 10% 16% 4% Nottingham 54 60 32 3 53% 65% 41% 6% 12% 0% Nottinghamshire 162 142 55 19 39% 45% 33% 13% 17% 9% Oldham 23ꜝ 27 14 2 52% 70% 34% 9% 19% 0% Oxfordshire 152 120 48 7 40% 47% 33% 5% 8% 2% Peterborough 35ꜝ 44 14 4 31% 45% 17% 8% 16% 0% Plymouth 115 133 49 8 37% 45% 29% 6% 10% 2% Poole 24ꜝ 23 8 1 35% 52% 18% 4% 11% 0%

202
Local authority Unweighted total Total
Agreement that taking part in getting the EHC plan was a positive experience for the child/young
person
Agree Disagree
Value Upper Bound
Lower Bound Value Upper
Bound Lower Bound
Portsmouth 44ꜝ 39 18 3 45% 58% 32% 7% 13% 1% Reading 29ꜝ 47 24 2 51% 68% 34% 3% 9% 0% Redbridge 79 83 44 3 52% 62% 42% 4% 8% 0% Redcar and Cleveland 66 59 21 6 35% 45% 25% 11% 17% 5% Richmond upon Thames 50 57 12 13 21% 31% 11% 23% 33% 13% Rochdale 74 78 29 8 37% 47% 27% 10% 16% 4% Rotherham 81 67 28 6 42% 51% 33% 9% 14% 4% Rutland 10ꜝ 11 3 2 30% 55% 5% 20% 42% 0% Salford 43ꜝ 50 22 4 43% 56% 30% 7% 14% 0% Sandwell 54 55 23 5 43% 55% 31% 9% 16% 2% Sefton 45ꜝ 33 9 5 27% 38% 16% 15% 24% 6% Sheffield 52 53 9 7 17% 26% 8% 14% 22% 6% Shropshire 118 96 45 8 47% 55% 39% 9% 13% 5% Slough 29ꜝ 26 12 3 47% 63% 31% 12% 22% 2% Solihull 48ꜝ 49 12 9 24% 35% 13% 18% 28% 8% Somerset 63 57 18 9 32% 42% 22% 16% 24% 8% South Gloucestershire 82 78 35 9 45% 54% 36% 12% 18% 6% South Tyneside 61 71 29 3 41% 52% 30% 5% 10% 0% Southampton 42ꜝ 61 21 9 35% 48% 22% 15% 25% 5% Southend-on-Sea 76 76 31 6 40% 50% 30% 8% 13% 3%

203
Local authority Unweighted total Total
Agreement that taking part in getting the EHC plan was a positive experience for the child/young
person
Agree Disagree
Value Upper Bound
Lower Bound Value Upper
Bound Lower Bound
Southwark 95 91 38 6 42% 51% 33% 7% 11% 3% St. Helens 26ꜝ 34 8 7 23% 38% 8% 19% 33% 5% Staffordshire 129 113 51 13 45% 52% 38% 11% 16% 6% Stockport 129 134 55 6 41% 48% 34% 5% 8% 2% Stockton-on-Tees 70 91 38 9 41% 51% 31% 10% 16% 4% Stoke-on-Trent 54 54 22 4 41% 52% 30% 7% 13% 1% Suffolk 93 85 40 10 48% 57% 39% 11% 16% 6% Sunderland 96 97 38 17 40% 49% 31% 18% 25% 11% Surrey 258 249 89 24 36% 41% 31% 10% 13% 7% Sutton 67 62 21 2 33% 43% 23% 3% 7% 0% Swindon 56 53 24 6 45% 56% 34% 11% 18% 4% Tameside 35ꜝ 60 24 12 39% 54% 24% 20% 32% 8% Telford and Wrekin 36ꜝ 49 22 1 44% 59% 29% 3% 8% 0% Thurrock 39ꜝ 39 20 4 51% 65% 37% 10% 18% 2% Torbay 77 72 29 6 40% 49% 31% 8% 13% 3% Tower Hamlets 62 108 54 9 50% 62% 38% 8% 14% 2% Trafford 68 60 15 4 25% 34% 16% 7% 12% 2% Wakefield 72 95 44 3 46% 56% 36% 3% 7% 0% Walsall 77 61 27 6 45% 54% 36% 10% 16% 4% Waltham Forest 59 49 23 2 47% 58% 36% 3% 7% 0%

204
Local authority Unweighted total Total
Agreement that taking part in getting the EHC plan was a positive experience for the child/young
person
Agree Disagree
Value Upper Bound
Lower Bound Value Upper
Bound Lower Bound
Wandsworth 52 67 29 2 43% 55% 31% 4% 9% 0% Warrington 100 106 51 3 48% 57% 39% 3% 6% 0% Warwickshire 102 111 50 8 45% 54% 36% 7% 11% 3% West Berkshire 89 78 33 6 42% 51% 33% 7% 12% 2% West Sussex 206 186 72 13 39% 45% 33% 7% 10% 4% Westminster 15ꜝ 22 12 3 55% 78% 32% 13% 29% 0% Wigan 79 76 30 6 39% 48% 30% 8% 13% 3% Wiltshire 186 160 55 17 35% 41% 29% 11% 15% 7% Windsor and Maidenhead 28ꜝ 21 4 3 19% 31% 7% 13% 23% 3% Wirral 98 117 44 13 37% 46% 28% 11% 17% 5% Wokingham 54 50 22 8 44% 55% 33% 15% 23% 7% Wolverhampton 34ꜝ 44 24 2 54% 69% 39% 4% 10% 0% Worcestershire 151 131 44 11 34% 40% 28% 9% 13% 5% York 82 73 33 9 45% 54% 36% 12% 18% 6%
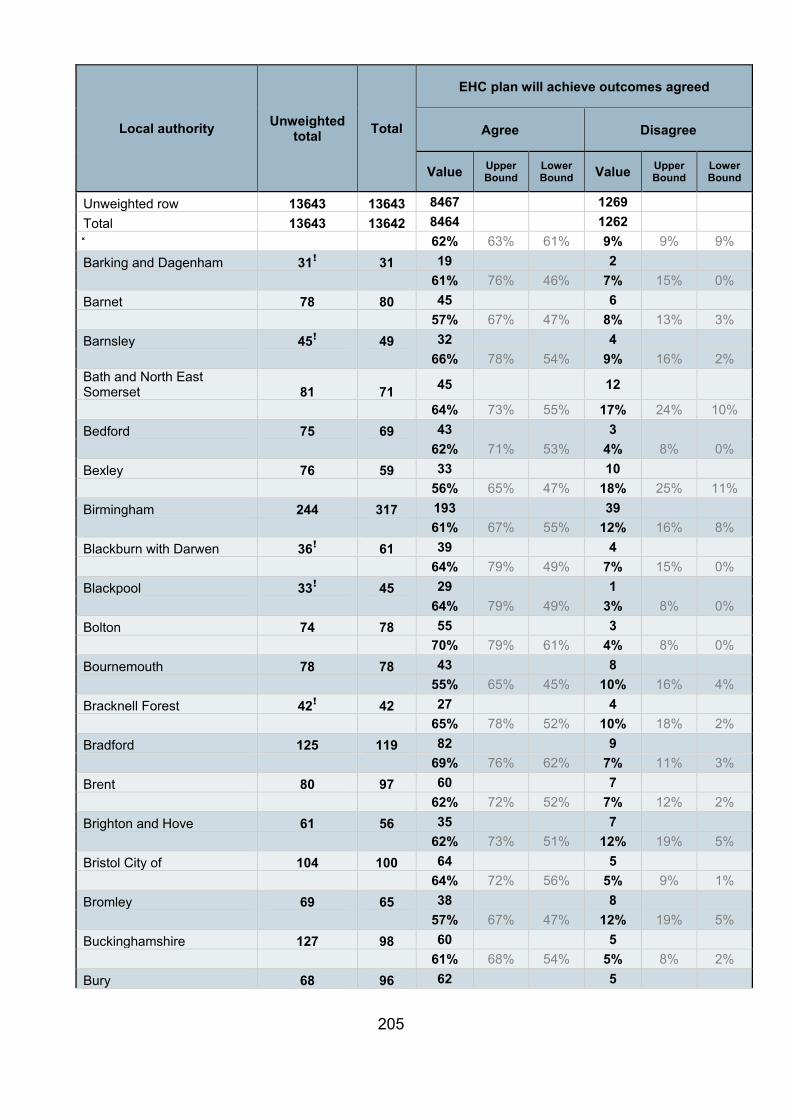
205
Local authority Unweighted total Total
EHC plan will achieve outcomes agreed
Agree Disagree
Value Upper Bound
Lower Bound Value Upper
Bound Lower Bound
Unweighted row 13643 13643 8467 1269 Total 13643 13642 8464 1262 62% 63% 61% 9% 9% 9% Barking and Dagenham 31ꜝ 31 19 2 61% 76% 46% 7% 15% 0% Barnet 78 80 45 6 57% 67% 47% 8% 13% 3% Barnsley 45ꜝ 49 32 4 66% 78% 54% 9% 16% 2% Bath and North East Somerset 81 71 45 12
64% 73% 55% 17% 24% 10% Bedford 75 69 43 3 62% 71% 53% 4% 8% 0% Bexley 76 59 33 10 56% 65% 47% 18% 25% 11% Birmingham 244 317 193 39 61% 67% 55% 12% 16% 8% Blackburn with Darwen 36ꜝ 61 39 4 64% 79% 49% 7% 15% 0% Blackpool 33ꜝ 45 29 1 64% 79% 49% 3% 8% 0% Bolton 74 78 55 3 70% 79% 61% 4% 8% 0% Bournemouth 78 78 43 8 55% 65% 45% 10% 16% 4% Bracknell Forest 42ꜝ 42 27 4 65% 78% 52% 10% 18% 2% Bradford 125 119 82 9 69% 76% 62% 7% 11% 3% Brent 80 97 60 7 62% 72% 52% 7% 12% 2% Brighton and Hove 61 56 35 7 62% 73% 51% 12% 19% 5% Bristol City of 104 100 64 5 64% 72% 56% 5% 9% 1% Bromley 69 65 38 8 57% 67% 47% 12% 19% 5% Buckinghamshire 127 98 60 5 61% 68% 54% 5% 8% 2% Bury 68 96 62 5

206
Local authority Unweighted total Total
EHC plan will achieve outcomes agreed
Agree Disagree
Value Upper Bound
Lower Bound Value Upper
Bound Lower Bound
64% 74% 54% 5% 10% 0% Calderdale 99 84 47 10 56% 64% 48% 12% 17% 7% Cambridgeshire 238 201 123 17 61% 66% 56% 9% 12% 6% Camden 44ꜝ 59 38 7 63% 76% 50% 11% 19% 3% Central Bedfordshire 51 43 28 2 65% 76% 54% 5% 10% 0% Cheshire East 90 79 43 11 55% 64% 46% 13% 19% 7% Cheshire West and Chester 105 101 63 11 62% 70% 54% 11% 16% 6% City of London * * 0
100% #DIV/0!
#DIV/0! 0% #DIV/0
! #DIV/0
! Cornwall 129 99 63 10 64% 71% 57% 10% 14% 6% Coventry 58 75 42 10 56% 68% 44% 13% 21% 5% Croydon 104 131 77 15 59% 68% 50% 12% 18% 6% Cumbria 257 212 155 12 73% 78% 68% 6% 8% 4% Darlington 20ꜝ 22 16 1 70% 88% 52% 5% 14% 0% Derby 70 66 38 9 57% 67% 47% 14% 21% 7% Derbyshire 168 141 91 18 64% 70% 58% 13% 17% 9% Devon 75 74 39 10 52% 62% 42% 13% 20% 6% Doncaster 40ꜝ 46 31 5 69% 82% 56% 12% 21% 3% Dorset 62 56 34 5 61% 71% 51% 10% 16% 4% Dudley 61 45 28 5 62% 72% 52% 12% 19% 5% Durham 205 219 144 16 66% 72% 60% 8% 11% 5% Ealing 69 79 42 9

207
Local authority Unweighted total Total
EHC plan will achieve outcomes agreed
Agree Disagree
Value Upper Bound
Lower Bound Value Upper
Bound Lower Bound
54% 64% 44% 12% 19% 5% East Riding of Yorkshire 71 49 29 6 59% 68% 50% 13% 19% 7% East Sussex 126 110 66 14 60% 67% 53% 13% 18% 8% Enfield 64 74 50 3 67% 77% 57% 5% 10% 0% Essex 254 230 139 20 61% 66% 56% 9% 12% 6% Gateshead 91 85 52 7 62% 71% 53% 8% 13% 3% Gloucestershire 181 184 113 16 61% 67% 55% 9% 13% 5% Greenwich 66 45 24 6 54% 64% 44% 14% 21% 7% Hackney 63 70 49 2 71% 81% 61% 3% 7% 0% Halton 28ꜝ 32 22 2 69% 84% 54% 7% 15% 0% Hammersmith and Fulham 19ꜝ 18 11 1 58% 77% 39% 5% 14% 0% Hampshire 355 293 186 33 63% 67% 59% 11% 14% 8% Haringey 54 55 37 6 67% 78% 56% 11% 18% 4% Harrow 66 63 44 3 70% 80% 60% 5% 10% 0% Hartlepool 20ꜝ 28 24 1 86% 100% 72% 5% 14% 0% Havering 64 57 37 4 64% 74% 54% 8% 14% 2% Herefordshire 44ꜝ 51 32 7 63% 76% 50% 14% 23% 5% Hertfordshire 360 335 196 46 58% 62% 54% 14% 17% 11% Hillingdon 90 95 56 9 58% 67% 49% 9% 14% 4% Hounslow 51 61 35 6 58% 70% 46% 10% 17% 3% Isle of Wight 60 43 27 2 62% 72% 52% 5% 10% 0%

208
Local authority Unweighted total Total
EHC plan will achieve outcomes agreed
Agree Disagree
Value Upper Bound
Lower Bound Value Upper
Bound Lower Bound
Isles Of Scilly * * 0
50% #DIV/0!
#DIV/0! 0% #DIV/0
! #DIV/0
! Islington 34ꜝ 49 24 9 50% 65% 35% 17% 29% 5% Kensington and Chelsea 8ꜝ 10 9 1 89% 100% 69% 11% 31% 0% Kent 591 546 346 40 63% 66% 60% 7% 9% 5% Kingston upon Hull City of 34ꜝ 42 30 1 71% 85% 57% 3% 8% 0% Kingston upon Thames 42ꜝ 38 25 3 66% 78% 54% 8% 15% 1% Kirklees 90 120 84 8 70% 79% 61% 6% 10% 2% Knowsley 47ꜝ 67 37 7 55% 68% 42% 11% 19% 3% Lambeth 87 95 69 5 73% 81% 65% 6% 10% 2% Lancashire 210 275 177 20 64% 70% 58% 7% 10% 4% Leeds 219 215 136 27 63% 69% 57% 13% 17% 9% Leicester 61 91 55 7 61% 72% 50% 8% 14% 2% Leicestershire 270 278 167 25 60% 65% 55% 9% 12% 6% Lewisham 63 59 34 5 57% 68% 46% 8% 14% 2% Lincolnshire 257 223 148 17 66% 71% 61% 8% 11% 5% Liverpool 69 87 49 5 56% 67% 45% 5% 10% 0% Luton 54 59 41 4 70% 81% 59% 7% 13% 1% Manchester 169 212 135 18 64% 71% 57% 8% 12% 4% Medway 131 156 101 11 65% 72% 58% 7% 11% 3% Merton 45ꜝ 48 26 8 54% 67% 41% 17% 27% 7%

209
Local authority Unweighted total Total
EHC plan will achieve outcomes agreed
Agree Disagree
Value Upper Bound
Lower Bound Value Upper
Bound Lower Bound
Middlesbrough 33ꜝ 36 26 0 73% 86% 60% 0% 0% 0% Milton Keynes 146 161 90 11 56% 63% 49% 7% 11% 3% Newcastle upon Tyne 65 76 50 3 66% 76% 56% 4% 8% 0% Newham 30ꜝ 31 11 4 36% 51% 21% 14% 25% 3% Norfolk 146 128 75 17 58% 65% 51% 13% 18% 8% North East Lincolnshire 39ꜝ 42 26 2 63% 76% 50% 5% 11% 0% North Lincolnshire 47ꜝ 42 29 5 69% 80% 58% 12% 20% 4% North Somerset 27ꜝ 28 11 5 38% 54% 22% 18% 31% 5% North Tyneside 50 44 22 7 50% 62% 38% 16% 25% 7% North Yorkshire 163 139 82 16 59% 65% 53% 11% 15% 7% Northamptonshire 161 170 96 23 57% 64% 50% 13% 18% 8% Northumberland 68 56 38 5 69% 78% 60% 9% 15% 3% Nottingham 54 60 42 7 70% 81% 59% 11% 18% 4% Nottinghamshire 162 142 80 16 56% 63% 49% 11% 15% 7% Oldham 23ꜝ 27 19 1 70% 87% 53% 4% 11% 0% Oxfordshire 152 120 72 8 60% 67% 53% 7% 10% 4% Peterborough 35ꜝ 44 26 5 60% 75% 45% 11% 20% 2% Plymouth 115 133 80 13 61% 69% 53% 10% 15% 5% Poole 24ꜝ 23 17 2 73% 88% 58% 8% 17% 0% Portsmouth 44ꜝ 39 25 2 64% 76% 52% 4% 9% 0% Reading 29ꜝ 47 26 5

210
Local authority Unweighted total Total
EHC plan will achieve outcomes agreed
Agree Disagree
Value Upper Bound
Lower Bound Value Upper
Bound Lower Bound
54% 71% 37% 10% 20% 0% Redbridge 79 83 55 6 66% 75% 57% 7% 12% 2% Redcar and Cleveland 66 59 36 6 60% 70% 50% 11% 17% 5% Richmond upon Thames 50 57 28 11 50% 62% 38% 19% 29% 9% Rochdale 74 78 47 7 60% 70% 50% 10% 16% 4% Rotherham 81 67 44 4 65% 74% 56% 6% 10% 2% Rutland 10ꜝ 11 6 0 50% 78% 22% 0% 0% 0% Salford 43ꜝ 50 35 1 69% 81% 57% 3% 8% 0% Sandwell 54 55 33 3 61% 72% 50% 6% 12% 0% Sefton 45ꜝ 33 21 3 64% 76% 52% 10% 17% 3% Sheffield 52 53 26 4 50% 62% 38% 7% 13% 1% Shropshire 118 96 62 6 65% 72% 58% 7% 11% 3% Slough 29ꜝ 26 17 1 68% 83% 53% 5% 12% 0% Solihull 48ꜝ 49 30 8 60% 72% 48% 16% 25% 7% Somerset 63 57 32 7 57% 68% 46% 13% 20% 6% South Gloucestershire 82 78 56 8 72% 80% 64% 10% 16% 4% South Tyneside 61 71 32 9 46% 57% 35% 13% 21% 5% Southampton 42ꜝ 61 35 12 57% 71% 43% 19% 30% 8% Southend-on-Sea 76 76 52 3 68% 77% 59% 4% 8% 0% Southwark 95 91 57 7 63% 71% 55% 8% 13% 3% St. Helens 26ꜝ 34 18 7 54% 71% 37% 19% 33% 5%

211
Local authority Unweighted total Total
EHC plan will achieve outcomes agreed
Agree Disagree
Value Upper Bound
Lower Bound Value Upper
Bound Lower Bound
Staffordshire 129 113 83 8 73% 80% 66% 7% 11% 3% Stockport 129 134 88 12 65% 72% 58% 9% 13% 5% Stockton-on-Tees 70 91 51 5 55% 66% 44% 6% 11% 1% Stoke-on-Trent 54 54 37 3 68% 79% 57% 6% 12% 0% Suffolk 93 85 53 8 62% 70% 54% 9% 14% 4% Sunderland 96 97 54 12 56% 65% 47% 13% 19% 7% Surrey 258 249 141 19 57% 62% 52% 8% 11% 5% Sutton 67 62 40 5 65% 75% 55% 8% 14% 2% Swindon 56 53 33 4 62% 73% 51% 8% 14% 2% Tameside 35ꜝ 60 39 5 65% 80% 50% 9% 18% 0% Telford and Wrekin 36ꜝ 49 33 4 67% 81% 53% 8% 16% 0% Thurrock 39ꜝ 39 23 3 59% 73% 45% 7% 14% 0% Torbay 77 72 48 6 67% 76% 58% 9% 15% 3% Tower Hamlets 62 108 70 9 65% 76% 54% 8% 14% 2% Trafford 68 60 31 9 51% 61% 41% 15% 22% 8% Wakefield 72 95 59 5 63% 73% 53% 6% 11% 1% Walsall 77 61 34 6 56% 65% 47% 10% 16% 4% Waltham Forest 59 49 30 2 61% 72% 50% 3% 7% 0% Wandsworth 52 67 47 5 70% 81% 59% 7% 13% 1% Warrington 100 106 56 16 53% 62% 44% 16% 22% 10% Warwickshire 102 111 76 8

212
Local authority Unweighted total Total
EHC plan will achieve outcomes agreed
Agree Disagree
Value Upper Bound
Lower Bound Value Upper
Bound Lower Bound
69% 77% 61% 7% 11% 3% West Berkshire 89 78 52 7 66% 74% 58% 9% 14% 4% West Sussex 206 186 127 9 68% 73% 63% 5% 8% 2% Westminster 15ꜝ 22 11 6 50% 73% 27% 28% 49% 7% Wigan 79 76 49 4 65% 74% 56% 5% 9% 1% Wiltshire 186 160 102 16 64% 70% 58% 10% 14% 6% Windsor and Maidenhead 28ꜝ 21 14 3 67% 81% 53% 14% 25% 3% Wirral 98 117 64 17 55% 64% 46% 14% 20% 8% Wokingham 54 50 28 7 56% 67% 45% 14% 22% 6% Wolverhampton 34ꜝ 44 32 1 73% 87% 59% 2% 6% 0% Worcestershire 151 131 71 12 55% 62% 48% 9% 13% 5% York 82 73 49 8 67% 76% 58% 11% 17% 5%

213
These summary scores have been created by combining respondents' answers to the question numbers listed at the top of the column. This means the highest possible score is 6, and the lowest possible score is -6. For instance, the overall satisfaction score has been calculated by combining the answers to G3, C7 and G2. At each question a value of 2 has been attributed to answers of 'strongly agree' or 'very satisfied', decreasing to -2 for answers of 'strongly disagree' or 'very dissatisfied'.
Local authority Unweighted total Total
Overall quality scores
Overall Satisfaction
Score (G3/C7/G2)
Ease of process score
(G1)
Difference made score
(E1)
Unweighted row 13643 13643 1.63 1.35 1.75 Total 13643 13642 1.65 1.36 1.76 Barking and Dagenham 31ꜝ 31 2.40 1.31 2.09 Barnet 78 80 1.51 0.77 1.43 Barnsley 45ꜝ 49 1.47 0.84 1.59 Bath and North East Somerset 81 71 2.15 1.39 2.08 Bedford 75 69 1.38 1.38 1.37 Bexley 76 59 1.25 0.39 1.43 Birmingham 244 317 1.56 1.37 1.81 Blackburn with Darwen 36ꜝ 61 2.02 1.78 2.03 Blackpool 33ꜝ 45 2.21 2.82 2.03 Bolton 74 78 2.19 1.54 2.09 Bournemouth 78 78 1.63 1.56 1.80 Bracknell Forest 42ꜝ 42 1.25 1.48 1.18 Bradford 125 119 2.00 1.81 2.02 Brent 80 97 1.89 0.83 2.21 Brighton and Hove 61 56 1.05 0.75 1.39

214
Local authority Unweighted total Total
Overall quality scores
Overall Satisfaction
Score (G3/C7/G2)
Ease of process score
(G1)
Difference made score
(E1)
Bristol City of 104 100 1.41 1.59 1.88 Bromley 69 65 1.65 1.86 1.36 Buckinghamshire 127 98 1.50 0.92 1.89 Bury 68 96 2.12 2.03 2.06 Calderdale 99 84 1.51 1.61 1.43 Cambridgeshire 238 201 1.56 1.38 1.59 Camden 44ꜝ 59 2.07 1.58 1.98 Central Bedfordshire 51 43 2.13 1.96 2.10 Cheshire East 90 79 1.28 0.65 1.56 Cheshire West and Chester 105 101 1.31 0.45 1.84 City of London Cornwall 129 99 1.21 1.24 1.46 Coventry 58 75 1.10 0.84 0.94 Croydon 104 131 1.87 1.49 2.01 Cumbria 257 212 2.19 1.79 2.13 Darlington 20ꜝ 22 2.35 2.01 2.42 Derby 70 66 1.41 1.14 1.58 Derbyshire 168 141 1.61 0.84 2.28 Devon 75 74 0.99 0.74 1.09 Doncaster 40ꜝ 46 2.23 1.98 1.56

215
Local authority Unweighted total Total
Overall quality scores
Overall Satisfaction
Score (G3/C7/G2)
Ease of process score
(G1)
Difference made score
(E1)
Dorset 62 56 1.58 1.19 2.02 Dudley 61 45 1.63 1.71 1.64 Durham 205 219 1.81 1.80 1.35 Ealing 69 79 1.26 0.05 1.30 East Riding of Yorkshire 71 49 1.70 1.59 1.63 East Sussex 126 110 1.04 0.62 1.70 Enfield 64 74 2.03 1.65 2.32 Essex 254 230 1.67 1.47 1.98 Gateshead 91 85 1.47 1.44 1.57 Gloucestershire 181 184 1.54 1.20 1.59 Greenwich 66 45 1.83 1.50 1.60 Hackney 63 70 2.60 0.88 2.81 Halton 28ꜝ 32 2.80 2.35 2.72 Hammersmith and Fulham 19ꜝ 18 1.97 0.17 2.38 Hampshire 355 293 1.24 0.84 1.72 Haringey 54 55 1.46 0.53 1.77 Harrow 66 63 2.71 1.80 2.71 Hartlepool 20ꜝ 28 2.84 3.07 3.03 Havering 64 57 1.83 1.70 1.81 Herefordshire 44ꜝ 51 1.66 1.96 1.56 Hertfordshire 360 335 1.08 1.09 1.33

216
Local authority Unweighted total Total
Overall quality scores
Overall Satisfaction
Score (G3/C7/G2)
Ease of process score
(G1)
Difference made score
(E1)
Hillingdon 90 95 2.01 1.38 2.13 Hounslow 51 61 1.54 1.15 2.27 Isle of Wight 60 43 1.53 1.19 1.59 Isles Of Scilly Islington 34ꜝ 49 1.28 0.52 1.21 Kensington and Chelsea 8ꜝ 10 1.89 -0.98 3.24 Kent 591 546 1.77 1.48 1.90 Kingston upon Hull City of 34ꜝ 42 1.87 1.87 2.38 Kingston upon Thames 42ꜝ 38 1.17 0.82 1.78 Kirklees 90 120 1.97 2.04 1.91 Knowsley 47ꜝ 67 1.98 1.21 1.85 Lambeth 87 95 2.35 1.23 2.42 Lancashire 210 275 1.49 1.44 1.56 Leeds 219 215 1.57 1.60 1.45 Leicester 61 91 1.95 1.24 1.90 Leicestershire 270 278 1.35 1.17 1.54 Lewisham 63 59 1.96 0.73 2.27 Lincolnshire 257 223 1.83 1.88 1.62 Liverpool 69 87 1.61 1.26 1.64 Luton 54 59 2.07 1.96 1.67

217
Local authority Unweighted total Total
Overall quality scores
Overall Satisfaction
Score (G3/C7/G2)
Ease of process score
(G1)
Difference made score
(E1)
Manchester 169 212 1.95 1.49 2.04 Medway 131 156 1.68 1.13 1.76 Merton 45ꜝ 48 1.23 0.64 1.62 Middlesbrough 33ꜝ 36 2.59 1.52 2.77 Milton Keynes 146 161 1.60 1.50 1.52 Newcastle upon Tyne 65 76 2.36 2.52 1.98 Newham 30ꜝ 31 1.62 0.59 1.09 Norfolk 146 128 1.10 0.83 1.84 North East Lincolnshire 39ꜝ 42 2.12 1.88 1.54 North Lincolnshire 47ꜝ 42 1.80 1.86 1.51 North Somerset 27ꜝ 28 0.98 0.60 1.04 North Tyneside 50 44 0.78 0.45 1.58 North Yorkshire 163 139 1.47 1.11 1.69 Northamptonshire 161 170 1.58 1.25 1.48 Northumberland 68 56 1.08 0.85 1.48 Nottingham 54 60 2.29 1.68 1.70 Nottinghamshire 162 142 1.39 1.23 1.19 Oldham 23ꜝ 27 2.13 2.13 2.30 Oxfordshire 152 120 1.93 1.83 1.81 Peterborough 35ꜝ 44 1.36 1.03 1.73 Plymouth 115 133 1.79 2.22 1.67

218
Local authority Unweighted total Total
Overall quality scores
Overall Satisfaction
Score (G3/C7/G2)
Ease of process score
(G1)
Difference made score
(E1)
Poole 24ꜝ 23 1.58 1.04 1.01 Portsmouth 44ꜝ 39 1.96 1.78 2.50 Reading 29ꜝ 47 1.89 1.10 1.42 Redbridge 79 83 2.39 1.96 2.23 Redcar and Cleveland 66 59 1.21 1.13 1.64 Richmond upon Thames 50 57 0.11 -0.38 1.32 Rochdale 74 78 1.40 1.34 1.81 Rotherham 81 67 1.82 1.97 2.06 Rutland 10ꜝ 11 0.70 0.70 1.00 Salford 43ꜝ 50 1.56 0.95 1.83 Sandwell 54 55 1.88 2.06 2.19 Sefton 45ꜝ 33 0.92 0.55 1.48 Sheffield 52 53 0.13 0.23 1.20 Shropshire 118 96 1.75 1.44 1.85 Slough 29ꜝ 26 1.88 1.39 2.17 Solihull 48ꜝ 49 0.93 1.55 1.07 Somerset 63 57 0.89 0.38 1.52 South Gloucestershire 82 78 1.48 1.59 1.99 South Tyneside 61 71 1.45 2.43 0.95 Southampton 42ꜝ 61 1.17 0.39 1.74

219
Local authority Unweighted total Total
Overall quality scores
Overall Satisfaction
Score (G3/C7/G2)
Ease of process score
(G1)
Difference made score
(E1)
Southend-on-Sea 76 76 1.90 1.66 2.01 Southwark 95 91 1.79 1.27 2.10 St. Helens 26ꜝ 34 1.00 0.81 0.42 Staffordshire 129 113 2.20 1.47 2.46 Stockport 129 134 2.01 2.13 1.92 Stockton-on-Tees 70 91 1.67 2.20 1.14 Stoke-on-Trent 54 54 1.89 0.82 2.13 Suffolk 93 85 1.93 1.84 2.19 Sunderland 96 97 1.25 1.19 1.05 Surrey 258 249 1.20 0.73 1.49 Sutton 67 62 1.74 1.03 2.19 Swindon 56 53 1.74 1.40 1.82 Tameside 35ꜝ 60 1.53 0.62 1.51 Telford and Wrekin 36ꜝ 49 2.27 0.97 1.74 Thurrock 39ꜝ 39 1.74 2.09 2.28 Torbay 77 72 2.03 2.28 1.72 Tower Hamlets 62 108 1.79 1.27 2.02 Trafford 68 60 0.53 0.28 1.15 Wakefield 72 95 1.96 1.90 1.76 Walsall 77 61 1.93 1.31 2.21 Waltham Forest 59 49 1.77 1.09 2.23

220
Local authority Unweighted total Total
Overall quality scores
Overall Satisfaction
Score (G3/C7/G2)
Ease of process score
(G1)
Difference made score
(E1)
Wandsworth 52 67 1.92 1.43 2.91 Warrington 100 106 1.93 1.54 1.66 Warwickshire 102 111 2.17 2.24 2.11 West Berkshire 89 78 1.84 2.04 1.82 West Sussex 206 186 1.77 1.35 2.23 Westminster 15ꜝ 22 1.12 0.48 1.80 Wigan 79 76 2.21 2.09 1.77 Wiltshire 186 160 1.66 1.38 1.82 Windsor and Maidenhead 28ꜝ 21 1.05 0.46 2.17 Wirral 98 117 1.41 1.49 1.47 Wokingham 54 50 1.43 1.22 1.54 Wolverhampton 34ꜝ 44 2.50 1.89 2.79 Worcestershire 151 131 1.57 1.35 1.48 York 82 73 1.69 1.59 1.03

221
© Department for Education, 2017
Reference: DFE-RR657
ISBN: 978-1-78105-726-1
The views expressed in this report are the authors’ and do not necessarily reflect those of the Department for Education.
Any enquiries regarding this publication should be sent to us at: [email protected] or www.education.gov.uk/contactus
This document is available for download at www.gov.uk/government/publications