experiences from latin america preventive resettlement ... · hazards and their disaster...
TRANSCRIPT

Preventive Resettlement of Populations at Risk of D
isaster: Experiences from Latin A
merica
Preventive Resettlement of Populations at Risk of DisasterExperiences from Latin America
Elena CorreaEditor
Preventive Resettlement of Populations at Risk of DisasterExperiences from Latin America
The Latin American and the Caribbean Region faces two increasingly stark trends: rapid urbanization and
frequent natural disasters. Combined, they substantially increase the intensive risk of disasters to which
thousands of people are exposed.
Preventive Resettlement of Populations at Risk of Disaster: Experiences from Latin America presents case
studies from Argentina, Brazil, Colombia and Guatemala that offer an overview of the countries’ main
hazards and their disaster risk-management systems. Also, they illustrate how preventive resettlement has
been incorporated as a disaster risk-reduction measure, and describe resettlement alternatives, institutional
arrangements, sources of financing and recovery and control of reclaimed areas.
These experiences provide important lessons for future interventions and can help other countries currently
developing risk reduction strategies.
Global Facility for Disaster Reduction and Recovery1818 H Street, NWWashington, DC 20433, USATelephone: 202-458-0268Facsimile: 202-522-3227Web site: www.gfdrr.org
Special thanks and appreciation are extended to the partners who support GFDRR’s work to protect livelihood and improve lives:
ACP Secretariat, Arab Academy for Science, Technology and Maritime Transport, Australia, Bangladesh, Belgium, Brazil, Canada,
China, Colombia, Denmark, Egypt, European Commission, Finland, France, Germany, Haiti, India, Indonesia, International Federation
of Red Cross and Red Crescent Societies, Ireland, Italy, Japan, Luxembourg, Malawi, Mexico, The Netherlands, New Zealand, Nigeria,
Norway, Portugal, Saudi Arabia, Senegal, South Africa, South Korea, Spain, Sweden, Switzerland, Turkey, United Kingdom, United
Nations Development Programme, United States, UN International Strategy for Disaster Reduction, Vietnam, The World Bank,
and Yemen.
TURKEYSWEDEN UNITED STATES YEmENSPAIN UNITED KINGDOmSWITZERLAND VIETNAm
AUSTRALIA CANADABELGIUm COLOmBIA EGYPTBANGLADESh ChINABRAZIL DENmARK FINLAND
mExICO NORWAYNEW ZEALAND SAUDI ARABIA SOUTh AFRICAThE NEThERLANDS PORTUGALNIGERIA SENEGAL SOUTh KOREA
FRANCE INDONESIAhAITI ITALY LUxEmBOURGGERmANY IRELANDINDIA JAPAN mALAWI
Preventive Resettlement of Populations at Risk of DisasterExperiences from Latin America
Elena CorreaEditor
Preventive Resettlement of Populations at Risk of Disaster: Experiences from Latin America
Copyright © 2011 by The International Bank for Reconstruction and DevelopmentThe World Bank, 1818 H Street, N.W.Washington, DC 20433, U.S.A.Internet: www.worldbank.org
All Rights ReservedPrinting and Manufactured in Washington, DC, 2011First Printing: September, 2011
This book was originally published by The World Bank and Global Facility for Disaster Risk and Recovery (GFDRR) in Spanish as Reasentamiento preventivo de poblaciones en riesgo de desastre: Experiencias de América Latina in May 2011.
The findings, interpretations, and conclusions expressed in this book are entirely those of the authors and should not be attrib-uted in any manner to the World Bank, to its affiliated organizations, to members of its Board of Executive Directors, the countries they represent, or the Ministry of Federal Planning, Public Investment and Services (Ministerio de Planificación Federal, Inversión Pública y Servicios), Argentina; the Municipal Housing Secretariat, São Paulo Major’s Office (Secretaria Municipal da Habitação da Prefeitura do Municipio de São Paulo) Brazil; the Low Income Population Housing Agency of Bogotá (Caja de Vivienda Popular de Bogotá), Colombia; and the Office of the President (Presidencia de la República), Guatemala.
The World Bank, the GFDRR, the Municipal Housing Secretariat, São Paulo Major’s Office (Secretaria Municipal da Habitação da Prefeitura do Municipio de São Paulo) Brazil; the Low Income Population Housing Agency of Bogotá (Caja de Vivienda Popular de Bogotá), Colombia; and the Office of the President (Presidencia de la República), Guatemala, do not guarantee the accuracy of the data included in this publication and accepts no responsibility for any consequence of their use. The boundaries, colors, denomina-tions, and other information shown on any map in this volume do not imply on the part of the World Bank Group any judgment on the legal status of any territory or the endorsement or acceptance of such boundaries.
Rights and PermissionsThe material in this publication is copyrighted. The World Bank and GFDRR encourage dissemination of its work and normally will promptly grant permission to reproduce portions of the work. For permission to photocopy or reprint any part of this work, as well as all other queries on rights and licenses, including subsidiary rights, please send a request with complete information to the Office of the Publisher, The World Bank, 1818 H Street NW, Washington, DC 20433, USA; fax: 202-522-2422; e-mail: [email protected].
The World BankCover and Design: Miki Fernández
Preventive resettlement for populations at risk of disaster: Experiences from Latin America / Haris Sanahuja… [et al.]; Elena Correa - Editor. – Washington, DC : The World Bank : GFDRR, 2011. 121 p. : xx. 1. Preventive resettlement – Argentina – Case study. – 2. Preventive resettlement – Brazil – Case study. – 3. Preventive resettle-ment – Colombia – Case study. – 4. Preventive resettlement –Guatemala – Case study. – 5. Argentina – Preventive resettlement – Case study. – 6. Brazil – Preventive resettlement – Case study. – 7. Colombia – Preventive resettlement – Case study. – 8. Guatemala – Preventive resettlement – Case study. – I. Sanahuja, Haris, coaut. – II. Zelmeister, Ignacio, coaut. – III. Pérez, Rómulo, coaut. – IV. Scombatti, Marilia, coaut. – V. Marques, Ronaldo, coaut. – VI. Poveda Gómez, Narzha, coaut. – VII. Aguirre Cantero, Eduardo, coaut. – VIII. Carmona, Sergio Iván, coaut. – IX. Correa, Elena, comp.

Abbreviations ........................................................................................................................................................ xForeword ............................................................................................................................................................... xviiIntroduction .......................................................................................................................................................... xviii
Chapter 1Global and Latin America and the Caribbean Natural Disaster Trends Haris Sanahuja
1. Global Patterns and Trends in the Occurrence and Impacts of Disasters ................................................. 11.1. The Impacts of Disasters ....................................................................................................................... 31.2. Differential Distribution of Risk ......................................................................................................... 51.3. Intensive and Extensive Risk ................................................................................................................ 51.4. A Changing Climate ............................................................................................................................. 6
2. Disaster Risk Patterns and Trends in Latin America and the Caribbean ................................................... 62.1. Disaster Occurrence .............................................................................................................................. 72.2. Disaster Impact Trends ......................................................................................................................... 82.3. Disaster Risk Configuration in the Region ........................................................................................ 92.4. Vulnerability and Risk-driving Factors .............................................................................................. 102.5. Urban Areas and the Construction of Vulnerabilities ..................................................................... 102.6. Rural Areas and the Construction of Vulnerabilities ....................................................................... 122.7. Governance and Institutional Vulnerability ...................................................................................... 12
3. Institutional Frameworks and Strategies for Disaster Risk Reduction ........................................................ 133.1. Different Approaches and Tools for Risk Management .................................................................... 153.2. Risk Reduction Challenges ................................................................................................................... 15
References .................................................................................................................................................................. 17Web Resources .......................................................................................................................................................... 18
Chapter 2Resettlement as a Disaster Risk Reduction Measure: Case Studies Elena Correa
1. Preventive Resettlement .................................................................................................................................... 192. The Benefits of Preventive Resettlement .......................................................................................................... 193. Case Studies ......................................................................................................................................................... 21
3.1. Objectives ................................................................................................................................................ 213.2 Scope of the Case Studies ...................................................................................................................... 223.3 Methodology .......................................................................................................................................... 22
iii
Contents

Preventive Resettlement of Populations at Risk of Disaster: Experiences from Latin America
Chapter 3
Argentina: Response to Recurrent Floods: Assisted Self-Construction Housing Program Rómulo Pérez
Ignacio Zelmeister
A. Country Context and Disaster Risk Management ................................................................................ 25
1. Population and Urbanization ............................................................................................................................ 252. Regional Disparities ............................................................................................................................................ 263. Socio-natural Disasters ....................................................................................................................................... 264. Disaster Risk Management ............................................................................................................................... 27
B. Case Study: Resettlement of Inhabitants of Flood-prone Areas .................................................. 301. The Housing Subprogram (Subprograma de Vivienda, SPV) ....................................................................... 302. Participating Entities .......................................................................................................................................... 313. Assisted Self-construction: The Strategy Selected .......................................................................................... 314. Flood Protection Program (PPI) ..................................................................................................................... 325. Outcomes ............................................................................................................................................................. 386. Lessons Learned .................................................................................................................................................. 407. External Evaluations .......................................................................................................................................... 41References .................................................................................................................................................................. 42
Chapter 4 Brazil: Changes in the Quality of Life for People in High Risk Areas Ronaldo Marques
Marilia Scombatti
A. Country Context ............................................................................................................................................... 431. Urbanization and Regional Disparities ........................................................................................................... 432. Socio-natural Disasters ...................................................................................................................................... 433. Disaster Risk Management ............................................................................................................................... 45
B. The City of São Paulo .................................................................................................................................... 46 1. Disaster Risk Management ............................................................................................................................... 46
C. Case Study: Stream Canalization Program II ....................................................................................... 48
1. Objectives ............................................................................................................................................................ 482. Components ........................................................................................................................................................ 493. Institutional Organization ................................................................................................................................ 494. Profile of the Population .................................................................................................................................... 505. Resettlement Alternatives ................................................................................................................................. 506. Social Management ............................................................................................................................................ 527. Budget and Resettlement Costs ........................................................................................................................ 538. Outcomes ............................................................................................................................................................ 53
iv
9. Lessons Learned During the Relocation Process .......................................................................................... 54References .................................................................................................................................................................. 57
Chapter 5
Colombia: Nueva Esperanza: A Resettlement Case with Risk Management and Land Use Planning Approach Narzha Poveda Gómez
A. Country Context .................................................................................................................................................. 591. Population ........................................................................................................................................................... 592. Disaster Risk Management ................................................................................................................................ 603. The National Emergency Relief and Prevention System ............................................................................... 614. Incorporation of Risk Prevention in Development Planning ...................................................................... 625. Financing Risk Management ............................................................................................................................ 626. Resettlement: A Risk Prevention and Reduction Strategy ............................................................................ 62
B. Capital District of Bogotá ................................................................................................................................. 631. Population Growth and Settlement Patterns................................................................................................... 632. Main Hazards ....................................................................................................................................................... 643. Risk Management and the Bogotá District Emergency Prevention and Relief System ........................... 64
C. Case Study: The Nueva Esperanza Resettlement ................................................................................. 671. Studies to Identify the Risk Reduction Measures .......................................................................................... 672. Rehabilitation, Reconstruction and Sustainable Development Plan .......................................................... 683. Resettlement Program ....................................................................................................................................... 684. Impacts of Displacement ................................................................................................................................... 725. Institutional Organization ................................................................................................................................. 726. Eligibility Criteria and Principles Governing the Resettlement Process ................................................... 737. Stages in the Resettlement Process .................................................................................................................. 738. Rehabilitation and Restoration of High-risk Lots ......................................................................................... 789. Post-Resettlement Stage .................................................................................................................................... 7810. Cost ...................................................................................................................................................................... 7911 Main Challenges ................................................................................................................................................. 7912. Lessons Learned ................................................................................................................................................. 81References .................................................................................................................................................................. 82Bibliography .............................................................................................................................................................. 83
Chapter 6 Guatemala: The First Tz´utujil City of the Twenty-First Century Eduardo Aguirre Cantero
A. Country Context and Disaster Risk Management ................................................................................ 851. Population, Cultural Diversity and Exclusion ................................................................................................ 852. Hazards, Vulnerability and Risks ..................................................................................................................... 86
Table of Contents v

Preventive Resettlement of Populations at Risk of Disaster: Experiences from Latin America
3. Socio-natural Disasters ...................................................................................................................................... 864. Risk Management ............................................................................................................................................... 87
B. Case Study: Panabaj and Tz’anchaj – Reconstruction with Transformation ............................. 90
1. Impacts of Tropical Storm Stan ........................................................................................................................ 902. Key Challenges .................................................................................................................................................... 903. Reconstruction with Transformation ............................................................................................................... 904. Consequences of Tropical Storm Stan in Panabaj and Tz’anchaj ................................................................ 945. Spontaneous Reaction of Communities to the Disaster ............................................................................... 946. Reaction of Institutions and Temporary Resettlement of Families ............................................................ 947. An Initial, Inadequately Planned Resettlement Attempt............................................................................... 958. Reorienting and Planning the Resettlement Process .................................................................................... 959. Articulation of the Reconstruction Plan with the Land Planning Strategy ............................................... 9610. Institutional Organization ................................................................................................................................ 9711. Participation of Traditional Communities, Authorities and Organizations .............................................. 9812. Building Trust ..................................................................................................................................................... 9913. Selecting Resettlement Sites and Acquiring Land .......................................................................................... 9914. The Chuk Muk Resettlement: A Heritage Recovered ................................................................................... 10015. Environmental Impact Study of the New Site ............................................................................................... 10016. Characteristics of the New Settlement ............................................................................................................ 10117. Budget .................................................................................................................................................................. 10218. Resettlement Schedule ....................................................................................................................................... 10219. Allocation and Titling of Houses ...................................................................................................................... 10220. Technical Training and Income Generation ................................................................................................... 10221. State of the Process ............................................................................................................................................. 10322. Lessons Learned ................................................................................................................................................. 103References .................................................................................................................................................................. 105Bibliography .............................................................................................................................................................. 106
Chapter 7
Comparative Analysis of the Case Studies Sergio Iván Carmona
Elena Correa
1. Urbanization, Risk and Vulnerability .............................................................................................................. 1072. Disaster Risk Management ............................................................................................................................... 1083. Resettlement as a Disaster Prevention Measure ............................................................................................ 1084. Resettlement as a Multidimensional Process ................................................................................................. 1095. Resettlement Planning ....................................................................................................................................... 1106. Housing Solutions .............................................................................................................................................. 1107. Payment for Housing Solutions ........................................................................................................................ 1118. Legal Titles to the Houses ................................................................................................................................. 1119. Environmental Impact Study of the Resettlement ........................................................................................ 112
vi

10. The Transition from the Informal to the Formal Sector .............................................................................. 11211. Restoration of Access to Social Services ......................................................................................................... 11212. Restoration of Income ........................................................................................................................................ 11213. Monitoring Risks and Contingency Plans ....................................................................................................... 11214. Community Participation ................................................................................................................................. 11315. Sources of Financing ........................................................................................................................................... 11416. Private Sector Participation ............................................................................................................................... 11417. Control of Reclaimed Areas .............................................................................................................................. 11418. Transparency and Accountability .................................................................................................................... 11519. Documenting and Systematizing Experiences .............................................................................................. 115
Glossary ......................................................................................................................................................................... 116
About the authors ................................................................................................................................................... 120Haris Sanahuja .......................................................................................................................................................... 120Elena Correa .............................................................................................................................................................. 118Rómulo Pérez ............................................................................................................................................................ 120Ignacio Zelmeister .................................................................................................................................................... 120Ronaldo Marques Margini ...................................................................................................................................... 121Marilia Scombatti ..................................................................................................................................................... 121Narzha Poveda Gómez ............................................................................................................................................. 121Eduardo Aguirre Cantero ........................................................................................................................................ 121Sergio Iván Carmona Maya ..................................................................................................................................... 121
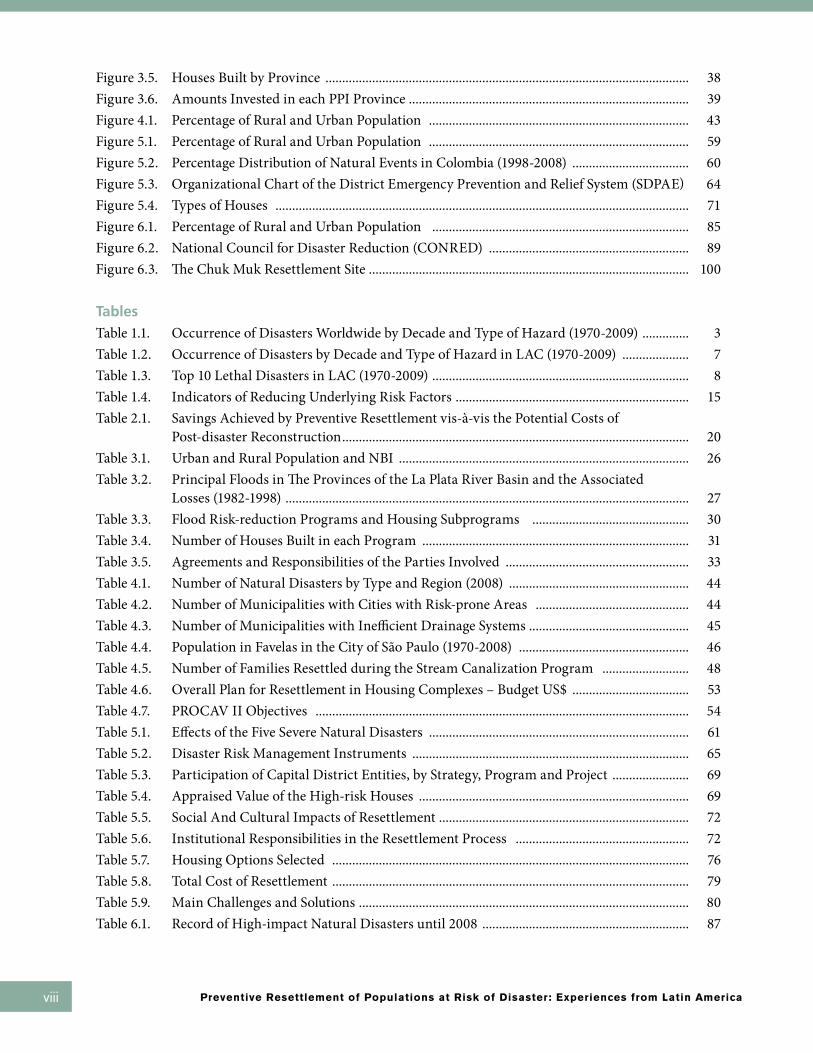
FiguresFigure 1.1. Occurrence of Geological and Hydrometeorological Disasters (1900-2009) ....................... 2Figure 1.2. Occurrence of Disasters Worldwide by Type of Hazard (1970-2009) .................................... 2Figure 1.3. Number of Persons Affected as a Share of the Average Population (1970-2009) ................. 3Figure 1.4. Percentage of Deaths by Type of Hazard (1970-2009) ............................................................. 4Figure 1.5. Percentage of Persons Affected by Type of Hazard (1970-2009) ............................................ 4Figure 1.6. Percentage of Economic Losses by Type of Hazard (1970-2009) ............................................ 4Figure 1.7. Disaster Occurrence in LAC by Type of Hazard ...................................................................... 7Figure 1.8. Percentage of Total Deaths by Type of Hazard in LAC .......................................................... 8Figure 1.9. Percentage of People Affected by Type of Hazard in LAC ...................................................... 9Figure 1.10. Percentage of Economic Losses by Type of Hazard in LAC .................................................. 9Figure 1.11. Pressures that Result in Disasters – Pressure and Release (PAR) Model ............................. 11Figure 1.12. Urbanization Trends in LAC ....................................................................................................... 11Figure 1.13. Hyogo Framework for Action (2005-2015) ................................................................................ 14Figure 3.1. Percentage Urban and Rural Population ................................................................................... 26Figure 3.2. Working Organizational Flow .................................................................................................... 34Figure 3.3. Drawings of a House ..................................................................................................................... 35Figure 3.4. Administrative Circuit of the Vouchers ..................................................................................... 37
Table of Contents vii
Preventive Resettlement of Populations at Risk of Disaster: Experiences from Latin America
Figure 3.5. Houses Built by Province ............................................................................................................. 38Figure 3.6. Amounts Invested in each PPI Province .................................................................................... 39Figure 4.1. Percentage of Rural and Urban Population .............................................................................. 43Figure 5.1. Percentage of Rural and Urban Population .............................................................................. 59Figure 5.2. Percentage Distribution of Natural Events in Colombia (1998-2008) ................................... 60Figure 5.3. Organizational Chart of the District Emergency Prevention and Relief System (SDPAE) 64Figure 5.4. Types of Houses ............................................................................................................................ 71Figure 6.1. Percentage of Rural and Urban Population ............................................................................. 85Figure 6.2. National Council for Disaster Reduction (CONRED) ............................................................ 89Figure 6.3. The Chuk Muk Resettlement Site ................................................................................................ 100
Tables
Table 1.1. Occurrence of Disasters Worldwide by Decade and Type of Hazard (1970-2009) .............. 3Table 1.2. Occurrence of Disasters by Decade and Type of Hazard in LAC (1970-2009) .................... 7Table 1.3. Top 10 Lethal Disasters in LAC (1970-2009) ............................................................................. 8Table 1.4. Indicators of Reducing Underlying Risk Factors ...................................................................... 15Table 2.1. Savings Achieved by Preventive Resettlement vis-à-vis the Potential Costs of
Post-disaster Reconstruction ........................................................................................................ 20Table 3.1. Urban and Rural Population and NBI ....................................................................................... 26Table 3.2. Principal Floods in The Provinces of the La Plata River Basin and the Associated
Losses (1982-1998) ......................................................................................................................... 27Table 3.3. Flood Risk-reduction Programs and Housing Subprograms ............................................... 30Table 3.4. Number of Houses Built in each Program ................................................................................ 31Table 3.5. Agreements and Responsibilities of the Parties Involved ....................................................... 33Table 4.1. Number of Natural Disasters by Type and Region (2008) ...................................................... 44Table 4.2. Number of Municipalities with Cities with Risk-prone Areas .............................................. 44Table 4.3. Number of Municipalities with Inefficient Drainage Systems ................................................ 45Table 4.4. Population in Favelas in the City of São Paulo (1970-2008) ................................................... 46Table 4.5. Number of Families Resettled during the Stream Canalization Program .......................... 48Table 4.6. Overall Plan for Resettlement in Housing Complexes – Budget US$ ................................... 53Table 4.7. PROCAV II Objectives ................................................................................................................ 54Table 5.1. Effects of the Five Severe Natural Disasters .............................................................................. 61Table 5.2. Disaster Risk Management Instruments ................................................................................... 65Table 5.3. Participation of Capital District Entities, by Strategy, Program and Project ....................... 69Table 5.4. Appraised Value of the High-risk Houses ................................................................................. 69Table 5.5. Social And Cultural Impacts of Resettlement ........................................................................... 72Table 5.6. Institutional Responsibilities in the Resettlement Process .................................................... 72Table 5.7. Housing Options Selected ........................................................................................................... 76Table 5.8. Total Cost of Resettlement ........................................................................................................... 79Table 5.9. Main Challenges and Solutions ................................................................................................... 80Table 6.1. Record of High-impact Natural Disasters until 2008 .............................................................. 87
viii

ix
Table 6.2. Institutions Involved in the Plan ................................................................................................. 97Table 6.3. Budget for the Santiago Atitlán Reconstruction Plan .............................................................. 102
Maps
Map 3.1. Regions and Provinces ................................................................................................................. 25Map 3.2. Population Density by Province .................................................................................................. 27Map 3.3. Flood Prone Areas ......................................................................................................................... 27Map 4.1. Regions and States ......................................................................................................................... 43Map 4.2. Drought Areas in the Northeast ................................................................................................. 45Map 4.3. At-risk Areas in São Paulo ........................................................................................................... 47Map 4.4. Location of PROCAV II Works and Resettlement Sites .......................................................... 49Map 5.1. Regions and Departments ............................................................................................................ 59Map 5.2. Localities of Bogotá ...................................................................................................................... 63Map 5.3. Geographical Location of Houses Chosen in other Departments ......................................... 77Map 5.4. Geographical Location of Houses Chosen in Bogotá’s Localities ......................................... 77Map 6.1 Political Division of the Republic of Guatemala ....................................................................... 83Map 6.2. Department of Sololá, Municiaplity of Santiago Atitlán .......................................................... 92
Boxes
Box 6.1. National Reconstruction Plan ..................................................................................................... 91Box 6.2. Disasters in the Mayan Worldview ............................................................................................. 94
Table of Contents
Preventive Resettlement of Populations at Risk of Disaster: Experiences from Latin America x
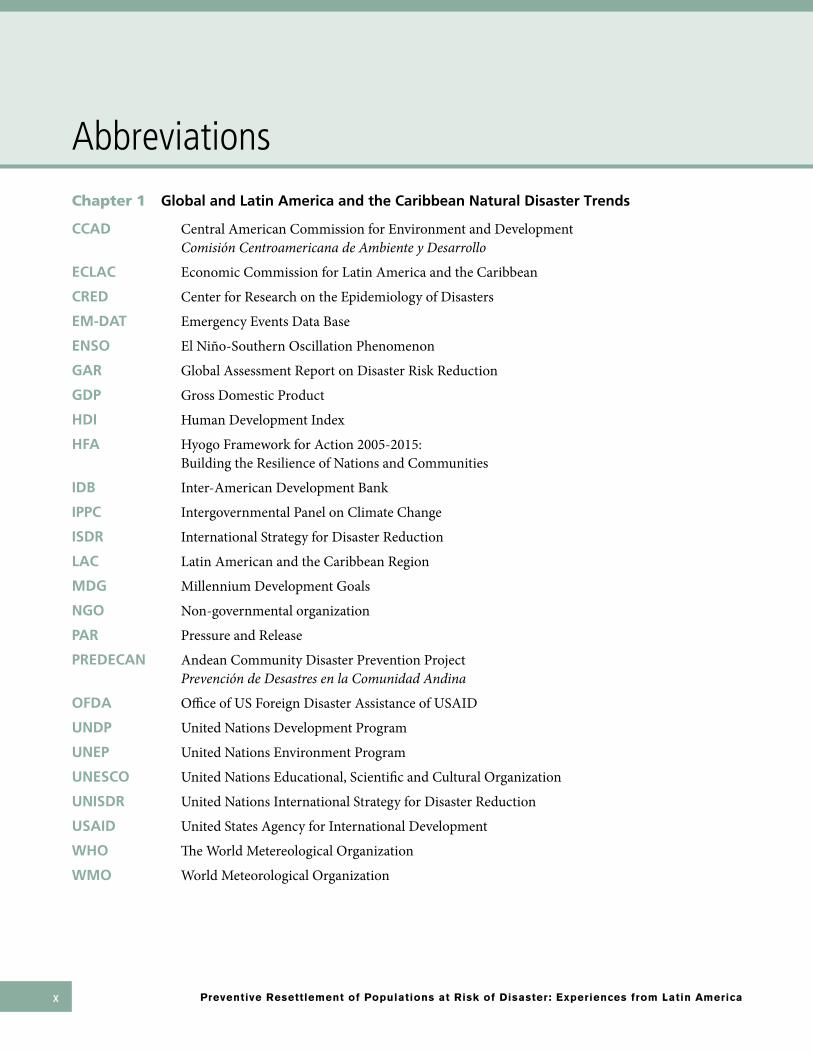
Chapter 1 Global and Latin America and the Caribbean Natural Disaster Trends
CCAD Central American Commission for Environment and Development Comisión Centroamericana de Ambiente y Desarrollo
ECLAC Economic Commission for Latin America and the Caribbean
CRED Center for Research on the Epidemiology of Disasters
EM-DAT Emergency Events Data Base
ENSO El Niño-Southern Oscillation Phenomenon
GAR Global Assessment Report on Disaster Risk Reduction
GDP Gross Domestic Product
HDI Human Development Index
HFA Hyogo Framework for Action 2005-2015: Building the Resilience of Nations and Communities
IDB Inter-American Development Bank
IPPC Intergovernmental Panel on Climate Change
ISDR International Strategy for Disaster Reduction
LAC Latin American and the Caribbean Region
MDG Millennium Development Goals
NGO Non-governmental organization
PAR Pressure and Release
PREDECAN Andean Community Disaster Prevention Project Prevención de Desastres en la Comunidad Andina
OFDA Office of US Foreign Disaster Assistance of USAID
UNDP United Nations Development Program
UNEP United Nations Environment Program
UNESCO United Nations Educational, Scientific and Cultural Organization
UNISDR United Nations International Strategy for Disaster Reduction
USAID United States Agency for International Development
WHO The World Metereological Organization
WMO World Meteorological Organization
Abbreviations

xi
Chapter 3 Argentina
CIA Central Intelligence Agency
COAH-INA Hydrological Early Warning Operations Center Centro Operativo de Alerta Hidrológico del InA
CONAE National Space Activities Commission Comisión nacional de Actividades Espaciales
EM-DAT Emergency Events Data Base
GDP Gross Domestic Product
HFA Hyogo Framework for Action
IGM Military Geographic Institute Instituto Geográfico Militar
IIED-ALL International Institute of Environment and Development – Latin America Instituto Internacional de Medio Ambiente y Desarrollo - América Latina
INA National Water and Environment Institute Instituto nacional del Agua y del Ambiente
INDEC Institute of Statistics and Censuses Instituto nacional de Estadísticas y Censos
INTA National Agricultural and Livestock Technology Institute Instituto nacional de Tecnología Agropecuaria
MDS Ministry of Social Development Ministerio de Desarrollo Social
NEA Northeast Argentinean Region
NWA Northwest Argentinean Region
NBI Unsatisfied Basic Needs necesidades básicas insatisfechas
PIDU Flood Prevention and Urban Dreinage Program Programa de Prevención de Inundaciones y Drenaje Urbano
PPI Flood Protection Program Programa de Protección contra Inundaciones
PREI Flood Emergency Rehabilitation Program Programa de Rehabilitación por la Emergencia de las Inundaciones
Abbreviations

Preventive Resettlement of Populations at Risk of Disaster: Experiences from Latin America
SEGEMAR Argentine Mining Geology Service Servicio Geológico Minero Argentino (Argentina)
SIFEM Federal Emergencies System Sistema Federal de Emergencias
SMN National Meteorological Service Servicio Meteorológico nacional (Fuerza Aérea Argentina)
SPV Housing Subprogram Suprograma de vivienda
SUCCE Central Emergency Coordination Subunit Subunidad Central de Coordinación para la Emergencia
SUPCE Provincial Emergency Coordination Subunits Subunidades Provinciales de Coordinación para la Emergencia
Provincial Implementing Units Unidades Ejecutoras Provinciales
Chapter 4 Brazil
ANA National Water Agency Agencia nacional das Aguas
CGE Emergency Management Center Centro Gerenciamento de Emergências
CODDEC Civil Defense Coordination Office Coordenadoria Distrital de Defesa Civil
COMDEC Municipal Civil Defense Coordination Office Coordenadorias Municipais de Defesa Civil
CPTEC Center for Weather Forecasts and Climate Studies Centro de Previsão de Tempo e Estudos Climáticos
FIPE Economic Research Institute Foundation Fundação Instituto de Pesquisas Econômicas
GePROCAV PROCAV Management Unit Unidade de Gestão de PROCAV
FUNCAP Special Fund for Public Calamities Fundo Especial para Calamidades Públicas
IBGE Brazil’s Geography and Statistics Institute Instituto Brazileiro de Geografia e Estatística
IDB Inter-American Development Bank
INPE National Institute for Space Research Instituto nacional de Pesquisas Espaciais
NGO Non-governmental organizations
xii
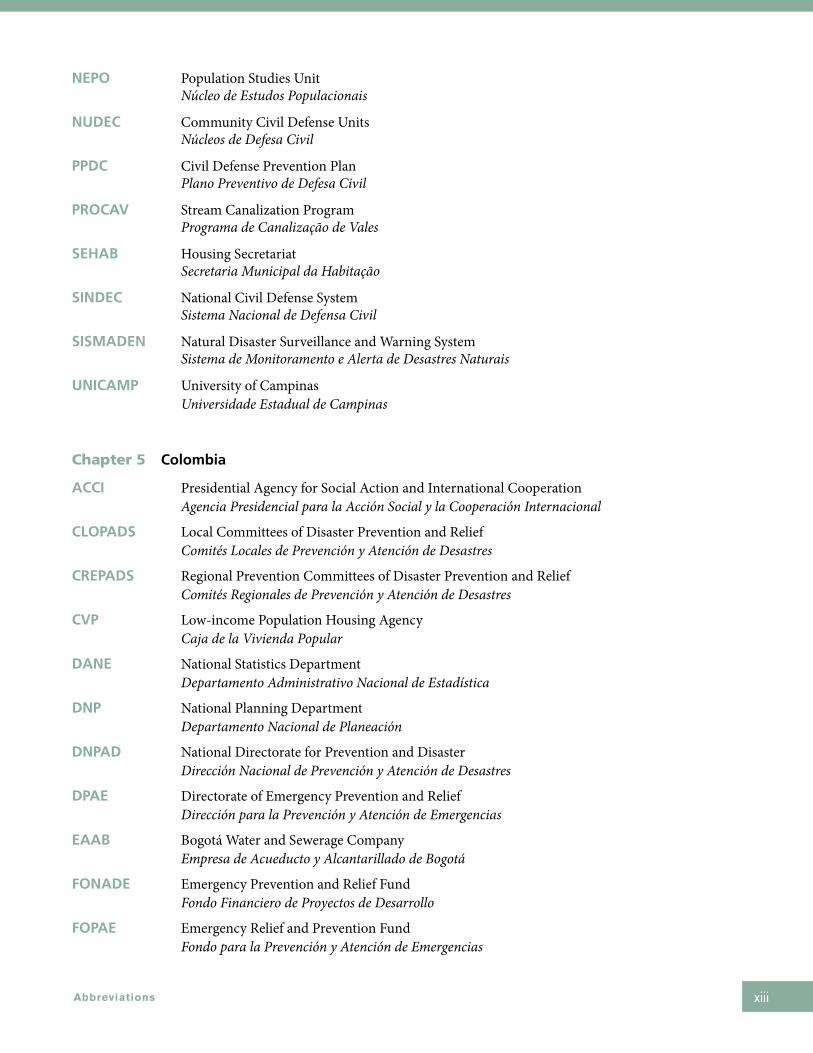
NEPO Population Studies Unit núcleo de Estudos Populacionais
NUDEC Community Civil Defense Units núcleos de Defesa Civil
PPDC Civil Defense Prevention Plan Plano Preventivo de Defesa Civil
PROCAV Stream Canalization Program Programa de Canalização de Vales
SEHAB Housing Secretariat Secretaria Municipal da Habitação
SINDEC National Civil Defense System Sistema nacional de Defensa Civil
SISMADEN Natural Disaster Surveillance and Warning System Sistema de Monitoramento e Alerta de Desastres naturais
UNICAMP University of Campinas Universidade Estadual de Campinas
Chapter 5 Colombia
ACCI Presidential Agency for Social Action and International Cooperation Agencia Presidencial para la Acción Social y la Cooperación Internacional
CLOPADS Local Committees of Disaster Prevention and Relief Comités Locales de Prevención y Atención de Desastres
CREPADS Regional Prevention Committees of Disaster Prevention and Relief Comités Regionales de Prevención y Atención de Desastres
CVP Low-income Population Housing Agency Caja de la Vivienda Popular
DANE National Statistics Department Departamento Administrativo nacional de Estadística
DNP National Planning Department Departamento nacional de Planeación
DNPAD National Directorate for Prevention and Disaster Dirección nacional de Prevención y Atención de Desastres
DPAE Directorate of Emergency Prevention and Relief Dirección para la Prevención y Atención de Emergencias
EAAB Bogotá Water and Sewerage Company Empresa de Acueducto y Alcantarillado de Bogotá
FONADE Emergency Prevention and Relief Fund Fondo Financiero de Proyectos de Desarrollo
FOPAE Emergency Relief and Prevention Fund Fondo para la Prevención y Atención de Emergencias
Abbreviations xiii

Preventive Resettlement of Populations at Risk of Disaster: Experiences from Latin America
IDRD Instituto Distrital para la Recreación y el Deporte
INGEOMINAS Colombian Institute of Mining and Geology Ministerio de Minas y Energía - Instituto Colombiano de Minería y Geología
NBI Unsatisficed Basic Needs necesidades Básicas Insatisfechas
PEDEN Entre Nubes District Ecological Park Parque Ecológico Distrital Entre nubes
POT Land Management Plan Plan de Ordenamiento Territorial
PNUD Programa de las Naciones Unidas para el Desarrollo
SDPAE District Emergency Prevention and Relief System Sistema Distrital para la Prevención y Atención de Emergencias
SIRE Risk Management and Emergency Relief Information System Sistema de Información para la Gestión de Riesgos y Atención de Emergencias
SISBEN System for Potential Beneficiaries of Social Programs Sistema de Identificación y Clasificación de Potenciales Beneficiarios para Programas Sociales
SMLV Legal Minimum Wages Salario mínimo legal vigente
SNPAD National Emergency Relief and Prevention System Sistema nacional de Prevención y Atención de Desastres
UPR Rural Planning Units Unidades de Planeamiento Rural
UPZ Zonal Planning Units Unidades de Planeación Zonal
VUR Sole Recognized Value Valor Único de Reconocimiento
Chapter 6 Guatemala
AACID Andalusian Cooperation Agency Agencia Andaluza de Cooperación Internacional al Desarrollo
AMSCLAE Authority for Sustainable Management of the Lake Atitlán Basin and Surrounding Areas Autoridad y Manejo Sostenible de la Cuenca del Lago de Atitlán y su Entorno
AECID Spanish Cooperation Agency Agencia Española de Cooperación Internacional para el Desarrollo
CEPAL Economic Commission for Latin American and the Caribbean Comisión Económica para América Latina y el Caribe
CEPREDENAC Coordination for Natural Disaster Prevention in Central America Centro de Coordinación para la Prevención de los Desastres naturales en América Central
xiv
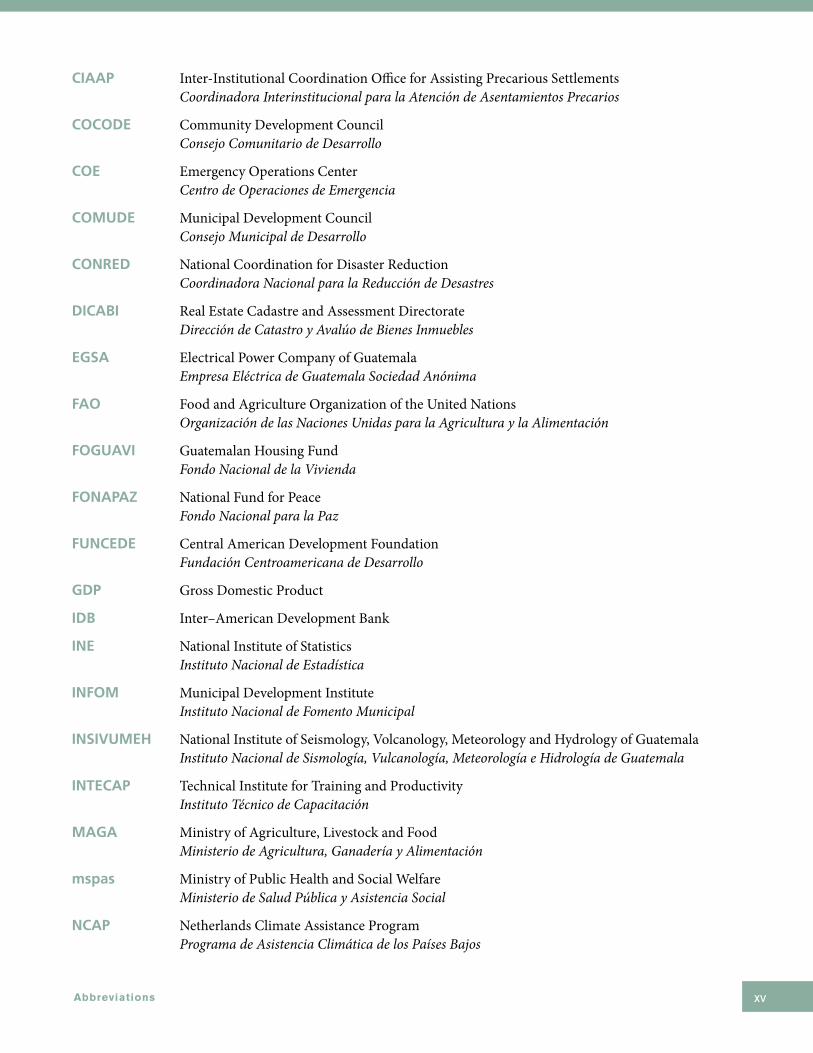
CIAAP Inter-Institutional Coordination Office for Assisting Precarious Settlements Coordinadora Interinstitucional para la Atención de Asentamientos Precarios
COCODE Community Development Council Consejo Comunitario de Desarrollo
COE Emergency Operations Center Centro de Operaciones de Emergencia
COMUDE Municipal Development Council Consejo Municipal de Desarrollo
CONRED National Coordination for Disaster Reduction Coordinadora nacional para la Reducción de Desastres
DICABI Real Estate Cadastre and Assessment Directorate Dirección de Catastro y Avalúo de Bienes Inmuebles
EGSA Electrical Power Company of Guatemala Empresa Eléctrica de Guatemala Sociedad Anónima
FAO Food and Agriculture Organization of the United Nations Organización de las naciones Unidas para la Agricultura y la Alimentación
FOGUAVI Guatemalan Housing Fund Fondo nacional de la Vivienda
FONAPAZ National Fund for Peace Fondo nacional para la Paz
FUNCEDE Central American Development Foundation Fundación Centroamericana de Desarrollo
GDP Gross Domestic Product
IDB Inter–American Development Bank
INE National Institute of Statistics Instituto nacional de Estadística
INFOM Municipal Development Institute Instituto nacional de Fomento Municipal
INSIVUMEH National Institute of Seismology, Volcanology, Meteorology and Hydrology of Guatemala Instituto nacional de Sismología, Vulcanología, Meteorología e Hidrología de Guatemala
INTECAP Technical Institute for Training and Productivity Instituto Técnico de Capacitación
MAGA Ministry of Agriculture, Livestock and Food Ministerio de Agricultura, Ganadería y Alimentación
mspas Ministry of Public Health and Social Welfare Ministerio de Salud Pública y Asistencia Social
NCAP Netherlands Climate Assistance Program Programa de Asistencia Climática de los Países Bajos
Abbreviations xv
Preventive Resettlement of Populations at Risk of Disaster: Experiences from Latin America
NGO Non-governmental Organization
OMP Municipal Planning Offices Oficinas Municipales de Planificación
PET Strategic Land-Use Plans Planificación Estratégica Territorial
PROPEVI Program for the Prevention and Eradication of Domestic Violence Programa de Prevención y Erradicación de la Violencia Intrafamiliar
SAA Secretariat of Agrarian Affairs of the Office of the President Secretaría de Asuntos Agrarios de la Presidencia
SIDA Swedish International Development Cooperation Agency
SCEP Executive Coordination Secretariat of the Office of the President Secretaría de Coordinación Ejecutiva de la Presidencia
SECONRED CONRED Executive Secretariat Secretaría Ejecutiva de la Conred
SEGEPLAN Secretariat for Planning of the Office of the President Secretaría de Planificación y Programación de la Presidencia
SIME Integrated Emergency Management System Sistema Integrado de Manejo de Emergencia
SINPET National System of Strategic Territorial Planning Sistema nacional de Planificación Estratégica Territorial
SISMICEDE Information Management System in the Event of Disasters Sistema de Manejo de la Información en Caso de Desastre
SEI Stockholm Environment Institute
SOSEP Social Works Secretariat of the First Lady Secretaría de Obras Sociales de la Esposa del Presidente
UDT Departmental Technical Unit Unidad Técnica Departamental
UNEPAR Executing Unit of the Rural Water Programme Unidad Ejecutora del Programa de Acueductos Rurales
UNICEF United Nations International Children Educational Fund
UNISDR United Nations International Strategy for Disaster Reduction
UNPD United Nations Development Programme
USAC University of San Carlos de Guatemala Universidad de San Carlos de Guatemala
USAID US Agency for International Development
xvi
Latin America and the Caribbean Region has the highest urbanization rate in the developing world, with 80 percent of the population living in cities. It is also the region that, after Asia, has the highest number of disasters a year.
The Haiti and Chile earthquakes in early 2010, and the major floods in Brazil, Colombia, and Venezuela at the end of that year, are recent examples of the onslaught of natural disasters impacting the region. In the last 40 years, these events have killed over half a million and left another 170 million hurt or homeless.
Major disasters since 1985, such the earthquake in Mexico and the nevado del Ruiz volcanic eruption in Colombia, have led governments to develop legislative and institutional frameworks for disaster risk management; these reflect a paradigm shift from an approach that focuses on emergency responses to one that reduces the risk factors by incorporating disaster risk management strategies in the development planning agendas.
Preventive resettlement of at-risk populations is now being implemented, among other disaster risk reduction measures. This publication, Preventive Resettlement of Populations at Risk of Disasters: Experiences from Latin America, presents case studies illustrating how various countries have incorporated this measure in innovative ways. Through examples included in this book, practitioners can compare the advantages and disadvantages of various resettlement alternatives, as well as learn how institutions have been organized and community awareness raised, the types of sources of financing obtained, and how reclaimed areas have been controlled, providing important lessons for future interventions.
These experiences can help guide other countries currently developing risk reduction strategies. This publication is a companion to the Populations at Risk of Disaster: A Resettlement Guide which details the steps taken to determine if resettlement is the pertinent measure and describes how to formulate and implement preventive resettlement programs as part of disaster risk reduction strategies.
Cyprian Fisiy Francis Ghesquiere Director Regional Coordinator Department of Social Development Disaster Risk Management
Foreword
Foreword xvii

Introduction
Rapid and unplanned urbanization have compounded vulnerabilities to natural disasters in the Latin American and the Caribbean Region (LAC). As a pre-ventive measure, resettlement has been carried out in some LAC countries in
recent years. The analysis and dissemination of the results of this strategy to countries worldwide is relevant and timely given the millions of people exposed to natural haz-ards, especially in developing nations. This was the main motivation for preparing the Argentina, Brazil, Colombia and Guatemala case studies presented in this publication.
Chapter I analyzes global natural disaster trends and their impacts. It also studies these trends in LAC and the principal factors that increase the vulnerability to natural disasters. Statistics on the occurrence of disasters, and especially their increasing impact in terms of loss of life and livelihoods, and overall economic losses, underscore the growing importance of disaster risk reduction frameworks at global and regional levels. The chapter concludes with a description of the strategic frameworks and institutional development that are been developed in the region.
Chapter II analyzes resettlement as a risk reduction measure and describes the objec-tives and methodology of the cases studied. The next four chapters present the find-ings of each. In those countries, either due to the impacts of major disasters such as in Colombia and Guatemala, or to recurrent events, such as floods in Argentina and Brazil, risk reduction plans include preventive resettlement.
Each case presents the country context, the area where the study was conducted, the geographical distribution of the population, the principal natural hazards to which it is exposed, the major disasters faced, and the specific risk management model applied.
The Argentina case presents the results from a housing subprogram, a non-structural component of the flood protection program carried out in 120 localities in seven provinces from 1997-2006. This subprogram forms part of an ongoing strategy to reduce the risk of floods that was adopted in 1993, during which 11,911 families have been resettled. This case is an example of resettlement based on Assisted Self-construction and Mutual Assistance Housing Construction. This approach involved the efforts of federal, provincial, and local governments, as well as beneficiaries and construction material suppliers working together in a decentralized, participatory process.
The Brazil case involved a resettlement program implemented in the second stage of the Streams Canalization Program (PROCAV II) in São Paulo, from 1995-2007. This program is one of a series of efforts to control the flooding that has wreaked havoc on the city of São Paulo for the past two decades. PROCAV II resettled 5,137 fami-lies, almost double the 2,585 resettled in PROCAV I. The case illustrates the various
Preventive Resettlement of Populations at Risk of Disaster: Experiences from Latin America xviii
options to resettle the population, including large housing complexes, new dwellings built in risk-free areas in the same neighborhoods, exchanges of houses between fami-lies whose homes were at risk and others whose were not, but who preferred to move to the housing complexes and cash compensation.
The Colombia case involved the resettlement of 1,074 families in Bogotá within a re-habilitation, reconstruction and sustainable development plan for the high-risk nueva Esperanza zone, which began in 2005. Its three components are: the environmental and at-risk land reclamation, the strengthening of social organization and community par-ticipation, and resettlement. This case illustrates a comprehensive approach to resettle-ment, which required strong inter-institutional coordination. It also presents different housing options including: the construction of new dwellings, the partnerships with private construction companies and grassroots housing organizations, and the pur-chase of homes on the market with the technical, legal and social support of the entity responsible for the program.
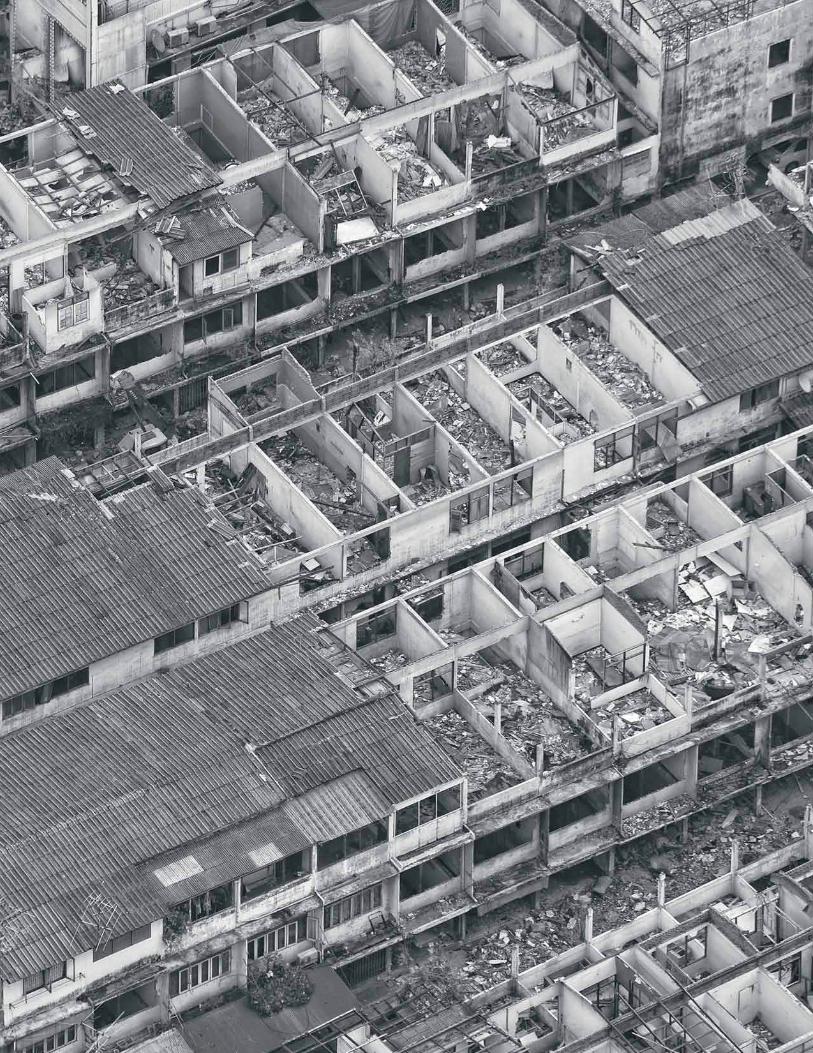
In the Guatemala case, the approach was part of a government policy of reconstruction with transformation developed after the Tropical Storm Stan disaster. The comprehen-sive approach to risk management applied during reconstruction included preventive resettlement of at-risk families. The study describes the experience of the districts (can-tones) of Panabaj and Tz’anchaj, in the municipality of Santiago Atitlán, Department of Sololá, where 915 families were resettled since 2007. This experience demonstrates the importance of community participation, of cultural aspects including inter-cultural negotiations, institutional commitment to innovative practices in urban development and housing design, and the achievements in rebuilding confidence in the State and strengthening the social fabric.
Each case highlights experiences that can be replicated, from identifying at-risk popu-lations to the post-resettlement phase. The examples describe different methodological and management tools for future processes, and key lessons about wise and unwise ac-tions taken. The cases also raise various questions for further research to enhance both knowledge and practices in human resettlement.
The studies are summaries of technical papers written by various consultants. The full technical papers are available upon request.
As noted in the Forward, this paper seeks to provide useful material for the design and implementation of resettlement programs as part of comprehensive disaster risk management strategies. The lessons can be applied by institutions and governments, professionals working in the field, and at-risk communities.
Introduction xix

1Chapter 1 Global and Latin America and the Caribbean Natural Disaster Trends
Disasters are the result of the overlapping in time and space, of a natural phenomenon of certain intensity —that is, a hazard—with a population
exposed to its impact. A natural phenomenon cannot be considered a hazard unless it is analyzed in a socioeco-nomic context where its occurrence can affect society. This context also influences the level of susceptibility to damage—that is, vulnerability—to a particular hazard. When a hazard affects two areas with different socio-economic and environmental contexts, the level of dam-age depends on these differences.
The Caribbean region, with its diverse island states and annual tropical storms, offers a useful area in which to analyze the effects of the same natural disaster. Indeed, the differences in the extent of damage from tropical storms are related to different levels of vulnerability. For example, the low level of human development and se-vere environmental degradation in Haiti greatly explain why the damage is likely to be far larger than in other Caribbean states, despite similar levels of exposure. Likewise, the impacts are generally lower in countries with more highly developed disaster preparedness, such as Cuba and Jamaica.1
Thus, the probability of a disaster and the magnitude of its impact are defined as the product of two factors – the level of the hazard and the degree of vulnerability – which
together constitute risk. Accordingly, disasters show where, how and for whom the risk translates into human and material damages and losses. Analyses of the spatial and temporal distribution of the occurrence and impacts of disasters provide critical information for assessing the level of risk. The geographical distribution and magni-tude of the effects allow analysts to (a) gauge the scope of the problem, (b) urge that it be a public policy issue, (c) identify trends and (d) prioritize actions in the field of disaster risk reduction.
1. Global Patterns and Trends in the Occurrence and Impacts of Disasters
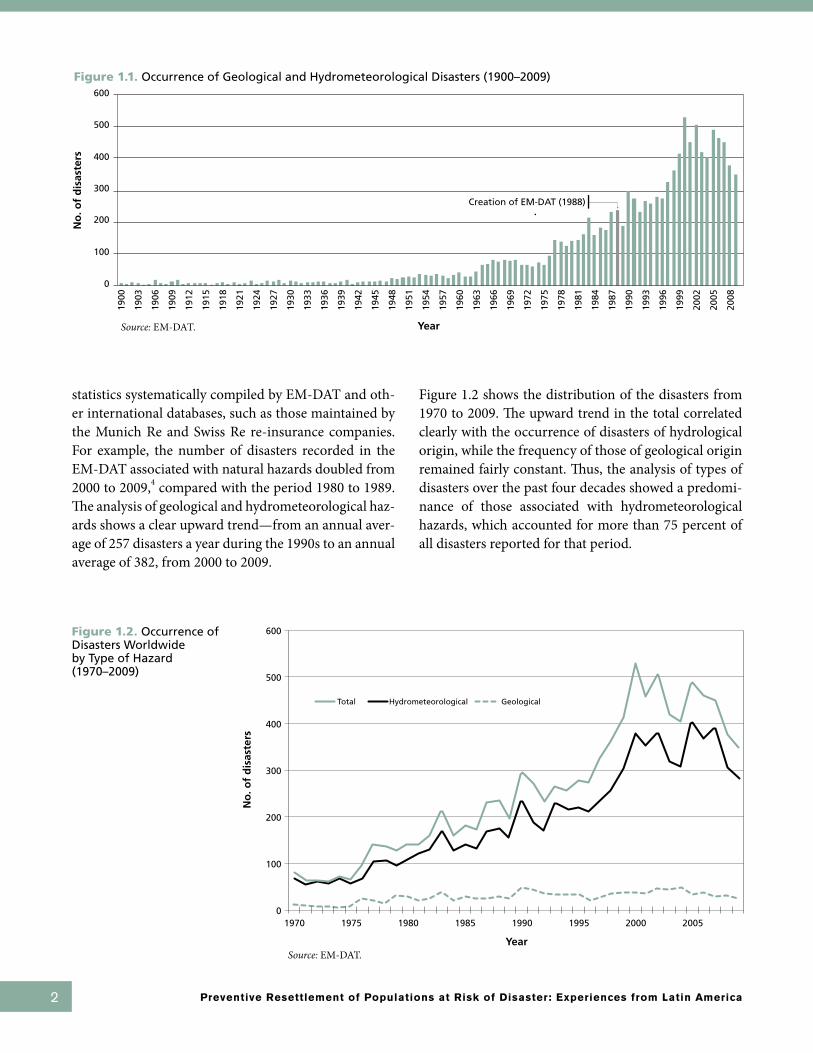
Information about the occurrence and effects of disas-ters worldwide since the beginning of the 20th century is available in the global Emergency Events Database (EM-DAT).2 EM-DAT statistics show that the number of disasters—triggered by the occurrence of natural hazards—has accelerated sharply worldwide (see figure 1.1).3
Although some argue that the increased number of disasters shown in Fig. 1.1., up to the 1970s, is due to improved registering and the existence of scientific centers that monitor these events, the upward trend has been confirmed for the past four decades through
Chapter 1
Global and Latin America and the Caribbean Natural Disaster Trends
By Haris Sanahuja
1 For the links between the impact of disasters and human development, see UNDP (2004).2 EM-DAT was established in 1988 by the Centre for Research on the Epidemiology of Disasters (CRED) with the support of the Office of
Foreign Disaster Assistance (OFDA) of the United States Agency for International Development (USAID). It contains data on the occur-rence and effects of natural and technological disasters in the world, reported since 1900. See http://www.cred.be.
3 Figure 1.1 includes only disasters associated with hydrometeorological and geological hazards. Biological hazards (such as epidemics and insect infestation) were excluded from the analysis because they fall outside the scope of this analysis.
4 EM-DAT distinguishes between disasters associated with natural hazards (natural disasters) and technological disasters. Natural disasters include three types: geological hazards (earthquakes, volcanic eruptions, landslides due to tectonic movements, and tsunamis); hydrome-teorological hazards (floods, droughts, storms, extreme temperatures, forest fires, and landslides due to hydrological causes); and biologi-cal hazards (epidemics and insect infestation).
Preventive Resettlement of Populations at Risk of Disaster: Experiences from Latin America 2
statistics systematically compiled by EM-DAT and oth-er international databases, such as those maintained by the Munich Re and Swiss Re re-insurance companies. For example, the number of disasters recorded in the EM-DAT associated with natural hazards doubled from 2000 to 2009,4 compared with the period 1980 to 1989. The analysis of geological and hydrometeorological haz-ards shows a clear upward trend—from an annual aver-age of 257 disasters a year during the 1990s to an annual average of 382, from 2000 to 2009.
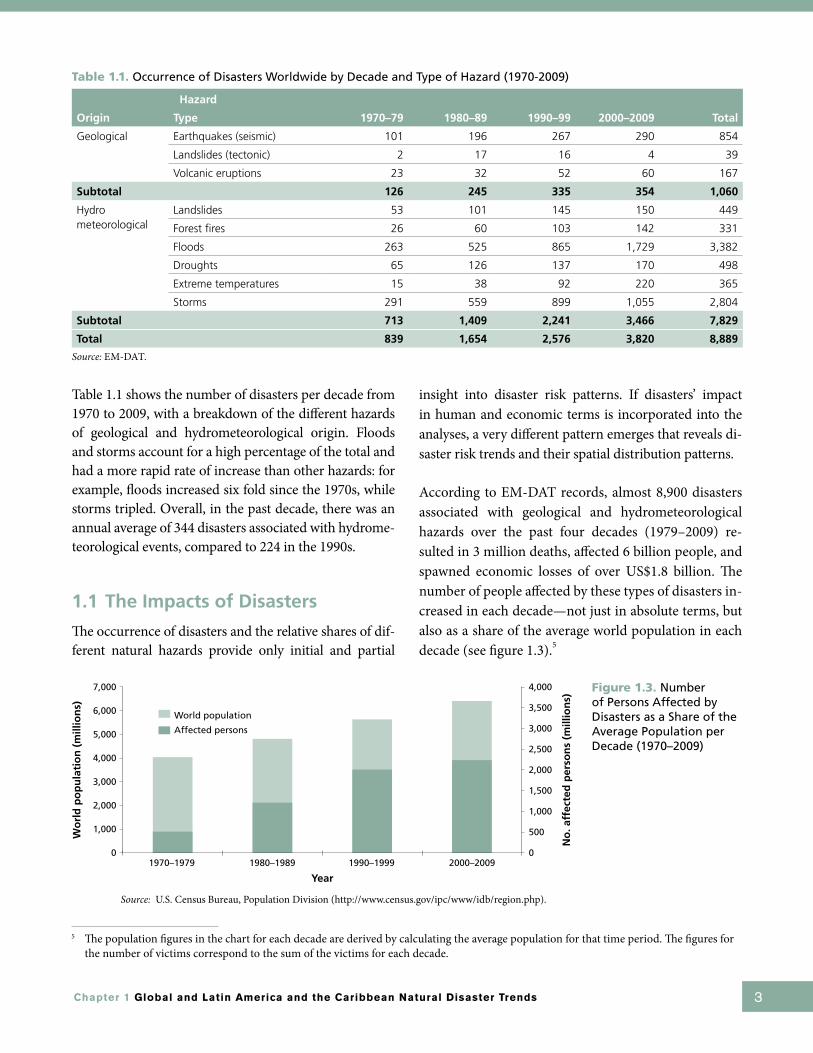
Figure 1.2 shows the distribution of the disasters from 1970 to 2009. The upward trend in the total correlated clearly with the occurrence of disasters of hydrological origin, while the frequency of those of geological origin remained fairly constant. Thus, the analysis of types of disasters over the past four decades showed a predomi-nance of those associated with hydrometeorological hazards, which accounted for more than 75 percent of all disasters reported for that period.
Figure 1.1. Occurrence of Geological and Hydrometeorological Disasters (1900–2009)
1900
1903
1906
1909
1912
1915
1918
1921
1924
1927
1930
1933
1936
1939
1942
1945
1948
1951
1954
1957
1960
1963
1966
1969
1972
1975
1978
1981
1984
1987
1990
1993
1996
1999
2002
2005
2008
600
500
400
300
200
100
0
No
. of
dis
aste
rs
Year
Creation of EM-DAT (1988)
Source: EM-DAT.
Source: EM-DAT.
Total Hydrometeorological Geological
1970 1975 1980 1985 1990 1995 2000 2005
600
500
400
300
200
100
0
No
. of
dis
aste
rs
Year
Figure 1.2. Occurrence of Disasters Worldwide by Type of Hazard (1970–2009)
Chapter 1 Global and Latin America and the Caribbean Natural Disaster Trends 3
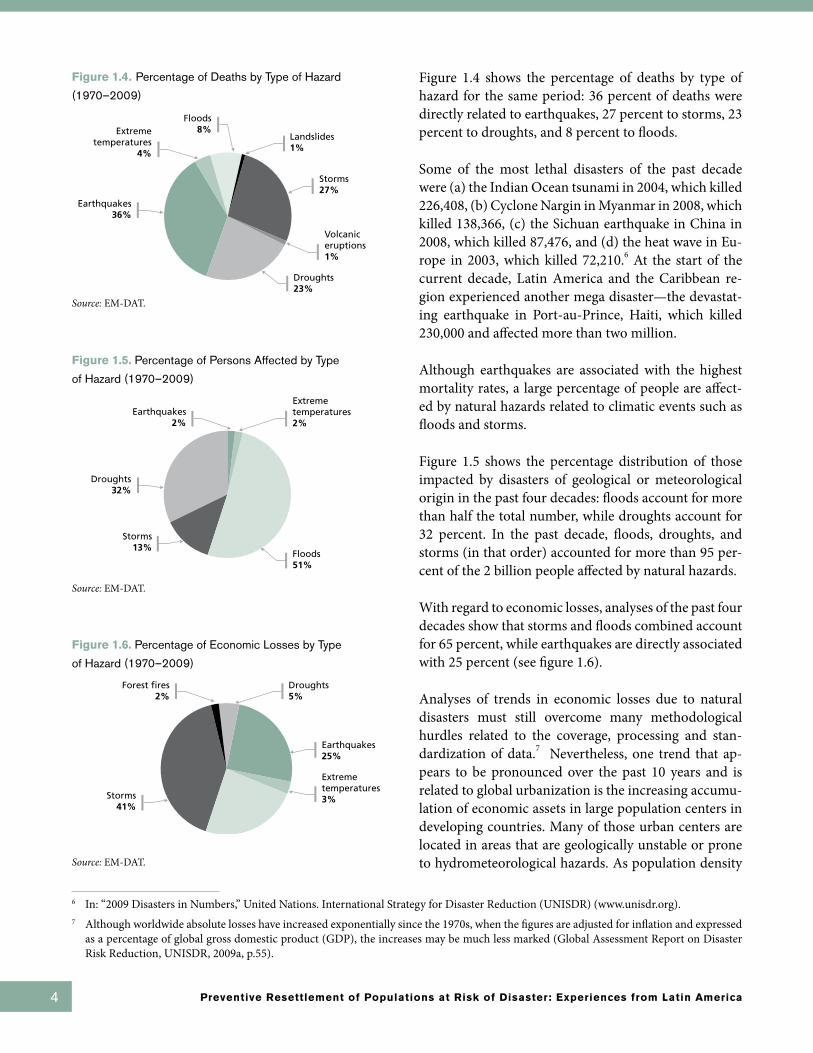
Table 1.1 shows the number of disasters per decade from 1970 to 2009, with a breakdown of the different hazards of geological and hydrometeorological origin. Floods and storms account for a high percentage of the total and had a more rapid rate of increase than other hazards: for example, floods increased six fold since the 1970s, while storms tripled. Overall, in the past decade, there was an annual average of 344 disasters associated with hydrome-teorological events, compared to 224 in the 1990s.
1.1 The Impacts of Disasters
The occurrence of disasters and the relative shares of dif-ferent natural hazards provide only initial and partial
insight into disaster risk patterns. If disasters’ impact in human and economic terms is incorporated into the analyses, a very different pattern emerges that reveals di-saster risk trends and their spatial distribution patterns.
According to EM-DAT records, almost 8,900 disasters associated with geological and hydrometeorological hazards over the past four decades (1979–2009) re-sulted in 3 million deaths, affected 6 billion people, and spawned economic losses of over US$1.8 billion. The number of people affected by these types of disasters in-creased in each decade—not just in absolute terms, but also as a share of the average world population in each decade (see figure 1.3).5
Table 1.1. Occurrence of Disasters Worldwide by Decade and Type of Hazard (1970-2009)
Hazard
1970–79 1980–89 1990–99 2000–2009 TotalOrigin Type
Geological Earthquakes (seismic) 101 196 267 290 854
Landslides (tectonic) 2 17 16 4 39
Volcanic eruptions 23 32 52 60 167
Subtotal 126 245 335 354 1,060
Hydro meteorological
Landslides 53 101 145 150 449
Forest fires 26 60 103 142 331
Floods 263 525 865 1,729 3,382
Droughts 65 126 137 170 498
Extreme temperatures 15 38 92 220 365
Storms 291 559 899 1,055 2,804
Subtotal 713 1,409 2,241 3,466 7,829
Total 839 1,654 2,576 3,820 8,889
Source: EM-DAT.
5 The population figures in the chart for each decade are derived by calculating the average population for that time period. The figures for the number of victims correspond to the sum of the victims for each decade.
1970–1979 1980–1989 1990–1999 2000–2009
7,000
6,000
5,000
4,000
3,000
2,000
1,000
0
4,000
3,500
3,000
2,500
2,000
1,500
1,000
500
0
Wo
rld
po
pu
lati
on
(m
illio
ns)
No
. aff
ecte
d p
erso
ns
(mill
ion
s)
Year
Source: U.S. Census Bureau, Population Division (http://www.census.gov/ipc/www/idb/region.php).
World population
Affected persons
Figure 1.3. Number of Persons Affected by Disasters as a Share of the Average Population per Decade (1970–2009)
Preventive Resettlement of Populations at Risk of Disaster: Experiences from Latin America 4
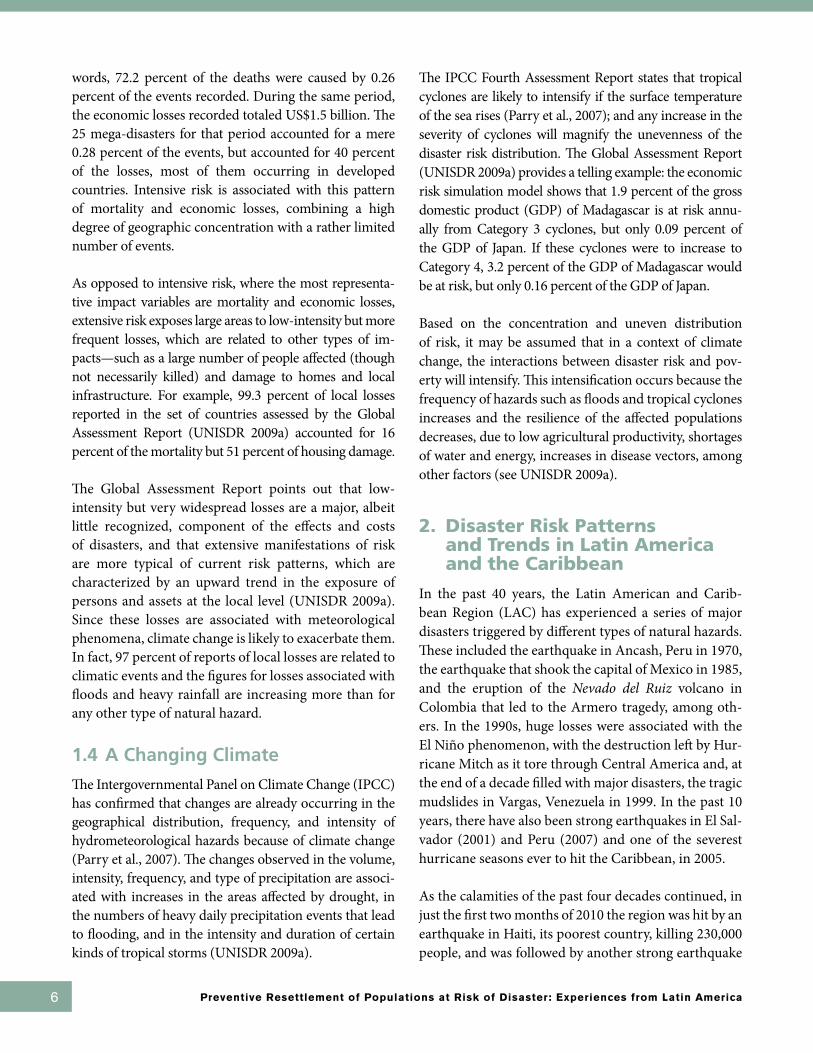
Figure 1.4 shows the percentage of deaths by type of hazard for the same period: 36 percent of deaths were directly related to earthquakes, 27 percent to storms, 23 percent to droughts, and 8 percent to floods.
Some of the most lethal disasters of the past decade were (a) the Indian Ocean tsunami in 2004, which killed 226,408, (b) Cyclone Nargin in Myanmar in 2008, which killed 138,366, (c) the Sichuan earthquake in China in 2008, which killed 87,476, and (d) the heat wave in Eu-rope in 2003, which killed 72,210.6 At the start of the current decade, Latin America and the Caribbean re-gion experienced another mega disaster—the devastat-ing earthquake in Port-au-Prince, Haiti, which killed 230,000 and affected more than two million.
Although earthquakes are associated with the highest mortality rates, a large percentage of people are affect-ed by natural hazards related to climatic events such as floods and storms.
Figure 1.5 shows the percentage distribution of those impacted by disasters of geological or meteorological origin in the past four decades: floods account for more than half the total number, while droughts account for 32 percent. In the past decade, floods, droughts, and storms (in that order) accounted for more than 95 per-cent of the 2 billion people affected by natural hazards.
With regard to economic losses, analyses of the past four decades show that storms and floods combined account for 65 percent, while earthquakes are directly associated with 25 percent (see figure 1.6).
Analyses of trends in economic losses due to natural disasters must still overcome many methodological hurdles related to the coverage, processing and stan-dardization of data.7 Nevertheless, one trend that ap-pears to be pronounced over the past 10 years and is related to global urbanization is the increasing accumu-lation of economic assets in large population centers in developing countries. Many of those urban centers are located in areas that are geologically unstable or prone to hydrometeorological hazards. As population density
Figure 1.4. Percentage of Deaths by Type of Hazard
(1970–2009)
Figure 1.5. Percentage of Persons Affected by Type
of Hazard (1970–2009)
Figure 1.6. Percentage of Economic Losses by Type
of Hazard (1970–2009)
Source: EM-DAT.
Source: EM-DAT.
Earthquakes36%
Floods8%
Landslides1%
Storms27%
Volcanic eruptions1%
Droughts23%
Extreme temperatures
4%
Earthquakes2%
Storms13%
Droughts32%
Floods51%
Extreme temperatures2%
Floods24%
Forest fires2%
Earthquakes25%
Storms41%
Droughts5%
Extreme temperatures3%
6 In: “2009 Disasters in Numbers,” United Nations. International Strategy for Disaster Reduction (UNISDR) (www.unisdr.org). 7 Although worldwide absolute losses have increased exponentially since the 1970s, when the figures are adjusted for inflation and expressed
as a percentage of global gross domestic product (GDP), the increases may be much less marked (Global Assessment Report on Disaster Risk Reduction, UNISDR, 2009a, p.55).
Source: EM-DAT.

Chapter 1 Global and Latin America and the Caribbean Natural Disaster Trends 5
grows and the pace of economic activity in those hubs quickens, the exposure of economic assets to hazards increases significantly.8
1.2 Differential Distribution of Risk
Although the distribution of hazards makes no dis-tinction between more or less developed countries, their impacts in terms of deaths and people affected is much lower in countries with higher levels of human development. For example, Japan and the Philippines, which have similar degrees of exposure to tropical cy-clones, have very different mortality risks, which can be correlated with the different levels of human develop-ment: Japan’s Human Development Index (HDI) score is 0.953, compared to the Philippines’, which is 0.771.9 In the Philippines, with a population of 16 million, the annual likelihood of deaths due to cyclones is 17 times higher than in Japan, which has 22.5 million inhabitants (UNISDR 2009a; UNISDR 2009b).
Economic losses in absolute terms are higher in the more developed countries, but when measured against the total wealth in those countries, they are lower in relative terms than in developing countries. Likewise, in small island states, such as St. Lucia, disasters can wipe out several decades of development, while in high-in-come countries, such as the United States, the effects are less perceptible, even in the case of such events as Hur-ricane Katrina, which in 2005 caused economic losses in the order of US$125 billion.10
1.3 Intensive and Extensive Risk
The Global Assessment Report on Disaster Risk Reduc-tion (UNISDR 2009c) distinguishes between intensive and extensive risk, based on differences in the spatial and temporal concentration of losses.11 Intensive risk refers to the exposure of large concentrations of people and economic activities to intense hazard events, which can lead to potentially catastrophic impacts involving deaths and the loss of assets.
Extensive risk, on the other hand, refers to the exposure of dispersed populations to repeated or persistent haz-ard conditions of low or moderate intensity (UNISDR 2009c), which can lead to debilitating cumulative disas-ter impacts. It usually affects large numbers of persons and damages homes and local infrastructure, but without generating high mortality rates or major destruction of economic assets.
Globally documented losses due to disasters focus mainly on a limited number of low-frequency events. Between January 1975 and October 2008, EM-DAT recorded 8,866 events (excluding epidemics) that caused 2,283,767 deaths. Of those deaths, 1,786,084 were a result of 23 mega-disasters, mainly in developing countries; in other
8 Teheran and Istanbul, for instance, both of which are prone to earthquakes, have experienced swifter urban and economic growth than the overall growth of their respective countries (UNISDR, 2009a, p.56).
9 The degree of human development achieved by countries is measured on the Human Development Index (HDI) published each year by the United Nations Development Programme (UNDP). The HDI measures average progress in three core dimensions of human development (a long and healthy life, knowledge, and a decent standard of living). For more details on the HDI, see http://www.undp.org.
10 For a more detailed analysis, see UNISDR 2009a, 57–60.11 The report was coordinated by the International Strategy for Disaster Reduction Secretariat (UNISDR), in collaboration with UNDP, The
World Bank, the United Nations Environment Programme (UNEP), the World Meteorological Organization (WMO), the United Nations Educational, Scientific and Cultural Organization (UNESCO), the ProVention Consortium, Norway’s Geotechnical Institute and other ISDR-related entities.
Preventive Resettlement of Populations at Risk of Disaster: Experiences from Latin America 6
words, 72.2 percent of the deaths were caused by 0.26 percent of the events recorded. During the same period, the economic losses recorded totaled US$1.5 billion. The 25 mega-disasters for that period accounted for a mere 0.28 percent of the events, but accounted for 40 percent of the losses, most of them occurring in developed countries. Intensive risk is associated with this pattern of mortality and economic losses, combining a high degree of geographic concentration with a rather limited number of events.
As opposed to intensive risk, where the most representa-tive impact variables are mortality and economic losses, extensive risk exposes large areas to low-intensity but more frequent losses, which are related to other types of im-pacts—such as a large number of people affected (though not necessarily killed) and damage to homes and local infrastructure. For example, 99.3 percent of local losses reported in the set of countries assessed by the Global Assessment Report (UNISDR 2009a) accounted for 16 percent of the mortality but 51 percent of housing damage.
The Global Assessment Report points out that low-intensity but very widespread losses are a major, albeit little recognized, component of the effects and costs of disasters, and that extensive manifestations of risk are more typical of current risk patterns, which are characterized by an upward trend in the exposure of persons and assets at the local level (UNISDR 2009a). Since these losses are associated with meteorological phenomena, climate change is likely to exacerbate them. In fact, 97 percent of reports of local losses are related to climatic events and the figures for losses associated with floods and heavy rainfall are increasing more than for any other type of natural hazard.
1.4 A Changing Climate
The Intergovernmental Panel on Climate Change (IPCC) has confirmed that changes are already occurring in the geographical distribution, frequency, and intensity of hydrometeorological hazards because of climate change (Parry et al., 2007). The changes observed in the volume, intensity, frequency, and type of precipitation are associ-ated with increases in the areas affected by drought, in the numbers of heavy daily precipitation events that lead to flooding, and in the intensity and duration of certain kinds of tropical storms (UNISDR 2009a).
The IPCC Fourth Assessment Report states that tropical cyclones are likely to intensify if the surface temperature of the sea rises (Parry et al., 2007); and any increase in the severity of cyclones will magnify the unevenness of the disaster risk distribution. The Global Assessment Report (UNISDR 2009a) provides a telling example: the economic risk simulation model shows that 1.9 percent of the gross domestic product (GDP) of Madagascar is at risk annu-ally from Category 3 cyclones, but only 0.09 percent of the GDP of Japan. If these cyclones were to increase to Category 4, 3.2 percent of the GDP of Madagascar would be at risk, but only 0.16 percent of the GDP of Japan.
Based on the concentration and uneven distribution of risk, it may be assumed that in a context of climate change, the interactions between disaster risk and pov-erty will intensify. This intensification occurs because the frequency of hazards such as floods and tropical cyclones increases and the resilience of the affected populations decreases, due to low agricultural productivity, shortages of water and energy, increases in disease vectors, among other factors (see UNISDR 2009a).
2. Disaster Risk Patterns and Trends in Latin America and the Caribbean
In the past 40 years, the Latin American and Carib-bean Region (LAC) has experienced a series of major disasters triggered by different types of natural hazards. These included the earthquake in Ancash, Peru in 1970, the earthquake that shook the capital of Mexico in 1985, and the eruption of the nevado del Ruiz volcano in Colombia that led to the Armero tragedy, among oth-ers. In the 1990s, huge losses were associated with the El Niño phenomenon, with the destruction left by Hur-ricane Mitch as it tore through Central America and, at the end of a decade filled with major disasters, the tragic mudslides in Vargas, Venezuela in 1999. In the past 10 years, there have also been strong earthquakes in El Sal-vador (2001) and Peru (2007) and one of the severest hurricane seasons ever to hit the Caribbean, in 2005.
As the calamities of the past four decades continued, in just the first two months of 2010 the region was hit by an earthquake in Haiti, its poorest country, killing 230,000 people, and was followed by another strong earthquake

Chapter 1 Global and Latin America and the Caribbean Natural Disaster Trends 7
in Chile, one of the most developed countries in the region. The following section summarizes the trends in the occurrence and impact of natural hazard-related disasters in LAC.
2.1 Disaster Occurrence
The LAC Region has, after Asia, the second largest av-erage number of disasters per year (ECLAC and IDB, 2000). Figure 1.7 shows the upward trend in the occur-rence of disasters associated with hydrometeorologi-cal and geological hazards over the past four decades. Since the 1970s, when the region experienced an annual average of 16 major disasters, the statistic has practically quadrupled in the most recent decade in which there were, on average, 63 disasters a year associated with hy-drometeorological and geological hazards.
Figure 1.7 also shows the large share of hydrometeo-rological hazards directly associated with the upward trend in the number of disasters, compared to the much more stable and lower frequency levels of disasters re-lated to geological hazards. As with the global trends mentioned above, floods and storms are related to al-most 70 percent of the disasters recorded for 1970-2009. In absolute numbers, flood-related disasters have qua-drupled in the past decade and storm-related disasters have increased five-fold.
Drought-related disasters are also rising, with 3.5 times as many in the past decade, compared to 1970-1979. Moreover, the frequency of high temperature-related disasters has increased 10-fold compared to the 1970s. Table 1.2 lists the number of disasters of hydrometeoro-logical and geological origin from 1970-2009.
80
70
60
50
40
30
20
10
0
No
. of
dis
aste
rs
1970
1972
1974
1976
1978
1980
1982
1984
1986
1988
1990
1992
1994
1996
1998
2000
2002
2004
2006
2008
Year
Total Hydrometeorological Geological
Figure 1.7. Disaster Occurrence in LAC by Type of Hazard
Source: EM-DAT.
Table 1.2. Occurrence of Disasters by Decade and Type of Hazard in LAC (1970-2009)
Hazard
1970-1979 1980-1989 1990-1999 2000-2009 TotalOrigin Type
Geological
Earthquakes (seismic) 23 42 50 38 153
Landslides (tectonic) 0 3 2 1 6
Volcanic eruptions 9 7 24 22 62
Sub-total 32 52 76 61 221
Hydrometeorological
Landslides (hydric) 18 33 37 26 114
Forest fires 1 6 18 13 38
Floods 69 131 147 279 626
Droughts 10 19 29 34 92
Extreme temperatures 3 3 13 31 50
Storms 34 70 130 188 422
Sub-total 135 262 374 571 1,342
Total 167 314 450 632 1,563
Source: EM-DAT
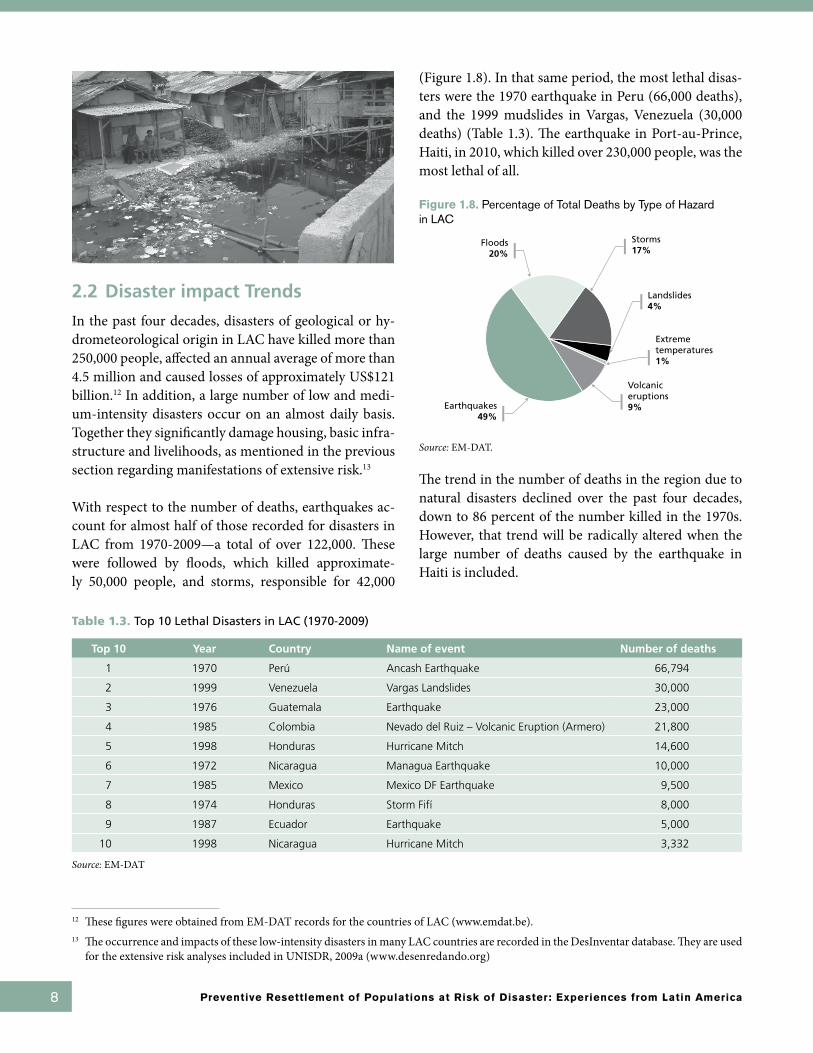
Preventive Resettlement of Populations at Risk of Disaster: Experiences from Latin America 8
2.2 Disaster impact Trends
In the past four decades, disasters of geological or hy-drometeorological origin in LAC have killed more than 250,000 people, affected an annual average of more than 4.5 million and caused losses of approximately US$121 billion.12 In addition, a large number of low and medi-um-intensity disasters occur on an almost daily basis. Together they significantly damage housing, basic infra-structure and livelihoods, as mentioned in the previous section regarding manifestations of extensive risk.13
With respect to the number of deaths, earthquakes ac-count for almost half of those recorded for disasters in LAC from 1970-2009—a total of over 122,000. These were followed by floods, which killed approximate-ly 50,000 people, and storms, responsible for 42,000
(Figure 1.8). In that same period, the most lethal disas-ters were the 1970 earthquake in Peru (66,000 deaths), and the 1999 mudslides in Vargas, Venezuela (30,000 deaths) (Table 1.3). The earthquake in Port-au-Prince, Haiti, in 2010, which killed over 230,000 people, was the most lethal of all.
Figure 1.8. Percentage of Total Deaths by Type of Hazard in LAC
The trend in the number of deaths in the region due to natural disasters declined over the past four decades, down to 86 percent of the number killed in the 1970s. However, that trend will be radically altered when the large number of deaths caused by the earthquake in Haiti is included.
Earthquakes49%
Floods20%
Landslides4%
Storms17%
Volcanic eruptions9%
Extreme temperatures1%
Source: EM-DAT.
12 These figures were obtained from EM-DAT records for the countries of LAC (www.emdat.be).13 The occurrence and impacts of these low-intensity disasters in many LAC countries are recorded in the DesInventar database. They are used
for the extensive risk analyses included in UNISDR, 2009a (www.desenredando.org)
Table 1.3. Top 10 Lethal Disasters in LAC (1970-2009)
Top 10 Year Country Name of event Number of deaths
1 1970 Perú Ancash Earthquake 66,794
2 1999 Venezuela Vargas Landslides 30,000
3 1976 Guatemala Earthquake 23,000
4 1985 Colombia Nevado del Ruiz – Volcanic Eruption (Armero) 21,800
5 1998 Honduras Hurricane Mitch 14,600
6 1972 Nicaragua Managua Earthquake 10,000
7 1985 Mexico Mexico DF Earthquake 9,500
8 1974 Honduras Storm Fifí 8,000
9 1987 Ecuador Earthquake 5,000
10 1998 Nicaragua Hurricane Mitch 3,332
Source: EM-DAT

Chapter 1 Global and Latin America and the Caribbean Natural Disaster Trends 9
Disasters of hydrometeorological origin affect more peo-ple than any other types of natural hazards: 166 million people were victims of such disasters in the past four de-cades, of whom approximately 63 million were affected by drought,14 more than 60 million by floods and 35 mil-lion by storms. Disasters associated with those three haz-ards accounted for 84 percent of all victims in that period, compared to 12 percent for earthquakes (Figure 1.9).
Figure 1.9. Percentage of People affected by Type of Hazard in LAC
As for economic losses, EM-DAT data show a total of US$121.13 billion in the past four decades.15 Figure 1.10 indicates that almost 50 percent of economic losses re-late to the effects of storms, followed by floods, earth-quakes and drought.
Figure 1.10. Percentage of Economic Losses by Type of Hazard in LAC
Numerous studies for LAC countries measure cumula-tive losses caused by natural disasters as a percentage of gross domestic product (GDP). For example, the cumu-lative losses due to natural disasters in the 1990s repre-sented 15.6 percent of GDP in Nicaragua, 12.6 percent in Jamaica and 1.8 percent in Argentina (Arnold, 2004). The impact of Hurricane Mitch in Honduras is estimat-ed to have caused losses equal to 41 percent of its GDP (Benson and Twigg, 2007).
The patterns and trends for the above-mentioned inten-sive and extensive risks on a global scale are reproduced in the region.16 The analysis in the study of national data regarding low-intensity losses indicates that mortality and destruction of housing are concentrated in infre-quent events affecting a limited number of geographi-cal areas in the region, while damage to housing is very widespread and more frequent.
The extensive risk associated with hydrometeorological hazards is expanding geographically, as such hazards occur more frequently and cause increasing damage—a reflection, in large part, of the greater exposure of per-sons and assets at the local level. Thus, it can be conclud-ed that in a context of climate change, losses associated with meteorological events will most likely increase in the region.
2.3 Disaster Risk Configuration in the Region
To understand the particular disaster risk configuration in LAC, it is important to analyze its physical environ-ment and natural dynamics. From a geological per-spective, LAC is located above a set of five interacting tectonic plates. The western shores of this region form part of the so-called “Pacific Ring of Fire,” in which the earth’s crust is constantly being transformed. This trans-lates into the high level of volcanic and seismic activity in Andean and Central American countries. For exam-ple, 59 percent of the population of the Andean Com-munity (54 million inhabitants of Bolivia, Colombia,
Source: EM-DAT.
Source: EM-DAT.
14 Reports on people affected by droughts in LAC highlight Brazil, with 47 million, followed by Bolivia and Peru with over 3 million people affected. Guatemala and Haiti have the highest records for Central America and the Caribbean, with more than two million people affected.
15 All estimates, including for economic losses, refer to natural disasters associated with hydrometeorological and geological hazards. Biologi-cal hazards and technological disasters have been deliberately excluded from the analysis.
16 The national data supporting the analysis of extensive risk found in UNISDR (2009a) form part of DesInventar, a database with ample coverage of LAC. The public can access the DesInventar data on its website (www.desinventar.com).
Earthquakes25%
Floods32%
Droughts33%Landslides
1%
Storms19%
Volcanic eruptions
1%
Extreme temperatures
2%
Earthquakes15%
Floods24%
Droughts7%
Forest fires1%
Landslides1%
Storms49%
Volcanic eruptions
1%
Extreme temperatures1%
Preventive Resettlement of Populations at Risk of Disaster: Experiences from Latin America 10
Ecuador and Peru) are estimated to live in earthquake-prone areas.17 Also, in the Caribbean basin, the tectonic configuration makes the islands significantly prone to volcanic and seismic hazards.
The topography, especially the Andes in South America and the Meso-American highlands in Central America, is associated with the climatic dynamics that trigger frequent mass movements and floods. These mountain chains create a divide between the Pacific slopes, with watersheds and shorter rivers that can produce flash flooding, and the Atlantic and Caribbean slopes, with vast plains in which rivers encounter conditions conducive to slow-growing floods. The climate also leaves its imprint on other parts of the region, as in the Caribbean, with its annual tropical storms and hurricanes, and in areas off the coast of Peru, where the El Niño-Southern Oscillation phenomenon (ENSO) begins and then causes floods and drought in various parts of LAC.
Often, these hazards occur in a chain reaction, which increases the magnitude of their impact. In mountainous areas, of which there are many in the region, tectonic hazards and heavy rains can give rise to mass movements, such as mudslides or floods. Droughts may also create the conditions for forest fires which “set the ground” to exacerbate flooding: for example, the extensive drought triggered by El Niño in 1997-1998 made the vegetable biomass in Central America much more combustible (CCAD, 1998). The severe shortage of water and the delayed start of the rainy season in 1998 allowed fires to spread rapidly; therefore the heavy rainfall unleashed by Hurricane Mitch found large areas devoid of vegetation, which increased soil saturation levels, and caused surface runoff (Sanahuja, 1999).
In short, the diversity and intensity of the geological and hydrometeorological dynamic in LAC create a “multiple hazards” scenario, characterized by dangerous events, such as earthquakes, volcanic eruptions, tsunamis, landslides, storms, floods, forest fires and droughts.
2.4 Vulnerability and Risk-driving Factors
As indicated at the beginning of this chapter, disasters can-not be analyzed outside the social, economic, political and environmental contexts in which they occur. Accordingly, there is broad consensus that the increase in disastrous events is rooted in a process of increasing vulnerability.
There have been numerous attempts to define the concept of vulnerability to disasters and to classify it under multiple headings, but all researchers view vulnerability as a state of “being prone to” or being “susceptible to damage and harm” (Blaikie et al., 1996). In the mid-1990s, two models were proposed to explain the underlying causes of increased vulnerability. Figure 1.11 shows one of those models, called PAR (Pressure and Release), which examines the evolution of unsafe conditions in the form of dynamic pressures. Examples of these conditions are urbanization and environmental degradation, whose causes are found in the political economy.
The processes that shape the emergence of vulnerable scenarios are varied, complex and differentiated by sub-region, country, and areas within them. Any attempt to describe them in broad terms could over-simplifies the issues. Nevertheless, it is possible to identify some of the major factors driving vulnerability and risk, such as rapid urbanization and environmental degradation, exacerbated in a vicious circle by poverty and persistent weak governance. It is also assumed that these factors are inter-related, so that effective and comprehensive intervention in all of them is essential to reduce disaster risks. One way to present an integrated picture of those driving vulnerability forces is to examine both urban and rural areas.
2.5 Urban Areas and the Construction of Vulnerabilities
One notable feature in LAC is that it constitutes the most urbanized part of the developing world. In 1950, urban residents accounted for 41.4 percent of the total popula-tion; by 2007, the figure had soared to 78.3 percent and
17 Atlas de las dinámicas del territorio andino: población y bienes expuestos a amenazas naturales [Atlas of the dynamics of the Andes: population and property exposed to natural hazards], General Secretariat of the Andean Community, Cali: Corporación OSSO, 2009).
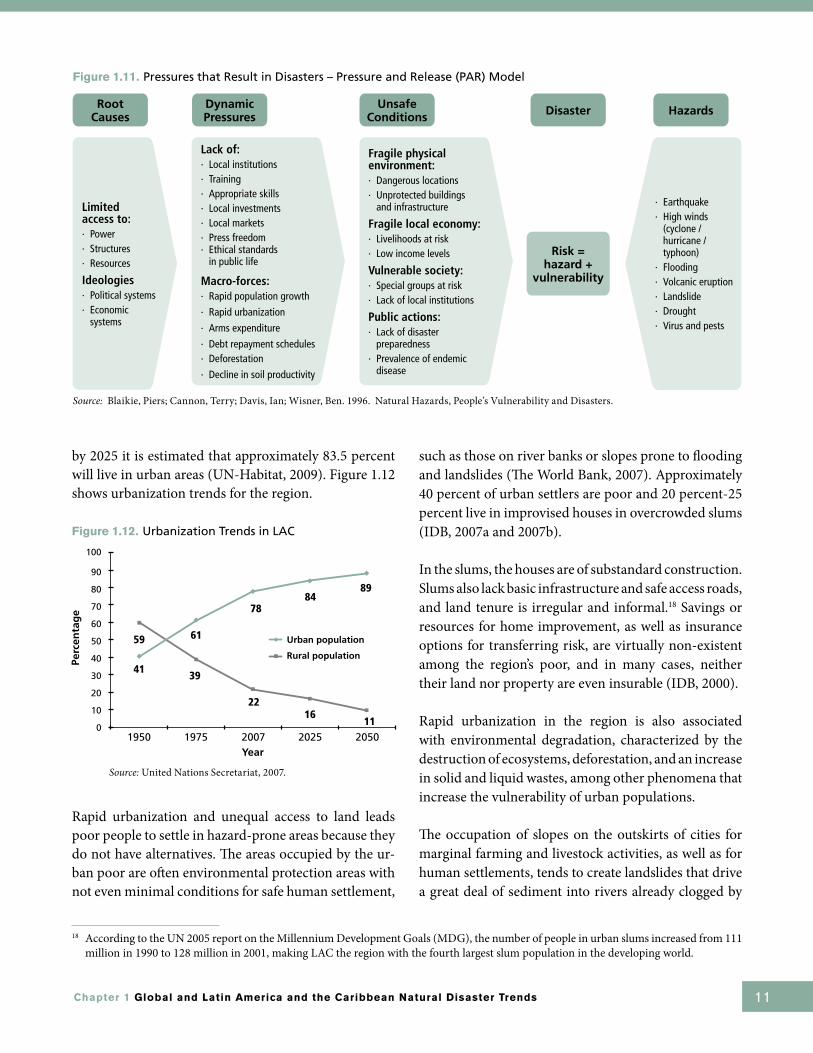
Chapter 1 Global and Latin America and the Caribbean Natural Disaster Trends 11
by 2025 it is estimated that approximately 83.5 percent will live in urban areas (UN-Habitat, 2009). Figure 1.12 shows urbanization trends for the region.
Figure 1.12. Urbanization Trends in LAC
Rapid urbanization and unequal access to land leads poor people to settle in hazard-prone areas because they do not have alternatives. The areas occupied by the ur-ban poor are often environmental protection areas with not even minimal conditions for safe human settlement,
such as those on river banks or slopes prone to flooding and landslides (The World Bank, 2007). Approximately 40 percent of urban settlers are poor and 20 percent-25 percent live in improvised houses in overcrowded slums (IDB, 2007a and 2007b).
In the slums, the houses are of substandard construction. Slums also lack basic infrastructure and safe access roads, and land tenure is irregular and informal.18 Savings or resources for home improvement, as well as insurance options for transferring risk, are virtually non-existent among the region’s poor, and in many cases, neither their land nor property are even insurable (IDB, 2000).
Rapid urbanization in the region is also associated with environmental degradation, characterized by the destruction of ecosystems, deforestation, and an increase in solid and liquid wastes, among other phenomena that increase the vulnerability of urban populations.
The occupation of slopes on the outskirts of cities for marginal farming and livestock activities, as well as for human settlements, tends to create landslides that drive a great deal of sediment into rivers already clogged by
18 According to the UN 2005 report on the Millennium Development Goals (MDG), the number of people in urban slums increased from 111 million in 1990 to 128 million in 2001, making LAC the region with the fourth largest slum population in the developing world.
Source: United Nations Secretariat, 2007.
100
90
80
70
60
50
40
30
20
10
0
Perc
enta
ge
1950 1975 2007Year
Urban population
Rural population
2025 2050
Figure 1.11. Pressures that Result in Disasters – Pressure and Release (PAR) Model
Root Causes
Dynamic Pressures
Unsafe Conditions Disaster Hazards
Risk = hazard +
vulnerability
Limited access to:· Power· Structures· Resources
Ideologies· Political systems· Economic
systems
Lack of:· Local institutions· Training· Appropriate skills· Local investments· Local markets· Press freedom· Ethical standards
in public life
Macro-forces:· Rapid population growth
· Rapid urbanization
· Arms expenditure
· Debt repayment schedules· Deforestation
· Decline in soil productivity
Fragile physical environment:· Dangerous locations· Unprotected buildings
and infrastructure
Fragile local economy:· Livelihoods at risk· Low income levels
Vulnerable society:· Special groups at risk· Lack of local institutions
Public actions:· Lack of disaster
preparedness· Prevalence of endemic
disease
· Earthquake· High winds
(cyclone / hurricane / typhoon)
· Flooding· Volcanic eruption· Landslide· Drought· Virus and pests
Source: Blaikie, Piers; Cannon, Terry; Davis, Ian; Wisner, Ben. 1996. Natural Hazards, People’s Vulnerability and Disasters.
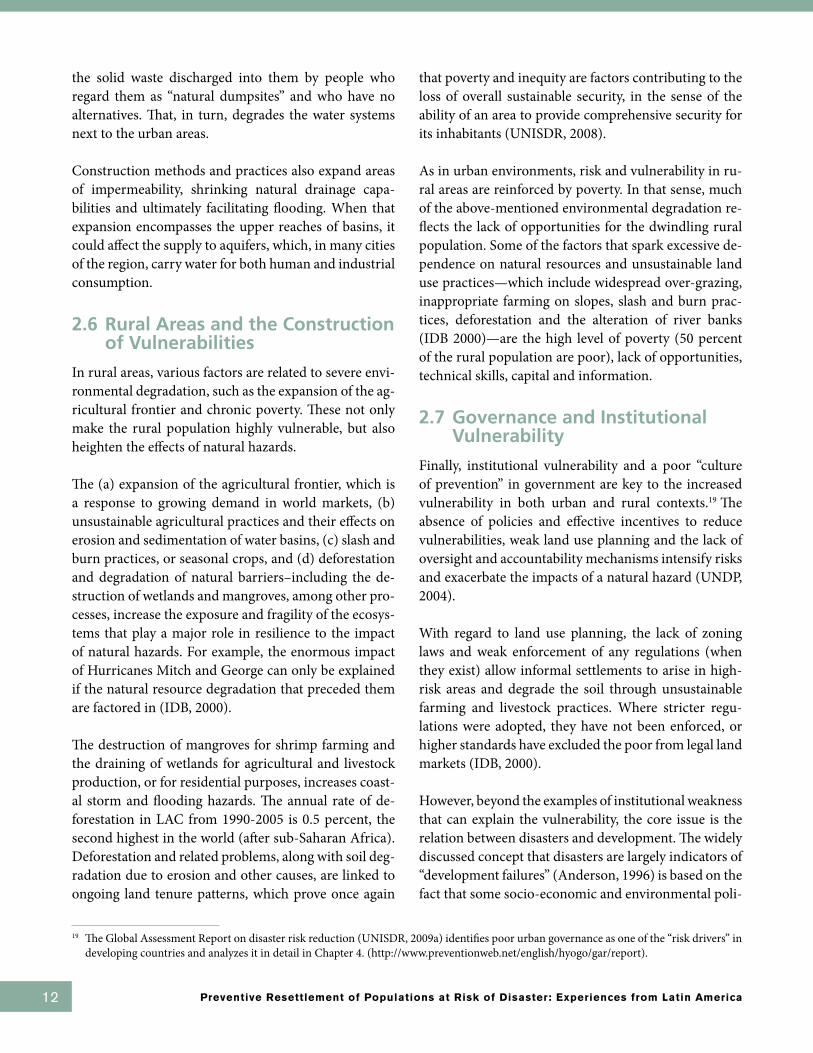
Preventive Resettlement of Populations at Risk of Disaster: Experiences from Latin America 12
the solid waste discharged into them by people who regard them as “natural dumpsites” and who have no alternatives. That, in turn, degrades the water systems next to the urban areas.
Construction methods and practices also expand areas of impermeability, shrinking natural drainage capa-bilities and ultimately facilitating flooding. When that expansion encompasses the upper reaches of basins, it could affect the supply to aquifers, which, in many cities of the region, carry water for both human and industrial consumption.
2.6 Rural Areas and the Construction of Vulnerabilities
In rural areas, various factors are related to severe envi-ronmental degradation, such as the expansion of the ag-ricultural frontier and chronic poverty. These not only make the rural population highly vulnerable, but also heighten the effects of natural hazards.
The (a) expansion of the agricultural frontier, which is a response to growing demand in world markets, (b) unsustainable agricultural practices and their effects on erosion and sedimentation of water basins, (c) slash and burn practices, or seasonal crops, and (d) deforestation and degradation of natural barriers–including the de-struction of wetlands and mangroves, among other pro-cesses, increase the exposure and fragility of the ecosys-tems that play a major role in resilience to the impact of natural hazards. For example, the enormous impact of Hurricanes Mitch and George can only be explained if the natural resource degradation that preceded them are factored in (IDB, 2000).
The destruction of mangroves for shrimp farming and the draining of wetlands for agricultural and livestock production, or for residential purposes, increases coast-al storm and flooding hazards. The annual rate of de-forestation in LAC from 1990-2005 is 0.5 percent, the second highest in the world (after sub-Saharan Africa). Deforestation and related problems, along with soil deg-radation due to erosion and other causes, are linked to ongoing land tenure patterns, which prove once again
that poverty and inequity are factors contributing to the loss of overall sustainable security, in the sense of the ability of an area to provide comprehensive security for its inhabitants (UNISDR, 2008).
As in urban environments, risk and vulnerability in ru-ral areas are reinforced by poverty. In that sense, much of the above-mentioned environmental degradation re-flects the lack of opportunities for the dwindling rural population. Some of the factors that spark excessive de-pendence on natural resources and unsustainable land use practices—which include widespread over-grazing, inappropriate farming on slopes, slash and burn prac-tices, deforestation and the alteration of river banks (IDB 2000)—are the high level of poverty (50 percent of the rural population are poor), lack of opportunities, technical skills, capital and information.
2.7 Governance and Institutional Vulnerability
Finally, institutional vulnerability and a poor “culture of prevention” in government are key to the increased vulnerability in both urban and rural contexts.19 The absence of policies and effective incentives to reduce vulnerabilities, weak land use planning and the lack of oversight and accountability mechanisms intensify risks and exacerbate the impacts of a natural hazard (UNDP, 2004).
With regard to land use planning, the lack of zoning laws and weak enforcement of any regulations (when they exist) allow informal settlements to arise in high-risk areas and degrade the soil through unsustainable farming and livestock practices. Where stricter regu-lations were adopted, they have not been enforced, or higher standards have excluded the poor from legal land markets (IDB, 2000).
However, beyond the examples of institutional weakness that can explain the vulnerability, the core issue is the relation between disasters and development. The widely discussed concept that disasters are largely indicators of “development failures” (Anderson, 1996) is based on the fact that some socio-economic and environmental poli-
19 The Global Assessment Report on disaster risk reduction (UNISDR, 2009a) identifies poor urban governance as one of the “risk drivers” in developing countries and analyzes it in detail in Chapter 4. (http://www.preventionweb.net/english/hyogo/gar/report).
Chapter 1 Global and Latin America and the Caribbean Natural Disaster Trends 13
cies pursued in the region have generated conditions of vulnerability that a natural hazard may have turned into a disaster. In that sense, the increased vulnerability shows that concepts of prevention and mitigation are still not sufficiently built into and assimilated by pub-lic policies and development planning processes in the region.
Disaster risk reduction is still not regarded by many de-cision and policy-makers as an investment, despite the solid evidence accumulated in recent years about the advantages of prevention and mitigation as opposed to policies based on response and reconstruction. Thus, prevention tends to be seen as a “cost” rather than an “investment.”
Despite the challenges with respect to including risk management as an intrinsic part of development plan-ning, institutional progress is being made in the region which shows a growing recognition of the importance of disaster prevention and mitigation. Some of the insti-tutional and legislative changes were introduced in 1985 as a result of the impact and general sensitization trig-gered by the earthquake in Mexico City and the nevado del Ruiz volcanic eruption in Colombia. Between 1985 and the mid-1990s, some national disaster agencies amended their mandates to include aspects of preven-tion, mitigation and emergency relief, but their role was still mainly limited to strengthening disaster prepared-ness activities—such as early warning systems (UNIS-DR, 2004)—and basic mapping of hazards.
Since the end of the 1990s, the huge impacts of several disasters in the region, particularly the widespread loss-es from the 1997-1998 El Niño phenomenon and the passage of Hurricane Mitch through Central America, served as catalysts by which disaster reduction was gradually becoming linked to policy agendas and devel-opment planning, both in legislative and institutional arrangements. These changes on the domestic front, starting with the development of national disaster pre-vention and relief systems in certain countries, were accompanied by the development of specialized inter-governmental organizations in the subregion20.
3. Institutional Frameworks and Strategies for Disaster Risk Reduction
Over the past two decades, discussion of what today is called disaster risk reduction has been the result of a slow transition and change of paradigm. Initially, the emphasis was on the event itself and response activities (disaster management) but later it changed towards an approach in which disaster is understood as a manifes-tation of vulnerabilities associated with socioeconomic and environmental processes. In this view, natural haz-ards “trigger” disasters but are not the agents that cause them (disaster risk management).
This conceptual trend recognizes that risk is an out-come associated with social construction processes and linked to the predominant forms of social and economic development. For this reason, “disaster risk manage-ment” is inseparable from “development management.” Further, this change in paradigm—from a focus on di-saster, natural hazards, and response, to one in which risk, vulnerability, and their reduction become domi-nant themes—has also prompted a reconsideration of institutional roles and needs, so the countries can deal with the issue more effectively.
A recent milestone at the international level was the World Conference on Disaster Reduction, in Kobe, Ja-pan, in 2005, which the Hyogo Framework for Action 2005–2015 (HFA) was adopted. This framework, en-dorsed by 168 governments, aims to substantially re-duce the loss of life, and the social, economic and envi-ronmental assets of communities and countries by 2015. The HFA focuses on three strategic goals and five priori-ties for action (figure 1.11), and articulates the respon-sibilities of governments, international organizations, nongovernmental organizations (NGOs), and civil so-ciety with respect to their roles in and contributions to implementing the HFA.
To help implement the HFA, the International Strategy for Disaster Reduction (ISDR) now includes a “plat-forms system” (the Global Platform for Disaster Risk
20 The National System for Prevention and Assistance to Natural Disasters in Colombia was launched in 1980.
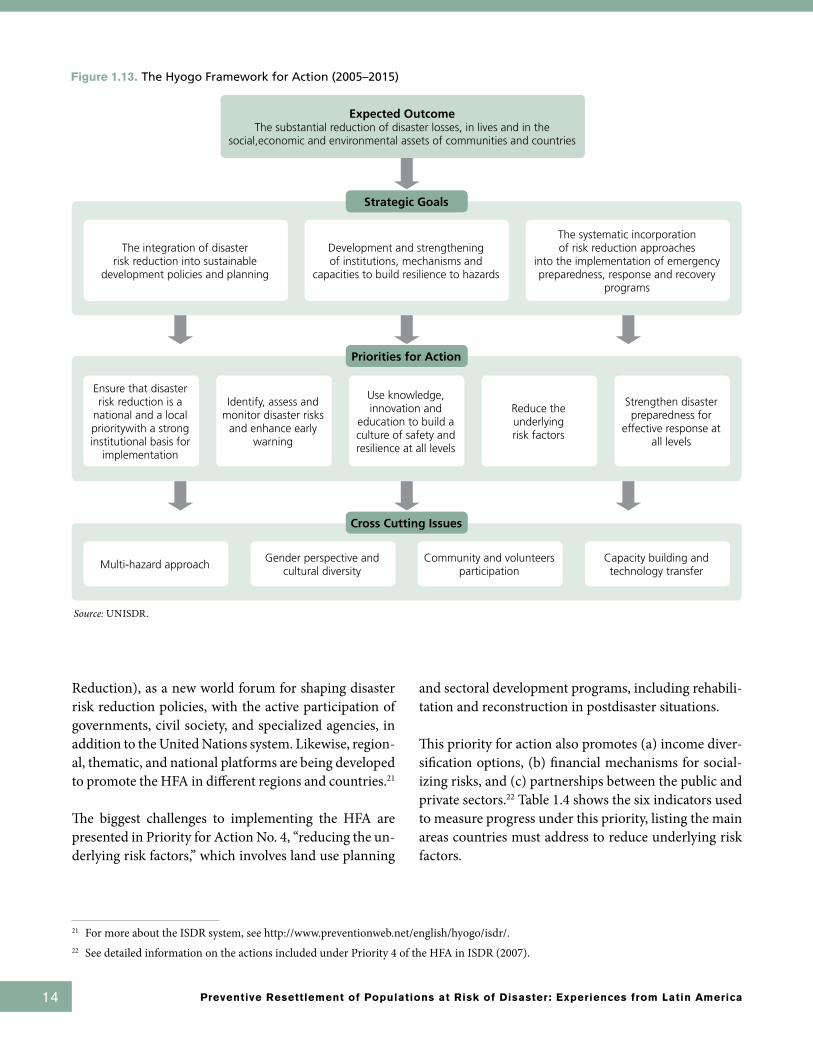
Preventive Resettlement of Populations at Risk of Disaster: Experiences from Latin America 14
Reduction), as a new world forum for shaping disaster risk reduction policies, with the active participation of governments, civil society, and specialized agencies, in addition to the United Nations system. Likewise, region-al, thematic, and national platforms are being developed to promote the HFA in different regions and countries.21
The biggest challenges to implementing the HFA are presented in Priority for Action No. 4, “reducing the un-derlying risk factors,” which involves land use planning
and sectoral development programs, including rehabili-tation and reconstruction in postdisaster situations.
This priority for action also promotes (a) income diver-sification options, (b) financial mechanisms for social-izing risks, and (c) partnerships between the public and private sectors.22 Table 1.4 shows the six indicators used to measure progress under this priority, listing the main areas countries must address to reduce underlying risk factors.
Expected OutcomeThe substantial reduction of disaster losses, in lives and in the
social,economic and environmental assets of communities and countries
Multi-hazard approach Community and volunteers
participation Gender perspective and
cultural diversity Capacity building and technology transfer
Ensure that disaster risk reduction is a
national and a local prioritywith a strong institutional basis for
implementation
Strengthen disaster preparedness for
effective response at all levels
Identify, assess and monitor disaster risks
and enhance early warning
Use knowledge, innovation and
education to build a culture of safety and resilience at all levels
Reduce the underlying risk factors
The integration of disaster risk reduction into sustainable
development policies and planning
Development and strengthening of institutions, mechanisms and
capacities to build resilience to hazards
The systematic incorporation of risk reduction approaches
into the implementation of emergency preparedness, response and recovery
programs
Strategic Goals
Priorities for Action
Cross Cutting Issues
Figure 1.13. The Hyogo Framework for Action (2005–2015)
21 For more about the ISDR system, see http://www.preventionweb.net/english/hyogo/isdr/. 22 See detailed information on the actions included under Priority 4 of the HFA in ISDR (2007).
Source: UNISDR.

Chapter 1 Global and Latin America and the Caribbean Natural Disaster Trends 15
3.1 Different Approaches and Tools for Risk Management
Reducing these underlying risk factors necessarily in-volves a discussion of disaster risk management and the tools needed to implement it.
The risk management concept refers to an ongoing pro-cess whose goal is predicting, reducing and controlling risk factors. This process promotes, prepares, and imple-ments policies, strategies, instruments, and actions that help society confront natural hazards and minimize the losses/damage associated with their effects (Lavell 2008).
Disaster risk management may be corrective or prospec-tive (Lavell 2004). Corrective management takes its point of reference from already existing risk, which is the product of past social actions—for example, a settle-ment, located in a flood zone, that was built with inap-propriate techniques; a hospital constructed without an-tiseismic standards; a community built around a single access road prone to recurrent landslides; or agricul-tural activity ill-adapted to the climate and its extremes.
This corrective management approach may also be con-servative or progressive (Lavell 2009). The conservative corrective model aims to reduce visible risk conditions (by protecting housing, shoring up river banks or lots on steep slopes, etc.) and to strengthen institutions so they can respond more effectively to emergencies. The underlying factors of existing risks—related to poverty or power structures—are not considered.
The progressive corrective model combines reducing existing risk factors with actions based more on
development objectives, in communities where risks have been identified. The approach involves reducing poverty, empowering people and planning, and adopting development goals by attacking the underlying causes of risk.
Unlike corrective management, prospective manage-ment works with risks that have not yet presented themselves but could nevertheless be generated by new investments and development initiatives, whether by governments, the private sector, NGOs, development associations, families, or individuals.
Prospective risk management is therefore an integral part of development planning, investment project planning, and environmental management. It implies practices that avoid repeating past errors that led to the existing levels of risk. The strategies or other specific tools for prospec-tive risk management are largely similar to those appro-priate for corrective management, although the timing and orientation of the various activities differ.
Regardless of whether corrective and prospective risk management succeeds, countries will always need to respond to the crises triggered by extreme events. The area of risk that cannot be addressed by either correc-tive or prospective management is called residual risk, and in this area, humanitarian responses will continue to play a dominant role.
3.2 Risk Reduction Challenges
Risk reduction is increasingly important on the inter-national agenda, within a context where rapid urban-ization and environmental degradation combine with
Table 1.4 Indicators of Reducing Underlying Risk Factors
Disaster risk reduction is an integral objective of environment-related policies and plans, including for land use, natural resource management, and adaptation to climate change.
Social development policies and plans are being implemented to reduce the vulnerability of populations most at risk.
Economic and productive sectoral policies and plans have been implemented to reduce the vulnerability of economic activities.
Planning and management of human settlements incorporate disaster risk reduction elements, including enforcement of building codes.
Disaster risk reduction measures are integrated into post-disaster recovery and rehabilitation processes.
Procedures are in place to assess the disaster risk impacts of major development projects, especially infrastructure.
Source: HFA in UNISDR (2007)

Preventive Resettlement of Populations at Risk of Disaster: Experiences from Latin America 16
grinding poverty and weak governance—especially at the local government level—to deepen vulnerability that is stressed even further by the effects of climate change.
Thus, the use of risk management tools should be inten-sified and risk reduction criteria made an integral part of land use planning and development policies. How-ever, regardless of whether corrective or prospective risk management measures are implemented, reducing the underlying factors will continue to pose enormous challenges.
In certain scenarios, when nothing else can mitigate the risk, the most viable option for reducing the risk
to which some communities are exposed is resettle-ment. Although resettlement is a complex affair, there are examples of successful preventive resettlements that have not only eliminated the risk of disaster but also improved the standard of living and safety of the popu-lation involved and reclaimed the areas at-risk areas to their original use.
Under current conditions, in which risk scenarios may worsen for millions of people due to development mod-els and land tenure patterns, an awareness of preventive resettlement outcomes may help improve this practice as a risk reduction measure.
Chapter 1 Global and Latin America and the Caribbean Natural Disaster Trends 17
References
Anderson, Mary B. 1996. A reconceptualization of the linkages between disasters and development. The Disasters: The International Journal of Disaster Studies and Practice 9 (Harvard Supplement).
Arnold, Margaret. 2004. Natural Disasters: Counting the Cost. The World Bank, Washington D.C. Retrieved from http://web.worldbank.org/WBSITE/EXTERNAL/NEWS/0,,contentMDK:20169861~pagePK:64257043~piPK:437376~theSitePK:4607,00.html.
Benson, Charlotte; Twigg, John. 2007. Tools for Main-streaming Disaster Risk Reduction: Guidance Notes for Development Organizations. Benfield UCL Hazard Research Centre, London, England. Retrieved from: http://www.benfieldhrc.org/ac-tivities/misc_papers/Tools_for_mainstreaming_DRR.pdf
Blaikie, Piers; Cannon, Terry; Davis, Ian; Wisner, Ben. 1996. Vulnerabilidad, el entorno social, político y económico de los desastres. Red de Estudios Socia-les en Prevención de Desastres de en América La-tina (Spanish version of “At Risk”, 1994).
CCAD (Comisión Centroamericana de Ambiente y De-sarrollo). 1998. Incendios: problemáticas y per-spectivas. Memoria de la Reunión técnica de San Pedro Sula (CCAD).
ECLAC (Economic Commission for the Latin America and the Caribbean) and the IDB (Inter-American Development Bank). 2000. Effects of Natural Disasters on the Surface of the Earth, On Infrastructure and on Agriculture. In: A Matter of Development: How to Reduce Vulnerability in the Face of Natural Disasters. Mexico, March 7.
EM-DAT (Emergency Events Database). OFDA/CRED International Disaster Database. Uni-versité Catholique de Louvain, Brussels, Bel-gium. http://www.emdat.be
General Secretariat of the Andean Community. 2009. Atlas de las dinámicas del territorio andino: población y bienes expuestos a amenazas natu-rales. Cali: Corporación OSSO
Inter-American Development Bank. 2000. Facing the Challenge of natural Disasters in LAC: An IDB Action Plan. Washington DC.
———. 2007a. Developing and Supporting the Use of Disaster-Linked Financial Instruments: The Role of the IDB in Latin America and the Ca-ribbean. Washington D.C., May
———. 2007b. The Disaster Response to Prevention Companion Paper to the Disaster Risk Man-agement Policy
Lavell, Allan. 2004. Local Level Risk Management: From Concept to Practice. CEPREDENAC-UNDP. Quito.
———. 2008. Apuntes para una reflexión institucio-nal en países de la subregión andina sobre el enfoque de la reducción de riesgos. Lima: PRE-DECAN.
———. 2009. Local Disaster Risk Reduction: Lessons Learned from the Andes. Lima: PREDECAN.
Parry, M.L., Canziani, O.F.; Palutikof, J.P., Linden, P.J. v.d. and Hanson, C.E. (Eds.). 2007 Fourth As-sessment Report of the IPCC (Intergovernmental Panel on Climate Change). Climate Change 2007: Impacts, Adaptation and Vulnerability. Contribu-tion of Working Group II to the Fourth Assessment Report of the IPCC. Cambridge, UK. Cambridge University Press.
Sanahuja, Haris. 1999. El daño y la evaluación del riesgo en América Central. Una propuesta metodológica tomando como caso de estudio a Costa Rica. Cos-ta Rica: Biblioteca Demetrio Tinoco, Universidad de Costa Rica.
The World Bank. 2007. Research Highlights 2007: Sustainable Rural and Urban Development. Recovered from: http://go.worldbank.org/EET-M1Y9EG0
UNISDR (International Strategy for Disaster Reduc-tion). 2004. Living with Risk: a global Review of disaster reduction initiatives (ISDR).
———. 2007. Words into action: A guide for imple-menting the Hyogo Framework for Action 2005-2015. Building the resilience of nations and communities to disasters. Retrieved from http://www.preventionweb.net/files/594_10382.pdf

Preventive Resettlement of Populations at Risk of Disaster: Experiences from Latin America 18
Resettlement as a Disaster Risk Reduction Measure: Case studies
———. 2009a. Global Assessment Report on Disaster Risk Reduction. Geneva: United Nations. Re-trieved from http://www.preventionweb.net/english/hyogo/gar/report/index.php?id=9413.
———. 2009b. 2009 Disasters in numbers.
———. 2009c. Terminology on Disaster Risk Reduction. Retrieved from: http://unisdr.org/files/7817_UNISDRTerminologyEnglish.pdf
UNDP (United Nations Development Program). 2004. Reducing Disaster Risk, A Challenge for Development. Provention Consortium, Guidance Note 8: Tools for mainstreaming disaster risk reduction - economic analysis. Nueva York: UNDP’S Bureau for Crisis Prevention and Recovery (BCPR).
UN-Habitat. (United Nations Human Settlements Pro-gramme). 2009. Global Report on Human Settle-ments 2009. Planning Sustainable cities: Policy Directions. London: Abridge Edition. London-Sterling.
UN (United Nations). 2005. The Millennium Devel-opment Goals Report. New York 2005. Re-trieved from: http://unstats.un.org/unsd/mi/pdf/MDG%20Book.pdf
Wilches Chaux, Gustavo. 2008. Estrategia Internacio-nal de Reducción de Desastres (eird). 2008. La gestión del riesgo de desastres hoy: contextos glo-bales, herramientas locales (eird).
Web Resources
CDERA Caribbean Disaster Emergency Re-sponse Agency - http://www.cdera.org/
CERESIS Regional Seismologic Center for South America http://www.ceresis.org/new/es/index.html
CRED Center for Research on Epidemiology of Disasters - http://www.cred.be/
CRID Regional Disaster Information Center for Latin America and the Caribbean http://www.crid.or.cr/crid/ing/index_ing.html
ISDR International Strategy for Natural Disas-ter Reduction - http://www.unisdr.org/
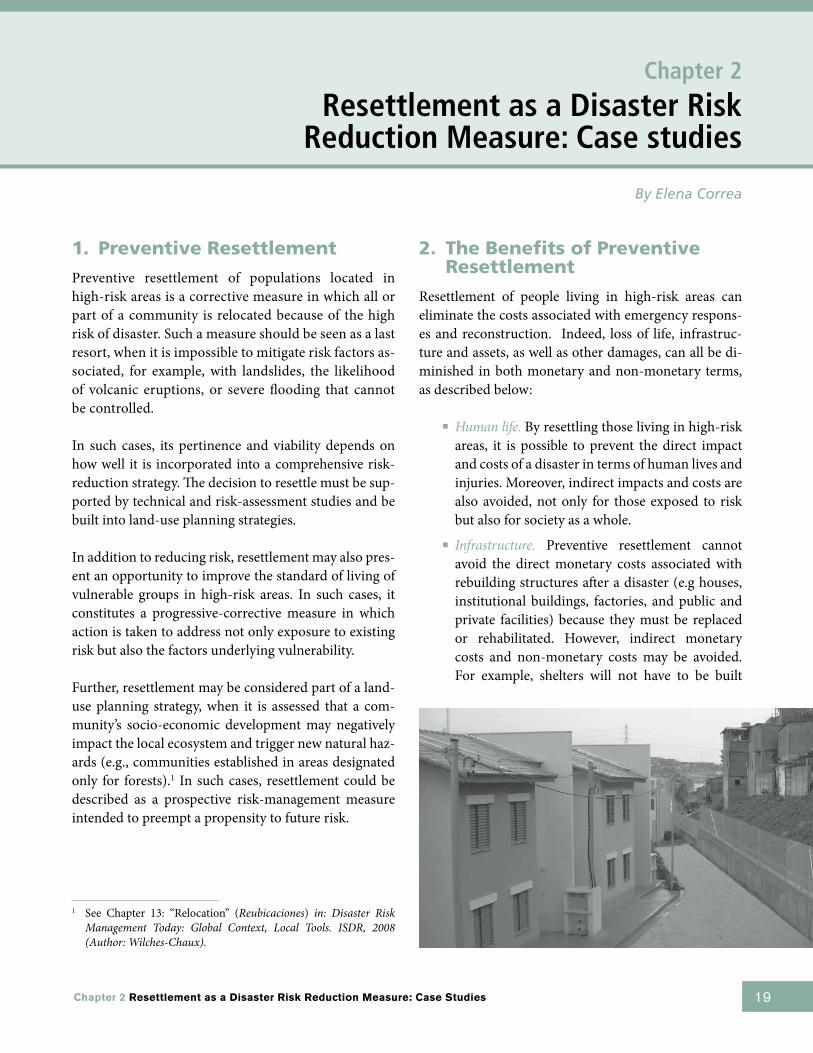
19Chapter 2 Resettlement as a Disaster Risk Reduction Measure: Case Studies
1. Preventive Resettlement
Preventive resettlement of populations located in high-risk areas is a corrective measure in which all or part of a community is relocated because of the high risk of disaster. Such a measure should be seen as a last resort, when it is impossible to mitigate risk factors as-sociated, for example, with landslides, the likelihood of volcanic eruptions, or severe flooding that cannot be controlled.
In such cases, its pertinence and viability depends on how well it is incorporated into a comprehensive risk-reduction strategy. The decision to resettle must be sup-ported by technical and risk-assessment studies and be built into land-use planning strategies.
In addition to reducing risk, resettlement may also pres-ent an opportunity to improve the standard of living of vulnerable groups in high-risk areas. In such cases, it constitutes a progressive-corrective measure in which action is taken to address not only exposure to existing risk but also the factors underlying vulnerability.
Further, resettlement may be considered part of a land-use planning strategy, when it is assessed that a com-munity’s socio-economic development may negatively impact the local ecosystem and trigger new natural haz-ards (e.g., communities established in areas designated only for forests).1 In such cases, resettlement could be described as a prospective risk-management measure intended to preempt a propensity to future risk.
2. The Benefits of Preventive Resettlement
Resettlement of people living in high-risk areas can eliminate the costs associated with emergency respons-es and reconstruction. Indeed, loss of life, infrastruc-ture and assets, as well as other damages, can all be di-minished in both monetary and non-monetary terms, as described below:
■ Human life. By resettling those living in high-risk areas, it is possible to prevent the direct impact and costs of a disaster in terms of human lives and injuries. Moreover, indirect impacts and costs are also avoided, not only for those exposed to risk but also for society as a whole.
■ Infrastructure. Preventive resettlement cannot avoid the direct monetary costs associated with rebuilding structures after a disaster (e.g houses, institutional buildings, factories, and public and private facilities) because they must be replaced or rehabilitated. However, indirect monetary costs and non-monetary costs may be avoided. For example, shelters will not have to be built
Chapter 2
Resettlement as a Disaster Risk Reduction Measure: Case studies
1 See Chapter 13: “Relocation” (Reubicaciones) in: Disaster Risk Management Today: Global Context, Local Tools. ISDR, 2008 (Author: Wilches-Chaux).
By Elena Correa
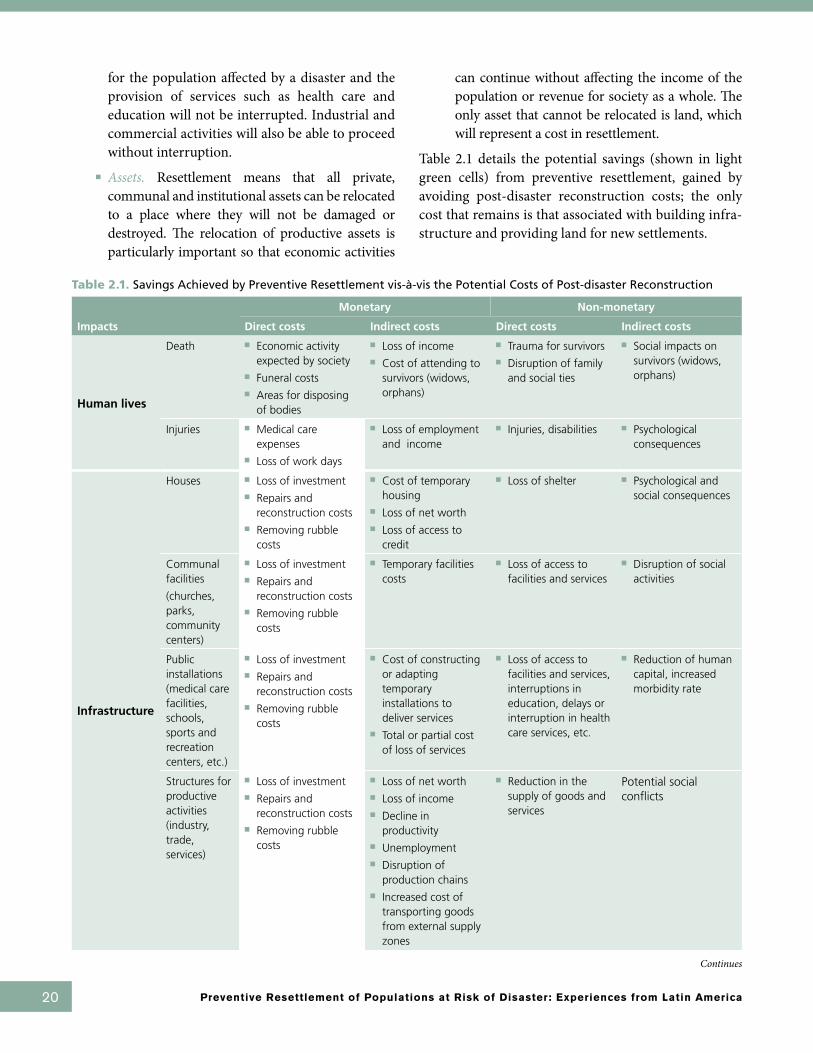
20 Preventive Resettlement of Populations at Risk of Disaster: Experiences from Latin America
for the population affected by a disaster and the provision of services such as health care and education will not be interrupted. Industrial and commercial activities will also be able to proceed without interruption.
■ Assets. Resettlement means that all private, communal and institutional assets can be relocated to a place where they will not be damaged or destroyed. The relocation of productive assets is particularly important so that economic activities
can continue without affecting the income of the population or revenue for society as a whole. The only asset that cannot be relocated is land, which will represent a cost in resettlement.
Table 2.1 details the potential savings (shown in light green cells) from preventive resettlement, gained by avoiding post-disaster reconstruction costs; the only cost that remains is that associated with building infra-structure and providing land for new settlements.
Table 2.1. Savings Achieved by Preventive Resettlement vis-à-vis the Potential Costs of Post-disaster Reconstruction
Impacts
Monetary Non-monetary
Direct costs Indirect costs Direct costs Indirect costs
Human lives
Death ■ Economic activity expected by society
■ Funeral costs■ Areas for disposing
of bodies
■ Loss of income■ Cost of attending to
survivors (widows, orphans)
■ Trauma for survivors■ Disruption of family
and social ties
■ Social impacts on survivors (widows, orphans)
Injuries ■ Medical care expenses
■ Loss of work days
■ Loss of employment and income
■ Injuries, disabilities ■ Psychological consequences
Infrastructure
Houses ■ Loss of investment■ Repairs and
reconstruction costs■ Removing rubble
costs
■ Cost of temporary housing
■ Loss of net worth■ Loss of access to
credit
■ Loss of shelter ■ Psychological and social consequences
Communal facilities
(churches, parks, community centers)
■ Loss of investment■ Repairs and
reconstruction costs■ Removing rubble
costs
■ Temporary facilities costs
■ Loss of access to facilities and services
■ Disruption of social activities
Public installations (medical care facilities, schools, sports and recreation centers, etc.)
■ Loss of investment■ Repairs and
reconstruction costs■ Removing rubble
costs
■ Cost of constructing or adapting temporary installations to deliver services
■ Total or partial cost of loss of services
■ Loss of access to facilities and services, interruptions in education, delays or interruption in health care services, etc.
■ Reduction of human capital, increased morbidity rate
Structures for productive activities (industry, trade, services)
■ Loss of investment■ Repairs and
reconstruction costs■ Removing rubble
costs
■ Loss of net worth■ Loss of income■ Decline in
productivity■ Unemployment■ Disruption of
production chains■ Increased cost of
transporting goods from external supply zones
■ Reduction in the supply of goods and services
Potential social conflicts
Continues

21Chapter 2 Resettlement as a Disaster Risk Reduction Measure: Case Studies
Impacts
Monetary Non-monetary
Direct costs Indirect costs Direct costs Indirect costs
Assets
Land (private, communal, public)
■ Loss of investment ■ Loss of economic activities related to the use of land
■ Loss of identity and belonging
■ Psychological and social consequences
Other private assets
■ Loss of savings, IDs and personal belongings (furniture, clothing, household electrical appliances, etc.)
■ Replacement cost of goods
■ Replacement of identification documents and personal belongings, costs of bringing relief items to victims.
■ Loss of investment
■ Loss of access to services
■ Dependency on foreign aid
■ Psychological consequences
Other public assets
■ Loss of public property
■ Replacement costs
■ Reallocation of regular budget funds to replace assets
■ Reduced investment in other areas
■ Reduced expansion of coverage or provision of services in different areas
■ Loss of human capital
Other communal assets
■ Loss of community property (religious, cultural, recreational, educational, etc.)
■ Property replacement costs
■ Loss of social structure and networks, reduced social and cultural capital
■ Alterations in social and cultural dynamics
Productive assets (private, communal, public)
■ Loss of machinery, equipment, tools
■ Cost of replacing productive assets
■ Loss of income, unemployment
■ Reduced quality of life and living conditions
■ Stress and other psychological consequences
3. Case Studies
Table 2.1. Continuation
Resettlement as a preventive measure of disaster risk-reduction strategy is still in its early stages. However, it needs to be analyzed given its benefits in terms of pro-tecting life and assets, the technology available to iden-tify and assess risks, and the increasing number of disas-ters and people affected.
To that end, and with support from the Global Facility for Disaster Reduction and Recovery, preventive resettle-ment experiences were studied in Argentina, Brazil, Colombia and Guatemala. These were selected because they illustrate conditions and practices in different parts of LAC: Central America, Andean countries, and the Southern Cone.
3.1 Objectives
The main objectives of the case studies were to:
■ Document various experiences with resettling populations living in high-risk areas, the legal and institutional frameworks in which they were carried out, the housing solutions adopted, the sources and cost of financing, and participation by communities and local authorities;
■ Present the lessons learned in a guide on resettlement for disaster risk reduction that could be used by governments, institutions and communities.
22 Preventive Resettlement of Populations at Risk of Disaster: Experiences from Latin America
3.2 Scope of the Case Studies
The following factors were examined:
■ The country’s main hazards and disasters;■ The legal and institutional framework for risk
management and emergency response;■ The context of the case studied, land use, population
patterns, principal hazards, existing risk management measures, institutions responsible, costs and sources of funding;
■ The hazards to which the populations were exposed and their socio-economic characteristics;
■ The decision-making process for the authorities and communities in determining the need for preventive resettlement;
■ The entities in charge of resettlement, the professional teams responsible for its preparation and implementation, and the inter-agency coordination mechanisms;
■ Planning and implementing the resettlement;■ Proposed housing solutions, including a discussion
of how housing types, designs and construction strategies were selected;
■ Solutions for persons without legal land rights titles (deeds to property);
■ The delivery of houses and property titles to families;
■ Mechanisms for consulting and negotiating the various resettlement options;
■ Mechanisms for consulting with the population involved;
■ Activities and support to the communities before, during, and after relocation;
■ Measures adopted to restore the livelihoods of the resettled population;
■ Participation by local authorities and communities in the resettlement process;
■ Monitoring of risk during the resettlement process and contingency plans;
■ Costs and sources of financing;■ Monitoring and evaluation systems;■ Accountability mechanisms;■ The use of reclaimed at-risk areas, strategies for
overseeing new occupation of those areas and the institutions in charge.
3.3 Methodology
To conduct the studies, a team of professionals was formed that included a coordinator with experience in human resettlement, four professionals (consultants) responsible for preparing the case studies (one per country), two experts in risk management, and research assistants. The consultants worked directly with the re-settlement programs, although in different roles. The governments and institutions involved authorized the preparation of the studies.
To develop the methodology and assemble the team, a workshop was held in Bogotá, Colombia, in April 2008. At that time, each professional gave a brief presentation of the case chosen, after which there were discussions about the objectives, contents, and methodology to be used. In June of that year, a second workshop was held in Santiago Atitlán, Guatemala, at which each profes-sional presented the principal findings of the studies. The participants then identified the most important lessons learned. The workshops held in Colombia and Guatemala allowed the entire team to gain first-hand experience of these two cases.

23Chapter 2 Resettlement as a Disaster Risk Reduction Measure: Case Studies
Since all the professionals had participated in the cases studied, the work consisted of reviewing existing infor-mation and documents, which they supplemented with their own first-hand experiences. Primary information was not compiled.
The risk management experts analyzed disaster trends, globally and in Latin America, and developed the con-ceptual framework and technical processes for defining resettlement as a disaster risk-reduction measure.
Another team that included the same coordinator and two professionals familiar with resettlement analyzed the findings and established the outline for the Reset-tlement Guide for Populations at Risk of Disaster, pre-pared in 2009-2010.
Although the participants agreed on the broad out-lines of the content and scope of the studies, the pace at
which they materialized differed due to various reasons. First, each resettlement program was conceived accord-ing to each country’s strategies and premises. Second, the information needed had not been systematically compiled, so the professionals had to collect it and sometimes the data required were not available. Third, the resettlement processes were conducted within dif-ferent time frames and, as some were still under way, their outcomes had not yet been evaluated. Finally, the professionals’ profiles differed, and they also performed different functions: some were managers or coordina-tors, while others were field experts or evaluators. All of these factors were reflected in the studies.
However, the evaluation of conducting the studies was positive. Although it became impossible to maintain the methodological rigor envisaged at the start, the expe-riences were documented and important lessons were drawn for potential replication in other countries.
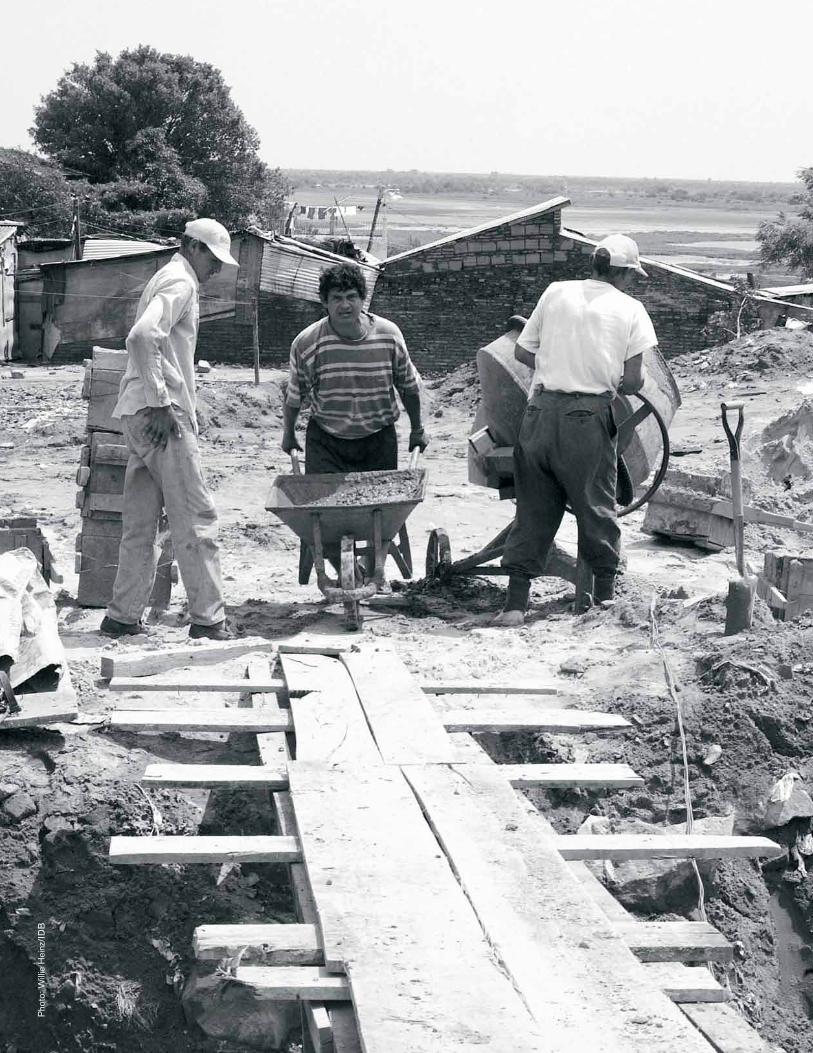
Pho
to: W
illie
Hei
nz/I
DB
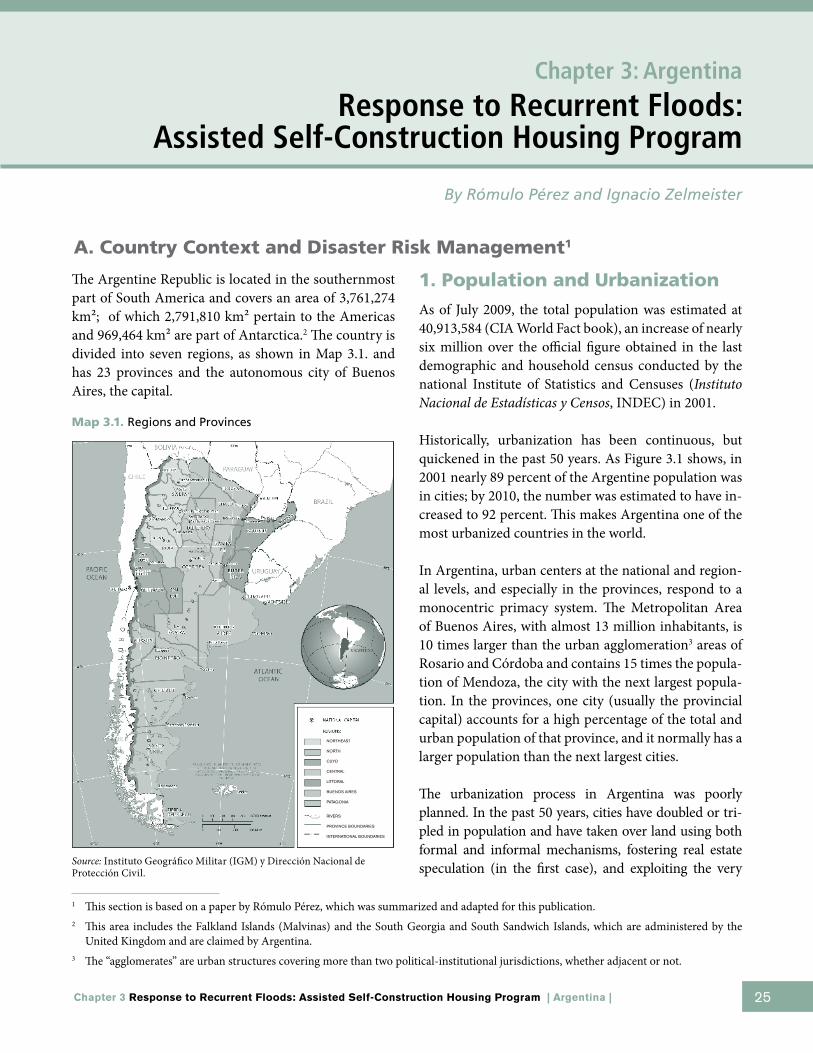
Chapter 3 Response to Recurrent Floods: Assisted Self-Construction Housing Program | Argentina | 25
The Argentine Republic is located in the southernmost part of South America and covers an area of 3,761,274 km²; of which 2,791,810 km² pertain to the Americas and 969,464 km² are part of Antarctica.2 The country is divided into seven regions, as shown in Map 3.1. and has 23 provinces and the autonomous city of Buenos Aires, the capital.
Map 3.1. Regions and Provinces
1. Population and Urbanization
As of July 2009, the total population was estimated at 40,913,584 (CIA World Fact book), an increase of nearly six million over the official figure obtained in the last demographic and household census conducted by the national Institute of Statistics and Censuses (Instituto nacional de Estadísticas y Censos, INDEC) in 2001.
Historically, urbanization has been continuous, but quickened in the past 50 years. As Figure 3.1 shows, in 2001 nearly 89 percent of the Argentine population was in cities; by 2010, the number was estimated to have in-creased to 92 percent. This makes Argentina one of the most urbanized countries in the world.
In Argentina, urban centers at the national and region-al levels, and especially in the provinces, respond to a monocentric primacy system. The Metropolitan Area of Buenos Aires, with almost 13 million inhabitants, is 10 times larger than the urban agglomeration3 areas of Rosario and Córdoba and contains 15 times the popula-tion of Mendoza, the city with the next largest popula-tion. In the provinces, one city (usually the provincial capital) accounts for a high percentage of the total and urban population of that province, and it normally has a larger population than the next largest cities.
The urbanization process in Argentina was poorly planned. In the past 50 years, cities have doubled or tri-pled in population and have taken over land using both formal and informal mechanisms, fostering real estate speculation (in the first case), and exploiting the very
Chapter 3: Argentina
Response to Recurrent Floods: Assisted Self-Construction Housing Program
By Rómulo Pérez and Ignacio Zelmeister
Source: Instituto Geográfico Militar (IGM) y Dirección Nacional de Protección Civil.
1 This section is based on a paper by Rómulo Pérez, which was summarized and adapted for this publication.2 This area includes the Falkland Islands (Malvinas) and the South Georgia and South Sandwich Islands, which are administered by the
United Kingdom and are claimed by Argentina. 3 The “agglomerates” are urban structures covering more than two political-institutional jurisdictions, whether adjacent or not.
A. Country Context and Disaster Risk Management1
NORTHEAST
NORTH
CUYO
CENTRAL
LITTORAL
BUENOS AIRES
PATAGONIA
RIVERS
PROVINCE BOUNDARIES
INTERNATIONAL BOUNDARIES
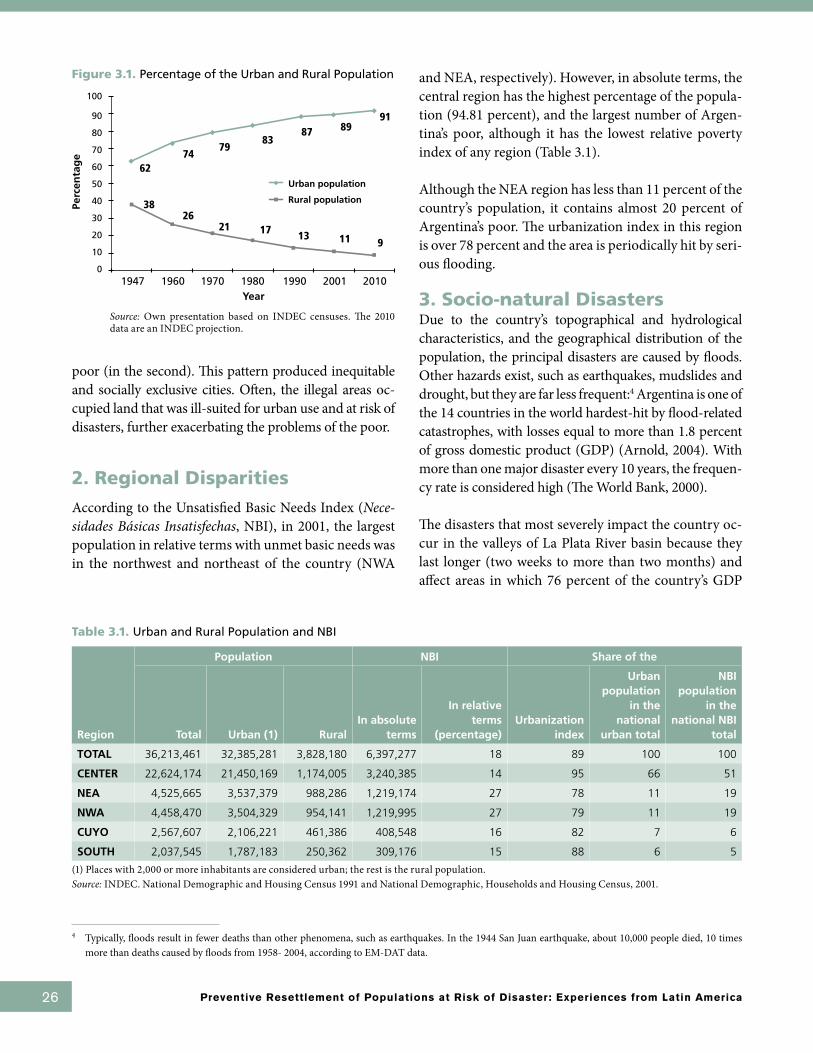
26 Preventive Resettlement of Populations at Risk of Disaster: Experiences from Latin America
Source: Own presentation based on INDEC censuses. The 2010 data are an INDEC projection.
100
90
80
70
60
50
40
30
20
10
0
Perc
enta
ge
1947 1970 19901960 1980 2001 2010Year
Urban population
Rural population
poor (in the second). This pattern produced inequitable and socially exclusive cities. Often, the illegal areas oc-cupied land that was ill-suited for urban use and at risk of disasters, further exacerbating the problems of the poor.
2. Regional Disparities
According to the Unsatisfied Basic Needs Index (nece-sidades Básicas Insatisfechas, NBI), in 2001, the largest population in relative terms with unmet basic needs was in the northwest and northeast of the country (NWA
and NEA, respectively). However, in absolute terms, the central region has the highest percentage of the popula-tion (94.81 percent), and the largest number of Argen-tina’s poor, although it has the lowest relative poverty index of any region (Table 3.1).
Although the NEA region has less than 11 percent of the country’s population, it contains almost 20 percent of Argentina’s poor. The urbanization index in this region is over 78 percent and the area is periodically hit by seri-ous flooding.
3. Socio-natural DisastersDue to the country’s topographical and hydrological characteristics, and the geographical distribution of the population, the principal disasters are caused by floods. Other hazards exist, such as earthquakes, mudslides and drought, but they are far less frequent:4 Argentina is one of the 14 countries in the world hardest-hit by flood-related catastrophes, with losses equal to more than 1.8 percent of gross domestic product (GDP) (Arnold, 2004). With more than one major disaster every 10 years, the frequen-cy rate is considered high (The World Bank, 2000).
The disasters that most severely impact the country oc-cur in the valleys of La Plata River basin because they last longer (two weeks to more than two months) and affect areas in which 76 percent of the country’s GDP
4 Typically, floods result in fewer deaths than other phenomena, such as earthquakes. In the 1944 San Juan earthquake, about 10,000 people died, 10 times more than deaths caused by floods from 1958- 2004, according to EM-DAT data.
Table 3.1. Urban and Rural Population and NBI
Region
Population NBI Share of the
Total Urban (1) RuralIn absolute
terms
In relative terms
(percentage)Urbanization
index
Urban population
in the national
urban total
NBI population
in the national NBI
total
TOTAL 36,213,461 32,385,281 3,828,180 6,397,277 18 89 100 100
CENTER 22,624,174 21,450,169 1,174,005 3,240,385 14 95 66 51
NEA 4,525,665 3,537,379 988,286 1,219,174 27 78 11 19
NWA 4,458,470 3,504,329 954,141 1,219,995 27 79 11 19
CUYO 2,567,607 2,106,221 461,386 408,548 16 82 7 6
SOUTH 2,037,545 1,787,183 250,362 309,176 15 88 6 5
(1) Places with 2,000 or more inhabitants are considered urban; the rest is the rural population.Source: INDEC. National Demographic and Housing Census 1991 and National Demographic, Households and Housing Census, 2001.
Figure 3.1. Percentage of the Urban and Rural Population
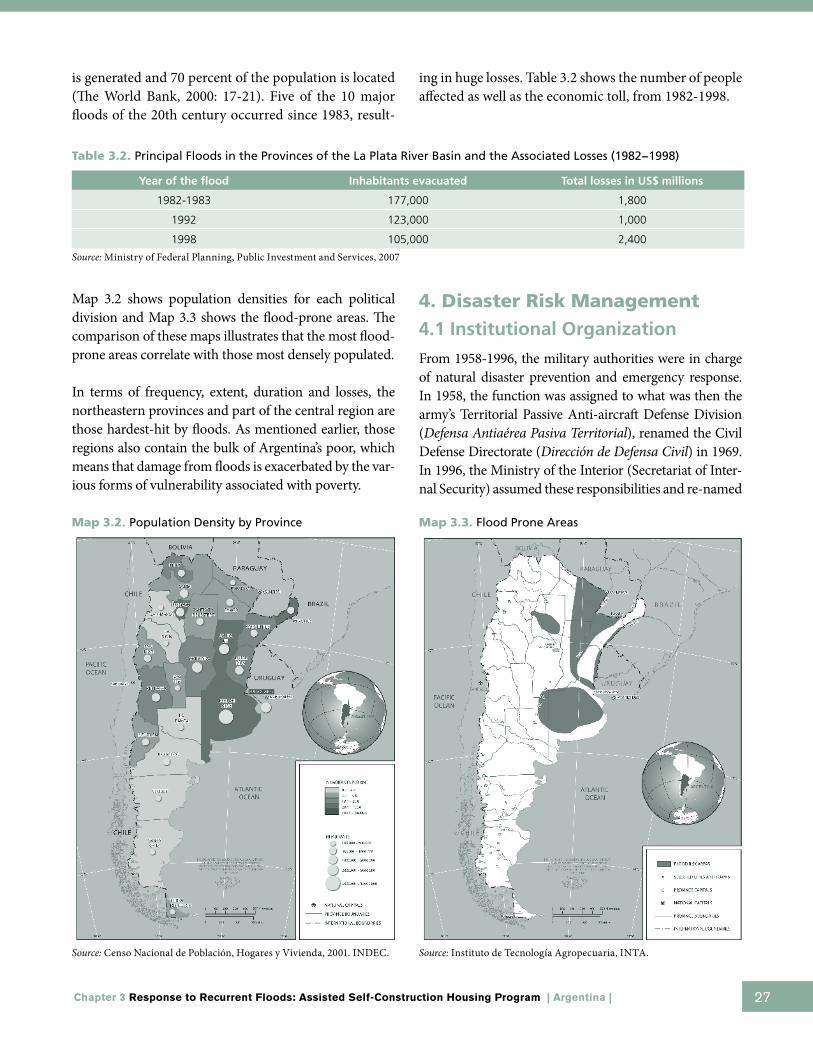
Chapter 3 Response to Recurrent Floods: Assisted Self-Construction Housing Program | Argentina | 27
Table 3.2. Principal Floods in the Provinces of the La Plata River Basin and the Associated Losses (1982−1998)
Year of the flood Inhabitants evacuated Total losses in US$ millions
1982-1983 177,000 1,800
1992 123,000 1,000
1998 105,000 2,400
Source: Ministry of Federal Planning, Public Investment and Services, 2007
is generated and 70 percent of the population is located (The World Bank, 2000: 17-21). Five of the 10 major floods of the 20th century occurred since 1983, result-
ing in huge losses. Table 3.2 shows the number of people affected as well as the economic toll, from 1982-1998.
Map 3.2. Population Density by Province Map 3.3. Flood Prone Areas
Source: Censo Nacional de Población, Hogares y Vivienda, 2001. INDEC. Source: Instituto de Tecnología Agropecuaria, INTA.
Map 3.2 shows population densities for each political division and Map 3.3 shows the flood-prone areas. The comparison of these maps illustrates that the most flood-prone areas correlate with those most densely populated.
In terms of frequency, extent, duration and losses, the northeastern provinces and part of the central region are those hardest-hit by floods. As mentioned earlier, those regions also contain the bulk of Argentina’s poor, which means that damage from floods is exacerbated by the var-ious forms of vulnerability associated with poverty.
4. Disaster Risk Management
4.1 Institutional Organization
From 1958-1996, the military authorities were in charge of natural disaster prevention and emergency response. In 1958, the function was assigned to what was then the army’s Territorial Passive Anti-aircraft Defense Division (Defensa Antiaérea Pasiva Territorial), renamed the Civil Defense Directorate (Dirección de Defensa Civil) in 1969. In 1996, the Ministry of the Interior (Secretariat of Inter-nal Security) assumed these responsibilities and re-named

28 Preventive Resettlement of Populations at Risk of Disaster: Experiences from Latin America
the unit again, to the National Directorate of Planning and Civil Defense. This Directorate consists of two units: One is responsible for operations and assistance and the other for civic education. The latter trains and advises munici-palities and institutions on risk management.
Civil defense is structured in the following manner. At the national level, the President is responsible for coor-dinating and directing the effort, while delegating the function to the Ministry of the Interior. Provincial gov-ernments and the City of Buenos Aires have the Civil Defense Board (Junta de Defensa Civil) as an advisory entity and the Directorate of Civil Defense (Dirección de Defensa Civil) as the organ of execution. At the municipal level, mayors are in charge and have a Municipal Civil Defense Board (Junta Municipal de Defensa Civil) and a Municipal Civil Defense Coordinator or Secretary.
The Civil Defense Directorate’s principal activities are geared to reducing risk, preparing emergency plans, co-ordinating their implementation during emergencies, rehabilitating basic services interrupted by an emergen-cy, and carrying out reconstruction activities or improv-ing the conditions that existed prior to the disaster. Each level of civil defense is autonomous in its own jurisdic-tional sphere. Throughout the system, the hierarchically higher levels lend support to the lower levels.
As a result of the heavy flooding caused by the El Niño phenomenon in 1998, the Federal Emergencies System (Sistema Federal de Emergencias, SIFEM) was estab-lished in 1999. It is under the Secretariat of Internal Se-curity, establishes linkages with national agencies and coordinates actions at the federal, provincial and mu-nicipal levels.
Various other national agencies provide information, conduct research, or lend resources or technical capac-ity from different sectors. They include the Ministry of Social Development (Ministerio de Desarrollo So-cial, MDS), the Military Geographic Institute (Instituto Geográfico Militar, IGM), the National Space Activities Commission (Comisión nacional de Actividades Espa-ciales, CONAE), the National Meteorological Service (Servicio Metereológico nacional, SMN), the National Water and Environment Institute (Instituto nacional del Agua y del Ambiente, INA), the National Agricultural and Livestock Technology Institute (Instituo nacional de
Teconología Agropecuaria, INTA), the Argentine Min-ing Geology Service (Servicio Geológico Minero Argen-tino, SEGEMAR), the National Institute of Statistics and Censuses (Instituto nacional de Estadísticas y Censos, INDEC), as well as universities and research institutes.
In 2007, the government launched the national platform for disaster risk reduction, which is coordinated by the White Helmets, to promote the implementation of the Hyogo Framework for Action (HFA) in the country. This platform consists of a large number of ministries and representatives of civil society, academia and the private sector.
Despite the existing institutional organization and the national platform for disaster risk reduction, Argentina needs to improve its risk reduction practices because most of these institutions’ actions focus on the emer-gency disaster response and recovery phases. Moreover, there is considerable thematic, functional and opera-tional fragmentation among the national agencies and units responsible for disaster management.
Also, no federal water law or federal land use and land management laws exist. National legislation in these areas consists of a number of provisions scattered over various codes and laws that do not constitute a coherent body of legislation for risk management and its relation to planning the country’s integrated development. This issue is now being addressed by the Sub-Secretary of Planning and Public Investment.
4.2 Reducing Vulnerability to Floods
Since floods are the hazard that Argentina faces most frequently and the one that creates the most damage, the country has tried to reduce its vulnerability by es-tablishing hydrological early warning networks and flood risk-reduction programs.
Hydrological early warning networks of the La Plata River Basin and definition of flood-risk areas
After the 1982-1983 floods, a Hydrological Early Warn-ing Operations Center (Centro Operativo de Alerta Hi-drológico, COAH) was established. The National Water Science and Technology Institute (renamed the Nation-al Water and Environment, INA), was tasked with oper-

Chapter 3 Response to Recurrent Floods: Assisted Self-Construction Housing Program | Argentina | 29
ating the Center, which forecasts floods and low water levels, both of which are crucial for river navigation and port activities.
Also, based on a study for regulating the Paraná, Para-guay and Uruguay River valley and flood control, the provinces that comprise La Plata River basin passed leg-islation that established the flood-risk areas and defined their potential uses (Halcrow, 1994).
Flood risk-reduction programs
Since the 1990s, the government conducted several pro-grams with The World Bank and the Inter-American Development Bank support, the largest or most notable being the following:
■ Flood Emergency Rehabilitation Program (Programa de Rehabilitación por la Emergencia de las Inundaciones, PREI).
This was a multi-sector emergency loan for reconstruct-ing infrastructure and housing for low-income popula-tions affected by water emergencies. It was executed in seven provinces from 1993-1998.
■ Flood Protection Program (Programa de Protección contra las Inundaciones, PPI)
This program provided continuity to PREI actions that were designed to protect the lives and assets of 5.5 mil-lion people, guarantee the normal and unrestricted per-formance of economic activities in the drainage area of the Paraná, Paraguay and Uruguay Rivers, and ensure uninterrupted use of communications and transporta-tion routes. It was conducted in the provinces of For-mosa, Misiones, Chaco, Corrientes, Entre Ríos, Santa Fe and Buenos Aires, from 1997-2006.
The program had two components: (i) structural mea-sures, such as civil works, to protect against floods, and (ii) non-structural measures, such as institutional and operational strengthening of provincial civil defense systems for managing each province’s recurrent floods, promulgating municipal laws on the use of property in flood-prone areas, devising environmental manage-ment plans and studies in 21 localities, and creating an early flood warning system, among others. Ninety-nine shelters were built for the population hit by floods and 5,636 houses were constructed with technical-social as-
sistance in the form of assisted self-construction and mutual assistance schemes.
■ El Niño Floods Emergency Program
The aim of this program was to help finance physical works and institutional actions to deal with the El Niño phenomenon. It was designed in two stages: The first fo-cused on prevention and the second on rehabilitation, and were implemented from 1998-2004. The project’s specific activities included assistance to minimize losses or damage through preventive measures and rehabilitat-ing infrastructure and services. In addition, 455 houses were constructed for families affected by the floods, again using assisted self-construction and mutual assis-tance arrangements.
■ Emergency program for recovering areas affected by floods
This program was developed from 1998-2008 to support the economic and social recovery of areas affected by floods through activities designed to mitigate their ef-fects and the reconstruction/rehabilitation of economic and social infrastructure.
■ Flood Prevention and Urban Drainage Program (Programa de Prevención de Inundaciones y Drenaje Urbano, PIDU)
This program was begun in 2008 and is expected to end in 2011. Its chief objective is to reduce the vulnerabil-
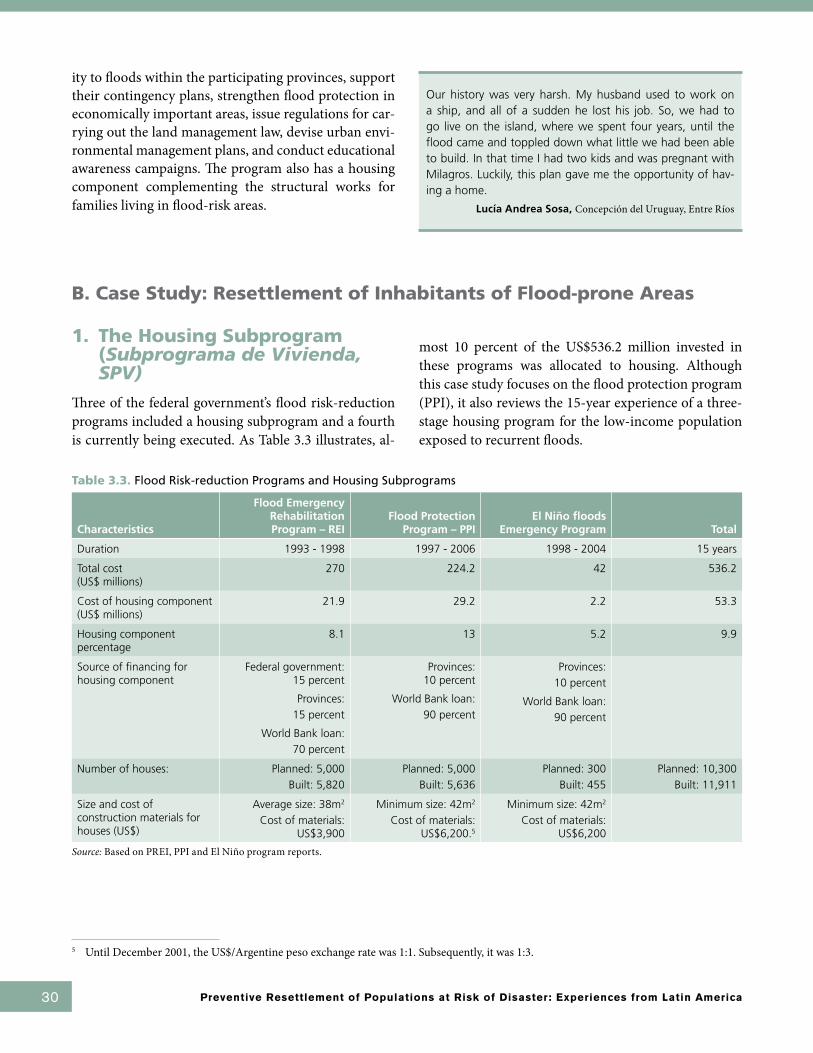
30 Preventive Resettlement of Populations at Risk of Disaster: Experiences from Latin America
ity to floods within the participating provinces, support their contingency plans, strengthen flood protection in economically important areas, issue regulations for car-rying out the land management law, devise urban envi-ronmental management plans, and conduct educational awareness campaigns. The program also has a housing component complementing the structural works for families living in flood-risk areas.
Our history was very harsh. My husband used to work on a ship, and all of a sudden he lost his job. So, we had to go live on the island, where we spent four years, until the flood came and toppled down what little we had been able to build. In that time I had two kids and was pregnant with Milagros. Luckily, this plan gave me the opportunity of hav-ing a home.
Lucía Andrea Sosa, Concepción del Uruguay, Entre Ríos
5 Until December 2001, the US$/Argentine peso exchange rate was 1:1. Subsequently, it was 1:3.
1. The Housing Subprogram (Subprograma de Vivienda, SPV)
Three of the federal government’s flood risk-reduction programs included a housing subprogram and a fourth is currently being executed. As Table 3.3 illustrates, al-
most 10 percent of the US$536.2 million invested in these programs was allocated to housing. Although this case study focuses on the flood protection program (PPI), it also reviews the 15-year experience of a three-stage housing program for the low-income population exposed to recurrent floods.
Table 3.3. Flood Risk-reduction Programs and Housing Subprograms
Characteristics
Flood Emergency Rehabilitation Program – REI
Flood Protection Program – PPI
El Niño floods Emergency Program Total
Duration 1993 - 1998 1997 - 2006 1998 - 2004 15 years
Total cost (US$ millions)
270 224.2 42 536.2
Cost of housing component (US$ millions)
21.9 29.2 2.2 53.3
Housing component percentage
8.1 13 5.2 9.9
Source of financing for housing component
Federal government: 15 percent
Provinces:
15 percent
World Bank loan:
70 percent
Provinces: 10 percent
World Bank loan:
90 percent
Provinces:
10 percent
World Bank loan:
90 percent
Number of houses: Planned: 5,000
Built: 5,820
Planned: 5,000
Built: 5,636
Planned: 300
Built: 455
Planned: 10,300
Built: 11,911
Size and cost of construction materials for houses (US$)
Average size: 38m2
Cost of materials: US$3,900
Minimum size: 42m2
Cost of materials: US$6,200.5
Minimum size: 42m2
Cost of materials: US$6,200
Source: Based on PREI, PPI and El Niño program reports.
B. Case Study: Resettlement of Inhabitants of Flood-prone Areas

Chapter 3 Response to Recurrent Floods: Assisted Self-Construction Housing Program | Argentina | 31
Table 3.4 shows the provinces in which the three stag-es of the risk reduction program’s housing component were implemented and the number of houses built.
Table 3.4. Number of Houses Built in each Program
Provinces PREI PPI El Niño Sub-total
Buenos Aires 513 577 1,090
Chaco 514 1,312 1,826
Chubut 50 50
Córdoba 150 150
Corrientes 1,120 1,016 2,136
Entre Ríos 353 353
La Rioja 50 50
Formosa 951 609 1,560
Misiones 1,450 586 2,036
Salta 105 105
Santa Fe 1,272 1,183 2,455
Tucumán 100 100
Total 5,820 5,636 455 11,911
Source: Based on PREI, PPI and El Niño program reports.
In all cases, the number of houses built exceeded the target by 15 to 50 percent due to savings in construction materials. Those savings were used to construct 19 com-munity facilities.
2. Participating Entities
The various different flood risk-reduction programs with housing components were promoted, coordinated and supervised by the Central Emergency Coordina-tion Sub-unit (Subunidad Central de Coordinación para la Emergencia, SUCCE), under the Central Implement-ing Unit of the Externally Financed Programs and Proj-ects Coordination Unit of the Ministry of Federal Plan-ning, Public Investment and Services (Unidad Ejecutora Central de la Unidad de Coordinación de Programas y Proyectos con Financiamiento Externo del Ministerio de Planificación Federal, Inversión Pública y Servicios).
It was beautiful how we organized together. We learned many things, like team work and collaboration… if someone needed something, there was always someone to help. There was a lot of solidarity, fellowship and, above all, harmony. There were no fights or discussions. We were all working for the same goal: having a house, a good house.
Lilian Benítez, Puerto Iguazú, Misiones
The provinces participated through the Provincial Im-plementing Units (Unidades Ejecutoras Provinciales, UEP), Provincial Emergency Coordination Sub-units (Subunidad Provincial de Coordinación para la Emer-gencia, SUPCE), and housing institutes.
3. Assisted Self-construction: The Strategy Selected
The idea was to design flexible housing prototypes tai-lored to meet the tastes and cultural patterns of the in-habitants, and size of households, using locally available construction materials.
Although the beneficiary families were poor, lacked fi-nancial resources and the opportunity to obtain loans, they could nevertheless contribute labor; thus, the housing strategy adopted was assisted self-construction. However, that posed educational and training challeng-es, since the families had little or no experience with construction.
Through assisted self-construction schemes, an effort was made to promote participation and train the ben-eficiaries in construction skills; also, this course would reduce the cost of houses, strengthen community skills, and promote solidarity and the spirit of cooperation. Thus, instead of approaching housing as a charitable good, the program promoted the families’ capacity to organize and participate in the construction. Families

32 Preventive Resettlement of Populations at Risk of Disaster: Experiences from Latin America
became active subjects in transforming their living con-ditions, learned a trade, shared achievements and over-came obstacles in order to build their residences.
Negotiating this strategy with both the financing agen-cies and the provinces was a long and difficult task, as there was no prior practical experience in the country with assisted self-construction on the scale proposed or with the geographical scope envisaged.
…That is why I think the most important thing was to prove that this was a serious project, that it was going to have con-tinuity in time and that it was going to be coordinated by all the participating entities: the province, the Housing Institute, the municipality and the nation. I think that that was what differentiated the project from others.
Ms. Graciela Pereyra, Mayor of Colonia Elisa, Chaco
As the financing agency, The World Bank expected the housing component to be implemented within shorter time-frames in order to meet the needs of families af-fected by the emergency. It also promoted the idea of delivering tents or using a uniform prefabricated hous-ing model for all inhabitants of the river basin. Further, it wanted to avoid any possibility of patronage and cor-ruption, which resulted in long discussions during ne-
gotiations for the Bank loan. Finally, the Bank accepted the country’s position. In addition, representatives of the provinces and local governments did not believe they could rely on the beneficiaries to provide the labor, and they thought this would involve a huge effort with few results. Indeed, negotiating the strategy with The World Bank and provinces delayed project implementa-tion by 10 months.
4. Flood Protection Program (PPI)
The following illustrates the experience with the hous-ing component of the (PPI) in seven provinces—Buenos Aires, Chaco, Corrientes, Entre Ríos, Formosa, Misio-nes and Santa Fe—on the banks of the Paraná, Paraguay and Uruguay Rivers, in more than 120 locations with varying degrees of urbanization, in an area of over 2,200 kilometers.
4.1 Cost and Sources of Financing of the PPI
Initially, the Flood Protection Program was to cost US$420 million, but because of the economic crisis in Argentina as of 2001, that amount was reduced to US$224.5 million, which was financed in large part by a World Bank loan. Despite the reduced loan amount, the

Chapter 3 Response to Recurrent Floods: Assisted Self-Construction Housing Program | Argentina | 33
Table 3.5. Agreements and Responsibilities of the Parties Involved
Agreements SUPCE – Municipalities - Housing Institutes – ProvidersResponsibilities of the parties
Agreements SUPCE – Municipalities
SUPCE Responsibilities Municipality Responsibilities
■ Implement, oversee and coordinate the housing subprogram■ Provide municipalities with technical advice and social support to
implement the housing subprogram■ Provide municipalities and beneficiaries with studies, calculations
and guidelines needed to construct the houses (drawings, budgets, model lay-outs, and construction guidelines)
■ Provide municipalities and beneficiaries with a list of building material suppliers
■ Provide beneficiaries with vouchers for purchasing materials ■ Conduct a final census of beneficiaries, select them through
eligibility criteria, and send the final lists to SUCCE.
■ Provide beneficiaries with land and titles, free of charge■ Conduct an initial census of the affected population■ Form a technical and social team to execute the housing
component and advise the beneficiaries■ Assign one builder/bricklayer for every five houses■ Lend tools to beneficiaries■ Certify progress with housing construction■ Monitor new settlements in rehabilitated and flood-prone areas ■ Adopt security measures in the construction areas to avoid
accidents.
Agreements SUPCE – Provincial Housing Institutes
SUPCE Responsibilities Provincial Housing Institute Responsibilities
■ Defray the cost of construction materials up to a maximum established for each family
■ Hire technical and social work staff: A minimum of one professional on each field for every four localities and at least one per 100 beneficiaries.
■ Conduct the final census of beneficiaries, select them based on eligibility criteria, and send the final lists to SUCCE
■ Prepare the urban development project■ Execute the sub-division of land and obtain legal authorization■ Prepare the lots earmarked for housing construction
■ Support the execution of the housing component.■ Prepare a roster of local suppliers of construction materials. ■ Provide and pay for construction materials using vouchers. ■ Monitor and oversee the delivery of materials to beneficiaries.■ Assign vehicles to the technical and social worker teams.
■ Prepare the legal papers for delivering the lots to beneficiaries■ Assign professionals and technical staff to help beneficiaries.
Agreements SUPCE – Suppliers of Construction Materials
SUPCE Responsibilities Suppliers’ Responsibilities
■ Verify deliveries and quality of materials■ Pay bills within 15-20 days from when the vouchers are received■ Approve a list of prices for building materials.
■ Provide beneficiaries with construction materials.■ Ensure that all materials are of the best quality■ Deliver materials within 48 working hours of receiving the order■ Maintain prices for the period agreed upon with SUPCE.
share allocated to the housing component was reduced only slightly, from US$31 million to US$29.2 million.
4.2 Organization and Inter-agency Coordination
The close coordination among the national, provincial and municipal levels, the active participation of the lo-cal providers of construction materials and the techni-cal and social assistance enabled the objectives to be
achieved. Each Provincial Emergency Coordination Sub-Unit (SUPCE) signed participation agreements with every municipality, provincial housing institutes, and local providers of construction materials. The agree-ments were designed to establish the rights and duties of the parties involved. Table 3.5 lists the responsibilities of each entity, reflecting the sensitivity with which the design and implementation of the housing component were structured.
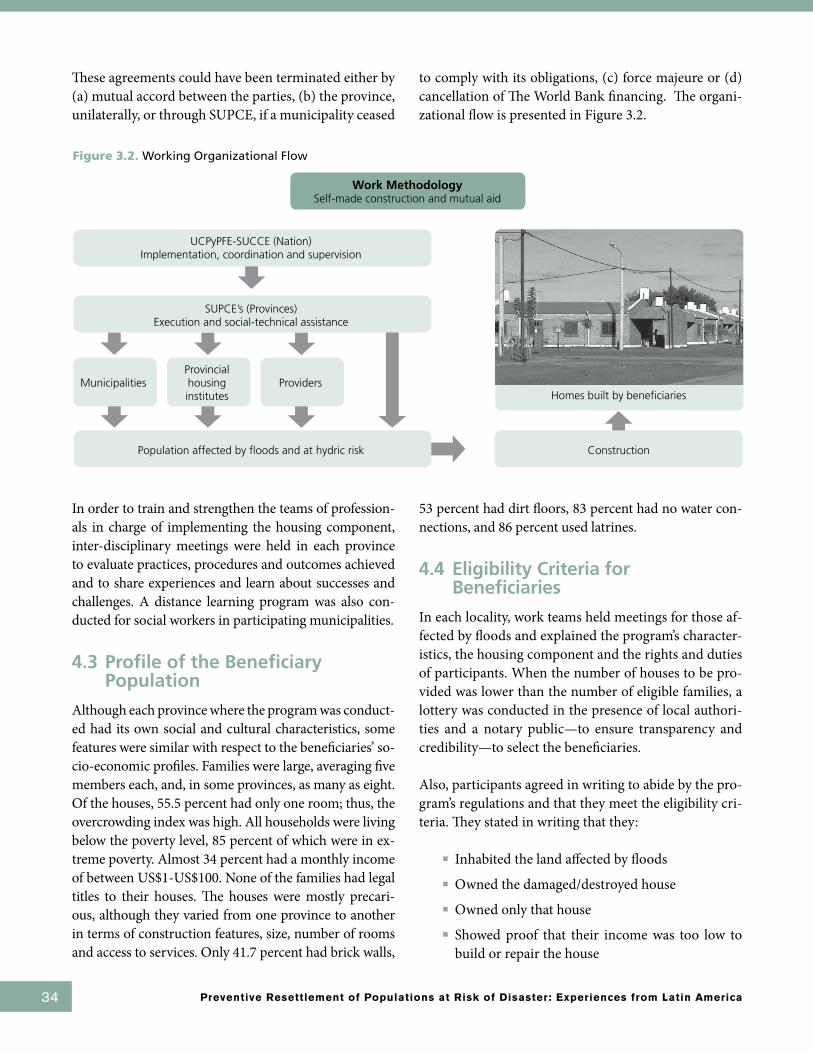
34 Preventive Resettlement of Populations at Risk of Disaster: Experiences from Latin America
These agreements could have been terminated either by (a) mutual accord between the parties, (b) the province, unilaterally, or through SUPCE, if a municipality ceased
to comply with its obligations, (c) force majeure or (d) cancellation of The World Bank financing. The organi-zational flow is presented in Figure 3.2.
Work MethodologySelf-made construction and mutual aid
MunicipalitiesProvincial housing institutes
Providers
UCPyPFE-SUCCE (Nation)Implementation, coordination and supervision
Homes built by beneficiaries
Population affected by floods and at hydric risk
Figure 3.2. Working Organizational Flow
Construction
SUPCE’s (Provinces)Execution and social-technical assistance
In order to train and strengthen the teams of profession-als in charge of implementing the housing component, inter-disciplinary meetings were held in each province to evaluate practices, procedures and outcomes achieved and to share experiences and learn about successes and challenges. A distance learning program was also con-ducted for social workers in participating municipalities.
4.3 Profile of the Beneficiary Population
Although each province where the program was conduct-ed had its own social and cultural characteristics, some features were similar with respect to the beneficiaries’ so-cio-economic profiles. Families were large, averaging five members each, and, in some provinces, as many as eight. Of the houses, 55.5 percent had only one room; thus, the overcrowding index was high. All households were living below the poverty level, 85 percent of which were in ex-treme poverty. Almost 34 percent had a monthly income of between US$1-US$100. None of the families had legal titles to their houses. The houses were mostly precari-ous, although they varied from one province to another in terms of construction features, size, number of rooms and access to services. Only 41.7 percent had brick walls,
53 percent had dirt floors, 83 percent had no water con-nections, and 86 percent used latrines.
4.4 Eligibility Criteria for Beneficiaries
In each locality, work teams held meetings for those af-fected by floods and explained the program’s character-istics, the housing component and the rights and duties of participants. When the number of houses to be pro-vided was lower than the number of eligible families, a lottery was conducted in the presence of local authori-ties and a notary public—to ensure transparency and credibility—to select the beneficiaries.
Also, participants agreed in writing to abide by the pro-gram’s regulations and that they meet the eligibility cri-teria. They stated in writing that they:
■ Inhabited the land affected by floods■ Owned the damaged/destroyed house■ Owned only that house ■ Showed proof that their income was too low to
build or repair the house
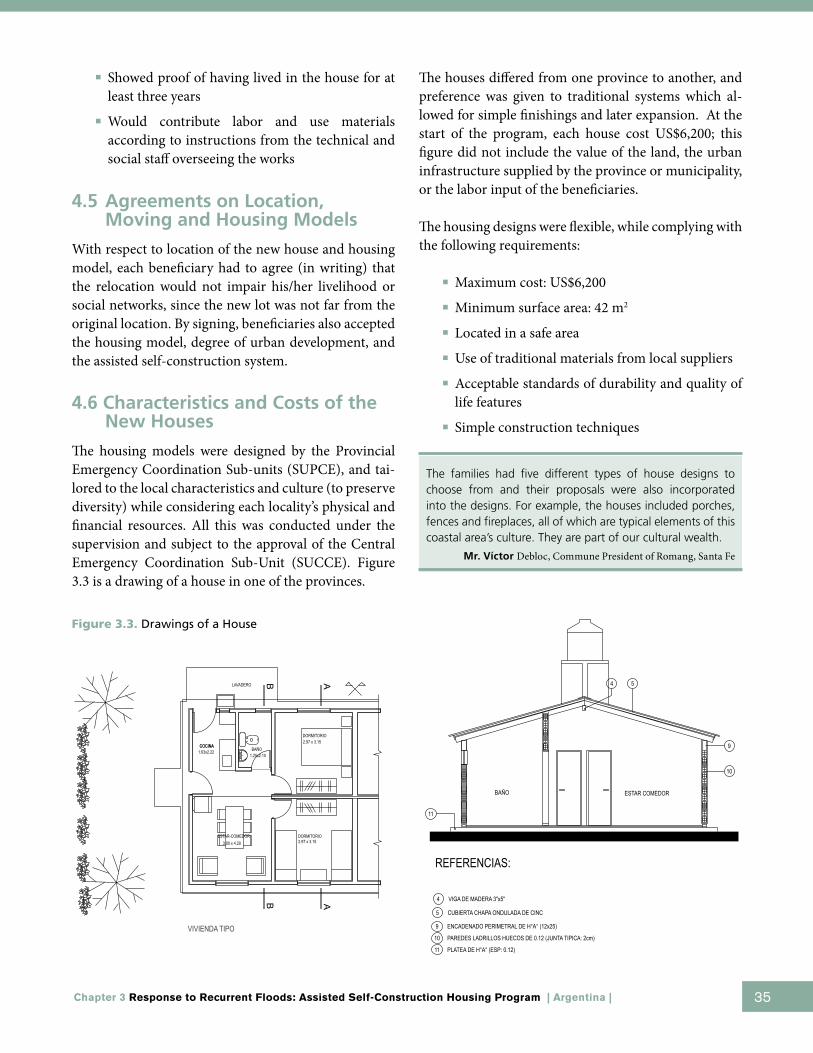
Chapter 3 Response to Recurrent Floods: Assisted Self-Construction Housing Program | Argentina | 35
■ Showed proof of having lived in the house for at least three years
■ Would contribute labor and use materials according to instructions from the technical and social staff overseeing the works
4.5 Agreements on Location, Moving and Housing Models
With respect to location of the new house and housing model, each beneficiary had to agree (in writing) that the relocation would not impair his/her livelihood or social networks, since the new lot was not far from the original location. By signing, beneficiaries also accepted the housing model, degree of urban development, and the assisted self-construction system.
4.6 Characteristics and Costs of the New Houses
The housing models were designed by the Provincial Emergency Coordination Sub-units (SUPCE), and tai-lored to the local characteristics and culture (to preserve diversity) while considering each locality’s physical and financial resources. All this was conducted under the supervision and subject to the approval of the Central Emergency Coordination Sub-Unit (SUCCE). Figure 3.3 is a drawing of a house in one of the provinces.
The houses differed from one province to another, and preference was given to traditional systems which al-lowed for simple finishings and later expansion. At the start of the program, each house cost US$6,200; this figure did not include the value of the land, the urban infrastructure supplied by the province or municipality, or the labor input of the beneficiaries.
The housing designs were flexible, while complying with the following requirements:
■ Maximum cost: US$6,200 ■ Minimum surface area: 42 m2
■ Located in a safe area■ Use of traditional materials from local suppliers■ Acceptable standards of durability and quality of
life features■ Simple construction techniques
The families had five different types of house designs to choose from and their proposals were also incorporated into the designs. For example, the houses included porches, fences and fireplaces, all of which are typical elements of this coastal area’s culture. They are part of our cultural wealth.
Mr. Víctor Debloc, Commune President of Romang, Santa Fe
Figure 3.3. Drawings of a House

36 Preventive Resettlement of Populations at Risk of Disaster: Experiences from Latin America
The houses were built with two bedrooms, a dining room, kitchen, bathroom, laundry room and semi-covered out-side area. Housing costs were subsidized and the mu-nicipalities or housing institute provided beneficiaries with the houses and deeds, free of charge, provided that the beneficiaries would inhabit the houses immediately and not sell them until five to 10 years had elapsed; the number of years before families actually sold their houses varied from one province to another, but the minimum remained five years.
4.7 Land and Infrastructure
Land for the new urban development was contributed by the provinces or municipalities. The infrastructure—new streets, as well as water and electricity connections and grids—were built with national, provincial, and municipal funds, at no cost to the beneficiaries.
The Housing Institute was in charge of the urban devel-opment project and preparing the land for construction; beneficiaries were given the lots at no charge.
4.8 Community Organization
Beneficiaries were organized in groups of 20 families (up to 100 people), which promoted and facilitated mutual assistance. They were helped by a SUPCE team composed of a social worker and architect, along with local government representatives. Each group built 20 houses based on the “assisted self-construction and mutual aid with technical and social assistance” model; they achieved a significant amount of unity, participa-tion, and training in building homes. People who were
unable to do the actual construction (either on their own houses or those of others) helped with other tasks.
Male heads of households participated in 73 percent of cases and female heads of household in 31 percent. Children and other family members participated in 15 percent of cases. In female-headed households, the participation of women increased (nearly doubled), as did that of children and other family members, while in households headed by men, male participation domi-nated. (Clemente, Bertolotto y Del Valle, 2003).
The fact that nobody handles cash avoided conflicts, suspi-cions or requests for reviews by the political opposition or by any other institution. Everything was managed through vouchers which are the equivalent of materials. Beneficiaries knew what vouchers were like, what each represented. They were fully aware of the different construction stages.
Mr. Ocampo, Mayor of Reconquista, Santa Fe.
Both in Puerto Iguazú (Misiones) and in San José (Entre Ríos), women were particularly active in construction, which had a major impact on their self-esteem. This in-dicates that a program such as the SPV can be imple-mented in female-headed households and that the more they are trained, the more involved they become.
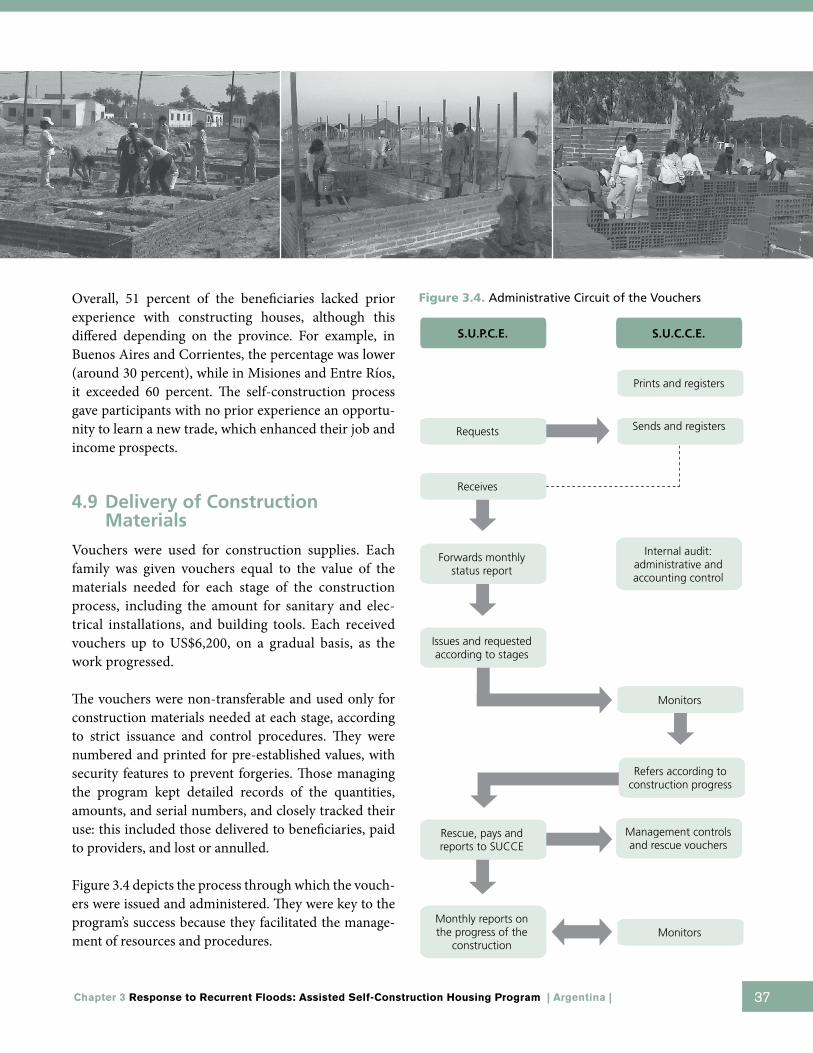
Chapter 3 Response to Recurrent Floods: Assisted Self-Construction Housing Program | Argentina | 37
Overall, 51 percent of the beneficiaries lacked prior experience with constructing houses, although this differed depending on the province. For example, in Buenos Aires and Corrientes, the percentage was lower (around 30 percent), while in Misiones and Entre Ríos, it exceeded 60 percent. The self-construction process gave participants with no prior experience an opportu-nity to learn a new trade, which enhanced their job and income prospects.
4.9 Delivery of Construction Materials
Vouchers were used for construction supplies. Each family was given vouchers equal to the value of the materials needed for each stage of the construction process, including the amount for sanitary and elec-trical installations, and building tools. Each received vouchers up to US$6,200, on a gradual basis, as the work progressed.
The vouchers were non-transferable and used only for construction materials needed at each stage, according to strict issuance and control procedures. They were numbered and printed for pre-established values, with security features to prevent forgeries. Those managing the program kept detailed records of the quantities, amounts, and serial numbers, and closely tracked their use: this included those delivered to beneficiaries, paid to providers, and lost or annulled.
Figure 3.4 depicts the process through which the vouch-ers were issued and administered. They were key to the program’s success because they facilitated the manage-ment of resources and procedures.
Figure 3.4. Administrative Circuit of the Vouchers
S.U.P.C.E. S.U.C.C.E.
Requests
Prints and registers
Monitors
Monitors
Forwards monthly status report
Issues and requested according to stages
Rescue, pays and reports to SUCCE
Management controls and rescue vouchers
Monthly reports on the progress of the
construction
Internal audit: administrative and accounting control
Receives
Sends and registers
Refers according to construction progress
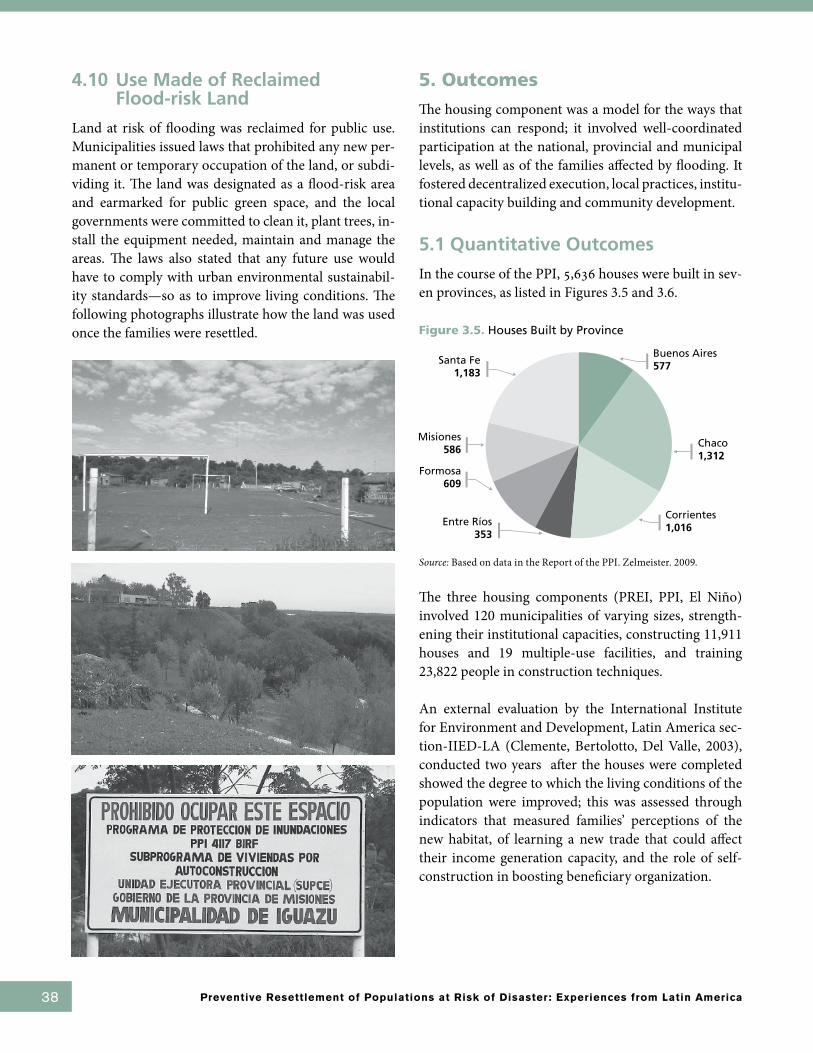
38 Preventive Resettlement of Populations at Risk of Disaster: Experiences from Latin America
4.10 Use Made of Reclaimed Flood-risk Land
Land at risk of flooding was reclaimed for public use. Municipalities issued laws that prohibited any new per-manent or temporary occupation of the land, or subdi-viding it. The land was designated as a flood-risk area and earmarked for public green space, and the local governments were committed to clean it, plant trees, in-stall the equipment needed, maintain and manage the areas. The laws also stated that any future use would have to comply with urban environmental sustainabil-ity standards—so as to improve living conditions. The following photographs illustrate how the land was used once the families were resettled.
5. Outcomes
The housing component was a model for the ways that institutions can respond; it involved well-coordinated participation at the national, provincial and municipal levels, as well as of the families affected by flooding. It fostered decentralized execution, local practices, institu-tional capacity building and community development.
5.1 Quantitative Outcomes
In the course of the PPI, 5,636 houses were built in sev-en provinces, as listed in Figures 3.5 and 3.6.
Figure 3.5. Houses Built by Province
Source: Based on data in the Report of the PPI. Zelmeister. 2009.
The three housing components (PREI, PPI, El Niño) involved 120 municipalities of varying sizes, strength-ening their institutional capacities, constructing 11,911 houses and 19 multiple-use facilities, and training 23,822 people in construction techniques.
An external evaluation by the International Institute for Environment and Development, Latin America sec-tion-IIED-LA (Clemente, Bertolotto, Del Valle, 2003), conducted two years after the houses were completed showed the degree to which the living conditions of the population were improved; this was assessed through indicators that measured families’ perceptions of the new habitat, of learning a new trade that could affect their income generation capacity, and the role of self-construction in boosting beneficiary organization.
Santa Fe1,183
Misiones 586
Formosa 609
Entre Ríos 353
Buenos Aires577
Corrientes 1,016
Chaco 1,312
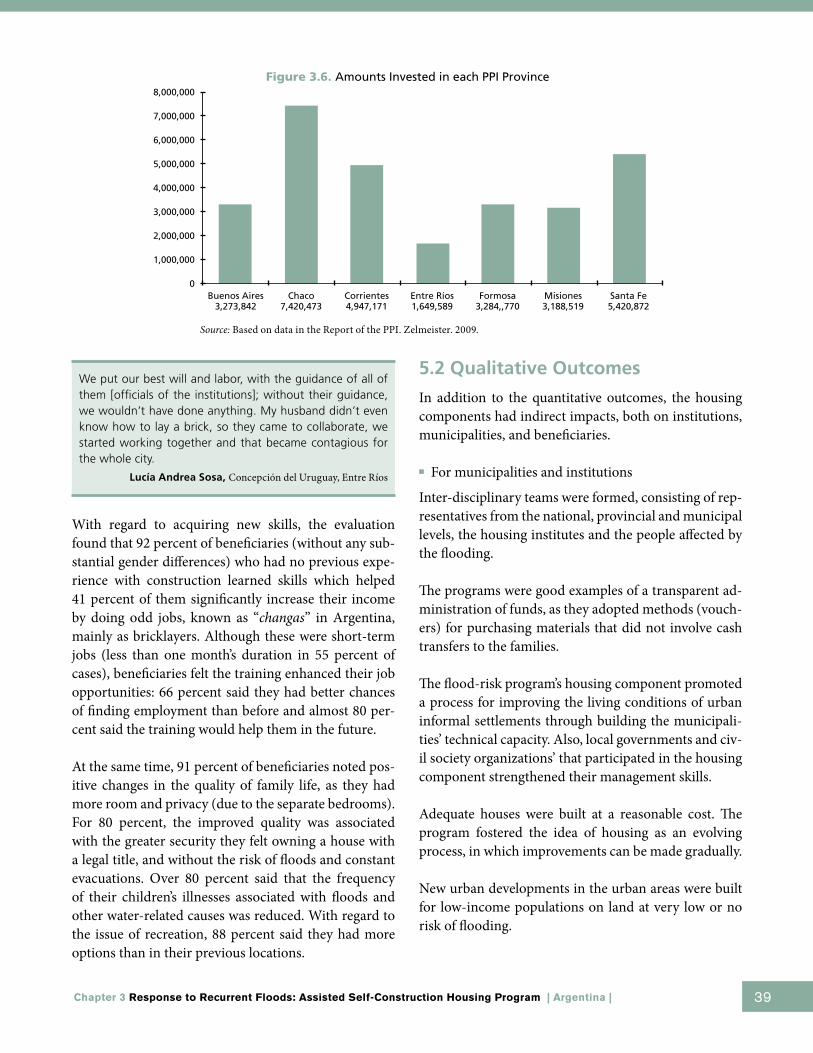
Chapter 3 Response to Recurrent Floods: Assisted Self-Construction Housing Program | Argentina | 39
We put our best will and labor, with the guidance of all of them [officials of the institutions]; without their guidance, we wouldn’t have done anything. My husband didn’t even know how to lay a brick, so they came to collaborate, we started working together and that became contagious for the whole city.
Lucía Andrea Sosa, Concepción del Uruguay, Entre Ríos
With regard to acquiring new skills, the evaluation found that 92 percent of beneficiaries (without any sub-stantial gender differences) who had no previous expe-rience with construction learned skills which helped 41 percent of them significantly increase their income by doing odd jobs, known as “changas” in Argentina, mainly as bricklayers. Although these were short-term jobs (less than one month’s duration in 55 percent of cases), beneficiaries felt the training enhanced their job opportunities: 66 percent said they had better chances of finding employment than before and almost 80 per-cent said the training would help them in the future.
At the same time, 91 percent of beneficiaries noted pos-itive changes in the quality of family life, as they had more room and privacy (due to the separate bedrooms). For 80 percent, the improved quality was associated with the greater security they felt owning a house with a legal title, and without the risk of floods and constant evacuations. Over 80 percent said that the frequency of their children’s illnesses associated with floods and other water-related causes was reduced. With regard to the issue of recreation, 88 percent said they had more options than in their previous locations.
5.2 Qualitative Outcomes
In addition to the quantitative outcomes, the housing components had indirect impacts, both on institutions, municipalities, and beneficiaries.
■ For municipalities and institutions
Inter-disciplinary teams were formed, consisting of rep-resentatives from the national, provincial and municipal levels, the housing institutes and the people affected by the flooding.
The programs were good examples of a transparent ad-ministration of funds, as they adopted methods (vouch-ers) for purchasing materials that did not involve cash transfers to the families.
The flood-risk program’s housing component promoted a process for improving the living conditions of urban informal settlements through building the municipali-ties’ technical capacity. Also, local governments and civ-il society organizations’ that participated in the housing component strengthened their management skills.
Adequate houses were built at a reasonable cost. The program fostered the idea of housing as an evolving process, in which improvements can be made gradually.
New urban developments in the urban areas were built for low-income populations on land at very low or no risk of flooding.
Source: Based on data in the Report of the PPI. Zelmeister. 2009.
8,000,000
7,000,000
6,000,000
5,000,000
4,000,000
3,000,000
2,000,000
1,000,000
0Buenos Aires
3,273,842Chaco
7,420,473Corrientes4,947,171
Entre Ríos1,649,589
Formosa3,284,,770
Misiones3,188,519
Santa Fe5,420,872
Figure 3.6. Amounts Invested in each PPI Province

40 Preventive Resettlement of Populations at Risk of Disaster: Experiences from Latin America
The self-effort and mutual assistance spirit has led to neigh-bors’ higher commitment and enthusiasm to build, to com-plete and to improve the quality of the housing. This is un-usual for the works the municipality carries out.
Mr. Juan Carlos Benítez, Mayor of Colonia Delicia, Misiones
■ For beneficiaries
New houses in safe locations with appropriate sanitary conditions improved the families’ health and saved them from the loss of assets due to frequent flooding.
Another major achievement was the beneficiaries’ im-proved self-esteem. They actively participated in the construction effort, thereby overcoming notions that they were receiving charity. Moreover, women were in-volved throughout the process (characterized by trans-parency and equity), occasionally assuming leadership positions, on an equal basis with men.
The way in which the community organized for self-construction triggered a spirit of cooperation, fostered solidarity, and improved people’s job opportunities. For low-income families, the new urban developments, with their network of services, helped integrate them into so-ciety and formal city life, overcoming their former isola-tion and ostracism.
Now my daughter runs around and plays everywhere. She couldn’t do this before. In fact, now when it rains, the chil-dren are inside running from one place to the other. We don’t have to worry whether we are going to be flooded, or be-cause of the pests, or that they are coming to take us away because of the flood. Thank God, we see the water pass us by, so to speak, on the outside. We are at home!
Lilian Benítez, Puerto Iguazú, Misiones
6. Lessons Learned
The implementation of the housing component was an enriching experience for all those involved, including beneficiaries, municipalities, provinces, and the central government. The SUCCE carried out, supervised and monitored the work, in coordination with the provin-cial teams and municipalities.
For many of the municipalities, the flood risk program’s housing component was an opportunity to learn a new
approach to building homes; also, the national govern-ment contributed with physical and human resources. The SUPCEs made a key and timely contribution to various activities.
Most of the lessons learned have to do with involving the population early on in the planning and execution of the works. Key factors that made this possible were coherent administrative and institutional management, along with the commitment and hard work of the ben-eficiaries.
Instead of the authorities’ adopting a charity approach, they made a conscious effort to promote and strengthen community organization and enable the beneficiaries to play a proactive role.
In this learning process, special emphasis was placed on decentralized practices with the active participation of the population, municipalities, housing institutes, pro-vincial governments and suppliers of construction ma-terials.
Another lesson was the importance of fostering equal opportunities for the low-income families hurt by flood-ing and avoiding any form of discrimination.
The PPI benefited from lessons learned in the PREI and El Niño programs. For example, the PREI had not cov-
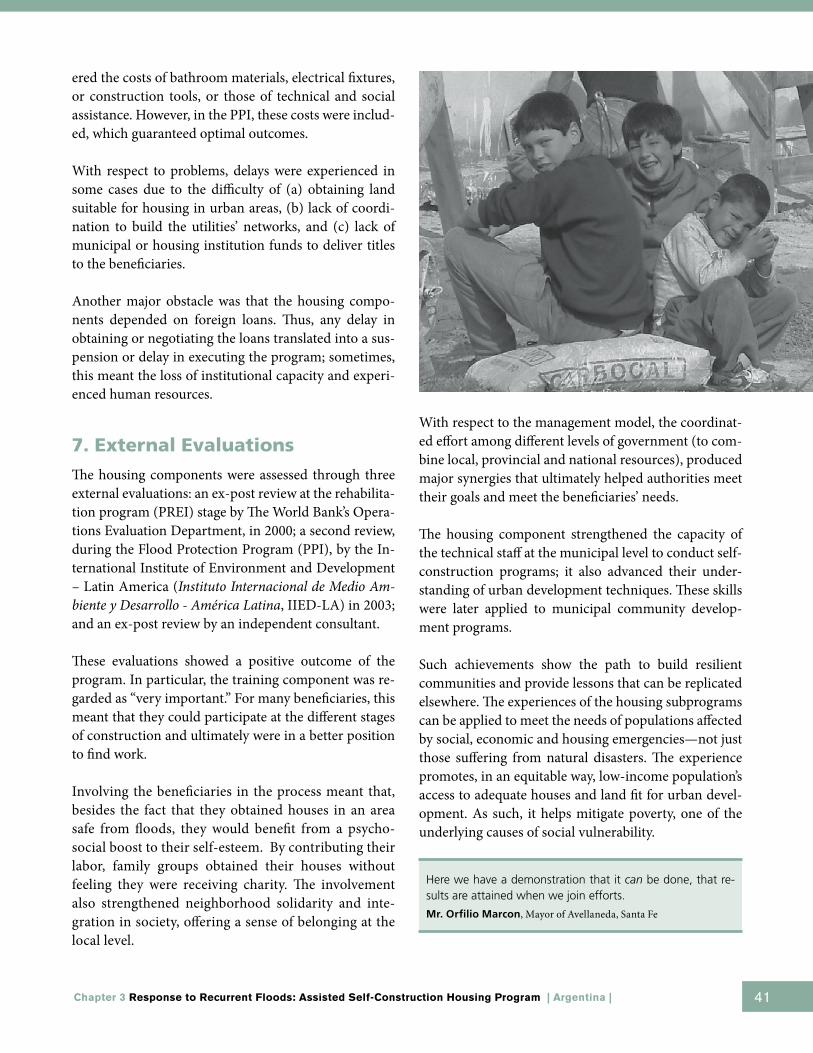
Chapter 3 Response to Recurrent Floods: Assisted Self-Construction Housing Program | Argentina | 41
ered the costs of bathroom materials, electrical fixtures, or construction tools, or those of technical and social assistance. However, in the PPI, these costs were includ-ed, which guaranteed optimal outcomes.
With respect to problems, delays were experienced in some cases due to the difficulty of (a) obtaining land suitable for housing in urban areas, (b) lack of coordi-nation to build the utilities’ networks, and (c) lack of municipal or housing institution funds to deliver titles to the beneficiaries.
Another major obstacle was that the housing compo-nents depended on foreign loans. Thus, any delay in obtaining or negotiating the loans translated into a sus-pension or delay in executing the program; sometimes, this meant the loss of institutional capacity and experi-enced human resources.
7. External Evaluations
The housing components were assessed through three external evaluations: an ex-post review at the rehabilita-tion program (PREI) stage by The World Bank’s Opera-tions Evaluation Department, in 2000; a second review, during the Flood Protection Program (PPI), by the In-ternational Institute of Environment and Development – Latin America (Instituto Internacional de Medio Am-biente y Desarrollo - América Latina, IIED-LA) in 2003; and an ex-post review by an independent consultant.
These evaluations showed a positive outcome of the program. In particular, the training component was re-garded as “very important.” For many beneficiaries, this meant that they could participate at the different stages of construction and ultimately were in a better position to find work.
Involving the beneficiaries in the process meant that, besides the fact that they obtained houses in an area safe from floods, they would benefit from a psycho-social boost to their self-esteem. By contributing their labor, family groups obtained their houses without feeling they were receiving charity. The involvement also strengthened neighborhood solidarity and inte-gration in society, offering a sense of belonging at the local level.
With respect to the management model, the coordinat-ed effort among different levels of government (to com-bine local, provincial and national resources), produced major synergies that ultimately helped authorities meet their goals and meet the beneficiaries’ needs.
The housing component strengthened the capacity of the technical staff at the municipal level to conduct self-construction programs; it also advanced their under-standing of urban development techniques. These skills were later applied to municipal community develop-ment programs.
Such achievements show the path to build resilient communities and provide lessons that can be replicated elsewhere. The experiences of the housing subprograms can be applied to meet the needs of populations affected by social, economic and housing emergencies—not just those suffering from natural disasters. The experience promotes, in an equitable way, low-income population’s access to adequate houses and land fit for urban devel-opment. As such, it helps mitigate poverty, one of the underlying causes of social vulnerability.
Here we have a demonstration that it can be done, that re-sults are attained when we join efforts.
Mr. Orfilio Marcon, Mayor of Avellaneda, Santa Fe
42 Preventive Resettlement of Populations at Risk of Disaster: Experiences from Latin America
References
Arnold, Margaret. 2004. Natural Disasters: Count-ing the Cost. The World Bank, Washington DC. Retrieved from: http://web.worldbank.org/WB-SITE/EXTERNAL/NEWS/0,,contentMDK:20169861~pagePK:64257043~piPK:437376~theSitePK:4607,00.html.
Clemente, Adriana; Bertolotto, Mary; Del Valle, Julieta. 2003. Alcance y perspectivas del Subprograma de Vivienda. Una aproximación evaluativa. En: Vivi-endas por autoconstrucción. La experiencia en el programa de protección contra las Inundaciones. Buenos Aires: IIED-LA.
Halcrow, Ingenieros Consultores. Sir William Halcrow y Partners. 1994. Estudio de regulación del valle aluvial de los ríos Paraná, Paraguay y Uruguay para el control de las inundaciones. Buenos Aires: succe, Ministerio del Interior, Banco Mundial.
INDEC (Instituto Nacional de Estadística y Censos). Censos Nacionales de Población y Vivienda 1947 a 200:. 1947, 1960, 1970, 1980, 1991 y 2001. Ar-gentina.
Ministry of Federal Planning, Public Investment and Services. 2007. Operational Manual. Flood Pre-vention and Urban Drainage Program.
The World Bank. 2000. Argentina. Gestión de los recur-sos hídricos. Elementos de política para su desa-rrollo sustentable en el siglo XXI. Buenos Aires: Oficina Regional de América Latina y el Caribe, Unidad Departamental de Argentina y los Grupos de Finanzas, Sector Privado e Infraestructura y Medio Ambiente y Desarrollo Social Sustentable.
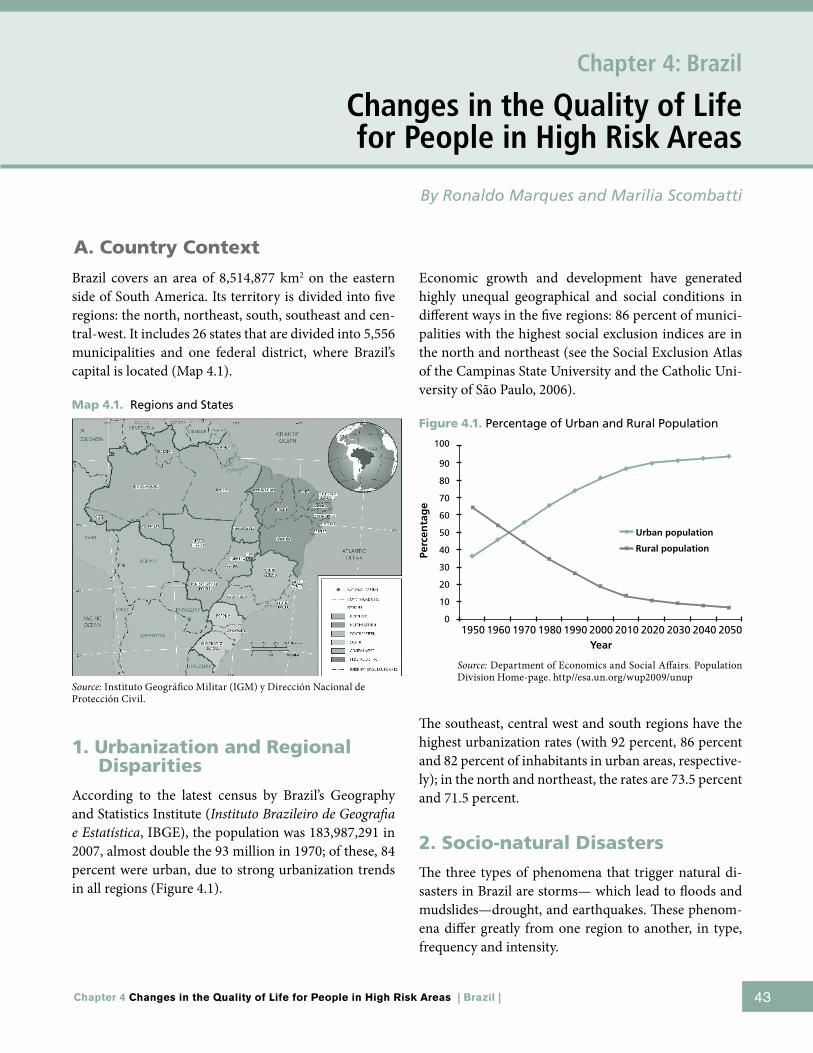
43Chapter 4 Changes in the Quality of Life for People in High Risk Areas | Brazil |
Brazil covers an area of 8,514,877 km2 on the eastern side of South America. Its territory is divided into five regions: the north, northeast, south, southeast and cen-tral-west. It includes 26 states that are divided into 5,556 municipalities and one federal district, where Brazil’s capital is located (Map 4.1).
Map 4.1. Regions and States
1. Urbanization and Regional Disparities
According to the latest census by Brazil’s Geography and Statistics Institute (Instituto Brazileiro de Geografia e Estatística, IBGE), the population was 183,987,291 in 2007, almost double the 93 million in 1970; of these, 84 percent were urban, due to strong urbanization trends in all regions (Figure 4.1).
Economic growth and development have generated highly unequal geographical and social conditions in different ways in the five regions: 86 percent of munici-palities with the highest social exclusion indices are in the north and northeast (see the Social Exclusion Atlas of the Campinas State University and the Catholic Uni-versity of São Paulo, 2006).
Figure 4.1. Percentage of Urban and Rural Population
The southeast, central west and south regions have the highest urbanization rates (with 92 percent, 86 percent and 82 percent of inhabitants in urban areas, respective-ly); in the north and northeast, the rates are 73.5 percent and 71.5 percent.
2. Socio-natural Disasters
The three types of phenomena that trigger natural di-sasters in Brazil are storms— which lead to floods and mudslides—drought, and earthquakes. These phenom-ena differ greatly from one region to another, in type, frequency and intensity.
Chapter 4: Brazil
Changes in the Quality of Life for People in High Risk Areas
A. Country Context
By Ronaldo Marques and Marilia Scombatti
Source: Instituto Geográfico Militar (IGM) y Dirección Nacional de Protección Civil.
Source: Department of Economics and Social Affairs. Population Division Home-page. http//esa.un.org/wup2009/unup
100
90
80
70
60
50
40
30
20
10
0
Perc
enta
ge
1950 1970 19901960 1980 2000 2010 2020 2030 2040 2050Year
Urban population
Rural population
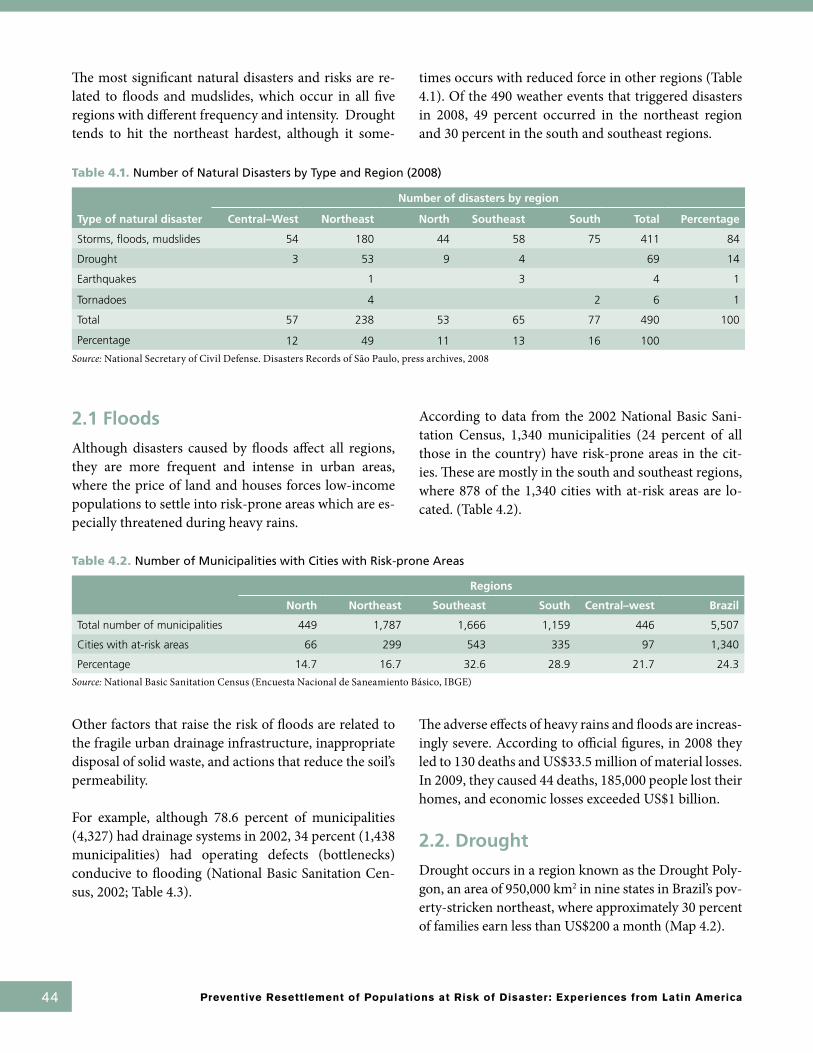
44 Preventive Resettlement of Populations at Risk of Disaster: Experiences from Latin America
The most significant natural disasters and risks are re-lated to floods and mudslides, which occur in all five regions with different frequency and intensity. Drought tends to hit the northeast hardest, although it some-
times occurs with reduced force in other regions (Table 4.1). Of the 490 weather events that triggered disasters in 2008, 49 percent occurred in the northeast region and 30 percent in the south and southeast regions.
Table 4.1. Number of Natural Disasters by Type and Region (2008)
Type of natural disaster
Number of disasters by region
Central–West Northeast North Southeast South Total Percentage
Storms, floods, mudslides 54 180 44 58 75 411 84
Drought 3 53 9 4 69 14
Earthquakes 1 3 4 1
Tornadoes 4 2 6 1
Total 57 238 53 65 77 490 100
Percentage 12 49 11 13 16 100
Source: National Secretary of Civil Defense. Disasters Records of São Paulo, press archives, 2008
2.1 Floods
Although disasters caused by floods affect all regions, they are more frequent and intense in urban areas, where the price of land and houses forces low-income populations to settle into risk-prone areas which are es-pecially threatened during heavy rains.
According to data from the 2002 National Basic Sani-tation Census, 1,340 municipalities (24 percent of all those in the country) have risk-prone areas in the cit-ies. These are mostly in the south and southeast regions, where 878 of the 1,340 cities with at-risk areas are lo-cated. (Table 4.2).
Table 4.2. Number of Municipalities with Cities with Risk-prone Areas
Regions
North Northeast Southeast South Central–west Brazil
Total number of municipalities 449 1,787 1,666 1,159 446 5,507
Cities with at-risk areas 66 299 543 335 97 1,340
Percentage 14.7 16.7 32.6 28.9 21.7 24.3
Source: National Basic Sanitation Census (Encuesta Nacional de Saneamiento Básico, IBGE)
Other factors that raise the risk of floods are related to the fragile urban drainage infrastructure, inappropriate disposal of solid waste, and actions that reduce the soil’s permeability.
For example, although 78.6 percent of municipalities (4,327) had drainage systems in 2002, 34 percent (1,438 municipalities) had operating defects (bottlenecks) conducive to flooding (National Basic Sanitation Cen-sus, 2002; Table 4.3).
The adverse effects of heavy rains and floods are increas-ingly severe. According to official figures, in 2008 they led to 130 deaths and US$33.5 million of material losses. In 2009, they caused 44 deaths, 185,000 people lost their homes, and economic losses exceeded US$1 billion.
2.2. Drought
Drought occurs in a region known as the Drought Poly-gon, an area of 950,000 km2 in nine states in Brazil’s pov-erty-stricken northeast, where approximately 30 percent of families earn less than US$200 a month (Map 4.2).

45Chapter 4 Changes in the Quality of Life for People in High Risk Areas | Brazil |
Map 4.2. Drought Areas in the Northeast
Historically, droughts occur every 10 years, but may last up to three, four, or, in some cases, even five years, due to various factors, including: (a) the temperature in the region which, at certain times of the year, exceeds 40 de-grees centigrade; (b) a harsh stream-flow regime, which results in minimal and highly infrequent rainfall; (c) the terrain and topography, characterized by shallow soil, which causes rapid evaporation of surface waters; and (d) anthropogenic action that destroys natural vegeta-tion and expands the semi-arid climate.
Harsh living conditions in periods of drought force people to abandon the northeast and migrate to other regions, especially the southeast, in search of better conditions. When they arrive, they cannot afford formal housing. Thus, they look for cheaper plots far from downtown neighborhoods which, in many cases, are located on the banks of rivers that are vulnerable to flooding.
2.3. Earthquakes
Seismic activity is slight compared with other countries in Latin America. In the past 50 years, Brazil experi-enced eight earthquakes, four in the southeast. In the south, no earthquakes were recorded from 1955-2008.
3. Disaster Risk Management
Two ministries are responsible for preventing and con-trolling natural disasters: The Ministry of National In-tegration, through the National Civil Defense System (Sistema nacional de Defesa Civil, SINDEC) and the Ministry of the Environment, through the National Wa-ter Agency (Agencia nacional das Aguas, ANA).
The Civil Defense System—SINDEC—was created in 1988. It implements national civil defense policy, which aims to:
■ Promote permanent defense against disasters, natural or man-made;
■ Prevent or minimize damage, rescue and help the population affected, and rehabilitate and restore areas struck by disasters;
■ Act when disasters are imminent and after they occur;
Table 4.3. Number of Municipalities with Inefficient Drainage Systems
North Northeast Southeast South Central-west Total
No. % No. % No. % No. % No. % No. %
Number of municipalities 449 1,787 1,666 1,159 446 5,507 100
Number of municipalities with urban drainage 222 49 1,227 69 1,468 88 1,094 94 316 71 4,327 79
Number of municipalities with bottlenecks in the urban drainage 66 29 316 26 596 40 403 37 57 18 1,438 34
Source: IBGE. National Survey of Basin Sanitation, 2002.
Source: Instituto Geográfico Militar (IGM) y Dirección Nacional de Protección Civil.
46 Preventive Resettlement of Populations at Risk of Disaster: Experiences from Latin America
■ Organize and coordinate SINDEC throughout Brazil.
This system has an operating structure based on several bodies with different areas of responsibility at the na-tional, regional, state, municipal and sectoral levels.
SINDEC’s operations are funded by the Special Fund for Public Calamities (FUNCAP), the financial instrument established to deal with emergencies. Under the Federal Constitution, it can also draw on loans to handle public calamities.
ANA coordinates interactions between the ministries of National Integration and the Environment, and over-sees the warning system when catchment basin levels rise. It also conducts studies and programs on urban water management and flood control.
Brazil also has a National Institute for Space Research (Instituto nacional de Pesquisas Espaciais, INPE), which, in 2008, established the Natural Disaster Surveillance and Warning System (Sistema de Monitoramento e Aler-ta de Desastres naturais, SISMADEN), a geo-processing tool for overseeing, recovering, storing and processing environmental data. SISMADEN uses a large database devised by INPE’s Center for Weather Forecasts and Climate Studies (Centro de Previsão de Tempo e Estudos Climáticos, CPTEC), with information gathered from across the country.
The system includes hydrometeorological and other data needed to analyze and establish early warnings. SISMADEN allows free use of its services and its data can be downloaded at no cost on the Internet. It pro-vides access to up-to-date climate observations and forecasting data and generates mathematical models for devising risk maps of the areas selected.
B. The City of São Paulo
The case study focuses on the second phase of the Stream Canalization Program (Programa de Canalização de Va-les, PROCAV) in São Paulo, the largest city in Brazil, which covers 1,509 km2 and has 10.9 million inhabit-ants, or almost 10 percent of the country’s population.
The population is more diverse than in any other Brazil-ian city. It mainly consists of descendants of Italian and Portuguese immigrants, but also has large contingents of Amerindian and African descent and others from the major Arab, German, Spanish and Japanese migration flows. In addition, São Paulo receives large numbers of migrants from other parts of Brazil, particularly the north and northeast regions. Although no national and regional statistics are kept on the places of origin and destination of emigrants from the Drought Polygon, research by the Population Studies Unit (núcleo de Es-tudos Populacionais, NEPO) of the University of Campi-nas (Universidade Estadual de Campinas, UNICAMP) indicates that almost 40 percent of the population in at-risk areas (slums or favelas) of São Paulo city are from the northeast region.
While only 1 percent of São Paulo residents (71,840) in 1970 lived in favelas, many located near rivers and streams, by 2008, the figure had soared to 13 percent (1,395,000). See Table 4.4.
Table 4.4. Population in Favelas in the City of São Paulo (1970-2008)
DecadePopulation in favelas
Total populationof São Paulo Percent
1970 71,840 6,560,547 1
1980 375,023 8,558,841 4
1990 891,673 9,644,122 9
2000 1,160,597 10,338,196 11
2008 1,395,000 10,886,518 13
Source: Archives of the Secretaria de Habitação da Prefeitura Municipal de São Paulo.
The favelas contain practically all those exposed to flooding, especially in the rainy season. Map 4.3 shows the location of the city’s at-risk areas.
1. Disaster Risk Management
1.1 Institutional Organization
The Civil Defense System of São Paulo reports to the Municipal Secretariat of Urban Security (Secretaria Mu-nicipal de Segurança Urbana), whose activities are gov-erned by the Ministry of National Integration (Ministé-rio da Integração nacional) within the SINDEC.
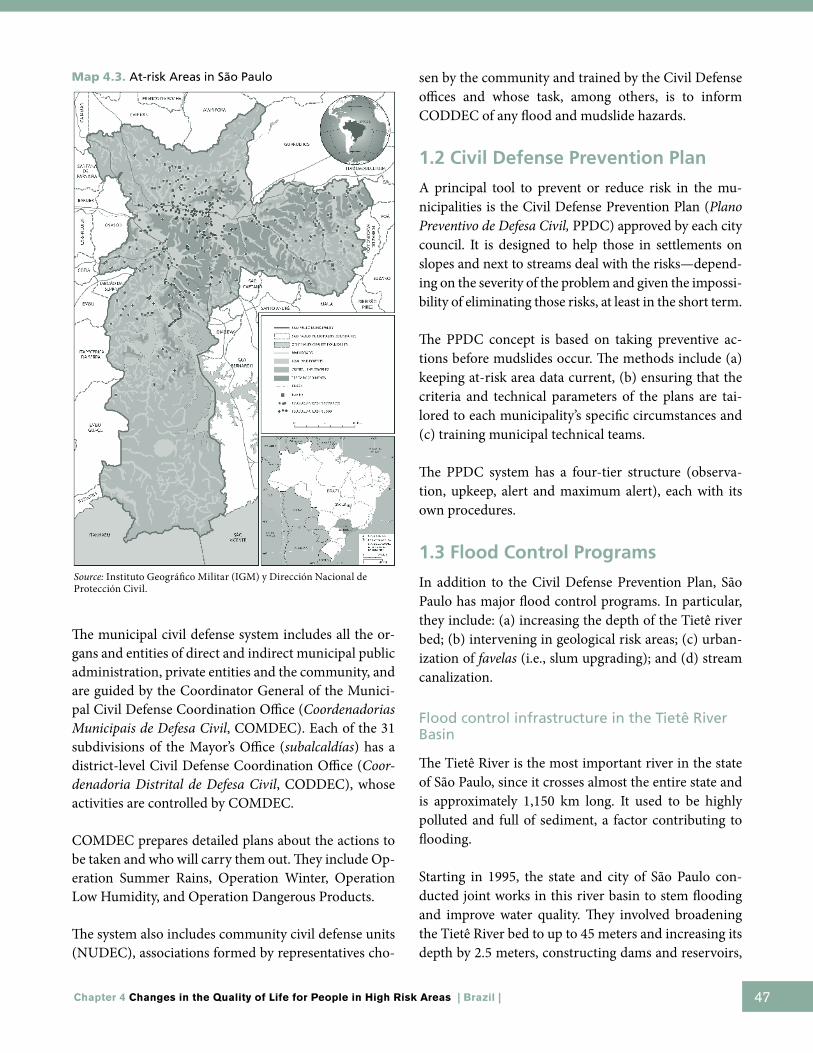
47Chapter 4 Changes in the Quality of Life for People in High Risk Areas | Brazil |
The municipal civil defense system includes all the or-gans and entities of direct and indirect municipal public administration, private entities and the community, and are guided by the Coordinator General of the Munici-pal Civil Defense Coordination Office (Coordenadorias Municipais de Defesa Civil, COMDEC). Each of the 31 subdivisions of the Mayor’s Office (subalcaldías) has a district-level Civil Defense Coordination Office (Coor-denadoria Distrital de Defesa Civil, CODDEC), whose activities are controlled by COMDEC.
COMDEC prepares detailed plans about the actions to be taken and who will carry them out. They include Op-eration Summer Rains, Operation Winter, Operation Low Humidity, and Operation Dangerous Products.
The system also includes community civil defense units (NUDEC), associations formed by representatives cho-
sen by the community and trained by the Civil Defense offices and whose task, among others, is to inform CODDEC of any flood and mudslide hazards.
1.2 Civil Defense Prevention Plan
A principal tool to prevent or reduce risk in the mu-nicipalities is the Civil Defense Prevention Plan (Plano Preventivo de Defesa Civil, PPDC) approved by each city council. It is designed to help those in settlements on slopes and next to streams deal with the risks—depend-ing on the severity of the problem and given the impossi-bility of eliminating those risks, at least in the short term.
The PPDC concept is based on taking preventive ac-tions before mudslides occur. The methods include (a) keeping at-risk area data current, (b) ensuring that the criteria and technical parameters of the plans are tai-lored to each municipality’s specific circumstances and (c) training municipal technical teams.
The PPDC system has a four-tier structure (observa-tion, upkeep, alert and maximum alert), each with its own procedures.
1.3 Flood Control Programs
In addition to the Civil Defense Prevention Plan, São Paulo has major flood control programs. In particular, they include: (a) increasing the depth of the Tietê river bed; (b) intervening in geological risk areas; (c) urban-ization of favelas (i.e., slum upgrading); and (d) stream canalization.
Flood control infrastructure in the Tietê River Basin
The Tietê River is the most important river in the state of São Paulo, since it crosses almost the entire state and is approximately 1,150 km long. It used to be highly polluted and full of sediment, a factor contributing to flooding.
Starting in 1995, the state and city of São Paulo con-ducted joint works in this river basin to stem flooding and improve water quality. They involved broadening the Tietê River bed to up to 45 meters and increasing its depth by 2.5 meters, constructing dams and reservoirs,
Map 4.3. At-risk Areas in São Paulo
Source: Instituto Geográfico Militar (IGM) y Dirección Nacional de Protección Civil.
48 Preventive Resettlement of Populations at Risk of Disaster: Experiences from Latin America
canalizing streams, and carrying out urbanization activ-ities alongside them. The program ended in 2008, fol-lowing an investment of approximately US$1.35 billion.
Interventions in geological risk areas
The Technical Advice Office for Works and Services of the Municipal Secretariat for Coordination of the sub-divisions of the Mayor’s Office (subalcaldías) seeks to control mudslides on slopes and the banks of streams. From 2005-2008, the program carried out 202 works in 562 locations considered to be at geological risk in 20 subalcaldías.
Stream canalization
The unauthorized occupation of land on the banks of streams in São Paulo put the low-income population that settled there at risk. These settlements also cause water pollution and sedimentation in the streams be-cause they dispose of solid waste directly into them, which in turn, increases flooding risks.
One program designed to mitigate and reverse these conditions was PROCAV, which began at the end of the 1980s. It included a series of multi-faceted works
in the catchment basins of the metropolitan region and was carried out in two stages, from 1987-1994 and from 1995-2007. It was initially estimated that the program would take from four to five years to complete, but, due to its complexity, it lasted 10. The US$1.05 billion in-vestment was used to canalize 63.3 km in 21 streams, construct 60.4 km of roads alongside the canals, and build eight dams.
The program involved resettling 7,544 families—2,585 from 1987-1994, and 5,137 from 1995-2007—who were occupying the areas where the works were carried out and where there were recurrent floods.
The resettlement solutions for those families included:
■ Resettlement in three housing complexes (benefiting 5,288 families—1,590 in the first stage and 3,876 in the second);
■ Resettlement in safe areas of the same neighbor-hoods (634 families)
■ Cash compensation for properties whose owners had obtained official permits and deeds, involving 1,622 families, 995 in the first stage and 627 in the second (see Table 4.5).
Table 4.5. Number of Families Resettled during the Stream Canalization Program
First Stage 1987-1994
Second Stage 1995-2007 Total Percentage
Resettlement to housing complexes 1,590 3,876 5,288 70
Financial compensation, expropriation 995 627 1622 22
Resettlement in remaining areas of same neighborhood 634 634 8
Total 2,585 5,137 7,544 100
Source: Archives SEHAB – GePROCAV – IDB
C. Case Study: Stream Canalization Program II
The case study focuses on the second stage of the Stream Canalization Program PROCAV, from 1995-2007.
1. Objectives
The objectives of the second stage of the Stream Canali-zation Program included:
■ Reducing the problems triggering frequent floods along the streams by canalizing them and thus increasing their hydraulic capacity;
■ Reducing the risk of mudslides caused by destabilized construction and streets located next to the streams;
■ Improving sanitary and housing conditions for the target families by moving those at risk to higher quality houses;

49Chapter 4 Changes in the Quality of Life for People in High Risk Areas | Brazil |
■ Improving transportation in the low areas and stream maintenance by building streets parallel to the canalized streams;
■ Protecting green areas.
Thus, PROCAV II was conceived as a program to re-verse environmental and social degradation in the low-lying areas of micro-basins in São Paulo. Under a single program, it improved both the living and sanitary con-ditions of the population in the capital’s most critical sub-basins by canalizing and draining streams and thus helping solve flood-related problems.
The program’s other components, such as street con-struction and paving, helped solve traffic and access is-sues and well as problems related to housing, sanitation, reclaiming urban space, environmental education and institution-building.
2. Components
The program included the following components:
■ Stream channelization and check dams in 13 streams, along with seven storm water retention ponds;
■ Building roads to improve traffic and access, and reclaim urban spaces;
■ Resettling the population located in at-risk areas and those required for infrastructure works;
■ Establishing green areas and protecting micro-basins, as well as implementing the environmental education plan targeting the population in the program’s service area;
■ Strengthening institutional capacities by devising an information system in the Emergency Manage-ment Center (Centro Gerenciamento de Emergên-cias, CGE) to prevent floods and strengthening the Municipal Ecological and Environmental Secretariat.
Map 4.4 shows the location of PROCAV II works in São Paulo.
3. Institutional Organization
The design and implementation of the program were car-ried out by the PROCAV Management Unit (Unidade de Gestão de PROCAV, GEPROCAV), an institution created in February 1987 to ensure greater autonomy within the city council. As the unit responsible for budgeting and administering expenditures, GEPROCAV reported to the Municipal Secretariat of Urban Infrastructure and was linked with several divisions of the São Paulo city council (Secretariats of Infrastructure, Finance, Legal Affairs, Housing, and Ecology and Environment).
The resettlement process was run by the Housing Sec-retariat (Secretaria Municipal da Habitação, SEHAB), which formed two management and support teams composed of seven engineers and architects, 11 social workers, two sociologists, and one attorney.
To construct the housing complexes and manage the so-cial aspects of the resettlement plan, SEHAB hired special-ized companies through competitive bidding processes.
Map 4.4. PROCAV II: Location of Civil Works and Resettlement Sites
Source: SEHAB-GREPROCAV–IDB Archives.

50 Preventive Resettlement of Populations at Risk of Disaster: Experiences from Latin America
4. Profile of the Population
The favelas were located on public land. Most of the houses were built by the people living in them (80 per-cent) with various materials, especially wood. The vast majority lacked deeds.
A 1994 socio-economic study conducted by the Univer-sity of São Paulo’s Economic Research Institute Founda-tion (Fundação Instituto de Pesquisas Econômicas, FIPE) on the 3,876 families resettled in housing complexes found that nearly 41 percent were in the informal labor market and 23 percent were under- or unemployed. Al-though the most common income range was between one and three minimum wages, 20 percent lived in what was regarded as extreme poverty with a monthly family income of less than one minimum wage. It also found that the time needed to reach a school or health care center was at most 30 minutes, a factor considered dur-ing the design of resettlement options.
5. Resettlement Alternatives
Four resettlement options were designed for the 5,137 families in the at-risk areas or areas needed for infra-structure works. They were:
a. Resettlement in housing complexes (3,876 families).
b. Resettlement in new houses built in the same favelas, which were improved and upgraded (634 families).
c. Resettlement in houses not affected by floods in the same favelas, (630 of the 3,876 families resettled in the housing complexes)
d. Cash compensation for property holders (627 families).
5.1 Resettlement in Housing Complexes
Three new apartment complexes were built for the 3,786 families that selected that option and for other families in São Paulo: Families had to pay a fraction of the apart-ments’ value, with a subsidized 20-year loan.
Two criteria were established:
■ The location should not disrupt the socio-cultural ties forged in the communities; or, if it was required, the disruption should be minimized. Thus the complexes needed to be located at an optimal distance, which meant taking into account the distribution of houses at the time of resettlement.
■ Families should not pay more than 10 percent of their total monthly income. Currently, the monthly mortgage payment for each unit is almost US$20.
The areas selected for resettlement in housing com-plexes are located in the neighborhoods of Jaraguá, São Miguel Paulista and Guaianazes (see Map 4.4 above). The housing complexes include the following:
The City Jaraguá. This complex was built in the dis-trict (barrio) of Jaraguá, in the northern part of the city. It covers 400,000 m2 and contains 4,000 housing units, 1,641 of which are reserved for those resettled due to the stream canalization program (PROCAV II). The re-maining units were distributed to other families regis-tered in the housing program of the Housing Secretariat of the São Paulo municipal council.
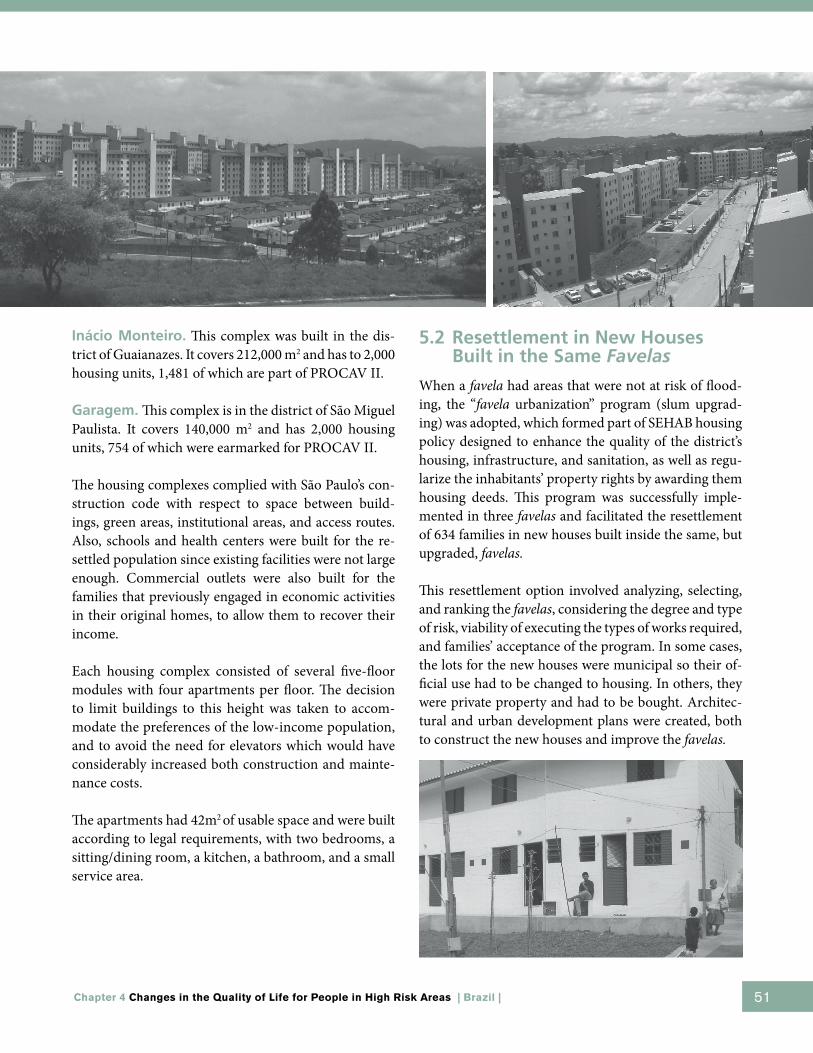
51Chapter 4 Changes in the Quality of Life for People in High Risk Areas | Brazil |
Inácio Monteiro. This complex was built in the dis-trict of Guaianazes. It covers 212,000 m2 and has to 2,000 housing units, 1,481 of which are part of PROCAV II.
Garagem. This complex is in the district of São Miguel Paulista. It covers 140,000 m2 and has 2,000 housing units, 754 of which were earmarked for PROCAV II.
The housing complexes complied with São Paulo’s con-struction code with respect to space between build-ings, green areas, institutional areas, and access routes. Also, schools and health centers were built for the re-settled population since existing facilities were not large enough. Commercial outlets were also built for the families that previously engaged in economic activities in their original homes, to allow them to recover their income.
Each housing complex consisted of several five-floor modules with four apartments per floor. The decision to limit buildings to this height was taken to accom-modate the preferences of the low-income population, and to avoid the need for elevators which would have considerably increased both construction and mainte-nance costs.
The apartments had 42m2 of usable space and were built according to legal requirements, with two bedrooms, a sitting/dining room, a kitchen, a bathroom, and a small service area.
5.2 Resettlement in New Houses Built in the Same Favelas
When a favela had areas that were not at risk of flood-ing, the “favela urbanization” program (slum upgrad-ing) was adopted, which formed part of SEHAB housing policy designed to enhance the quality of the district’s housing, infrastructure, and sanitation, as well as regu-larize the inhabitants’ property rights by awarding them housing deeds. This program was successfully imple-mented in three favelas and facilitated the resettlement of 634 families in new houses built inside the same, but upgraded, favelas.
This resettlement option involved analyzing, selecting, and ranking the favelas, considering the degree and type of risk, viability of executing the types of works required, and families’ acceptance of the program. In some cases, the lots for the new houses were municipal so their of-ficial use had to be changed to housing. In others, they were private property and had to be bought. Architec-tural and urban development plans were created, both to construct the new houses and improve the favelas.
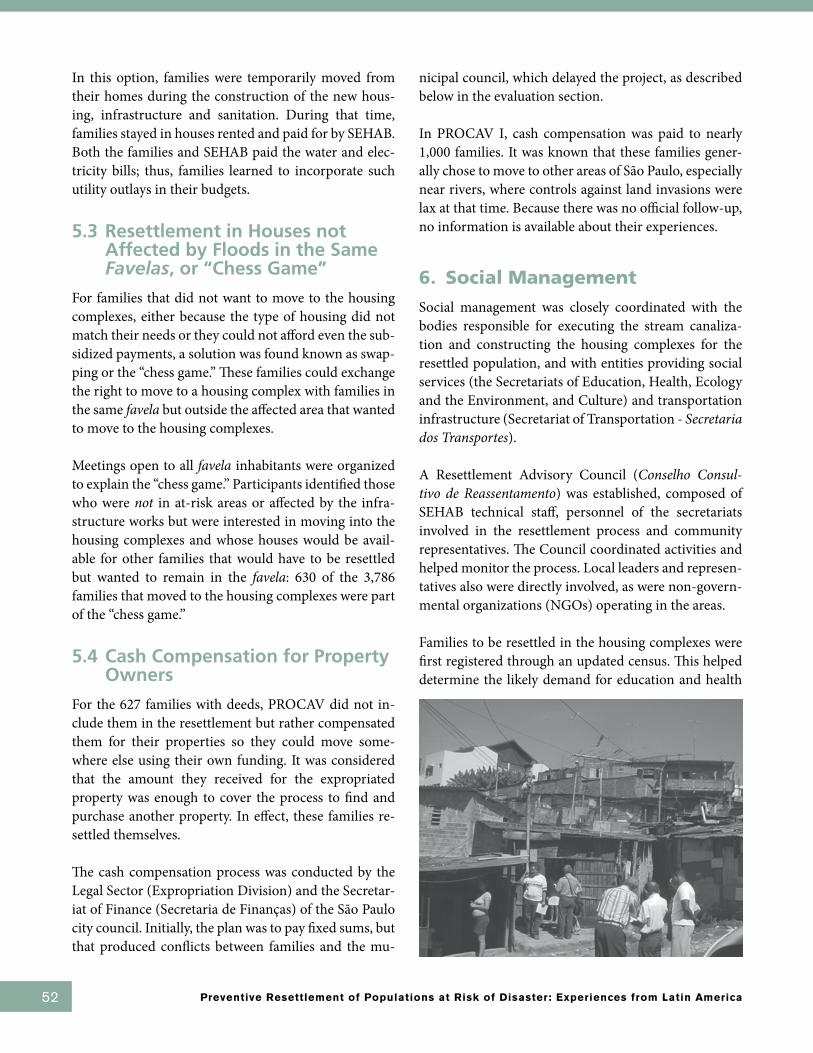
52 Preventive Resettlement of Populations at Risk of Disaster: Experiences from Latin America
In this option, families were temporarily moved from their homes during the construction of the new hous-ing, infrastructure and sanitation. During that time, families stayed in houses rented and paid for by SEHAB. Both the families and SEHAB paid the water and elec-tricity bills; thus, families learned to incorporate such utility outlays in their budgets.
5.3 Resettlement in Houses not Affected by Floods in the Same Favelas, or “Chess Game”
For families that did not want to move to the housing complexes, either because the type of housing did not match their needs or they could not afford even the sub-sidized payments, a solution was found known as swap-ping or the “chess game.” These families could exchange the right to move to a housing complex with families in the same favela but outside the affected area that wanted to move to the housing complexes.
Meetings open to all favela inhabitants were organized to explain the “chess game.” Participants identified those who were not in at-risk areas or affected by the infra-structure works but were interested in moving into the housing complexes and whose houses would be avail-able for other families that would have to be resettled but wanted to remain in the favela: 630 of the 3,786 families that moved to the housing complexes were part of the “chess game.”
5.4 Cash Compensation for Property Owners
For the 627 families with deeds, PROCAV did not in-clude them in the resettlement but rather compensated them for their properties so they could move some-where else using their own funding. It was considered that the amount they received for the expropriated property was enough to cover the process to find and purchase another property. In effect, these families re-settled themselves.
The cash compensation process was conducted by the Legal Sector (Expropriation Division) and the Secretar-iat of Finance (Secretaria de Finanças) of the São Paulo city council. Initially, the plan was to pay fixed sums, but that produced conflicts between families and the mu-
nicipal council, which delayed the project, as described below in the evaluation section.
In PROCAV I, cash compensation was paid to nearly 1,000 families. It was known that these families gener-ally chose to move to other areas of São Paulo, especially near rivers, where controls against land invasions were lax at that time. Because there was no official follow-up, no information is available about their experiences.
6. Social Management
Social management was closely coordinated with the bodies responsible for executing the stream canaliza-tion and constructing the housing complexes for the resettled population, and with entities providing social services (the Secretariats of Education, Health, Ecology and the Environment, and Culture) and transportation infrastructure (Secretariat of Transportation - Secretaria dos Transportes).
A Resettlement Advisory Council (Conselho Consul-tivo de Reassentamento) was established, composed of SEHAB technical staff, personnel of the secretariats involved in the resettlement process and community representatives. The Council coordinated activities and helped monitor the process. Local leaders and represen-tatives also were directly involved, as were non-govern-mental organizations (NGOs) operating in the areas.
Families to be resettled in the housing complexes were first registered through an updated census. This helped determine the likely demand for education and health

53Chapter 4 Changes in the Quality of Life for People in High Risk Areas | Brazil |
services and the number of families eligible for this op-tion. It also helped prepare the population for the sub-sequent phases and their new habitat.
In addition, a socio-economic study was conducted in 1994 by the Research Institute Foundation of the Eco-nomic and Administrative Sciences Faculty of the Uni-versity of São Paulo, which focused on the: (a) num-ber of families to be resettled; (b) composition of each family—number of individuals, age ranges, and school needs; (c) families’ capacity to pay; (d) place of employ-ment, time needed to get to work; (e) socio-cultural ties, length of residence in the favela, participation in com-munity activities; and (f) aspirations with respect to the resettlement options.
The social management team held periodic meetings with the communities, their representatives and local organizations to report on the program’s progress and prepare for the move. Families were taken to visit the housing complexes to ensure they were familiar with their future homes and characteristics of the new neigh-borhoods. They were also trained in meeting their post-resettlement obligations.
During the meetings, consensus was reached on: (a) moving schedules (that took into account school atten-dance); (b) criteria for allotting the housing units so as to reconstitute neighborhoods; (c) rights and duties as-sociated with being home owners; (d) families’ financing arrangements, monthly quota amounts, terms, and con-ditions of access to subsidies for specific time periods; (e) the need for community organization and associated costs; (f) upkeep of the apartments and associated costs; (g) use and maintenance of collective community facili-ties; (h) use and costs of public utilities (drinking water, wastewater, and electricity).
7. Budget and Resettlement Costs
PROCAV II cost US$627 million, US$325 million of which was covered by the São Paulo City Council. The remaining US$302 million was in the form of a loan from the Inter-American Development Bank (IDB): US$54 million was earmarked for the works and activi-ties of the overall resettlement plan (see Table 4.6).
Studies and project preparation were 3 percent of the total cost of the housing complexes. Basic infrastruc-ture, including electricity, sewage systems, and potable water networks, roads, paving and public lighting, were estimated to be 10 percent of the total cost. The cost of building schools and health centers was US$3,276,200. The total cost did not include the value of the land on which the housing was built, which was provided by the municipality (See Table 4.6).
Each family was allotted US$200 for its move, for trans-portation, logistical support, and food. The total for these activities was US$775,000.
According to data from the PROCAV Management Unit and the Housing Secretariat, the unit cost for each apartment was US$9,725.
The cost of the favelas’ urban development was US$2,772,022: 634 houses were built, with each at ap-proximately US$4,372.
8. Outcomes
The stream canalization program (PROCAV) achieved its goal of improving the living and health conditions of those in the low-lying areas of the most critical sub-basins in São Paulo. Almost all the objectives estab-
Table 4.6. Overall Plan for Resettlement in Housing Complexes – Budget US$
Municipality IDB
Studies and plans 1,384,974
Infrastructure 4,616,580
Homes 37,694,100
Shared facilities 3,276,400
Resettlement 775,000
Urbanization of favelas 2,772,022
Management team 1,173,028
Support team 2,083,309
Evaluation 76,000
Institution building 1,000,000
Subtotal 50,575,013 4,276,400
Total 54,851,413
Source: GEPROCAV and SEHAB archives
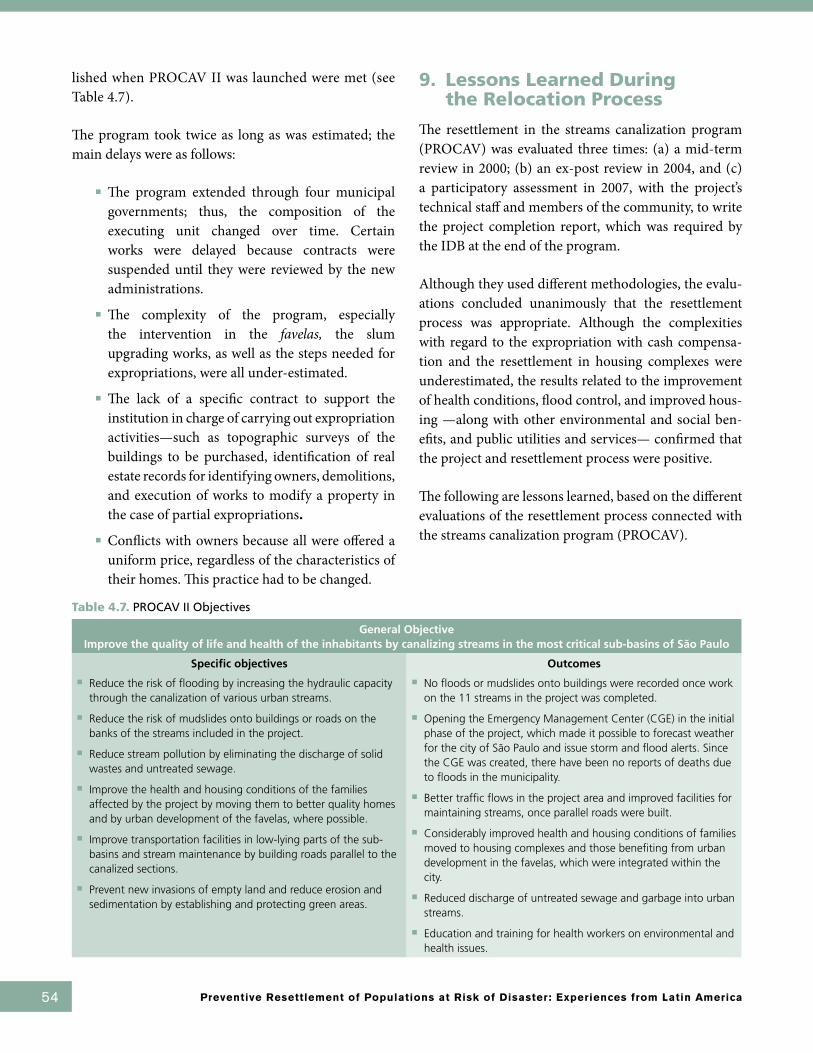
54 Preventive Resettlement of Populations at Risk of Disaster: Experiences from Latin America
lished when PROCAV II was launched were met (see Table 4.7).
The program took twice as long as was estimated; the main delays were as follows:
■ The program extended through four municipal governments; thus, the composition of the executing unit changed over time. Certain works were delayed because contracts were suspended until they were reviewed by the new administrations.
■ The complexity of the program, especially the intervention in the favelas, the slum upgrading works, as well as the steps needed for expropriations, were all under-estimated.
■ The lack of a specific contract to support the institution in charge of carrying out expropriation activities—such as topographic surveys of the buildings to be purchased, identification of real estate records for identifying owners, demolitions, and execution of works to modify a property in the case of partial expropriations.
■ Conflicts with owners because all were offered a uniform price, regardless of the characteristics of their homes. This practice had to be changed.
9. Lessons Learned During the Relocation Process
The resettlement in the streams canalization program (PROCAV) was evaluated three times: (a) a mid-term review in 2000; (b) an ex-post review in 2004, and (c) a participatory assessment in 2007, with the project’s technical staff and members of the community, to write the project completion report, which was required by the IDB at the end of the program.
Although they used different methodologies, the evalu-ations concluded unanimously that the resettlement process was appropriate. Although the complexities with regard to the expropriation with cash compensa-tion and the resettlement in housing complexes were underestimated, the results related to the improvement of health conditions, flood control, and improved hous-ing —along with other environmental and social ben-efits, and public utilities and services— confirmed that the project and resettlement process were positive.
The following are lessons learned, based on the different evaluations of the resettlement process connected with the streams canalization program (PROCAV).
Table 4.7. PROCAV II Objectives
General ObjectiveImprove the quality of life and health of the inhabitants by canalizing streams in the most critical sub-basins of São Paulo
Specific objectives Outcomes
■ Reduce the risk of flooding by increasing the hydraulic capacity through the canalization of various urban streams.
■ Reduce the risk of mudslides onto buildings or roads on the banks of the streams included in the project.
■ Reduce stream pollution by eliminating the discharge of solid wastes and untreated sewage.
■ Improve the health and housing conditions of the families affected by the project by moving them to better quality homes and by urban development of the favelas, where possible.
■ Improve transportation facilities in low-lying parts of the sub-basins and stream maintenance by building roads parallel to the canalized sections.
■ Prevent new invasions of empty land and reduce erosion and sedimentation by establishing and protecting green areas.
■ No floods or mudslides onto buildings were recorded once work on the 11 streams in the project was completed.
■ Opening the Emergency Management Center (CGE) in the initial phase of the project, which made it possible to forecast weather for the city of São Paulo and issue storm and flood alerts. Since the CGE was created, there have been no reports of deaths due to floods in the municipality.
■ Better traffic flows in the project area and improved facilities for maintaining streams, once parallel roads were built.
■ Considerably improved health and housing conditions of families moved to housing complexes and those benefiting from urban development in the favelas, which were integrated within the city.
■ Reduced discharge of untreated sewage and garbage into urban streams.
■ Education and training for health workers on environmental and health issues.
55Chapter 4 Changes in the Quality of Life for People in High Risk Areas | Brazil |
9.1 Resettlement in Housing Complexes
What went well in the process of resettling people in housing complexes?
The 1994 resettlement plan for the housing complexes involved various actions before the moves, coordinated in a multidisciplinary effort by the different bodies and institutions participating in the process. Through the joint work of the secretariats, the plan was tailored to the civil works schedule, and took account of the actions that would have a socio-economic impact on the com-munity. These included:
■ The use of monitoring instruments and mecha-nisms (half-yearly reports and mid-term and ex-post reviews), according to special provisions of the IDB loan contract. Although the process encountered some problems, it identified factors that could have hampered the resettlement pro-cess.
■ One of the main achievements was community participation in the resettlement process, due to the creation of the Resettlement Advisory Council.
■ By including commercial areas and units in the housing complex designs, families that had originally engaged in subsistence businesses were able to sustain their income.
What did not work well in the resettlement process?
■ The very large size of the housing complexes, which had many buildings concentrated in the same area receiving families from different regions, made it more difficult to build a community and provide social services. The evaluations recommended that future projects be smaller, with no more than 150 apartments, to make it easier for occupants to create communities. Smaller scale also would eliminate the large demand for infrastructure, goods and services, such as construction of health clinics, schools, recreation areas, streets, among others.
■ Lack of coordination among the secretariats and the firms hired to operate social facilities and services (schools, health clinics) hampered the construction of the housing complexes and moving of families. A similar lack of coordination regarding the financing schedule occurred among the municipal secretariats because each had its own annual work and investment plans.
■ There was a time lapse between the census and socio-economic study conducted in 1994 and the moving of families. During that time, the population in the area increased, making the project more difficult, which, in turn, generated mistrust regarding the resettlement.
■ The various levels of family income and cost of the new houses were incompatible. This strained family budgets and made it more difficult to resettle families in the housing complexes.
9.2 Resettlement in the Upgraded Favelas
What went well in the process of resettling people in the upgraded favelas?
According to the report submitted after a seminar or-ganized to finalize the 2007 evaluation (São Paulo City Council, GEPROCAV, IDB, PROCAV II Evaluation Seminar, April 2007), successful features of the favelas’ urban development process included:
■ The fact that families could remain in their own districts was considered one of the most successful features of this option. Instead of resettling families in distant areas, a new neighborhood was created within the improved favela and the PROCAV works eliminated the risk of floods.
■ Community participation in the urban development meant participants could match their expectations with the institutional, legal and budgetary constraints.
■ The rental option, instead of shelters, accommo-dated families while new houses were built. Be-cause the occupants paid part of their water and electricity bills when they moved to the rental

56 Preventive Resettlement of Populations at Risk of Disaster: Experiences from Latin America
housing, they more readily accepted the financial responsibilities later.
What did not work in the process of resettling people in the upgraded favelas?
■ Cooperation between the secretariat and firms hired to perform services (street lighting, public transportation and security) did not fully develop in the time agreed upon; thus, families who were moved to rental housing during the works phase were not resettled on schedule.
■ There was a gap between the time the urbanization project was prepared and its implementation.
■ No environmental education program was created for the community to develop new options with respect to garbage disposal.
9.3 Expropriation and Cash Compensation
Unlike the option to resettle in housing complexes, the one that involved cash compensation or expropriation was conducted without a specific plan to guide the pro-cess. As a result, the expropriations and compensation payments were processed through the municipalities’ standard procedures.
A key lesson was that authorities should have attached the same importance to the cash compensation option as to the resettlement option. Experience suggests that moving low-income populations to housing complexes is less problematic than compensating residents for the value of their houses, either with funds or replacement houses. Despite the difficulties of resettling families into large complexes, they always receive better homes than they previously had, which cannot always be guaranteed in the compensation option.
The final report on expropriations (of owners affected by projects similar to the streams canalization program) recommended the following:
a. The international organizations’ financing the proj-ects should pay more attention to the expropriation
processes, so as to achieve a serious commitment between the parties and also provide mechanisms and instruments for monitoring and managing the process. It might also be useful if the loans included funds with which to finance the expropriations, so as not to depend solely on the availability of local counterpart funds.
b. If it is not feasible to include the costs of expropria-tions in the budget, the multi-lateral financial insti-tutions could require, from the time the contract is concluded, a guarantee that funds will be available to avoid interruptions in the expropriation process, which create difficulties in meeting schedules for the project’s civil works.
c. A detailed expropriation plan should be designed, based on a census and socio-economic study of the target population. The plan should include all of the activities in line with the civil works schedule.
d. The expropriation plan needs to guarantee fair pay-ment for the properties involved, so that the amount the displaced families receive will be enough to pur-chase a comparable property.
e. It is essential to anticipate schedules of actions that can be implemented in a timely fashion and thereby facilitate the movement of families as the construc-tion begins. This will help them avoid losses caused by lack of income and any activities they have to sus-pend.
f. It is vital to include communication actions and negotiating techniques into the expropriation pro-cess to provide answers to queries and exhaust all options for acquiring properties by friendly, rather than judicial means.
g. The entities responsible for expropriations must have adequate human and financial resources. Also, an instrument should be designed to regulate the administrative procedures for expropriating real es-tate; it should not allow the process to begin without guarantees that the funds needed for the compensa-tions are available.
This case study offers valuable lessons about different resettlement options. It also shows the risks of underes-timating such a complex program.

57Chapter 4 Changes in the Quality of Life for People in High Risk Areas | Brazil |
References
Instituto Brazileiro de Geografia e Estatística (IBGE), Censo Nacional de Saneamento, 2002; Censos Demográficos 1970, 1980, 1990, 2000 e contagem de população 2007.
Inter-American Development Bank (IDB). 2008. Eva-luación final del proyecto.
National Secretary of Civil Defense. Disasters Records of São Paulo, press archives, 2008.
Prefeitura Municipal de São Paulo. 2004. Plano general de reassentamento de População.
———. 2007. Plano preventivo de Defensa Civil (PPDC).
———. 2007. Urbanização de Favelas.
Prefeitura Municipal de São Paulo, GePROCAV, BID. 2007. Seminário de Avaliação do PROCAV II, abril.
Prefeitura Municipal de São Paulo, GePROCAV, Ziguia. 2004. Avaliação expost do processo de remaneja-mento de população.
Prefeitura Municipal de São Paulo, SEHAB-HABI. 2007. Cadastro de favelas, sistema.
Prefeitura Municipal de São Paulo, SEHAB-HABI- GePROCAV-BID. 2007. Avaliação final do PRO-CAV.
Scombatti, Marília. 2004. Banco Interamericano de De-sarrollo: Informes de seguimiento y supervisión del PROCAV 2000-2004.
Universidade de Campinas, Núcleo de Estudos Popula-cionais (NEPO). 2006. Estudios demográficos.

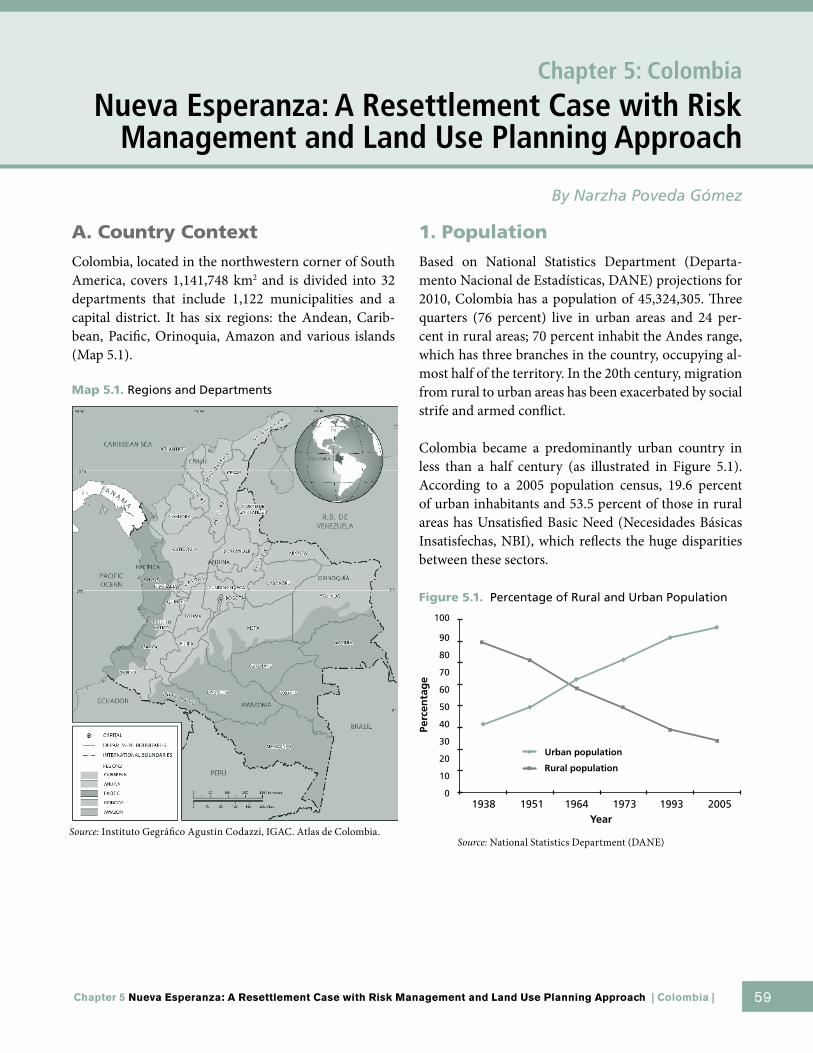
59Chapter 5 Nueva Esperanza: A Resettlement Case with Risk Management and Land Use Planning Approach | Colombia |
A. Country Context
Colombia, located in the northwestern corner of South America, covers 1,141,748 km2 and is divided into 32 departments that include 1,122 municipalities and a capital district. It has six regions: the Andean, Carib-bean, Pacific, Orinoquia, Amazon and various islands (Map 5.1).
Map 5.1. Regions and Departments
1. Population
Based on National Statistics Department (Departa-mento Nacional de Estadísticas, DANE) projections for 2010, Colombia has a population of 45,324,305. Three quarters (76 percent) live in urban areas and 24 per-cent in rural areas; 70 percent inhabit the Andes range, which has three branches in the country, occupying al-most half of the territory. In the 20th century, migration from rural to urban areas has been exacerbated by social strife and armed conflict.
Colombia became a predominantly urban country in less than a half century (as illustrated in Figure 5.1). According to a 2005 population census, 19.6 percent of urban inhabitants and 53.5 percent of those in rural areas has Unsatisfied Basic Need (Necesidades Básicas Insatisfechas, NBI), which reflects the huge disparities between these sectors.
Figure 5.1. Percentage of Rural and Urban Population
Chapter 5: Colombia
Nueva Esperanza: A Resettlement Case with Risk Management and Land Use Planning Approach
By Narzha Poveda Gómez
Source: Instituto Gegráfico Agustín Codazzi, IGAC. Atlas de Colombia.Source: National Statistics Department (DANE)
100
90
80
70
60
50
40
30
20
10
0
Perc
enta
ge
1938 1964 19931951 1973 2005Year
Urban population
Rural population
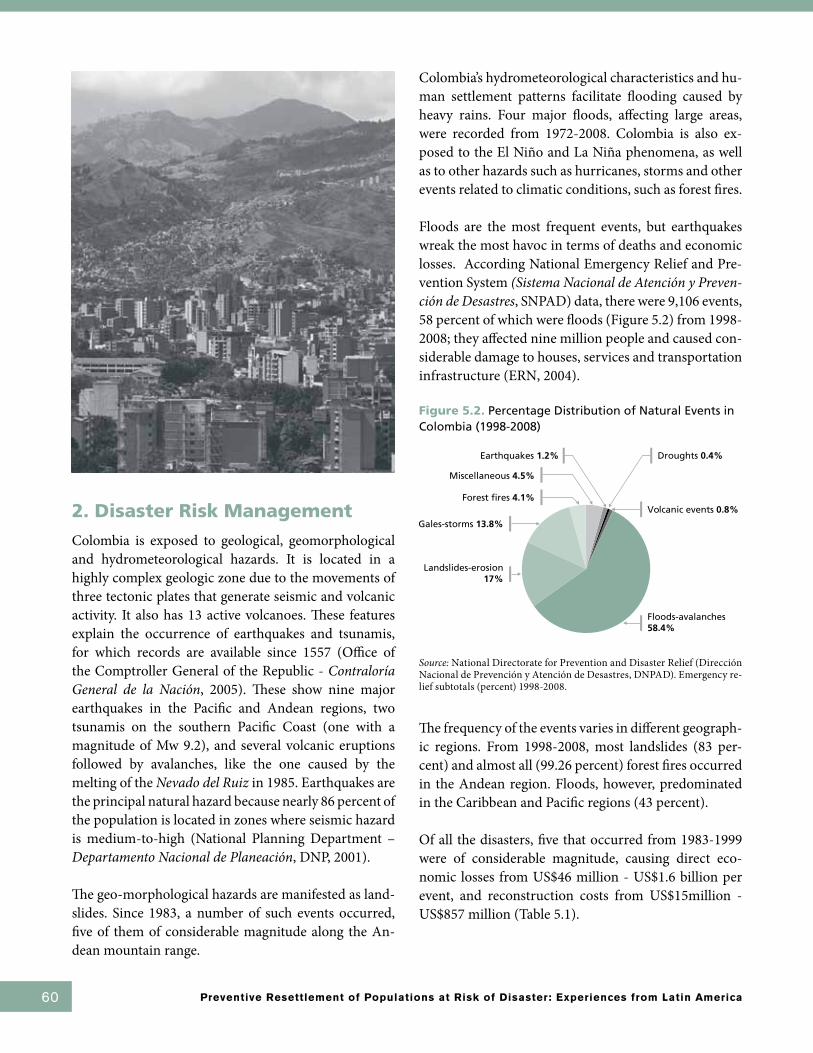
60 Preventive Resettlement of Populations at Risk of Disaster: Experiences from Latin America
2. Disaster Risk Management
Colombia is exposed to geological, geomorphological and hydrometeorological hazards. It is located in a highly complex geologic zone due to the movements of three tectonic plates that generate seismic and volcanic activity. It also has 13 active volcanoes. These features explain the occurrence of earthquakes and tsunamis, for which records are available since 1557 (Office of the Comptroller General of the Republic - Contraloría General de la nación, 2005). These show nine major earthquakes in the Pacific and Andean regions, two tsunamis on the southern Pacific Coast (one with a magnitude of Mw 9.2), and several volcanic eruptions followed by avalanches, like the one caused by the melting of the nevado del Ruiz in 1985. Earthquakes are the principal natural hazard because nearly 86 percent of the population is located in zones where seismic hazard is medium-to-high (National Planning Department – Departamento nacional de Planeación, DNP, 2001).
The geo-morphological hazards are manifested as land-slides. Since 1983, a number of such events occurred, five of them of considerable magnitude along the An-dean mountain range.
Colombia’s hydrometeorological characteristics and hu-man settlement patterns facilitate flooding caused by heavy rains. Four major floods, affecting large areas, were recorded from 1972-2008. Colombia is also ex-posed to the El Niño and La Niña phenomena, as well as to other hazards such as hurricanes, storms and other events related to climatic conditions, such as forest fires.
Floods are the most frequent events, but earthquakes wreak the most havoc in terms of deaths and economic losses. According National Emergency Relief and Pre-vention System (Sistema nacional de Atención y Preven-ción de Desastres, SNPAD) data, there were 9,106 events, 58 percent of which were floods (Figure 5.2) from 1998-2008; they affected nine million people and caused con-siderable damage to houses, services and transportation infrastructure (ERN, 2004).
Figure 5.2. Percentage Distribution of Natural Events in Colombia (1998-2008)
Source: National Directorate for Prevention and Disaster Relief (Dirección Nacional de Prevención y Atención de Desastres, DNPAD). Emergency re-lief subtotals (percent) 1998-2008.
The frequency of the events varies in different geograph-ic regions. From 1998-2008, most landslides (83 per-cent) and almost all (99.26 percent) forest fires occurred in the Andean region. Floods, however, predominated in the Caribbean and Pacific regions (43 percent).
Of all the disasters, five that occurred from 1983-1999 were of considerable magnitude, causing direct eco-nomic losses from US$46 million - US$1.6 billion per event, and reconstruction costs from US$15million - US$857 million (Table 5.1).
Miscellaneous 4.5%
Forest fires 4.1%
Gales-storms 13.8%
Volcanic events 0.8%
Floods-avalanches 58.4%
Landslides-erosion17%
Droughts 0.4% Earthquakes 1.2%
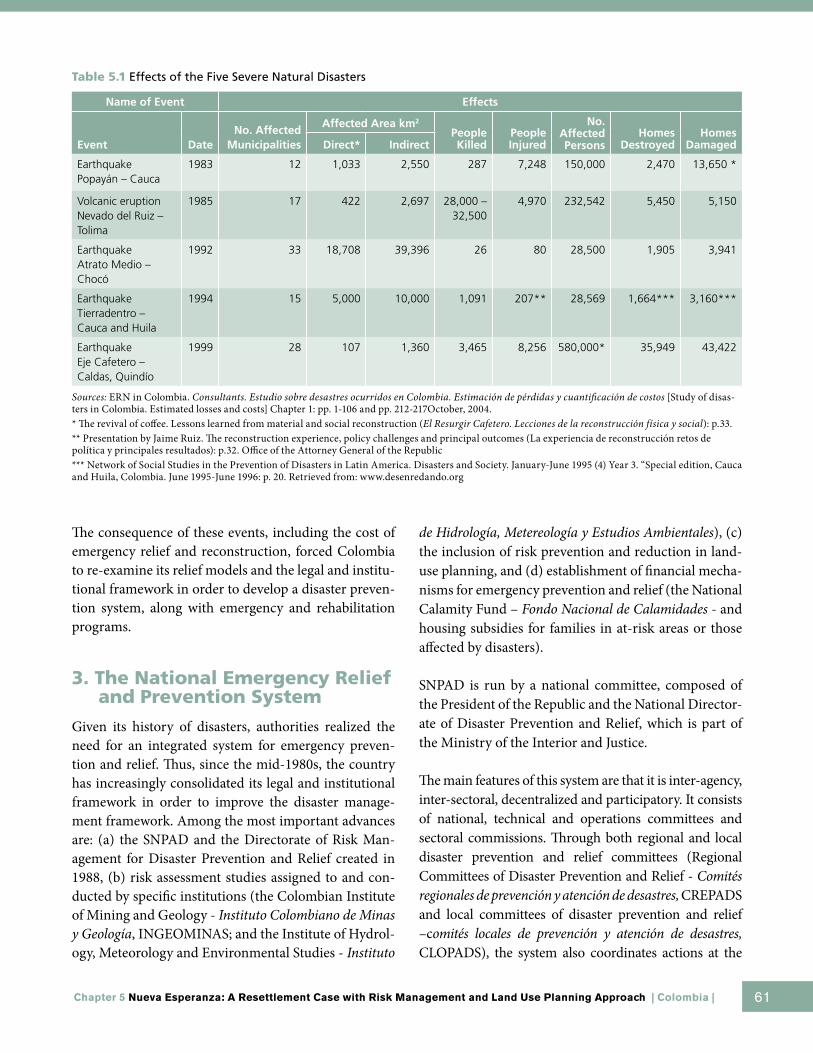
61Chapter 5 Nueva Esperanza: A Resettlement Case with Risk Management and Land Use Planning Approach | Colombia |
The consequence of these events, including the cost of emergency relief and reconstruction, forced Colombia to re-examine its relief models and the legal and institu-tional framework in order to develop a disaster preven-tion system, along with emergency and rehabilitation programs.
3. The National Emergency Relief and Prevention System
Given its history of disasters, authorities realized the need for an integrated system for emergency preven-tion and relief. Thus, since the mid-1980s, the country has increasingly consolidated its legal and institutional framework in order to improve the disaster manage-ment framework. Among the most important advances are: (a) the SNPAD and the Directorate of Risk Man-agement for Disaster Prevention and Relief created in 1988, (b) risk assessment studies assigned to and con-ducted by specific institutions (the Colombian Institute of Mining and Geology - Instituto Colombiano de Minas y Geología, INGEOMINAS; and the Institute of Hydrol-ogy, Meteorology and Environmental Studies - Instituto
de Hidrología, Metereología y Estudios Ambientales), (c) the inclusion of risk prevention and reduction in land-use planning, and (d) establishment of financial mecha-nisms for emergency prevention and relief (the National Calamity Fund – Fondo nacional de Calamidades - and housing subsidies for families in at-risk areas or those affected by disasters).
SNPAD is run by a national committee, composed of the President of the Republic and the National Director-ate of Disaster Prevention and Relief, which is part of the Ministry of the Interior and Justice.
The main features of this system are that it is inter-agency, inter-sectoral, decentralized and participatory. It consists of national, technical and operations committees and sectoral commissions. Through both regional and local disaster prevention and relief committees (Regional Committees of Disaster Prevention and Relief - Comités regionales de prevención y atención de desastres, CREPADS and local committees of disaster prevention and relief –comités locales de prevención y atención de desastres, CLOPADS), the system also coordinates actions at the
Name of Event Effects
Event DateNo. Affected
Municipalities
Affected Area km2
People Killed
People Injured
No. Affected Persons
Homes Destroyed
Homes DamagedDirect* Indirect
Earthquake Popayán – Cauca
1983 12 1,033 2,550 287 7,248 150,000 2,470 13,650 *
Volcanic eruption Nevado del Ruiz –Tolima
1985 17 422 2,697 28,000 – 32,500
4,970 232,542 5,450 5,150
Earthquake Atrato Medio – Chocó
1992 33 18,708 39,396 26 80 28,500 1,905 3,941
Earthquake Tierradentro – Cauca and Huila
1994 15 5,000 10,000 1,091 207** 28,569 1,664*** 3,160***
Earthquake Eje Cafetero – Caldas, Quindío
1999 28 107 1,360 3,465 8,256 580,000* 35,949 43,422
Sources: ERN in Colombia. Consultants. Estudio sobre desastres ocurridos en Colombia. Estimación de pérdidas y cuantificación de costos [Study of disas-ters in Colombia. Estimated losses and costs] Chapter 1: pp. 1-106 and pp. 212-217October, 2004. * The revival of coffee. Lessons learned from material and social reconstruction (El Resurgir Cafetero. Lecciones de la reconstrucción física y social): p.33. ** Presentation by Jaime Ruiz. The reconstruction experience, policy challenges and principal outcomes (La experiencia de reconstrucción retos de política y principales resultados): p.32. Office of the Attorney General of the Republic*** Network of Social Studies in the Prevention of Disasters in Latin America. Disasters and Society. January-June 1995 (4) Year 3. “Special edition, Cauca and Huila, Colombia. June 1995-June 1996: p. 20. Retrieved from: www.desenredando.org
Table 5.1 Effects of the Five Severe Natural Disasters

62 Preventive Resettlement of Populations at Risk of Disaster: Experiences from Latin America
national, departmental and municipal levels. SNPAD has also designed an integrated information system, which can identify existing risks and levels of vulnerability.
The system’s planning tools include the National Emer-gency Prevention and Relief Plan, sectoral plans, and business sector plans.
4. Incorporation of Risk Prevention in Development Planning
The chief advantage of including risk reduction in plan-ning processes is that it is incorporated into land use planning, sector planning and the public investment system.
In 1997, Colombia required that land use plans (Plan de Ordenamiento Territorial, POT) be developed at the municipal level and must consider the location of criti-cal hazards and risk areas for disaster prevention pur-poses; also, they must designate land use in order to re-duce risk factors.
The Ministry of Environment, Housing and Regional Development (Ministerio de Ambiente, Vivienda y De-sarrollo Territorial) and SNPAD have provided techni-cal assistance to the municipalities to enable them to incorporate risk considerations into land use planning. However, efforts need to be improved, since only 20 per-cent of municipalities had included disaster risk man-agement in the POTs as of 2007.
5. Financing Risk Management
Colombia has a financial structure that can respond to disaster prevention and relief; it consists of the National Calamity Fund, which receives domestic funds from royalties1, and the National Housing Fund (Fondo na-cional de Vivienda).
Disaster prevention and relief still rely on national-level resources, except for the capital district of Bogotá, which established its Emergency Prevention and Relief Fund (Fondo Financiero de Proyectos de Desarrollo, FOPAE).
In addition, since 2005, the National Housing Fund provides subsidies for low-income households in urban areas affected by disasters or those at high-risk. In rural areas, the Ministry of Agriculture and Rural Develop-ment grants such subsidies.
The Government also acquires loans from multilateral agencies, such as the US$260 million loan signed with The World Bank in 2005 to finance the program to re-duce the Government’s fiscal vulnerability to natural disasters. The country also receives donations from in-ternational cooperation agencies.
6. Resettlement: A Risk Prevention and Reduction Strategy
One of Colombia’s risk prevention strategies is to resettle the at-risk population in safe areas, when risk cannot be mitigated by other means or only by methods that are more costly than resettlement. Some of the largest preventive resettlements involved 10,000 people in the municipality of San Cayetano, in Cundinamarca, 45,000 in Medellín, and 65,000 in Bogotá.
A 2005 study of resettlement experiences and practices by the DNP (DNP and Presidential Agency for Social Action and International Cooperation - Agencia Presidencial para la Acción Social y la Cooperación Internacional, ACCI, 2005) showed that from 1994-2004, approximately 130,000 people (28,555 households) in 192 municipalities were displaced by natural disasters.
The study also found that in 137 municipalities (9.6 percent of the total municipalities), there were 158 resettlement plans for 95,340 families in at-risk areas to be executed by 2011: 81 percent were in the Andean region, 13 percent in the Pacific region, and 6 percent in other regions. Unfortunately, no consolidated data or a national information system exists about the extent to which the plans were implemented. Further, within each municipality, data tend to be dispersed.
1 The companies that exploit non-renewable resources should pay royalties which are an important source of financing of the Government.
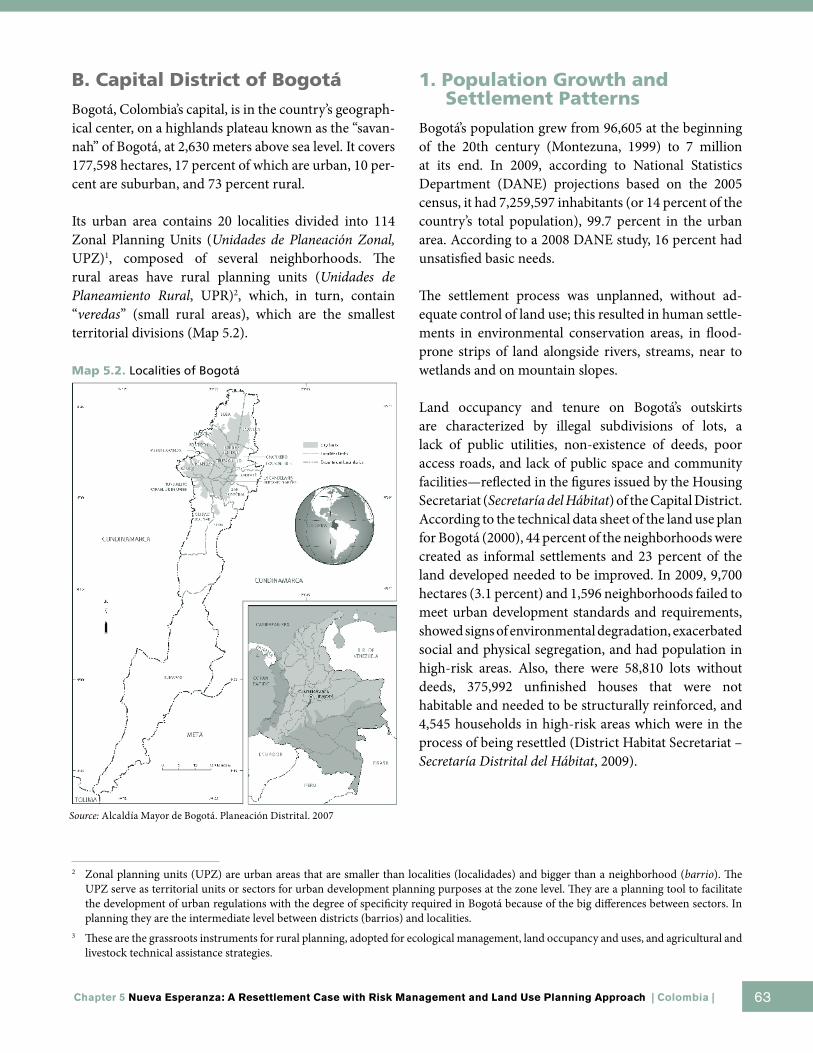
63Chapter 5 Nueva Esperanza: A Resettlement Case with Risk Management and Land Use Planning Approach | Colombia |
B. Capital District of Bogotá
Bogotá, Colombia’s capital, is in the country’s geograph-ical center, on a highlands plateau known as the “savan-nah” of Bogotá, at 2,630 meters above sea level. It covers 177,598 hectares, 17 percent of which are urban, 10 per-cent are suburban, and 73 percent rural.
Its urban area contains 20 localities divided into 114 Zonal Planning Units (Unidades de Planeación Zonal, UPZ)1, composed of several neighborhoods. The rural areas have rural planning units (Unidades de Planeamiento Rural, UPR)2, which, in turn, contain “veredas” (small rural areas), which are the smallest territorial divisions (Map 5.2).
Map 5.2. Localities of Bogotá
1. Population Growth and Settlement Patterns
Bogotá’s population grew from 96,605 at the beginning of the 20th century (Montezuna, 1999) to 7 million at its end. In 2009, according to National Statistics Department (DANE) projections based on the 2005 census, it had 7,259,597 inhabitants (or 14 percent of the country’s total population), 99.7 percent in the urban area. According to a 2008 DANE study, 16 percent had unsatisfied basic needs.
The settlement process was unplanned, without ad-equate control of land use; this resulted in human settle-ments in environmental conservation areas, in flood-prone strips of land alongside rivers, streams, near to wetlands and on mountain slopes.
Land occupancy and tenure on Bogotá’s outskirts are characterized by illegal subdivisions of lots, a lack of public utilities, non-existence of deeds, poor access roads, and lack of public space and community facilities—reflected in the figures issued by the Housing Secretariat (Secretaría del Hábitat) of the Capital District. According to the technical data sheet of the land use plan for Bogotá (2000), 44 percent of the neighborhoods were created as informal settlements and 23 percent of the land developed needed to be improved. In 2009, 9,700 hectares (3.1 percent) and 1,596 neighborhoods failed to meet urban development standards and requirements, showed signs of environmental degradation, exacerbated social and physical segregation, and had population in high-risk areas. Also, there were 58,810 lots without deeds, 375,992 unfinished houses that were not habitable and needed to be structurally reinforced, and 4,545 households in high-risk areas which were in the process of being resettled (District Habitat Secretariat – Secretaría Distrital del Hábitat, 2009).
2 Zonal planning units (UPZ) are urban areas that are smaller than localities (localidades) and bigger than a neighborhood (barrio). The UPZ serve as territorial units or sectors for urban development planning purposes at the zone level. They are a planning tool to facilitate the development of urban regulations with the degree of specificity required in Bogotá because of the big differences between sectors. In planning they are the intermediate level between districts (barrios) and localities.
3 These are the grassroots instruments for rural planning, adopted for ecological management, land occupancy and uses, and agricultural and livestock technical assistance strategies.
Source: Alcaldía Mayor de Bogotá. Planeación Distrital. 2007
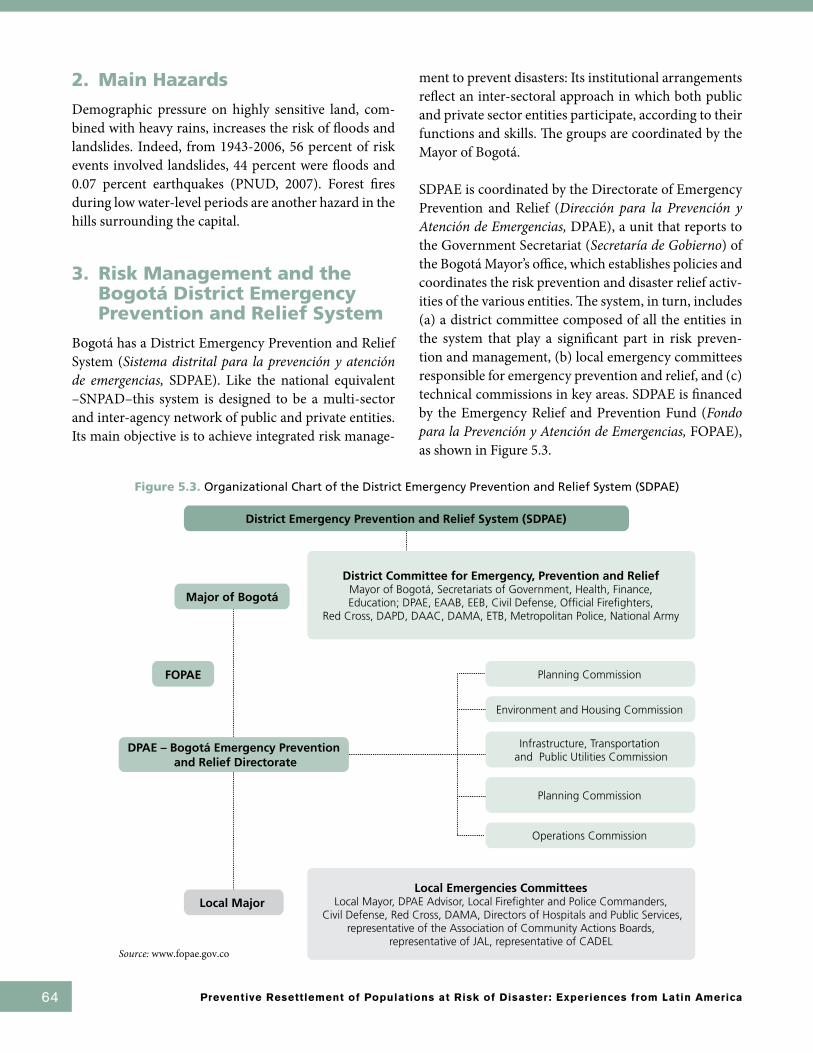
64 Preventive Resettlement of Populations at Risk of Disaster: Experiences from Latin America
2. Main Hazards
Demographic pressure on highly sensitive land, com-bined with heavy rains, increases the risk of floods and landslides. Indeed, from 1943-2006, 56 percent of risk events involved landslides, 44 percent were floods and 0.07 percent earthquakes (PNUD, 2007). Forest fires during low water-level periods are another hazard in the hills surrounding the capital.
3. Risk Management and the Bogotá District Emergency Prevention and Relief System
Bogotá has a District Emergency Prevention and Relief System (Sistema distrital para la prevención y atención de emergencias, SDPAE). Like the national equivalent –SNPAD–this system is designed to be a multi-sector and inter-agency network of public and private entities. Its main objective is to achieve integrated risk manage-
ment to prevent disasters: Its institutional arrangements reflect an inter-sectoral approach in which both public and private sector entities participate, according to their functions and skills. The groups are coordinated by the Mayor of Bogotá.
SDPAE is coordinated by the Directorate of Emergency Prevention and Relief (Dirección para la Prevención y Atención de Emergencias, DPAE), a unit that reports to the Government Secretariat (Secretaría de Gobierno) of the Bogotá Mayor’s office, which establishes policies and coordinates the risk prevention and disaster relief activ-ities of the various entities. The system, in turn, includes (a) a district committee composed of all the entities in the system that play a significant part in risk preven-tion and management, (b) local emergency committees responsible for emergency prevention and relief, and (c) technical commissions in key areas. SDPAE is financed by the Emergency Relief and Prevention Fund (Fondo para la Prevención y Atención de Emergencias, FOPAE), as shown in Figure 5.3.
District Committee for Emergency, Prevention and ReliefMayor of Bogotá, Secretariats of Government, Health, Finance,Education; DPAE, EAAB, EEB, Civil Defense, Official Firefighters,
Red Cross, DAPD, DAAC, DAMA, ETB, Metropolitan Police, National Army
Local Emergencies CommitteesLocal Mayor, DPAE Advisor, Local Firefighter and Police Commanders,
Civil Defense, Red Cross, DAMA, Directors of Hospitals and Public Services, representative of the Association of Community Actions Boards,
representative of JAL, representative of CADEL
Planning Commission
Environment and Housing Commission
Operations Commission
Planning Commission
Infrastructure, Transportation and Public Utilities Commission
District Emergency Prevention and Relief System (SDPAE)
Major of Bogotá
Local Major
DPAE – Bogotá Emergency Prevention and Relief Directorate
FOPAE
Figure 5.3. Organizational Chart of the District Emergency Prevention and Relief System (SDPAE)
Source: www.fopae.gov.co

65Chapter 5 Nueva Esperanza: A Resettlement Case with Risk Management and Land Use Planning Approach | Colombia |
SDPAE includes 25 institutions in the following sec-tors: government, finance, planning and economic de-velopment, industry and tourism, security and peaceful coexistence, education and health, social integration, culture, recreation and sports, environment, transporta-tion and housing. Each performs a specific task accord-ing to their funcions.
DPAE is a particularly important institution as it estab-lishes risk management policy, prepares technical stud-ies, and coordinates disaster prevention, mitigation, and relief activities. Others are the Bogotá Water and Sewerage Company (Empresa de Acueducto y Alcan-tarillado de Bogotá - EAAB), which is responsible for flood control, and the Low-income Population Housing Agency (Caja de Vivienda Popular - CVP), which is in charge of resettling families living in high-risk areas. For emergency relief, public utility and transportation enti-ties play a very important part, as do the police, army, firefighters, and civil defense units.
3.1 Risk Management Studies and Instruments
Since the 1990s, Bogotá, through the DPAE and na-tional entities such as INGEOMINAS, has conducted various studies to identify hazards and assess risks. As a result, it has maps of hazards related to floods, land-slides and forest fires, as well as a seismic micro-zon-ing map. Also, geo-technical and hydrometeorological systems monitor the evolution of hazards. Data from these studies were used to formulate the regional and district-level land-use plan (plan de ordenamiento ter-ritorial, POT) and the District Emergency Prevention and Relief Plan.
SDPAE has designed 12 instruments for disaster pre-vention and emergency relief responses. These instru-ments establish a logical thread from the formulation of policies to their implementation through specific ac-tions and inter-agency coordination (see Table 5.2).
Table 5.2 Disaster Risk Management Instruments
The institutional framework for risk management in Bogotá: DPAE and SDPAE
The land-use plan (POT) and instruments derived from it (the master plan and zonal planning units) (UPZ)
The Risk Management and Emergency Relief Information System (Sistema de Información para la Gestión de Riesgos y Atención de Emergencias, SIRE)
The District Disaster Prevention and Emergency Relief Plan, which offers integrated risk management methodology for regional and sectoral scenarios
Inter-agency networks to prevent and control illegal developments
Risk assessment methodology; technical studies and concepts
Resettlement of families in high-risk areas
Slum upgrading programs
Housing improvements
District emergency response protocols
Social response to emergencies due to disasters
Design and implementation of policies, strategies, plans and projects in coordination with district-level entities, to incorporate emergency prevention and relief into the culture of the capital district
3.2 Information Systems
Given the pivotal role of information in managing disas-ter risks, SDPAE has developed the following systems:
■ The Information System for Risk Management and Emergency Relief (SIRE);
■ The Resettlement Information System of the CVP. This system contains information on properties and houses at risk, public services, types of legal tenure, real estate appraisals, the “sole recognized value” (Valor Único de Reconocimiento, VUR),4 socio-economic information on households and on replacement houses;
■ The Illegal Urbanization Information and Moni-toring System (Sistema de Información y Moni-toreo de Urbanizaciones Ilegales), which monitors and controls new settlements in at-risk areas and of those reclaimed by resettlement programs.
4 The Sole Recognized Value is the amount assessed by the District to compensate a household located on high-risk land. It is based on two factors: the amount of the special commercial valuation plus the vulnerability factor. That value is applied to houses with a special com-mercial appraised value of less than 50 minimum legal wages.

66 Preventive Resettlement of Populations at Risk of Disaster: Experiences from Latin America
3.3 Sources of Financing
Bogotá has an Emergency Prevention and Relief Fund (FOPAE), which finances SDPAE. This Fund receives 0.5 percent of the District’s recurrent tax revenue, as well as contributions that may be made by national and district-level entities and private or international orga-nizations. Also, to reduce its fiscal vulnerability, the Dis-trict has been conducting studies aimed at establishing insurances policies for public and private infrastructure.
3.4 Resettlement of At-risk Population
Bogotá has engaged in resettlement processes for four key reasons: high risks, public works, urban sprawl, and urban renewal. These processes have become more pronounced since 1990: From 1997-2007, 21,490 households and pro-ductive units (in industry and trade) were resettled.
Resettlement of people in high-risk areas
The Land Use Plan (Plan de Ordenamietno Territorial, POT) adopted in 2000 established the priorities to be im-plemented over 10 years in the form of specific programs. Preventive risk management included low-cost housing programs for low-income families, comprehensive slum upgrading programs and resettlement for the population in high-risk areas. In addition, steps were taken to moni-
tor the occupation of land unsuitable for urbanization, to avoid increasing the number of people to be resettled, as well as rehabilitate the areas reclaimed under the resettle-ment program. This program involves moving house-holds to safe, adequate houses in another part of the city and promoting their social and economic inclusion.
The policy framework and methodologies for resettling households from high-risk areas were prepared by the CVP in 2002, as part of the Bogotá Urban Services proj-ect, financed by The World Bank. That framework and methodology drew on the CVP’s experience from the 1990s, and has been updated with more recent lessons learned.
Based on DPAE’s micro-zoning studies, as of September 2008, it had registered 9,154 households for the resettle-ment program in the SIRE. Of those, 5,179 were already resettled and 2,357 were in the process of moving—for a coverage ratio of 82 percent. However, as hazards are dynamic phenomena, new families are being registered in the SIRE: For example, from June 30-September 15, 2008, 120 new families were included in the system.
Housing subsidies for resettling the population living in high-risk areas
Within the POT, a special housing subsidy was estab-lished in 2003 called the “Sole Recognized Value” (Valor Único de Reconocimiento, VUR), as a financial instru-ment for resettling low-income families from areas de-clared as high-risk.
The VUR is made up of: (a) the appraised value of the land and improvements, according to a special com-mercial appraisal5 based on in rem rights of ownership (dominio)6 or possession (posesión)7; and (b) an addi-tional recognized value due to financial vulnerability for those families whose properties are appraised at less than the minimum cost of a typical home in low-cost housing programs.
5 The special commercial appraisal is carried out to assess the value of properties owned by the households to be resettled, using methods that calculate replacement costs.
6 An in rem right of ownership (derecho de dominio real) is that possessed by the owner of property who has a deed drawn up by a notary public and entered in the real estate register.
7 Possession (posesión) is the in rem right allowing tenure for a property or its use to those intending to become owners.

67Chapter 5 Nueva Esperanza: A Resettlement Case with Risk Management and Land Use Planning Approach | Colombia |
Initially, the amount assessed due to financial vulnerabil-ity was up to 24 legal minimum wages (Salario Mínimo Legal Vigente, SMLV) ($6,441 - 2008 dollars), but that subsidy was still not enough to purchase a replacement house; thus, families had to apply for national or district housing allowances or for private bank loans to acquire the necessary funds. In 2006, in order to facilitate the resettlement process, the VUR was increased to up to 50 SMLV (approximately US$13,000), which meant house-holds could acquire a legal, safe house without having to apply for additional allowances or loans.
The requirements the District established for granting a VUR are:
■ The lot on which the household lives has been declared at unmitigated high-risk (en alto riesgo no mitigable);
■ The household is in a socio-economic stratum8 of 1 or 2;
■ The household can show proof of ownership or possession;
■ No household member owns other inhabitable real estate anywhere in the country;
■ The owner/owners of the at-risk property authorize the use of the “sole recognized value” (VUR) to purchase a legal, safe replacement house;
■ Beneficiaries provide the information needed to obtain the VUR.
C. Case Study: The Nueva Esperanza Resettlement
The nueva Esperanza neighborhood was in Rafael Uribe Uribe, in the southeast of Bogotá, in a micro-watershed of the Hoya del Güaira creek near the Entre Nubes Dis-trict Ecological Park (Parque Ecológico Distrital Entre nubes, PEDEN), one of the Bogotá’s natural reserves.
Since the area was declared an environmentally fragile zone in the 2000 POT and had human settlements, the National Planning Department, along with the DPAE, commissioned studies to design the civil works need-ed to rehabilitate the high-risk area in the nueva Es-peranza district and prevent new settlements; this was done under The World Bank-financed project to reduce Colombia’s vulnerability to natural disasters. Based on the studies, DPAE declared the area a “high-risk zone.”
1. Studies to Identify the Risk Reduction Measures
Several studies were conducted by a consulting firm9 in 2003 and 2004 to determine the types of responses needed. They analyzed the physical (topographical, geo-morphological, hydrological, urbanization) compo-nents, biological (vegetation cover, fauna) components, and socio-economic aspects (characteristics of the pop-ulation and land tenure). The studies established the buffer zone of the creek—an area that should not be de-veloped (zona de ronda), and the landslide and flooding hazards. The findings were compared with the land uses established in the POT.
The socio-economic component described how nueva Esperanza had been transformed from an Andean for-
8 Socioeconomic stratum is a classification of residential areas to apply criteria for granting government subsidies and provide social assis-tance. Strata 1 and 2 correspond to low-income populations.
9 The studies were carried out by Geocing Ltda. Studies and civil works designs were produced to restore the areas and prevent settlements in the high hazard area at nueva Esperanza, Rafael Uribe-Uribe, Bogotá DC, 2004.
68 Preventive Resettlement of Populations at Risk of Disaster: Experiences from Latin America
est floor into rural land that was used for farming and livestock, and finally into an informal urban develop-ment area.
Regarding hazards, the studies found unstable areas producing landslides, erosion, and several houses about to collapse. The principal trigger was human activity re-lated to excavation for housing and road construction, inappropriate landfills, discharge of wastewater and de-forestation.
It was found that the first emergency relief was used in 1997, to resettle about 100 households. However, the effort was not sustainable because some households returned to the at-risk area due to authorities’ lack of control of the area.
When the findings were compared with the land use specified in the POT, it was concluded that the nueva Esperanza area was once part of the principal ecological structure of the Capital District and subject to land-use restrictions for the following reasons:
■ 54 percent of the area (28.4 ha) with 289 lots was located inside the PEDEN;
■ 17 percent (9 ha), 756 lots, was in high-risk zones; ■ 6 percent (3 ha), 126 lots, was encroaching on
the seepage areas alongside the creek’s buffer zone (ronda hídrica) and the land reserved for environmental management and conservation in the La Güaira creek.
2. Rehabilitation, Reconstruction and Sustainable Development Plan
The above-mentioned restrictions and the risk to which the population was exposed led the District Planning Department (Planeación Distrital) to design an inte-grated rehabilitation, reconstruction and sustainable development plan in 2005. It included actions to be car-ried out over a 10-year period, within a comprehensive framework, starting in 2005. The plan incorporated three strategies: (a) environmental and territorial re-covery, (b) community organization and participation strengthen, and (c) resettlement of population at-risk.
To develop it, consultations were held with local au-thorities, oversight bodies, the Office of the Comptroller General - Personería y Contraloría) and communities.
DPAE declared the at-risk areas to be protected and es-tablished the following actions to implement the strate-gies mentioned above:
■ To prevent the construction of new houses by denying applications for building permits (through the local mayor’s office), and carrying out civil or landscape works;
■ To acquire all the lots so the District had fee simple (dominium plenum) for the land, and the Environment Secretariat could implement the environmental management plan to rehabilitate the land, vegetation cover and Güaira creek;
■ To resettle the entire population; ■ To incorporate the entire area into the PEDEN.
Table 5.3 lists the different entities involved in imple-menting the strategies.
3. Resettlement Program
3.1 Resettlement Planning Studies
To prepare the resettlement program, the following were conducted: A census, socio-economic study, land tenure study (to determine the ownership status), and property appraisals. The following describes their scope and findings.
Census of lots, houses and population
Once DPAE declared the area as protected land and at high risk, and determined the need to resettle the popu-lation, it conducted a census of 1,450 existing lots (with structures already built, being constructed and vacant), the population and houses. The data were then linked to the SIRE database and sent to the CVP, the entity man-aging the resettlements.
Also, the District Planning Secretariat took aerial pho-tographs which were used to demarcate the area of in-tervention and the population to be resettled.
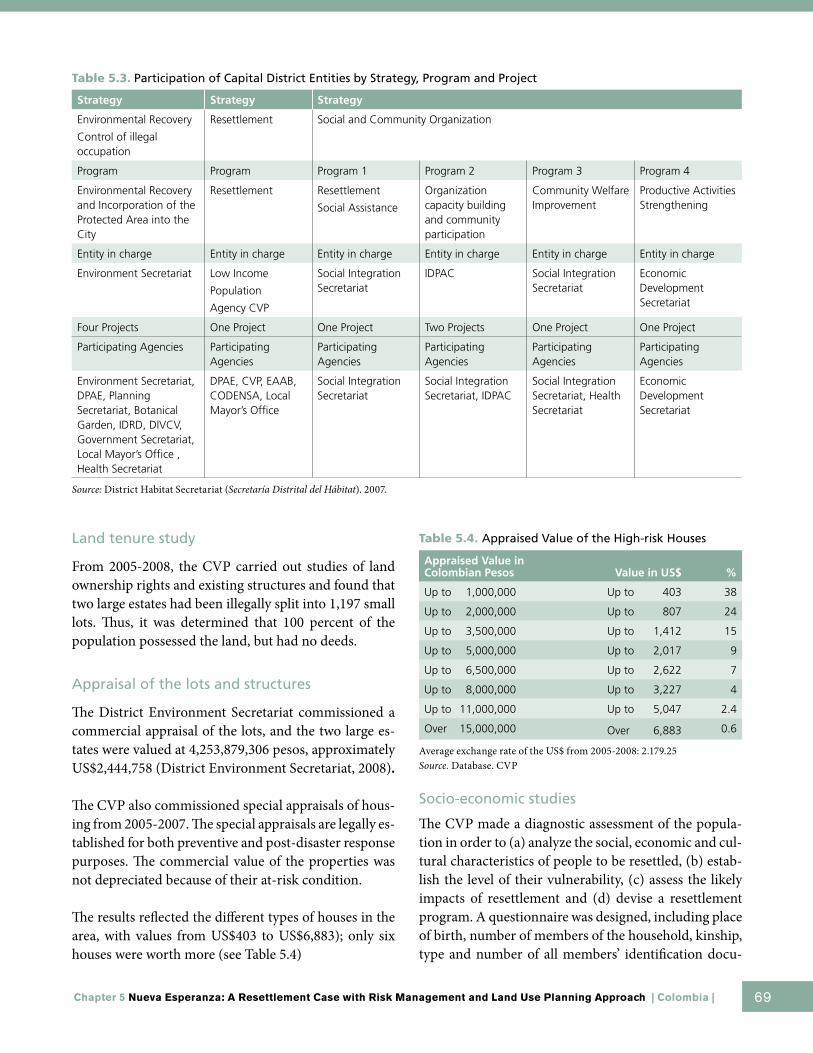
69Chapter 5 Nueva Esperanza: A Resettlement Case with Risk Management and Land Use Planning Approach | Colombia |
Land tenure study
From 2005-2008, the CVP carried out studies of land ownership rights and existing structures and found that two large estates had been illegally split into 1,197 small lots. Thus, it was determined that 100 percent of the population possessed the land, but had no deeds.
Appraisal of the lots and structures
The District Environment Secretariat commissioned a commercial appraisal of the lots, and the two large es-tates were valued at 4,253,879,306 pesos, approximately US$2,444,758 (District Environment Secretariat, 2008).
The CVP also commissioned special appraisals of hous-ing from 2005-2007. The special appraisals are legally es-tablished for both preventive and post-disaster response purposes. The commercial value of the properties was not depreciated because of their at-risk condition.
The results reflected the different types of houses in the area, with values from US$403 to US$6,883); only six houses were worth more (see Table 5.4)
Table 5.4. Appraised Value of the High-risk Houses
Appraised Value in Colombian Pesos Value in US$ %
Up to 1,000,000 Up to 403 38
Up to 2,000,000 Up to 807 24
Up to 3,500,000 Up to 1,412 15
Up to 5,000,000 Up to 2,017 9
Up to 6,500,000 Up to 2,622 7
Up to 8,000,000 Up to 3,227 4
Up to 11,000,000 Up to 5,047 2.4
Over 15,000,000 Over 6,883 0.6
Average exchange rate of the US$ from 2005-2008: 2.179.25Source. Database. CVP Socio-economic studies
The CVP made a diagnostic assessment of the popula-tion in order to (a) analyze the social, economic and cul-tural characteristics of people to be resettled, (b) estab-lish the level of their vulnerability, (c) assess the likely impacts of resettlement and (d) devise a resettlement program. A questionnaire was designed, including place of birth, number of members of the household, kinship, type and number of all members’ identification docu-
Table 5.3. Participation of Capital District Entities by Strategy, Program and Project
Strategy Strategy Strategy
Environmental Recovery
Control of illegal occupation
Resettlement Social and Community Organization
Program Program Program 1 Program 2 Program 3 Program 4
Environmental Recovery and Incorporation of the Protected Area into the City
Resettlement Resettlement
Social Assistance
Organization capacity building and community participation
Community Welfare Improvement
Productive Activities Strengthening
Entity in charge Entity in charge Entity in charge Entity in charge Entity in charge Entity in charge
Environment Secretariat Low Income
Population
Agency CVP
Social Integration Secretariat
IDPAC Social Integration Secretariat
Economic Development Secretariat
Four Projects One Project One Project Two Projects One Project One Project
Participating Agencies Participating Agencies
Participating Agencies
Participating Agencies
Participating Agencies
Participating Agencies
Environment Secretariat, DPAE, Planning Secretariat, Botanical Garden, IDRD, DIVCV, Government Secretariat, Local Mayor’s Office , Health Secretariat
DPAE, CVP, EAAB, CODENSA, Local Mayor’s Office
Social Integration Secretariat
Social Integration Secretariat, IDPAC
Social Integration Secretariat, Health Secretariat
Economic Development Secretariat
Source: District Habitat Secretariat (Secretaría Distrital del Hábitat). 2007.

70 Preventive Resettlement of Populations at Risk of Disaster: Experiences from Latin America
ments (IDs), occupation, education level, monthly in-come and expenditures, use of the health system, char-acteristics of the houses, public utilities connections, and forms of participation.
The results showed that the nueva Esperanza popula-tion had highly diverse origins (from four different re-gions of Colombia—Andean, Caribbean, Pacific and Orinoquia). A total of 1,099 households and 4,632 peo-ple were identified. Most had migrated to Bogotá for job opportunities, schooling and to be near to relatives.
A smaller percentage were families from Bogotá who were paying rent, and they bought lots in nueva Es-peranza from illegal urban developers with the idea of becoming owners and not having to pay rent. Four percent of households had been displaced by armed conflict, some of them indigenous people from various ethnic groups or Afro-Colombians. The diverse origins created a complex web of inter-cultural relations with a mix of (previous) small farmers, indigenous and Afro-descendants, which were reflected in different types of leadership.
There were an average of four people per household; women accounted for 51 percent and men 49 percent. Just over half (51 percent) were under 17 years of age, 47 percent were economically active adults, and 1.6 percent were elderly. Of the women, 3,183 (69 percent) were single, 1,017 (22 percent) lived with partners, 232 (5 percent) were married, 139 (3 percent) were separat-ed and 61 (1.3 percent) were widows. Sixteen percent of households were headed by women.
With regard to education, 49 percent had completed primary school, 23 percent secondary school, less than 1 percent had technical or higher education, 10 percent were illiterate, and 17 percent did not provide information.
Most of the population worked in the informal sector either as street vendors, waste collectors, maids, or in small home-based businesses. Approximately 9 per-cent worked in factories or construction, or as security guards. A high percentage was unemployed. Jobs were normally performed outside the neighborhood. The vast majority earned less than a minimum wage and only 3 percent earned more than 1.5 minimum legal wages10 (CVP, 2008b).
Regarding health services, 80 percent had access to gov-ernment-subsidized health care, 9 percent were covered by premium-based health insurance plans, 5 percent had no access at all and 6 percent did not report any information
Just less than a half (49 percent) the households had lived in the neighborhood from 1-5 years, almost a third (31 percent) from 6-10 years, 14 percent from 11-15 years and 6 percent for 16 years or more, which explains the dynamics of the neighborhood’s settlements.
Given the poor socio-economic conditions, the houses were highly vulnerable (Figure 5.4). At the same time, the population was also vulnerable to being displaced because of low income, zero capacity to save or have ac-cess to bank loans, the type of land rights, and the low value of houses. For these reasons, they could not afford adequate, safe houses.
10 The minimum legal wage in Colombia in 2008 was US$265 a month.

71Chapter 5 Nueva Esperanza: A Resettlement Case with Risk Management and Land Use Planning Approach | Colombia |
Figure 5.4 Types of Houses
Source: District Habitat Secretariat – Comprehensive Resettlement Information System, 2008
BUILT WITH RECYCLED MATERIALS Such houses—76 percent of the total— had no lighting or sanitation services.
PRE-FABRICATED HOUSES—2 percent of the total
SIMPLE MASONRY HOUSES—5 percent of the total. These are typically built with trussed stonework without a structure (to attach to), cyclops foundations, and a foundation beam to support possible add-ons.
ONE-FLOOR ARCADE MASONRY—15 percent of the total
TWO-FLOOR ARCADE MASONRY—1 percent of the total. Built as a vertical (pillars) and horizontal (beams) structure. Confined Cyclops cement with concrete structures—the traditional building system.

72 Preventive Resettlement of Populations at Risk of Disaster: Experiences from Latin America
4. Impacts of Displacement
The studies identified the impacts of displacement and were used as the basis for designing the resettlement program (Table 5.5).
Table 5.5 Social and Cultural Impacts of Resettlement
Impact Description
Loss of current house and frustrated plans to improve it
The low-income populations, with no access to the formal housing market or loans, build their homes gradually, when money is available. Most want a large house with several floors (if possible), so part can be used to generate income (eg. renting rooms or floors, or establishing some type of business).
Loss of social networks Over time, people built social networks. Thus, the extent to which they are affected by resettlement is directly related to vulnerability, especially for those needing the most support, such as female-headed households, the elderly and disabled.
Psycho-social problems
Awareness of risk and the need to relocate triggers feelings of loss and anxiety regarding the potential dangers, as well as the uncertainty associated with displacement.
Household budgeting
Moves into legally owned houses entails payments—such as taxes and utility fees—not previously in the household budget.
Moves also involve expenditures for paperwork and loss of income due to the time spent on acquiring the new house and getting re-established.
Households that run businesses or rented out space in the houses suffer a temporary loss of income until they resume those activities, if the new house allowed for them.
Disruptions in the host community
The host community could be affected by the arrival of the resettled households because of increased pressure on the use of and demand for community facilities and social services. Also, new arrivals can be regarded as undesirable (due to their origins), which creates stigmas.
5. Institutional Organization
The CVP directed the resettlement program, while other entities performed specific functions such as risk assess-ments and management, education and health care, community organization, and income-generating projects. Local authorities and emergency relief committees also participate (see Table 5.6 for a list of entities and their activities).
Table 5.6 Institutional Responsibilities in the Resettlement Process
Activities Entity in Charge Supporting Entities
Identifying hazards and risks; preparing technical concepts
Directorate of Emergency Prevention and Relief - DPAEIdentifying lots and population
Identifying total affected area – monitoring risks
Prioritizing households for resettlement
Designing evacuation routes and training programs; temporarily relocating populations (first month) DPAE
District Social Integration Secretariat
District Health Secretariat
Local Mayor’s Office
Rehabilitating reclaimed land District Environment Secretariat DPAE
Purchasing land and properties
Low-Income Population Housing Agency - CVP Conducting appraisals and awarding VURs
Assisting population to be resettled during all the process
Providing psycho-social assistance District Social Integration Secretariat
Improving sanitation and health conditions District Health Secretariat
Continues
73Chapter 5 Nueva Esperanza: A Resettlement Case with Risk Management and Land Use Planning Approach | Colombia |
Activities Entity in Charge Supporting Entities
Linking to educational services District Education Secretariat
Arranging for household-based productive projects District Economic Development Secretariat
Consolidating social networks District Environment Secretariat, District Social Integration Secretariat, District Institute of Participation and Community Action, Economic
Development SecretariatSupporting cultural, ecological and productive participation initiatives
Source: Secretaría Distrital del Habitat, 2007.
Table 5.6 Continuation
To coordinate the actions of the different institutions involved in nueva Esperanza, a technical-social round-table was formed, meeting monthly. It was chaired by the CVP and DPAE, and attended by all the entities per-forming tasks, along with leaders elected by the com-munity and oversight bodies.
Accountability mechanisms were devised to ensure that progress with the resettlement and other programs in the rehabilitation was properly reported.
6. Eligibility Criteria and Principles Governing the Resettlement Process
Based on the regulations for resettling high-risk house-holds, the CPV applied the following eligibility criteria:
■ The lot and house were identified by DPAE as being high-risk;
■ The household was living in the high risk area; ■ The household did not possess any other habitable
property inside or outside the city;■ The household had not been resettled in any other
project in the city; ■ The household was “in possession” of the property,
according to the land tenure study.
Based on these criteria, 1,074 of the 1,099 households surveyed were included in the resettlement program; the rest were ineligible because 10 families had other habitable houses, six were renters, and nine refused to participate (CVP, 2010b). This last group was referred to a government agency to find a solution.
7. Stages in the Resettlement Process
A comprehensive three-stage methodology was devel-oped to support the resettlement process. This included:
■ Community engagement and awareness-raising ■ Support with preparations for move■ Monitoring and follow-up (after the resettlement)
7.1 Community Engagement and Awareness-raising
The first stage, starting in December 2004, involved get-ting to know the households and community in order to determine their socio-economic characteristics and raise their awareness about the risks to which they were exposed. This was done by visiting households, con-ducting semi-structured interviews, sensitizing house-holds to the high risks, supervising their moves, han-dling their temporary relocation (where necessary), and monitoring the signing of shared responsibility pacts between households and the CVP.
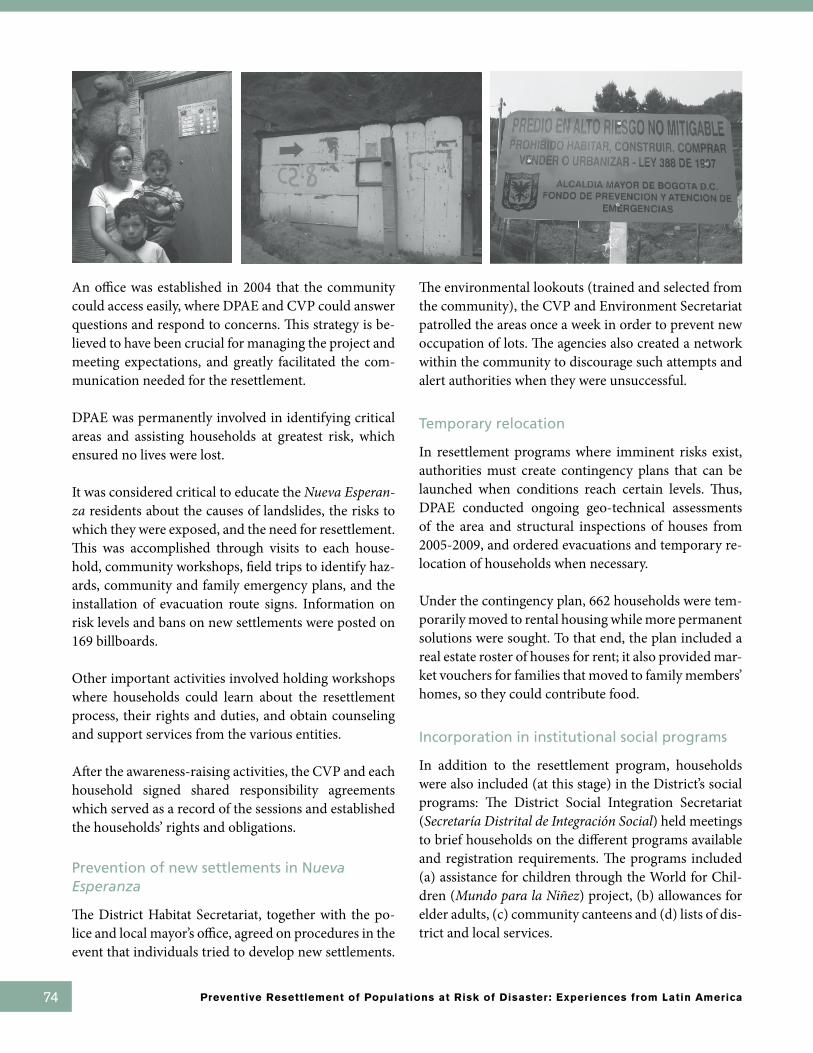
74 Preventive Resettlement of Populations at Risk of Disaster: Experiences from Latin America
An office was established in 2004 that the community could access easily, where DPAE and CVP could answer questions and respond to concerns. This strategy is be-lieved to have been crucial for managing the project and meeting expectations, and greatly facilitated the com-munication needed for the resettlement.
DPAE was permanently involved in identifying critical areas and assisting households at greatest risk, which ensured no lives were lost.
It was considered critical to educate the nueva Esperan-za residents about the causes of landslides, the risks to which they were exposed, and the need for resettlement. This was accomplished through visits to each house-hold, community workshops, field trips to identify haz-ards, community and family emergency plans, and the installation of evacuation route signs. Information on risk levels and bans on new settlements were posted on 169 billboards.
Other important activities involved holding workshops where households could learn about the resettlement process, their rights and duties, and obtain counseling and support services from the various entities.
After the awareness-raising activities, the CVP and each household signed shared responsibility agreements which served as a record of the sessions and established the households’ rights and obligations.
Prevention of new settlements in Nueva Esperanza
The District Habitat Secretariat, together with the po-lice and local mayor’s office, agreed on procedures in the event that individuals tried to develop new settlements.
The environmental lookouts (trained and selected from the community), the CVP and Environment Secretariat patrolled the areas once a week in order to prevent new occupation of lots. The agencies also created a network within the community to discourage such attempts and alert authorities when they were unsuccessful.
Temporary relocation
In resettlement programs where imminent risks exist, authorities must create contingency plans that can be launched when conditions reach certain levels. Thus, DPAE conducted ongoing geo-technical assessments of the area and structural inspections of houses from 2005-2009, and ordered evacuations and temporary re-location of households when necessary.
Under the contingency plan, 662 households were tem-porarily moved to rental housing while more permanent solutions were sought. To that end, the plan included a real estate roster of houses for rent; it also provided mar-ket vouchers for families that moved to family members’ homes, so they could contribute food.
Incorporation in institutional social programs
In addition to the resettlement program, households were also included (at this stage) in the District’s social programs: The District Social Integration Secretariat (Secretaría Distrital de Integración Social) held meetings to brief households on the different programs available and registration requirements. The programs included (a) assistance for children through the World for Chil-dren (Mundo para la niñez) project, (b) allowances for elder adults, (c) community canteens and (d) lists of dis-trict and local services.
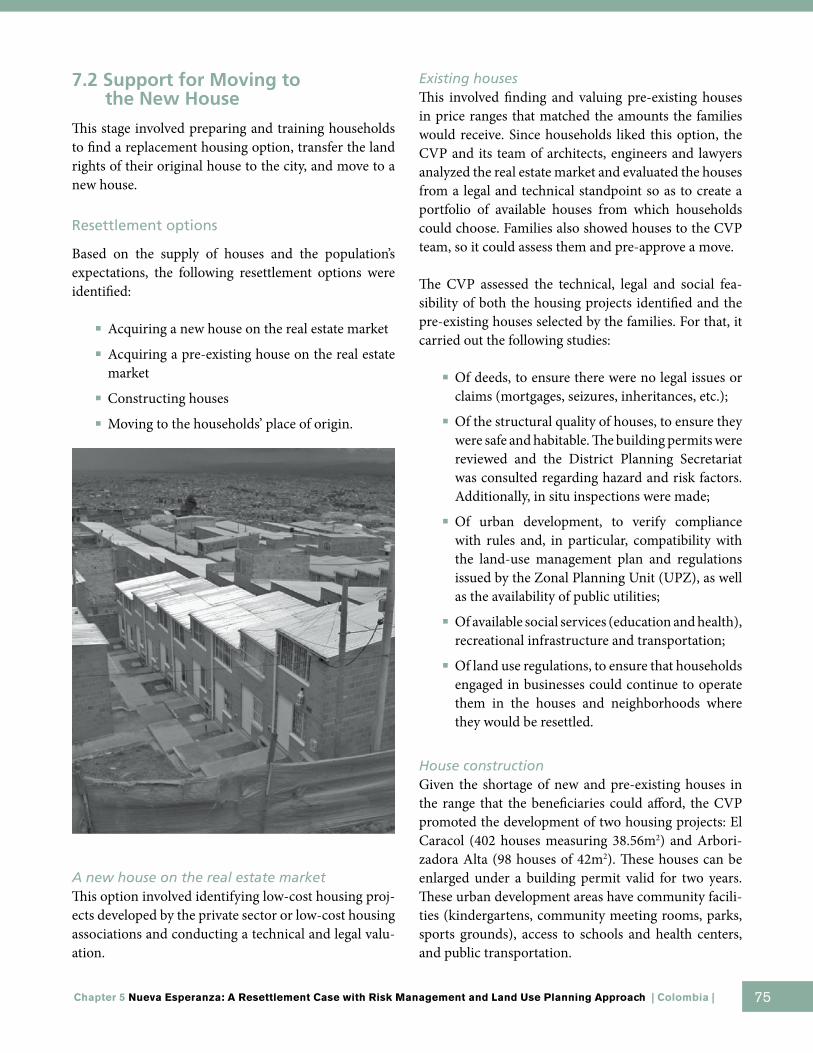
75Chapter 5 Nueva Esperanza: A Resettlement Case with Risk Management and Land Use Planning Approach | Colombia |
7.2 Support for Moving to the New House
This stage involved preparing and training households to find a replacement housing option, transfer the land rights of their original house to the city, and move to a new house.
Resettlement options
Based on the supply of houses and the population’s expectations, the following resettlement options were identified:
■ Acquiring a new house on the real estate market■ Acquiring a pre-existing house on the real estate
market■ Constructing houses■ Moving to the households’ place of origin.
A new house on the real estate marketThis option involved identifying low-cost housing proj-ects developed by the private sector or low-cost housing associations and conducting a technical and legal valu-ation.
Existing housesThis involved finding and valuing pre-existing houses in price ranges that matched the amounts the families would receive. Since households liked this option, the CVP and its team of architects, engineers and lawyers analyzed the real estate market and evaluated the houses from a legal and technical standpoint so as to create a portfolio of available houses from which households could choose. Families also showed houses to the CVP team, so it could assess them and pre-approve a move.
The CVP assessed the technical, legal and social fea-sibility of both the housing projects identified and the pre-existing houses selected by the families. For that, it carried out the following studies:
■ Of deeds, to ensure there were no legal issues or claims (mortgages, seizures, inheritances, etc.);
■ Of the structural quality of houses, to ensure they were safe and habitable. The building permits were reviewed and the District Planning Secretariat was consulted regarding hazard and risk factors. Additionally, in situ inspections were made;
■ Of urban development, to verify compliance with rules and, in particular, compatibility with the land-use management plan and regulations issued by the Zonal Planning Unit (UPZ), as well as the availability of public utilities;
■ Of available social services (education and health), recreational infrastructure and transportation;
■ Of land use regulations, to ensure that households engaged in businesses could continue to operate them in the houses and neighborhoods where they would be resettled.
House constructionGiven the shortage of new and pre-existing houses in the range that the beneficiaries could afford, the CVP promoted the development of two housing projects: El Caracol (402 houses measuring 38.56m2) and Arbori-zadora Alta (98 houses of 42m2). These houses can be enlarged under a building permit valid for two years. These urban development areas have community facili-ties (kindergartens, community meeting rooms, parks, sports grounds), access to schools and health centers, and public transportation.
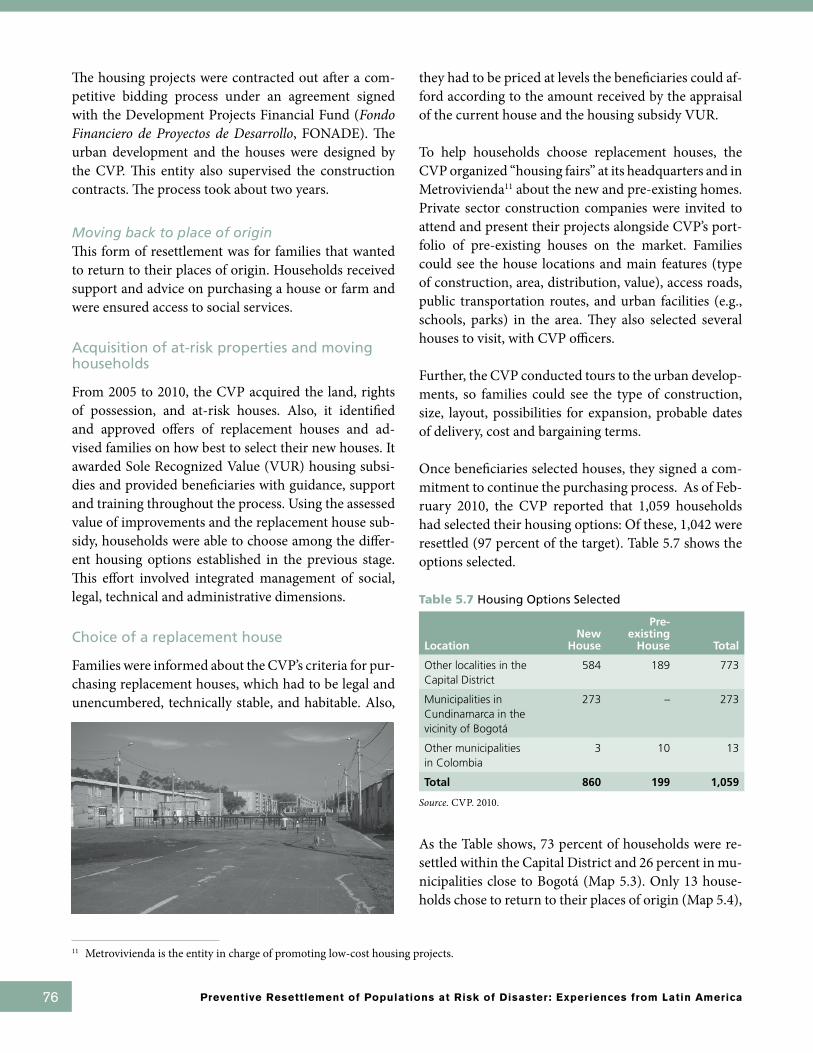
76 Preventive Resettlement of Populations at Risk of Disaster: Experiences from Latin America
The housing projects were contracted out after a com-petitive bidding process under an agreement signed with the Development Projects Financial Fund (Fondo Financiero de Proyectos de Desarrollo, FONADE). The urban development and the houses were designed by the CVP. This entity also supervised the construction contracts. The process took about two years.
Moving back to place of origin This form of resettlement was for families that wanted to return to their places of origin. Households received support and advice on purchasing a house or farm and were ensured access to social services.
Acquisition of at-risk properties and moving households
From 2005 to 2010, the CVP acquired the land, rights of possession, and at-risk houses. Also, it identified and approved offers of replacement houses and ad-vised families on how best to select their new houses. It awarded Sole Recognized Value (VUR) housing subsi-dies and provided beneficiaries with guidance, support and training throughout the process. Using the assessed value of improvements and the replacement house sub-sidy, households were able to choose among the differ-ent housing options established in the previous stage. This effort involved integrated management of social, legal, technical and administrative dimensions.
Choice of a replacement house
Families were informed about the CVP’s criteria for pur-chasing replacement houses, which had to be legal and unencumbered, technically stable, and habitable. Also,
they had to be priced at levels the beneficiaries could af-ford according to the amount received by the appraisal of the current house and the housing subsidy VUR.
To help households choose replacement houses, the CVP organized “housing fairs” at its headquarters and in Metrovivienda11 about the new and pre-existing homes. Private sector construction companies were invited to attend and present their projects alongside CVP’s port-folio of pre-existing houses on the market. Families could see the house locations and main features (type of construction, area, distribution, value), access roads, public transportation routes, and urban facilities (e.g., schools, parks) in the area. They also selected several houses to visit, with CVP officers.
Further, the CVP conducted tours to the urban develop-ments, so families could see the type of construction, size, layout, possibilities for expansion, probable dates of delivery, cost and bargaining terms.
Once beneficiaries selected houses, they signed a com-mitment to continue the purchasing process. As of Feb-ruary 2010, the CVP reported that 1,059 households had selected their housing options: Of these, 1,042 were resettled (97 percent of the target). Table 5.7 shows the options selected.
Table 5.7 Housing Options Selected
LocationNew
House
Pre-existing
House Total
Other localities in the Capital District
584 189 773
Municipalities in Cundinamarca in the vicinity of Bogotá
273 – 273
Other municipalities in Colombia
3 10 13
Total 860 199 1,059
Source. CVP. 2010.
As the Table shows, 73 percent of households were re-settled within the Capital District and 26 percent in mu-nicipalities close to Bogotá (Map 5.3). Only 13 house-holds chose to return to their places of origin (Map 5.4),
11 Metrovivienda is the entity in charge of promoting low-cost housing projects.

77Chapter 5 Nueva Esperanza: A Resettlement Case with Risk Management and Land Use Planning Approach | Colombia |
in municipalities in the Andean, Caribbean, Orinoquia and Pacific regions. A large majority (81 percent) opted for a new house.
Map 5.3. Geographical Location of Houses Chosen in other Departments
When beneficiaries bought new and pre-existing houses from private construction companies, the CVP trans-ferred the money directly to the sellers after receiving authorization from the household. This course reduced the risk that funds might have been mis-used or that beneficiaries would be defrauded.
Legal titles to the new houses
All households received deeds to their new houses and thus became legal property owners. The deeds state the houses are family property and not just that of the male head of household, which protects the rights of women and children and safeguards the property in the event a household head becomes insolvent or goes bankrupt. The designation also means the head of household may not sell the house, and only a family law judge may lift that restriction.
Moving to replacement house
The team of professionals prepared the families well in advance, helping them organize the moves and cov-er the costs. Once legal documents were completed, households moved to their new houses, where they were met by CVP professionals. The beneficiaries then signed documents which certified they received their houses, and the condition and utilities of the houses at the time. The new owners also received an Owners’ Manual containing the housing unit’s technical specifi-cations, a copy of the building permit, the unit’s design plans, a description of the types of maintenance needed, and rules governing the use of private and public areas.
Map 5.4. Geographical Location of Houses Chosen in Bogotá’s Localities
Source. CVP Data Bases 2008.
Source. CVP Data Bases 2008.
78 Preventive Resettlement of Populations at Risk of Disaster: Experiences from Latin America
Preparing for the resettlement
During the process, the CVP performed various ac-tivities to help households resettle. These included preparing family life plans—in which the beneficiaries described their current living conditions, actions and commitments for resettlement, enrollment of children in schools, and preparations for buying their replace-ment houses. Further, since most replacement houses could be expanded or improved, the CVP provided training on different types of construction, along with information on procedures to obtain building permits.
Using the services of the local hospital and under the umbrella of the basic sanitation and urban agriculture project, the Health Secretariat offered day courses on environmental sanitation, food security, household hy-giene, safe water, urban agriculture and family vegetable gardens and orchards.
Environmental education
In coordination with DPAE, the District Environment Secretariat (Secretaría Distrital de Ambiente) carried out a pilot project for vulnerable segments of the population in nueva Esperanza to instruct them to serve as environ-mental lookouts in the high-risk zone and surrounding areas. A total of 135 people, from both the population to be resettled and other neighbors, were selected, trained in risk prevention and mitigation, and environmental restoration, and certified. They included female heads of households, people displaced by armed conflict, the unemployed, and parents of families with numerous children, who were paid for attending the courses and for the activities they performed, and still work in the area. Also, workshops and activities were also held on other environmental topics and reforestation days were held for children.
Peaceful co-existence
The CVP organized one-day “peaceful co-existence” courses, which established rules of behavior for relating to neighbors and the community, and for managing public and private areas. The guidelines for harmonious living are regarded as essential for preparing families for resettlement and evolve into useful tools for helping house-holds integrate with the city and new neighborhood.
Restoring social services
The CVP coordinated with the Education Secretariat (Secretaría de Educación) about the enrollment of re-settled children in their new neighborhood schools. Disabled children were enrolled in special schools. Further, the population was cross-checked against the identification/classification System for Potential Ben-eficiaries of Social Programs (Sistema de Identificación y Clasificación de Potenciales Beneficiarios para Progra-mas Sociales, SISBEN) when the resettlement activities were prepared, and children under four, along with the disabled and elderly, were included in the District’s so-cial programs.
8. Rehabilitation and Restoration of High-risk Lots
The goals of the rehabilitation plan were to restore envi-ronmentally friendly conditions on the at-risk land and generate effective controls over new attempts to occupy lots. The plan involved incorporating the lots into the Entre Nubes District Ecological Park (PEDEN), one of the city’s ecological structures.
Once the resettled families turned over their original properties and signed documents to this effect, the CVP referred the records to DPAE, which handled the demar-cation and rehabilitation, and to the local mayor’s office, to ensure that controls would be in place to prevent new settlements. According to the CVP’s report on the status of 1,197 properties, 1,170 were demolished and the land restored, as of March 2010. The environmental lookouts participated in the work.
The process involved fencing off the areas, demolishing houses, collecting debris (1,014 tons of solid waste were collected during this time), preparing the soil for plant-ing trees and shrubs (12,643 trees and 952 plants), re-storing the surface soil on slopes, and recovering 5,583 meters of rainwater and sewage.
9. Post-resettlement Stage
The post-resettlement stage, managed by the CVP, was aimed at monitoring and following up the resettled population, ensuring that good quality of life conditions

79Chapter 5 Nueva Esperanza: A Resettlement Case with Risk Management and Land Use Planning Approach | Colombia |
were maintained. The teams of professionals coordinat-ed with other entities to provide education and training programs and encourage beneficiaries to use utilities ef-ficiently, pay the bills punctually, progressively develop their houses, improve their management skills, and as-sume responsibility for looking after their houses and public spaces. They also ensured the resettled families were effectively connected with the basic social services network (health care, education, welfare and income-generating projects).
The CVP established a post-resettlement assistance period to be conducted for 12 months, with the following goals:
■ Boosting self-management capacity for integra-tion into urban life;
■ Enrolling 100 percent of the school-age population in the educational system;
■ Providing 100 percent of the population access to health care;
■ Providing care for 100 percent of the disabled;■ Providing care for 100 percent of the elderly;■ Supporting income-generation projects.
10. Cost
The total investment in the resettlement program and the activities related to restoring the reclaimed land from 2004-2009 was US$17 million. According to the CVP, the average cost of a house, including the so-cial, technical and legal assistance per household, was US$15,121. No estimate was made of education and so-cial integration costs (see Table 5.8).
Table 5.8. Total Cost of Resettlement*
Program Institution
Investment
Cost (US Dollars)
in Millions Source
Resettling households CVP 15.0 Resetlement Directorate, Sub Directorate of Finance and Planning Advisory Office CVP
Improving habitats District Health Secretary
Hospital Rafael Uribe Uribe
0.17 Sanitation Directorate Hospital Rafael Uribe Uribe
Identifying at-risk households FOPAE 0.23 Ecosistems Directorate District Environment Secretariat
Recovering degraded land environmentally
District Department of Environment
0.59 FOPAE Ecosistems Directorate District Environment Secretariat
Recovering degraded land environmentally
Local Development Fund Rafael Uribe Uribe
0.21 Ecosistems Directorate District Environment Secretariat
Improving resettled households’ productive activities
CVP Secretariat of Economic Development IPES
0.84 Ecosistems Directorate District Environment Secretariat
Total cost 17.04
*Cut off date: December 31,2009Source: CVP, 2010
11. Main Challenges
The implementation of a resettlement program is not free from problems and obstacles. Table 5.9 summarizes the main issues, such as the intervention of third par-ties interested in obtaining personal benefits, the fear
of the head of household to provide some information, the lack of legal tools to solve some problems, and prob-lems with host populations. Table 5.9 also shows how the inter-institutional and inter-sectoral actions, as well as the CVP management, were key to overcoming the problems.

80 Preventive Resettlement of Populations at Risk of Disaster: Experiences from Latin America
Table 5.9. Main Challenges and Solutions
Challenges Solutions
Some community leaders opposed DPAE decisions on preventive evacuation and the resettlement process.
Awareness-raising with each household and a standing invitation to leaders and delegates of the three sectors to round- table talks, as well as community meetings.
156 new land occupations in the area, after the 2004 census, which were not eligible for resettlement. Some were the result of lot sales “including the right to resettlement.”
Inter-sectoral monitoring by the District Habitat Secretariat’s Sub-Directorate of Inspection and Surveillance, District Environment Secretariat, DPAE and CVP; proceedings brought by the local mayor’s office.
Installing a zonal security committee, headed by the local mayor and police chief.
Involving the Government Secretariat to persuade families to leave.
Establishing a grassroots housing association.
Legal difficulties in dealing with the new land occupations. Inter-agency and local authorities address the problem.
Difficulty locating households that left by their own means after the DPAE ordered the evacuation.
The CVP posted notices in various offices calling for those families to report and a few appeared.
Reluctance of the population to provide information about origins and income, which made it harder to (a) assess their socio-economic conditions, (b) do the financial analysis for the house purchase and (c) cover the costs of notarizing the deeds to the new houses.
The CVP and households jointly analyzed each household’s income-expenditure structure, by constructing life plans in which family members assumed responsibility for commitments connected to the resettlement and sustainability.
Insufficient supply of housing in the required price range. The CVP promoted construction of two housing projects, with 500 housing units and urban facilities.
Households’ insistence that properties be built on 72 m2 lots (although 76 percent had houses built of recycled material with an average area of 40 m2).
The CVP and households jointly analyzed the advantages of houses in urban districts with the kind of development, social and community facilities they offer.
Some community leaders pressured households to request housing alternatives other than those arranged by the CVP, which delayed the selection process.
Households signed certificates for the housing option they selected.
Pressure from leaders who carried out new land occupations to be included in the resettlement.
Involvement of the local mayor’s office, District Habitat Secretariat, Government Secretariat, and data from prior studies, the census, and aerial photographs.
Authorities offered to evacuate these households and pay one month’s rent; together, the actions were effective in most cases, as were the Government Secretariat’s efforts to persuade families to withdraw voluntarily and establish a grassroots housing association.
Delays in delivering the new houses by the builders, after heavy rain postponed construction;
The CVP supervised construction.
The host population resented the resettled population, believing they were among those demobilized from illegal armed groups;
Meetings in the host communities to inform them of the District’s risk management actions and its project to resettle the at-risk population;
The CVP assured host communities that the households were resettled people, not part of the demobilization process;
Resettled population was blamed for difficulties in achieving peaceful coexistence and security in the areas where they moved.
Manuals on harmonious civic relations were developed, agreements reached, and conflict resolution bodies were created.

81Chapter 5 Nueva Esperanza: A Resettlement Case with Risk Management and Land Use Planning Approach | Colombia |
12. Lessons Learned
Because the resettlement program was still being con-ducted and the nueva Esperanza Rehabilitation, Recon-struction and Sustainable Development Plan will not be completed until 2015, there have not yet been any evalu-ations to compare the different resettlement options or the restoration of socio-economic conditions. However, the case provides important lessons related to:
■ Incorporation of preventive resettlement pro-grams in comprehensive disaster risk- reduction plans, and land-use plans;
■ Participation and coordination of government institutions to respond properly to the multiple resettlement dimensions;
■ Advantages of having an institution that only di-rects the resettlement of at-risk populations;
■ Control of at-risk areas to reduce the number population exposed to natural hazards;
■ Innovative sources of financing of disaster risk-reduction plans;
■ Government subsidies for supporting low-in-come populations to offer access to adequate, safe houses;
■ Community participation in the resettlement process;
■ Promotion of risk-reduction culture in all the processes;
■ Recovery of at-risk areas and their incorporation in the ecological structure of the Capital District.
It is expected that these lessons will help other cities and countries.

82 Preventive Resettlement of Populations at Risk of Disaster: Experiences from Latin America
References
CVP (Caja de la Vivienda Popular). 2008. Consultoría Banco Mundial. Informes de avance del reasenta-miento de hogares de nueva Esperanza. Bogotá. Abril a octubre.
———. 2009 y 2010. Dirección de Reasentamientos Hu-manos. Informe de gestión. Reasentamiento de hogares localizados en zonas de alto riesgo no miti-gable - Sector nueva Esperanza. 22 de febrero de 2009 y 1 y 8 de febrero y 8 de marzo de 2010.
Capitales Andinas 2007. Catálogo de instrumentos en gestión municipal para la reducción de riesgos y preparativos ante emergencias. Bogotá: 15.
Cardona, OD.; et ál. 2004. Definición de la responsabi-lidad del Estado, su exposición ante desastres na-turales y diseños de mecanismos para la cobertura de los riesgos residuales del Estado. Estudio sobre desastres ocurridos en Colombia: estimación de pérdidas y cuantificación de costos. Banco Mun-dial, Agencia Colombiana de Cooperación Inter-nacional, Departamento Nacional de Planeación. Bogotá. Octubre.
DANE (Departamento Administrativo Nacional de Estadística). 2005 Censo 2005. Retrieved from: http://www.dane.gov.co/censo/
Departamento Nacional de Planeación (DNP). 2001. Consejo Nacional de Política Económica y Social (CONPES) Documento 3146 “Estrategia para consolidar la ejecución del plan nacional para la prevención y atención de desastres” (PNPAD) a corto y mediano plazos. Bogotá: DNP, CONPES. 20 diciembre.
ERN Colombia. Estudio sobre desastres ocurridos en Co-lombia. Estimación de pérdidas y cuantificación de costos [Study of disasters in Colombia. Estimated losses and quantification of costs] Chapter 1: pp. 1-106 and pp. 212-217October, 2004.
Montezuna, Ricardo (ed.).1999. Transporte urbano: un desafío en el próximo milenio. Bogotá: Universidad Javeriana.
Programa de las Naciones Unidas para el Desarrollo (PNUD). 2007. Capitales Andinas 2007. Docu-mento regional. Catálogo de instrumentos en gestión municipal para la reducción de riesgos y pre-parativos ante emergencias. La Paz, Bolivia. Abril.
Secretaría Distrital de Ambiente. 2008. Informe al Secre-tario. Dirección de Planeación y Gestión Ambien-tal – Oficina de Ecosistemas Estratégicos. Febrero.
Secretaría Distrital del Hábitat. 2007. Revisión del plan de rehabilitación, reconstrucción y desarrollo sos-tenible postevento de la zona de nueva Esperanza de la localidad Rafael Uribe Uribe. Subdirección de Reasentamientos y Mejoramiento de Vivienda. Septiembre.
———. 2009. Programa de mejoramiento de barrios. Subsecretaría de Coordinación de Operativa Sub-dirección de Barrios. Bogotá 19 de julio.
83Chapter 5 Nueva Esperanza: A Resettlement Case with Risk Management and Land Use Planning Approach | Colombia |
Bibliography
Alcaldía Mayor de Bogotá. 2008. Secretaría Distrital del Hábitat. Lineamientos y marco de política de reasentamiento. Bogotá. Febrero.
———. 2008. Subsecretaría de Inspección, Vigilancia y Control de Vivienda. Informe de control a la ocu-pación ilegal sector de nueva Esperanza. Localidad Rafael Uribe Uribe. Bogotá.
———. 2008. Plan de desarrollo económico, social, am-biental de obras públicas para Bogotá D.C. 2008-2012. Acuerdo de junio.
———. 2008. Oficina de Ecosistemas Estratégicos. In-forme de ejecución de convenio 008 de 2006 y 070 de 2007. Bogotá. Julio, agosto, octubre de 2007, mayo y septiembre de 2008.
Cardona, OD.; Yasmín, LE. 2006. Información sobre el riesgo de desastre, a través del Estudio de casos pi-loto. Estudio nacional de Colombia. Programa de información e indicadores de gestión de riesgos bid, Cepal, idea. Bogotá. Septiembre.
———. 2007. Información para la gestión del riesgo de desastre. Estudio de caso de cinco países. Estudio de caso Colombia. BID - Cepal. Bogotá, Ciudad de Mexico. Diciembre.
Contraloría General de la República. 2005. Prevención y Atención de Desastres. La gestión del riesgo: Re-alidad y perspectivas. Bogotá.
Correa B., Nilson. 2007. Departamento Nacional de Pla-neación. Dirección de Desarrollo Urbano y Políti-ca Ambiental Sostenible. Diagnóstico y análisis de inversiones en gestión del riesgo en Colombia, peri-odo 2002 - 2006 y Esquema de financiamiento para la gestión del riesgo en Colombia. Bogotá.
CVP (Caja de la Vivienda Popular). 2008. Dirección de Reasentamientos Humanos. Plan de reasenta-miento final. Bogotá. Abril.
DANE (Departamento Administrativo Nacional Estadísti-co DANE) 2008. Boletín Censo General 2005 Nece-sidades Básicas Insatisfechas. Bogotá, Diciembre
DNP – ACCI. 2005. Lineamientos de la política de reasentamiento de población afectada por proyec-tos de desarrollo, de protección ambiental y de pre-vención de desastres en Colombia. Estado del arte documento síntesis (Libro I, Anexo 2). Preparado por Desarrollo a Escala Humana. Proyecto reduc-ción de la vulnerabilidad fiscal del estado ante de-sastres naturales – Bogotá
DNP (Departamento Nacional de Planeación). 2004. Estudios y diseños de intervención física para re-cuperar y evitar la ocupación de la zona de alta amenaza en el desarrollo nueva Esperanza, de la localidad de Rafael Uribe, en la ciudad de Bogotá D.C. Reducción de la vulnerabilidad del estado ante desastres naturales. The World Bank, DNP, Geoc-ing Ltda. Bogotá. Noviembre.
———. 2007. Diagnóstico y evaluación de la Dirección de Gestión del Riesgo para la Prevención y Aten-ción de Desastres. En relación con el sistema na-cional de prevención y atención de desastres (Sin-pad). Vargas, Carlos. Bogotá
Lavell, A.; Franco, E. 1996. El sistema para la prevención y atención de desastres en Colombia. En: Estado, sociedad y gestión de los desastres en América La-tina. La Red, Red de Estudios Sociales en Preven-ción de Desastres en América Latina.
Secretaría Distrital de Ambiente. 2009. Informe de gestión 2008. Comisión Distrital para la Preven-ción y Litigación de Incendios Forestales. Con-solidado de eventos atendidos en Bogotá durante los años 1995 a 2008. Bogotá. Marzo.

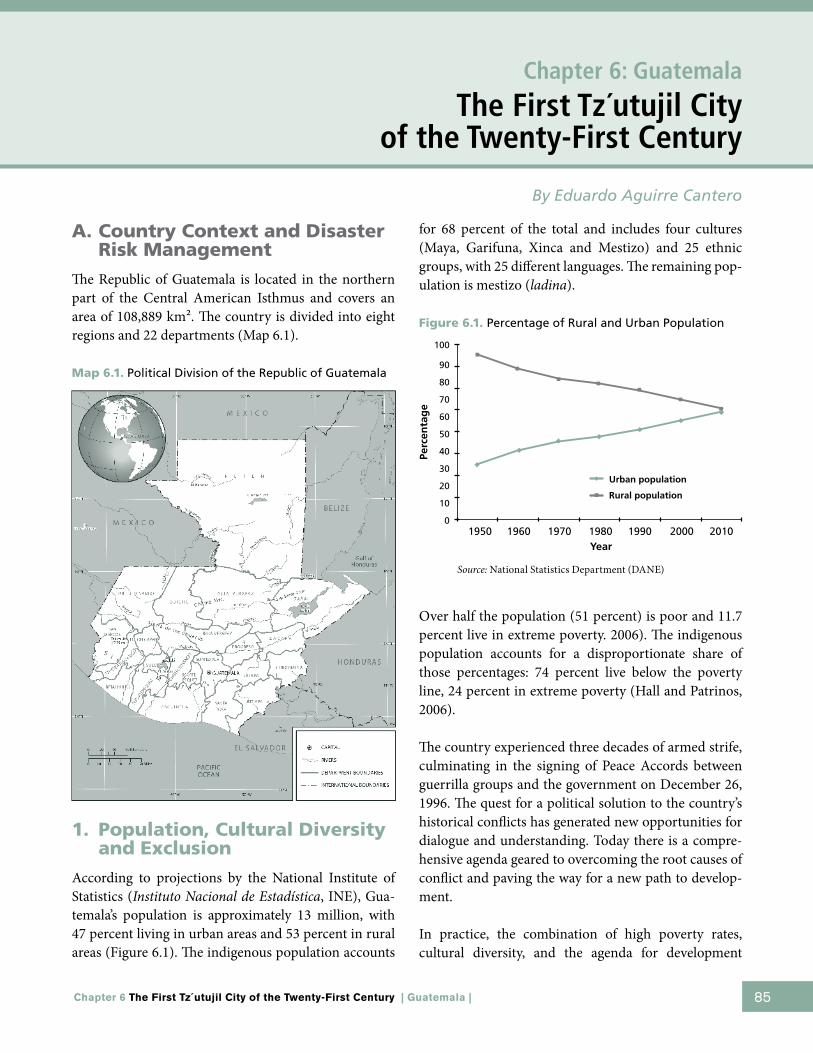
85Chapter 6 The First Tz´utujil City of the Twenty-First Century | Guatemala |
A. Country Context and Disaster Risk Management
The Republic of Guatemala is located in the northern part of the Central American Isthmus and covers an area of 108,889 km². The country is divided into eight regions and 22 departments (Map 6.1).
Map 6.1. Political Division of the Republic of Guatemala
1. Population, Cultural Diversity and Exclusion
According to projections by the National Institute of Statistics (Instituto nacional de Estadística, INE), Gua-temala’s population is approximately 13 million, with 47 percent living in urban areas and 53 percent in rural areas (Figure 6.1). The indigenous population accounts
for 68 percent of the total and includes four cultures (Maya, Garifuna, Xinca and Mestizo) and 25 ethnic groups, with 25 different languages. The remaining pop-ulation is mestizo (ladina).
Figure 6.1. Percentage of Rural and Urban Population
Over half the population (51 percent) is poor and 11.7 percent live in extreme poverty. 2006). The indigenous population accounts for a disproportionate share of those percentages: 74 percent live below the poverty line, 24 percent in extreme poverty (Hall and Patrinos, 2006).
The country experienced three decades of armed strife, culminating in the signing of Peace Accords between guerrilla groups and the government on December 26, 1996. The quest for a political solution to the country’s historical conflicts has generated new opportunities for dialogue and understanding. Today there is a compre-hensive agenda geared to overcoming the root causes of conflict and paving the way for a new path to develop-ment.
In practice, the combination of high poverty rates, cultural diversity, and the agenda for development
Chapter 6: Guatemala
The First Tz´utujil City of the Twenty-First Century
By Eduardo Aguirre Cantero
Source: National Statistics Department (DANE)
100
90
80
70
60
50
40
30
20
10
0
Perc
enta
ge
1950 1970 19901960 1980 2000 2010Year
Urban population
Rural population
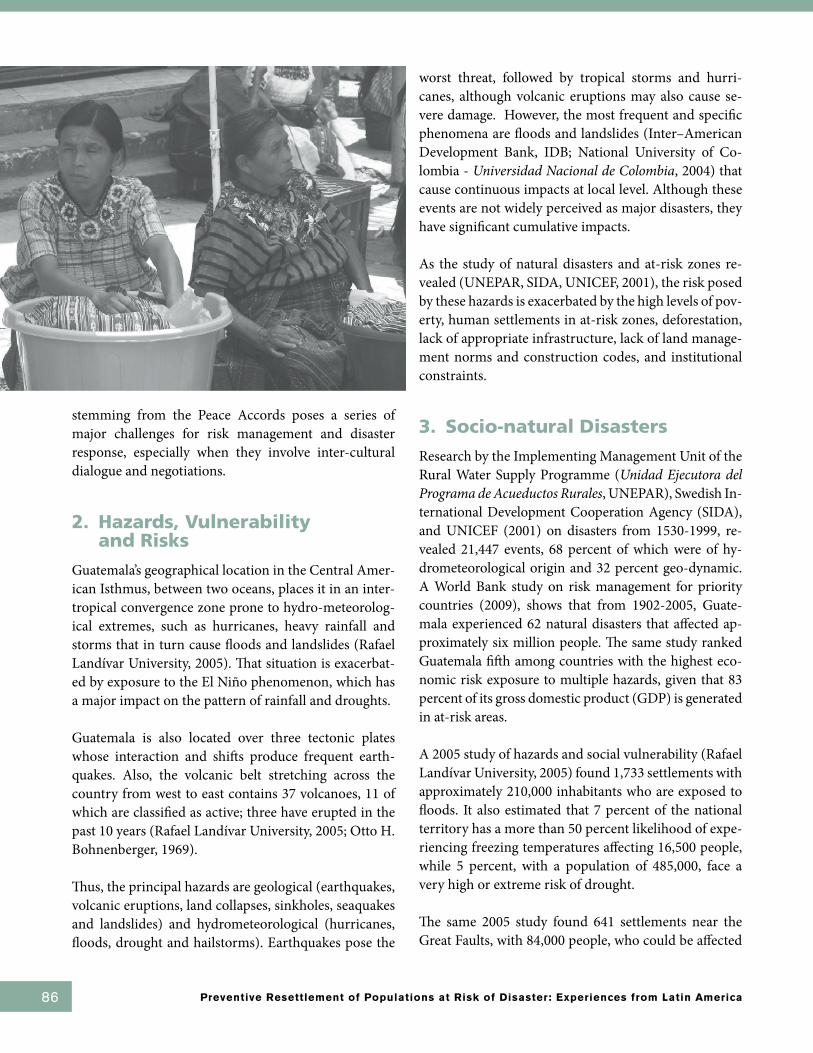
86 Preventive Resettlement of Populations at Risk of Disaster: Experiences from Latin America
stemming from the Peace Accords poses a series of major challenges for risk management and disaster response, especially when they involve inter-cultural dialogue and negotiations.
2. Hazards, Vulnerability and Risks
Guatemala’s geographical location in the Central Amer-ican Isthmus, between two oceans, places it in an inter-tropical convergence zone prone to hydro-meteorolog-ical extremes, such as hurricanes, heavy rainfall and storms that in turn cause floods and landslides (Rafael Landívar University, 2005). That situation is exacerbat-ed by exposure to the El Niño phenomenon, which has a major impact on the pattern of rainfall and droughts.
Guatemala is also located over three tectonic plates whose interaction and shifts produce frequent earth-quakes. Also, the volcanic belt stretching across the country from west to east contains 37 volcanoes, 11 of which are classified as active; three have erupted in the past 10 years (Rafael Landívar University, 2005; Otto H. Bohnenberger, 1969).
Thus, the principal hazards are geological (earthquakes, volcanic eruptions, land collapses, sinkholes, seaquakes and landslides) and hydrometeorological (hurricanes, floods, drought and hailstorms). Earthquakes pose the
worst threat, followed by tropical storms and hurri-canes, although volcanic eruptions may also cause se-vere damage. However, the most frequent and specific phenomena are floods and landslides (Inter–American Development Bank, IDB; National University of Co-lombia - Universidad nacional de Colombia, 2004) that cause continuous impacts at local level. Although these events are not widely perceived as major disasters, they have significant cumulative impacts.
As the study of natural disasters and at-risk zones re-vealed (UNEPAR, SIDA, UNICEF, 2001), the risk posed by these hazards is exacerbated by the high levels of pov-erty, human settlements in at-risk zones, deforestation, lack of appropriate infrastructure, lack of land manage-ment norms and construction codes, and institutional constraints.
3. Socio-natural Disasters
Research by the Implementing Management Unit of the Rural Water Supply Programme (Unidad Ejecutora del Programa de Acueductos Rurales, UNEPAR), Swedish In-ternational Development Cooperation Agency (SIDA), and UNICEF (2001) on disasters from 1530-1999, re-vealed 21,447 events, 68 percent of which were of hy-drometeorological origin and 32 percent geo-dynamic. A World Bank study on risk management for priority countries (2009), shows that from 1902-2005, Guate-mala experienced 62 natural disasters that affected ap-proximately six million people. The same study ranked Guatemala fifth among countries with the highest eco-nomic risk exposure to multiple hazards, given that 83 percent of its gross domestic product (GDP) is generated in at-risk areas.
A 2005 study of hazards and social vulnerability (Rafael Landívar University, 2005) found 1,733 settlements with approximately 210,000 inhabitants who are exposed to floods. It also estimated that 7 percent of the national territory has a more than 50 percent likelihood of expe-riencing freezing temperatures affecting 16,500 people, while 5 percent, with a population of 485,000, face a very high or extreme risk of drought.
The same 2005 study found 641 settlements near the Great Faults, with 84,000 people, who could be affected
87Chapter 6 The First Tz´utujil City of the Twenty-First Century | Guatemala |
4. Risk Management
The Guatemalan authorities’ concern with regard to vul-nerability and procedures for mitigating the impact of disasters increased in the wake of the three mentioned above. However, the response models differed in each case due to historical and other special circumstances.
In the 1970s, management typically consisted of deci-sions taken in a vertical chain of command involving the military, with no participation by the population (with respect to the 1976 earthquake). Toward the end of the 20th Century, the response to Hurricane Mitch focused on reconstructing physical infrastructure, but still with-in a vertical decision-making process. The private sector participated but the community did not. Finally, in the first decade of the 21st Century, the current model of reconstruction with transformation was developed. This model not only allowed society to participate in deci-sion making with a cultural and gender perspective, but also emphasized reconstruction of the social fabric, re-spect for human rights, the incorporation of risk man-agement into sustainable development, and application of the subsidiary-with-solidarity principle.
The historical transformations in Guatemalan society and the cumulative effect of the disasters fostered a lon-ger-term vision of risk prevention and management and
helped strengthen the country’s legal and institutional framework in those areas. Although much remains to be done, the basis for a sound and strategic approach to risk management has been laid.
4.1 Hazard and Vulnerability Studies
A critical factor for disaster risk management was the inadequate understanding of the natural and social dy-namics that generate hazards. To overcome that short-coming, since the end of the 1990s (post Hurricane Mitch), several studies were conducted. The most nota-ble were a 2001 review carried out with United Nations support on disasters and at-risk zones, and a 2005 study on social and environmental vulnerability, by the Insti-tute of Agriculture, Natural Resources and Environment of the Environmental and Agricultural Sciences Faculty of the Rafael Landívar University, which lists the major steps needed to reduce vulnerability.
In 2004, with Inter-American Development Bank sup-port, Guatemala began applying the risk management indicators system, which made it possible to gauge the country’s vulnerability and risk and, on that basis, iden-tify effective risk-management measures that consid-ered macro-economic, social, institutional and techni-cal factors.
in the event of an earthquake (due to movements of the tectonic plates). In the 20th century, there have been 12 earthquakes, an average of one every eight years (IDB – Universidad Nacional de Colombia, 2004).
Of the various disasters the country has experienced, those with the severest social and economic impacts
were the 1976 earthquake, which killed 23,000 people and caused damage estimated at 17.9 percent of the GDP; Hurricane Mitch in 1998, which killed 268 and caused a 4.7 percent decline in GDP; and Tropical Storm Stan in 2005, which affected 27 percent of the popula-tion. Table 6.1 summarizes the impact of those events.
Table 6.1. Record of High-impact Natural Disasters until 2008
Recent disasters Date Number of People Killed
Number of People Affected
Economic Losses (US$ Million)
Earthquake February 1976 23,000 375,000 1 200
Hurricane Mitch November 1998 268 743,000 876
Tropical Storm Stan October 2005 669 3,500,000 983
Source:- Earthquake in 1976: US Agency for International Development (USAID), 1978. “Disaster relief case report: Guatemala – earthquake February 1976”,
Washington.- Hurricane Mitch: IDB. 2002. Central America after Hurricane Mitch. The Challenge of Turning a Disaster into an Opportunity. In: www.iadb.org- Tropical Storm Stan: USAID. 2006. Response to the Stan Disaster.
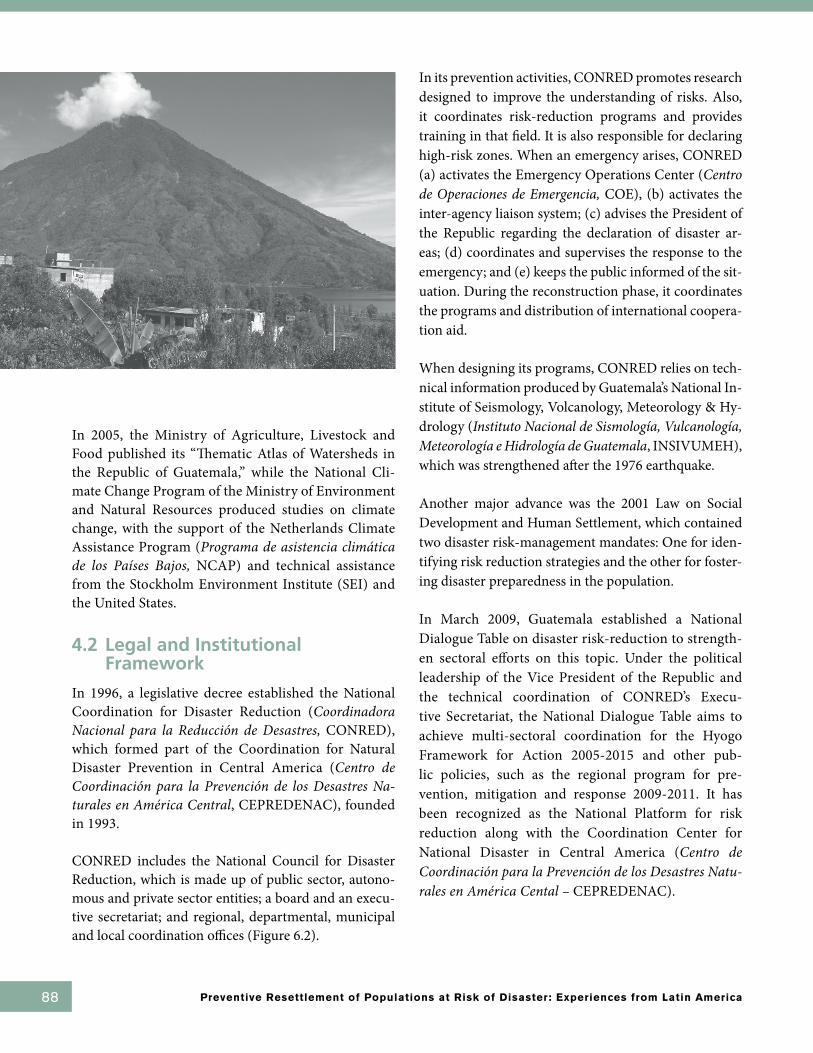
88 Preventive Resettlement of Populations at Risk of Disaster: Experiences from Latin America
In 2005, the Ministry of Agriculture, Livestock and Food published its “Thematic Atlas of Watersheds in the Republic of Guatemala,” while the National Cli-mate Change Program of the Ministry of Environment and Natural Resources produced studies on climate change, with the support of the Netherlands Climate Assistance Program (Programa de asistencia climática de los Países Bajos, NCAP) and technical assistance from the Stockholm Environment Institute (SEI) and the United States.
4.2 Legal and Institutional Framework
In 1996, a legislative decree established the National Coordination for Disaster Reduction (Coordinadora nacional para la Reducción de Desastres, CONRED), which formed part of the Coordination for Natural Disaster Prevention in Central America (Centro de Coordinación para la Prevención de los Desastres na-turales en América Central, CEPREDENAC), founded in 1993.
CONRED includes the National Council for Disaster Reduction, which is made up of public sector, autono-mous and private sector entities; a board and an execu-tive secretariat; and regional, departmental, municipal and local coordination offices (Figure 6.2).
In its prevention activities, CONRED promotes research designed to improve the understanding of risks. Also, it coordinates risk-reduction programs and provides training in that field. It is also responsible for declaring high-risk zones. When an emergency arises, CONRED (a) activates the Emergency Operations Center (Centro de Operaciones de Emergencia, COE), (b) activates the inter-agency liaison system; (c) advises the President of the Republic regarding the declaration of disaster ar-eas; (d) coordinates and supervises the response to the emergency; and (e) keeps the public informed of the sit-uation. During the reconstruction phase, it coordinates the programs and distribution of international coopera-tion aid.
When designing its programs, CONRED relies on tech-nical information produced by Guatemala’s National In-stitute of Seismology, Volcanology, Meteorology & Hy-drology (Instituto nacional de Sismología, Vulcanología, Meteorología e Hidrología de Guatemala, INSIVUMEH), which was strengthened after the 1976 earthquake.
Another major advance was the 2001 Law on Social Development and Human Settlement, which contained two disaster risk-management mandates: One for iden-tifying risk reduction strategies and the other for foster-ing disaster preparedness in the population.
In March 2009, Guatemala established a National Dialogue Table on disaster risk-reduction to strength-en sectoral efforts on this topic. Under the political leadership of the Vice President of the Republic and the technical coordination of CONRED’s Execu-tive Secretariat, the National Dialogue Table aims to achieve multi-sectoral coordination for the Hyogo Framework for Action 2005-2015 and other pub-lic policies, such as the regional program for pre-vention, mitigation and response 2009-2011. It has been recognized as the National Platform for risk reduction along with the Coordination Center for National Disaster in Central America (Centro de Coordinación para la Prevención de los Desastres natu-rales en América Cental – CEPREDENAC).
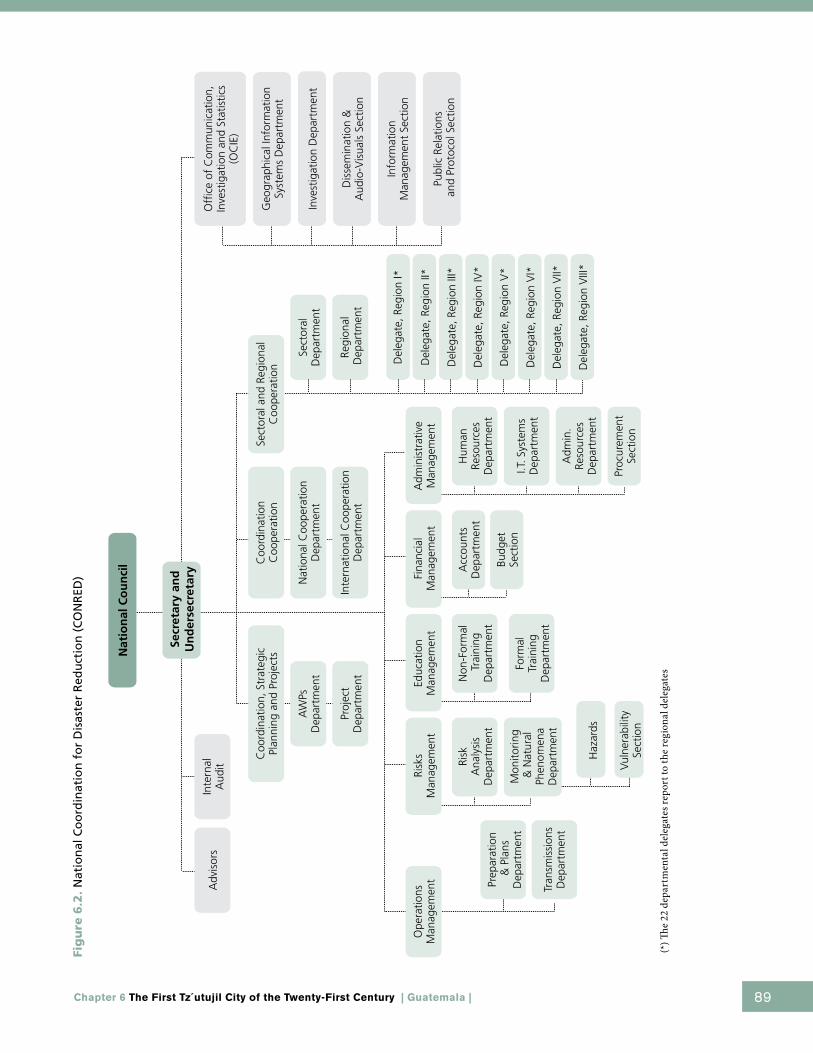
89Chapter 6 The First Tz´utujil City of the Twenty-First Century | Guatemala |
(*) Th
e 22
dep
artm
enta
l del
egat
es re
port
to th
e re
gion
al d
eleg
ates
Fig
ure
6.2
. N
atio
nal
Co
ord
inat
ion
fo
r D
isas
ter
Red
uct
ion
(C
ON
RED
)
Nat
ion
al C
ou
nci
l
Adv
isor
s
Ope
ratio
ns
Man
agem
ent
Coo
rdin
atio
n, S
trat
egic
Pl
anni
ng a
nd P
roje
cts
AW
Ps
Dep
artm
ent
Nat
iona
l Coo
pera
tion
Dep
artm
ent
Proj
ect
Dep
artm
ent
Risk
s M
anag
emen
tEd
ucat
ion
Man
agem
ent
Fina
ncia
l M
anag
emen
t
Acc
ount
sD
epar
tmen
tN
on-F
orm
al T
rain
ing
Dep
artm
ent
Risk
A
naly
sis
Dep
artm
ent
Prep
arat
ion
& P
lans
Dep
artm
ent
Tran
smis
sion
s D
epar
tmen
t
Mon
itorin
g &
Nat
ural
Ph
enom
ena
Dep
artm
ent
Budg
et
Sect
ion
Form
al
Trai
ning
D
epar
tmen
t
Haz
ards
Vul
nera
bilit
ySe
ctio
n
Adm
inis
trat
ive
Man
agem
ent
Hum
an
Reso
urce
s D
epar
tmen
t
I.T. S
yste
ms
Dep
artm
ent
Adm
in.
Reso
urce
s D
epar
tmen
t
Proc
urem
ent
Sect
ion
Inte
rnat
iona
l Coo
pera
tion
Dep
artm
ent
Coo
rdin
atio
n C
oope
ratio
n
Offi
ce o
f C
omm
unic
atio
n,
Inve
stig
atio
n an
d St
atis
tics
(OC
IE)
Geo
grap
hica
l Inf
orm
atio
n Sy
stem
s D
epar
tmen
t
Inve
stig
atio
n D
epar
tmen
t
Dis
sem
inat
ion
&
Aud
io-V
isua
ls S
ectio
n
Info
rmat
ion
Man
agem
ent
Sect
ion
Publ
ic R
elat
ions
and
Pro
toco
l Sec
tion
Sect
oral
and
Reg
iona
l C
oope
ratio
n
Sect
oral
D
epar
tmen
t
Regi
onal
Dep
artm
ent
Del
egat
e, R
egio
n I*
Del
egat
e, R
egio
n V
*
Del
egat
e, R
egio
n III
*
Del
egat
e, R
egio
n V
II*
Del
egat
e, R
egio
n II*
Del
egat
e, R
egio
n V
I*
Del
egat
e, R
egio
n IV
*
Del
egat
e, R
egio
n V
III*
Inte
rnal
A
udit
Secr
etar
y an
d
Un
der
secr
etar
y
90 Preventive Resettlement of Populations at Risk of Disaster: Experiences from Latin America
4.3 Disaster Risk Management Model
The overall CONRED’s strategy for disaster risk reduction focuses on operations and the programs, such as the National Response Plan, the Inter-Agency Liaison System, the Emergency Operations Center (COE), the Information Management System in the Event of Disasters (Sistema de manejo de la información en caso de desastre, SISMICEDE), the National Operations Manual and the Integrated Emergency Management System (Sistema Integrado de Manejo de EMERGEnCIA, SIME).
The strategy also incorporates risk management in Strategic Land use Planning (Planificación Estratégica Territorial, PET) prepared by the Secretariat for Planning of the Office of the President (Secretaría de Planificación y Programación de la Presidencia, SEGEPLAN), and strengthens local coordination in high-risk areas through CEPREDENAC and the CONRED Executive Secretariat (Secretaría Ejecutiva de la CONRED, SECONRED).
The adoption of this comprehensive strategy was a radi-cal shift from a model that focused on response and reconstruction to one where prevention plays a key role. The new model also supersedes the civil defense approach by establishing responsibilities in all govern-mental entities, according to their particular functions, to attack the root causes of risk and act across sectors.
The integration of risk prevention in Guatemala’s strate-gic land-use planning and investment programs as part of public administration strategy achieves two major objectives: First, it generates an institutional commit-ment to develop risk-reduction strategies and second, it channels major public investment funds toward efforts to overcome the historical and structural causes of risk.
However, the implementation of this strategy is often limited by financial constraints and, despite efforts to change it, the emergency response approach still pre-dominates. This is why, when events and catastrophes arise, it is necessary to declare a state of emergency and Congress has to approve transfers and generate funds by cutting the budgets of the various ministries and sec-retariats.
B. Case Study: Panabaj and Tz’anchaj – Reconstruction with Transformation
1. Impacts of Tropical Storm Stan
As a result of the national disaster wrought by Tropi-cal Storm Stan on October 5, 2005, the Government de-clared a state of public emergency. The total economic impact was estimated at US$983 million (3.4 percent of 2004 GDP) of which US$400 million involved damage and US$583 million outright losses. Most (59 percent) of the losses were sustained by low-income segments of the population and small-scale producers, with little ability to recover what they lost.
The storm left 17,000 houses either totally destroyed or declared unfit for human habitation. In terms of damage to houses, it was the worst natural disaster the country had experienced, exacerbating the shortage of 1.2 mil-lion homes.
2. Key Challenges
The storm’s impact posed an enormous national chal-lenge with regard to the reconstruction of economic and social infrastructure (roads, bridges, service stations, etc.) and the creation of 80 new urban centers.
In addition, a degree of inter-agency coordination was required that was unprecedented. Also, it was neces-sary to restore trust in the State and institutions, ex-pand community participation, and take the social and cultural characteristics of the population into account. Timely, appropriate, effective and transparent engage-ment was also needed to undo the damage of previous experiences of disillusionment and the lack of credible institutions.
3. Reconstruction with Transformation
To meet the challenges, the President called for “national reconstruction” in November 2005 and presented the broad outlines of the Reconstruction with Transformation model, which adopted a more inclusive stance and prom-ised comprehensive measures within a framework of de-velopment and sustainability. The main features were:
91Chapter 6 The First Tz´utujil City of the Twenty-First Century | Guatemala |
■ Participation by the population in setting priori-ties;
■ Applying the subsidiary-with-solidarity principle; ■ Strengthening democratic governance and legiti-
macy; ■ Strengthening civic values through joint work
and agreements; ■ Involving the private sector through the procure-
ment mechanism;■ Incorporating a cultural and gender perspective; ■ Adopting a new integrated and sustainable rural
development strategy.
When this reconstruction model was adopted, it offered the opportunity to (a) rehabilitate the social fabric, (b) rebuild and strengthen the country’s infrastructure in a way that could avoid reproducing previous risks, (c) en-dow households with better productive infrastructure, and (d) construct the institutional underpinnings for risk management aimed at supporting sustainable hu-man development.
These goals led to the national Reconstruction with Transformation Plan, which has three major compo-nents and three connected themes: (Box 6.1)
Box 6.1. National Reconstruction Plan
Components
■ Physical infrastructure and the management of watersheds
■ Reactivation of productive activities and family income
■ Rehabilitation and strengthening of the social fabric
Cross-cutting Themes
■ Risk management and integrated management of watersheds
■ Transparency and accountability
■ Decentralization
The Office of the National Coordinator for Reconstruc-tion of the Office of the President (Coordinadora nacio-nal de Reconstrucción de la Presidencia de la República) was responsible for creating and implementing the Plan. A National Manager for Reconstruction was appointed, as were departmental managers. The population of the 15 departments affected by Tropical Storm Stan also participated. In each, a Departmental Reconstruction
Commission was established to execute the reconstruc-tion plans.
The crisis forced the government to adopt and encour-age a more dynamic pace than was usually followed. It set up an inter-agency team managed by the National Coordinator for Reconstruction and composed of vari-ous types of professionals—architects, engineers, an-thropologists, economists, journalists, archeologists, sociologists, urban development specialists and envi-ronmentalists—committed to forming 80 new settle-ments in 15 departments to resettle approximately 7,400 families (50,000 people) who were either victims of the disaster or at imminent risk.
Strengthening the social fabric played a decisive part in confidence-building, as it fostered citizen participation; this improved transparency and matched grassroots “demand” with reconstruction “supply.” Specifically, the Plan did the following:
■ Mobilized internal and external solidarity;■ Promoted measures that fostered the population’s
participation in social and productive rehabilita-tion efforts;
■ Boosted communication mechanisms, the quest for points of consensus, and coordination on the work to be done between society and the govern-ment;
■ Included a social and cultural perspective in deci-sion making;
■ Linked the program’s actions with Millennium Development Goals, the Peace Accords, and na-tional development priorities.
Resettlement of the affected and at-risk populations of the Panabaj and Tzanchaj districts in the municipality of Santiago Atitlán illustrates how challenges were faced and how the Reconstruction with Transformation model was applied. This case was selected because of the special factors associated with the building of trust, strengthen-ing the social fabric, retrieving traditions and culture, adopting an environmental approach and creating the potential to develop productive activities—all geared to achieving sustainable development.
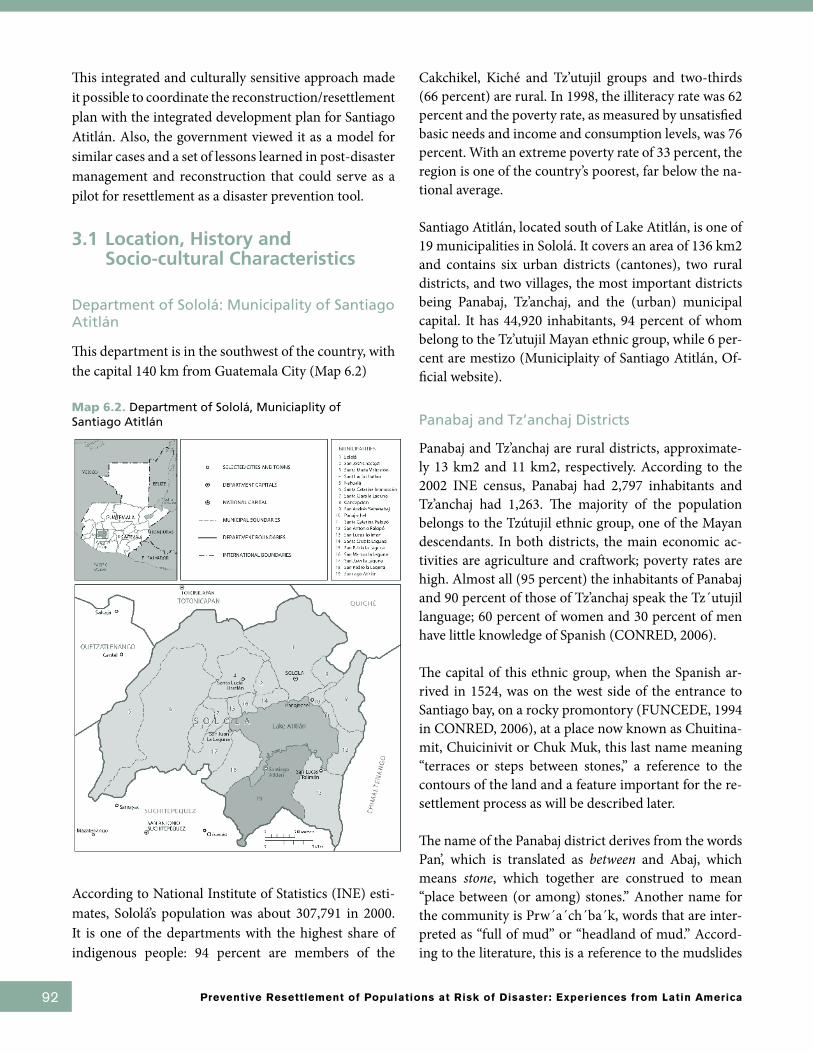
92 Preventive Resettlement of Populations at Risk of Disaster: Experiences from Latin America
This integrated and culturally sensitive approach made it possible to coordinate the reconstruction/resettlement plan with the integrated development plan for Santiago Atitlán. Also, the government viewed it as a model for similar cases and a set of lessons learned in post-disaster management and reconstruction that could serve as a pilot for resettlement as a disaster prevention tool.
3.1 Location, History and Socio-cultural Characteristics
Department of Sololá: Municipality of Santiago Atitlán
This department is in the southwest of the country, with the capital 140 km from Guatemala City (Map 6.2)
According to National Institute of Statistics (INE) esti-mates, Sololá’s population was about 307,791 in 2000. It is one of the departments with the highest share of indigenous people: 94 percent are members of the
Cakchikel, Kiché and Tz’utujil groups and two-thirds (66 percent) are rural. In 1998, the illiteracy rate was 62 percent and the poverty rate, as measured by unsatisfied basic needs and income and consumption levels, was 76 percent. With an extreme poverty rate of 33 percent, the region is one of the country’s poorest, far below the na-tional average.
Santiago Atitlán, located south of Lake Atitlán, is one of 19 municipalities in Sololá. It covers an area of 136 km2 and contains six urban districts (cantones), two rural districts, and two villages, the most important districts being Panabaj, Tz’anchaj, and the (urban) municipal capital. It has 44,920 inhabitants, 94 percent of whom belong to the Tz’utujil Mayan ethnic group, while 6 per-cent are mestizo (Municiplaity of Santiago Atitlán, Of-ficial website).
Panabaj and Tz’anchaj Districts
Panabaj and Tz’anchaj are rural districts, approximate-ly 13 km2 and 11 km2, respectively. According to the 2002 INE census, Panabaj had 2,797 inhabitants and Tz’anchaj had 1,263. The majority of the population belongs to the Tzútujil ethnic group, one of the Mayan descendants. In both districts, the main economic ac-tivities are agriculture and craftwork; poverty rates are high. Almost all (95 percent) the inhabitants of Panabaj and 90 percent of those of Tz’anchaj speak the Tz´utujil language; 60 percent of women and 30 percent of men have little knowledge of Spanish (CONRED, 2006).
The capital of this ethnic group, when the Spanish ar-rived in 1524, was on the west side of the entrance to Santiago bay, on a rocky promontory (FUNCEDE, 1994 in CONRED, 2006), at a place now known as Chuitina-mit, Chuicinivit or Chuk Muk, this last name meaning “terraces or steps between stones,” a reference to the contours of the land and a feature important for the re-settlement process as will be described later.
The name of the Panabaj district derives from the words Pan’, which is translated as between and Abaj, which means stone, which together are construed to mean “place between (or among) stones.” Another name for the community is Prw´a´ch´ba´k, words that are inter-preted as “full of mud” or “headland of mud.” Accord-ing to the literature, this is a reference to the mudslides
Map 6.2. Department of Sololá, Municiaplity of Santiago Atitlán
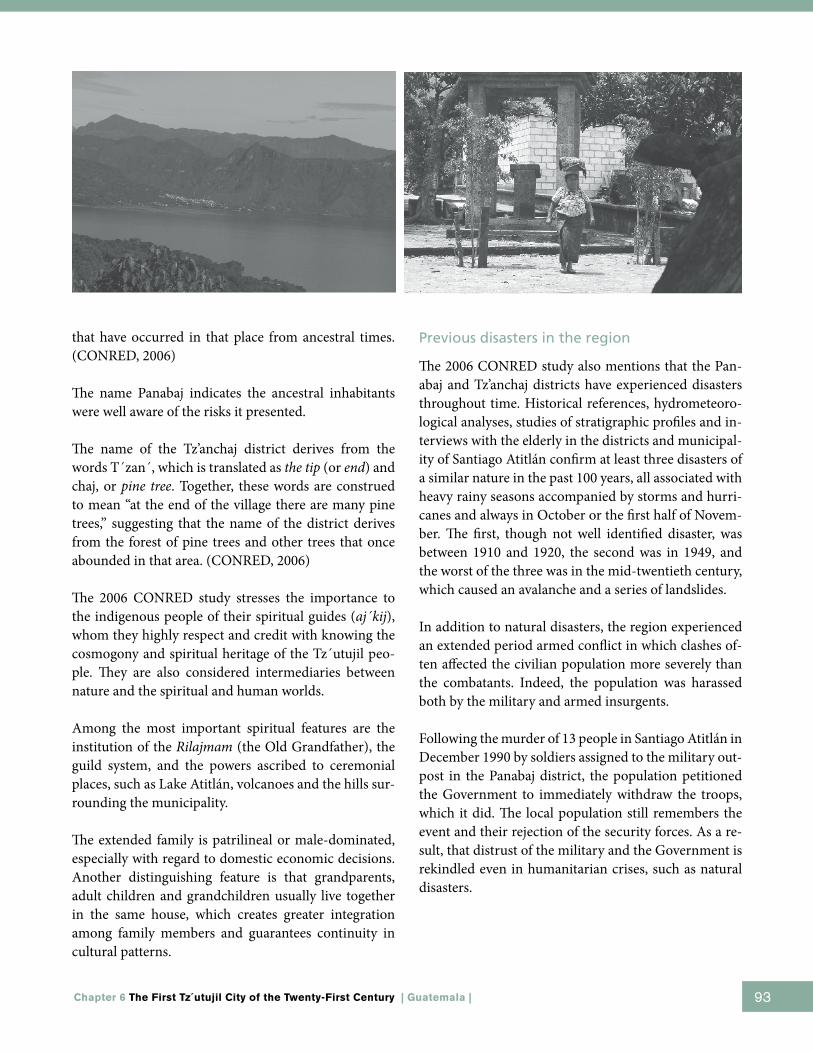
93Chapter 6 The First Tz´utujil City of the Twenty-First Century | Guatemala |
that have occurred in that place from ancestral times. (CONRED, 2006)
The name Panabaj indicates the ancestral inhabitants were well aware of the risks it presented.
The name of the Tz’anchaj district derives from the words T´zan´, which is translated as the tip (or end) and chaj, or pine tree. Together, these words are construed to mean “at the end of the village there are many pine trees,” suggesting that the name of the district derives from the forest of pine trees and other trees that once abounded in that area. (CONRED, 2006)
The 2006 CONRED study stresses the importance to the indigenous people of their spiritual guides (aj´kij), whom they highly respect and credit with knowing the cosmogony and spiritual heritage of the Tz´utujil peo-ple. They are also considered intermediaries between nature and the spiritual and human worlds.
Among the most important spiritual features are the institution of the Rilajmam (the Old Grandfather), the guild system, and the powers ascribed to ceremonial places, such as Lake Atitlán, volcanoes and the hills sur-rounding the municipality.
The extended family is patrilineal or male-dominated, especially with regard to domestic economic decisions. Another distinguishing feature is that grandparents, adult children and grandchildren usually live together in the same house, which creates greater integration among family members and guarantees continuity in cultural patterns.
Previous disasters in the region
The 2006 CONRED study also mentions that the Pan-abaj and Tz’anchaj districts have experienced disasters throughout time. Historical references, hydrometeoro-logical analyses, studies of stratigraphic profiles and in-terviews with the elderly in the districts and municipal-ity of Santiago Atitlán confirm at least three disasters of a similar nature in the past 100 years, all associated with heavy rainy seasons accompanied by storms and hurri-canes and always in October or the first half of Novem-ber. The first, though not well identified disaster, was between 1910 and 1920, the second was in 1949, and the worst of the three was in the mid-twentieth century, which caused an avalanche and a series of landslides.
In addition to natural disasters, the region experienced an extended period armed conflict in which clashes of-ten affected the civilian population more severely than the combatants. Indeed, the population was harassed both by the military and armed insurgents.
Following the murder of 13 people in Santiago Atitlán in December 1990 by soldiers assigned to the military out-post in the Panabaj district, the population petitioned the Government to immediately withdraw the troops, which it did. The local population still remembers the event and their rejection of the security forces. As a re-sult, that distrust of the military and the Government is rekindled even in humanitarian crises, such as natural disasters.
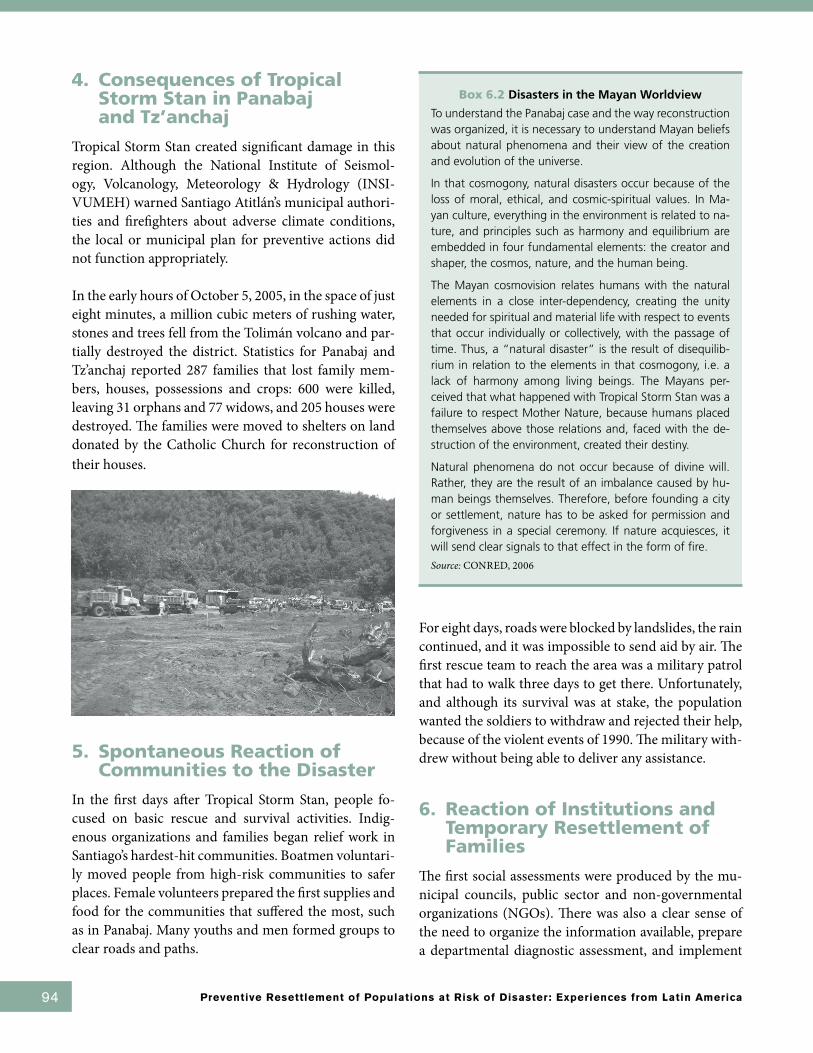
94 Preventive Resettlement of Populations at Risk of Disaster: Experiences from Latin America
4. Consequences of Tropical Storm Stan in Panabaj and Tz’anchaj
Tropical Storm Stan created significant damage in this region. Although the National Institute of Seismol-ogy, Volcanology, Meteorology & Hydrology (INSI-VUMEH) warned Santiago Atitlán’s municipal authori-ties and firefighters about adverse climate conditions, the local or municipal plan for preventive actions did not function appropriately.
In the early hours of October 5, 2005, in the space of just eight minutes, a million cubic meters of rushing water, stones and trees fell from the Tolimán volcano and par-tially destroyed the district. Statistics for Panabaj and Tz’anchaj reported 287 families that lost family mem-bers, houses, possessions and crops: 600 were killed, leaving 31 orphans and 77 widows, and 205 houses were destroyed. The families were moved to shelters on land donated by the Catholic Church for reconstruction of their houses.
5. Spontaneous Reaction of Communities to the Disaster
In the first days after Tropical Storm Stan, people fo-cused on basic rescue and survival activities. Indig-enous organizations and families began relief work in Santiago’s hardest-hit communities. Boatmen voluntari-ly moved people from high-risk communities to safer places. Female volunteers prepared the first supplies and food for the communities that suffered the most, such as in Panabaj. Many youths and men formed groups to clear roads and paths.
For eight days, roads were blocked by landslides, the rain continued, and it was impossible to send aid by air. The first rescue team to reach the area was a military patrol that had to walk three days to get there. Unfortunately, and although its survival was at stake, the population wanted the soldiers to withdraw and rejected their help, because of the violent events of 1990. The military with-drew without being able to deliver any assistance.
6. Reaction of Institutions and Temporary Resettlement of Families
The first social assessments were produced by the mu-nicipal councils, public sector and non-governmental organizations (NGOs). There was also a clear sense of the need to organize the information available, prepare a departmental diagnostic assessment, and implement
Box 6.2 Disasters in the Mayan Worldview
To understand the Panabaj case and the way reconstruction was organized, it is necessary to understand Mayan beliefs about natural phenomena and their view of the creation and evolution of the universe.
In that cosmogony, natural disasters occur because of the loss of moral, ethical, and cosmic-spiritual values. In Ma-yan culture, everything in the environment is related to na-ture, and principles such as harmony and equilibrium are embedded in four fundamental elements: the creator and shaper, the cosmos, nature, and the human being.
The Mayan cosmovision relates humans with the natural elements in a close inter-dependency, creating the unity needed for spiritual and material life with respect to events that occur individually or collectively, with the passage of time. Thus, a “natural disaster” is the result of disequilib-rium in relation to the elements in that cosmogony, i.e. a lack of harmony among living beings. The Mayans per-ceived that what happened with Tropical Storm Stan was a failure to respect Mother Nature, because humans placed themselves above those relations and, faced with the de-struction of the environment, created their destiny.
Natural phenomena do not occur because of divine will. Rather, they are the result of an imbalance caused by hu-man beings themselves. Therefore, before founding a city or settlement, nature has to be asked for permission and forgiveness in a special ceremony. If nature acquiesces, it will send clear signals to that effect in the form of fire.
Source: CONRED, 2006
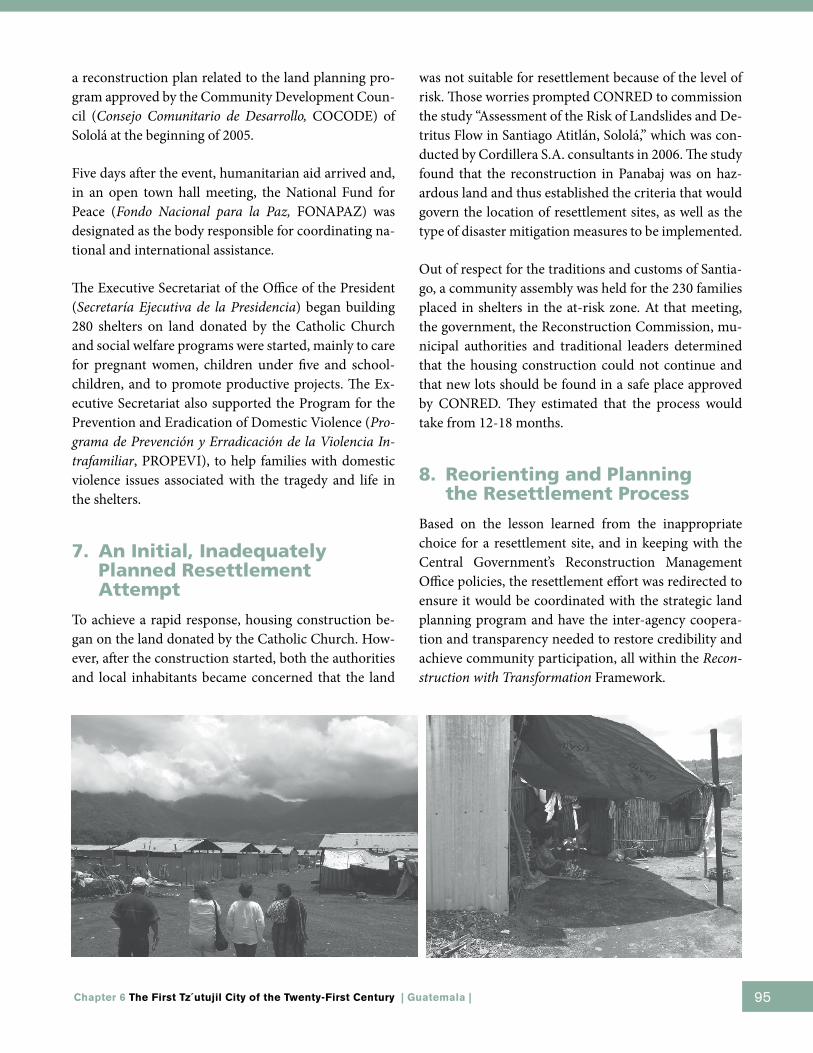
95Chapter 6 The First Tz´utujil City of the Twenty-First Century | Guatemala |
a reconstruction plan related to the land planning pro-gram approved by the Community Development Coun-cil (Consejo Comunitario de Desarrollo, COCODE) of Sololá at the beginning of 2005.
Five days after the event, humanitarian aid arrived and, in an open town hall meeting, the National Fund for Peace (Fondo nacional para la Paz, FONAPAZ) was designated as the body responsible for coordinating na-tional and international assistance.
The Executive Secretariat of the Office of the President (Secretaría Ejecutiva de la Presidencia) began building 280 shelters on land donated by the Catholic Church and social welfare programs were started, mainly to care for pregnant women, children under five and school-children, and to promote productive projects. The Ex-ecutive Secretariat also supported the Program for the Prevention and Eradication of Domestic Violence (Pro-grama de Prevención y Erradicación de la Violencia In-trafamiliar, PROPEVI), to help families with domestic violence issues associated with the tragedy and life in the shelters.
7. An Initial, Inadequately Planned Resettlement Attempt
To achieve a rapid response, housing construction be-gan on the land donated by the Catholic Church. How-ever, after the construction started, both the authorities and local inhabitants became concerned that the land
was not suitable for resettlement because of the level of risk. Those worries prompted CONRED to commission the study “Assessment of the Risk of Landslides and De-tritus Flow in Santiago Atitlán, Sololá,” which was con-ducted by Cordillera S.A. consultants in 2006. The study found that the reconstruction in Panabaj was on haz-ardous land and thus established the criteria that would govern the location of resettlement sites, as well as the type of disaster mitigation measures to be implemented.
Out of respect for the traditions and customs of Santia-go, a community assembly was held for the 230 families placed in shelters in the at-risk zone. At that meeting, the government, the Reconstruction Commission, mu-nicipal authorities and traditional leaders determined that the housing construction could not continue and that new lots should be found in a safe place approved by CONRED. They estimated that the process would take from 12-18 months.
8. Reorienting and Planning the Resettlement Process
Based on the lesson learned from the inappropriate choice for a resettlement site, and in keeping with the Central Government’s Reconstruction Management Office policies, the resettlement effort was redirected to ensure it would be coordinated with the strategic land planning program and have the inter-agency coopera-tion and transparency needed to restore credibility and achieve community participation, all within the Recon-struction with Transformation Framework.

96 Preventive Resettlement of Populations at Risk of Disaster: Experiences from Latin America
To that end, the Santiago Atitlán Reconstruction Commission was advised of the need to negotiate a reconstruction/resettlement model, respecting and strengthening the municipality’s traditional community-based organizational structure, which is built around a stakeholder network and institutions with ancestral elements integrated into the Western government-type system. At the heart of the institutions in Santiago Atitlán is the Tz´utujil people’s cosmic worldview, its history and notion of spiritual life.
Participation in the planning and implementation of the reconstruction and resettlement programs was or-ganized by the Municipal Development Council (Con-sejo Municipal de Desarrollo, COMUDE), the body that authorized the Municipal Reconstruction Commission.
Although the process started by addressing the plight and resettlement of families that lost their houses as a result of the storm, the Government later widened its eligibility criteria to include families living in at-risk areas as a way of preventing future disasters. In this way, the post-disaster resettlement also became a preventive resettlement of at-risk populations.
9. Articulation of the Reconstruction Plan with the Land Planning Strategy
The Reconstruction Commission based the plan on Sololá’s Sustainable Development Plan, which had been designed with a land planning focus, according to guidelines issued by the Secretariat for Planning and Programs of the Office of the President (SEGEPLAN). This approach aims to promote economic and social development with equity, based on each region’s potential and capacity, incorporating both gender and ethnic perspectives.
The Reconstruction Plan was drafted by a planning team composed of Sololá’s Governor, the manager of the Development Council, SEGEPLAN, the United Nations Development Programme (UNDP), the Authority for Sustainable Management of the Lake Atitlán Basin and Surrounding Areas (Autoridad y Manejo Sostenible de la Cuenca del Lago de Atitlán y su Entorno, AMSCLAE), and the NGO “Vivamos Mejor.”
Given the area’s particular characteristics in terms of its natural and cultural resources and high poverty indices, the plan included four components that included:
■ Rebuilding houses, schools, health centers, water supply and sanitation systems, roads, community ceremonial centers and archeological sites, and a guarantee that they will be built in low-risk areas;
■ Reducing economic, social, cultural and environmental vulnerability at the local, municipal and departmental levels. Risk management was built into the Strategic Land Use Plan (PET); an early warning system was created; COCODE’s Risk Management Commission was established; and a search and rescue team was formed to respond to emergencies;
■ Creating an economic and productive focus through support to agricultural and livestock, agro-forestry, tourism, and handcraft microen-terprises;
■ Strengthening the social fabric to increase oppor-tunities for community participation through the development councils, while fostering transpar-ency through social audits, civic education, and conflict resolution.
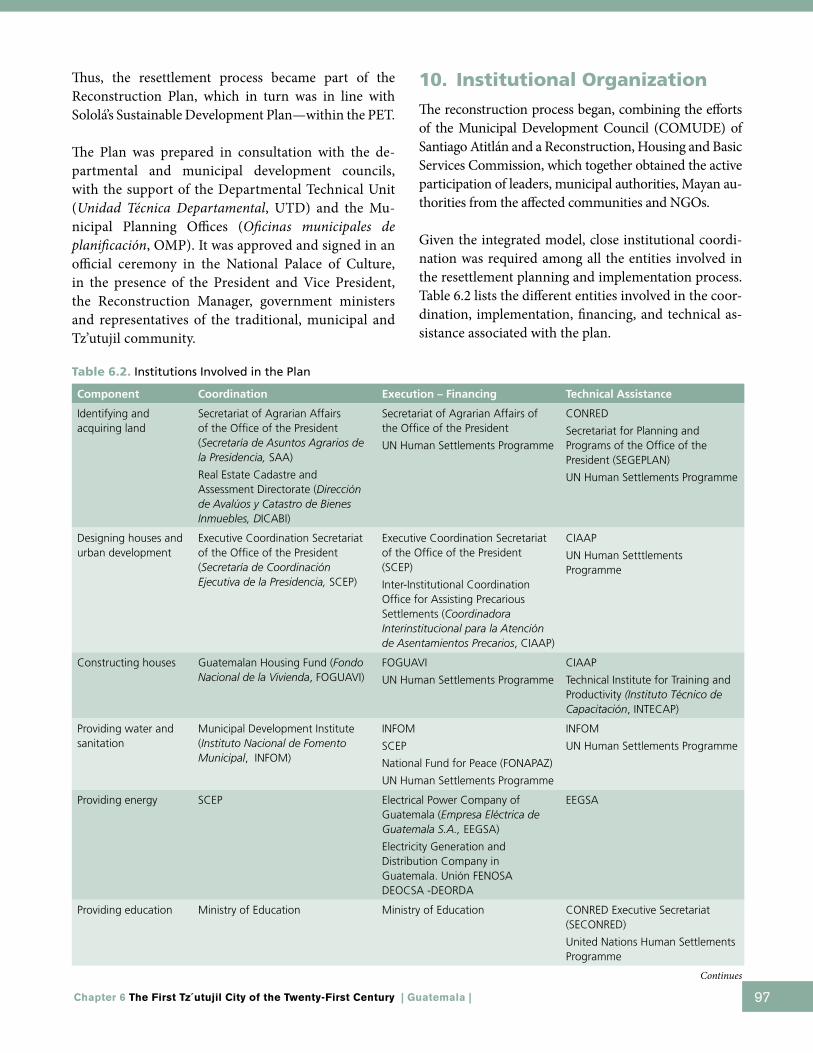
97Chapter 6 The First Tz´utujil City of the Twenty-First Century | Guatemala |
Table 6.2. Institutions Involved in the Plan
Component Coordination Execution – Financing Technical Assistance
Identifying and acquiring land
Secretariat of Agrarian Affairs of the Office of the President (Secretaría de Asuntos Agrarios de la Presidencia, SAA)
Real Estate Cadastre and Assessment Directorate (Dirección de Avalúos y Catastro de Bienes Inmuebles, DICABI)
Secretariat of Agrarian Affairs of the Office of the President
UN Human Settlements Programme
CONRED
Secretariat for Planning and Programs of the Office of the President (SEGEPLAN)
UN Human Settlements Programme
Designing houses and urban development
Executive Coordination Secretariat of the Office of the President (Secretaría de Coordinación Ejecutiva de la Presidencia, SCEP)
Executive Coordination Secretariat of the Office of the President (SCEP)
Inter-Institutional Coordination Office for Assisting Precarious Settlements (Coordinadora Interinstitucional para la Atención de Asentamientos Precarios, CIAAP)
CIAAP
UN Human Setttlements Programme
Constructing houses Guatemalan Housing Fund (Fondo Nacional de la Vivienda, FOGUAVI)
FOGUAVI
UN Human Settlements Programme
CIAAP
Technical Institute for Training and Productivity (Instituto Técnico de Capacitación, INTECAP)
Providing water and sanitation
Municipal Development Institute (Instituto Nacional de Fomento Municipal, INFOM)
INFOM
SCEP
National Fund for Peace (FONAPAZ)
UN Human Settlements Programme
INFOM
UN Human Settlements Programme
Providing energy SCEP Electrical Power Company of Guatemala (Empresa Eléctrica de Guatemala S.A., EEGSA)
Electricity Generation and Distribution Company in Guatemala. Unión FENOSA DEOCSA -DEORDA
EEGSA
Providing education Ministry of Education Ministry of Education CONRED Executive Secretariat (SECONRED)
United Nations Human Settlements Programme
Thus, the resettlement process became part of the Reconstruction Plan, which in turn was in line with Sololá’s Sustainable Development Plan—within the PET.
The Plan was prepared in consultation with the de-partmental and municipal development councils, with the support of the Departmental Technical Unit (Unidad Técnica Departamental, UTD) and the Mu-nicipal Planning Offices (Oficinas municipales de planificación, OMP). It was approved and signed in an official ceremony in the National Palace of Culture, in the presence of the President and Vice President, the Reconstruction Manager, government ministers and representatives of the traditional, municipal and Tz’utujil community.
10. Institutional Organization
The reconstruction process began, combining the efforts of the Municipal Development Council (COMUDE) of Santiago Atitlán and a Reconstruction, Housing and Basic Services Commission, which together obtained the active participation of leaders, municipal authorities, Mayan au-thorities from the affected communities and NGOs.
Given the integrated model, close institutional coordi-nation was required among all the entities involved in the resettlement planning and implementation process. Table 6.2 lists the different entities involved in the coor-dination, implementation, financing, and technical as-sistance associated with the plan.
Continues

98 Preventive Resettlement of Populations at Risk of Disaster: Experiences from Latin America
11. Participation of Traditional Communities, Authorities and Organizations
Stakeholders took part in the resettlement by identify-ing and acquiring land, designing houses and urban development schemes, and preserving the archeological heritage, as described below.
Land
The Reconstruction Commission established a Land Procurement Commission to find land suitable for the resettlement. It consisted of representatives from the community and the Secretariat of Agrarian Affairs.
Designing houses and urban development
The Reconstruction Commission also established the Urban Design and Housing Design Commissions, comprised of four members from the community and some from the Guillermo Toriello Foundation, the Executive Secretariat of the Presidency (SCEP), the National Reconstruction Manager, the National Housing Fund (FOGUAVI) and the UN Human Settlements Programme.
The urban and housing design proposals were based on a study of customs and traditions by the University of San Carlos de Guatemala (Universidad de San Carlos de Guatemala, USAC), which influenced the layout of streets, demarcation of lots assigned for houses, and the design of houses. The community was actively involved in the housing design process. However, because peo-ple were not familiar with technical drawings and scale
models to perceive spaces and dimensions, it was nec-essary to conduct an exercise in which the community itself formed human chains to give an idea of the size and shape of a house and of the rooms inside it. That process produced consensus, after which a model house was designed that could be used in subsequent phases of the resettlement.
Preserving the archeological heritage
A Ministry of Culture archeologist trained local leaders about archeological remains that might be found on the lots earmarked for resettlement. In turn, the leaders su-pervised the construction teams so as to identify archeo-logical remains. When some were found, the commission was informed and the land demarcation was realigned. For example, during construction, the remains of a Ma-yan dwelling were discovered– the only one of its kind in the country—which has since become a tourist attraction.
Component Coordination Execution – Financing Technical Assistance
Devising productive activities
Ministry of Agriculture, Livestock and Food (Ministerio de Agricultura, Ganadería y Alimentación, MAGA)
MAGA
UN Human Settlements Programme
SEGEPLAN
Technical Institute for Training and Productivity (INTECAP)
UN Human Settlements Programme
Promoting health efforts
Ministry of Public Health and Social Welfare (Ministerio de Salud Pública y Asistencia Social, MSPAS)
MSPAS Social Works Secretariat of the First Lady (SOSEP)
Promoting cultural and archeological aspects
Ministry of Culture Ministry of Culture Ministry of Culture
Table 6.2. Continuation
99Chapter 6 The First Tz´utujil City of the Twenty-First Century | Guatemala |
12. Building Trust
Trust between institutions and communities involved in any social program is a key factor to success. As men-tioned earlier, in Panabaj and Tz’anchaj, trust was de-stroyed when some in the military killed members of the community in 1990. For that reason, strong mea-sures were taken to restore trust and encourage the community to participate and help oversee the process. These measures are described below.
Establishing the participation network and strengthening the social fabric
Citizen participation and strengthening the social fab-ric were key to restoring trust in the Government and implementing the Reconstruction with Transformation policy.
As noted above, residents of Santiago Atitlán had expe-rienced several major upheavals in recent times—the 1976 earthquake, nearly 36 years of internal armed con-flict, and wide-scale destruction from Tropical Storm Stan. These factors, exacerbated by poverty and the iso-lation caused when the road was blocked by landslides, severely strained community relations and weakened the social fabric.
When the resettlement process began, there was seri-ous mistrust among community groups and political parties and between government authorities and the community. Thus, it was crucial to create a dialogue among community leaders and authorities so as to promote a sense of partnership and heal the divisions. A huge effort was also made to restore relations be-tween the central government and municipality and between them and community leaders by creating a commission with a uniform proposal and vision for rebuilding Santiago.
Establishing agreements on transparency
To achieve the goals pursued in the participatory pro-cess and rehabilitate the social fabric, it was essential to reach an agreement on transparency. To that end, in February 2006, the President and ministers publicly committed to:
■ Facilitate unrestricted access to all public infor-
mation generated in the course of the reconstruc-tion;
■ Conduct public events on accountability at the national and departmental levels to ensure the public was kept informed about the project’s progress and its impact, in addition to traditional accountability mechanisms;
■ Promote extensive social auditing so as to obtain the views/complaints of individuals and orga-nized groups and ensure that any alleged act of corruption was detected and punished according to the laws.
Given this commitment, it was possible to facilitate transparent, swift, competitive, and publicly audited procedures. In Sololá and Panabaj, transparency mea-sures were adopted at both the municipal and depart-mental levels. To this end, representatives from the Commission of Reconstruction, Housing and Basic Services presented monthly reports to the Municipal Development Council (COMUDE) and the Commu-nity Development Council (COCODE), listing each construction work, its location, costs, starting and end-ing dates, names of the construction companies, and progress. This process was reinforced by the local social audit, which provided management and the reconstruc-tion team with accurate information about the situation on the ground, so the ministries could deal with issues related to the contractors’ compliance.
13. Selecting Resettlement Sites and Acquiring Land
Based on the results of the assessment of landslide and detritus flows in Santiago Atitlán—particularly in the Panabaj and Tz’achaj communities—commissioned by CONRED (2006), it was determined that the entire municipality of Santiago, and especially Panabaj and Tz’anchaj, were highly vulnerable to floods and land-slides and declared it an “uninhabitable emergency zone.” The findings implied that the land donated by the Catholic Church, where houses were being built, was also located in a high-risk area.
One outcome of the open assembly for the 230 families living in shelters was the establishment of the Negotia-

100 Preventive Resettlement of Populations at Risk of Disaster: Experiences from Latin America
tion Commission consisting of the leaders of the dif-ferent groups—the reconstruction manager, munici-pality, several guest NGOs, government institutions, and some families who were not in shelters but would have to be resettled since the area was declared unin-habitable. Thus, the original resettlement scheme also became a preventive program for families at high risk, and the total number of households increased from 230 to 915.
Several meetings were held to review different propos-als for resettlement sites. However, all were rejected by community representatives and the Reconstruction Commission because “the Tz’utujil indigenous people were born, had grown, and wished to die on its land” and would not leave their region. Thus, they asked the Government to look for resettlement land that was safe and located in their area and with their participation. As a result, a Land Procurement Commission was created, whose criteria for selecting alternative sites were partly shaped by a review of urban development trends, so as to find land that was likely to be earmarked for hous-ing with easy access to well maintained roads, services, urban facilities and proximity to the municipal admin-istrative center. The sites also had to be geographically strategic and not exposed to natural hazards. The Com-mission attempted to coordinate the effort with Santia-go Atitlán’s housing plans for that sector.
The search for land became complicated because the area CONRED defined as safe consisted of micro-lots whose owners claimed to have occupied them for sev-eral generations but had no deeds, and the entity created for the reconstruction could not purchase land without formal legal titles. Moreover, many of the smallholders were either not interested in selling or asked prices five to 10 times higher than the cost authorized by the Real Estate Cadastre and Assessment Directorate (DICABI), which made it impossible to buy them.
Thus, a special land acquisition mechanism was estab-lished, consisting of the municipality, the National Fund for Peace, and community representatives to ensure transparency and fair prices, as well as the legitimacy of property rights.
To obtain the lots, an agreement was signed by the mu-nicipality and National Fund for Peace (FONAPAZ),
under which the latter transferred US$1 million for di-rect purchases of land.
Once lots were identified, the Land Procurement Com-mission negotiated with the owners to purchase and then legalize the lots. The process of purchasing land from 70 smallholders lasted eight months. Given the lo-cation of the sites, it created a veritable jigsaw puzzle of lots. When half the land required was purchased, talks began with the community on a suitable type of urban development.
14. The Chuk Muk Resettlement: A Heritage Recovered
The site selected for the new Tz’utujil city—known as Chuck Muck—was especially significant, since it was where the Mayan ancestors lived before the Spanish con-quest. This was confirmed by the discovery of Tz’utujil dwellings from the 11th century, creating a deeper sense of cultural identity and heritage (Figure 6.3)
Figure 6.3. The Chuk Muk Resettlement Site
15. Environmental impact Study of the New Site
The municipality and Office of the Reconstruction Manager, with the consent of the Santiago Atitlán Re-construction Commission, commissioned the Guiller-mo Toriello Foundation to do an environmental impact study of the new site. The report was shown to various institutions participating in the Chuk Muk resettlement

101Chapter 6 The First Tz´utujil City of the Twenty-First Century | Guatemala |
and was endorsed, as legally required, by the Ministry of the Environment and Natural Resources. The study found that the environmental impacts of the 915-house project, along with services and facilities, were “not sig-nificant” and satisfied an urgent need of the affected and at-risk populations, while creating jobs and lowering the country’s housing deficit. Finally, it certified that any negative impacts could be mitigated, provided the proj-ect complied with the recommendations in the environ-mental security, contingency and human safety plans.
16. Characteristics of the New settlement
At the time, no precedents existed in Guatemala for the kind of participatory project design adopted for the new settlement. Given the complex nature of the discus-sions, the Human Rights Prosecutor’s Office was invited to participate as an observer and mediator. With the participation of the community and various stakehold-ers, a balance was found between the indigenous and Western visions of what was needed, resulting in the first successful integration of urban development with indigenous traditions, culture and customs and Western technology. Thus, the Chuk Muk resettlement came to be called the first Tz’utujil city of the 21st Century.
Following lengthy negotiations, and based on the stud-ies by the University of San Carlos de Guatemala, par-ticipants agreed to the criteria with regard to commu-nity features, location of the lots, characteristics of the houses, access to services, infrastructure, and sources of income generation, as detailed below.
■ Community organization. The project recog-nized the existing form of community organiza-tion, based on extended families. Thus, the spatial planning allowed for groups of houses, equal to the number of families in the extended family pool, built around a small square or patio, with a tree in the middle and a common area for various activities.
■ Size of lots. The basic lot was 150m2, 7.5m wide and 20m deep (irregularly shaped lots had to have the same total area). The lot size was de-signed to accommodate a house (56 m2), an area for breeding poultry (35 m2), a traditional steam
bath house (temazcal1) (3.5 m2), land for growing fruits and vegetables (40 m2), a stack of firewood (2.5 m2), a shed (3 m2) and an area for drying laundry (10 m2).
■ Houses. The housing designs were made accord-ing to the population’s socio-cultural characteris-tics, which require specific areas for daily activities. The design was developed based on the concept of a house that is adequate, modular, and can be ex-panded. Through a sensitization process, informa-tion-sharing and assistance, the community made informed decisions, generated proposals and nego-tiated solutions. The decisions were based on inputs from the professional team and the community.
■ Income generation. The resettlement was con-ceived as a “productive habitat” for the communi-ties’ economic revival and as a way to raise their income levels, which were very low prior to the disaster. Thus, space was allotted for stalls and the sale of staple goods, handicrafts and locally woven cloth. Also, a strategic area for restaurants was reserved that would allow for enjoying beau-tiful views and cultural activities.
■ Communal areas. These areas were also de-signed to blend with the architecture and art of the region. The open public area was designed to be used for various activities such as markets, civic gatherings, sports and cultural events, including an open-air theater with a capacity for 1,125 people.
1 A temazcal is a type of sweat lodge use as part of a curative ceremony to clean the mind, body and spirit.
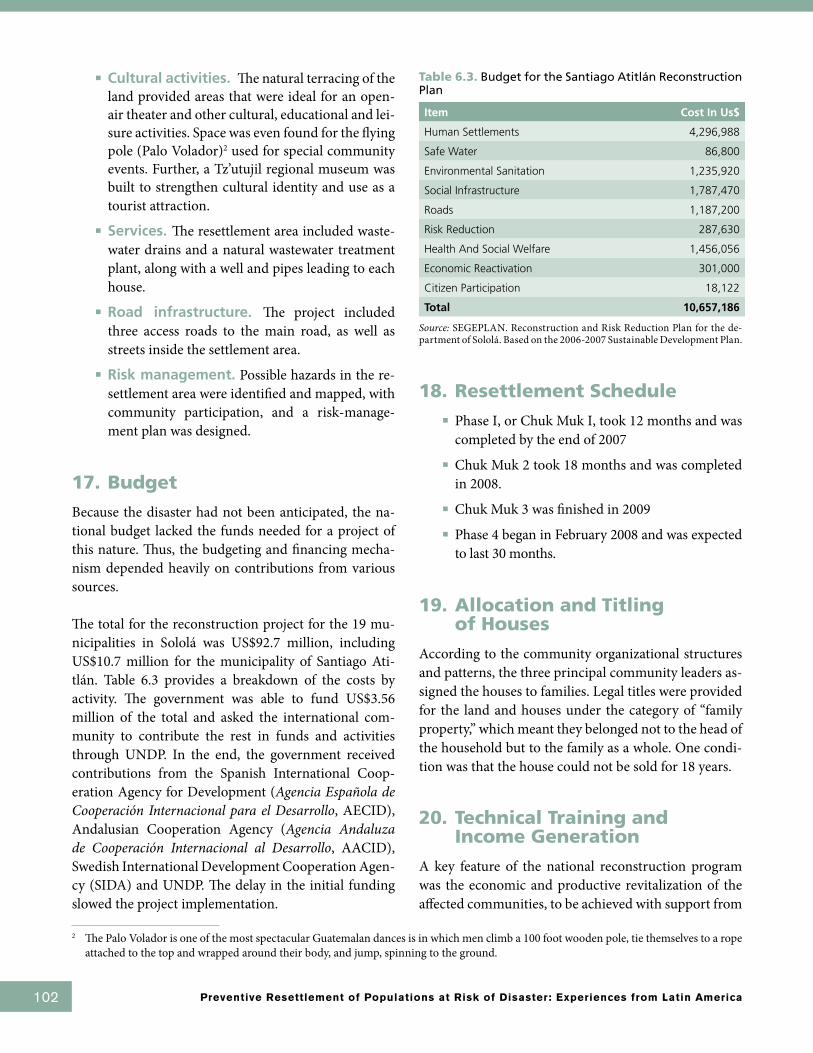
102 Preventive Resettlement of Populations at Risk of Disaster: Experiences from Latin America
■ Cultural activities. The natural terracing of the land provided areas that were ideal for an open-air theater and other cultural, educational and lei-sure activities. Space was even found for the flying pole (Palo Volador)2 used for special community events. Further, a Tz’utujil regional museum was built to strengthen cultural identity and use as a tourist attraction.
■ Services. The resettlement area included waste-water drains and a natural wastewater treatment plant, along with a well and pipes leading to each house.
■ Road infrastructure. The project included three access roads to the main road, as well as streets inside the settlement area.
■ Risk management. Possible hazards in the re-settlement area were identified and mapped, with community participation, and a risk-manage-ment plan was designed.
17. Budget
Because the disaster had not been anticipated, the na-tional budget lacked the funds needed for a project of this nature. Thus, the budgeting and financing mecha-nism depended heavily on contributions from various sources.
The total for the reconstruction project for the 19 mu-nicipalities in Sololá was US$92.7 million, including US$10.7 million for the municipality of Santiago Ati-tlán. Table 6.3 provides a breakdown of the costs by activity. The government was able to fund US$3.56 million of the total and asked the international com-munity to contribute the rest in funds and activities through UNDP. In the end, the government received contributions from the Spanish International Coop-eration Agency for Development (Agencia Española de Cooperación Internacional para el Desarrollo, AECID), Andalusian Cooperation Agency (Agencia Andaluza de Cooperación Internacional al Desarrollo, AACID), Swedish International Development Cooperation Agen-cy (SIDA) and UNDP. The delay in the initial funding slowed the project implementation.
18. Resettlement Schedule ■ Phase I, or Chuk Muk I, took 12 months and was
completed by the end of 2007■ Chuk Muk 2 took 18 months and was completed
in 2008.■ Chuk Muk 3 was finished in 2009■ Phase 4 began in February 2008 and was expected
to last 30 months.
19. Allocation and Titling of Houses
According to the community organizational structures and patterns, the three principal community leaders as-signed the houses to families. Legal titles were provided for the land and houses under the category of “family property,” which meant they belonged not to the head of the household but to the family as a whole. One condi-tion was that the house could not be sold for 18 years.
20. Technical Training and Income Generation
A key feature of the national reconstruction program was the economic and productive revitalization of the affected communities, to be achieved with support from
Table 6.3. Budget for the Santiago Atitlán Reconstruction Plan
Item Cost In Us$
Human Settlements 4,296,988
Safe Water 86,800
Environmental Sanitation 1,235,920
Social Infrastructure 1,787,470
Roads 1,187,200
Risk Reduction 287,630
Health And Social Welfare 1,456,056
Economic Reactivation 301,000
Citizen Participation 18,122
Total 10,657,186
Source: SEGEPLAN. Reconstruction and Risk Reduction Plan for the de-partment of Sololá. Based on the 2006-2007 Sustainable Development Plan.
2 The Palo Volador is one of the most spectacular Guatemalan dances is in which men climb a 100 foot wooden pole, tie themselves to a rope attached to the top and wrapped around their body, and jump, spinning to the ground.
103Chapter 6 The First Tz´utujil City of the Twenty-First Century | Guatemala |
institutions such as the Guillermo Toriello Foundation and the UN Human Settlements Programme.
In the short term, an effort was made to hire the popula-tion that was to be resettled to do the construction. To that end, the Technical Training Institute (INTECAP) provided courses in bricklaying, carpentry, plumbing, electricity, and other skills.
At the same time, employment and income generation programs were developed to stimulate the economic re-vitalization of the families, based on their skills, poten-tial and social characteristics, and according to the new environment and their new responsibilities. An inven-tory was compiled of their resources and skills; studies were conducted of existing demand for employment in the public and private sectors; the community was of-fered training; and sources of loans for families were identified. The productive projects chosen were consis-tent with the Strategic Plan for the Lake Atitlán Basin and the Municipal Development Plan.
Throughout the process, consideration was given to the importance of the municipal government in local eco-nomic development. For that reason, the Guillermo To-riello Foundation focused on strengthening municipal institutions in areas such as overall and land-use plan-ning, and economic development.
The integrated model, which is still being developed, has already yielded encouraging outcomes and contin-ues to attract more government and NGO programs. Subsequently, a school was built, along with a health center and community center, which also serves as the headquarters for the Council of Elders, the Community Council, and the offices for women, elderly and youth. There is also a press and culture center, a natural medi-cine clinic and a risk-management office (El Periódico, 2010).
21. State of the Process
At the moment of finalizing this study, the project had not been evaluated. However, data show that the first families were resettled in January 2007, and about 700 families were resettled by January 2010. As to be expect-ed, those families that have not yet benefited are impa-
tient and pessimistic; there have been cases where fami-lies, faced with the long wait, have considered returning to where they lived before.
22. Lessons Learned
Although there were no an evaluation available at the moment of finalizing the study, several lessons related to the responses during the emergency and the recon-struction and resettlement process could be drawn.
22.1 During Emergency Response and Reconstruction
The disaster and the emergency response highlighted the following:
■ The extreme vulnerability to natural disasters of the housing, transportation, roads and education-al infrastructure;
■ The environmentally precarious nature of the country, exacerbated by deforestation and inap-propriate land use, which significantly increased the vulnerability;
■ The minimal importance attached by local and municipal authorities to risk management and emergency response;
■ CONRED’s limited regional presence: At the time of the disaster, it had only eight departmen-tal units. Now, each of the 22 departments has CONRED units.
■ CONRED and the National Emergencies Fund (Fondo nacional de Emergencias) lacked human, technical and financial resources of CONRED and the National Emergencies Fund (Fondo na-cional de Emergencias);
■ The weaknesses of the existing housing institu-tions. The massive loss of houses was the greatest challenge the Government faced. That weakness created a gap between planning and implementa-tion, which led many of the institutions to impro-vise;
■ The lack of government-owned machinery and supplies;

104 Preventive Resettlement of Populations at Risk of Disaster: Experiences from Latin America
■ The lack of flexibility of the Government Procure-ment Law for emergency situations, which led to major delays;
■ The need to design grassroots mitigation plans with a high level of ownership by communities and to organize and strengthen stakeholders so they can implement the plans in line with their traditions and customs;
■ This experience also showed that it is not neces-sary to create new institutions for risk manage-ment and reconstruction. For countries with se-vere financial constraints, it is better to develop inter-agency mechanisms that help ministries and secretariats cooperate effectively. Those mecha-nisms need to have high-level political support from the Office of the President;
■ Resettlement should be a prevention tool, rather than a mechanism for responding to emergencies;
■ Financial resources are critical for implementing resettlement plans on schedule. The Government’s resources were insufficient and it was necessary to apply for supplementary funds from international agencies and NGOs. Given the lack of resources, the resettlement was not completed on time. Such delays not only affected the families, but also un-dermined the trust in the government institutions that the process had restored.
22.2 During the Resettlement Process
Significant achievements included the following:
■ Coordination of national, departmental, munici-pal and local levels in the design and implementa-tion of the resettlement plans;
■ Coordination of the resettlement plans with stra-tegic land planning programs, to guarantee their sustainability;
■ The important decision to include ethnical, so-cial and cultural considerations in the design and implementation of the resettlement plans, such as the ancestral settlement pattern, traditional forms of social organization, the indigenous cosmic world view, ethics, and understanding of nature
and disasters. This was a major challenge but one that benefited the entire process;
■ Inter-cultural dialogue, recognition and respect for other cultures throughout the process;
■ Participation of the community in the design of the new settlements and houses, which made it possible to recover the house designs of the Tz´utujil people population, based on the extend-ed family model, and including space for produc-tive, social, and cultural activities;
■ Strengthening the social fabric as a fundamental tool for processes of reconstruction with transfor-mation;
■ Strengthening community organization, which meant stakeholders established themselves as le-gitimate representatives in relation to national and municipal public institutions, as well as inter-national aid agencies. It created the conditions for channeling the community’s contribution to the reconstruction and facilitated social audits and the management of conflicts that might arise dur-ing the process;
■ The important role of women in community or-ganization and during the process;
■ The replacement of the basic or “minimum roof ” house concept with that of an adequate, modular, gradually built and improvable house;
■ The transparency mechanisms agreed upon with the communities, which helped restore confi-dence in the Government.
Finally, it should be highlighted that this well planned and implemented resettlement, based on the active participation of all stakeholders and respectful of ethi-cal and cultural values, became an opportunity not just to build houses but also to rebuild community trust in the State, to strengthen the social fabric, forge greater communal cohesion, improve living conditions, rein-force cultural identity and generate opportunities for the economic, social and cultural inclusion of histori-cally excluded groups. These factors not only increased the communities’ resilience to natural hazards, but also contributed to the process of national reconciliation.

105Chapter 6 The First Tz´utujil City of the Twenty-First Century | Guatemala |
References
Bohnenberger, Otto H. 1969. Los Focos Eruptivos Cua-ternarios de Guatemala. Instituto Centroamerica-no de Investigación y Tecnología Industrial. Gua-temala. Retrieved from: http://www.insivumeh.gob.gt/folletos/FVQGT.pdf
CONRED (National Coordination for Disaster Reduc-tion). 2006. Evaluación de riesgos por deslizamien-tos y flujo de detritos en Santiago Atitlá. Cordillera S.A. Sololá.
El Periódico. Guatemala, Sábado 27 de febrero, 2010. Retrieved from: http://www.elperiodico.com.gt/es/20100227/ciencia/139820/
Hall. G., Patrinos A. (Eds.) 2006. Indigenous Peoples, Poverty and Human Development in Latin Amer-ica: 1994-2004. The World Bank. Retrieved from: http://elibrary.worldbank.org/docserver/down-load/9781403999382.pdf?expires=1308694969&id=id&accname=guest&checksum=60C3F068D6954577CB95830377D8FF22.
Inter-American Development Bank (IDB); Universidad Nacional de Colombia. 2004. Indicadores para la gestión de riesgos. Aplicación del sistema de in-dicadores 1980-2000. Manizales, Colombia: BID, Universidad Nacional de Colombia –Sede Man-izales–, Instituto de Estudios Ambientales (idea).
Inter-American Development Bank (IDB). 2002. Cen-tral America after Hurricane Mitch. The Chal-lenge of Turning a Disaster into an Opportunity. In: www.iadb.org
Municiplaity of Santiago Atitlán. Official web site. Re-trieved from: http://www.inforpressca.com/san-tiagoatitlan/informe_stan.php
Secretaría de Planificación de la Presidencia (SEGE-PLAN). Reconstruction and Risk Reduction Plan for the department of Sololá. Based on the 2006-2007 Sustainable Development Plan.
Swedish International Development Cooperation Agen-cy (SIDA), Executing Unit of the Rural Water Programme (UNEPAR), United Nations Inter-national Children Educational Fund (UNICEF). (2001). Desastres naturales y zonas de riesgo en Guatemala. Coordinación general del arquitecto José Luís Gándara.
Unidad Ejecutora de Proyectos de Acueductos Rurales, Fondo de las Naciones Unidas Para la Infancia (UNEPAR-UNICEF). 2001. Desastres naturales y zonas de riesgo en Guatemala. Guatemala, 94 p.
Universidad Rafael Landívar, Facultad de Ciencias Am-bientales y Agrícolas. 2005. Amenazas al ambiente y vulnerabilidad social en Guatemala. Documento técnico del perfil ambiental de Guatemala. Insti-tuto de Agricultura, Recursos Naturales y Ambi-ente. Retrieved from: http://www.infoiarna.org.gt/media/file/publicaciones/propias/doc_tecni-cos/vulnerabilidad/Amenazas%20al%20ambien-te%20(low).pdf]
US Agency for International Development (USAID), 1978. “Disaster relief case report: Guatemala – earthquake February 1976”, Washington.
The World Bank. 2009. Disaster Risk Management Programs for Priority Countries. Global Facility for Disaster Reduction and Recovery. Retrieved from: http://www.preventionweb.net/files/14757_6thCGCountryProgramSummaries1.pdf
106 Preventive Resettlement of Populations at Risk of Disaster: Experiences from Latin America
Bibliography
INSIVUMEH (Instituto Nacional de Sismología, Vulca-nología, Meteorología e Hidrología de Guatema-la). Sf. Evaluación del alud tipo Lahar que soterró al cantón de Panabaj y afectación del cantón de Tzanchag. insivumeh.
MAGA (Ministerio de Agricultura, Ganadería y Ali-mentación), Unidad de Planificación Geográfica y Gestión de Riesgo, Laboratorio de Información Geográfica. 2005. Atlas temático de las cuencas hi-drográficas de la República de Guatemala.
Ministerio de Ambiente y Recursos Naturales. 2007. Estudio de evaluación de impacto ambiental del desarrollo habitacional ChokMuc 2, arquitecto Pedro José Asturias (Colegiado 454).
CONRED (National Coordination for Disaster Reduc-tion). 2008. Tomado del artículo escrito por Alber-to Ramírez E. del diario Prensa Libre de la edición del día lunes 29 de diciembre de 2008: 4 y 5.
ONU (Organización de las Naciones Unidas, CEPAL (Comisión Económica para América Latina y el Caribe), SEGEPLAN ( Secretaría de Planificación y Programación de la Presidencia de Guatemala). 2005. Efectos en Guatemala de las lluvias torren-ciales y la tormenta tropical Stan. Octubre.
FAO (Organización de las Naciones Unidas para la Ag-ricultura y la Alimentación), SEGEPLAN ( Sec-retaría de Planificación de la Presidencia). 2006. Base metodológica del Sistema Nacional de Plani-ficación Estratégica Territorial (SINPET – SEGE-PLAN). Guatemala: SEGEPLAN, FAO.
———. 2006. Marco conceptual del Sistema Nacional de Planificación Estratégica Territorial (SINPET – SEGEPLAN). Guatemala: SEGEPLAN, FAO.
SEGEPLAN (Secretaría de Planificación de la Presidencia). 2006. Guía de facilitación de la planificación estratégica territorial (PET) y Plan de Desarrollo Municipal. SEGEPLAN – Sistema Nacional de Planificación Estratégica Territorial, SINPET, Gobierno de Guatemala.
Programa Nacional de Reconstrucción. 2007. Informe anual de reconstrucción 2007: de la crisis a la emergencia, de la emergencia a la reconstrucción, de la reconstrucción a la transformación para el desarrollo. Gerencia de la Vicepresidencia de la República de Guatemala.
PET (Planificación Estratégica Territorial). 2006. Cuenca del Lago de Atitlán; Consejo de Desarrollo Depar-tamental de Sololá.

107Chapter 7 Comparative Analysis of the Case Studies
This chapter presents a comparative analysis and the main conclusions from the cases studied in the earlier chapters. It is expected that the les-
sons learned in these experiences could be useful to guide other resettlement programs designed to reduce the risk of disasters.
1. Urbanization, Risk and Vulnerability
One conclusion involves the factors that give rise to hu-man settlements in high-risk areas. In Argentina, Brazil and Colombia, rapid urbanization without proper land use planning, policies to provide housing for the poor and supervision of settlements in at-risk areas, led low-income and marginalized segments of the population to build houses in prone risk areas.
Poor people settle in areas that are either at-risk or un-suitable for human settlement because they have no other options. For example, in Guatemala, when the most appropriate area for resettlement after the dev-astation from Tropical Storm Stan was selected, it was the one traditionally occupied by the Mayans until they were forcibly removed during the Spanish conquest and colonial period.
In addition, human settlements in at-risk areas exacer-bate exposure to hazards and their impacts because of the lack of basic infrastructure, which, even when it ex-ists, is built by settlers without construction standards or technical assistance. That was evident in Brazil and Colombia. For example, in São Paulo, when families liv-ing on the banks of streams discharged wastewater and solid waste into the waterways, this caused sedimenta-tion and increased the likelihood of flooding. In Co-lombia, when settlers excavated land on slopes to build houses and roads, discharged wastewater, and defor-
ested the Andean forest, these activities contributed to erosion and landslides—confirmed by a study commis-sioned by the Capital District of Bogotá, as part of its plan to rehabilitate the high-risk areas.
Poverty is another factor that intensifies the marginal populations’ vulnerability to risks. In all the cases, the population was at or beneath the poverty line, which made them doubly vulnerable, as they could not satisfy basic needs and confront emergencies.
In many cases, these settlements are considered “illegal” because they do not comply with urban development regulations and families lack the legal titles requested by governmental agencies to build basic infrastructure. This creates a vicious circle with severe consequences for these groups and the city as a whole. Some efforts are underway to break that pattern through programs such as São Paulo’s “urbanization of favelas” and Bogotá’s comprehensive slum upgrading program. They involve (a) providing legal titles to land where there are no haz-ards, (b) identifying at-risk zones, (c) establishing miti-gation measures, including resettlement, if exposure to the risk cannot be otherwise reduced, and (d) improv-ing urban infrastructure—all of which integrate these settlements with the formal city.
Lessons from the cases indicate the importance of land-use planning and strengthening institutions—to make the planning possible, as well as developing inclusion policies for the poor, so they, too, can access adequate, safe houses. This lesson is especially pertinent given the rapid urbanization growth. By 2007, half the world’s population lived in cities (UN-Habitat, 2007). And, while the urban population is expected to increase from 0.8 billion to one billion from 2010-2050 in developed countries, the number is expected to soar in develop-ing countries, from 2.7 billion to 5.4 billion.1 If such
Chapter 7
Comparative Analysis of the Case Studies
By Sergio Carmona and Elena Correa
1 See World Population Prospects: The 2006 Revision; World Urbanization Prospects: The 2007 Revision.
108 Preventive Resettlement of Populations at Risk of Disaster: Experiences from Latin America
remarkable growth is not accompanied by the kinds of policies such as those mentioned above, billions will be exposed to disaster risks.
2. Disaster Risk Management
The cases also revealed how countries are introducing risk management policies and improving their legal and institutional frameworks for that purpose. Some of the risk-management processes are fairly advanced, as in Colombia, where a national emergency response and prevention system exists that applies a comprehensive approach. Here, authorities coordinate the efforts of national, regional and local institutions and involve all the relevant ones in the process. In addition, the coun-try has established financing mechanisms to respond to emergencies and prevent disasters, and has integrated risk management into land-use planning and develop-ment processes.
Guatemala has also made major progress by establishing the National Coordinator for Disaster Reduction and adopting a comprehensive strategy that incorporates risk prevention in the country’s strategic land planning programs and investment plans.
In general, advanced risk-management strategies gener-ate harmonious institutional and legal frameworks that facilitate planning, resource allocation, the monitoring of risk management plans and ways to incorporate the plans into development processes.
It is interesting to note that the countries with compre-hensive risk management policies are those that have experienced major disasters. In both Colombia and Guatemala, such events showed how vital it was to have (a) a full understanding of hazards and of the popula-tion’s vulnerability, (b) a national emergency prevention and response system, (c) special financial instruments, and (d) risk-management policies incorporated into land-use planning and in national and local develop-ment plans.
Another lesson is that prevention is the best investment possible because responding to disasters has serious hu-man consequences and financial impacts on a country’s development.
Community participation has also played an important role in risk management, although this varies by coun-try: Guatemala is a good example of where transition from vertical and authoritarian arrangements to par-ticipatory practices that included cultural and gender-related variables, was extremely effective.
3. Resettlement as a Disaster Prevention Measure
In each of the four cases, a different approach was ad-opted when resettlement was used to reduce the risk of disasters. In Colombia, such efforts are part of public policies that were built into land use planning, with specific rules and instruments, as illustrated in the case of Bogotá—one of the cities that is more advanced in terms of implementing this strategy. Its efforts include creating (a) micro-zoning maps showing the location of at-risk properties and families, (b) information sys-tems that store data and make it possible to monitor and oversee new settlements, (c) financial mechanisms, such as housing subsidies for at-risk families, and (d) institu-tions specialized in resettlement.
In Guatemala, preventive resettlement was included in the post-disaster reconstruction process when it was found that families, while not affected by the disaster, were living in high-risk areas and also needed to be re-settled. This strategy was included in the Government’s Reconstruction with Transformation program, but has not yet been converted into a public policy that is sys-tematically applied throughout the country.
In Argentina, resettlement programs targeted popula-tion groups exposed to the risk of floods; these largely depended on foreign loans, which made it more difficult to ensure their continuity and sustainability.
In Brazil, resettlement is part of an attempt to recover small urban watersheds but has not yet been incorpo-rated into public policies.
Thus, it can be concluded that resettlement must be incorporated in comprehensive risk management poli-cies, which should (a) provide housing programs for the poor, (b) adopt land-use planning, (c) identify at-risk areas, (d) monitor human settlements in at-risk areas,
109Chapter 7 Comparative Analysis of the Case Studies
and (e) supervise reclaimed areas to ensure that addi-tional households do not settle there. If these compo-nents are not included, preventive resettlement could become an incentive for low-income people to settle in at-risk areas in order to obtain government assistance.
Incorporating resettlement into comprehensive risk management strategies also ensures continuity in the process. For example, it has been found that if resettle-ment is not incorporated into comprehensive risk man-agement strategies, the efforts may be interrupted be-cause they depend on foreign loans, international aid, budget allocations or changes of government.
Further, such inclusion helps identify the at-risk popu-lation in advance, through studies of hazards, risks and vulnerabilities, such as were conducted in Bogotá. That information made it possible for authorities to deter-mine the magnitude of the problem, formulate strate-gies and plans for addressing it, estimate the resources needed to respond to it, monitor new settlements, gen-erate institutional and legal frameworks, and system-atize the results to learn from the experience.
4. Resettlement as a Multidimensional Process
Human resettlement is a complex process. If done inap-propriately, it can create serious problems: For example, if it is poorly planned or implemented, resettlement may trigger social, economic and cultural disasters worse than one it is supposed to prevent. Unfortunately, there are hundreds of such failures. This risk has led interna-tional organizations such as The World Bank and other multilateral agencies, to require that resettlement poli-cies be included in the operations they finance.
The ultimate aim of resettlement is to help people re-build their livelihoods, which means not just their hous-es but sources of income, economic activities, social re-lations, access to public services, and cultural practices. This can be achieved if the families and communities moved to new habitats are offered the economic, social and cultural conditions that will help them re-adapt and develop their potential further.
Conversely, when resettlement is seen mainly as a new house in a safe place, resettled people often experience economic or social disruption; thus, the process must be multi-dimensional, to help people re-establish their livelihoods and adjust to their new environment.2
Another problem arises when populations do not par-ticipate in the planning and implementation, and the programs fail to consider their social and cultural char-acteristics.
Since resettlement is multi-dimensional, it must be planned and implemented with the participation of var-ious sectors and institutions. Key entities include those responsible for housing programs, public utilities (water, electricity, sewage systems, communications and trans-portation), social services (education and health care), training and support for productive activities, as well as oversight bodies. Although one entity typically leads the resettlement process, other governmental institutions (such as those responsible for health and education) must assume responsibility in their specific areas for the resettled groups. Their participation also generates syn-ergies in the implementation of institutional programs and deployment of human and financial resources, to ensure the socio-economic integration of resettled com-munities in their new habitat and guarantee the conti-nuity of social programs.
The multi-dimensional approach was adopted in all the cases studied. In Brazil, the Secretariat for Housing led the process, which also included the Secretariats for Edu-cation, Health, Transport, Ecology, the Environment and Culture. In Bogotá, the process was conducted by the entity specialized in resettlement of at-risk populations, closely coordinated with those responsible for emergency response and prevention, education, health, productive activities and other social programs. In Guatemala, the reconstruction manager appointed by the Vice-President of the Republic coordinates a large number of govern-mental institutions, international agencies and NGOs that support various processes, including land purchases, the design and construction of houses, protection of ar-cheological findings, education, health, productive proj-ects and public services. In that country, the institutional
2 For further information on the risks associated with resettlement see Michael Cernea’s publications.

110 Preventive Resettlement of Populations at Risk of Disaster: Experiences from Latin America
synergies created to overcome one of the major hurdles in the resettlement—namely, land procurement—in-volved the National Fund for Peace (FONAPAZ), the Municipality of Santiago Atitlán, the National Valuation Commission, international agencies and the communi-ties. In both Guatemala and Colombia, the process was improved when families were included in the design of social welfare programs that were part of national and lo-cal public policies, such as the care of children, women and the elderly, even prior to resettlement.
■ Interdisciplinary teams
The multi-dimensional nature of resettlement also re-quires that inter-disciplinary teams be formed to deal with the various aspects. In all the cases, the teams were organized within the entities responsible. In Brazil, pro-fessionals from other institutions or firms were hired to help manage the social impacts.
■ Interinstitutional coordination
Such broad participation (agencies, local authorities and communities) means the activities must be well coordi-nated. Brazil’s “Resettlement Advisory Council,” Colom-bia’s “Technical-Social Working Group” and Guatemala’s “Santiago Atitlán Reconstruction Commission” are ex-amples of inter-institutional coordination strategies.
■ Coordination among different governmental levels
Similarly, when various levels of government are in-volved, their efforts must be closely coordinated. For example, in Argentina, agreements were signed speci-fying how responsibilities would be distributed among central, provincial and municipal levels and the hous-ing institutes. The coordination produced significant re-sults: 120 localities across 2,200 km in seven provinces participated in the housing component of the flood risk-reduction programs.
In Guatemala, resettlement is coordinated at the high-est planning, inter-agency and decision-making levels, ensuring coherence, integrated management and the in-volvement of all national, regional, and local authorities.
In large cities such as São Paulo and Bogotá, the differ-ent levels of the administration within the cities coordi-nated their efforts.
5. Resettlement Planning
The studies found that once the decision was made to re-settle a population, it was crucial to carry out a census and socio-economic assessments, in order to plan the activities required. A census establishes the number of people in the target population and sets cut-off dates for determining the program’s beneficiaries. For example, in Bogotá, such dates helped authorities monitor the settle-ment of new families in the at-risk areas, as well as the sale of houses “including the right to resettlement” and they did not have to deal with ever-increasing numbers.
In addition, socio-economic and cultural studies pro-vide useful information to ensure that the populations’ unique characteristics are considered in the housing de-sign and to plan the resettlement. Of the different cases studied, the Guatemala case should be highlighted with the study conducted by the University of San Carlos de Guatemala on community practices and customs and the participation of traditional authorities in design-ing the houses and new settlements. In Argentina, the analysis of cultural characteristics was reflected in the types of houses built; also, the use of local materials was promoted to reduce construction costs and facilitate maintenance.
In São Paulo and Bogotá, the programs helped incor-porate families into the formal city; and the socio-eco-nomic data helped authorities re-establish social servic-es and educate families about the obligations they would incur in formal housing complexes.
6. Housing Solutions
The cases studied show there is no single recipe for re-settling a population; rather, a wide range of options ex-ists, such as hiring private firms to construct the new houses (Brazil, Colombia and Guatemala), creating partnerships with private construction companies or with NGO housing organizations (Colombia), support-ing self-construction and reciprocal assistance (Argen-tina), families exchanging houses (the so-called “chess game” in Brazil), purchasing pre-existing houses on the market with technical, legal and social services (Colom-bia), and providing cash compensation to beneficiaries (Brazil). Where several housing options are available,
111Chapter 7 Comparative Analysis of the Case Studies
as in São Paulo and Bogotá, this expedites the resettle-ment.
In Argentina, Colombia and Guatemala, the new houses were designed to allow for gradual expansion, based on each family’s needs and resources.
The Colombian example was particularly interesting. As mentioned above, families received legal, technical and social services to help them select new or pre-existing houses on the market. Another interesting option was developing partnerships between the entities in charge of the program and private construction companies, since the existence of an assured market is a strong in-centive for firms to develop housing projects.
Another interesting option was the “chess game” (Brazil) that helped families which did not want to leave their neighborhoods. Under the plan, they exchanged the houses they were offered in the resettlement program for ones owned by other families which were located in the same (original) neighborhood but where the sites were not at-risk. This created a win-win solution for the participating families and helped expedite resettlement.
Of all the options, perhaps the most noteworthy was the self-construction and mutual assistance arrange-ment (Argentina). The magnitude of the program, its broad geographical scope (in a large country), the par-ticipation of different levels of government and entities, and its major achievements dispel the myth that self-construction is inefficient or impossible; it also proved that women could participate on an equal footing with men. This option had comparative advantages in terms of costs, community participation and secondary ben-efits. For example, various external evaluations found the population’s self-esteem increased, along with high levels of “ownership,” which prompted greater care and maintenance of the properties. It also trained many people in house construction, thus strengthening hu-man capital (regardless of gender) and enhancing the community’s entrepreneurial skills, which in turn, in-creased their job opportunities. Moreover, the pro-gram promoted community solidarity and cooperation, helped reduce the cost of houses and generated savings the residents later used to construct community facili-ties. Another lesson is that self-construction does not mean leaving communities to their own devices; rather,
it requires well-planned technical and social assistance and the timely delivery of materials.
With regard to the practice of relocating households in buildings within large housing complexes (Brazil), the independent evaluation recommended avoiding such solutions and focusing instead on smaller complexes that are better suited to fostering harmonious com-munity relations. Another lesson from Brazil’s experi-ence—already encountered in numerous resettlement programs elsewhere—is that cash compensation is not an appropriate solution and creates problems for both the families and cities. For example, in the initial phase of the program, the families that received cash compen-sation without any assistance, returned to areas unsuit-able for human settlements.
In addition to the information already obtained from the studies, comparative cost-benefit analysis reviews are needed to better understand the advantages and dis-advantages of each housing solution.
7. Payment for Housing Solutions
Because the families involved in all the cases were ex-tremely poor, the governments had to subsidize housing costs. In Argentina, families contributed their labor and received free construction materials and technical assis-tance. In Guatemala, they received their new houses free of charge. In Brazil, families that were resettled in hous-ing complexes assumed 10% of the cost of their new houses by obtaining government subsidized long-term loans. In Colombia, families initially received a partial subsidy and had to pay part of the costs; however, Bo-gotá authorities later decided to subsidize all the costs.
Despite the cases show different arrangements regard-ing payment for the new houses, due to a lack of com-parative evaluations, it is impossible to draw firm con-clusions about the best payment arrangements. This aspect should be studied further.
8. Legal Titles to the Houses
In all the cases, families were given deeds to their hous-es, which had a significant impact on their net worth

112 Preventive Resettlement of Populations at Risk of Disaster: Experiences from Latin America
and status: They went from being informal or illegal settlers to legal owners with deeds.
It should be noted that deeds were provided to fami-lies, rather than individuals, as a way of safeguarding the rights of women and children (Guatemala and Co-lombia); also, families were prevented from selling their houses for a given period of time (Argentina and Gua-temala).
9. Environmental Impact Study of the Resettlement
Guatemala was the only country to assess the environ-mental impact of the new settlements. This is an impor-tant activity because collective resettlements may put pressure on natural and social resources and negatively affect the environment. Therefore, measures should be included to mitigate any adverse impacts.
10. The Transition from the Informal to the Formal Sector
One of the many challenges for resettled families and those who plan the resettlement process is moving peo-ple from an informal to a formal environment. In the formal city, they must assume new responsibilities, such as paying for utilities and taxes. Also, in some cases, the new urban setting may require a different type of neigh-borhood behavior.
For this reason, once households were resettled (in Bra-zil and Colombia), they were provided with manuals about rules and regulations to promote harmonious re-lations with the neighbors and trained on how to handle the costs associated with new houses and the efficient use of utilities, among other topics.
11. Restoration of Access to Social Services
Resettlement may sometimes cause children to miss a year of school or lose access to schools entirely. Also, the population may lose its access to health care, since families were registered at health centers in their origi-nal sites.
Such problems were addressed in different ways. In Bra-zil, it was necessary to build schools and health centers for the families resettled in the housing complexes. Also, the moving was scheduled on dates that had the least negative effect on the children’s schooling. In Colombia, arrangements were made with public entities to register families with schools and health centers close to their new houses. In Argentina, no extra actions were needed because the families’ distance from schools and health centers was not altered substantially. In Guatemala, these facilities were built later, due to the synergies in Chuk Muk with public entities and international agencies.
12. Restoration of Income
Peoples conducting economic activities within their homes or neighborhoods may lose this source of income when they move. Thus, it is important to study their so-cio-economic conditions to determine the nature of the families’ economic activities and assess whether income will be lost through resettlement. None of the cases pro-duced detailed information on such aspects, but they all considered the issue. In Brazil, commercial premises were built inside the housing complexes for families that had been engaged in a trade. In Argentina, income sources were not affected because distances were not significantly altered by resettlement. In Colombia, income-generating projects are under way. In Guatemala, the new settlement was designed as a “productive habitat,” with spaces incor-porated for subsistence and commercial activities, and special programs were conducted to revive the econo-mies of the communities affected by the disaster.
It should be noted that while much can be done to im-prove family incomes, resettlement cannot solve a coun-try’s or region’s structural problems.
13. Monitoring Risks and Contingency Plans
Since preventive resettlement is a response to communi-ties exposed to high risk hazards, authorities must mon-itor the risk conditions, and develop contingency plans to react properly. In the cases studied, two approaches were adopted: Guatemala constructed shelters, while Bogotá (Colombia) subsidized housing rentals pend-ing permanent solutions, or gave grocery vouchers to
113Chapter 7 Comparative Analysis of the Case Studies
households that went to live with relatives. The feasibil-ity of Colombia’s rental strategy will depend on the sup-ply of available houses (for rent). The shelter option may work if it does not involve prolonged stays that create other problems. The delay in implementing the resettle-ment in Guatemala led families living in shelters to con-template returning to the high-risk area.
14. Community Participation
As in any social process, successful programs cannot be designed and executed without active community participation. This helps residents (a) become aware of the type of impacts they may face in the resettlement process, (b) analyze different resettlement options, (c) manifest their expectations and (d) find solutions with the team responsible for the process. Participation is the path to free and informed consent and legitimizes the decisions made.
In addition, participation make possible to reach agree-ments on the nature and scope of programs, share re-sponsibilities for their implementation, and jointly monitor and evaluate them. Such agreements may be recorded in minutes or documents that help those in-volved clarify their roles and responsibilities. For exam-ple, in Argentina and Colombia, families signed agree-ments to participate in the process and assumed their responsibilities.
To enable the participation, the population must be in-formed from the beginning about the studies and activi-ties to be conducted, the institutions involved and the team responsible for the program. In each case studied, the implementing agencies developed information and communication strategies. In Argentina, teams from the municipal units informed potential beneficiaries about the program and guided them throughout the process. In Brazil, opportunities for community par-ticipation were created in the Resettlement Advisory Council and the social management team held periodic meetings with the communities to reach consensus on major issues such as the criteria to adjudicate houses, the parties’ rights and duties, and the resettlement schedule. In Colombia, the community’s elected leaders partici-pated in the “Technical-Social Working Group,” offices were established to assist the community in the nueva
Esperanza zone, and social workers visited families pe-riodically. In Guatemala, community leaders, Tz´utujil authorities and representatives of civil society organiza-tions all participated in the “Reconstruction Commis-sion.” The different mechanisms used illustrate the op-portunities that exist for informing the community and promoting its participation in decision making.
The population must also be informed about the types of hazards and risks to which they are exposed. The cases studied illustrate how the type of hazard demands different efforts to make people aware about the risk. For example, where phenomena occur regularly (such as floods), people were well aware of the problem and its consequences. However, where the hazards were la-tent (such as landslides in Bogotá), or families were not affected by a particular event (such as Tropical Storm Stan, in Guatemala) but were still at risk, a major effort was needed to help people understand and acknowledge the dangers. In these cases, the institutions made a great effort to sensitize people. The risk assessment studies were presented and discussed with those potentially af-fected, field trips were conducted to observe problems in situ, and awareness campaigns were launched to help households understand their serious exposure to risk and the need to be resettled.
Through information and dialogue, the possibilities for participation are defined. For example, communi-ties participated in the census (Brazil); in monitoring risk (Colombia); in finding solutions, such as procur-ing land for resettlement (Guatemala) and searching for housing on the market (Colombia); in designing houses and new settlements (Guatemala); in building their own houses (Argentina); and in performing specific activi-ties tailored to the particular characteristics of a project, such as the community participating in archeological conservation (Chuk Muk, in Guatemala), or helping re-store the environment in the nueva Esperanza district (Bogotá -Colombia).
Recognizing community organization and participation patterns and structures, is not only a sign of respect but also builds and strengthens solid relations and trust. A key example occurred in Guatemala, where multi-cul-tural management, in which - indigenous identity pat-terns, forms of political organization that combined tra-ditional and contemporary leadership structures, and
114 Preventive Resettlement of Populations at Risk of Disaster: Experiences from Latin America
religious beliefs - converged to create a social organiza-tion model for reconstruction.
In some cases, community organization had to be pro-moted in order to achieve sufficient participation. For example, in Argentina, to conduct the self-construction process, it was necessary to facilitate the community or-ganization thorough groups of 20 families to build 20 houses each one. This facilitated participation and also ensured that families helped each other to achieve the program’s goals.
Community participation is also crucial for monitor-ing the programs. Communities that have been histori-cally marginalized do not trust government institutions; thus, by including them in monitoring and verification at every stage of the process facilitates management and enables the communities become aware of obstacles and contribute to solving them.
15. Sources of Financing
The cases illustrate the various ways that resettlement can be financed. These include funds from government budgets, multilateral bank loans, grants from interna-tional agencies, and community contributions. These sources were tapped in all the cases in one way or an-other, and to varying degrees.
Government allocations can be provided in different ways: They can be (a) a special allocation such as in Guatemala, when the government altered its national budget to respond to the devastation from Tropical Storm Stan, (b) counterpart funds for loans from multi-lateral agencies (Brazil and Argentina), or (c) funds for emergency response and prevention (Colombia). This last mechanism is regarded as the one most likely to ensure program sustainability. With regard to the spe-cific sources, Brazil created the Special Fund for Public Calamities (FUNCAP) and Colombia established the National Calamity Fund. Also, Bogotá established an Emergency Prevention and Response Fund (FOPAE), which receives 0.5% of the Capital District’s current tax revenues, as well as other contributions.
To finance the housing needs of low-income families in high-risk areas, one interesting mechanism (Colombia)
involved housing subsidies for rural and urban popu-lations, including those special subsidies in Bogotá. These subsidies allowed the administration to include the most vulnerable settlers (who had no ability to pay for their houses in the formal market), so as to protect their lives and assets and gain access to legal and safe housing.
In these experiences, which involved creating financial instruments that targeted the most vulnerable people, a clear message was conveyed with regard to citizens’ rights and the governments’ responsibility toward ex-cluded and poor people, core features of any form of comprehensive risk management program.
16. Private Sector Participation
The cases also show the various types of private sector participation in the resettlement processes. These includ-ed conducting risk assessments or socio-economic and cultural studies of the population (Colombia and Guate-mala); providing services, where private firms were hired to implement the social management program (Brazil); constructing houses (Brazil, Colombia and Guatemala); and providing construction materials (Argentina).
Especially noteworthy are the partnerships, as in Argen-tina and Colombia, between the institutions responsible for the resettlement and the private sector. The agree-ments signed in Argentina by the provincial emergency coordination units and private suppliers of construction materials (that involved carefully monitored and con-trolled use of voucher mechanisms), helped guarantee transparency in the use of resources. The partnerships with private construction companies in Colombia using “real estate window displays” to present their projects to the communities benefited both the construction com-panies and the families who thus had a wider range of options from which to choose.
17. Control of Reclaimed Areas
After at-risk populations are resettled, the reclaimed ar-eas should be rehabilitated and carefully monitored. If this does not occur, costly new problems will arise for governments, institutions and territorial entities; and the efforts to reduce disaster risk will be vanished.

115Chapter 7 Comparative Analysis of the Case Studies
Thus, the reclaimed areas must be earmarked for ap-propriate use and strict controls must be applied over new settlements. To this end, the countries adopted dif-ferent approaches. In Argentina, Colombia and Guate-mala, regulations were issued banning new settlements in such areas; in Guatemala, the government prohibited investments by public agencies and international orga-nizations in the high-risk areas. In Argentina, rehabili-tated areas were turned into public green zones, includ-ing parks and sports grounds, which the municipalities agreed to oversee and maintain. In Colombia, Andean forest lands were incorporated into a municipal ecologi-cal park and people from the community were hired to do the rehabilitation. In Brazil, the rehabilitated areas were used for infrastructure, such as stream canaliza-tion projects or roads. Thus, it is important to regulate land use, ensure that authorities enforce the rules, and earmark these areas for public use in ways that benefit the community—all of which helps prevent new settle-ments in at-risk areas.
18. Transparency and Accountability
Transparency is critical to the programs’ success and for confidence-building with communities and stake-holders. Although the entire process must be transpar-ent, it is particularly vital when it comes to determining which families will participate, the types and amounts of benefits to be delivered, and the use of resources. In Argentina, where resources were insufficient to cover all the families, beneficiaries were chosen by a public
lottery in which local authorities or public notaries took part. After this, families were given vouchers to purchase construction materials (rather than cash), subject to tight controls by the entities responsible. In Colombia, the families that chose new houses built by private contractors or pre-existing houses, also did not receive cash; instead, they authorized the entity in charge to transfer the money directly to the seller. An-other important mechanism (in Brazil, Colombia and Guatemala), was to form committees, commissions or working groups made up of representatives of the local authorities, government entities and the community, which enabled all participants to monitor and oversee the programs.
Accountability is tightly linked to transparency. For example, the public acts of accountability organized at both the national and departmental level in Guatemala played a major part in building confidence among com-munities, the government, and other institutions.
19. Documenting and Systematizing Experiences
The analysis presented above shows some lessons of the cases studied. It would be important to promote prac-tices in order to document and evaluate resettlement ex-periences around the world to identify strategies, meth-odologies and instruments that will most effectively benefit the communities and governments. It will also allow replicating experiences and continually improve practices.

116 Preventive Resettlement of Populations at Risk of Disaster: Experiences from Latin America
Acceptable riskThe level of potential losses that a society or community considers acceptable given existing social, economic, political, cultural, technical and environmental condi-tions.
AdaptationThe adjustment in natural or human systems in re-sponse to actual or expected climatic stimuli or their effects, which moderates harm or exploits beneficial op-portunities.
Biological hazardProcess or phenomenon of organic origin or conveyed by biological vectors, including exposure to pathogenic micro-organisms, toxins and bioactive substances that may cause loss of life, injury, illness or other health im-pacts, property damage, loss of livelihoods and services, social and economic disruption, or environmental dam-age.
Building codeA set of ordinances or regulations and associated stan-dards intended to control aspects of the design, con-struction, materials, alteration and occupancy of struc-tures that are necessary to ensure human safety and welfare, including resistance to collapse and damage.
CapacityThe combination of all the strengths, attributes and re-sources available within a community, society or orga-nization that can be used to achieve agreed goals.
Capacity DevelopmentThe process by which people, organizations and soci-ety systematically stimulate and develop their capacities over time to achieve social and economic goals, includ-ing through improvement of knowledge, skills, systems, and institutions.
Climate change(a) The Inter-governmental Panel on Climate Change
(IPCC) defines climate change as: “a change in the state of the climate that can be identified (e.g., by us-ing statistical tests) by changes in the mean and/or the variability of its properties, and that persists for an extended period, typically decades or longer. Cli-mate change may be due to natural internal processes or external forcings, or to persistent anthropogenic changes in the composition of the atmosphere or in land use”.
(b) The United Nations Framework Convention on Cli-mate Change (UNFCCC) defines climate change as “a change of climate which is attributed directly or indirectly to human activity that alters the composi-tion of the global atmosphere and which is in ad-dition to natural climate variability observed over comparable time periods”.
Contingency planningA management process that analyses specific potential events or emerging situations that might threaten soci-ety or the environment and establishes arrangements in advance to enable timely, effective and appropriate re-sponses to such events and situations.
Coping capacityThe ability of people, organizations and systems, using available skills and resources, to face and manage ad-verse conditions, emergencies or disasters.
Corrective disaster risk management*Management activities that address and seek to correct or reduce disaster risks which are already present.
Critical facilitiesThe primary physical structures, technical facilities and systems which are socially, economically or operation-
Glossary*
* Reproduced from the UNIDR 2009. Terminology on Disaster Risk Reduction. Geneva, Switzerland. May. Retrieved from: http://unisdr.org/files/7817_UNISDRTerminologyEnglish.pdf
117Glossary
ally essential to the functioning of a society or commu-nity, both in routine circumstances and in the extreme circumstances of an emergency.
DisasterA serious disruption of the functioning of a community or a society involving widespread human, material, eco-nomic or environmental losses and impacts, which ex-ceeds the ability of the affected community or society to cope using its own resources.
Disaster riskThe potential disaster losses, in lives, health status, live-lihoods, assets and services, which could occur to a particular community or a society over some specified future time period.
Disaster risk managementThe systematic process of using administrative direc-tives, organizations, and operational skills and capaci-ties to implement strategies, policies and improved cop-ing capacities in order to lessen the adverse impacts of hazards and the possibility of disaster.
Disaster risk reductionThe concept and practice of reducing disaster risks through systematic efforts to analyse and manage the causal factors of disasters, including through reduced exposure to hazards, lessened vulnerability of people and property, wise management of land and the en-vironment, and improved preparedness for adverse events.
Disaster risk reduction planA document prepared by an authority, sector, organi-zation or enterprise that sets out goals and specific ob-jectives for reducing disaster risks together with related actions to accomplish these objectives.
Early warning systemThe set of capacities needed to generate and disseminate timely and meaningful warning information to enable individuals, communities and organizations threatened by a hazard to prepare and to act appropriately and in sufficient time to reduce the possibility of harm or loss.
Ecosystem servicesThe benefits that people and communities obtain from ecosystems.
El Niño-Southern Oscillation phenomenonA complex interaction of the tropical Pacific Ocean and the global atmosphere that results in irregularly occur-
ring episodes of changed ocean and weather patterns in many parts of the world, often with significant impacts over many months, such as altered marine habitats, rainfall changes, floods, droughts, and changes in storm patterns.
Emergency managementThe organization and management of resources and re-sponsibilities for addressing all aspects of emergencies, in particular preparedness, response and initial recov-ery steps.
Emergency servicesThe set of specialized agencies that have specific respon-sibilities and objectives in serving and protecting people and property in emergency situations.
Environmental degradationThe reduction of the capacity of the environment to meet social and ecological objectives and needs.
Environmental impact assessmentProcess by which the environmental consequences of a proposed project or programme are evaluated, under-taken as an integral part of planning and decision mak-ing processes with a view to limiting or reducing the adverse impacts of the project or programme.
ExposurePeople, property, systems, or other elements present in hazard zones that are thereby subject to potential losses.
Extensive risk The widespread risk associated with the exposure of dispersed populations to repeated or persistent haz-ard conditions of low or moderate intensity, often of a highly localized nature, which can lead to debilitating cumulative disaster impacts.
ForecastDefinite statement or statistical estimate of the likely oc-currence of a future event or conditions for a specific area.
Geological hazardGeological process or phenomenon that may cause loss of life, injury or other health impacts, property damage, loss of livelihoods and services, social and economic disruption, or environmental damage.
Greenhouse gasesGaseous constituents of the atmosphere, both natural and anthropogenic, that absorb and emit radiation of thermal infrared radiation emitted by the Earth’s sur-face, the atmosphere itself, and by clouds.

118 Preventive Resettlement of Populations at Risk of Disaster: Experiences from Latin America
HazardA dangerous phenomenon, substance, human activity or condition that may cause loss of life, injury or other health impacts, property damage, loss of livelihoods and services, social and economic disruption, or environ-mental damage.
Hydrometeorological hazardProcess or phenomenon of atmospheric, hydrological or oceanographic nature that may cause loss of life, in-jury or other health impacts, property damage, loss of livelihoods and services, social and economic disrup-tion, or environmental damage.
Intensive riskThe risk associated with the exposure of large concen-trations of people and economic activities to intense hazard events, which can lead to potentially catastrophic disaster impacts involving high mortality and asset loss.
Land-use planningThe process undertaken by public authorities to iden-tify, evaluate and decide on different options for the use of land, including consideration of long term economic, social and environmental objectives and the implica-tions for different communities and interest groups, and the subsequent formulation and promulgation of plans that describe the permitted or acceptable uses.
MitigationThe lessening or limitation of the adverse impacts of hazards and related disasters.
National platform for disaster risk reductionA generic term for national mechanisms for coordina-tion and policy guidance on disaster risk reduction that are multi-sectoral and inter-disciplinary in nature, with public, private and civil society participation involving all concerned entities within a country.
Natural hazardNatural process or phenomenon that may cause loss of life, injury or other health impacts, property damage, loss of livelihoods and services, social and economic disruption, or environmental damage.
PreparednessThe knowledge and capacities developed by govern-ments, professional response and recovery organiza-tions, communities and individuals to effectively antici-pate, respond to, and recover from, the impacts of likely, imminent or current hazard events or conditions.
PreventionThe outright avoidance of adverse impacts of hazards and related disasters.
Prospective disaster risk management Management activities that address and seek to avoid the development of new or increased disaster risks.
Public awarenessThe extent of common knowledge about disaster risks, the factors that lead to disasters and the actions that can be taken individually and collectively to reduce expo-sure and vulnerability to hazards.
RecoveryThe restoration, and improvement where appropriate, of facilities, livelihoods and living conditions of disas-ter-affected communities, including efforts to reduce disaster risk factors.
Residual riskThe risk that remains in unmanaged form, even when effective disaster risk reduction measures are in place, and for which emergency response and recovery capaci-ties must be maintained.
ResilienceThe ability of a system, community or society exposed to hazards to resist, absorb, accommodate to and recov-er from the effects of a hazard in a timely and efficient manner, including through the preservation and resto-ration of its essential basic structures and functions.
ResponseThe provision of emergency services and public assis-tance during or immediately after a disaster in order to save lives, reduce health impacts, ensure public safety and meet the basic subsistence needs of the people af-fected.
RetrofittingReinforcement or upgrading of existing structures to become more resistant and resilient to the damaging ef-fects of hazards.
RiskThe combination of the probability of an event and its negative consequences.
Risk assessmentA methodology to determine the nature and extent of risk by analyzing potential hazards and evaluating exist-ing conditions of vulnerability that together could po-
119Glossary
tentially harm exposed people, property, services, liveli-hoods and the environment on which they depend.
Risk managementThe systematic approach and practice of managing un-certainty to minimize potential harm and loss.
Risk transferThe process of formally or informally shifting the finan-cial consequences of particular risks from one party to another whereby a household, community, enterprise or state authority will obtain resources from the other party after a disaster occurs, in exchange for ongoing or compensatory social or financial benefits provided to that other party.
Socio-natural hazard The phenomenon of increased occurrence of certain geophysical and hydrometeorological hazard events, such as landslides, flooding, land subsidence and drought, that arise from the interaction of natural haz-ards with overexploited or degraded land and environ-mental resources.
Structural and non-structural measuresStructural measures: Any physical construction to re-duce or avoid possible impacts of hazards, or application of engineering techniques to achieve hazard resistance and resilience in structures or systems. Non-structural measures: Any measure not involving physical con-struction that uses knowledge, practice or agreement to reduce risks and impacts, in particular through policies and laws, public awareness raising, training and educa-tion.
Sustainable developmentDevelopment that meets the needs of the present with-out compromising the ability of future generations to meet their own needs.
Technological hazardA hazard originating from technological or industrial conditions, including accidents, dangerous procedures, infrastructure failures or specific human activities, that may cause loss of life, injury, illness or other health im-pacts, property damage, loss of livelihoods and services, social and economic disruption, or environmental dam-age.
VulnerabilityThe characteristics and circumstances of a community, system or asset that make it susceptible to the damaging effects of a hazard.
120 Preventive Resettlement of Populations at Risk of Disaster: Experiences from Latin America
Haris Sanahuja, an Argentinean now living in Panama, has a B.A. in Biology and an M.A. in Geography from the University of Costa Rica. He has 15 years of international experience in sustainable development, particularly in, disaster risk reduction He has consulted for international organizations, including The World Bank, sub-regional organizations like the Center for Coordination of Natural Disaster Prevention in Central America (CEPREDENAC) and United Nations agencies, such as the UN Development Programme’s Bureau for Crisis Prevention and Recovery (UNDP/BCPR) and the Secretariat of the UN International Strategy for Disaster Reduction (UNISDR). Also, he worked at the UNISDR headquarters in Geneva until 2005, and as the Regional Policy Advisor of UNISDR Americas, based in Panama, until 2009. His principal research, either as co-author or reviewer, includes the UN publications Living with Risk: A Global Review of Disaster Reduction Initiatives (UNISDR) and Reducing Disaster Risk: A Challenge for Development (UNDP/BCPR), and over a dozen scientific articles in journals specializing in disaster risk-management and ecology. ([email protected])
Elena Correa, a Colombian, is a psychologist and specialist in regional development planning, which she studied at the Universidad de los Andes in Bogota. She has over 25 years’ experience with social impact assessments of development projects and resettlement. Having joined The World Bank in 2000 as a Senior Social Development Specialist, she has worked in the Latin American and the Caribbean Region for seven years. At present, she is in the Social Development Department working on involuntary resettlement caused by development projects, natural disasters and conflict. Before joining The World Bank, she taught at several Colombian universities, worked for 12 years as Coordinator for Resettlement and Social Programs in two large hydro-electric projects in Latin America, and provided independent consulting services for assessing and managing socioeconomic impacts in complex projects in several countries. Her publications include
a book on Socio-Economic Impacts of Large Projects: Assessment and Management (1999). ([email protected]/[email protected])
Rómulo Pérez, an Argentinean, is an architect with an M.A. in Urban and Regional Planning from the University of Buenos Aires (UBA). He has lectured at both the UBA and Argentina’s Catholic University. Having 18 years’ experience with urban and regional planning, he is currently doing research at the UBA’s Higher Institute for Urban Planning, Regional Studies and Environment. He has worked on projects involving the recovery of degraded urban areas and the restructuring/expansion of the Central Area of Avellaneda; Argentina’s environmental strategies program; and the master plan for the River Salado Basin in Buenos Aires province. Recent publications include: Derecho de superficie y dimensión social de la propiedad del suelo. Un instrumento para la implementación de políticas públicas activas de desarrollo urbano ambiental. (2007) [Surface Rights and the Social Dimension of Land Ownership. A Tool for Implementing Proactive Public Policies in Environmental Urban Development], Reconfiguración institucional de gobiernos urbanos, el caso de los grandes aglomerados (co-authored, 2007) [Institutional Reconfiguration of City Governments; The Case of the Large Urban Centers] and Estructuración institucional para la planificación y gestión integradas del aglomerado urbano de Buenos Aires (co-authored, 2005) [Institutional Structuring for Integrated Planning and Management of the Buenos Aires Urban Center] ([email protected]).
Ignacio Zelmeister, an Argentinean, is an architect with a post-graduate degree in Metropolitan Environmental Management from the National University of Buenos Aires. He has worked for 17 years at the Emergency Coordination Unit of Argentina’s Ministry of Federal Planning, Public Investment and Services on the resettlement of the very poor living in areas affected by flooding and on the planning and coordination of housing programs using self-construction and mutual assistance. He has also
About the Authors and Contributors

121About the Authors
worked in private sector management positions in construction companies. He is a co-author of: Viviendas por autoconstrucción. La experiencia en el programa de protección contra las inundaciones [Self-Built Homes. Experience with the Flood Protection Program] and Arquitectura para la emergencia social y ambiental [Architecture for Social and Environmental Emergencies] ([email protected] [email protected]).
Ronaldo Marques, a Brazilian, studied pub-lic administration and has a post-graduate degree in economics from the University of Campinas. He has 25 years’ experience in the field of socio- environmen-tal studies. Currently, he is the Coordinator of Brazil’s Special Committee on the Environment of Companhia Paulista de Trens Metropolitanos (CPTM). In 2004, he served as Municipal Secretary for Services of the Mu-nicipality of Sao Paulo ([email protected]).
Marilia Scombatti, a Brazilian, studied so-ciology and has an M.A. in Urban Planning from the University of the Sorbonne. She has 30 years’ experi-ence with involuntary resettlement projects. She has been a consultant for private sector enterprises, the In-ter-American Development Bank and the World Bank. Her areas of expertise include: social and environmental impact mitigation; resettlement plans; media programs; environmental training; and the monitoring and evalu-ation of social program outcomes. She has worked in Argentina, Bolivia, Brazil, Ecuador, Guatemala, Hondu-ras, Paraguay, Peru, Uruguay and Venezuela ([email protected]).
Eduardo Aguirre Cantero, a Guatemalan, is an architect who graduated from the University San Carlos de Guatemala and specializes in risk management. He has served in several government posts, including the Manager of the Office of the President and the Vice President of the Republic. From 2006-2008 he was Coordinator General of Guatemala’s Reconstruction with Transformation Plan following Hurricane Stan. He was also National Coordinator of Pro Habitat (Production and Housing), a UN and Guatemalan government project to design 60 urban centers for risk prevention and mitigation. He was National Coordinator of the reconstruction and risk management component of the municipal local development program supported by the German Cooperation agency (GTZ), and Assistant Secretary of the Peace Secretariat. He has also served as Dean of the Architecture Faculty
at the University of San Carlos, Director of the Farusac Research Center, professor and founder of M.A. programs in Human Settlements and Environmental Protection. He has also been a consultant for UNDP, the World Bank and the GTZ. He has won national and international awards for his work promoting housing for low-income families. Publications include: Historia de la Arquitectura contemporánea de Guatemala (1997) [The History of Contemporary Guatemalan Architecture] and Arquitectura vernácula guatemalteca (1991) [Guatemalan Vernacular Architecture]. He has been editor/director of the journals Resultados and En obra, published by the Architecture Faculty of the University of San Carlos. Currently, he is Sustainable Development and Institutional Relations Manager at Cementos Progreso S.A. ([email protected]).
Narzha Poveda Gómez, a Colombian, has a B.A. in Social Sciences and an M.A. in Educational and Social Development from the National Pedagogical University of Colombia. She has 29 years’ experience working on social development projects and environmental impact studies, as well as teaching post-graduate courses, and consultancy work. She worked for nine years on resettlement of populations at risk or disaster, coordinated interdisciplinary teams and formulated public policies. She also participated in the preparation of a resettlement toolkit and roadmap. She has also prepared and conducted national and regional socioeconomic studies ([email protected]).
Sergio Iván Carmona Maya (1962-2009), a Colombian, was an anthropologist who studied at the University of Antioquia and obtained an M.A. in Ibero-American Political Systems and an Advanced Studies Diploma in Governance and Democracy. For 15 years he worked as a strategy and development specialist on inter-connected electricity grids in Colombia. He was a World Bank consultant, an advisor in Colombia to several government institutions. He was a professor, or-ganizer of the M.A. degree in Environmental Manage-ment at the National University of Colombia, and the director-founder of its Laboratory on Environmental Conflicts and Development. He wrote and co-authored books and articles on subjects relating to the social and cultural dimensions of environmental impacts, anthro-pology and sustainable development, social manage-ment, inter-cultural relations, conflict mediation and environmental management in development projects. He died in December 2009.

Preventive Resettlement of Populations at Risk of D
isaster: Experiences from Latin A
merica
Preventive Resettlement of Populations at Risk of DisasterExperiences from Latin America
Elena CorreaEditor
Preventive Resettlement of Populations at Risk of DisasterExperiences from Latin America
The Latin American and the Caribbean Region faces two increasingly stark trends: rapid urbanization and
frequent natural disasters. Combined, they substantially increase the intensive risk of disasters to which
thousands of people are exposed.
Preventive Resettlement of Populations at Risk of Disaster: Experiences from Latin America presents case
studies from Argentina, Brazil, Colombia and Guatemala that offer an overview of the countries’ main
hazards and their disaster risk-management systems. Also, they illustrate how preventive resettlement has
been incorporated as a disaster risk-reduction measure, and describe resettlement alternatives, institutional
arrangements, sources of financing and recovery and control of reclaimed areas.
These experiences provide important lessons for future interventions and can help other countries currently
developing risk reduction strategies.
Global Facility for Disaster Reduction and Recovery1818 H Street, NWWashington, DC 20433, USATelephone: 202-458-0268Facsimile: 202-522-3227Web site: www.gfdrr.org