expensive children in poor families: the intersection of childhood disabilities and ... · pdf...
TRANSCRIPT

Expensive Children in Poor Families: The Intersection ofChildhood Disabilitiesand Welfare
• • •
Marcia K. MeyersHenry E. BradyEva Y. Seto
2000
PUBLIC POLICY INSTITUTE OF CALIFORNIA

Library of Congress Cataloging-in-Publication DataMeyers, Marcia.
Expensive children in poor families : the intersection of childhood disabilities and welfare / Marcia K. Meyers, Henry E. Brady, Eva Y. Seto.
p. cm.Includes bibliographical references.ISBN: 1-58213-055-8
1. Handicapped children—Care—California—Costs. 2. Aid to families with dependent children programs—California. I. Brady, Henry E. II. Seto, Eva Y., 1970– III. Title.
HV889.C3 M49 2000362.4'048'08309794—dc21 00-062658
Research publications reflect the views of the authors and do notnecessarily reflect the views of the staff, officers, or Board ofDirectors of the Public Policy Institute of California.
Copyright © 2000 by Public Policy Institute of CaliforniaAll rights reservedSan Francisco, CA
Short sections of text, not to exceed three paragraphs, may be quotedwithout written permission provided that full attribution is given tothe source and the above copyright notice is included.

iii
Foreword
President Clinton’s promise to “end welfare as we know it” wasfulfilled with the passage of the Personal Responsibility and WorkOpportunity Reconciliation Act of 1996. Most observers attribute theunprecedented decline in welfare dependency since then to a robusteconomy as well as to welfare reform, but the benefits of this economicactivity have been spread unevenly. Previous PPIC studies havedocumented the formidable obstacles facing welfare recipients withoutbasic skills as well as the mismatch between the experiences of low-income, never-married parents on the one hand and welfare regulationsand the child support system on the other. In Expensive Children in PoorFamilies: The Intersection of Childhood Disabilities and Welfare, Marcia K.Meyers, Henry E. Brady, and Eva Y. Seto focus attention on anothergroup of low-income families and the difficulties they face in moving offpublic assistance.
The report’s main concern is to estimate the private costs and publiceffects of childhood disabilities, which the authors define as chronicphysical, mental, and emotional conditions that limit activities, learning,and healthy development. After extensive interviews with householdheads in four California counties, the authors conclude that 20 to 25percent of welfare families have a disabled or chronically ill mother orchild. Not surprisingly, they find that the direct and indirect costs ofcaring for these family members are a major factor in continued welfaredependency. Employable members of such families not only have greaterdemands on their time for home care of the disabled child, but asubstantial share of the income they do secure is used to pay forspecialized goods and services related to the child’s disability or chronicillness. In short, a disabled child in the home presents a significantobstacle to economic self-sufficiency for these families.
The authors conclude that public assistance may be an essential partof an income packaging strategy for families with extraordinary private
iv
costs. To force these families to achieve full independence from means-tested programs would risk imposing other forms of hardship on alreadydisadvantaged children. The public policy challenge facing California isto design an integrated system of multiple benefits, one that lets thefamily achieve a substantial level of financial independence yet supportsthe extra cost of a disability with the right mix of SSI, Food Stamps,health insurance, and general public assistance. Because these programshave different eligibility rules, funding sources, and service agencies, thehard policy work will be in the details of such a system. In this report,the authors show how (and how much) child disabilities hold familiesback from true income security. The challenge for policymakers is to usethis evidence to design an integrated program that will serve vulnerablefamilies today and into the future.
David W. LyonPresident and CEOPublic Policy Institute of California

v
Summary
All children require care, but children who have exceptional needsbecause of a physical disability, chronic health problem, or mental ordevelopmental impairment often require exceptional levels of care. Thecosts of this care are borne by families, communities, and publicprograms. Childhood disabilities and illnesses are not confined by class,race, or income. However, poor children living in poor neighborhoodsare far more likely than their more affluent peers to suffer from theseconditions.
When poverty and disabilities intersect, the costs associated withchildren’s care have particularly important implications for their familiesand for society. Poverty-related compromises in living conditions andhealth care elevate the risk that children will suffer from chronic anddisabling conditions. At the same time, the care of a disabled or ill childcan increase the risk that the family will be poor by imposing direct costsfor medical and other care and indirect costs in the form of forgoneearnings.
Childhood disabilities in poor families impose public costs as well.Some of these costs are associated with targeted services such as specialeducation that are provided regardless of income. Others are associatedwith means-tested programs, particularly the Supplemental SecurityIncome (SSI) program for low-income disabled children and adults. Stillother costs are borne by the public sector when these families receivemeans-test assistance that is not targeted on disabled children, includingMedicaid, welfare, and Food Stamps.
Although the private and public costs of caring for exceptionalchildren may be high, we know relatively little about their magnitude ortheir distribution between families and government. Programs to aidlow-income families have undergone change in recent years. Reformshave affected programs that are targeted specifically on disabled children,such as the SSI program, and others, such as welfare, that are not

vi
specifically targeted but include large numbers of families caring fordisabled children. As these policy reforms are evaluated and modified, itwill be important to bring to bear the best and most extensiveinformation possible to craft more effective policy approaches. Nowhereis this need for information greater than on issues of the costs of caringfor disabled and ill children.
This study uses survey and administrative data collected in the mid-1990s in the State of California to examine the public and private costsassociated with children in families at the intersection of twopopulations: those served by public welfare programs and those caringfor disabled children. We consider direct private costs for families, in theform of out-of-pocket expenditures for disability-related goods orservices, and the indirect private costs of forgone employment income.We consider public costs by examining rates and duration ofparticipation in means-tested cash assistance programs. We concludethat poor parents with disabled children often face dismaying tradeoffsbetween meeting the special needs of their children or meeting the basicneeds of their families, and between working or caring for their children.Assistance provided through public programs, particularly Medicaid orSupplemental Security Income (SSI), may reduce these tradeoffs andresulting compromises in families’ well-being.
Data and MethodsDefining “costly” childhood disabilities poses a number of
difficulties. For adults, the cost of a disability is equated with lostearning capacity and income. In the case of children, this approachseems too limited and even flawed. Many childhood disabilities andillnesses do reduce children’s capacities in ways that have implications fortheir human capital and long-term earning prospects. In the short term,however, these conditions impose costs not through lost earnings, sincechildren do not work, but through direct demands on families’ financialand time resources and through the reduction in the quality of the child’severyday experiences. A more useful basis for defining childhoodconditions, therefore, is one that captures the extent of the child’slimitations and the corresponding burden on families’ resources.

vii
To estimate the costs of caring for children, we need data onchildren’s disabilities and costs in a representative sample of poorfamilies. Such data are hard to come by because very few surveys ask thein-depth questions needed to determine the scope and severity ofdisabilities; even fewer measure costs. For this study, we take advantageof data from in-depth interviews conducted with a representative sampleof 1,764 English- and Spanish-speaking welfare households from fourCalifornia counties: Alameda, and San Joaquin in the north and LosAngeles and San Bernardino in the south. An initial stratified randomsample of about 15,000 single- and two-parent welfare (AFDC) recipientfamilies was selected in October 1992 from administrative records of theCalifornia Department of Social Services; a subsample of English- andSpanish-speaking households was randomly selected from this sampleand interviewed twice by phone. Wave I interviews were conducted in1993–94. We base most of our analysis upon an 18- to 24-monthfollow-up (Wave II) interview that was conducted in 1995–96, to whichwe added detailed questions about children’s disabilities and family costs.
Prevalence and Types of Children’s Disabilities
Prevalence of DisabilitiesDisabilities and chronic illnesses affected a significant share of the
welfare recipient population in California. Between one-fifth and one-quarter of families who were in or had recently left welfare had a disabledor ill mother or child; about half of these families (10 to 12 percent ofthe welfare population) had a disabled child. Between 3 and 5 percent offamilies cared for children with severe limitations. Given falling welfarecaseloads, it is likely that the prevalence of disability or illness amongthose who remain on welfare has grown since these interviews wereconducted in the mid-1990s.
Types of Children’s DisabilitiesThe children in these families suffered from a wide range of limiting
conditions, and their special needs imposed both direct and indirect costson their families. For about three-quarters of these children, the primarycondition reported by the mother was physical; for the remaining one-

viii
quarter, it was a mental, developmental, or emotional problem. Thecorrelation between condition and the severity of children’s limitations isweak. There were few conditions that did not impose costs on somefamilies. However, the frequency and magnitude of direct costs, and ofindirect costs in the form of forgone earnings, were related to the numberof disabled children in a family and to the severity of their disabilities.
Private Costs of Children’s Disabilities
Special ExpensesAbout 45 percent of families reported that they incurred extra direct
costs for specialized child care, special clothes, special foods,transportation, medicine, or health care for their special needs child orchildren in the prior month. Those costs averaged $134 for thosefamilies with any expenses (or $62 per month across all families, withand without expenses).
Work ReductionFamilies also incurred indirect costs in the form of work reductions
and forgone maternal earnings. Mothers with more than one moderatelydisabled child, or with any severely disabled children, were 20 to 30percentage points less likely to have worked in the previous month thanwere mothers with healthier children. Using multivariate techniques tocontrol for other individual and labor market factors, we estimate thatcare for a severely disabled child translates into $80 in forgone earningsper month, as a result of both lower probabilities of employment andreduced hours of work.
Material Hardships and PovertyThese financial burdens also translate into direct, material hardship
for these families. Unless they received SSI, families with disabledchildren were more likely to be poor or extremely poor than otherfamilies, and direct out-of-pocket expenditures pushed between 4 and 12percent of already poor families with disabled children into extremepoverty at 75 percent of the federal poverty line. The consequences foreconomic well-being were severe. Families with disabled children were

ix
not only more likely than other families to be extremely poor, they werealso more likely to report experiencing concrete hardship. About 17percent of families with only healthy, nondisabled children reported thatchildren had gone hungry in the prior year because the family lackedmoney for food, but one-third or more of families with any disabled orchronically ill children reported hunger. In 22 percent of families withonly healthy children, adults had gone hungry; between 33 and 73percent of families caring for exceptional children experienced hungeramong adults. Families with extra caregiving responsibility were alsomore likely to have had difficulty paying their housing costs, to haveexperienced eviction or periods of homelessness, and to have had phoneor utility shutoffs because they could not pay their bills.
The Public Costs of Care
Receipt of Special ServicesFamilies with special needs children sometimes received specialized
services for these children, and the likelihood of participation in suchprograms increased with the severity of children’s disabilities. Theproportion of families with a child in a special education or earlyintervention program increases from over 43 percent of those with asingle, moderately impaired child to 75 percent of families with morethan one impaired child, at least one of whom was severely limited.Families were much less likely to be receiving case management fromCalifornia Children’s Services or Community Mental Health Services.Among families with a single, moderately disabled child, about 7 percentreceived services from California Children’s Services, and 11 percent gothelp for their child through Community Mental Health Services.Among families with multiple and severely limited children, 25 percentwere assisted through California Children’s Services and 32 percentthrough Community Mental Health Services.
Receipt of Public AssistanceFamilies with disabled and ill children were also more likely than
families with only healthy children to participate in nontargeted transferprograms for the poor, including welfare, Food Stamps, public housing,
x
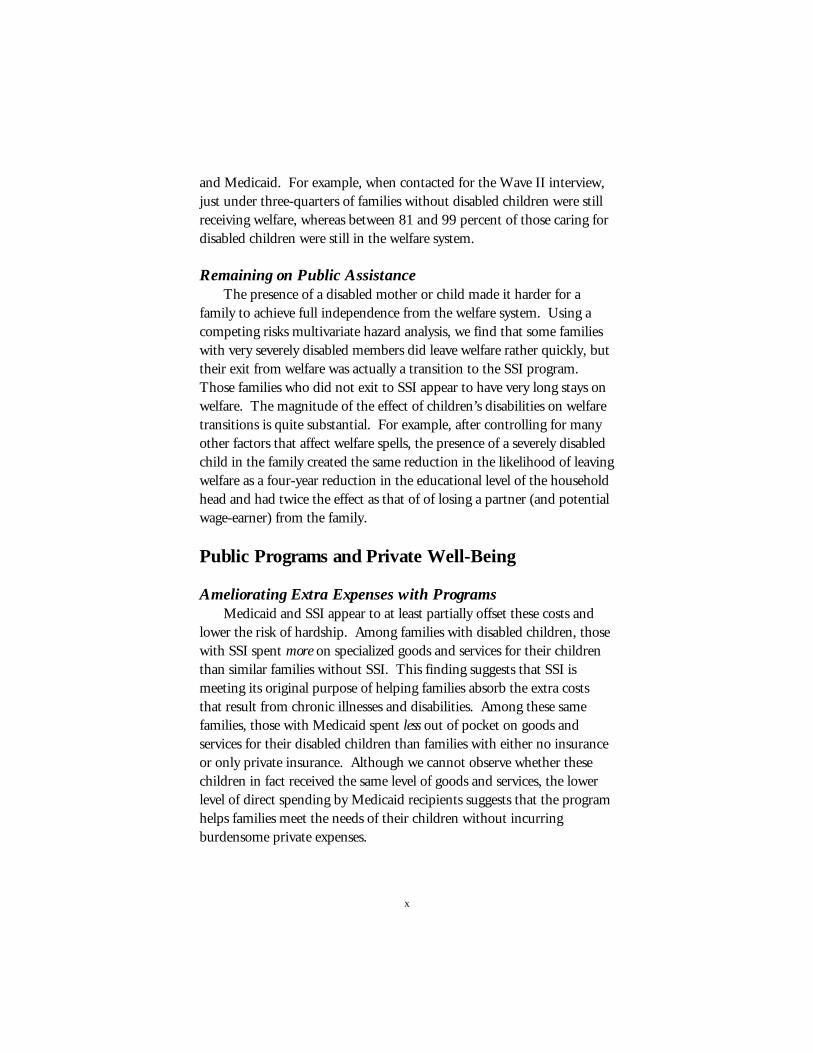
and Medicaid. For example, when contacted for the Wave II interview,just under three-quarters of families without disabled children were stillreceiving welfare, whereas between 81 and 99 percent of those caring fordisabled children were still in the welfare system.
Remaining on Public AssistanceThe presence of a disabled mother or child made it harder for a
family to achieve full independence from the welfare system. Using acompeting risks multivariate hazard analysis, we find that some familieswith very severely disabled members did leave welfare rather quickly, buttheir exit from welfare was actually a transition to the SSI program.Those families who did not exit to SSI appear to have very long stays onwelfare. The magnitude of the effect of children’s disabilities on welfaretransitions is quite substantial. For example, after controlling for manyother factors that affect welfare spells, the presence of a severely disabledchild in the family created the same reduction in the likelihood of leavingwelfare as a four-year reduction in the educational level of the householdhead and had twice the effect as that of of losing a partner (and potentialwage-earner) from the family.
Public Programs and Private Well-Being
Ameliorating Extra Expenses with ProgramsMedicaid and SSI appear to at least partially offset these costs and
lower the risk of hardship. Among families with disabled children, thosewith SSI spent more on specialized goods and services for their childrenthan similar families without SSI. This finding suggests that SSI ismeeting its original purpose of helping families absorb the extra coststhat result from chronic illnesses and disabilities. Among these samefamilies, those with Medicaid spent less out of pocket on goods andservices for their disabled children than families with either no insuranceor only private insurance. Although we cannot observe whether thesechildren in fact received the same level of goods and services, the lowerlevel of direct spending by Medicaid recipients suggests that the programhelps families meet the needs of their children without incurringburdensome private expenses.

xi
Reducing Poverty and Hardship Through Public ProgramsEven more compelling evidence of the role of government programs
in offsetting costs is provided by our simulation of poverty and hardship.By using multivariate methods, we are able to control for otherindividual and family factors that may explain the higher levels ofeconomic disadvantage observed among families with disabled children.After controlling for these factors, we find that the presence of a severelydisabled child increased the likelihood that a family experienced materialhardship by as much as 30 percentage points. For families that receivedSSI, however, the chances of going hungry, falling behind in their bills,being evicted, or having utilities shut off were about the same as those offamilies with only healthy children.
ConclusionsOur empirical analyses yield five broad conclusions. First, we find
that a surprisingly high proportion of poor, welfare-reliant familiesabsorb costs related to the care of disabled family members.
Our second conclusion is that childhood disabilities sometimesimpose very high costs on very poor families. This may force someparents to make tradeoffs between meeting the needs of their childrenand meeting the basic needs of their families.
Our third conclusion is that parents with disabled children facetradeoffs not only in the purchase of basic goods and services but also intheir allocation of time. Mothers with atypical children may find it moredifficult than most to combine their caregiving work with employment,as evidenced by lower probabilities of employment and, among thoseemployed, fewer hours of work.
Our fourth and related conclusion is that childhood disabilities andmeans-tested welfare use are closely intertwined. Families with seriouslydisabled children may be more likely to receive means-tested assistancethan are families with only healthy children, and, once on aid, they aremuch less likely to leave. Some families with a disabled child leavewelfare through a transition to the SSI program. If they do not, having adisabled child greatly reduces families’ chances of leaving welfare.

xii
Our fifth and final conclusion is that the SSI and Medicaid programsappear to be working fairly well to help protect highly vulnerable familiesfrom the risk of economic insecurity and material hardship. Publicprograms may reduce these risks either by increasing the resources thatfamilies have available for specialized purchases or by offsetting the costsof specialized goods and services directly. To the extent that publicprograms have these effects, receipt of cash and in-kind assistance mayserve an important role in promoting families’ economic security andability to care for special needs children at home. Recent policy reformshave focused heavily on reducing welfare reliance. For families who bearextraordinary private caregiving costs, however, concerns about welfaredependence may be misplaced. In fact, assistance from public programsmay be an essential part of an income packaging strategy for families whoassume extraordinary caregiving costs.
As a result of these findings, we make the followingrecommendations regarding policies affecting families with disabledchildren.
First, low-income families with severely disabled children shouldcontinue to receive unrestricted cash assistance through SSI. This policyappears to be well justified by the costs these families assume. Ourfindings indicate that these costs are intermittent and highly variable,even across families whose children have the same condition. Althoughthese qualities might justify more precise targeting of benefits, suchtargeting is likely to be both expensive and intrusive. In particular,dispensing restricted cash assistance, vouchers, or in-kind benefits asneeded would greatly increase the administrative costs for governmentand the application burden for families.
Second, the extension of Medicaid to families with disabled childrenis crucial. Disabled and chronically ill children are among those mostmedically at risk if they do not get appropriate preventive and ongoinghealth care. Their parents are among those who face the gravest financialrisks if they lose health insurance for their children. For low-incomefamilies with disabled and chronically ill children, policies that guaranteecontinuous coverage and access are particularly crucial, both to increasemedical security for these children and to provide an employmentincentive for their parents.
xiii
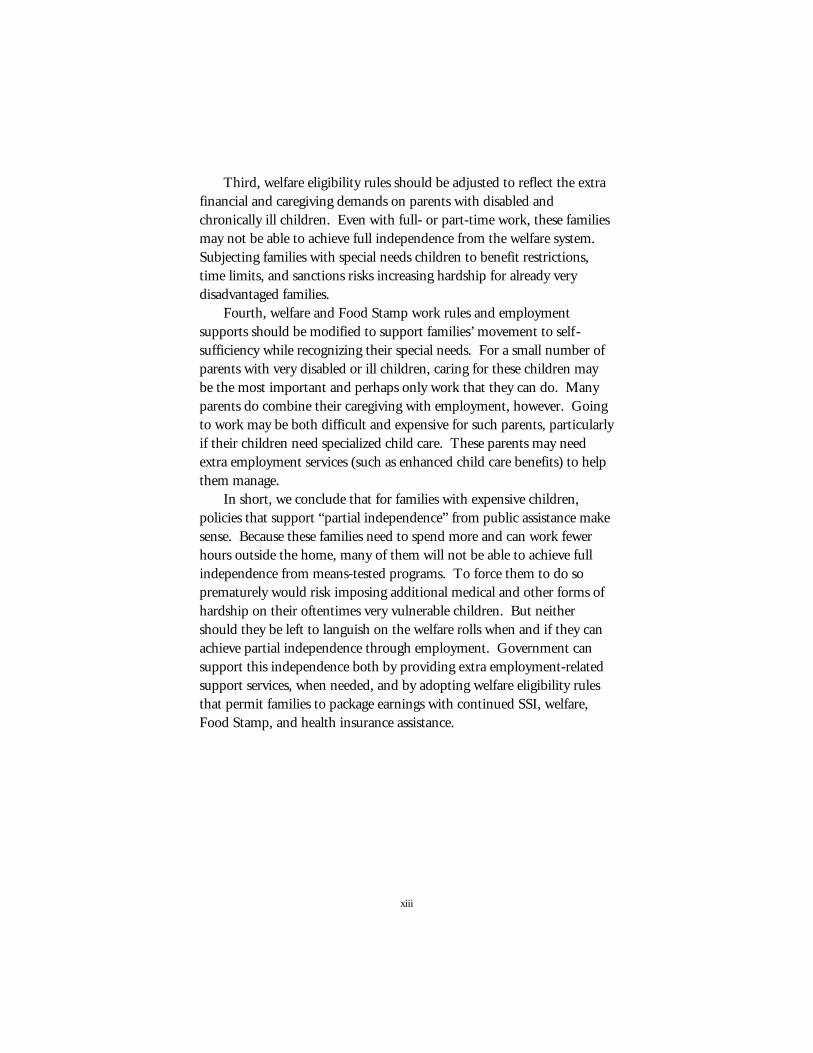
Third, welfare eligibility rules should be adjusted to reflect the extrafinancial and caregiving demands on parents with disabled andchronically ill children. Even with full- or part-time work, these familiesmay not be able to achieve full independence from the welfare system.Subjecting families with special needs children to benefit restrictions,time limits, and sanctions risks increasing hardship for already verydisadvantaged families.
Fourth, welfare and Food Stamp work rules and employmentsupports should be modified to support families’ movement to self-sufficiency while recognizing their special needs. For a small number ofparents with very disabled or ill children, caring for these children maybe the most important and perhaps only work that they can do. Manyparents do combine their caregiving with employment, however. Goingto work may be both difficult and expensive for such parents, particularlyif their children need specialized child care. These parents may needextra employment services (such as enhanced child care benefits) to helpthem manage.
In short, we conclude that for families with expensive children,policies that support “partial independence” from public assistance makesense. Because these families need to spend more and can work fewerhours outside the home, many of them will not be able to achieve fullindependence from means-tested programs. To force them to do soprematurely would risk imposing additional medical and other forms ofhardship on their oftentimes very vulnerable children. But neithershould they be left to languish on the welfare rolls when and if they canachieve partial independence through employment. Government cansupport this independence both by providing extra employment-relatedsupport services, when needed, and by adopting welfare eligibility rulesthat permit families to package earnings with continued SSI, welfare,Food Stamp, and health insurance assistance.

xv
Contents
Foreword..................................... iiiSummary..................................... vFigure....................................... xviiTables....................................... xixAcknowledgments ............................... xxi
1. INTRODUCTION........................... 1
2. POOR FAMILIES WITH EXPENSIVE CHILDREN .... 7
3. MEASURING DISABILITIES AND COSTS .......... 15Private Costs of Childhood Disabilities ............... 15Public Costs of Childhood Disabilities ............... 16Public Policy Dilemmas: The Case of SSI ............. 17The Policy Conundrums ........................ 20Defining Disabilities........................... 21Estimating Costs ............................. 23Avoiding Waste, Abuse, and Undesirable Incentives ....... 24
4. DATA AND METHODS ....................... 27The Data .................................. 27Sample Characteristics and Generalizability ............ 30Analysis of Private Costs ........................ 33Analysis of Public Costs......................... 34
5. THE PRIVATE COSTS OF CARE ................ 37Prevalence of Disabilities ........................ 37Types of Disabilities ........................... 44The Frequency and Magnitude of Direct Costs.......... 46The Frequency and Magnitude of Indirect Costs ......... 50The Economic Consequences for Families: Poverty and
Hardship............................... 53
6. THE PUBLIC COSTS OF CARE.................. 57Disabilities and Public Program Participation ........... 57Disabilities and Welfare Exits ..................... 60
xvi
7. PUBLIC PROGRAMS AND PRIVATE WELL-BEING ... 65Public Programs and Private Spending ............... 66Public Programs and Economic Well-Being ............ 68
8. CONCLUSIONS AND POLICY IMPLICATIONS...... 71Conclusions ................................ 71Implications for Policy ......................... 76
AppendixA. Maternal Employment Estimation .................. 83B. Event History Analysis of Welfare Transitions .......... 87C. Hardship Estimation .......................... 93D. Disability Measures ........................... 99
Bibliography .................................. 107
About the Authors ............................... 115

xvii
Figure
1.1. Expensive Children in Poor Families .............. 4

xix
Tables
4.1. Household Characteristics in Cross-Sectional SampleCompared to the California and U.S. WelfarePopulations.............................. 31
5.1. Coding of Severity: Disabilities and Chronic Illnesses ... 385.2. Summary of Prevalence of Mother and Child
Disabilities .............................. 395.3. Prevalence of Mother and Child Disabilities in Cross-
Sectional Sample .......................... 405.4. Prevalence of Mother and Child Disabilities in New to
Welfare Sample ........................... 415.5. Comparison of Prevalence of Disabilities to Other Data
Sources................................. 425.6. Distribution of Child Disabilities by Diagnosis of First
Child with Disability for Households with DisabledChildren................................ 45
5.7. Out-of-Pocket Disability-Related Expenses of Familieswith Disabled Children ...................... 47
5.8. Distribution of Out-of-Pocket Disability Expenses forFamilies with Disabled Children ................ 48
5.9. Distribution of Out-of-Pocket Expenses by Diagnosis forHouseholds with One Disabled Child ............. 49
5.10. Employment Rates by Child Disability for All Families .. 515.11. Selected Results, Impact of Childhood Disabilities on
Mothers’ Employment in the Prior Month .......... 525.12. Percentage of Households with Hardship Since Last
Interview by Child Disability for All Families ........ 556.1. Program Participation by Number and Severity of
Disabled Children for All Families ............... 596.2. Competing Risks Model of Transitions off AFDC ..... 637.1. Out-of-Pocket Disability-Related Expenses of Families
with Disabled Children ...................... 67

xx
7.2. Predicted Impact of Child Disability and SSI Receipt onFamily Economic Well-Being .................. 70
A.1. Independent Variables in Employment Estimation:Means and Standard Deviations................. 85
A.2. Effect of Childhood Disabilities on Mothers’Employment in the Prior Month ................ 86
B.1. Competing Risks Weibull Model of Transitions offAFDC ................................. 91
C.1. Independent Variables in Poverty and HardshipEstimations.............................. 95
C.2. Logistic Regression Results of Probability the FamilyExperienced Poverty in the Prior Month ........... 96
C.3. Logistic Regression Results of Probability the FamilyExperienced Hardship in the Prior Year ............ 97
D.1. Survey Questions .......................... 100

xxi
Acknowledgments
We gratefully acknowledge the substantive contributions of TimothySmeeding, Samantha Luks, and Anna Lukemeyer, all of whomcollaborated on portions of this research. The U.S. Department ofHealth and Human Services, Office of the Assistant Secretary forPlanning and Program Evaluation, and the California Department ofSocial Services provided additional support for this research. WernerSchink and his staff at the CDSS provided the framework that made thisresearch possible.
We are also grateful for the feedback of several reviewers anddiscussants who read earlier versions of this research for presentation atthe Association for Public Policy Analysis and Management EighteenthAnnual Research Conference (1996); the Thirty-Sixth Annual NationalAssociation for Welfare Research and Statistics Annual Conference (1996),and the Association for Public Policy Analysis and Management SeventeenthAnnual Research Conference (1995). A portion of the findings have beenreported in M. K. Meyers, A. Lukemeyer, and T. Smeeding, “The Costof Caring: Public and Private Costs of Childhood Disabilities in PoorFamilies,” Social Service Review, Vol. 72, No. 1, 1998, pp. 209–233; andA. Lukemeyer, M. Meyers, T. and T. Smeeding, “Expensive Children inPoor Families: Out-of-Pocket Expenditures for the Care of Disabled andChronically Ill Children in Welfare Families,” Journal of Marriage andthe Family, Vol. 62, No. 2, 2000, pp. 399–415.
Finally, we would like to dedicate this work to the memory of KarenGarett, who helped us design the survey on which much of this analysiswas based. In this study, as in many others, Karen helped formulate theresearch hypotheses, made sure that the questionnaire got theinformation needed to test those hypotheses, and carried out the fieldwork involving a very hard-to-reach population.
Although this report reflects the contributions of many people, anyerrors of fact or interpretation are the responsibility of the authors alone.

1
1. Introduction
All children require care, but children who have exceptional needsbecause of a physical disability, chronic health problem, or mental ordevelopmental impairment often require exceptional levels of care. Thecosts of this care are borne by families, communities, and publicprograms. Childhood disabilities and illnesses are not confined tochildren of any one class, race, or income group. Poor children,however, are far more likely than are their more affluent peers to sufferfrom these conditions.
When poverty and disabilities intersect, the costs associated withchildren’s care have particularly important implications for their familiesand for society. Poverty-related compromises in living conditions andhealth care elevate the risk that children will suffer from chronic anddisabling conditions. At the same time, the care of a disabled or ill childcan increase the risk that the family will be poor by imposing direct costsfor medical and other care and indirect costs in the form of forgoneearnings.
Childhood disabilities in poor families impose higher public costs aswell. Some of these costs are associated with targeted services fordisabled children, such as special education, that are provided regardlessof income. But others are associated with means-tested programs,particularly the Supplemental Security Income (SSI) program for low-income disabled children and adults. Still other costs are borne by thepublic sector when these families receive means-test assistance that is nottargeted on disabled children, including Medicaid, public assistance, andFood Stamps.
The number of children receiving assistance through targeteddisability programs grew dramatically in the 1980s. The growth incaseloads and costs was particularly dramatic in the SSI program,following administrative and legal actions that broadened eligibilitycriteria for children. The number of child SSI cases doubled between

2
1989 and 1991, for example, following the Zelby v. Sullivan SupremeCourt decision that expanded the basis for determining child eligibility.
This growth in the child caseload fueled considerable debate aboutthe purposes of cash assistance for families with disabled children andabout the processes through which such families are identified. Thisdebate intensified as it became clear that caseloads were also growing fortwo other, more controversial groups of recipients—adult drug addictsand aged immigrants. Studies of caseload growth also revealed, to thesurprise and concern of some federal lawmakers, that many state welfareagencies were taking active steps to shift welfare recipients from state andstate-federal welfare programs to the federally funded SSI program.
Fueled by concerns over caseloads and costs, and by speculation thatstate welfare agencies and families might be exaggerating children’sconditions to qualify them for the more generous SSI benefits, Congressplaced significant new restrictions on SSI eligibility as part of the 1996Personal Responsibility and Work Opportunities Act. The 1996legislative changes to the SSI program for children were implementedwith considerable vigor by local offices. They were also implementedwith substantial variation in different regions of the country, leading towide variation in the proportion of cases that were denied or terminatedunder the new rules. This variation led to another round ofadministrative reforms, and the review and reinstatement of a portion ofthe child cases terminated under the 1996 rules.
The debate over the Supplemental Security Income program, andthe reactive process of policy reform, reflected long-standing ambiguitiesabout the purposes of children’s SSI benefits. SSI was created in 1974 tosupport fully disabled or aged adults who were unable to work but didnot have sufficient work history to qualify for Disability Insurance orSocial Security benefits. Although children clearly did not qualify forbenefits due to lost earning ability, Congress recognized that familieswho cared for disabled children were likely to incur special costs andrestrictions on their labor force participation associated with the care ofthese children. However, there were few reliable data on the incidence ormagnitude of these costs that could be used to resolve questions aboutthe need for this assistance.
3
Information about the costs of caring for disabled and chronically illchildren was hardly better when Congressional lawmakers turned theirattention to the child SSI program in the 1990s. Data are readilyavailable about total public expenditures for some targeted programs suchas special education and Supplemental Security Income. Less is knownabout the public costs that result from families’ participation in other,nontargeted programs such as Medicaid and welfare. Private costs—those born solely by the families of special needs children—have receivedeven less attention. Yet the two aspects of the cost of caring are clearlyrelated. The magnitude of the private costs for families has implicationsfor their participation in a variety of public programs that partially offsetthese costs. And, as Jacobs and McDermott (1989) point out, “cost-cutting” with respect to public programs may be simply “cost-shifting”onto affected families.
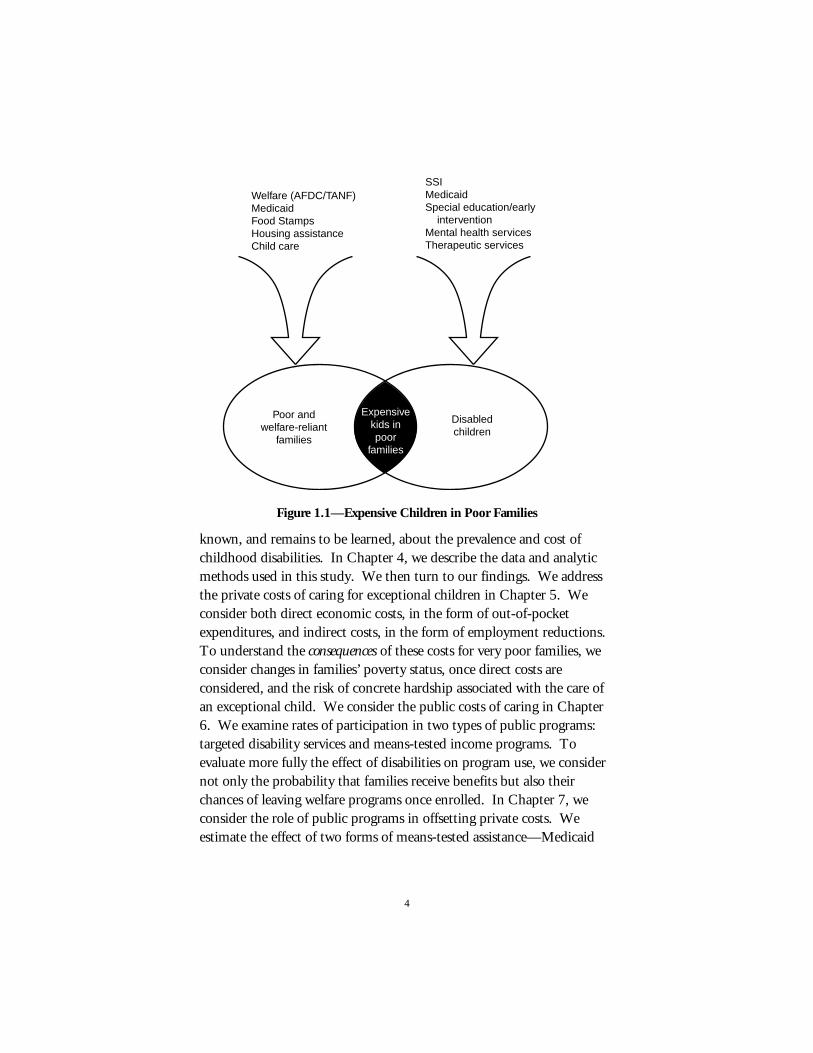
The debate over the purpose of the SSI program for children, andover the level of benefits to be provided, has yet to be fully resolved.New questions have arisen in the wake of the 1996 welfare reforms aboutthe interaction between SSI and welfare benefits, and about the needs offamilies in the welfare system who care for disabled children. This studybegins to answer these questions using survey and administrative datafrom the State of California to examine the public and private costsassociated with children in families at the intersection of twopopulations: those served by public welfare programs and those caringfor disabled children (Figure 1.1). These are not the only families whoincur costs or who have been affected by changes to the SSI program.However, they are a particularly important and interesting populationbecause they are potentially subject to both welfare reforms and changesin SSI eligibility. They are also among the poorest families who care forspecial needs children and therefore the most vulnerable to exceptionalcaregiving costs.
In Chapter 2, we present several scenarios that profile thecircumstances and needs of families caring for disabled and chronically illchildren. These scenarios describe families who were interviewed as apart of a larger study of welfare-reliant families in California. We usethem to illustrate some of the issues and costs that arise when poorfamilies care for expensive children. In Chapter 3, we review what is
4
Welfare (AFDC/TANF)MedicaidFood StampsHousing assistanceChild care
SSIMedicaidSpecial education/early interventionMental health servicesTherapeutic services
Poor and welfare-reliant
families
Disabledchildren
Expensivekids inpoor
families
Figure 1.1—Expensive Children in Poor Families
known, and remains to be learned, about the prevalence and cost ofchildhood disabilities. In Chapter 4, we describe the data and analyticmethods used in this study. We then turn to our findings. We addressthe private costs of caring for exceptional children in Chapter 5. Weconsider both direct economic costs, in the form of out-of-pocketexpenditures, and indirect costs, in the form of employment reductions.To understand the consequences of these costs for very poor families, weconsider changes in families’ poverty status, once direct costs areconsidered, and the risk of concrete hardship associated with the care ofan exceptional child. We consider the public costs of caring in Chapter6. We examine rates of participation in two types of public programs:targeted disability services and means-tested income programs. Toevaluate more fully the effect of disabilities on program use, we considernot only the probability that families receive benefits but also theirchances of leaving welfare programs once enrolled. In Chapter 7, weconsider the role of public programs in offsetting private costs. Weestimate the effect of two forms of means-tested assistance—Medicaid

5
and SSI—on families’ ability to absorb the direct costs of care withoutfinancial hardship. In the final chapter we summarize our conclusionsand consider policy recommendations, returning to the family scenarios(from Chapter 2) to illustrate our conclusions.
7
2. Poor Families with ExpensiveChildren
Our understanding of the private costs of caring for disabled childrenis limited, in part because it so difficult to generalize the experiences ofthese families. The costs of caring for exceptional children are as diverseas children’s special needs. The hardship that these costs impose onfamilies is as varied as the families. Although our primary aim in thisstudy is to draw general conclusions about these costs and hardships, it isuseful to begin by considering individual cases. The following “scenarios”describe the characteristics of several families interviewed for this study.Although the study did not use the type of qualitative, in-depth interviewsthat would be appropriate for developing case studies, the detailed natureof the interview allows us to sketch “scenarios” for a few families usingtheir responses to standardized survey questions about their income,expenses, living situation, and family health. These scenarios are notmeant to be representative of the population in statistical terms. Rather,they are illustrative of the wide-ranging and diverse situations of families.Each family cared for at least one severely disabled child. All were onwelfare in October 1992 and were interviewed twice over a period of threeyears until 1995. The sample of families, the data collection procedures,and the interview questions (including the definitions of moderate andsevere disability) are described more fully throughout this report, butthese profiles can be understood without a detailed grasp of these matters.They provide a sense of the difficulties and tradeoffs that poor familieswith severely disabled children may confront.
• Matilda [30812],1 33 years old, was born in Mexico and lived inAlameda County until a few years ago. She is now separated
____________ 1This is the case number in the California Work Pays Demonstration Project
Survey: English/Spanish Interviews Wave II. All names are fictional.

8
from her husband and lives in Los Angeles. She has threechildren—two boys ages 12 and nine, and one girl five years old.The middle child is in poor health with heart problems thatlimit his ability to walk, run, go up stairs, and attend schoolregularly. His medical problems sent him to the emergencyroom twice in the last year and led to an overnight stay in thehospital. These medical problems also resulted in extra expensesfor the family, including an ambulance bill and the cost ofspecial medicines in the last month. Matilda is unaware of theSSI program and has never received child support. She relies ona combination of welfare and work, but with no partner in thehousehold, it is difficult to get by with half-time employment.She has had her phone and gas and electricity turned off becauseshe could not pay the bills and she is late with the rent every fouror five months. For Matilda, making ends meet is a constantstruggle, and her child’s heart problems add additionalchallenges to her already difficult situation.
• Dorothy [20265], a 36 year old divorced mother of a 16 year oldgirl, lives with another unrelated adult in a small single-familyhouse in San Joaquin County. Dorothy works as an animalcaretaker, but her child’s severe asthma sometimes limits herwork hours. Her daughter has poor health generally, and herhealth problems make it hard for her to run, to go up stairs, andto participate in the usual activities for a girl her age. She alsomisses a lot of school because of her condition. Dorothy is notcurrently on public assistance; one consequence is that she doesnot receive Medi-Cal. She had to pay $110 in special expensesfor her asthmatic daughter last month, including $95 formedications. In the last year, her strained finances caused her togo hungry on at least one occasion. She worries because thereare special treatments that she would like to get for her daughter,but she cannot afford them.
• Gladys [30408] is 32 years old and divorced, was born in theUnited States, and lives in a three-bedroom public housingapartment in Los Angeles. She had her first child when she was15, and she now has three children, ages 17, 15, and 11. All

9
have learning and behavioral problems and attend special classesat school; the eldest is also mentally retarded and receives SSI.Her 17 year old child needs a lot more help than other kids hisage with eating, bathing, and dressing, and he cannot take partin many activities with his peers. He goes to school, but hemisses classes a lot. He also has substantial medical problems.He was treated four times at an emergency room in the last year,and the family incurred substantial out-of-pocket costs in thelast month for his special food, transportation, and medicines.Gladys herself has a significant physical condition that preventsher from working, although she has never applied for SSI. Shehas been on welfare for more than nine years, and describesherself as dissatisfied with her standard of living. Nevertheless,she does not think her job prospects are very good because shehas only a 10th grade education and heavy caregivingresponsibilities, so she has not been looking for work. She lives aprecarious life—her children were sometimes hungry last year,for a two-month period she went to a free food program a fewtimes each month, and she paid her rent late several times.
• Phyllis [21064], 27 years old, lives in San Joaquin County in atwo-bedroom apartment with her three children, ages eight,seven, and four. She was on welfare in the past, moved off for atime, but returned after she separated and moved away from herhusband 18 months ago. Her seven year old daughter hascerebral palsy and receives SSI. Her daughter cannot move verywell and cannot participate in the usual activities for a child herage. She does go to school, but she needs a lot more help thanother kids with eating, bathing, dressing, and getting around.Because of her child’s cerebral palsy, Phyllis receives help fromCalifornia Children’s Services. She still incurred substantial out-of-pocket expenses in the last month for special clothes andtransportation necessitated by her daughter’s cerebral palsy.Phyllis graduated from high school and she has worked part-time as a secretary at an insurance company for the past 18months, but her daughter’s illness limits the amount and kind ofwork she can do. Through public assistance, Phyllis obtains

10
Medi-Cal, which is very important because in the last year herdaughter received medical care at an emergency room five times.Because of her daughter’s illness, Phyllis cannot work enough toget off welfare, and even if she could, the prospect of losingMedi-Cal is very frightening to her.
• Mary and Robert [20859] are married and live in a rented three-bedroom home in San Joaquin County with their fivechildren—four boys ages 16, 14, 10, and six and one girl agethree. Their 16 year old boy has developmental problems; their10 year old son has cerebral palsy. Both boys receive SSI. Maryand Robert have been on public assistance continuously for thelast nine years. Robert, 32 years old, has a 10th grade educationand worked full-time last month and for 10 of the last 18months. Although he works many hours, his earnings as a childcare worker are low. Mary, age 35, has a GED, but caring forher disabled children limits her ability to work. With theirearnings, welfare, Food Stamps, and SSI, Mary and Robert areable to pay their rent, phone, gas, and electricity on a regularbasis and to provide sufficient food for the entire family. Butthey would like to get more services for the 16 year old son, andthey must also cover special expenses for their disabled child,such as the van they rented last month to get him to the hospitalwhen he was experiencing medical problems.
• Edith, 27 years old, and Ben, 30 years old [40045] are marriedand live in a rented two-bedroom mobile home in SanBernardino. They have only one child, Brandon, who is fiveyears old and blind. He also suffers from developmental delaysand chronic health problems such as asthma. In the last 18months, he received medical care in an emergency rooms 15times and stayed overnight in the hospital. Brandon cannot dothe usual things of a child his age, and he is in a special school.Because of his medical problems he misses a lot of days atschool, and Edith feels she is limited in her ability to workoutside the home. In addition to the work limitations, thefamily incurred direct costs for special food and transportation inthe last month because of Brandon’s health and developmental

11
problems. Ben has a GED and works as a bus driver at a localschool. Edith has a high school diploma and works at odd jobs.They are not currently on welfare, but they have been on and offin the last few years. Edith thinks that they are better off than ayear ago when they were still on welfare, but their livingsituation has been precarious. In the past 18 months, they havemoved four times (including once after they were evicted fromtheir lodgings), and they have been in their current place foronly one month. At one point they had to rely upon free foodfrom food pantries for about a month.
• Beth and Joe [40550] live in a rented home in San Bernardinowith their three boys ages 10, eight, and seven and theirdaughter age three. Because of blindness and developmentaldelays, their youngest boy needs a lot more help than otherchildren and attends a specialized education program. Joe is 28and works as a laborer in construction. He has been able towork 17 of the last 19 months. Beth, 27 years old with a 10thgrade education, takes care of the four children and does notwork, partly because she thinks she could make only about$4.25 an hour. After cycling on and off welfare for the last nineyears, Joe and Beth were able to get off welfare four months ago.They now rely on Joe’s earnings and on the SSI and Medi-Calthey receive for their disabled son.
These profiles demonstrate a number of recurrent themes. Childrenin poor families suffer from a diverse range of chronic, limiting, anddisabling conditions.2 Children in these families suffer from blindness,severe asthma, mental retardation, cerebral palsy, attention deficitdisorder, heart problems, and mental and emotional difficulties. Theextra burdens of caring for these children can be great. Some families____________
2Although we use the terms disability, limitations, and special needs interchangeablyin this document, some analysts distinguish among them. Researchers typically definechronic conditions as those that have lasted (or are expected to last) at least three months;chronic conditions are typically considered disabling only if they result in functionallimitations or developmental abnormalities. The term special needs is used more globallyto describe children who have conditions that require specialized care by parents, schools,medical providers, or other professionals.

12
report that their most disabled child requires a lot of help with basicactivities such as eating, bathing, dressing, or getting around the house;others report that their children require special schools, special classes, ortherapies.
Caring for these children can also be expensive. In our familyprofiles, most families had incurred some out-of-pocket expenses in theprior month related directly to the care of their special needs child; for aportion of these very poor families, such expenditures were high.Medical care can be a particularly common expense. Many of thefamilies went to the emergency room with their child within the prior 18months; several made multiple visits. Some parents reported that, in thelast year and half, there was at least one time when they could not get themedical care that they thought their child needed.
Special needs also appear to interfere with parents’ work options.Several of the mothers are themselves disabled and limited in their abilityto work. Many report that their children’s disability limits or evenprevents their ability to work. Some mothers do work currently. Onlyone of the mothers profiled, however, works full-time, and even shereports that her work is limited by her daughter’s disability.
These families cope with the costs and challenges of caring for specialchildren in different ways. Most receive welfare. Some have beenwelfare recipients only intermittently in the past years; others are in themidst of a long spell of receipt. In addition, some families with severelydisabled children receive extra income through the SSI program.However, other parents are not aware of the program, have never appliedfor help, or have been turned down for assistance.
What is most striking about these profiles, perhaps, is the level ofhardship experienced by families and their children. Late payment ofrent and utilities is common and leads to evictions, utility shutoffs, andhomelessness for some. Reliance on food banks and other sources of freefood is a necessity for most, but even with this form of help, someparents report that the family went hungry during the past year.Although most families have been able to retain Medicaid as part of theirpublic assistance, a few lack even this form of security. These poorfamilies are clearly living at the edge of economic survival. The extra
13
needs of their disabled children may well have pushed them over thatedge.
These profiles provide a first look at the characteristics of poorfamilies with disabled children, the private costs they incur, and their useof public programs. They also suggest some of the policy conundrumsthat arise in the design of public programs to help offset families’ privatecosts. How can we predict which childhood disabilities and illnesses arecostly for families? How can we measure these costs and estimate theeconomic consequences for families? How can government programsreduce the burden of private costs without wasting public resources orcreating undesirable incentives for families? These are the questions towhich we now turn, first by reviewing prior research and then bypresenting the findings from our study of California families.

15
3. Measuring Disabilities andCosts
Public programs can help offset the financial burden of caring fordisabled and ill children by reducing families’ costs or by increasing theirresources. Programs that provide direct services, such as medicaltreatments or specialized education and child care, reduce families’ costsfor these services. Programs that transfer income directly to families,most notably the Supplemental Security Income program, increasefamilies’ financial resources for the purchase of these, and other,specialized goods and services. To develop sound policies for either typeof program, we must begin by confronting a number of conundrums—from the difficulty of estimating need to the possibility that policiescreate perverse incentives.
Private Costs of Childhood DisabilitiesAlthough estimates of the prevalence of disabling conditions vary
considerably, most suggest that about 5 to 7 percent of childrenexperience a condition that results in some impairment or limitation oftheir ability to engage in the usual activities of children their age (Aron,Loprest, and Steuerle, 1996). Although disabilities affect children of allincome groups, children in low-income families have a 40 percent higherrisk of being disabled than their affluent peers (Newacheck andMcManus, 1988; McNeil, 1993). This elevated risk stems, in part, fromexposure to living conditions and health care practices that increase theprobability and the severity of illnesses and other potentially disablingconditions. Elevated blood lead levels and associated developmentalproblems among poor children, for example, have been linked to theirhigher probability of living in older, inner-city areas with high levels oflead in soil and housing. Other health problems that disproportionatelyafflict poor children, such as frequent and untreated ear infections

16
leading to hearing loss, have been associated with inadequate access tomedical care (Newacheck, Jameson, and Halfon, 1994).
The association between childhood disability and poverty appears tooperate in the opposite direction as well, when the financial costsassociated with the care of a disabled, fragile, or chronically ill child pusha family into poverty. These costs are typically described using a humancapital approach that considers the direct costs of medical and otherrehabilitative or restorative services (including hospitalization, outpatientcare, home health care, medications, and rehabilitative services anddevices) and the indirect or opportunity costs resulting from the loss ofproductive output by the caregiver (e.g., the loss of earnings resultingfrom increases in the extent and intensity of caregiving responsibilities)(Hodgson and Meiners, 1992; Jacobs and McDermott, 1989).Empirical studies suggest that these costs are frequent and often high.
The costs of caring for an expensive child can create a variety ofdilemmas for poor families. These families are more likely than others tohave a chronically ill, fragile, or atypical child, and they have fewerresources than others to absorb the costs of this care. For poor familieswith expensive children, the tradeoffs may be stark: whether to use thelimited family income to meet the needs of the child for medical or othercare, or to meet the family’s needs for food, shelter, and other basics;whether to work more hours and pay for sometimes very expensivespecialized child care, or to quit work altogether to qualify for welfare;whether to risk going without health insurance for a sometimes very illchild, or to make themselves poor enough to qualify for governmentinsurance through Medicaid.
Public Costs of Childhood DisabilitiesThe private dilemmas of caring for a disabled child thus have public
implications as well. Because these are very poor families, a portion ofthe resources devoted to their care come from public sources. A varietyof targeted public programs provide special education, early intervention,and diagnostic, rehabilitative, and therapeutic care for exceptionalchildren. By one recent estimate, total federal, state, and localexpenditures in the United States for targeted special services forexceptional children reached $44.3 billion in 1993 (Aron, Loprest, and

17
Steuerle, 1996). Less than one-quarter of these costs (an estimated $10.6billion) were federal; the majority ($33.7 billion) were incurred by stateand local governments, primarily for special education. At the federallevel, the largest targeted program is the Supplemental Security Incomeprogram, which provided $5,364,000,000 in benefits to children in 1997(Social Security Administration, 1998, Table IV. C1).
Childhood disabilities are also implicated in the costs of nontargetedtransfer programs. The largest of these programs is Medicaid. Althoughnot targeted on children with disabilities, Medicaid is used to covermedical care, residential care, and some community services for manydisabled and chronically ill children. The cost of Medicaid for anestimated 800,000 disabled children reached $3.4 billion in federal and$2.5 billion in state funds in 1993 (Aron, Loprest, and Steuerle, 1996).Children’s disabilities may also have other largely unmeasured effects onparticipation in cash assistance programs and Food Stamps. Theprevalence of disabilities is sharply higher among welfare recipients thanamong the general population (Blank, 1989; Spalter-Roth, Hartmann,and Andrews, 1992; Loprest and Acs, 1995), suggesting that thesefamilies may have both a higher probability of entering welfare and, oncein the program, a lower probability of leaving. For families with disabledand ill members, uncertain access to private health insurance mayincrease the incentive to enroll in welfare programs that providecategorical access to public health insurance through the Medicaidprogram (U.S. General Accounting Office, 1995).
Public Policy Dilemmas: The Case of SSITo the extent that they offset a portion of family costs, these
programs represent a public response to the private dilemmas that arisewhen poor families care for expensive children. Because they involve theuse of public mechanisms to effect a transfer and redistribution of privateresources, they also raise a host of public policy dilemmas. On the onehand, there is pressure to maximize transfers to increase equality andproduce socially desirable outcomes such as children’s health. On theother, there is pressure to minimize transfers that involve redistributionof private resources and to maximize the efficiency with which resources

18
are targeted. These dilemmas become particularly acute when the basisof eligibility is ambiguous, difficult to establish, or difficult to observe.
Programs that benefit disabled children in poor families raise all ofthese dilemmas, and many of these programs have become lightning rodsfor controversy in recent years. The federal Supplemental SecurityIncome program has been one of the most controversial. The SSIprogram provides cash assistance to low-income individuals who areeither elderly (and not covered by Social Security) or disabled. Beforethe mid-1980s, the number of SSI recipients was relatively stable; sincethen, the number of disabled recipients has increased by an average ofover 8 percent annually (U.S. General Accounting Office, 1995). Thischange raised particular alarm in political circles when it became clearthat children and two more controversial subpopulations—noncitizensand adults with mental impairments (including drug addicts andalcoholics)—accounted for the majority of the growth.
SSI caseload growth was particularly steep for child cases during the1990s, following modifications to federal eligibility rules for SSI andother mental health services. Most notably, in 1990 in Sullivan v. Zebley,the Supreme Court required that the Social Security Administration(SSA) provide an individual, functional assessment for children whosedisability did not qualify them for benefits under existing categoricalcriteria. At about the same time, SSA also revised its criteria forevaluating children claiming mental impairments (U.S. GeneralAccounting Office, 1994). These policy changes were designed tocorrect perceived inequities in the eligibility criteria for the program. Toapply the new rules fairly, the Social Security Administration directedregional field offices to conduct outreach to identify newly eligiblechildren and those who were denied benefits under the earlier rules.
The combination of rule changes and outreach had predictableresults for caseloads. In December 1974, shortly after it was firstimplemented, the program provided benefits to 70,849 children, whomade up 2 percent of total SSI beneficiaries; by December 1993, SSIprovided benefits to 770,501 children—13 percent of total beneficiaries.Between 1989 and 1994, the number of child cases, and total benefitpayments, tripled (Kubrick, 1999).

19
Much of the growth in the child SSI caseload reflected a one-timeaddition of children who would not have qualified under the earlierrules, so these dramatic rates of growth are not expected to continue(U.S. General Accounting Office, 1995). Regardless of projections offuture growth, the highly visible increase in the child SSI caseload in the1990s and the pervasive antiwelfare sentiments of the period provokedstrong criticism of the SSI program. Some of the program’s criticsquestioned the basic premise of providing cash assistance to healthyparents of disabled children. The SSI program was created in 1974 toprovide cash assistance to adults who were unable to work because theywere totally and permanently disabled, or over the age of 65, and unableto qualify for benefits through Social Security. The legislative history ofSSI suggests that Congress enacted the benefit structure for childrenbecause it accepted the argument that the needs of low-income familieswith disabled children were greater than the needs of other low-incomefamilies (Urban Systems Research and Engineering, 1979; Weishauptand Rains, 1991; Burke, 1974; Woodward and Weiser, 1994). Otherrationales included family support and preservation. To the extent thatSSI benefits decrease the risk of economic insecurity among families withdisabled children, it has been argued, the small cash grant to families mayprevent more expensive and disruptive institutionalization of children(National Academy of Social Insurance, 1995).
Although the children’s benefits in SSI were designed to offset someof the direct and indirect costs of providing family care to special needschildren, the benefits were adopted with little information on themagnitude or distribution of those costs. The state of knowledge washardly any better by the 1990s, when caseload growth provoked areassessment of the program. Some critics argued that the cash grantsprovided to children through SSI are too broadly distributed, benefitingfamilies who incur few if any additional costs for their disabled children.Others raised concerns, based mostly on anecdotal evidence, that therelatively generous SSI benefits created incentives for parents to coachtheir children to feign or exaggerate their limitations. Another source ofcontroversy was the benefit differential between SSI and welfare (theformer Aid to Families with Dependent Children or AFDC program,now the Temporary Assistance to Needy Families or TANF program). A

20
single person has never been able to receive benefits from both SSI andwelfare, but a family with a disabled child can combine benefits fromboth. If a child was eligible for either welfare or SSI benefits, the child’sfamily was usually better off if the child received SSI benefits.1 Garrettand Glied (2000) estimate that at least 32 percent of the post-Zebleycaseload growth in SSI may be attributable to the SSI-AFDC benefit gap.
Alarmed by the growth in SSI and allegations that state welfareofficials and families might be abusing the program, Congress moved torestrict SSI eligibility in the 1996 Personal Responsibility and WorkOpportunities Act. The law narrowed the definition of disability toinclude only children who have “a medically determinable physical ormental impairment, which results in marked and severe functionallimitations.” The law eliminated the individual functional assessmentsmandated earlier in the settlement of the Zebley court case and restrictedconsideration of maladaptive behavior when evaluating mentalimpairments. As Loprest (1997) observes, “the clear Congressionalintent of these changes was to eliminate benefits for less severely disabledchildren.”
The Policy ConundrumsThe controversy surrounding SSI underscores the dilemmas that
arise when we seek to target public benefits on the basis of difficult-to-observe characteristics. The rationale for children’s SSI benefits rests onthe assumption that raising a special child imposes direct or indirect costson families and that low-income families are particularly ill-equipped toabsorb these costs without incurring hardship or jeopardizing the care ofthe child. As described by the Disability Policy Panel of the NationalAcademy of Social Insurance (1995), children’s SSI benefits are designed____________
1For example, in 1993 a child eligible for the full federal SSI benefit would havereceived $434 per month (although actual payments are on average much lower). Inmost states, this amount was significantly greater than the marginal increase in welfarebenefits that would have resulted from including an additional child in the case. In themedian state, the maximum monthly welfare benefit in 1993 increased by $96 whenfamily size increased from one to two and by $57 when family size increased from two tothree. In California, a high-benefit state, the monthly increases in benefits were $197 and$120, respectively (U.S. House of Representatives, 1994).
21
to “level the playing field” for families who suffer the random shock ofhaving a disabled or seriously ill child.
For this rationale to be justified, in general terms as well as in thecase of an individual claimant, we must be able to resolve at least threedifficulties that are associated with observing child and familycharacteristics. First, we must be able to define childhood disabilities andillnesses that impose costs on families. Second, we must be able toestimate the distribution and magnitude of these costs. Finally, we mustbe able to devise systems for identifying families in need without creatingundesirable incentives. Each of these steps has proven difficult in theabsence of reliable information about the private costs of childhooddisabilities.
Defining DisabilitiesThe problem of defining “costly” childhood disabilities is
fundamental. For adults, equating costs with lost earning capacity andincome solves the problem of defining a costly disability. For thepurposes of public and private insurance programs, disabilities aredefined in human capital terms. Health is treated as capital stock that isaffected by both exogenous factors (such as age and accidents) and anindividual’s own investments (such as preventive medical care)(Grossman, 1972a, 1972b). For the individual, compromises in healthor functioning, whether caused by exogenous shocks or individualchoices, are seen as losses of human capital and earning capacity.Disabilities impose “costs” by reducing income: They decrease the timean individual has available for productive activities or the range ofpossible activities.
This human capital framework is evident in the definition ofeligibility for disability-related benefits (for adults) under the U.S. SocialSecurity Act:
For purposes of entitlement to disabled worker’s benefits, disability is definedas: The inability to engage in any substantial gainful activity (see §603) byreason of any medically determinable physical or mental impairment (see§601) which can be expected to result in death or which has lasted or can beexpected to last for a continuous period of not less than 12 months.

22
In the case of children, the human capital framework provides muchless guidance. Many childhood disabilities and illnesses do reducechildren’s capacities in ways that have implications for their humancapital and long-term earning prospects. In the short term, however,these conditions impose costs not through lost earnings, since childrendo not work, but through direct demands on families’ financial and timeresources and through the reduction in the quality of the child’s everydayexperiences.
A more useful basis for defining childhood conditions would be onethat captures the extent of the child’s limitations and the correspondingburden on families’ resources. Quantifying the extent of a child’slimitation remains difficult, however, and linking variations in children’slimitations to variations in family burden is even more problematic.
The difficulties begin with selecting the criteria for defining adisability. Researchers typically define chronic conditions as those thathave lasted (or are expected to last) at least three months. As many as 30percent of all children are estimated to have a chronic health condition.Only a fraction of these conditions result in significant physical, mental,or psychosocial impairments, however. The extent to which conditionsare disabling is typically measured in terms of functional limitations (e.g.,restrictions in daily activities), developmental abnormalities (e.g.,educational delays), or the level of pain or discomfort experienced by thechild. When researchers restrict their attention to chronic healthconditions that are disabling, they estimate that approximately 6 percentof children under age 18 have a limitation resulting from a chronichealth condition or impairment and between 0.5 and 3 percent ofchildren have a severely disabling condition (Newacheck and Taylor,1992; Wenger, Kaye, and LaPlante, 1996; McNeil, 1993).2
____________ 2Estimates of the prevalence of childhood illnesses are also sensitive to children’s
ages. Some disabling conditions that occur early in life are not manifested or cannot beeasily detected in young children. Other conditions may manifest themselves early in lifebut their effect on children’s health and functioning cannot be observed until childrenage. By one estimate (Wenger, Kaye, and LaPlante, 1996), 2.8 percent of children underage five compared with 7.5 percent of those aged five to 17 have a disabling condition.

23
Estimating CostsThe use of functional criteria improves the definition of childhood
disabilities and provides some indication of the potential loss of earningsin the future. This still does not provide information about the currentcosts imposed on families who care for the child. Once the problems ofdefining relevant childhood conditions are surmounted, the problem ofestimating the magnitude and the distribution of costs remains to besolved.
The costs associated with raising special needs children can be botheconomic and psychosocial (Hodgson and Meiners, 1982). Psychosocialcosts encompass “a wide variety of deteriorations in the quality of life”resulting from the child’s disability (Hodgson and Meiners 1982, p.435). For instance, caregiving tasks (such as daily therapy in the case of achild with cystic fibrosis or coping with disruptive behavior in the case ofa child with a mental disability), concern about the child’s future, andthe financial costs of the child’s disability can all lead to emotional stress,disruptions in family relationships, and other psychosocial costs(McEwen, 1998; Reinhard and Horwitz, 1995; Baldwin, Brown, andMilan, 1995; Whyte 1992).
Although psychological costs may exact a considerable toll onfamilies, public programs concern themselves more directly witheconomic costs. Direct costs include out-of-pocket medical expensesassociated with the child’s condition as well as nonmedical costs directlyresulting from the child’s disability. Nonmedical costs can includetransportation and lodging required for travel to distant treatmentcenters, long distance calls home, structural modifications to the home,special food or clothes for the child, babysitting for other siblings whilethe parents accompany the child to the doctor, respite care, andnumerous other items (National Academy of Social Insurance, 1995).Disabled and chronically ill children may also require special or moreexpert child care services while the parents are at work (Darling, 1987).In addition to being a direct cost, specialized child care can also increasethe cost of employment for parents. The elevated needs of manyexceptional children for direct care—from help with the activities of dailylife to transportation to doctor and therapy appointments—may also

24
exert downward pressure on parents’ employment, imposing indirectcosts on the family through reductions in earnings.
Research suggests that these costs are often substantial. Disabledchildren on average use more medical and health care services and incurhealth care expenditures nearly three times as great as nondisabledchildren (Newacheck and McManus, 1988). Other, nonmedical costsassociated with the child’s condition have also been found to be frequentand often very high (Jacobs and McDermott. 1989; Darling, 1987;Urban Systems Research and Engineering, 1979). Parents report bothadditional time spent in caregiving and lost employment income as aresult of their children’s disabilities (Leonard, Brust, and Sapienza, 1992;Lansky et al., 1979; Jacobs and McDermott, 1989). Studies using large,nationally representative samples have found evidence of lower laborforce participation among parents (overwhelmingly mothers) who carefor disabled children (Salkever, 1982; Breslau, Salkever, and Staruch,1982; Wolfe and Hill, 1995; Mauldon, 1991; Powers, 1999) and higherwelfare reliance (Blank 1989).
These studies also find that the distribution of these costs is veryuneven across families. Studies of the costs of childhood disabilities, eventhose restricted to a single or small number of disease categories,consistently report that costs are highly variable, with few or minimalcosts observed in the majority of families and very high costs observed ina few (Leonard, Brust, and Sapienza, 1992; Newacheck and McManus,1988; Jacobs and McDermott, 1989; Urban Systems Research andEngineering, 1979). Although researchers have tried to identify thespecific disease categories or child characteristics that are associated withhigher costs, the overarching conclusion is that variation remains greaterwithin than across categories and few child characteristics predict eitherthe probability or the magnitude of the costs that families incur.
Avoiding Waste, Abuse, and Undesirable IncentivesProblems arise in the definition of costly childhood disabilities, and
in estimating those costs, because it is difficult to observe children’sdisabilities and even more difficult to observe the costs they impose onfamilies. These problems also increase the risk that public programs will

25
use eligibility criteria that waste resources or create perverse incentives forpotential recipients.
Selective or targeted public programs must always strike a balancebetween two forms of error. Errors of underinclusion occur wheneligibility criteria are too narrow or too rigidly enforced. In this case,potentially eligible claimants are incorrectly excluded from assistance. Tothe extent that this assistance achieves public purposes—such asimproving developmental outcomes or reducing the chances thatchildren will be institutionalized—society incurs the costs of having toprovide more expensive remedial interventions at a later time. Errors ofoverinclusion occur when eligibility standards are too broad orinconsistently enforced. Under these conditions, ineligible claimants areincorrectly provided with assistance. The immediate costs to society arethe direct costs of giving unnecessary assistance and the opportunity costsof forgone uses of limited resources. Long-term costs include the loss ofprogram legitimacy if overinclusion is widespread.
A second concern is that of overinclusion as a result of program abuse.If benefits for disability programs are generous, and eligibility criteria areambiguous, there is a risk that individuals with moderate limitations mayexaggerate their symptoms or their economic losses to qualify forassistance. Debates about the SSI program in the 1990s were enlivenedby stories of welfare-recipient parents who coached their children to feignor to exaggerate symptoms to obtain more generous SSI benefits. In themost extreme version of this argument, critics suggested that families hadan incentive to increase their children’s functional difficulties. In a 1994article in the Washington Post, for example, a psychologist is quoted asobserving “many of the problems these children manifest are largelytraceable to parental neglect or abuse. . . . Behavioral and emotionalproblems or conduct disorder that are directly attributable to inadequateparenting are being called disabilities and the parents are receiving a cashaward for having achieved them” (Woodward and Weiser, 1994). Morecareful scrutiny of charges such as these failed to find evidence of anywidespread abuse of the program (National Academy of Social Insurance,1995). Nevertheless, concerns persist that families may exaggeratechildren’s symptoms in an effort to qualify for public benefits.

26
A third set of eligibility concerns revolves around behavioralincentives. When eligibility for public programs is limited by rules aboutincome, earnings, or assets, there is a risk that this will create incentivesfor individuals to maximize their short-term interests in obtainingbenefits while compromising their longer-term economic security. Twosuch incentives have been noted in means-tested disability programs.One is the incentive for families to divest themselves of assets to qualifyfor benefits. The U.S. General Accounting Office (1995) reported, forexample, that between 1990 and 1994, as many as 3,500 SSI recipienthouseholds transferred ownership of resources (such as cash, houses,land, and other assets) to other family members to qualify for SSIbenefits. Although such transfers of assets are legal, they raise questionsabout whether families are failing to make proper use of their own assetsto meet the private costs of illness and disability.
Related concerns are created by the income limits in means-testedwelfare programs such as SSI. Cash transfers have been shown to have amodest but consistent deterrence effect on employment (Moffitt, 1992).Because families whose earnings put them over the maximum foreligibility for SSI receive no cash assistance and may not qualify formedical assistance through Medicaid, the program may create incentivesfor families to leave or limit employment to meet the income limits.However, by doing so parents may also sacrifice income in the presentand reduce their opportunity to accumulate work experience that willraise their earnings in the future.

27
4. Data and Methods
To address the policy conundrums that arise at the intersection ofchildhood disability and family policy, we need better and moreextensive information about how many families are affected, the financialcosts they incur, and the consequences of these costs for their economicwell-being. This information is lacking, in part, because it is difficult toobtain. Very few surveys ask in-depth questions about the scope andseverity of disabilities and their costs, and even fewer studies ask aboutdisabilities among poor families. Once data are available, care must beused in interpreting them. The costs and burdens associated withdisabled children are very real, but their causes, their extent, and theirconsequences can be easily misinterpreted. Care must be taken indefining disabilities. Estimates of private and public costs can varydepending upon the way questions are asked. Statistical methods foranalyzing data must take into account sample characteristics and welfareprogram dynamics. We discuss some of these methodological issues inthis chapter and return to them throughout this report. A detaileddescription of key measures (of disability and hardship) and priorresearch about their reliability is provided in Appendix D.
The DataMost of our data come from Wave II of the California Work Pays
Demonstration Project (CWPDP) AFDC Cross-Sectional HouseholdSurvey,1 conducted through the joint effort of the Department of SocialServices of the State of California and the University of California DataArchive and Technical Assistance Program.2 An initial stratified random____________
1California Work Pays Demonstration Project Survey: English/Spanish InterviewsWave II. Henry Brady Principal Investigator, and Marcia Meyers Project Director.
2We are indebted to Werner Schink of the California Department of Social Serviceswho encouraged, promoted, and supported this and other research on welfare in the Stateof California.
28
sample of about 15,000 single- and two-parent welfare (AFDC) recipientfamilies was selected in October 1992 from four California counties: LosAngeles, Alameda, San Joaquin, and San Bernardino. A subsample ofEnglish- and Spanish-speaking households was randomly selected fromthe initial sample and first interviewed on the telephone in Wave I in1993–94. We base most of our analysis on an 18-month to 24-monthfollow-up (Wave II) telephone interview of these families, which wasfielded in 1995–96. Interviews were completed with 2,214 families fromthe initial sample of 3,776 at Wave I (a 59 percent completion rate);Wave II interviews were completed with 1,764 of these families (an 80percent recontact rate).
The four counties included in the sample represent almost 50percent of the California welfare caseload, and they include two largeurban populations, Los Angeles in the south and Oakland in the north.They also include the agricultural areas surrounding Stockton in theCentral Valley county of San Joaquin, and the suburban, rural, anddesert areas of San Bernardino County. Survey data are weighted toadjust for differences in sampling fractions by strata and for surveycompletion rates. Weights were constructed to adjust for differentialsampling rates in each of eight strata (for county and AFDC-programtype), and for differences in initial completion rates and attrition withinstrata and within language groups (English and Spanish). Weighted dataclosely represent the underlying population of AFDC cases in the fourcounties at the time the initial sample was drawn
In both waves, the adult caretaker (almost always a woman) forAFDC children was asked detailed questions about disability status,family and household composition, employment, household income,family well-being, and the use of social services. In Wave II of thesurvey, we included a set of questions to identify families withchronically ill or disabled children. We designed these questions to assessthe type and severity of the child’s disabilities, expenses associated withthe child’s condition, and the effect of the child’s disability on theparents’ employment and the family’s well-being.
For comparison purposes, we also use a complementary dataset of“new to welfare” families that initiated AFDC cases between 1993 and
29
1996 and were interviewed in the same time period.3 Strictly speaking,these families might have been on welfare before, but they were “new” inthe sense that they had not been on welfare since the sample was drawnor for the past year (whichever period was shorter). The interviewprotocol developed for the Wave II cross-sectional survey wasadministered to these families.4 We call this the California Work PaysDemonstration Project (CWPDP) AFDC New to Aid HouseholdSurvey.
Additional data were obtained from county and state administrativerecords of the California Department of Social Services. In the originalgroup of about 15,000 families from which the cross-sectional surveyrespondents were randomly chosen, all cases were on aid during thesampling month (October 1992), and two types of administrative dataare available for these families: (1) monthly aid code, payment data, andinformation on family structure and membership from the countywelfare office records from December 1992 to December 1995, and (2)statewide Medi-Cal MEDS data, which contain monthly aid codes fromJanuary 1987 to December 1995. The county data make it possible toidentify the members of a household. The statewide MEDS data can beused to determine monthly AFDC and SSI receipt from January 1987 toDecember 1995 for individuals in a household.5 This makes it possible____________
3The cross-sectional sample was drawn to be representative of the four counties inOctober 1992. As new families entered the welfare roles, this sample would no longer berepresentative of those currently on welfare because it would lack any new to welfarecases. Hence, the new to welfare sample was drawn on a monthly basis to retain therepresentativeness of the county samples by adding a representative sample of thoseentering the AFDC program.
4For some of these cases (“Batch I” and “Batch II”), two waves of interviews werecompleted as with the cross-sectional survey, and we use the second or Wave II interview.For the remainder of the cases (“Batch III”), the Wave II interview was adapted to beused for one consolidated interview. For simplicity, we call the combination of the WaveII interviews for Batches I and II and the Batch III interview the Wave II interviews ofthe new to welfare cases. For details of the sampling method see the technicaldocumentation for the CWPDP.
5The two administrative data sources complement one another. The MEDS filecovers a much longer span of time than the county data, and it includes information onSSI participation as well as receipt of AFDC, but it has records only on individuals withno (reliable) linkages between persons in the same household. The county data provide

30
to determine with precision when cases began the AFDC spell thatcontinued through December 1992,6 when they left this spell, and whenany members moved to SSI.
Sample Characteristics and GeneralizabilityTable 4.1 presents data on the characteristics of the cross-sectional
sample. Although Alameda, San Bernardino, and San Joaquin are aboutone-fifth of the unweighted sample and Los Angeles is about two-fifths,almost three-quarters of the weighted sample is from Los Angeles, whichreflects its large population. Nearly one-half of the parents in the samplewere Latino, slightly less than half had not completed high school, and27 percent were living with a partner (either married or cohabiting).7
A comparison of key demographic characteristics suggests that oursample is generally representative of the California welfare population,and somewhat less representative of the U.S. welfare population. Incomparison to the welfare population of the state, the sample for thisstudy contained somewhat more Latino families and fewer black families.The proportion of Latino families was much higher in the sample than inthe U.S. welfare population as a whole, reflecting the large Latinopopulation in California. The education level for the head of householdin the study sample was also lower than that reported for the UnitedStates as a whole, although these differences may not be reliable becauseof large amounts of missing data for the United States. The average ageof the head of household in the study sample also differed from thenational profile. The lower education and older average age of________________________________________________________ much better information on the membership in a household, but they cover a muchshorter period of time and they include only AFDC receipt.
6A small number of cases that were initially sampled in October 1992 but that leftaid before December 1992 were excluded from the survey sample. In addition, for thosecases that began their AFDC spell before January 1987, we use the survey data toestablish the beginning of the spell.
7The sample was stratified by AFDC program type to correctly represent familieswho qualified for AFDC-FG (for one parent families) or AFDC-UP (for two parentfamilies). We have elected to use the more inclusive coding of “partnered” in ouranalyses, which is consistent with recent research suggesting that income pooling is nearlyas common among cohabiting couples as it among married couples.

31
Table 4.1
Household Characteristics in Cross-Sectional Sample Compared tothe California and U.S. Welfare Populations
(in percent)
Weighted CaliforniaUnitedStates
CountyAlameda 8.2 4.1 0.7Los Angeles 72.0 34.3 6.3San Bernardino 15.6 7.0 1.3San Joaquin 4.3 2.4 0.4
Race/ethnicityWhite 20.5 25.9 37.4Black 28.4 17.4 36.5Latino 47.8 41.5 19.9Other 3.3 9.0 6.3
Education8th grade or less 19.3 n.a. 4.0a
Some high school 26.9 n.a. 17.6a
High School graduate or GED 29.8 n.a. 24.1a
Some college 21.2 n.a. 7.7a
College graduate or more 2.8 n.a. 7.7a
Living with partner 27.1 n.a. n.a.Age categories
Under age 25 11.3 n.a. 30.925–40 years 64.4 n.a. 57.541 or greater 24.3 n.a. 11.5
SOURCES: Authors’ calculations from the California Work PaysDemonstration Project Survey: English/Spanish Interviews Wave II;surveys of Alameda, Los Angeles, San Joaquin, and San BernardinoCounties; and U.S. House of Representatives (1996).
NOTE: Entries are weighted to be representative of the four counties.Numbers may not add because of rounding. Unweighted n = 1,764.
aEducational data for U.S. welfare population are available only for 54percent of the caseload.
respondents in the study sample may reflect the cross-sectional samplingdesign, which is likely to be dominated by long-term welfare cases.
When the initial cross-sectional study sample was drawn, all familieswere welfare and Medicaid recipients and some were also receiving SSIfor a disabled family member. By the time of the follow-up interview,

32
approximately one-quarter of the families were no longer receivingwelfare; some who had left welfare continued to receive Medicaid andothers received no means-tested assistance. Data from the secondinterview thus represent both families in the welfare system and thosebeginning a transition to independence.
Several important characteristics of the cross-sectional sample shouldbe noted. The sample was designed to represent the welfare populationin four diverse counties in California, representing almost half of thewelfare caseload for the state. Although we believe that the findings canbe generalized to the welfare population in California, they may not fullyrepresent the characteristics of families in the welfare system elsewhere inthe country. Because important groups were not included in this roundof surveys, notably recent immigrants who could not be interviewed ineither English or Spanish, caution must also be used even in drawingconclusions about California. In addition, the data are from the 1992–1996 period, and welfare has changed dramatically since then.
The cross-sectional sample has another important characteristic. It“samples the stock” of all welfare cases and represents the experiences offamilies who were receiving welfare at a point in time. As substantialresearch in this field has demonstrated, a cross-sectional sample will notrepresent the experiences of all families who ever enter the welfare system.In particular, this cross-sectional sample more fully represents long-term,more highly disadvantaged welfare recipients than the larger number ofshort-term, relatively more advantaged families who cycle through thewelfare system more quickly. The findings from this sample areparticularly useful for understanding the experiences of longer-termwelfare clients and the characteristics of welfare caseloads at any point intime. With the advent of time-limited welfare, these clients areincreasingly becoming the focus of public policy in California andaround the nation.
It is also important to note that this sample represents the experienceof a particular subgroup within the larger populations of families withdisabled children and those in the SSI program. The families representedhere, those poor enough to qualify for AFDC, are an especiallydisadvantaged subset of all families who care for exceptional children.However, they are the subset of families most likely to be affected by

33
recent federal changes in welfare and the SSI program. Findings aboutthe distribution and consequences of private costs for this population offamilies have particular relevance for these policy changes.
Analysis of Private CostsIn Chapter 5, we describe the distribution, amount, and type of
direct, disability-related expenses. In deriving population estimates ofdirect costs, our data are limited in one important respect. As earlierresearch indicates, special medical and other expenses are not distributedevenly, either across families or across time for the same family.Although our sample is expected to represent the range of families(within the welfare population) who are likely to incur these costs, thetime period is truncated in that we observe expenses only for the monthbefore the interview. This limits information about intermittentadjustments that occur less often than monthly. Thus, our estimates ofcosts cannot be easily extrapolated to estimates of the annual costs tofamilies. The proportion of families incurring costs over a longer periodis likely to be greater than the proportion of families incurring costswithin a given month. Similarly, among families with costs, the totalcost over a year is probably greater than the amount reported for thepreceding month but seems unlikely to be as great as 12 times themonthly amount.
We next consider the indirect costs for families in the form offorgone employment earnings. We begin by comparing employmentrates for families with and without special needs children, and the self-reported employment reductions of mothers with more and less severelyimpaired children. To estimate more precisely the effect of the child’sconditions on maternal employment, we used censored regressionanalysis to estimate the effect of children’s disabilities (severity and type)on maternal employment, controlling for other individual, family, andprogram participation factors.
To interpret the effect of these private costs on families’ well-being,we consider the effect of direct and indirect costs on poverty and onmaterial hardship. We compare rates of poverty and extreme poverty forfamilies with and without disabled children. Among families with specialneeds children, we compare poverty rates before and after adjusting
34
family income for direct, out-of-pocket expenditures related to theirchild’s disability.
Although having income below the poverty threshold is widely usedas a proxy for economic well-being, it is not sensitive to differences inneed across household. It has also been shown to be an imperfectpredictor of actual hardship (see Mayer and Jencks, 1988, for example),in part because the resource measure (gross cash income) bothunderestimates family resources and ignores important nonelectiveexpenses (see Edin and Lein, 1997, for example). These limitations areparticularly relevant to the present analysis, insofar as we hope to capturethe effect of variation in need—disability-related expenditures—oneconomic well-being. In an effort to estimate the net effect of these costson families’ economic security, we also compare experiences of materialhardship across families that vary in the presence of disabled children andin the severity of their conditions. The contribution of children’sdisabilities to family hardship was measured more precisely using logisticregression. We regressed measures of child disability on the likelihoodthat the family experienced at least one of these problems (“anyhardship”), controlling for other family characteristics. To interpretthese results more directly, we used the regression coefficients to simulatethe contribution of child disabilities to family hardship.
Analysis of Public CostsTurning to the public costs of caring for disabled children (Chapter
6), we describe participation in both targeted and nontargeted publicprograms for families who differ by the presence and severity of childdisabilities. Means-tested public assistance programs included cash aid(AFDC and SSI), in-kind programs (Food Stamps and subsidizedhousing), and public health insurance (Medicaid or Medicare).Specialized services included special education (for children over age five)or early intervention programs (for younger children), CaliforniaChildren’s Services (providing case management for somedevelopmentally disabled children), and Community Mental HealthServices.
To the extent that direct and indirect costs reduce families’ economicresources, we expect that families who care for children with disabilities

35
or chronic illnesses will be more likely to participate in means-testedassistance such as AFDC or TANF. Theory and research suggest thatmore, and more severe, disabilities and health problems will reducehuman capital, earning potential, and the probability of leaving someform of assistance. But these same factors increase the probability thatsomeone in the household will be eligible for cash assistance through SSI,either along with or instead of other forms of welfare. We show thatearlier studies on the role of disabilities in welfare transitions have failedto find consistent effects because they estimated an “average” of these twooffsetting effects.

37
5. The Private Costs of Care
The identification of disabilities or illness, especially in children, isoften difficult. Even doctors sometimes disagree on a diagnosis. In asurvey, we must rely on self-reports from parents about their children.One of the best ways to ensure high-quality and accurate responses tosurvey questions about health is to ask very specific and pointedquestions. We did this by asking a battery of questions about each childin the respondent’s family. Respondents were first asked two screeningquestions: whether any of their children (1) had a chronic healthproblem—physical, emotional, or mental—that limited the amount orkinds of things that he or she could do, or (2) had a disability orhandicapping condition that limited the amount or kind of things he orshe could do. If the parent answered yes to either of these questions, weasked them to identify up to five specific diseases or conditions that wereresponsible for the limitation. We then asked a series of questions aboutthe functional limitations that these conditions imposed. We classified afamily as including a special needs child if the respondent answered yesto either of the screening questions; we classified the severity of thecondition using the questions about functional limitations (summarizedin Table 5.1). We determined whether the mother had any limitingconditions by asking standard survey questions about whether she had aphysical, emotional, or mental condition that limited the amount or kindof work she could do and by asking her to rate her own health. Weclassified a parent as having a disability or health limitation if shereported a work-limiting disability or rated her health as “poor” (seeAppendix D for additional detail about measures).
Prevalence of DisabilitiesChronic health problems and disabilities were frequent in our
samples of welfare recipient families. As shown at the top of Table 5.2,when we use the cross-sectional sample, only 60.3 percent of the

38
Table 5.1
Coding of Severity: Disabilities and Chronic Illnesses
Children’s ConditionsModerate: Mother reports specific condition or diagnosis and one or more of the followingfunctional limitations due to condition:
Needs “a little” more help with daily activities than other children his/her age (e.g.,eating, bathing, dressing, or getting around the house).
Unable to take part in usual activities for child of his/her age.
Attends special classes or receives special education services.
Misses “some” days of school.
Limited in ability to crawl, walk, run, or use stairs.
Severe: Mother reports specific condition or diagnosis and one or more of the followingfunctional limitations due to condition:
Child needs “a lot” more help with daily activities than other children his/her age(e.g., eating, bathing, dressing, or getting around the house).
Misses “a lot” of days of school.
Prevented from going to school.Mothers’ Conditions
Moderate: Mother reports that she has a physical, mental, or emotional condition thatlimits the type of work she can do or the hours she can work.
Severe: Mother reports that she has a physical, mental, or emotional condition preventsher from working at all.
families escaped having some illness or disability of the mother or thechildren. About 28.9 percent of the households had an ill or disabledmother and 19.5 percent of households reported the presence of at leastone child with a chronic health problem or disability. When adultdisabilities and children’s special needs are considered together, 39.7percent of the households were affected: About one-quarter of thesehouseholds (10.8 percent of the total sample) had children with specialneeds, half were headed by a mother who was disabled or in poor health,

39
Table 5.2
Summary of Prevalence of Mother and Child Disabilities(in percent)
Mother’s Health and DisabilityStatus
Children’s Health and Disability
NoDisabilities orHealth Limits
SomeDisabilities
or PoorHealth Total
In cross-sectional sampleNo disabled/ill children 60.3 20.2 80.5One or more disabled/ill child 10.8 8.7 19.5Total 71.1 28.9 100In new to welfare sampleNo disabled/ill children 76.9 14.4 91.3One or more disabled/ill child 5.5 3.2 8.7Total 82.4 17.6 100.0
SOURCES: Authors’ calculations from the California Work PaysDemonstration Project Survey: English/Spanish Interviews Wave II; Survey:English/Spanish Interviews March 1993–May 1994 Sample (Wave 2); Survey:English/Spanish Interviews January 1995–August 1996 Sample (CombinedWave); and surveys of Alameda, Los Angeles, San Joaquin, and San BernardinoCounties.
NOTE: Entries are weighted to be representative of the four counties.Numbers may not add because of rounding. Unweighted n = 1,711.
and one-quarter included both a disabled or ill mother and one or moredisabled or ill children.
Because a cross-sectional sample represents the “stock” rather than“flow” of cases in the welfare caseload, it will be dominated by those casesthat remain in the system longest. If disabilities are associated withlonger stays on welfare, we would expect a prevalence estimate based on across-sectional sample to be higher than one based on cases that are newto welfare. The flow of new cases onto the rolls, which are dominated bycases that cycle off aid more quickly, may be more representative of theprevalence of disabilities in the low-income population that includesmany who are not on welfare. When we consider a sample of “new towelfare cases,” we find a distribution that is similar to what we found forthe cross-sectional sample but with lower prevalence of disabilities among

40
both mothers and children. In the bottom panel of Table 5.2, we seethat nearly one-quarter of families had special needs. Slightly more thanone-fifth of these (5.5 percent of the total sample) had special needsbecause of a disabled child, about three-fifths because of a disabled or illmother, and somewhat less than one-fifth because both mother and childhad limitations.
Caregiving costs for families vary not only with the presence ofdisabled and ill children but also with the severity of their needs and thenumber of such children within the family. We classified the severity ofchildren’s conditions according to the degree of functional limitation:from moderate to severe. If a child was identified as having a chroniccondition but met none of these criteria, he or she was classified as onlymildly disabled. For mothers, we classified the condition as severe only ifshe reported that it limited her from working altogether.
Table 5.3 breaks down the cross-sectional sample by severity ofdisabilities and number of disabled children, and Table 5.4 does the same
Table 5.3
Prevalence of Mother and Child Disabilities in Cross-Sectional Sample
Mother’s Health and Disability Status
Children’s Health andDisability Status
NoDisabilitiesor Health
Limits
ModerateDisabilities
or PoorHealth
SevereDisability Total
No disabled/ill children 60.3 14.1 6.1 80.6One disabled/ill child:Mild disabilities 1.3 0.3 0.3 1.8Moderate disabilities 5.1 2.2 1.2 8.5Severe disability 2.9 0.9 0.5 4.3More than one disabled/ill child:All Mild disabilities 0.3 0.0 0.0 0.3Any moderate, no severe disabilities 1.0 1.3 0.7 3.0Any severe disability 0.4 0.8 0.4 1.6
Total 71.1 19.7 9.2 100.0
SOURCES: Authors’ calculations from the California Work Pays DemonstrationProject Survey: English/Spanish Interviews Wave II and surveys of Alameda, LosAngeles, San Joaquin, and San Bernardino Counties.
NOTE: Entries are weighted to be representative of the four counties. Numbersmay not add because of rounding. Unweighted n = 1,711.

41
Table 5.4
Prevalence of Mother and Child Disabilities in New to Welfare Sample
Mother’s Health and Disability Status
Children’s Health andDisability Status
NoDisabilitiesor Health
Limits
ModerateDisabilities
or PoorHealth
SevereDisability Total
No disabled/ill children 76.9 11.5 2.9 91.3One disabled/ill child:Mild disabilities 0.4 0.1 0.0 0.5Moderate disabilities 2.8 1.4 0.6 4.8Severe disability 1.2 0.7 0.1 2.0More than one disabled/ill child:All Mild disabilities 0.0 0.0 0.0 0.0Any moderate, no severe disabilities 0.7 0.0 0.0 0.7Any severe disability 0.3 0.4 0.0 0.7
Total 82.4 14.1 3.5 100.0
SOURCES: Authors’ calculations from the California Work Pays DemonstrationProject Survey: English/Spanish Interviews March 1993–May 1994 Sample (Wave 2);Survey: English/Spanish Interviews January 1995–August 1996 Sample (CombinedWave); and surveys of Alameda, Los Angeles, San Joaquin, and San BernardinoCounties.
NOTE: Entries are weighted to be representative of the four counties. Numbersmay not add because of rounding. Unweighted n = 1,291.
for the new to welfare sample. According to our criteria, 11.5 percent ofthe families in the cross-sectional sample had children with moderatelimitations and 5.9 percent had children with severe limitations. Almost5 percent of the sample has more than one disabled or ill child. Thesefigures are smaller for the new to welfare sample; almost 3 percent ofthese families cared for a child with a severe limitation. Over 9 percentof mothers in the cross-sectional sample reported that their conditionspreclude work, as did more than 3 percent of those in the new to welfaresample.
Considering either the estimate based on the cross-sectional or newto welfare sample, the prevalence of limiting conditions in thispopulation is much higher than estimates for the general population.However, our estimates are similar to recent estimates of disabilities in

42
the welfare population by Loprest and Acs (1995). In Table 5.5 wecompare our estimates to those of Loprest and Acs, who used severalnationally representative data sources to estimate the prevalence ofdisabilities and poor health among AFDC recipient families. Althoughsamples and definitions vary slightly across the studies, some comparisonsare possible.
Given the structure of the cross-sectional and new to welfare sampleson which our estimates are based, we would expect our estimates tobracket those developed using other surveys, particularly panel surveys
Table 5.5
Comparison of Prevalence of Disabilities to Other Data Sources
AFDC HouseholdSurvey
AFDC Recipients inNationally Representative
Surveysa
Cross-SectionalSample
New toWelfareSample SIPP NHISb NLSYc
MothersWork-limiting disabilityd 26.1 13.6 16.6 17.8 19.2Poor health 2.8 4.0 n.a 4.5 n.a.Disability or poor health 28.9 17.6 n.a. n.a. n.a.ChildrenChildren with limitatione n.a. n.a. 11.1 15.9 15.1Families with limited child 19.4 8.7FamiliesMother or child limited 29.7 23.1 27.4 29.5 28.9
SOURCES: AFDC Household Survey; authors’ calculations from the CaliforniaWork Pays Demonstration Project Survey: English/Spanish Interviews Wave II;Survey: English/Spanish Interviews March 1993–May 1994 Sample (Wave 2); Survey:English/Spanish Interviews January 1995–August 1996 Sample (Combined Wave);and surveys of Alameda, Los Angeles, San Joaquin, and San Bernardino Counties.
NOTE: Entries are weighted to be representative of the four counties. Numbersmay not add because of rounding. Unweighted n = 1,711.
aNational samples: Loprest and Acs (1995).bNational Health Interview Survey.cNational Longitudinal Survey of Youth.dWork-limiting disabilities were measured in all surveys as a problem that limits
the amount of kind of work the respondent could do.eLimitations were defined as limitations in major activity (NHIS), as a functional
limitation (SIPP), or as a work, school, or physical limitation (NLSY).

43
such as the Survey of Income and Program Participation (SIPP). Ifdisabilities and poor health are associated with longer stays on welfare, wewould expect families in our cross-sectional sample, which has a highproportion of long-term welfare recipient families, to have higher rates ofdisability; likewise we would expect families in our new to welfare sampleto have lower rates of disability and health problems.
This is essentially what we find. Among mothers, work-limitingdisabilities were reported by 26.1 percent of women in our cross-sectional and 13.6 percent of women in our new to welfare samples. Innationally representative samples, 16.6 to 19.2 percent of women onAFDC reported affirmatively to the nearly identical question. Mothersreported poor health at a rate of 4.0 percent in our cross-sectional and2.8 percent in our new to welfare sample; in a nationally representativesample the rate is 4.5 percent. (We combine these two indicators (worklimiting disabilities or poor health) into our composite indicator of adultdisability.)
For children, both samples and questions are less comparable acrossdatasets, rendering comparisons difficult. Nationally representativesamples, using parent reports of child disabilities and limitations,estimate that between 11.1 and 15.9 percent of children in AFDChouseholds have a limiting condition. Because our data are weighted tohouseholds rather than children, we report disabilities at the family level.We estimate that between 19.4 (cross-sectional sample) and 8.7 (new towelfare sample) percent of families on AFDC cared for at least onedisabled child—once again, bracketing estimates from other surveys.
Estimates across the surveys are even closer when we use a commonlevel of analysis: AFDC families in which either the mother or a child hassome limiting condition. For this measure, national surveys estimate27.4 to 29.5 percent of families are affected, whereas the AFDChousehold survey for the two samples yields an estimate of 29.7 percentfor those already on welfare and 23.1 percent for those new to welfare.This comparison gives us considerable confidence about the reliability ofour estimates.
These data suggest that between 20 and 25 percent of poor familiesin the welfare system include families with disabled or ill mothers or
44
children and that those families most at risk for long-term welfare stayshave an even higher prevalence of disabilities and chronic illness amongmothers and children. As those most able to leave welfare continue to doso, it seems likely that families with disabilities and chronic illnesses willmake up an increasing share of the welfare caseload.
Types of DisabilitiesFor each child identified by our screening questions, respondents
were also asked to identify up to five conditions causing the child’simpairment. For purposes of this analysis, we use only the first listedimpairment for the eldest child with a disability in the family. Becausemany impairments affect only a small number of children, we groupedchildren’s conditions into eight broad categories. Four are classified asphysical impairments: (1) respiratory diseases (including asthma); (2)arthritis, deformities, and diseases causing muscle weakness; (3) visual orhearing impairments; (4) all other physical conditions. Another three areclassified as mental impairments: (5) behavioral and learning disorders(including attention deficit hyperactivity disorder); (6) mentalretardation and developmental disabilities (including autism); and (7)mental and emotional illness. Speech impairments constitute a finalcategory.
Almost three-quarters (71.7 percent) of children’s disabilities werephysical impairments and one-quarter (25.5 percent) were mentalimpairments. As shown in Table 5.6, both types of conditions imposedlimitations that range from mild to severe for individual children.
Almost two-thirds of the physical impairments (about 45 percent ofall disabilities) were respiratory diseases, in particular, asthma. The veryhigh prevalence of asthma in this population is consistent with otherstudies, which find that poor children, living in poor-quality housing andneighborhoods, have the highest rates of morbidity and mortality fromasthma in the country (Rosenstreich et al., 1997; Call et al., 1994;Sarpong et al., 1996). In this sample, children with respiratorydisabilities were more likely to be moderately (not severely) disabled thanwere children with other conditions. However, because so manychildren had respiratory illnesses, those who were coded as having a

45
Table 5.6
Distribution of Child Disabilities by Diagnosis of First Child with Disabilityfor Households with Disabled Children
(in percent)
Severity of Child’s Disability
DisabilityMild
DisabilityModerateDisability
SevereDisability Total
Physical impairmentRespiratory 3.1 29.1 12.8 45.0Arthritis, deformity, muscle weakness 0.1 1.9 1.2 3.2Visual/hearing impairment 1.0 3.8 0.2 5.0Other physical 5.0 6.7 6.7 18.4All physical 9.3 41.4 21.0 71.7Mental ImpairmentBehavioral/learning disorder 0.4 9.9 3.6 13.9Mental retardation/developmental delays 0.2 2.9 3.2 6.2All/emotional illness 0.5 2.7 2.1 5.3All mental 1.1 15.5 8.9 25.5Speech impairment 0.5 1.7 0.0 2.3Condition not known 0.0 0.2 0.4 0.5
Total 10.9 58.8 30.2 100.0
SOURCES: Authors’ calculations from the California Work Pays DemonstrationProject Survey: English/Spanish Interviews Wave II and surveys of Alameda, LosAngeles, San Joaquin, and San Bernardino Counties.
NOTE: Entries are weighted to be representative of the four counties. Numbersmay not add because of rounding. Unweighted n = 372.
severe limitation because of these respiratory illnesses constitute thelargest single category of children with severe conditions.
After respiratory impairments, the second largest category ofimpairments was a broad group of other physical diseases and disabilities,from cancer to epilepsy and cystic fibrosis. Conditions such as theseaffected nearly one-fifth of disabled or ill children and over one-thirdimposed severe limitations. The remainder of the physical impairmentsincludes visual and hearing impairments and arthritis, deformity, andmuscle weakness.
Another one-quarter of all conditions are classified as mentalimpairments. Of these, behavior and learning disorders were the mostcommon, closely followed by developmental problems or mentalretardation and mental illness. Over 50 percent of children with mental

46
retardation or developmental disabilities were severely limited; 40 percentof those with mental and emotional illness were also classified as severe.Behavioral and learning disorders, in contrast, were predominantly codedas moderately limiting.
The Frequency and Magnitude of Direct CostsWe measured the direct disability-related expenses incurred by
families in two ways. First we asked whether the family had made anyspecial purchases or incurred major costs, over $100, since the priorsurvey, because of any child’s disability. Second, we asked whether thefamily had experienced any disability-related expenses in the priormonth, and the amount of those expenses, in six categories: specialclothes, special foods, transportation, medicine and health care, childcare, and any other special expenses.1 For the purposes of analysis, weseparate child care expenses from all other expenses. Respondents withmore than one special needs child reported aggregate expenses for all thechildren in each category. Table 5.7 shows how expenses varied with thenumber of disabled children and the severity of their condition.
Looking first at major expenses, 12.5 percent of families reported atleast one major purchase or expenditure, (over $100), in the 18 monthsbetween waves of the survey. Medical care (such as tests, hospital stays,or therapy) and special equipment (such as wheelchairs or braces) werethe most common sources of major expenditures.
A much greater proportion of families with special needs childrenincurred some out-of-pocket expenses in the prior month. Thirty-eightpercent of such families reported incurring some expenses other thanchild care in the prior month, averaging $105. Nearly 20 percentreported special expenses associated with child care for a disabled child,averaging $120. Since some families with disabled children reported nospecial expenses in the previous month, the average expenses over all____________
1These questions were designed to elicit only extra or special expenses relatedspecifically to the child’s disability. However, in the case of child care, it is possible thatrespondents were unable to separate the extra marginal cost of care due to the child’sspecial needs and reported the full cost of care. For our analysis, we assume that thereported cost of child care does represent only extra or special expenses, but conclusionswith respect to this variable should be interpreted cautiously.

47
Table 5.7
Out-of-Pocket Disability-Related Expenses of Families with DisabledChildren
One Disabled ChildMore Than OneDisabled Child
ExpensesAll
FamiliesModeratelyDisabled
SeverelyDisabled
AllModeratelyDisabled
AnySeverelyDisabled
Expenses in the last yearPercent with expenses > $100 12.5 13.0 18.5 2.1 29.3Expenses other than child care
last monthPercent with any 38.0 30.6 51.3 41.0 65.3Average amount, $ 104.53 68.57 123.33 74.25 143.37Standard deviation, $ 102.03 80.72 137.92 61.98 136.07Child care expenses last monthPercent with any 18.8 25.5 8.9 8.2 33.4Average amount, $ 119.98 135.22 55.16 116.21 122.89Standard deviation, $ 83.62 86.60 33.42 73.93 109.12
SOURCES: Authors’ calculations from the California Work Pays DemonstrationProject Survey: English/Spanish Interviews Wave II and surveys of Alameda, LosAngeles, San Joaquin, and San Bernardino Counties.
NOTE: Entries are weighted to be representative of the four counties. Averageamounts and standard deviations are among those families with any expenses.Unweighted n = 372.
families with disabled children, whether or not they reported expenses,was about $62.
As has been found in other studies, direct expenses associated withthe care of a disabled child were highly variable across families. Both theseverity of the condition and the number of children affected helpexplain variation in non–child care costs. Families with more than onedisabled child were substantially more likely to have paid for specialclothing, food, transportation, or medical costs, and they paid nearly $20more on average. Families who cared for any child with a severelimitation were nearly twice as likely to incur such expenses than thosewith less severely affected children and, among those who did, incurredexpenses that were more than twice as great. Families with a singleseverely disabled child were less likely to have paid for specialized childcare than were those with a single, moderately impaired child, either

48
because they provided full-time parental care or because they had accessto care through public programs. Given this, it is surprising to note thatamong families with more than one special needs child, families with atleast one severely disabled child were more likely to be using specializedcare. Since we cannot assign child care costs at the child level, we cannotdetermine whether this reflects more use of paid care for severelyimpaired children among these families or use of care for a less-compromised child in the family. The lack of significant variation inout-of-pocket costs for specialized child care across these familiessupports the latter explanation.
In terms of specific expenses (see Table 5.8), unreimbursed medicalexpenses are the most common, reported by nearly one-quarter offamilies. Although common, medical expenses were moderate for most.Specialized child care was the next most common form of expense, and itwas the most expensive category of expense.
The type of condition did little to predict families’ financial burden(see Table 5.9). Families were slightly more likely to incur costs if theirchild had a physical condition, but they paid more, on average, if thechild’s condition was a mental impairment.
Table 5.8
Distribution of Out-of-Pocket Disability Expenses for Familieswith Disabled Children
Type of Expense
% of Families withExpense in Last
Month
AverageAmount ofExpense, $
StandardDeviation ofExpense, $
Clothing 8.6 82.14 48.23Food 14.5 84.84 51.81Transportation 6.2 48.86 26.48Medical 23.5 49.49 55.43Child care 18.8 119.98 83.62Other 6.5 87.43 98.67Total (all types) 46.2 134.89 123.82
SOURCES: Authors’ calculations from the California Work PaysDemonstration Project Survey: English/Spanish Interviews Wave II andsurveys of Alameda, Los Angeles, San Joaquin, and San Bernardino Counties.
NOTE: Entries are weighted to be representative of the four counties.Average amounts and standard deviations are among those families with anyexpenses. Unweighted n = 372.

49
Table 5.9
Distribution of Out-of-Pocket Expenses by Diagnosis for Householdswith One Disabled Child
Expenses in Last Month
Diagnosis
% ofFamilies
withExpenses
AverageExpenses,
$
StandardDeviation,
$
% of Familieswith Expenses> $100 Since
Wave 1Physical impairmentRespiratory 43.8 101.67 75.16 10.1Arthritis, deformity, muscle
weakness 30.1 92.18 24.80 7.6Visual/hearing impairment 33.5 249.51 96.89 46.5Other physical 52.4 135.12 119.68 15.2All physical 44.9 120.87 94.65 14.2Mental ImpairmentBehavioral/learning disorder 38.6 173.15 93.74 6.2Mental retardation/developmental
delays 41.2 70.66 65.43 0.0Mental/emotional illness 43.8 154.34 142.06 15.8All mental 40.7 137.72 101.90 6.9Speech impairment 63.6 202.91 141.94 52.4Condition not known 100.0 83.44 31.67 0.0
SOURCES: Authors’ calculations from the California Work Pays DemonstrationProject Survey: English/Spanish Interviews Wave II and surveys of Alameda, LosAngeles, San Joaquin, and San Bernardino Counties.
NOTE: Entries are weighted to be representative of the four counties. Averageamounts and standard deviations are among those families with any expenses.Unweighted n = 283.
Perhaps the more striking finding from these data is the lack ofvariation across categories. Excluding the small number of childrenwhose first diagnosis was speech impairments, the probability ofincurring costs in the prior month ranges between 30 and 52 percent.Only one category other than speech impairments was associated withaverage monthly costs of more than $200; the balance had average coststhat ranged narrowly between $70 and $170. No diagnostic category,including the large category of children with respiratory diseases, or theoftentimes controversial “soft” diagnoses of mental and behavioraldisorders, can be identified as creating little or no financial burden forfamilies.

50
The Frequency and Magnitude of Indirect CostsOut-of-pocket expenditures are not the only way in which care for
special children is costly. Special needs children are also expensive interms of time. Many parents with exceptional children combine theircaregiving work with work outside the home. If the caregiving demandsbecome too high, however, parents may be forced to reduce or forgoemployment to provide full-time care for their child.
We measured these indirect costs by considering the effect of childdisabilities on mothers’ employment. Respondents were asked whetherthey were currently employed in a “regular” job. Because theemployment of low-income parents and those with young children isoften volatile, the survey also included questions about any work (at “oddjobs”) in the prior month. Women who reported either regular or oddjobs in the prior month were asked for their hours of employment.Mothers who cared for any children with chronic mental, physical, oremotional conditions were asked additional questions about whether carefor those children caused them to reduce their employment at presentand whether they expected this care to reduce employment 12 months inthe future.
The data (Table 5.10) suggest that these low-income families arepaying opportunity costs in terms of their employment. Overall, justover one-third of all survey respondents (36.6 percent) indicated thatthey had worked for pay in the prior month. This rate of employment isconsiderably higher than estimates based on welfare records but stillsomewhat below estimates based on in-depth ethnographic studies. Edinand Lein (1997), for example, report that 46 percent of welfare recipientsobtain some of their income through employment. These discrepanciesmay be due to high levels of work in underground or illegal activities(reported by 8 percent of Edin and Lein’s respondents.)
Although these estimates may not capture the full extent ofemployment among current and recent welfare recipients, they do permitcomparisons across families. In comparison to mothers with healthychildren, those with disabled or ill children were less likely to beemployed in the prior month. About two-thirds of mothers with onlyhealthy children were not working when contacted. About the same

51
Table 5.10
Employment Rates by Child Disability for All Families(in percent)
One Disabled ChildMore Than OneDisabled Child
Mother’s EmploymentStatus and Impact ofChild(ren)’s Condition All
NoDisabled
ChildModerately
DisabledSeverelyDisabled
AllModeratelyDisabled
AnySeverelyDisabled
Employed last month 33.0 35.3 34.0 17.5 16.2 5.2Limits mother’s work
now n.a. 34.5 63.1 49.0 95.2Limits ability to work at
all n.a. 10.6 26.5 11.5 52.7Limits hours available
for work n.a. 24.0 36.6 37.6 42.6Limits work in 12
months n.a. 22.4 38.5 33.0 78.0Limits ability to work at
all n.a. 7.1 15.9 4.0 40.9Limits hours available
for work n.a. 15.3 22.7 28.9 37.1
SOURCES: Authors’ calculations from the California Work Pays DemonstrationProject Survey: English/Spanish Interviews Wave II and surveys of Alameda, LosAngeles, San Joaquin, and San Bernardino Counties.
NOTE: Entries are weighted to be representative of the four counties.Unweighted n = 1,711.
proportion of mothers with a single, moderately disabled child were notemployed. In contrast, less than 20 percent of mothers with more thanone or any severely disabled children report hours of employment.
Mothers’ self-reports also indicated that care for special needschildren depressed employment. One-third of those with only onemoderately disabled child indicated that care for the child made itdifficult to work. The percentage of mothers reporting barriers to workincreased dramatically with the number and severity of children’s specialneeds. Of those with a single severely disabled child, 63 percent reportedbarriers, and nearly all of those with multiple and at least one severelydisabled children did so. Mothers were more sanguine about theiremployment prospects in one year into the future, perhaps because theyexpected their children’s need for care to decline or supportive public or

52
family services to increase. Nevertheless, from 22 to 78 percent expectedthat caring for special children will cause them to limit their work in thenext year.
Although mothers with disabled children are observed to work lessthan other mothers in our sample, it is possible that this differencereflects other, unobserved characteristics of these mothers. Mothers whowere out of the labor force for other reasons may also have attributedtheir lack of employment to the need to care for their children, biasingthe estimate upward. To isolate the effect of caring for a special needschild from other factors that affect employment, we use regressiontechniques to estimate the reduction in employment probabilities andhours associated with children’s special needs while controlling for otherfactors that influence the employment decision. Details of the estimationand full results are provided in Appendix A. Table 5.11 provides asummary of the effect of children’s disabilities.
As would be predicted from prior research, mothers were less likelyto be employed, and worked fewer hours, if they were younger, had feweryears of education, had never been married, had health problems, had
Table 5.11
Selected Results, Impact of Childhood Disabilities on Mothers’Employment in the Prior Month (Tobit Estimates)
(in percent)
Any Child withModerateLimitation
Any Child withSevere
LimitationChange in the probability ofemployment (among all mothers)
Change in hours of employment (amongmothers who were employed)
–0.03
–3.18
–0.15***
–15.32***
SOURCES: Authors’ calculations from the California Work PaysDemonstration Project Survey: English/Spanish Interviews Wave II and surveysof Alameda, Los Angeles, San Joaquin, and San Bernardino Counties.
NOTE: Model also controls for individual, family, local labor market, anddesign effects. Full results are provided in Appendix A. Unweighted n = 1,732.Statistical significance level indicated as ***p < .01.

53
more children, or had any children under the age of six (see AppendixA). Employment was also lower in families who were eligible for higherwelfare benefits (based on the number of AFDC-eligible children).Receipt of SSI for any family member other than the mother herself wasnot significant, although the coefficient was moderately large. Mothers’probability of employment also decreased two percentage points, andhours decreased by about 2.3 per month among those employed, witheach one point increase in the local unemployment rate.
After controlling for these individual and structural factors,children’s disabilities explained a significant share of the remainingvariation in employment outcomes. As shown in Table 5.11, thepresence of a child with only moderate limitations was not significantlyrelated to mothers’ employment although the effect is negative(suggesting a reduction in employment). In those families caring for achild with a severe limitation, however, mothers’ probability ofemployment was 15 percent lower, and mothers who were employedworked an average of 15 fewer hours per month. This suggests that carefor more severely impaired children imposed a greater employmentbarrier for mothers. At the prevailing minimum wage of $5.15 per hour,15 hours of forgone employment translates into $77 in forgone incomeeach month among those who were employed. Assuming a minimumwage rate of pay and accounting for both reductions in the probability ofemployment and reductions in hours worked among those employed,mothers forgo an average of approximately $80 per month inemployment income if they care for a severely disabled child.
The Economic Consequences for Families: Povertyand Hardship
These data suggest that the care of a disabled child had considerablefinancial implications for families, particularly for those caring for anyseverely impaired child. In absolute terms, their direct costs averagingjust under $150, and forgone earnings of $80 or more, may seem small.However, even relatively small out-of-pocket expenses may create asignificant burden on a low-income family with few resources to spare.To measure the effect of special expenses on the economic well-being of

54
the family, we calculate each family’s income and poverty status for theprevious month before and after subtracting the total special expensesrelating to the care of a special needs child (all “extra” or special costsrelating to child care and other costs). Because SSI makes a significantcontribution to cash income, we consider outcomes separately forfamilies who did and did not receive SSI for a disabled child. Andbecause so many of the families in this sample are poor, we reportfamilies’ economic status relative to extreme poverty—defined here as 75percent of the federal poverty threshold.
Before adjusting incomes for special expenses, we find that 68percent of families with a disabled child and no SSI had incomes at orbelow 75 percent of the poverty line. Families with a disabled child whoreceived SSI were doing somewhat better, on average. Only 20 percentof these families were extremely poor.
The federal poverty threshold measures economic hardship in termsof resources (cash income) relative to need (basic food expensesmultiplied by three), adjusting for family size. Although this formulamay capture the loss of earned income associated with the care of adisabled child, it does not capture the higher level of need in thesefamilies. When we adjust families’ income by subtracting the direct, out-of-pocket expenditures for the care of disabled children, a much higherproportion of these families are observed to be living in extreme poverty.Nearly three-quarters (72 percent) of families without SSI and one-third(32 percent) of those with SSI have incomes below 75 percent of thepoverty line once the extra expenses associated with their disabled childare considered. The direct out-of-pocket expense of caring for a disabledchild pushed somewhere between 4 percent and 12 percent of alreadypoor families into extreme poverty.
Income poverty may still not capture the full effect of these privatecosts, however. When very poor families face extraordinary costs, theyare unlikely to have a cushion of income or savings on which to draw.Meeting the needs of a special child may force families to make choices—between purchasing specialized goods and services for this child ormeeting the basic needs of the family.
We can get some idea of whether families make such tradeoffs bycomparing their experience of income-related hardship in the prior year.
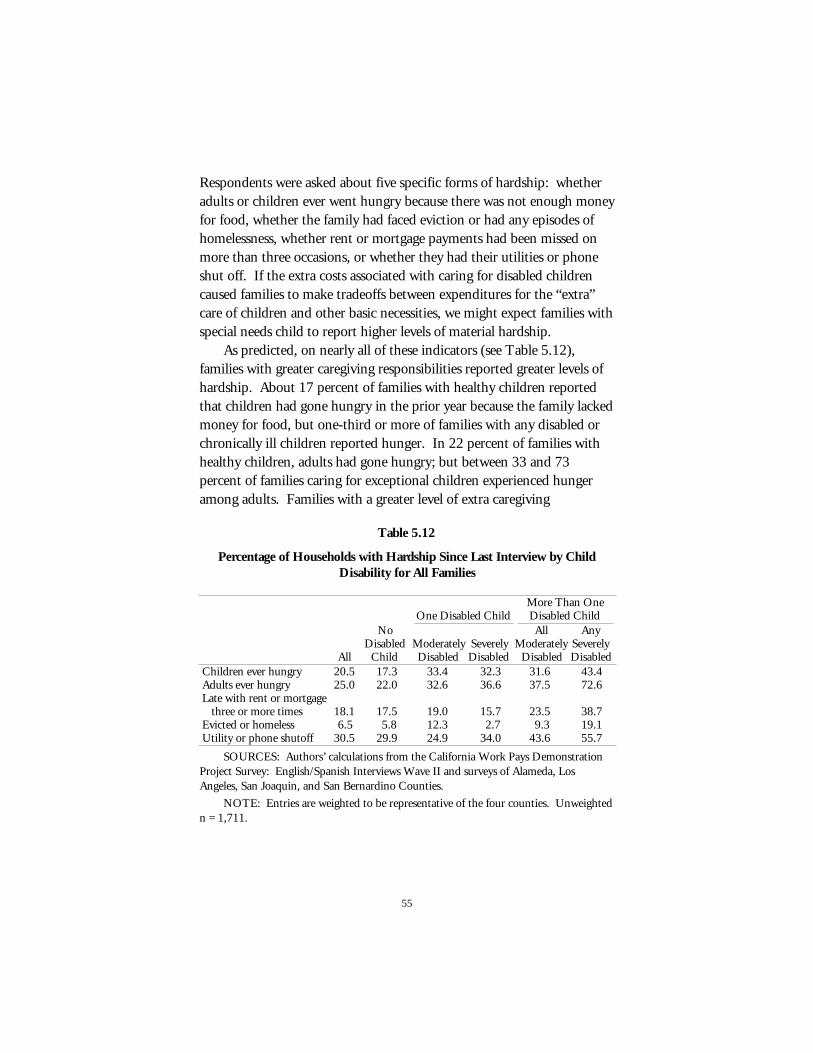
55
Respondents were asked about five specific forms of hardship: whetheradults or children ever went hungry because there was not enough moneyfor food, whether the family had faced eviction or had any episodes ofhomelessness, whether rent or mortgage payments had been missed onmore than three occasions, or whether they had their utilities or phoneshut off. If the extra costs associated with caring for disabled childrencaused families to make tradeoffs between expenditures for the “extra”care of children and other basic necessities, we might expect families withspecial needs child to report higher levels of material hardship.
As predicted, on nearly all of these indicators (see Table 5.12),families with greater caregiving responsibilities reported greater levels ofhardship. About 17 percent of families with healthy children reportedthat children had gone hungry in the prior year because the family lackedmoney for food, but one-third or more of families with any disabled orchronically ill children reported hunger. In 22 percent of families withhealthy children, adults had gone hungry; but between 33 and 73percent of families caring for exceptional children experienced hungeramong adults. Families with a greater level of extra caregiving
Table 5.12
Percentage of Households with Hardship Since Last Interview by ChildDisability for All Families
One Disabled ChildMore Than OneDisabled Child
All
NoDisabled
ChildModeratelyDisabled
SeverelyDisabled
AllModerately
Disabled
AnySeverelyDisabled
Children ever hungry 20.5 17.3 33.4 32.3 31.6 43.4Adults ever hungry 25.0 22.0 32.6 36.6 37.5 72.6Late with rent or mortgage
three or more times 18.1 17.5 19.0 15.7 23.5 38.7Evicted or homeless 6.5 5.8 12.3 2.7 9.3 19.1Utility or phone shutoff 30.5 29.9 24.9 34.0 43.6 55.7
SOURCES: Authors’ calculations from the California Work Pays DemonstrationProject Survey: English/Spanish Interviews Wave II and surveys of Alameda, LosAngeles, San Joaquin, and San Bernardino Counties.
NOTE: Entries are weighted to be representative of the four counties. Unweightedn = 1,711.

56
responsibility were also more likely to have had difficulty paying theirhousing costs, to have experienced eviction or periods of homelessness,and to have had phone or utility shut-offs because they could not paytheir bills.
57
6. The Public Costs of Care
Families absorb substantial direct and indirect costs caring forchildren with disabilities and chronic illnesses. Not all of the costsassociated with the care of these children are private, however. Publicprograms shoulder a portion of the burden as well. Most publicexpenditures on behalf of disabled children are used to provide directservices, principally through school-based special education and earlyintervention programs. If families are poor enough, governmentprograms may also offset a portion of private caregiving costs throughtargeted and means-tested transfer programs.
Disabilities and Public Program ParticipationAggregate spending figures provide one measure of the extent to
which public programs share the burden of care for exceptional children.However, spending figures do not tell us much about the likelihood thatindividual families use these programs. Families with disabled and illchildren are by definition more likely than others to participate inspecialized educational and therapeutic programs for children. Thesesame families are also overrepresented in nontargeted programs providingincome, food, housing, and medical assistance.
We measured families’ participation in targeted programs by askingparents who cared for any disabled or ill children whether those childrenreceived services from a variety of local, state, and national programs.Participation in these programs was relatively common among thesefamilies, and the likelihood of receiving services was closely associatedwith the severity of their children’s limitations. About 43 percent offamilies with a single, moderately disabled child had that child in specialeducation services, in comparison to 75 percent of families with more

58
than one impaired child, at least one of whom was severely limited1 (seeTable 6.1). Fewer families were receiving case management fromCalifornia Children’s Services or Community Mental Health Services.Although lower overall, participation rates in these programs alsoincreased substantially with the number and severity of special needs inthe family.
Some families with severely disabled adults or children were alsoeligible to receive cash assistance through SSI, either alone or incombination with AFDC. Nearly 5 percent of families without specialneeds children were receiving SSI for another household member. Inthose families with moderately to severely disabled children, between 23and 46 percent were receiving SSI for one or more family members.
It is more surprising to find a similar pattern in nontargeted,means-tested welfare programs. Although just under three-quarters offamilies without disabled children were still receiving welfare whencontacted (from 30 to 42 months after the sample was drawn), between81 and 99 percent of those caring for disabled children remained in thewelfare system. Rates of participation in the Food Stamp program weresimilar, ranging from 71 percent of those with no special caregivingresponsibilities to as high as 88 percent of those with the highest level ofextra caregiving burden. The percentage of families in subsidizedhousing (or receiving housing subsidies) varied from a low of 18 percentamong those with no special needs children to between 25 and 38percent of those with special needs children.
Rates of Medicaid participation also increased along with thepresence and severity of children’s disabilities. To standardize estimatesat the family level, Medicaid participation figures are reported for onerandomly selected child in each family. (This may or may not have beenthe disabled child.) About three-quarters of families with only healthychildren were still receiving Medicaid for at least one child when familieswere interviewed. In contrast, from 83 to 100 percent of families withany disabled children were still in the program. Not surprisingly, rates of____________
1Measures of program participation do not count families in the application process,on waiting lists, or under review for services and are, therefore, conservative estimates.

59
Table 6.1
Program Participation by Number and Severity of Disabled Children for AllFamilies
(in percent)
One Disabled ChildMore than OneDisabled Child
Type of Participation
NoDisabled
ChildModeratelyDisabled
SeverelyDisabled
AllModerately
Disabled
AnySeverelyDisabled
Special services, any child inSpecial education or early
intervention n.a. 43.9 39.6 65.1 74.7California Children’s
Services n.a. 6.9 21.5 22.8 25.3Community mental health
services n.a. 10.7 10.9 13.7 32.3Means-tested incomea
Currently receiving AFDC 72.9 81.2 85.6 86.9 99.0Currently receiving SSI 4.9 22.7 33.8 30.7 45.8Currently receiving either
AFDC or SSI 74.4 82.9 89.1 88.0 99.8Means-tested in-kindCurrently receiving Food
Stamps 71.6 73.6 79.4 82.3 88.2Currently in subsidized
housing 17.7 25.1 28.6 27.4 37.9Public health insuranceMedicaid or Medicare
(child)b 77.0 83.3 82.5 89.7 100.0Medicaid or Medicare
(mother) 67.4 72.8 86.9 72.3 81.2
SOURCES: Authors’ calculations from the California Work Pays DemonstrationProject Survey: English/Spanish Interviews Wave II and surveys of Alameda, LosAngeles, San Joaquin, and San Bernardino Counties.
NOTE: Entries are weighted to be representative of the four counties.aAFDC or SSI for anyone in household.bPublic health insurance (child measure) = randomly selected child. Unweighted
n = 1,711.
Medicaid coverage were lower for parents than for children, across all ofthe groups. Although mothers in families with special needs childrenwere less likely to be insured than their children, they were still morelikely to be Medicaid recipients than were mothers who had only healthy

60
children. This may reflect higher rates of welfare participation amongfamilies with special needs children.
The disproportionate representation of families with disabledchildren in means-tested welfare programs may be directly related tolower rates of employment and higher rates of poverty among thesefamilies. For families at the margin of poverty, absorbing direct out-of-pocket expenses may consume any financial assets providing a cushionagainst a slide into poverty. The indirect costs may be even moredevastating. As described by Hobbs, Perrin, and Ireys (1985), “Forfamilies in poverty, and especially for single-parent families, the presenceof a child with a chronic illness may effectively remove any opportunityto earn sufficient money to climb out of poverty. Real income loss issmall because income is small in total dollars; opportunity for increasingincome, however, may vanish under the demands for care.”
Disabilities and Welfare ExitsThe Hobbs et al. observation is consistent with a great deal of theory
and evidence suggesting that children’s disabilities increase the likelihoodthat their families will be poor. It seems reasonable to expect thatfamilies with disabled children will also be more likely to use means-tested, categorical welfare programs and, once enrolled, less likely to leavethem. However, this expectation is not confirmed by a substantialempirical literature on the dynamics of participation in welfare programs,most particularly on entries and exits from the AFDC program. Anumber of analysts have included measures of disability in theirestimations of the probability and the duration of welfare use. To date,empirical results have been mixed.
The most commonly used measures of adult disabilities are self-reports of activity limiting disabilities and poor health. A number ofanalysts have found evidence that these indicators of disability and healthproblems are associated with higher probabilities of welfare receipt (e.g.,Blank, 1989; Hutchens, 1981) and lower probabilities of welfare exits(e.g., O’Neill, Bassi, and Wolf, 1987; Sandefur and Cook, 1997).Results have been inconsistent, however, and vary with the populationstudied and measure of disability used. Other analysts (e.g., Plotnick,1983) have found no association.

61
Only a few researchers have included measures of the addedcaregiving responsibilities associated with disabled children. In her studyof the role of medical need and Medicaid receipt on AFDC participation,Blank (1989) finds that reported poor health of other householdmembers—who may be dependent children—increases the probability ofAFDC participation. In one of the few analyses of welfare durations thatinclude measures of both child and adult disability, Acs and Loprest(1999) find that the presence, number, type, and severity of functionallimitations reported by an adult woman all significantly reduce herprobability of leaving AFDC for employment; however, these samemeasures are not significantly associated with other types of welfare exits(for example, those resulting from changes in household composition,marriage, or increases in transfer income). They find almost no evidencethat measures of children’s functional limitations reduce the probabilityof welfare exits.
Given the consistent finding that child disabilities reduce theparent’s labor supply, the inconsistency of the empirical findings ondisability and welfare are puzzling. Our resolution of this paradox isquite simple. Most studies of transitions from AFDC have grouped allexits from the program together. This means that transitions entirely offassistance are treated the same as transitions to SSI. This failure todistinguish between transitions “from welfare” and transitions “betweenwelfare programs” has potentially serious implications for estimating theeffect of disability on welfare exits. Theory and research suggest thatmore, and more severe, disabilities and health problems will reducehuman capital, earning potential, and the probability of leaving someform of assistance. But these same factors increase the probability thatsomeone in the household will be eligible for cash assistance through SSI,either along with or instead of other forms of welfare. It is possible thatearlier studies on the role of disabilities in welfare transitions have failedto find consistent effects because they estimated an average of twooffsetting effects.2
____________ 2Although a single individual could not receive benefits from both SSI and AFDC
programs, a family with a disabled child or a disabled mother could combine benefitsfrom both. For example, a disabled child could receive SSI benefits while the rest of the

62
Our approach to solving these problems is to conduct multivariatehazard analysis using a combination of data from the household surveywith administrative data obtained from welfare payment records.3
Administrative payment data from state and county welfare systems makeit possible to determine with precision when families began their spell ofAFDC receipt, when that spell ended, and when any members moved toSSI.4 Our general strategy was the following. Each case in the samplewas receiving AFDC or AFDC and SSI as of December 1992 (by sampledesign). Each case was followed until December 1995 usingadministrative data until (a) it left AFDC entirely by moving completelyoff aid, or (b) it left AFDC entirely by moving to SSI alone; remainingcases (those receiving AFDC or AFDC and SSI continuously untilDecember 1992) were treated as censored.5
In Appendix B we describe a multivariate hazard analysis thatestimates the effect of disabilities on exits from AFDC, controlling forother individual and family factors. We use a method that accounts for“competing risks.” This technique was developed in biomedical researchfor situations where mortality is the result of competing risks such asheart disease and cancer. In these circumstances, the duration of one’slife depends on which disease strikes first. Similarly, with welfare spells,the duration of one’s spell depends on which change in status comesfirst—getting SSI for one’s child or finding some way to get off welfaresuch as working or getting married.
Full results of the hazard analysis are provided in Appendix TableB.1. As would be expected, families with more children under age six areless likely to leave welfare for complete independence, whereas those inwhich the mother has higher education and lives with a partner or spouse________________________________________________________ household received AFDC. If a child were eligible for either AFDC or SSI benefits, thechild’s family was usually better off if the child received SSI benefits.
3For these analyses, 159 cases were excluded because of missing data.4A small number of cases that were initially sampled in October 1992 but that left
aid before December 1992 were excluded from the survey sample. For those cases thatbegan their AFDC spell before January 1987, we use the survey data to establish thebeginning of the spell.
5Note that this coding combines cases that remained on AFDC alone with thosethat changed to AFDC plus SSI, because both states involve no movement off AFDC.

63
are more likely to experience a transition to independence. In the fullyspecified model for transitions from welfare to SSI, few covariates (otherthan disability) reach statistical significance, suggesting that thistransition is less dependent on other individual or family characteristics.
Table 6.2 presents the results for the disability variables, once otherfactors are controlled for. The first column, “Transitions off Aid,”reports estimates of the effects of disability on the transition from AFDCto being completely off aid. The second column, “Transitions to SSI,”reports results for a transition to SSI (alone). The disability variableshave very substantial consequences for the movement to SSI. Severedisabilities have a greater effect than moderate ones, and children’sdisabilities emerge as more influential than those of mothers. Inaddition, moderately disabled children seem likely to move their familyto SSI whereas moderately disabled mothers do not. This greaterimportance of children’s disabilities might be a real effect, but it alsomight be the result of our greater ability to measure children’s disabilitiesand their transitions to SSI. Whatever the explanation for these
Table 6.2
Competing Risks Model of Transitions off AFDC(standard errors in parenthesis) (in percent)
DisabilitiesTransitions
off AidTransitions
to SSIModerately disabled children –0.8 1.65*
(.17) (.64)Severely disabled children –1.39** 2.26**
(.44) (.83)Moderately disabled mother –.34* –0.41
(.16) (.55)Severely disabled mother –.59 .94
(–0.3) (–0.5)
SOURCES: Authors’ calculations from the CaliforniaWork Pays Demonstration Project Survey: English/SpanishInterviews Wave II and surveys of Alameda, Los Angeles, SanJoaquin, and San Bernardino Counties.
NOTE: Statistical significance indicated by * p < .05,** p < .01. Complete results are reported in Appendix B.

64
differences, it is hardly surprising to find that disabilities move families toSSI.
It is much more surprising given the previous literature to find thatdisabilities substantially reduce the ability of families to move tocomplete independence off AFDC and SSI. The effect is very substantialfor severely disabled children and it is still quite substantial for severelydisabled and even moderately disabled mothers. For example, the effectof a severely disabled child is about double that of not having a partner inthe household. Or it is about equal to a four-year reduction in themother’s educational level. The effect of a severely disabled mother isabout one-half this magnitude.
This analysis suggests that disabilities and health problems are asignificant factor in transitions out of the AFDC program in severalways. They significantly decrease the chances that households leavewelfare entirely (that is, make transitions to no aid) through changes inbehavior or other circumstances, and they increase the probability thathouseholds leave welfare through administrative mechanisms by makingtransitions to the SSI program. In policy terms, these exits might bethought of as transitions to “independence” and to “partialindependence,” respectively. It is especially interesting that children’sdisabilities have larger effects for these transitions than do mothers’disabilities.

65
7. Public Programs and PrivateWell-Being
The analysis in Chapter 5 reveals that somewhere between one-fifthto one-quarter of the families in the public welfare system care forchildren with disabilities and that these families assume substantial directand indirect costs associated with this care. Chapter 6 suggests that thesefamilies are overrepresented not only in targeted disability programs butalso in means-tested cash, food, housing and medical assistanceprograms. Not only are they more likely to participate in theseprograms, they are likely to stay for a longer time. Recent welfarereforms have emphasized the reduction of welfare “dependence.” Forfamilies who bear extraordinary private caregiving costs, however,concerns about dependence may be misplaced. In fact, assistance frompublic programs may be an essential part of an income packaging strategyfor families who assume extraordinary caregiving costs.
We have argued that families who care for a disabled or ill child mayface an increased risk of economic hardship for two reasons. They arelikely to have fewer economic resources, insofar as care for that childlimits parents’ availability for paid employment. They are also likely tohave greater demands on those resources, because of the purchase ofspecialized goods and services related to the child’s disability or illness.Either constraint will have similar results—limiting families’consumption and possibly forcing them to make tradeoffs between thepurchase of specialized goods for the disabled child and basic goods forother family members. Although families with special children may notappear worse off in terms of income, they are likely to be worse off interms of income available for other needs and in their experience ofmaterial hardship.
Public programs could reduce this risk by addressing either problem:by increasing the resources that families have available for these

66
specialized purchases or by offsetting the costs of specialized goods andservices directly. To the extent that they do so, cash transfers and in-kind assistance promote economic security and families’ ability to carefor special needs children at home. Two programs warrant specialconsideration in this regard: Supplemental Security Income andMedicaid.
Public Programs and Private SpendingOne standard by which we might judge the value of these programs
is by asking whether they increase the availability of specialized goods andservices for disabled and ill children. If cash transfers through SSI andin-kind health benefits through Medicaid have the intended effect ofhelping economically vulnerable families care for these children, wewould hope to see more expenditures on behalf of children with lessdirect tradeoff on consumption choices.
To examine the effect of Medicaid and SSI on families’ out-of-pocket expenditures, we examine in Table 7.1 these direct costsseparately for families who did and did not receive benefits.
Program participation is generally associated with out-of-pocketexpenditures in the expected directions. Families who receive SSI fortheir disabled children were slightly more likely than those who do not toincur out-of-pocket expenses. More important, their spending was asubstantial 67 percent higher. If families had Medicaid, in contrast, theywere much less likely to incur direct expenses than those families who hadeither no health insurance or private coverage. Families with Medicaidalso spent less than half the amount, on average, out of pocket.
These results are consistent with program design. Although bothprograms may help offset costs, SSI and Medicaid would be expected tohave different effects on families’ expenditures. Since SSI provides anunrestricted cash benefit to families, if families use this cash to purchasegoods and services for special needs children we would expect to observeSSI-recipient children receiving more specialized goods and services thanother children, and their parents spending more on such goods andservices than other parents. This is in fact what we observe in the data.Medicaid, in contrast, provides only in-kind assistance in the form ofmedical services and goods. If Medicaid helps provide some of the same

67
Table 7.1
Out-of-Pocket Disability-Related Expenses of Familieswith Disabled Children
All Familieswith Disabled
ChildrenFamilies without SSISpecial expenses last month
Percent with any 45.5Average amount $51.87Standard deviation $92.08
Families with SSISpecial expenses last month
Percent with any 47.7Average amount $87.20Standard deviation $145.52
Families without MedicaidSpecial Expenses last month
Percent with any 75.9Average amount $122.08Standard deviation $116.43
Families with MedicaidSpecial expenses last month
Percent with any 42.3Average amount $54.58Standard deviation $108.62
SOURCES: Authors’ calculations from the CaliforniaWork Pays Demonstration Project Survey: English/SpanishInterviews Wave II and surveys of Alameda, Los Angeles,San Joaquin, and San Bernardino Counties.
NOTE: Entries are weighted to be representative ofthe four counties. Unweighted n = 372.
specialized goods and services that parents would otherwise purchasedirectly, we would expect to observe Medicaid-recipient childrenreceiving the same or higher level of goods and services as other children,but their parents spending less than parents of children withoutMedicaid. This is again what we observe in the data. As we wouldexpect, having SSI appears to increase families’ purchase of goods andservices for their disabled children, and Medicaid reduces the out-of-pocket costs that they incur.

68
Public Programs and Economic Well-BeingA second standard against which we might judge these programs is
the extent to which they decrease the hardship experienced by poorfamilies who care for expensive children. If the “extra” resources frompublic programs were effective in offsetting the direct and indirect costsassociated with the care of a disabled child, we would expect to see themdecrease the heightened risk of poverty and material hardshipexperienced by these families.
As described above, before adjusting for out-of-pocket expenses,families with disabled children were only slightly poorer than familieswith only healthy children. Indeed, those who received SSI for theirchildren appear to have been somewhat better off than other poorfamilies in terms of both income and poverty status. Yet families withdisabled and ill children were more likely to experience income-relatedhardship, in the form of hunger, housing instability, and utility shutoffs.Higher rates of hardship may reflect increased demands on familyresources relating to the special care needs of their children. Familieswith disabled and ill children may make tradeoffs between the medicaland other needs of their exceptional children and routine family expensessuch as food, rent, and utilities.
To examine the effect of children’s disabilities more directly, and toexplore the effect of SSI on reducing these tradeoffs, we use regressiontechniques to isolate the effect of disabilities and SSI receipt on the riskthat the family was poor or extremely poor and the risk that theyexperienced one or more forms of hardship: going hungry, missing rentpayments, or experiencing eviction or a utility shutoff. This techniqueallows us to control for other factors that might increase the risk ofpoverty and hardship—including education, race, marital status,employment status, and number of children in the home. (Full details ofthe model and estimation are provided in Appendix C.)
To interpret these results, we use the regression coefficients tosimulate the contribution of child disabilities and of SSI receipt to theprobability that the family was poor or experienced one or more forms ofconcrete hardship. The probabilities were first calculated for an“average” family in the sample by setting independent variable values at
69
the average for the sample.1 A severely disabled child was then “added”to the family and the probability of hardship was reestimated. A similarprocess was used to determine hardship probabilities for families withmore than one disabled child and for families with more than onedisabled child and at least one severely impaired child. To estimate theeffect of SSI on these outcomes, families with severely disabled childrenwere also “given” SSI in the same fashion.
The results reported in Table 7.2 are dramatic. The families in thissample were very likely to be poor. Among families who did not receiveSSI, caring for a disabled child raised the likelihood of poverty slightly,by one to two percentage points. The presence of a special needs childhad a slightly larger effect on the likelihood of extreme poverty, raising itfrom 84 to as high as 90 percent. If the family received SSI for a disabledchild, however, their risk of poverty was greatly reduced. Between 45and 52 percent of SSI recipient families were predicted to be living inpoverty, and only 13 to 18 percent to be living in extreme poverty.
The role of SSI in the economic well-being of these families iscaptured even more vividly in our predictions of concrete hardship.Hardship was common in this sample of very poor families. Evenfamilies that reported no disabled or chronically ill children had about a50 percent probability of having experienced one or more forms ofhardship in the prior year. If they cared for at least one disabled childand did not have SSI, their chances of material hardship were muchgreater. Among families with more than one but no severely disabledchildren, 59 percent were predicted to have experienced hardship; if thefamily cared for any severely disabled children, the likelihood increasedto between 71 and 79 percent. If they received SSI, however, familieswith disabled children had similar or even slightly lower chances ofexperiencing hardship than did their counterparts with only healthychildren. SSI did not move these families far from economic insecurity:Even with the extra income from SSI, between 38 and 61 percent ofthese families were predicted to have experienced hardship. But the extra____________
1The resulting “base” or comparison case had the following characteristics: It was afamily headed by a white, Anglo, single female respondent living in Los Angeles, with theaverage level of education for the sample (10.43 years), who was caring for the averagenumber of children (2.2), and who was not currently employed.

70
risk of hardship associated with the care of a special needs child waslargely offset by receipt of SSI.
Table 7.2
Predicted Impact of Child Disability and SSI Receipton Family Economic Well-Being
(in percent)
More Than OneDisabled Child
NoDisabled
Child
OneSeverelyDisabled
NoneSeverelyDisabled
AnySeverelyDisabled
Probability of being poor (ator below 100% poverty)No SSI 89.6 90.2 91.7 92.1With SSI 89.6 45.0 49.7 51.2Probability of being extremelypoor (at or below 75% poverty)No SSI 84.0 86.0 88.0 89.5With SSI 84.0 13.8 15.9 18.2Probability of hardship (hunger,housing instability, utilityshutoffs)No SSI 49.3 71.1 59.4 78.8With SSI 49.3 51.0 38.2 61.1
SOURCES: Authors’ calculations from the California Work Pays DemonstrationProject Survey: English/Spanish Interviews Wave II and surveys of Alameda, LosAngeles, San Joaquin, and San Bernardino Counties.
NOTES: Simulation based on logistic regression, controlling for individual,family, and design factors. Full results are provided in Appendix C. Unweighted n =1,682.

71
8. Conclusions and PolicyImplications
Our empirical analyses yield five broad conclusions. In presentingour thoughts, we return to the family profiles from Chapter 2 to give ahuman face to our summary observations.
ConclusionsFirst, we find that a surprisingly high proportion of poor, welfare-
reliant families absorb costs related to the care of disabled familymembers. By our broadest definition, 40 percent of families on welfareat a point in time and 33 percent of recent entrants have either a motheror one or more children with a chronic condition. Nearly 12 percentcare for children with moderate limitations and another 6 percent carefor children with severe problems. These conditions varied from asthma,the most prevalent condition, to heart problems, cancer, cerebral palsy,mental retardation, mental illness, and learning disorders. Parents’reports about the direct costs of caring for children with these conditionssuggest that the severity of the child’s problem is directly related to thefinancial burden for families. The child’s condition, on the other hand,is not predictive of the frequency or magnitude of family costs. Everydisease or disability category is seen to impose direct costs on at leastsome families. Finding no relationship between condition and burdensmay reflect our relatively small sample or a lack of precision in ourmeasures of conditions or costs. It is consistent, however, with otherstudies that have found more variation in costs within than across diseasecategories.
Our second conclusion is that childhood disabilities sometimesimpose very high costs on very poor families. This may force someparents to make tradeoffs between meeting the needs of their childrenand meeting the basic needs of their families. Material hardship was

72
common in this sample of welfare-reliant families, and we estimate thatthe probability that a family experiences some form of income relatedhardship is 22 percentage points higher when it cares for a severelydisabled child (without SSI). Our family profiles help us understandwhy this would be so. Consider the case of Matilda, the mother of threewho had separated from her husband and returned to welfare when wespoke to her. The care of her nine year old son, who has a heartcondition, imposed out-of-pocket expenses in the prior month foruncovered health care services. Given that her son’s condition causeshim to miss school frequently and sent him to the hospital three times inthe prior year, these costs may arise frequently. But given Matilda’swelfare income, they are likely to be unmanageable. On months such asthese, she is likely to face a choice between paying for the critical andemergency health care needs of her son and paying the rest of the familybills. Such a forced choice may help explain why she had utility shutoffs,lost telephone service, and fell behind in her rent several times over theyear.
Even families who manage to pull ahead by going to work may notmove far from these risks. In the case of Edith and Ben, the family wasoff welfare and both were working when we contacted them—Ben as abus driver and Edith doing odd jobs when she could. Even with theirearnings and with the SSI they received for their blind anddevelopmentally disabled five year old son, the couple had troublemaking ends meet. Their son’s chronic health problems, which sent himto the emergency room 15 times in about 18 months, undoubtedlyadded to the family’s economic and emotional stress. In the year beforeour interview, economic stress took the form of multiple residentialmoves, at least one eviction, and trips to the food pantry when there wasnot enough money for food.
One of the most worrisome forms of disadvantage reported by thesefamilies is the potential loss of health insurance. For many familieshovering around the poverty line, the loss of welfare or a few dollarsmore in earnings can lead to the loss of Medicaid. For parents withdevelopmentally or medically fragile children, this loss may be disastrous.Consider the case of Dorothy, the divorced mother of a 16 year old girlwith severe asthma. Dorothy was managing to work full-time when we
73
talked with her, despite the fact that her daughter often missed schoolbecause of her medical problems. Without welfare, however, Dorothyand her daughter had no source of health insurance. Her job as ananimal caretaker did not provide any coverage and Dorothy could notafford to purchase private insurance. In the month before our interview,she had to pay out-of-pocket medical expenses related to her daughter’sasthma. Without insurance, even such routine medical expenses areburdensome for a family as poor as this. If they are too great, the parentand child may forgo them entirely. Indeed, Dorothy reported to us thatthere were times the prior year when her daughter went without neededmedical or therapeutic care. If her daughter has a medical emergency, itis not clear where Dorothy will turn for help.
Our third conclusion is that parents with disabled children facetradeoffs not only in the purchase of basic good and services but in theirallocation of time. Mothers with atypical children may find it moredifficult than most to combine their caregiving work with employment.In our sample, mothers who had a severely disabled child were about halfas likely to be employed as those with only healthy children. Two-thirdsor more of mothers with severely disabled children also indicated thatcare for those children limited their ability to work. When we controlfor the other human capital and institutional factors that might explaintheir lack or reduction in employment, we estimate that these mothersforgo $80 in earnings every month.
The family situations profiled in Chapter 2 suggest something of thedilemmas that these families face. Some mothers have very greatcaregiving burdens. Beth, for example, had four children, including aseven year old son who was blind and developmentally delayed. Whenwe spoke with her, the family was getting by on her husband’s earnings.SSI offset some of the financial burden of caring for their special needschild. But it did nothing to offset the direct caregiving needs of a childwho could not do usual childhood activities and needed a lot more helpwith daily activities than other children. Beth still had a preschool childto care for as well. Even when all her children are school age, a timewhen many mothers return to work, caring for her disabled son andother children may be a full-time job.

74
The challenges of combining specialized caregiving work andemployment are even greater for single mothers. Phyllis worked in themonth prior to our interview and also cared for three children, one ofwhom has cerebral palsy. But her earnings were low and she still reliedon Medicaid for health insurance. Dorothy was managing to work full-time when we spoke, perhaps because, at 16, her severely asthmaticdaughter was old enough to care for herself most of the time. ButDorothy reported that her daughter was out of school a lot because of theasthma and that it interfered with her own ability to work. Even whenshe was able to work full time, both she and her daughter went withouthealth insurance.
Our fourth and related conclusion is that childhood disabilities andmeans-tested welfare use are closely intertwined. Families with seriouslydisabled children appear more likely to receive means-tested assistancethan are families with only healthy children, and, once on aid, they aremuch less likely to leave. In fact, having a disabled child reduced afamily’s chances of leaving welfare (other than for SSI) at about the samerate as losing a spouse or partner in the family. Some families withdisabled children fit the profile of long-term “welfare dependent” orreliant families. Gladys, a divorced mother of three, had her first child at15. All three of her children had learning and behavior problems; onewas mentally retarded and receives SSI. Despite the fact that all three ofher children were nearly grown, Gladys had not worked at all in the 19months before we talked with her. This may be due to her own physicaland health problems. It may also be a by-product of her limitededucation and the nine years she had spent on welfare. Gladys gets by onwelfare, her son’s SSI, and housing assistance. Her life is not easy—shehad trouble paying bills and feeding her family in the last year. And herprospects for a better, more independent life appear limited.
Although some families fit this stereotypical profile of the welfare-reliant, others use welfare as a way to balance the demands of caregivingand economic support. For these families, means-tested cash assistance isa critical part of an income package. Phyllis, who separated from herhusband 18 months before our interview, was supporting herself and herthree children by combining earnings from a part-time secretarial job,welfare, and SSI received for her seven year old daughter with severe

75
cerebral palsy. She incurred costs in the prior month for special clothing,transportation, and specialized child care for her daughter. She was alsopaying for 20 hours of day care per week for her four year old so that shecould go to her part-time job. Compared to other families in oursample, Phyllis was doing fairly well and SSI had a lot to do with it.Even with the extra help, however, caring for a severely disabled childmeant that Phyllis could not work enough hours to get completely offwelfare. For her, packaging earnings from a part-time job with welfareand SSI may be necessary to achieve reasonable economic security.
Consider another case, that of Mary and Robert and their fivechildren. Two of their children were disabled enough to receive SSI; onehad very disabling cerebral palsy. The family had received welfare formany years but Robert had also found work as a child care worker whenwe spoke with them. When they packaged the SSI with welfare andRobert’s earnings, they may have been doing fairly well. They may havebeen able to absorb the extra costs of caring for their disabled children,such as the special transportation to the hospital needed in the priormonth. Income packaging provides them a measure of security which,given their circumstances, they are likely to need for some time to come.Mary and Robert seem to be working hard to meet their responsibilities,including the care of two special needs children. Without the addedcushion of SSI and welfare, they might not be able to make it at all.
This leads to our fifth and final conclusion, which is that the SSI andMedicaid programs appeared to be working fairly well to help protecthighly vulnerable families from the risk of economic insecurity andmaterial hardship. Our ability to draw conclusions about thecontribution of Medicaid is quite limited because most of the families inthis low-income sample were still on Medicaid. But we do observe thatfamilies with Medicaid paid less out of their own pockets to meet themedical and other needs of their disabled children than did those witheither no health insurance or private insurance. This observationsuggests that, if they are providing their children with the same level ofspecialized goods and services, Medicaid-eligible families are able tomanage their children’s care with fewer economic compromises for thefamily.

76
Our conclusions about the role of SSI are less tentative. The factthat families with disabled children who received SSI were less incomepoor than those who did not comes as no surprise. The fact that familieswith SSI were also much less likely to have suffered material hardshipthan otherwise similar families is both notable and encouraging. Itsuggests that for many poor families, such as those profiled above, theextra income from SSI provides a cushion against the uncontrollable andsometimes high costs that arise with the care of children who havedisabling health, developmental, mental, and physical conditions.
Implications for PolicyPrograms affecting disabled children and their families have
generated a surprising amount of controversy in recent years. Debatesabout SSI eligibility, welfare work requirements for parents with disabledchildren, and the extension of Medicaid to these families have beenhighly charged. Policies have been changed repeatedly and, givenprevailing sentiments about welfare, they are likely to change again in thefuture.
Setting policy for programs such as these is difficult. Transferprograms must always balance the goals of providing optimal supportand assistance and minimizing public costs. When programs involveunearned income transfers, there are additional concerns about theduration of support and the possibility that the support itself discourageswork and encourages dependency. When the basis of eligibility and needfor this assistance is ambiguous or difficult to observe, as in the case ofcostly childhood disabilities, these conflicts become even more acute.
In the case of aid for families with disabled children, a lack of gooddata about the prevalence and financial consequences of childhooddisabilities has helped fan controversy. Observers have argued aboutwhether children on SSI are in fact disabled, and whether their familiesneed and use the extra SSI income for child-related expenses. The mostbenign criticisms suggest that because SSI payments are both higher forthe family and less expensive for state and local governments, theincentive to enroll children overinflated program rolls in the 1990s. Themost severe critics charge that parents are exaggerating their children’slimitations or even worsening their conditions to increase their welfare

77
income and avoid work requirements. Without family-level data on thetypes and magnitude of costs absorbed by parents with disabled children,these policy-related arguments have been very difficult to resolve.
This study does not provide all the data we would need tounderstand the financial and psychosocial circumstances of poor familieswho care for expensive children. We cannot draw final conclusions ormake detailed recommendations about the direction of public policy.However, these data do provide important new estimates of the privatefinancial burdens that these families bear.
These data strongly suggest that families with disabled children, butwithout SSI income, are much worse off than otherwise similar families.Our cross-sectional observation of child disabilities and economic well-being cannot establish the reasons for economic hardship with certainty.It seems likely that the higher direct and indirect costs associated with thecare of special needs children contribute to families’ poverty and materialhardship, but we cannot rule out the possibility that lower workparticipation, higher poverty, and greater material hardship amongfamilies with disabled children are caused by other factors. Thesefamilies may differ from other poor families in other, unobserved waysthat cause them to be less able to achieve economic security.
Although we cannot rule out other explanations for the heightenedeconomic disadvantage of families with disabled children, these analysesindicate that the high cost of caring for these children is a major factor.Families report substantial direct and indirect costs associated with theirchildren’s disabilities, and their heightened risk for hardship persists evenafter we control for other adult and family characteristics. Mothers withdisabled children report that they have difficulty working, and this effectalso persists even after controlling for family, human capital, and labormarket conditions. To the extent that these employment withdrawalsreduce mothers’ accumulation of work experience and reduce theirearning power, care for expensive children may exact costs far into thefuture.
Given these findings, along with those about the positive role of SSIand even welfare as a part of an income package, we offer the followingrecommendations for the inevitable next rounds of reform in the welfare,SSI, and Medicaid programs.

78
First, the provision of unrestricted cash assistance (SSI) for familieswith severely disabled children appears to be well justified by the coststhat poor families assume. Costs are highly variable, even across familieswhose children have the same conditions. In our one-month snapshot,many families reported no costs but a minority reported very high costs.On the one hand, this variability might justify more and more precisetargeting of benefits, to be sure that they go only to families who actuallyincur costs. Some analysts have proposed replacing cash assistanceentirely with in-kind benefits. On the other hand, given the variable andintermittent nature of these costs, greater targeting is likely to be bothexpensive and intrusive. We could identify no category or set ofconditions that did not impose costs on some families. These costs wereas varied as medical devices (for example, asthma inhalers),nonprescription medications, transportation (for example, van service totake physically challenged children to the doctor), treatments (forexample, speech and mental health therapies), clothing (for example,diapers for incontinent children), and specialized child care for childrenwho could not easily go to regular child care settings. Dispensingrestricted cash assistance, vouchers, or in-kind benefits as needed wouldgreatly increase the administrative costs for government and theapplication burden for families.
Proposals to limit SSI to certain categories of children, or certaintypes of costs, or to replace unrestricted cash benefits with in-kind goodsand services could also increase the burden and financial insecurity ofalready very burdened parents. Rather than restricting SSI, we believethat the program should be expanded in several ways. Vigorous outreachefforts should be continued to make sure that those families potentiallyeligible for the program are made aware and encouraged to apply.Families should continue to receive help in working their way throughthe often complicated application process that may deter some deservingfamilies. Finally, our data suggest that recent efforts to narrow theeligibility criteria for children’s SSI may be misplaced. Parents ofchildren who have the so-called “soft” disabilities such as learning andattention deficit disorders may face direct and indirect caregiving coststhat are similar to those of parents with children who have otherconditions.

79
Second, protecting Medicaid coverage for families with disabledchildren is crucial. Disabled and chronically ill children are among thosemost medically at risk if they do not get appropriate preventive andongoing health care. Their parents are among those who face the gravestfinancial risks if they lose health insurance for their children. Bothanecdotal reports and empirical studies suggest that the fear of losingMedicaid deters employment and welfare exits (Yelowitz, 1995), with thestrongest effects observed among those likely to incur high medical costs(Moffitt and Wolfe, 1992). Recent changes in Medicaid policy,including the expansion of the Child Health Insurance Program and thedecoupling of Medicaid eligibility from welfare eligibility under the 1996Personal Responsibility and Work Opportunity Act (PRWORA), havebeen designed to increase access to coverage for children in low-income,working families. However, declining Medicaid caseloads suggest thatmany families are not able to access these benefits (Ku and Bruen, 1999).For low-income families with disabled and chronically ill children,policies that guarantee continuous coverage and access are particularlycrucial, both to increase medical security for these children and toprovide an employment incentive for their parents.
Third, welfare eligibility rules should be adjusted to reflect the extrafinancial and caregiving demands on parents with disabled andchronically ill children. For many of these families, welfare is animportant component of an income package and should be madeavailable for as long as the family needs it. Even with full- or part-timework, these families may not be able to achieve full independence fromthe welfare system. The 1996 PRWORA decisively changed welfarefrom an entitlement, under AFDC, to time-limited assistance underTANF. Caseloads have declined by about 50 percent nationwide and by80 percent or more in some states. These caseload reductions have beeninterpreted as evidence of successful reform by many observers. Theyhave also increased the proportion of families in the welfare system whoare very disadvantaged, as those most able to survive outside the welfaresystem exit or are denied entry. Although the effects of these changes forrelatively healthy families are still debated, there is reason for concernabout their implications for families with heavy caregiving burdens.Subjecting families with special needs children to benefit restrictions,

80
aggressive deterrence policies, time limits, and sanctions risks increasinghardship for already very disadvantaged families.
Fourth, TANF and Food Stamp work rules and employmentsupports should be modified to support families’ movement to self-sufficiency while recognizing their special needs. For parents withdisabled and ill children, child caregiving may consume greater thanaverage time, energy, and other resources. These parents also face specialchallenges and extra expenses when they go to work outside the home.This suggests that states will need to modify welfare-related workrequirements for these families. For a small number of parents with verydisabled or ill children, caring for these children may be the mostimportant and perhaps only work that they can do. Many parents docombine their caregiving with employment, however, and even thosewho care for very severely impaired children could benefit in the longrun by spending some time in the work force and accumulating humancapital. Work outside the home also provides important respite. Butgoing to work may be both difficult and expensive for such parents,particularly if their children need specialized child care. In part to avoidthese costs, many states are now completely exempting families with SSI-recipient children from work requirements and, consequently, from thereceipt of work-support services. A better policy approach might be toprovide extra employment services (such as enhanced child care benefits)to help parents manage.
In short, we recommend that poor families with expensive childrenare among those for whom policies that support “partial independence”on public assistance make sense. Because they need to spend more andcan work fewer hours outside the home, many of these families will notbe able to achieve full independence from means-tested programs. Toforce them to do so prematurely would risk imposing additional medicaland other forms of hardship on their oftentimes very vulnerable children.But neither should they be left to languish on the welfare rolls when andif they can achieve partial independence through employment.Government can support this independence both by providing extraemployment-related support services, when needed, and by adoptingwelfare eligibility rules that permit families to package earnings withcontinued SSI, welfare, Food Stamp, and health insurance assistance.

81
These recommendations do not address the very real concern that,for some percentage of the caseload, SSI functions like other welfareprograms to support and encourage long-term dependence ongovernment programs. Our data do not shed much light on whethermalingering, misrepresentation, or dependence are more prevalentamong families who receive SSI than among those who do not. They doconfirm the expectation that some of these families are very troubled andheavily reliant on welfare programs. We find that families with morethan one disabled child, in particular, and those in which both the childand the mother have limiting conditions, are exceptionally disadvantagedand almost exclusively reliant on welfare. For these families, disabilitiesmay be better understood not as an “exogenous shock” to the families’economic well-being but as one of several indicators of serious functionaldifficulties. They are likely to be among the families characterized as“multiproblem” or “hard to serve” who are coming to dominate welfarerolls as those more able to leave do so. For these families, enhancedemployment supports and opportunities for income packaging areunlikely to either increase self-sufficiency or reduce economic hardship.There is little reason to believe, on the other hand, that simplyterminating welfare and SSI or imposing more stringent workrequirements will bring about enduring changes for multiproblemfamilies. These families and their disabled and ill children are likely to bethose most in need of intensive, long-term rehabilitative services.
Finally, as welfare rolls decline, we can expect that families withdisabled children will become an increasing fraction of the remainingcaseload. Very little is currently known about these families, and we havetaken only some first steps toward characterizing and understanding theircircumstances, resources, and needs. Ongoing studies are necessary tosee how they are faring in the new world of welfare. We stronglyrecommend that updated surveys be conducted on a regular basis todetermine how well these families are coping. Regular studies canprovide the knowledge needed to design the innovative public policiesthat will be needed to avoid the human tragedies that will occur if thesefamilies are allowed to fall between the cracks of the overlappingprograms and eligibility restrictions that only imperfectly fit their needs.

83
Appendix A
Maternal Employment Estimation
Our estimate of mothers’ employment is based on a standard staticlabor supply model. In this model, individuals choose the combinationof market and nonmarket activities that allows them maximum utilitywith respect to consumption of goods and leisure (Killingsworth, 1983).Mothers’ decisions about whether and how much to work outside thehome are a function of factors such as available work and wages,availability of income from other sources (husband’s earnings, property,or other unearned income), productivity of time spent in other work,and household tastes. Because women assume the primary caregivingburden for children, we expect their employment decisions to beparticularly sensitive to the level of caregiving responsibilities, includingthe ages and number of their children and the availability of alternativecare arrangements (Berndt, 1991; Heckman, 1993; Killingsworth, 1983;Killingsworth and Heckman, 1986; Blau and Ferber, 1992).
We estimate a reduced form specification of this model in which amother’s employment is a function of structural, demographic, andhuman capital variables. The model presented here adds variablesdesigned to capture the extra demands of caring for disabled children.Employment is hypothesized to decrease with the presence of a disabledor ill child and as the severity of children’s functional impairmentsincreases from moderate to severe.
We control for demographic and human capital factors using measuresthat follow from the standard labor supply model and prior empiricalresearch. As a proxy for expected wage, we include variables for arespondent’s human capital (race, education, health, age, and agesquared). Because women’s labor supply choices are sensitive to thepresence and earnings of partners/spouses, we include a variable forcurrent cohabitation status. Because empirical research suggests thatwork and welfare behaviors differ for women who were ever married, wealso control for respondents’ marital status (as ever or never married).
84
We include other variables measuring characteristics that facilitate orinhibit women’s employment: the presence of any children under age six(assumed to reduce employment) and the presence of adults in thehousehold other than respondent and her spouse or partner(hypothesized to increase labor supply by increasing the number of adultsavailable for child care).
Our model also includes measures of income and structural factorsthat are hypothesized to affect a woman’s employment choices. Weinclude variables for the level of AFDC and SSI benefits available to thewoman and other non-means-tested family income (spouse’s earnings,child support, and income from family and friends). All are expected tohave an income effect that depresses a mother’s labor supply. Becauseboth AFDC and SSI are means-tested programs in which benefits arelikely to be reduced as earnings rise, we measure them with proxies (i.e.,the number of AFDC-eligible children and whether any family memberother than the respondent receives SSI) to reduce endogeneity problems.1
As a measure of local employment opportunities, we include countyunemployment rates for the month before the interview.
The limited observation period (employment in prior month) createsdifficulties when estimating the effects of family and individual factors onemployment. We use a censored regression or Tobit model for thisestimation (Greene, 1997). This estimation method adjusts linearestimates when a portion of the observations are censored at zero (i.e., noemployment is observed in the month before the interview). Becausethey reflect the effect of the independent variables on both (1) theprobability of working, and (2) the change in hours of work among thoseemployed, Tobit regression coefficients can be difficult to interpret.Therefore, following McDonald and Moffitt (1980), we also calculatedthe proportion of the mean total response to a change in an independentvariable that is due to the response of those with a nonzero probability____________
1We tested the employment model both with and without the SSI variable and theresults were approximately the same. The inclusion of the SSI indicator reduces the sizebut not the statistical significance of the indicator for a severely disabled child in thefamily. This suggests that the income effect of SSI may explain part of the reduction inmaternal labor supply in these families and the inclusion of the SSI indicator improvesthe precision of the estimate of the “caregiving” effect.

85
(i.e., any employment) and decomposed the coefficients into twoseparately reported measures: (1) the marginal effect of the independentvariables on the hours of work and (2) the effect of the independentvariables on the probability of having any employment.
Variable means and standard deviations are provided in Table A.1.Full regression results are reported in Table A.2.
Table A.1
Independent Variables in Employment Estimation: Means and StandardDeviations
Variable Description Mean (SD)Child disabilitySeverity of impairment Moderate functional impairment
Severe functional impairment.10 (.30).09 (.28)
Control variablesRespondent’s education Years of education 10.84 (2.94)Respondent’s race African American
LatinoOther, nonwhite
.26 (.44)
.40 (.49)
.05 (.23)Partner status Respondent is married or cohabiting .41 (.49)Number of children Biological, adopted, or step-children 2.31 (1.33)Respondent health Respondent is in poor health .11 (.31)Respondent age Age in years 34.36 (9.19)Age squared Age in years squared 1265 (730)Marital status Respondent never married .34 (.47)Any child < 6 At least one child younger than six .53 (.50)Other adults No. of adults other than spouse or partner .43 (.86)Non-means-tested income Prior-month income ($100s) divided by the
square root of family size3.60 (7.48)
Any SSI recipient Spouse, partner, or child receives SSI income .08 (.27)Design controlsCounty Alameda County
San Bernardino CountySan Joaquin
.22 (.41)
.18 (.39)
.24 (.43)Experimental status AFDC case in the experimental group .63 (.48)Aid group AFDC-UP (unemployed parent) .32 (.46)
SOURCES: Authors’ calculations from the California Work Pays DemonstrationProject Survey: English/Spanish Interviews Wave II and surveys of Alameda, LosAngeles, San Joaquin, and San Bernardino Counties.

86
Table A.2
Effect of Childhood Disabilities on Mothers’ Employment in the Prior Month(Tobit estimates)
CoefficientStandard
Error
ConditionalResponsea
(given Y > 0)
Change inProbabilityb
(Y > 0)Adult characteristics(“expected wage”)Respondent’s education (years)Respondent is African AmericanRespondent is LatinoRespondent is other non-whiteRespondent reports poor healthRespondent’s age (years)Respondent’s age squaredRespondent has never married
8.66***–9.713.82
10.26–51.37***
9.12***–0.14***
–16.85*
1.4910.429.68
15.7812.592.75
.048.84
2.57–2.881.133.04
–15.242.71–.04
–5.00
0.02–0.030.010.03
–0.150.03
–0.00–0.05
Family characteristicsAny child < 6Respondent has partner/spouseNo. other adults
–35.98***15.77
.12
8.809.874.16
–10.684.680.04
–0.110.050.00
Income variablesOther non-means-tested income
($100s)No. of AFDC childrenSSI recipient (not respondent)
1.76***
–11.64***–22.09
.51
3.3118.64
0.52
–3.46–6.56
0.01
–0.04–0.07
County unemployment rate(previous month) –7.67*** 2.94 –2.28 –0.02Child disability variablesModerate disabilitySevere disability
–10.70–51.63***
11.7717.28
–3.18–15.32
–0.03–0.15
Design controlsAlameda CountySan Bernardino CountySan Joaquin CountyExperimental groupAid group
–27.52**–18.77*
12.577.32
–12.62
11.6310.5913.587.249.51
–8.17–5.573.732.17
–3.74
–0.08–0.060.040.02
–0.04S.E. 120.218Log likelihood –4606.75Fraction working .38Fraction of mean total response due to response of those working .30
SOURCES: Authors’ calculations from the California Work Pays DemonstrationProject Survey: English/Spanish Interviews Wave II and surveys of Alameda, Los Angeles,San Joaquin, and San Bernardino Counties.
NOTE: Unweighted n = 1,732. Statistical significance levels indicated as * p<.10;**p<.05; ***p<.01.
aMarginal response measured at the mean for all variablesbMarginal change for continuous variables. Discrete change for dummy variables.

87
Appendix B
Event History Analysis of WelfareTransitions
Technical IssuesOur concern with transitions from AFDC is best approached
through event history modeling (Tuma and Hannan, 1984; Heckmanand Singer, 1985; Blossfeld and Rohwer, 1995) in which the duration ofspells on welfare is explicitly modeled. To estimate an event historymodel for our data, we must deal with three technical problems.
Sampling the Flow Versus Sampling the StockThe survey data we use is a sample of the “stock” of welfare
recipients and not the “flow” of welfare recipients into welfare. It is wellknown that a cross-sectional sample of welfare recipients includes a muchlarger number of those with long spells than those who are new towelfare. The intuition for this is simple. A cohort of those who are newto welfare includes people with both short and long spells. Those withshort spells will come and go whereas those with longer spells will remainon welfare. Therefore, a cross-sectional survey has a much higher chanceof sampling a person with a long spell than a person with a short spell.Consequently, a cross-sectional survey does not provide a random sampleof spells. This means that standard event history methods, which aredesigned to analyze a random sample of spells, will produce biasedresults.
A number of authors (Hamerle, 1991; Guo, 1993) have discussedthe ways that using cross-sectional samples produces biased results.Consider, for example, the construction of a hazard function from across-sectional sample of welfare durations. A hazard rate is calculated asthe ratio of those leaving welfare in a given period of time divided bythose at risk for leaving because they were still on welfare at the

88
beginning of the period. In a cross-sectional sample of cases, there willbe very few who leave welfare in a short period of time (because shortspells are undersampled) and many who are at risk (most of whom havelong spells). Hence the hazard rate for short durations will be very low.But as time goes on, the hazard rate will appear to increase. Thisincreasing hazard contradicts all of the research on welfare of which weare aware. Every other study has found that the rate of leaving welfaredeclines over time.
Lancaster (1979) showed that consistent estimates of the hazardfunction can be obtained by using a conditional maximum likelihoodprocedure that is described in greater detail in Hamerle (1991) and Guo(1993). This procedure requires knowing the starting times for eachspell and the duration of the spell as of the time of sampling. We havethis information for our sample, and we can implement this method inany program allowing for time-varying covariates.
Functional FormWith the relatively small amount of data available to us, it seems
sensible to simplify the estimation problem by assuming some parametricform for the hazard function. There are many possible choices, but wehave chosen the Weibull because it allows for both monotonic increasingand monotonic decreasing hazards, because it includes the exponential orconstant hazard rate model as a special case, and because several piece-wise exponential models provided no better fit than the Weibull. TheWeibull hazard h(t) is the following function of time (t) on aid:
h t ba tb b( ) = −1(1)
where a and b are unknown parameters that must be greater than 0. Ifb = 1, then this reduces to the exponential model with a constant hazardrate, h(t) = a. The parameter a can be interpreted as the baseline level ofthe hazard function and the parameter b indicates how much it increaseswith time (for b > 1) or decreases with time (for b < 1).
The parameters a and b can be expressed in terms of covariates. Theusual practice is to express only a, the baseline level of the hazardfunction, in terms of covariates, and we have followed this approach. For

89
a vector of covariates X (which include a column of 1s for a constantterm), we use a standard exponential linkage function so that:
a XA= exp( *), (2)
where A* is a vector of parameters including a constant A. With thislinkage function, the values of A* can be positive or negative and a willstill be greater than 0, as it must be. Although we do not use covariatesfor the b parameter, we express it in the same way:
b B= exp( ). (3)
This reparameterization means that a value of 0 for B indicates that aconstant hazard rate is appropriate for the data. A negative valueindicates a decreasing hazard, and a positive value indicates an increasinghazard. It also means that a positive coefficient for a covariate impliesthat an increase in the covariate will increase the hazard rate, that is, therate of leaving welfare.
Most research on AFDC exits has used models of this type with asingle outcome or a single transition. When this kind of model isestimated for the cross-sectional sample, the disability effects are almostall statistically insignificant; they are substantively small compared to theeffect of education or even having a partner in the household; andsomewhat perversely, cases with a severely disabled mother are morelikely to exit AFDC than cases with a moderately disabled mother. Ifdisabilities matter, then this model does not seem to capture theireffects—perhaps because the model conflates competing effects.
Multiple Transitions and Competing RisksThe possibility of competing effects leads to competing risks models.
In these models, it is assumed that people can end their current status,such as being on AFDC, in more than one way and that these wayscompete with one another. In our present situation, a competing riskmodel assumes that each individual can be characterized by twodurations on AFDC (or on AFDC plus SSI). One duration, let usdenote its length by T1, ends with a transition off aid entirely (i.e., notreceiving AFDC or SSI). The other duration, let us denote its length byT2, ends with a transition off AFDC to SSI alone. Only one of these
90
transitions is observed, and it is the one for which the duration T1 or T2
is smallest because it occurs first. If T1 and T2 are correlated, then thereare severe limitations on what can be estimated (Lawless, 1982, Chapter10), but if they are assumed independent, then it is straightforward togeneralize standard models to estimate competing risks models. Weassume that T1 and T2 are independent to make progress inunderstanding the effect of disabilities.
A competing risks formulation assumes that there are two hazardrates, h1(t) for the transition from AFDC to being off aid entirely andh2(t) for the transition from AFDC to being on SSI alone. Each hazardrate is assumed to have separate parameters: a1 and b1 for h1(t) and a2
and b2 for h2(t). As we did above, we allow a1 and a2 to vary only withthe covariates and we use a standard exponential linkage function:
a1 = exp(XA1*) and a2 = exp(XA2*). (4)
Although we do not use covariates for the b parameter, we express it inthe same way:
b1 = exp(B1) and b2 = exp(B2). (5)
Thus, with two competing risks we will obtain two columns of estimatesof coefficients for each model instead of just one as in a typicalregression.
ResultsTable B.1 presents estimates of three versions of the competing risks
models. The first set of columns, “Transitions off Aid,” are for thetransition from AFDC to being completely off aid. The second set ofcolumns is for “Transitions to SSI.” Each model yields one set ofestimates for transitions off aid and another for transitions to SSI. Thethree models are estimated with different sets of covariates—“Demographics and County Dummies Only,” “Disability Only,” and a“Full Model” including everything in the other two models.

91
Table B.1
Competing Risks Weibull Model of Transitions off AFDC
Transitions off Aid Transitions to AidDemographic &
County Dum-mies Only
Dis-abilityOnly
FullModel
Demographic &County Dum-
mies Only
Dis-abilityOnly
FullModel
Demographic characteristicsEducation 0.38***
(0.07)0.36***
(0.07)0.02
(0.18)0.07
(0.22)Age (25–40) –0.19
(0.17)–0.11(0.17)
0.43(0.67)
0.04(0.73)
Age (> 40) –0.62*(0.24)
–0.42(0.24)
1.29(0.82)
0.92(0.87)
Black –0.81***(0.19)
–0.78***(0.19)
0.18(0.41)
0.07(0.42)
Latino –0.06(0.15)
–0.09(0.14)
–2.33*(0.36)
–2.30*(1.06)
Partner in household 0.78***(0.13)
0.72***(0.13)
0.23(0.36)
0.49(0.40)
No. of children < 6 –0.29***(0.08)
–0.27***(0.08)
0.06(0.22)
0.06(0.24)
No. of children ≥ 6 –0.04(0.06)
–0.03(0.06)
0.13(0.18)
0.08(0.20)
County effectsAlameda County 0.18
(0.17)0.21
(0.16)–0.31(0.56)
–0.49(0.61)
San BernardinoCounty
–0.05(0.18)
–0.03(0.17)
0.65(0.52)
0.56(0.56)
San Joaquin County –0.05(0.18)
–0.02(0.16)
0.51(0.49)
0.42(0.52)
DisabilitiesModerately disabled
children–0.23(0.19)
–0.08(0.17)
1.63**(0.59)
1.65*(0.64)
Severely disabledchildren
–1.64***(0.49)
–1.39***(0.44)
2.15**(0.76)
2.26**(0.83)
Moderately disabledmother
–0.40*(0.18)
–0.34*(0.16)
–0.23(0.52)
–0.41(0.55)
Severely disabledmother
–0.68*(0.30)
–0.59*(0.28)
1.32*(0.57)
0.94(0.52)
Weibull hazard parametersA coefficient –4.87
(0.26)–4.31(0.09)
–4.78(0.25)
–7.88(1.19)
–8.20(0.91)
–8.66(1.46)
B coefficient –0.21(0.09)
–0.28(0.09)
–0.17(0.08)
0.04(0.25)
–0.01(0.24)
–0.04(0.28)
Log likelihood –2644.41 –2683.88 –2614.32
SOURCES: Authors’ calculations from the California Work Pays Demonstration ProjectSurvey: English/Spanish Interviews Wave II and surveys of Alameda, Los Angeles, San Joaquin, andSan Bernardino Counties.
NOTE: Weighted n = 1,605. Statistical significance levels indicated as * p < .05, ** p < .01,and *** p < .001. Cell entries are exponential of Weibull coefficients, standard errors in parentheses.

93
Appendix C
Hardship Estimation
To describe the consequences of direct and indirect caregiving costsfor families’ economic well-being, we use regression techniques toestimate the effect of these costs on the probability that familiesexperienced direct, material hardship in the prior year. Our modelassumes that the probability of experiencing hardship is a function offamilies’ income relative to needs (see, for example, Federman et al.,1996; Mayer and Jencks, 1988). We hypothesize that families who carefor disabled children will have a higher probability of hardship becausethey have both less income (because of reductions in maternalemployment) and greater needs (because of direct expenditures fordisability-related medical, child care, and other goods and services).
Hardship was measured using responses to six survey questions.Respondents were asked whether they had every experienced each of fourforms of hardship in the prior year: (1) adults or children had gonehungry, (2) the family had experienced an eviction or period ofhomelessness, (3) they had been late paying their rent or mortgage, or (4)they had experienced utility or phone shutoffs. A single indicator of “anyhardship” was created by coding “yes” if any of these forms of hardshipwere reported.
Independent variables controlled for family characteristics assumedto affect the likelihood of hardship through either income or needs: therespondent’s education, marital (cohabitation) status, number of childrenunder age 18, current work status, and race or ethnicity. Because publichousing assistance significantly affects income available for other needs,we also controlled for whether the respondent was in public housing orreceiving Section 8 housing vouchers. Additional control variables wereincluded to adjust for the sample design (county, program type, andexperimental status in the state welfare reform waiver project).
The contribution of child disabilities to economic well-being wasmeasured by adding a dummy variable for whether any child in the

94
family had a severe disability and a second indicator variable for whetherthere was more than one child in the family with a disability or chronicillness. Because the extra income received through the SSI program mayreduce tradeoffs in meeting basic needs, we included an indicator forwhether any child received SSI.
We use a logistic regression to estimate the dichotomous outcome(any or no hardship) (Maddala, 1983). The logistic regressioncoefficients represent the increase or decrease in the log of the odds of theoutcome given a change in the predictor variable. It is difficult totransform logistic regression coefficients into more readily understoodmarginal probabilities because the model is nonlinear; independentvariables would be expected to make a different marginal contribution atdifferent points in the distribution. To improve the precision and clarityof the findings, we interpret the coefficients by constructing a simulation.
The probability of any hardship was first calculated for an “average”family in the sample by setting independent variable values at theirmeans: the “base case” was a family headed by a white, Anglo, singlefemale respondent with the average level of education for the sample(10.43 years), who was caring for the average number of children (2.2),and who was not currently employed. (The values for the sample controlvariables were set to Los Angeles County, “family group” or single parentAFDC case, and experimental group.) The probability of experiencinghardship in the prior year was calculated for this “base case” or averagefamily. A severely disabled child was then “added” to the family and theprobability of hardship was reestimated; the family was then “given” SSIand the probability of hardships estimated once again. A similar processwas used to determine hardship probabilities for families with more thanone disabled child and for families with more than one disabled child, atleast one of whom was severely impaired.
Means and standard deviations for all variables in the model areprovided in Table C.1. Full regression results are provided in Tables C.2and C.3.

95
Table C.1
Independent Variables in Poverty and Hardship Estimations(Means; Standard Deviations in Parentheses)
Variable Description
Mean (SD)n = 1,732
UnweightedChild disabilitySeverity of
impairmentAt least one child has severe functionalimpairment
.04 (.21)
Control variablesRespondent’s
educationYears of education 10.43 (3.04)
Respondent’s race African AmericanLatino
.28 (.45)
.48 (.49)Partner status Respondent is married or cohabiting .27 (.44)Number of children Biological, adopted, or step-children 2.22 (1.30)Employment Respondent had any paid work in prior
month.37 (.48)
Policy VariablesAny SSI recipient Disabled child receives SSI income .05 (.21)Design controlsCounty Alameda County
San Bernardino CountySan Joaquin County
.22 (.41)
.18 (.39)
.24 (.43)Experimental status AFDC case in the experimental group 1.37 (.48)Aid group AFDC-UP (unemployed parent) 1.09 (.29)
SOURCES: Authors’ calculations from the California Work Pays DemonstrationProject Survey: English/Spanish Interviews Wave II and surveys of Alameda, LosAngeles, San Joaquin, and San Bernardino Counties.

96
Table C.2
Logistic Regression Results of Probability the Family Experienced Povertyin the Prior Month
Poor (100% PovertyLine)
Extremely Poor (75%Poverty Line)
Coef. S.E. Coef. S.E.Adult and family characteristicsRespondent’s education (years) –.1283*** .0293 –.0867*** .0247Respondent has partner/spouse –1.5378*** .1621 –1.6721*** .1606No. of children in household .3214*** .0598 .2160*** .0529Respondent is employed –1.7306*** .1324 –1.9515*** .1249Respondent is African American .4614*** .1757 .0006 .1693Respondent is Latino .4222** .1665 .2070 .1597Policy variablesChild receives SSI –2.4140*** .2963 –3.6511*** .3820Child disability variablesAny severely disabled children .0590 .2866 .1587 .2932More than one child disabled .2464 .3063 .3317 .3079Design controlsAlameda County .0381 .1958 .4141* .1874Los Angeles County .0105 .1765 .0853 .1664San Bernardino County –.1698 .1931 –.1317 .1867Program type = AFDC-FG (single
parent).7097*** .1729 .7482*** .1661
Experimental status = yes –.0249 .1326 –.0369 .1243Constant 2.0846 .4846 1.2848 .4329
SOURCES: Authors’ calculations from the California Work Pays DemonstrationProject Survey: English/Spanish Interviews Wave II and surveys of Alameda, LosAngeles, San Joaquin, and San Bernardino Counties.
NOTE: Unweighted n = 1,682 households. Statistical significance levels indicatedas * p < .10, ** p < .05, and *** p < .01.

97
Table C.3
Logistic Regression Results of Probability the Family ExperiencedHardship in the Prior Year
Coef. S.E.Adult and family characteristicsRespondent’s education (years) –.002 .019Respondent has partner/spouse –.476 *** .126No. of children in household .115 *** .043Respondent is employed .031 .105Respondent is African American .416 *** .145Respondent is Latino .176 .135Policy variablesAny housing subsidy –.230 * .128Child receives SSI –.860 *** .259Child disability variablesAny severely disabled children .930 *** .248More than one child disabled .410 * .247Design controlsAlameda County .032 .157Los Angeles County –.014 .138San Bernardino County –.005 .155Program type = AFDC-FG (single parent) .208 .133Experimental status = yes –.038 .103Constant –.417 .352
SOURCES: Authors’ calculations from the California Work PaysDemonstration Project Survey: English/Spanish Interviews Wave IIand surveys of Alameda, Los Angeles, San Joaquin, and San BernardinoCounties.
NOTE: Unweighted n = 1,682 households. Statisticalsignificance levels indicated as * p < .10 and *** p < .01.

99
Appendix D
Disability Measures
Mothers’ Disability and Health StatusOur measures of the disability status of survey respondents (mothers)
rely on two standard questions used in a variety of surveys (including theCPS, Panel Survey on Income Dynamics (PSID), Retirement HistorySurvey, and Health Interview Survey (HIS)): whether the respondent hada “physical, mental or emotional condition that limited the amount ortype of work she could do” and whether she rated her health incomparison to other people her own age as “excellent, good, fair orpoor.” (Questions are provided in Table D.1.)
A large literature on adult disabilities has grappled with the questionof the accuracy of self-reported disability and health status. These issuesraise particular concerns when adults are asked to report about work-limiting disabilities. Estimates of adult disabilities based on the standardquestion used in this and many other surveys tend to produce populationestimates that are higher than administrative data on participation indisability-related cash assistance programs (Social Security DisabilityInsurance (SSDI) and Supplemental Security Income). Among adults,administrative records indicate that in the early 1990s, over 4 percent ofthe working-age population were receiving disability insurance.Estimates for approximately this same time period from the self-reporteddata in the CPS are that over 6 percent of working-age adults wereunable to work because of health reasons (Haveman et al., 1995).
Differences between self-reported disability and participation indisability programs are usually understood to reflect the fact that adultsmay be disabled without meeting the eligibility requirements for cashassistance programs through SSDI (substantial work history) or SSI(limited income). Adults who self-report disabilities may also haveconditions that are not severe enough to qualify them for these programs.

100
Table D.1
Survey Questions
For determining respondent disability and health status (asked of ALL respondents):
Do you have a health condition—physical, emotional, or mental—that limits the amount or kind ofwork at a job you can do?
If yes: Does this condition prevent you from working at a job at all or does it only limit thekind or amount of work you could do at a job?
Now for a few questions about your health. In general, how would you rate your health thesedays—Excellent, Good, Fair or Poor?
For determining children’s disability status: (asked for ALL resident child under age 19):
Do any of your children had a health condition—physical, emotional, or mental—that limits theamount or kind of activities he or she can do?
Do any of your children have a disability or handicapping condition?
Do any of your children receive Supplemental Security Income (SSI) due to a disability orhandicapping condition?
(asked for EACH child identified as meeting any one of the three conditions above):
What is the health condition or disability? (Up to three verbatim answers recorded)
Because of his/her (physical/health/emotional/mental) (problem/condition), does (NAME OFDISABLED CHILD) need more help than other children his/her age doing things like eating,bathing, dressing, or getting around the house?
If yes: Does he/she need . . .only a little more help, ora lot more help than other children his/her age?
Does any (problem/condition) NOW keep (NAME OF DISABLED CHILD) from going toschool?
[If school age] How much impact does (NAME OF DISABLED CHILD)’s (problem/condition)have on his/her school attendance?
Is he/she able to attend school regularly,does he/she miss a lot of days because of his/her (problem/condition),or does he/she miss only some days because of his/her (problem/condition)?
[If school age] Does (NAME OF DISABLED CHILD) attend special school or special classes orreceive special education services because of his/her (problem/condition)?
Is (NAME OF DISABLED CHILD) able to take part in the usual kinds of activities done by mostchildren his/her age?
[If older than 1 year] Does (NAME OF DISABLED CHILD)’s condition limit his/her ability towalk, run, or use stairs?
[If younger than 1 year] Does (NAME OF DISABLED CHILD)’s condition limit his/her ability tocrawl, walk, run, or use stairs?

101
Self-reports of disability and health problems may be biased upwardsbecause of factors such as respondents’ misunderstanding of questions,their consideration of transitory illnesses, or the social desirability ofinvoking a health problem to explain nonwork, receipt of disabilitybenefits, or other contingent behaviors (see Burkhauser et al., 1993;Stern, 1989). An employment-related definition of disability may also beendogenous with the individual’s expectations regarding employment(for example, because women are less likely to be employed than menoverall they are also likely to describe themselves as having employment-limiting disabilities) and with the type of work that the individualexpects to perform (Loprest, Rupp, and Sandell, 1995).
The possible endogeneity of self-reported disabilities based on worklimitations is of particular concern when measures of disability based onwork limitations are used to model employment and other economicoutcomes. Although the problem of bias cannot be ruled out, there issubstantial evidence that self-reported measures of disability are bothrobust and minimally biased predictors. Self-reported measures arewidely used in employment models and have proven themselves to berobust predictors of, among other outcomes, labor force participationand welfare use (see Haveman et al., 1995; Wolfe and Hill, 1995).
With regard to whether these estimates are biased by the use of apotentially endogenous measure, the crucial issue is whether individualswho have misreported disability status are, in fact, healthy enough towork. The literature suggests that although self-reports of disability mayproduce estimates that are higher than other sources of information (forexample, clinical assessments), individuals who report themselves to bedisabled or in poor health are generally not in good health but, rather,have problems that may not be severe enough to meet an alternativestandard such as eligibility standards for disability insurance.
In their study of the increase over time in both self-reporteddisabilities and participation in disability programs, for example, Boundand Waidmann (1992) decompose the increase in self-reporteddisabilities, the decline in labor force participation, and the increase inparticipation in disability insurance programs among men in the 1970s.They conclude that liberalization of disability benefits during the 1970sappears to have led to an “earlier accommodation” of health limitations

102
by providing alternatives to employment for individuals with less severehealth and disability problems. Their analysis suggests that individualswith “relatively poor health” may have been particularly sensitive to thecombination of declining demand for low-skilled workers andincreasingly liberal disability benefits during this period. They do notconclude that healthy but unemployed adults became more likely toreport themselves as disabled during this period, but, rather, that as thethreshold for receipt of disability insurance was lowered, individuals withless severe conditions were both more likely to self-report and more likelyto obtain disability benefits. As they conclude, the data provide littleevidence that the increase in labor force withdrawals associated with self-reported disabilities represents malingering on the part of theseindividuals. Rather, that “the evidence suggests that most of those did so[left the labor force] and began receiving disability transfers did sufferfrom potentially disabling conditions” (p. 1417).
Similar conclusions are reached by Kubick (1999), who examinedchanges in the prevalence of childhood disabilities reported by parentsbefore and after changes that liberalized eligibility for the SSI program.Using data from the National Health Interview Survey and the MarchCurrent Population Survey, he finds that the rule changes were followedby a substantial increase in the percentage of low-income childrenidentified as having health impairments, relative to high-incomechildren. Parents in states with higher benefit differential between SSIand AFDC were more likely to identify their children as having a healthimpairment, and more likely to seek medical treatment and specialeducation services for their children. He concludes that the SSIexpansion was effective in encouraging poor families to identify and treathealth problems in their children.
Further evidence that the gap between alternative measures ofdisability reflects differences in the severity, rather than the existence, of adisability is provided by studies of individuals whose claims for disabilityare rejected (reviewed in Bound, 1991). Clinical studies of theseindividuals reveal that although they were not deemed sufficientlydisabled to work, the majority (as many as two-thirds) were not “capableof work under normal conditions” (p. 1432).
103
Stern (1989) makes use of detailed information about medicalconditions available in the NHIS to addresses the issue of endogeneitydirectly. To address the question of the accuracy of self-reported, work-limiting disabilities, he uses the NHIS data to compare self-reports ofwork-limiting disabilities (the question used in our survey) to self-reportsof specific, usually physician-diagnosed, conditions. In general, thecorrelation between the two types of measures is very strong, and moresevere conditions are associated with a higher probability of reportingwork-limiting disabilities. (Loprest, Rupp, and Sandel (1985) reportsimilar results using the NHIS and restricting their sample to women.)However, the correlation is not perfect, suggesting that some respondentseither misunderstand the questions or misreport their status.Interestingly, this includes both individuals who report a work-limitingdisability but no specific conditions, and those who report conditionsthat would generally be considered to impose limitations (for example,blindness), but do not report a work limitation.
Stern (1989) goes on to address the question of whether the moregeneral measures of “work-limiting disabilities” is an endogenous andtherefore biased measure by estimating two-stage employmentprobability models that use instruments constructed from either reportedconditions or self-reports of work-limiting disabilities or poor health. Heconcludes that the summary measures (of work limitations and poorhealth) are robust and exogenous to the employment measure andtherefore “provide good proxies for estimating the effect of disability onparticipation” (p. 391).
The general consensus among researchers who have examined theseissues is, not surprisingly, that more and more detailed measures (forexample, measures of functional limitations) are preferable to singlemeasures. However, our reading of the literature suggests that thestandard questions regarding work-limiting disabilities and health status,which we used in this study, have shown themselves to be robust andminimally biased measures. Although all individuals who reportthemselves as having disabilities and poor health may not meet othercriteria, such as eligibility for disability insurance, we believe that they arequite likely to have some level of health compromise.
104
Children’s Disability StatusAs noted above, concerns about overreporting and endogeneity have
been raised most often with regard to adults’ self-reports of disabilitystatus. Although it is possible that parents are also likely to misreportchildren’s disabilities, which are the central concern of this study, there islittle evidence to suggest that these measures are biased or endogenous toself-reports of parental employment. In fact, in the case of adultdisabilities, proxies are believed to be less likely to report disabilities(about a family member) than are respondents themselves (about theirown health), probably because of incomplete information (Bound andWaidmann, 1992). Because parents are the caretakers of their children,there is less reason to believe that they do not have information abouttheir health and disability status.
Because children’s disabilities are the primary focus of this study, wespent considerably more of the interview collecting detailed informationabout the existence, type, and severity of their conditions. Children withchronic health problems and disabilities were identified by askingmothers two separate questions concerning whether any of their children:(1) had a chronic health problem—physical, emotional, or mental—thatlimited the amount or kinds of things that he or she could do; and (2)had a disability or handicapping condition that limited the amount orkind of things he or she could do. We identified a household asincluding a child or children with chronic conditions if the respondentanswered yes to any of these three screening questions. Thus, wescreened broadly to include activity-limiting chronic illnesses, as well asemotional, mental, and physical conditions that could produce amoderate to severe functional limitation.
For each child identified as having a limiting condition, respondentswere asked to identify up to five specific conditions (diagnoses) causingthe child’s impairment. To measure the severity of the condition,respondents were also asked a series of questions regarding functionallimitations and use of special health and educational services. Thesequestions were derived from questions in the 1992 National HealthInterview Survey, the topical module on children’s disability designed forthe Survey of Income and Program Participation, and a 1978 survey of

105
households with SSI children undertaken by Urban Systems Researchand Engineering Inc.
We believe that these questions provide as reliable a measure ofchildren’s disabilities as is possible using telephone surveys. However,given the considerable difficulties of caring for children with physical,mental, and emotional conditions, parents may be inclined tooverestimate the severity of children’s disabilities. Parents who arereceiving welfare and not employed may also be inclined to identifyproblems among their children to justify their status. Given theseconcerns, we were conservative in our coding of children’s conditions.When mothers reported that their child had a condition, but did notprovide a specific condition or diagnosis, or did not describe the child ashaving functional limitations, we did not code that child as having adisability. Among those children for whom the mother identified acondition and at least one functional limitation, we used reportedfunctional limitations to distinguish between children with “moderate”and “severe” problems. (See Table 5.2 in text.)

107
Bibliography
Acs, Gregory, and Pamela Loprest, “The Effect of Disabilities on Exitsfrom AFDC,” Journal of Policy Analysis and Management, Vol. 18, No.1, 1999, pp. 28–49.
Aron, L., P. Loprest, and E. C. Steuerle, Serving Children withDisabilities, The Urban Institute Press, Washington D.C., 1996.
Baldwin, K., R. Brown, and M. Milan, “Predictors of Stress in Caregiversof Attention Deficit Hyperactivity Disordered Children,” AmericanJournal of Family Therapy, Vol. 23, 1995, 149–160.
Barabas, G., W. Matthews, and P. Zumoff, “Care-Load for Children andYoung Adults with Severe Cerebral Palsy,” Developmental Medicineand Child Neurology, Vol. 34, 1991, pp. 979–984.
Berndt, E., The Practice of Econometrics: Classic and Contemporary,Addison-Wesley, Reading, Massachusetts, 1991.
Blank, R. M., “The Effect of Medical Need and Medicaid on AFDCParticipation,” The Journal of Human Resources, Vol. XXIV, 1989, pp.54–87.
Blau, F., and M. Ferber, The Economics of Women, Men, and Work,Prentice-Hall, Englewood Cliffs, New Jersey, 1992.
Blossfeld, H. P., and G. Rohwer, Techniques of Event History Modeling,Lawrence Erlbaum Associates, Inc., Mahwah, New Jersey, 1995.
Bound, J., “The Health and Earnings of Rejected Disability InsuranceApplicants—Reply,” American Economics Review, Vol. 81, No. 5,December 1991, pp. 1427–1434.
Bound, J., and T. Waidmann, “Disability Transfers, Self-ReportedHealth, and the Labor-Force Attachment of Older Men—Evidence
108
from the Historical Record,” Quarterly Journal of Economics, Vol. 107,No. 4, November 1992, pp. 1393–1419.
Brady, H., M. K. Meyers, and S. Luks, “The Impact of Child and AdultDisabilities on the Duration of Welfare Spells,” paper presented at theAssociation for Public Policy Analysis and Management EighteenthAnnual Research Conference, Pittsburgh, October 1996.
Breslau, Naomi, D. Salkever, and K. S. Staruch, “Women’s Labor ForceActivity and Responsibilities for Disabled Dependents: A Study ofFamilies with Disabled Children,” Journal of Health and SocialBehavior, Vol. 23, No. 2, 1982.
Burke, V., Nixon’s Good Deed: Welfare Reform, Columbia UniversityPress, New York, 1974.
Burkhauser, Richard V., Robert H. Haveman, and Barbara L. Wolfe,“How People with Disabilities Fare When Public Policies Change,”Journal of Policy Analysis and Management, Vol. 12, No. 2, 1993, pp.251–269.
California Work Pays Demonstration Project: County WelfareAdministrative Data. Public Use Version 3. UC DATA, Universityof California at Berkeley.
California Work Pays Demonstration Project: Survey: English/SpanishInterviews Wave I. Public Use Version 2. UC DATA, University ofCalifornia at Berkeley.
California Work Pays Demonstration Project: Survey: English/SpanishInterviews Wave II. Public Use Version 1. UC DATA, University ofCalifornia at Berkeley.
California Work Pays Demonstration Project: Survey: English/SpanishInterviews March 1993–May 1994 Sample (Wave 2). Preliminaryversion. UC DATA, University of California at Berkeley.
California Work Pays Demonstration Project: Survey: English/SpanishInterviews January 1995–August 1996 Sample (Combined Wave).Preliminary version. UC DATA, University of California at Berkeley.

109
Call, R. S., G. Ward, S. Jackson, and T.A.E. Platts-Mills, “InvestigatingSevere and Fatal Asthma,” Journal of Allergy and Clinical Immunology,Vol. 94, No. 6, 1994.
Darling, R., “The Economic and Psychosocial Consequences ofDisability: Family-Society Relationships,” Marriage and FamilyReview, Vol. 11, 1987, pp. 45–62.
Edin, Kathryn, and Laura Leinj, Making Ends Meet: How Single MothersSurvive Welfare and Low-Wage Work, Russell Sage Foundation, NewYork, 1997.
Federman, M., T. Garner, K. Short, W. Keily, J. Levine, D. McGough,and McMillen, “What Does It Mean To Be Poor in America?”Monthly Labor Review, Vol. 3, May 1996, p. 17.
Garrett, Bowen, and Sherry Glied, “Does State AFDC Generosity AffectChild SSI Participation?” Journal of Policy Analysis and Management,Vol. 19, No. 2, 2000, pp. 275–295.
Greene, W., Econometric Analysis, 3rd Edition, Prentice Hall, Inc., UpperSaddle River, New Jersey, 1997.
Grossman, M., The Demand for Health: A Theoretical and EmpiricalInvestigation, Columbia University Press, New York, 1972a.
Grossman, M., “On the Concept of Health Capital and the Demand forHealth,” Journal of Political Economy, Vol. 80, 1972b, pp. 223–255.
Guo, G., “Event-History Analysis for Left-Truncated Data,” in Peter V.Marsden (ed.), Sociological Methodology, American SociologicalAssociation, Washington, D.C., 1993.
Hamerle, A., “On the Treatment of Interrupted Spells and InitialConditions in Event History Analysis,” Sociological Methods andResearch, Vol. 19, No. 3, 1991, pp. 388–414.
Haveman, Robert, Barbara Wolfe, Lawrence Buron, and Steven C. Hill,“Loss of Earnings Capability from Disability/Health Limitations:Toward a New Social Indicator,” Review of Income and Wealth, IRPReprint Series 41, No. 3, 1995, pp. 289–308.

110
Heckman, James J., “What Has Been Learned about Labor Supply in thePast Twenty Years?” American Economic Review, Vol. 83, No. 2, 1993.
Heckman J. J., and B. Singer, “Social Science Duration Analysis,” in J. J.Heckman and B. Singer (eds.), Longitudinal Analysis of Labor MarketData, Cambridge University Press, Cambridge, 1985.
Hobbs, N., J. Perrin, and H. Ireys, Chronically Ill Children and TheirFamilies, Jossey-Bass Publishers, San Francisco, 1985.
Hodgson, T. A., and M. R. Meiners, “Cost-of-Illness Methodology: AGuide to Current Practices and Procedures,” Milbank Memorial FundQuarterly/Health and Society, Vol. 60, No. 3, 1982, pp. 429–461.
Hutchens, R., “Entry and Exit Transitions in a Government TransferProgram: The Case of Aid to Families with Dependent Children,”The Journal of Human Resources, Vol. XVI, 1981, pp. 217–237.
Jacobs, P., and S. McDermott, “Family Caregiver Costs of ChronicallyIll and Handicapped Children: Method and Literature Review,”Public Health Reports, Vol. 104, No. 2, 1989, pp. 158–163.
Killingsworth, M. R., Labor Supply, Cambridge University Press,Cambridge, 1983.
Killingsworth, M., and J. Heckman, “Female Labor Supply: A Survey,”in Orley C. Ashenfelter and Richard Layard (eds.), Handbook of LaborEconomics (Vol. 1), North-Holland, New York, 1986.
Ku, L., and B. Bruen, “The Continuing Decline in Medicaid Coverage,”New Federalism: Issues and Options for the States, The Urban Institute,Washington, D.C., 1999.
Kubick, J. D., “Incentives for the Identification and Treatment ofChildren with Disabilities: The Supplemental Security IncomeProgram,” Journal of Public Economics, Vol. 73, No. 2, 1999, pp.187–215.
Lancaster, T., “Econometric Methods for the Duration ofUnemployment,” Econometrica, Vol. 47, No. 4, 1979, pp. 939–956.

111
Lansky, S. B., N. U. Cairns, G. M. Clark, and J. Lowman, “NonmedicalCosts of the Illness,” Cancer, Vol. 43, 1979, pp. 403–408.
Lawless, J. F., Statistical Models and Methods for Lifetime Data, JohnWiley and Sons, New York, 1982.
Leonard, B., J. Brust, and J. Sapienza, “Financial and Time Costs toParents of Severely Disabled Children,’ Public Health Reports, Vol.107, No. 3, 1992, pp. 302–311.
Loprest, P. J., Supplemental Security Income for Children with Disabilities:Part of the Federal Safety Net, The Urban Institute, Washington, D.C.,1997.
Loprest, P., and G. Acs, “Profile of Disability Among Families onAFDC,” unpublished manuscript, 1995.
Loprest, Pamela, Kalman Rupp, and Steven H. Sandell, “Gender,Disabilities, and Employment in Health and Retirement Study,”Journal of Human Resources, Vol. XXX (Supplement), 1995, pp.S293–319.
Maddala, G. S., Limited-Dependent and Qualitative Variables inEconometrics, Cambridge University Press, Cambridge(Cambridgeshire), New York, 1983.
Mauldon, J., “Employment of Mothers with Disabled Children,”APPAM Annual Research Meeting, Bethesda, Maryland, 1991.
Mayer, S., and C. Jencks, “Poverty and the Distribution of MaterialHardship,” The Journal of Human Resources, Vol. XXIV, 1988, pp.88–113.
McDonald, J., and R. Moffitt, “The Uses of Tobit Analysis,” Review ofEconomics and Statistics, Vol. 62, 1980, pp. 318–321.
McEwen, B. S., “Protective and Damaging Effects of Stress Mediators,”The New England Journal of Medicine, Vol. 338, 1998, pp. 171–179.
McNeil, J., “Americans with Disabilities 1991–92,” Current PopulationReports, P, 1993, pp. 70–133.

112
Meyers, M. K., A. Lukemeyer, and T. Smeeding, “The Cost of Caring:Public and Private Costs Childhood Disabilities in Poor Families,”Social Service Review, Vol. 72, No. 1, 1998, pp. 209–233.
Moffitt, R., “Incentive Effects of the U.S. Welfare System: A Review,”Journal of Economic Literature, Vol. 30, No. 1, March 1992, p. 1.
Moffitt, R., and B. Wolfe, “The Effects of the Medicaid Program onWelfare Participation and Labor Supply,” The Review of Economicsand Statistics, Vol. 74, No. 4, 1992, pp. 615–626.
National Academy of Social Insurance, Restructuring the SSI DisabilityProgram for Children and Adolescents, 1995.
Newacheck, P., and M. McManus, “Financing Health Care for DisabledChildren,” Pediatrics, Vol. 81, 1998, pp. 385–394.
Newacheck, P., W. J. Jameson, and N. Halfon, “Health Status andIncome: The Impact of Poverty on Child Health,” Journal of SchoolHealth, Vol. 64, No. 6, 1994, pp. 229–233.
Newacheck, P., and W. Taylor, “Childhood Chronic Illness: Prevalence,Severity, and Impact,” American Journal of Public Health, Vol. 82,1992, pp. 364–371.
O’Neill, J. A., L. J. Bassi, and D. A. Wolf, “The Duration of WelfareSpells,” The Review of Economics and Statistics, Vol. 69, 1987, pp.241–248.
Plotnick, R., “Turnover in the AFDC Population: An Event HistoryAnalysis,” The Journal of Human Resources, Vol. XVIII, No. 1, 1983,pp. 65–81.
Reinhard, S., and A. Horwitz, “Caregiver Burden: Differentiating theContent and Consequences of Family Caregiving,” Journal ofMarriage and the Family, Vol. 94, No. 57, 1995, pp. 741–750.
Rosenstreich, D. L., P. Eggleston, M. Kattan, D. Baker, R. G. Slavin, P.Gergen, H. Mitchell, K. McNiff-Mortimer, H. Lynn, D. Ownby, andF. Malveaux, “The Role of Cockroach Allergy and Exposure toCockroach Allergen in Causing Morbidity Among Inner-City

113
Children with Asthma,” New England Journal of Medicine, Vol. 336,No. 19, 1997.
Ross, J. L., Supplemental Security Income: Recipient Population HasChanged As Caseloads Have Burgeoned, U.S. General AccountingOffice, Washington, D.C., 1997.
Salkever, D., “Children’s Health Problems and Maternal Work Status,”Journal of Human Resources, Vol. 17, 1982, pp. 94–109.
Sandefur, Gary D., and Steven D. Cook, Duration of Public AssistanceReceipt: Is Welfare a Trap? Institute for Research on Poverty,Discussion Paper # 1129-97, 1997.
Sarpong, S B, R. G. Hamilton, P. A. Eggleston, and N. F. Adkinson, Jr.,“Socioeconomic Status and Race as Risk Factors for CockroachAllergen Exposure and Sensitization in Children with Asthma, Journalof Allergy and Clinical Immunology, Vol. 97, No. 6, 1996.
Social Security Administration, Children Receiving SSI, Social SecurityAdministration, Baltimore, Maryland, 1993.
Social Security Administration, Annual Report of the SupplementalSecurity Income Program, Washington, D.C., 1998.
Spalter-Roth, R. M., H. I. Hartmann, and L. Andrews, Combining Workand Welfare: An Alternative Antipoverty Strategy, Institute forWomen’s Policy Research, Washington, D.C., 1992.
Stern, Steve, “Measuring the Effect of Disability on Labor ForceParticipation,” Journal of Human Resources, Vol. XXIV, No. 3, 1989,pp. 360–395.
Tuma, N. B., and M. T. Hannan, Social Dynamics: Models and Methods,Academic Press, New York, 1984.
U.S. General Accounting Office, Social Security—Rapid Rise in Childrenon SSI Disability Rolls Follows New Regulations, Report No.GAO/HEHS 94-225, Washington D.C., 1994.

114
U.S. General Accounting Office, Supplemental Security Income—Growthand Changes in Recipient Population Call for Reexamining Program,Report No. GAO/HEHS-95-137, Washington D.C., 1995.
U.S. House of Representatives, 1994 Green Book, Committee on Waysand Means, Washington, D.C., 1994.
U.S. House of Representatives, 1996 Green Book, Committee on Waysand Means, Washington, D.C., 1996.
Urban Systems Research and Engineering Inc., Survey of Blind andDisabled Children Receiving Supplemental Security Income Benefits,Social Security Administration, Baltimore, Maryland, 1979.
Weishaupt, R., and R. Rains, “Sullivan vs. Zebley: New DisabilityStandards for Indigent Children to Obtain Government Benefits,”Saint Louis University Law Journal, Vol. 35, 1991, pp. 539–596.
Wenger, B. L., H. S. Kaye, and P. LaPlante, “Disabilities AmongChildren,” Disability Statistics Abstract, Vol. 15, 1996, pp. 1–4.
Whyte, D. A., “A Family Nursing Approach to the Care of a Child witha Chronic Illness,” Journal of Advanced Nursing, Vol. 17, 1992, p.317.
Wolfe, B. L., and S. C. Hill, “The Effect of Health on the Work Effortof Single Working Mothers,” The Journal of Human Resources, Vol.30, No. 1, 1995, pp. 42–62.
Woodward, B., and B. Weiser, “Costs Soar for Children’s DisabilityProgram,” The Washington Post, April 1994, p. A1.
Yelowitz, A. S., “The Medicaid Notch, Labor Supply, and WelfareParticipation; Evidence from Eligibility Expansions,” QuarterlyJournal of Economics, Vol. 110, No. 4, November 1995, pp. 909–939.

115
About the Authors
MARCIA K. MEYERS
Marcia K. Meyers is Associate Professor of Social Work and PublicAffairs at Columbia University and Associate Director of the New YorkCity Social Indicators Survey Center. She earned an M.P.A. at HarvardUniversity and an M.S.W. and Ph.D. from the University of California,Berkeley. Dr. Meyers’s research focuses on public policies and programsfor vulnerable populations, including public welfare services, childwelfare programs, and child-care services. Her papers have appearedrecently in the Journal of Policy and Management, the Journal of EuropeanSocial Policy, Social Services Review, and Social Science Quarterly.
HENRY E. BRADY
Henry E. Brady is Professor of Political Science and Public Policy atthe University of California, Berkeley, where he is also Director of theSurvey Research Center and UC DATA. He has co-authored two bookson mass political behavior, Letting the People Decide: The Dynamics of aCanadian Election (which won the Harold Adams Innis award for thebest book in the social sciences published in Canada in 1992–93) andVoice and Equality: Civic Voluntarism in American Politics (1995). Hisother publications include a co-authored monograph, Pacific Rim StatesAsian Demographic Data Book (1995), and numerous professional articleson statistical methods, research design, and politics and policy inCanada, the United States, Russia, and Estonia.
EVA Y. SETO
Eva Y. Seto is a doctoral student of economics at the University ofCalifornia, Berkeley, where she is also a researcher at UC DATA. Inaddition to working on various projects related to public assistance inCalifornia, she has participated in the evaluation of Cal-Learn, a programfor teenage welfare parents, for the California Department of SocialServices. Her research interests include disability programs. She holds aB.A. in economics from the University of California, Berkeley.