expecto performa! the magic and reality of performance tuning
TRANSCRIPT

Expecto Performa!The magic and reality of performance tuning
MATT SHELTON | TECHNICAL ACCOUNT MANAGER | ATLASSIAN | @MATTSHELTON
DENISE UNTERWURZACHER | SITE RELIABILITY ENGINEER | ATLASSIAN

Agenda
Understanding the problem
Let’s agree… to agree
Measure (allthethings)
Benchmarking
The art of tuning

Agenda
Understanding the problem
Let’s agree… to agree
Measure (allthethings)
Benchmarking
The art of tuning

Hi, I’m a TAM.

Hi, I’m a TAM.

© 2016 Walt Disney Pictures

© 2004 Warner Brothers

Any sufficiently advanced technology is indistinguishable from magic.ARTHUR C. CLARKE

got problems?

After our maintenance window, Confluence is really slow!
CONFLUENCE ADMIN

My users say that JIRA takes too long to create an issue, and that opening their boards takes forever!JIRA ADMIN

JIRA feels slower than it did last month, and way slower than it was earlier in the year.JIRA USER

My developers say JIRA is too slow, but it seems fine to me…
PROJECT MANAGER

We just acquired this other company, they have Confluence as well and we want to merge them together. We’ll end up with 25,000 users and it’s not the fastest now, and then we want to start using Collaborative Editing, and open it up to outside contractors, and …
CONFLUENCE ADMIN

MOVING TARGETS

Is it speed you want?!?


Toyota Camry 2016’s most popular mid-size car!

Tesla P100D World's fastest consumer sedan!
Toyota Camry 2016’s most popular mid-size car!

Agenda
Understanding the problem
Let’s agree… to agree
Measure (allthethings)
Benchmarking
The art of tuning

Let’s agree on…
Expectations
Priorities
Value

Expectations

Be reasonable… Don’t compare your internal Jira instance to a supercomputer!
Expectations

Status Quo Is it ok today? It’s only a few seconds…
Be reasonable… Don’t compare your internal Jira instance to a supercomputer!
Expectations

Status Quo Is it ok today? It’s only a few seconds…
Be reasonable… Don’t compare your internal Jira instance to a supercomputer…
Expectations
Latency A little is ok, but a lot can be a big problem.

Scalability I’ll see your 250 users, and raise you 2500, then 25,000…
Expectations

User Behavior temet nosce (know thyself)
Scalability I’ll see your 250 users, and raise you 2500, then 25,000…
Expectations

Priorities!

Urgency Trying to fix what’s broken, or make it better?Priorities!

Urgency Trying to fix what’s broken, or make it better?
Who cares? Discover, discern, and prioritize!
Priorities!

Urgency Trying to fix what’s broken, or make it better?
Who cares? Discover, discern, and prioritize!
Now vs Later What’s most beneficial now? What would be helpful down the road?
Priorities!

How much is it worth to you?
VALUE

Staffing Levels

Staffing Levels
Customer 1
Customer 2
Profile - 10,000 Users - Jira Data Center, Confluence Data Center - 1 Manager - 2 FT Sys Admin - 3 FT App Admins - 1 FT Dev - 1 FT SRE - 1 Architect
Assessment Well-staffed. Team runs all of our applications as well as other developer tools.

Staffing Levels
Customer 1
Customer 2
Profile - 20,000 Users - 2 Jira Data Center, 2 Confluence Data Center, 1 BB
Data Center, FeCru, 3 Bamboo - 1 Team Lead - 2 FT/1 PT App Admin - 1 FT/1PT Sys Admins
Assessment Under-staffed. Team runs all of our applications as well as at least 5 other tool across different geographies


I WANT TO GO TO THERE

Agenda
Understanding the problem
Let’s agree… to agree
Measure (allthethings)
Benchmarking
The art of tuning

MEASURE (ALLTHETHING)
It feels like it’s taking forever…
MEASURE (ALLTHETHING)
It feels like it’s taking forever…


It depends…
Bitbucket Make sure you monitor the CPU! (But don’t forget about DB load, SCM jobs, or disk speed, or…)
Bamboo Make sure you monitor the network! (But don’t forget about CPU load, or page load time, or…)
Jira Make sure you monitor disk I/O! (But don’t forget about heap use, or CPU load, or page load time, or…)
Confluence Make sure you monitor Memory! (But don’t forget about the db connection pool, or disk I/O, or…)

(micdrop)to Denise

Agenda
Understanding the problem
Benchmarking
The art of tuning
Let’s agree… to agree
Measure (allthethings)

extranet.atlassian.com

Extranet
Long pauses Garbage collection pauses of 10-20s
Nodes removed Lack of response means nodes are aggressively removed from the pool
Garbage Collection
Network latency
Load balancers

Extranet
Photo heavy blogs Latency causing slow image downloads
Garbage Collection
Network latency
Load balancers

Extranet10s health check Nodes are removed from the pool if there is no response for 10s
Idempotency Failed requests replay across other nodes
No draining period Requests fail immediately
Garbage Collection
Network latency
Load balancers

Load balancing
Node 1 Node 2 Node 3

Load balancing
Node 1 Node 2 Node 3

Load balancing
Node 1 Node 2 Node 3

Load balancing
Node 1 Node 2 Node 3

Stop cascading failures Turn off idempotency
Lower sensitivity of health check
Allow draining

Buffers
Node Load balancer 400k buffer
Client

Buffers
Node Load balancer ClientLoad balancer

Buffers
Node Load balancer ClientLoad balancer

Buffers
Node Load balancer ClientLoad balancer
400k 400k

Buffers
Node Load balancerLoad balancer
400k
Client
Client
400k

Buffers
Node Load balancer ClientLoad balancer
12mb

Buffers
Node Load balancer ClientLoad balancer
12mb

Stop artificially throttling Increase the load balancer buffer size

What does ‘slow’ really mean?
BENCHMARKING

You need data

Ok, but how?
BENCHMARKING
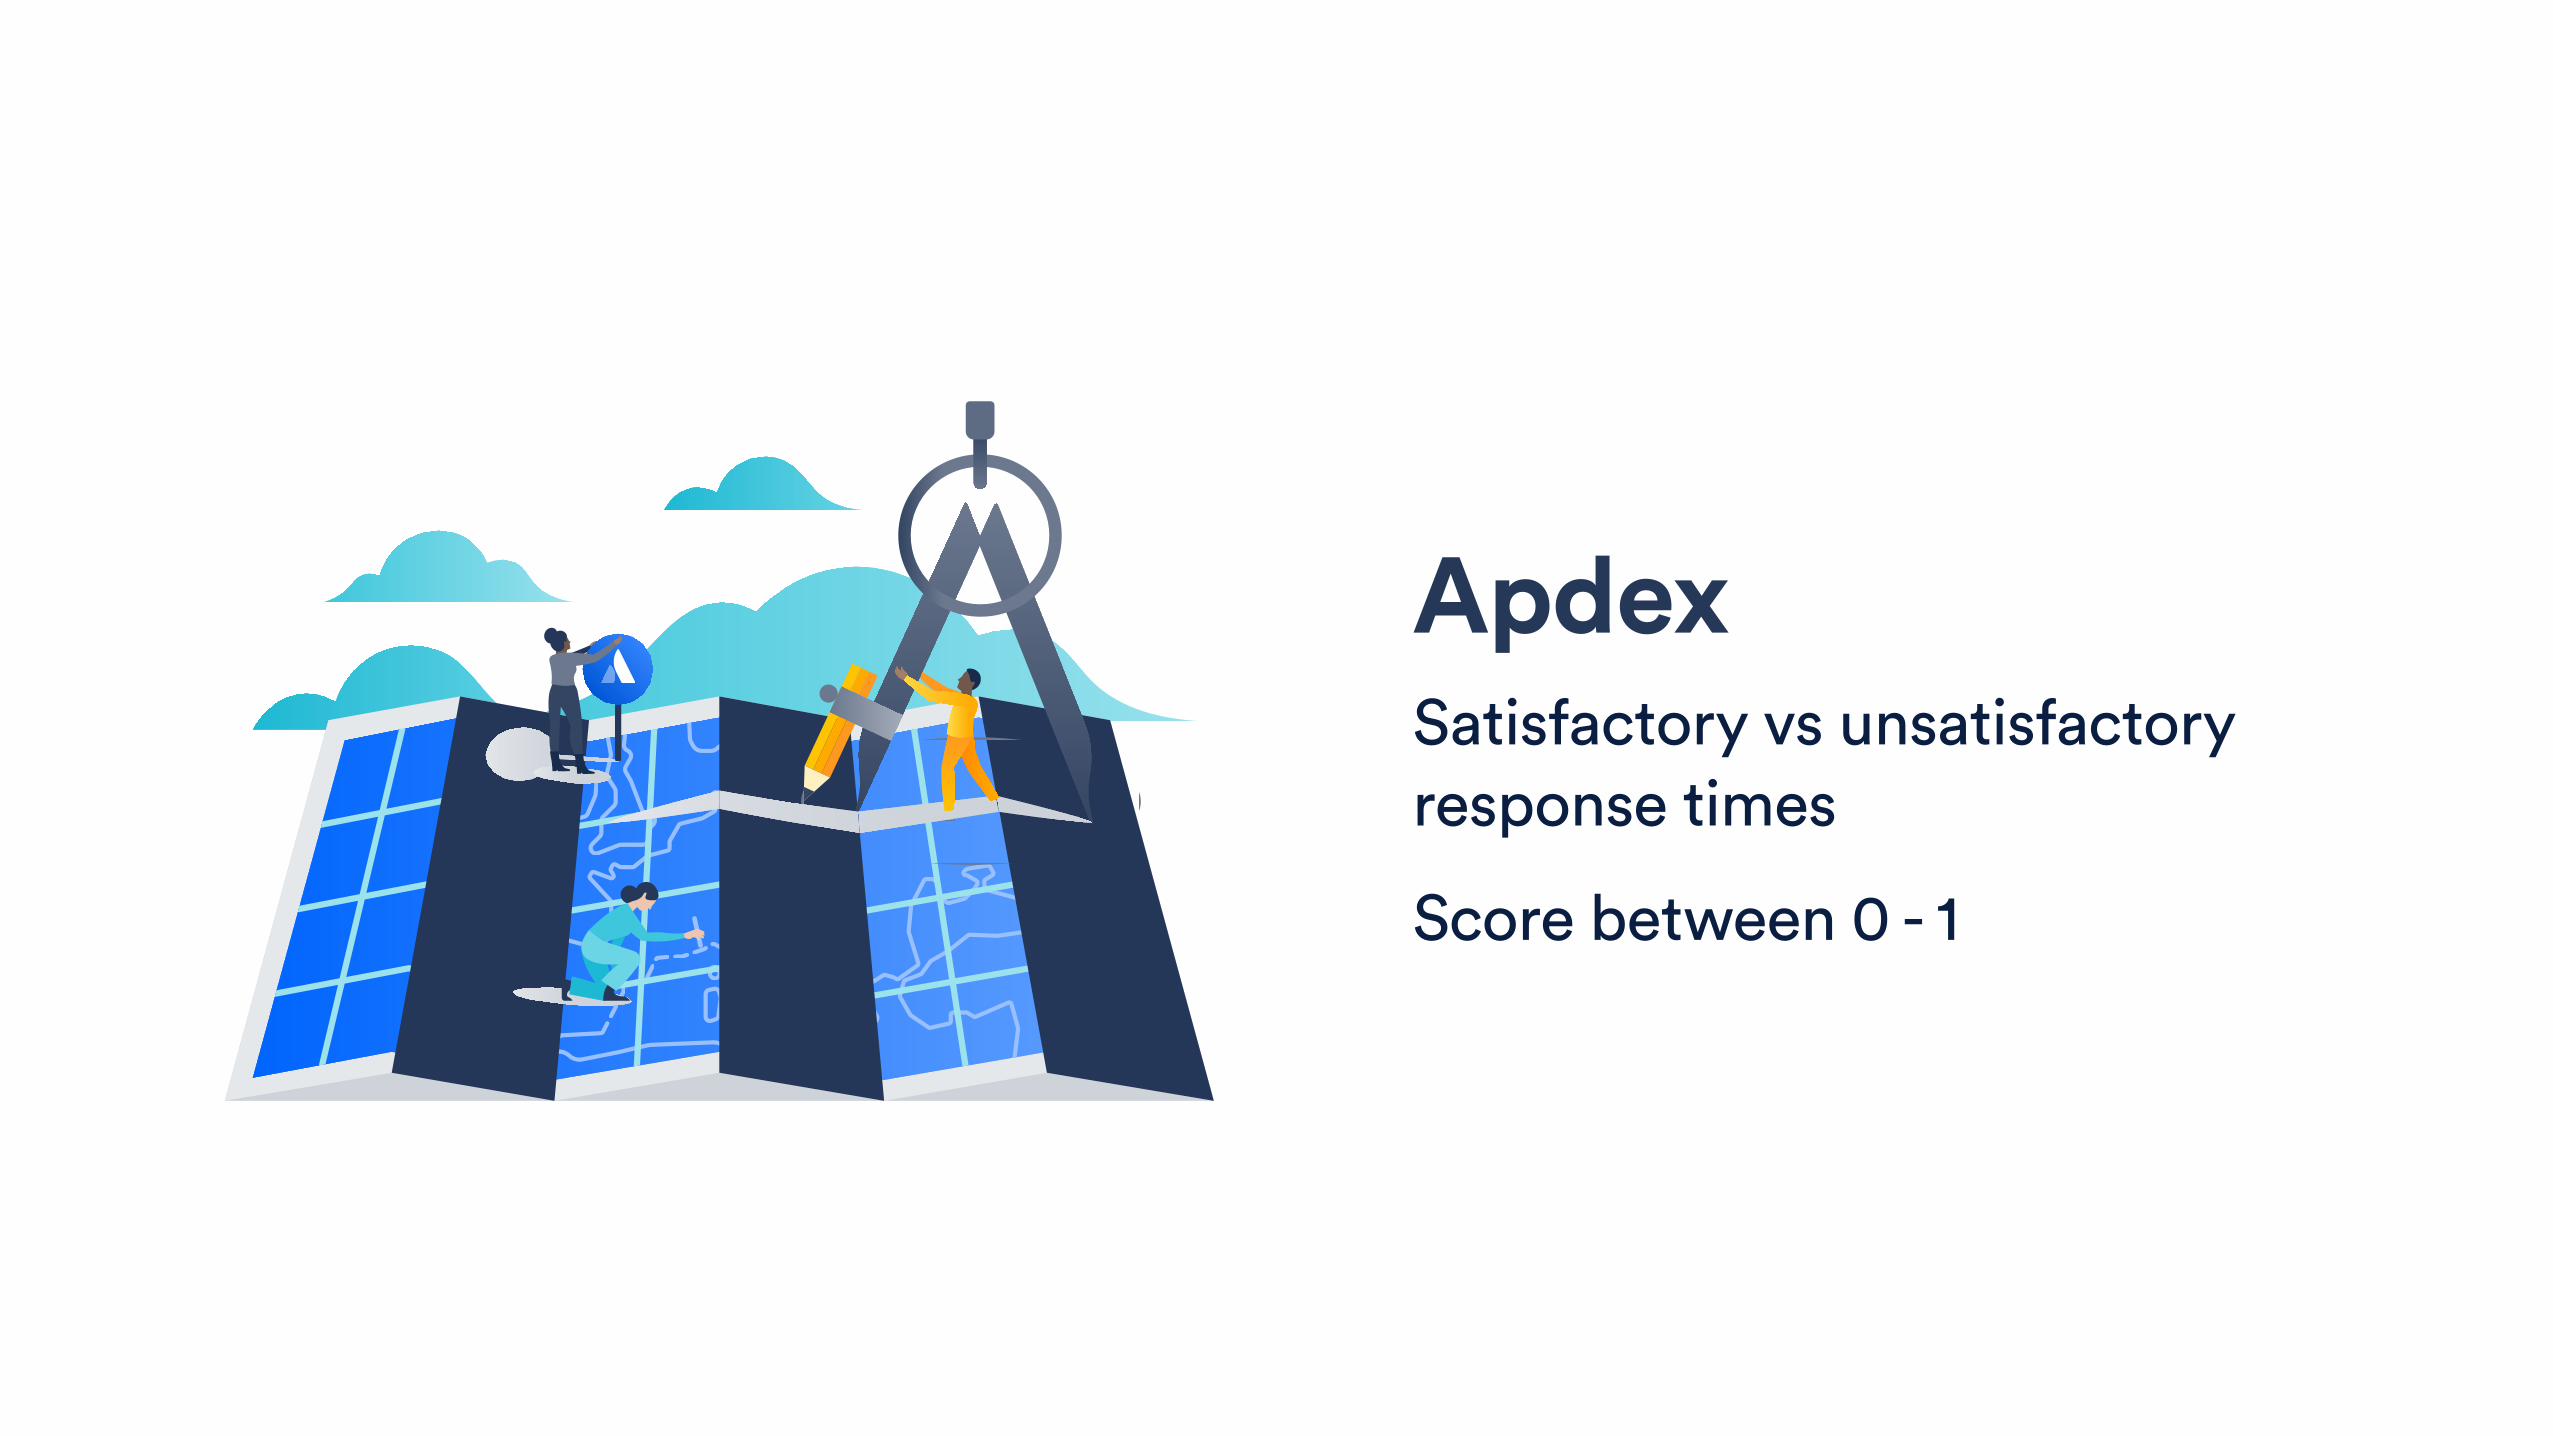
Apdex Satisfactory vs unsatisfactory response times
Score between 0 - 1


Know your infrastructure

Know your infrastructure
Network
Database
App servers
Requests
Largest potential for problems Work with your networking teams
Access logging Pipe load balancer or Tomcat access logs into Splunk

Know your infrastructure
Network
Database
App servers
Requests
Latency Check in System Information, or ping
Slow queries Enable logging on the database

Know your infrastructure
Network
Database
App servers
Requests
CPU Datadog or Logic Monitor
I/O Datadog or Logic Monitor
Memory Enable GC logging, use GCViewer

CPU and I/O (Datadog)

CPU and I/O (Datadog)

Know your infrastructure
Network
Database
App servers
Requests
CPU Datadog or Logic Monitor
I/O Datadog or Logic Monitor
Memory Enable GC logging, use GCViewer

Garbage Collection (GCViewer)

Know your infrastructure
Network
Database
App servers
Requests
HTTP threads New Relic
Load balancer Access logging
Database connections Datadog

HTTP Threads (NewRelic)

Know your infrastructure
Network
Database
App servers
Requests
HTTP threads New Relic
Load balancer Access logging
Database connections Datadog

Database Connections (Datadog)

Know your infrastructure
Network
Database
App servers
Requests
HTTP threads New Relic
Load balancer Access logging
Database connections Datadog

Log everything. Keep everything.

Peak times Know your peak and low load
times
Find your benchmarks
Percentiles Averages mean nothing
Identify Establish baselines for each
area

Percentiles

Percentiles

Percentiles

Percentiles

Agenda
Understanding the problem
Benchmarking
The art of tuning
Let’s agree… to agree
Measure (allthethings)

Before you start tuningHold your horses

Be patient Wait for peak and low load
times
Go slow
Know when to stop Is that last 100ms really
worth it?
Isolate Make one change at a time
and benchmark

Adding more nodes
Adding more
resources
VERTICAL HORIZONTAL

Agree on metrics

Start simple

Track everything

Adding too much capacity can cause other problems.
TUNING

Spell book

Magic tricks
Database
App servers
Requests
Check your indexes

Magic tricks
CPU Add more cores, limit concurrency
Garbage Collection Adding more memory != success
Database
App servers
Requests

Magic tricks
Threading More database connections than HTTP threads
Load balancer • Increase buffers • Turn off idempotency • Allow draining • ‘Least connections’ over
‘round robin’
Database
App servers
Requests

Limit complexity • Limit or combine custom fields
• Clean up unused plugins
• Keep general complexity of workflows low
Magic tricks
Jira
Confluence
Bitbucket Server

Tune for fault tolerance • Extend the cluster safety interval
• Turn off idempotency at your load balancer
• Know your garbage collection behaviour
Magic tricks
Jira
Confluence
Bitbucket Server

Load comes from git • Optimise for git over the JVM
• Scale vertically over horizontally
• Use docker and mirrors
Magic tricks
Jira
Confluence
Bitbucket Server

Upgrade

Planning for the future

Planning for the future
Capacity planning
Alerting
HTTP threads # of requests in highest load minute / 60 * average time to complete = threads in use/s
Requests in highest load minute = 8400 Time to complete = 0.82s
8400 / 60 * 0.82 = 115 threads, or 29 per node

Planning for the future
Capacity planning
Alerting
Our alerts
• More than 500x 500 errors in a minute • More than 300 timeouts at the load balancer in an
hour • Garbage collection pauses > 10s • Nodes being removed/readded at the load balancer • Cluster panics • Out of memory errors • Long running space exports

(micdrop)back to Matt


Accept Your Reality There are limits to performance tuning. Be ok with what’s fast enough.

Accept Your Reality There are limits to performance tuning. Be ok with what’s fast enough.
Data is Your Friend …but having good data takes time. Move slowly and methodically.

Accept Your Reality There are limits to performance tuning. Be ok with what’s fast enough.
Data is Your Friend …but having good data takes time. Move slowly and methodically.
Chill Go slowly. Track Everything. Lather. Rinse. Repeat. (Always repeat.)

The Four Principles of Atlassian Performance Tuning
Dan Hardiker CTO, Adaptavist
SUMMIT EUROPE 2017


© 2007 Warner Brothers

© 2002 1492 Pictures

Thank you!
MATT SHELTON | TECHNICAL ACCOUNT MANAGER | ATLASSIAN | @MATTSHELTON
DENISE UNTERWURZACHER | SITE RELIABILITY ENGINEER | ATLASSIAN