expectations of high school graduates, grade 12 · of grade 12 prince edward island high ... layout...
TRANSCRIPT


Expectations
For information, contact:
Department of EducationPolicy, Planning and Evaluation Division
16 Fitzroy StreetPO Box 2000
Charlottetown, PE C1A 7N8
Tel: 902 368 0281Fax: 902 368 4663
www.edu.pe.ca

-i-
Acknowledgements
Expectations of High School Graduates is a statistical description of the survey results compiledof Grade 12 Prince Edward Island high school students in May 2002. The survey instrumentexamined course selections, the future education plans of the Grade 12 students, their attitudesand expectations about career choices and participation in the labour force.
It is intended that the findings from the study, as presented in the report, will assist educators andadministrators in future planning.
I wish to thank principals, teachers, school counsellors and students who participated in thisproject. Without their cooperation, this report would not have been possible.
Special thanks are expressed to Jeff MacPhail, a UPEI Business Intern student, who helpedverify and analyze the data, and then completed the draft report during his internship term:January to April 2003.
A thank you is expressed to Shawn Alexander, Web Site Administrator for the Department ofEducation, for the design of the Web-based, data-entry module. A thank you is also expressed toJillian Power who entered the data while on a summer work project placement at the Departmentof Education.
Layout for the final document was completed by Strategic Marketing and Graphic Design,Provincial Treasury.
We continue to use questions from the Encouraging Island Grads to Return/Remain Home 1998: Report #1 so that we may compare the information shared by students from four years ago. Wefeel that this will be invaluable information as we attempt to understand the long-term desiresand aspirations of our PEI high school graduates.
Respectfully submitted,
Ron Smith, Special Projects ConsultantPolicy, Planning and EvaluationDepartment of Education

-iii-
Executive Summary
BackgroundIn April 2002, for the fifth consecutive year, a survey was conducted among 1,294 PrinceEdward Island Grade 12 students.
This project originates from the Executive Council and is led by the Department of Education. The survey is intended:
• to continue the tracking of PEI undergraduates, and
• to help decision makers be more responsive to the needs of high school students inpreparation for transition from secondary education to either post-secondaryeducation or the world of work.
The survey instrument is divided into seven sections: Personal Information, BackgroundInformation, High School Course Selection, Personal Expectations After High School,Occupational Plans or Further Study Plans, High School Guidance Services, and Influences onCourse Selection and Career Planning. The survey instrument is shown in Appendix A. Thereare two versions of the questionnaire, one designed for Anglophone students and the other forFrancophone students.
The major goal of the research is to provide data to be used by the Department of Education inmaking recommendations concerning the educational system.
Of the 1,676 Grade 12 students who graduated on Prince Edward Island in June 2002, a total of1,294 participated in the survey. This yields a participation rate of 77.2 per cent – 51 per cent (660)of the respondents were female, while the remaining 49 per cent (633) of the respondents were male.
Family Composition and ResidenceOf the students surveyed, 76 per cent (980) indicated that they reside with both parents orguardians; 15.7 per cent (202) live with their mother or female guardian; 3.6 per cent (47) livewith their father or male guardian. The students are mainly long-term residents as 89.8 per cent(1,159) of the respondents have resided on PEI for more than 10 years.
Anglophone Course SelectionEnrolment in academic English courses remains high because they are required courses in allPEI high schools. However, there are more students enrolling in academic English for the yearrather than advanced or general English compared to the previous years. Academicmathematics, a required course, has very high enrolment and continues to grow while theenrolment numbers for general mathematics are declining. It appears more students are choosingthe academic route with increases in most of the science courses at this level. In return, there arefewer students enrolling in the advanced and general categories. There is also a decline innumbers for quite a few career exploration courses when compared to the preceding years.

-iv-
New Course InterestsIn this year’s survey, students were also asked: “What course would you like to see offered atyour high school that is not presently offered?” Of the suggestions made by students, the mostpopular choices were psychology, electronics, cosmetology and photography.
Influencing FactorsThe factors which appear to have the most influence on high school course selection arepersonal interest which was mentioned by 75.8 per cent of the students surveyed, abilitymentioned by 42.3 per cent, choice of career mentioned by 35.9 per cent, marks mentioned by34.2 per cent, and friends mentioned by 33.8 per cent (Appendix B, Table 22).
The most common factors influencing a student’s choice of a job or career are very similar tothose influencing course selections. The results are personal interest at 77.4 per cent, ability at59.3 per cent, marks at 27.7 per cent, and friends at 21.3 per cent (see Appendix B, Table 23).
Future Plans and ExpectationsAfter high school, 71.7 per cent of the respondents plan to continue their education. The mostpopular programs of choice at universities are Arts and Science, Business/Commerce and HealthProfessions. The most popular programs of choice at community colleges and private trainingschools are Automotive Technology, Computer Engineering and EarlyChildhood Care and Education.
After completing their chosen programs or degrees, 26.1 per cent of thestudents plan to get a job on PEI, while 20.0 per cent plan to get a jobelsewhere. Another 19.4 per cent of the respondents plan to continuetheir studies and 28.7 per cent are unsure of their plans. When asked ifthey plan to stay on PEI on a permanent basis upon completing theireducation or training, 26.5 per cent said yes, 25.1 per cent said no, andthe remaining 48.4 per cent said they were unsure. The uncertainty onthe student’s part to live on PEI permanently may stem from theexpectancy of available work in their chosen field.
Many of the students were hesitant when asked: “Do you expect to findwork in your chosen occupation on PEI?” as 43.1 per cent respondedyes, 17.5 per cent said no, and 39.4 per cent were unsure. When askedabout starting their own business, 34.0 per cent said they had considered it. The majority ofrespondents (65.1 per cent) plan to work in the paid labour force for more than 20 years, while amodest 0.7 per cent plan to be working as a full-time homemaker five years after high schoolgraduation.

-v-
Table of Contents
Acknowledgements . . . . . . . . . . . . . . . . . . . . . . . . . . . . . . . . . . . . . . . . . . . . . . . . . . . . . . . . . . iExecutive Summary . . . . . . . . . . . . . . . . . . . . . . . . . . . . . . . . . . . . . . . . . . . . . . . . . . . . . . . . . iiiList of Figures and Tables . . . . . . . . . . . . . . . . . . . . . . . . . . . . . . . . . . . . . . . . . . . . . . . . . . . . viBackground and Methodology . . . . . . . . . . . . . . . . . . . . . . . . . . . . . . . . . . . . . . . . . . . . . . . . . viiPEI Grade 12 High School Students . . . . . . . . . . . . . . . . . . . . . . . . . . . . . . . . . . . . . . . . . . . . 1
Personal and Background Information . . . . . . . . . . . . . . . . . . . . . . . . . . . . . . . . . . . . . . . 1High School Course Selections . . . . . . . . . . . . . . . . . . . . . . . . . . . . . . . . . . . . . . . . . . . . . 3
Anglophone . . . . . . . . . . . . . . . . . . . . . . . . . . . . . . . . . . . . . . . . . . . . . . . . . . . . . . . . . 3Mathematics . . . . . . . . . . . . . . . . . . . . . . . . . . . . . . . . . . . . . . . . . . . . . . . . . . . . . . 3Language . . . . . . . . . . . . . . . . . . . . . . . . . . . . . . . . . . . . . . . . . . . . . . . . . . . . . . . . 4Science . . . . . . . . . . . . . . . . . . . . . . . . . . . . . . . . . . . . . . . . . . . . . . . . . . . . . . . . . 5Social Studies . . . . . . . . . . . . . . . . . . . . . . . . . . . . . . . . . . . . . . . . . . . . . . . . . . . . . 6Career Exploration . . . . . . . . . . . . . . . . . . . . . . . . . . . . . . . . . . . . . . . . . . . . . . . . . 7Course Category Selection . . . . . . . . . . . . . . . . . . . . . . . . . . . . . . . . . . . . . . . . . . 8
Francophone . . . . . . . . . . . . . . . . . . . . . . . . . . . . . . . . . . . . . . . . . . . . . . . . . . . . . . . . . 9Grade 10 . . . . . . . . . . . . . . . . . . . . . . . . . . . . . . . . . . . . . . . . . . . . . . . . . . . . . . . . . 9Grade 11 . . . . . . . . . . . . . . . . . . . . . . . . . . . . . . . . . . . . . . . . . . . . . . . . . . . . . . . . . 9Grade 12 . . . . . . . . . . . . . . . . . . . . . . . . . . . . . . . . . . . . . . . . . . . . . . . . . . . . . . . . 10
New Course Interests . . . . . . . . . . . . . . . . . . . . . . . . . . . . . . . . . . . . . . . . . . . . . . . . . . . . 10Factors Influencing Course Selection . . . . . . . . . . . . . . . . . . . . . . . . . . . . . . . . . . . . . . . . 11Factors Influencing Career Selection . . . . . . . . . . . . . . . . . . . . . . . . . . . . . . . . . . . . . . . . 12Future Plans and Expectations . . . . . . . . . . . . . . . . . . . . . . . . . . . . . . . . . . . . . . . . . . . . . 13Choice of Programs . . . . . . . . . . . . . . . . . . . . . . . . . . . . . . . . . . . . . . . . . . . . . . . . . . . . . 17Plans After Completing Program or Degree . . . . . . . . . . . . . . . . . . . . . . . . . . . . . . . . . . . 19Expected Mobility and Location of Residence . . . . . . . . . . . . . . . . . . . . . . . . . . . . . . . . . 20Career Plans and Confidence . . . . . . . . . . . . . . . . . . . . . . . . . . . . . . . . . . . . . . . . . . . . . 22Careers in the Trades . . . . . . . . . . . . . . . . . . . . . . . . . . . . . . . . . . . . . . . . . . . . . . . . . . . . 24School Guidance Services . . . . . . . . . . . . . . . . . . . . . . . . . . . . . . . . . . . . . . . . . . . . . . . 25
Conclusion . . . . . . . . . . . . . . . . . . . . . . . . . . . . . . . . . . . . . . . . . . . . . . . . . . . . . . . . . . . . . . . 26References . . . . . . . . . . . . . . . . . . . . . . . . . . . . . . . . . . . . . . . . . . . . . . . . . . . . . . . . . . . . . . 28Appendix A – Questions for Grade 12 Senior High Students . . . . . . . . . . . . . . . . . . . . . . . . 29Appendix B – Results of Survey of Grade 12 Senior High Students . . . . . . . . . . . . . . . . . . . 39Appendix C – Anglophone High School Course Selections . . . . . . . . . . . . . . . . . . . . . . . . . 53

-vi-
List of Figures and Tables
Figure 1: Survey Respondents by High School . . . . . . . . . . . . . . . . . . . . . . . . . . . . . . . . . . . . 1Figure 2: Sex of Respondents . . . . . . . . . . . . . . . . . . . . . . . . . . . . . . . . . . . . . . . . . . . . . . . . . 1Figure 3: Family Composition . . . . . . . . . . . . . . . . . . . . . . . . . . . . . . . . . . . . . . . . . . . . . . . . . 2Figure 4: Students Living With Single Parent/Guardian . . . . . . . . . . . . . . . . . . . . . . . . . . . . . 2Figure 5: Course Category Selection . . . . . . . . . . . . . . . . . . . . . . . . . . . . . . . . . . . . . . . . . . . 8Figure 6: Influence on Course Selection . . . . . . . . . . . . . . . . . . . . . . . . . . . . . . . . . . . . . . . . 11Figure 7: Influence on Job or Career Selection . . . . . . . . . . . . . . . . . . . . . . . . . . . . . . . . . . . 12Figure 8: Immediate Plans After High School . . . . . . . . . . . . . . . . . . . . . . . . . . . . . . . . . . . . 13Figure 9: Immediate Plans After High School by Sex . . . . . . . . . . . . . . . . . . . . . . . . . . . . . . 14Figure 10: Plans Five Years After High School . . . . . . . . . . . . . . . . . . . . . . . . . . . . . . . . . . . 15Figure 11: Most Popular College Programs . . . . . . . . . . . . . . . . . . . . . . . . . . . . . . . . . . . . . 17Figure 12: Choice of College Program Comparison . . . . . . . . . . . . . . . . . . . . . . . . . . . . . . . 18Figure 13: Most Popular University Programs . . . . . . . . . . . . . . . . . . . . . . . . . . . . . . . . . . . . 18Figure 14: Choice of University Program Comparison . . . . . . . . . . . . . . . . . . . . . . . . . . . . . 19Figure 15: Plans After Completing Program or Degree . . . . . . . . . . . . . . . . . . . . . . . . . . . . . 19Figure 16: Stay on PEI on a Permanent Basis . . . . . . . . . . . . . . . . . . . . . . . . . . . . . . . . . . . 20Figure 17: Capable of Achieving Your Career Plans . . . . . . . . . . . . . . . . . . . . . . . . . . . . . . . 22Figure 18: Capable of Achieving Your Career Plans by Sex . . . . . . . . . . . . . . . . . . . . . . . . . 22Figure 19: Considered Starting a Business . . . . . . . . . . . . . . . . . . . . . . . . . . . . . . . . . . . . . . 23Figure 20: Will You Register as an Apprentice? . . . . . . . . . . . . . . . . . . . . . . . . . . . . . . . . . . 24Figure 21: Choices Career Planning Program . . . . . . . . . . . . . . . . . . . . . . . . . . . . . . . . . . . . 25
Table 1: Students Taking Mathematics Courses by Year . . . . . . . . . . . . . . . . . . . . . . . . . . . . 3Table 2: Students Taking Language Courses by Year . . . . . . . . . . . . . . . . . . . . . . . . . . . . . . 4Table 3: Students Taking Science Courses by Year . . . . . . . . . . . . . . . . . . . . . . . . . . . . . . . . 5Table 4: Students Taking Social Studies Courses by Year . . . . . . . . . . . . . . . . . . . . . . . . . . . 6Table 5: Students Taking Career Exploration Courses by Year . . . . . . . . . . . . . . . . . . . . . . . 7Table 6: Francophone Students Taking Grade 10 Courses by Year . . . . . . . . . . . . . . . . . . . . 9Table 7: Francophone Students Taking Grade 11 Courses by Year . . . . . . . . . . . . . . . . . . . . 9Table 8: Francophone Students Taking Grade 12 Courses by Year . . . . . . . . . . . . . . . . . . . 10Table 9: Students Planning to Attend University by School . . . . . . . . . . . . . . . . . . . . . . . . . 16Table 10: Plans After Finishing Program or Degree . . . . . . . . . . . . . . . . . . . . . . . . . . . . . . . 21Table 11: Residence After Finishing Education . . . . . . . . . . . . . . . . . . . . . . . . . . . . . . . . . . . 21Table 12: The Factor That Would Help You Achieve Your Goals . . . . . . . . . . . . . . . . . . . . . 22

-vii-
Background and Methodology
It is important to state at the outset that thisstudy is exploratory research rather than anevaluation of Island schools or communities.
The basis of the current questionnaire originatedfrom the survey instrument in EncouragingIsland Graduates to Return/Remain Home1998. The original questionnaire was designedin 1997 by the project leader Debbie Pineau,Special Projects Consultant, Department ofEducation, Policy and Planning: HigherEducation and Training; with the assistance ofKaren White, UPEI graduate; and Carol Mayne,Director of Policy and Planning Division of theDepartment of Development and Technology.
This report was prepared by Jeff MacPhail,UPEI Business Intern, (January to April 2003),and is a continuation of the tracking of Islandgraduates which was initiated in the spring of1998. As the purpose of the survey is todetermine the future plans of Island Grade 12graduates, this program will continue tomaintain contact with a sample of the studentsin a number of follow-up surveys. Thesefollow-up surveys allow for comparisons withprevious years’ graduates on the Island and inother provinces.
Of the 1,676 Grade 12 students who graduatedon Prince Edward Island in June 2002, a total of1,294 participated in the survey in April 2002. Of these, 1,252 survey participants wereAnglophones, while the remaining 42 studentsattended schools of the French Language SchoolBoard. Reasons for non-participation ofstudents include Grade 12 students whograduated after the first semester and thereforedid not attend the second semester when thesurvey took place; absence due to illness; classoutings, trips or other reasons; and theunwillingness of some students to take part inthe survey.
The administration of the survey in each schooldepended on the preference of the schoolprincipal. In most schools, the questionnaireswere presented to the teachers who thenadministered them to the students during classtime. All surveys were returned in confidencedirectly to the Policy, Planning and EvaluationDivision, Department of Education through theinter-office or regular mail system, or they werepicked up at the school by the project leader. Each questionnaire was coded with anidentification number to facilitate data entry andchecking. The questionnaires were then enteredinto a database using a Web-based data entrymodule. The data was analyzed using the SPSSanalysis program on the computer facilities ofthe PEI government.
The following section of the report provides ananalysis of the survey results. Appendix Acontains a sample of the questionnaires andAppendix B shows the tabular presentation ofanswers for all applicable questions of thesurvey instrument. Appendix C contains thedetails of student course selection for grades 10,11 and 12.

1 Grade 12 Graduate List, Department of Education, March 2002.
Expectations of High School Graduates1
PEI Grade 12 High School Students
Of the 1,676 Grade 12 students who graduated on Prince Edward Island in June 20021, a total of 1,294participated in this year’s survey. This yields a high participation rate of 77.2 per cent. The followingchart shows the distribution of students who answered the questionnaire among the 13 high schools onPEI for the past four years (Appendix B, Table 1).
Personal and Background InformationThe questionnaire requires the student to supply thefollowing information: name, address, postal code, e-mailaddress, home phone number and permanent contactnumber. This information has been entered in a databaseenabling us to track these students in the future as the needarises.
A summary of the respondents’ characteristics are asfollows:
• At 51 per cent (660) the larger proportion of therespondents were female, the remaining 49 per cent(633) of the respondents were male.This matches closely to the gender ratio of thegraduates which was 51.1 per cent female and48.9 per cent male in June of 2002.

Expectations of High School Graduates2
• Of the students surveyed, 76.0 per cent (980) indicated that they reside with both parents orguardians; 15.7 per cent (202) live with their mother or female guardian; 3.6 per cent (47) livewith their father or male guardian; and the remaining 4.7 per cent (60) stated they live with other. Family composition shows very little change over the survey years (see Figure 3).
• Of the 249 students who live with a single parent or guardian, 81.1 per cent live with their motheror female guardian while only 18.9 per cent live with their father or male guardian (see Figure 4).
• The students are mainly long-term residents as 89.8 per cent (1,159) of the respondents haveresided on PEI for more than 10 years, 5.3 per cent (69) have lived on PEI for six to 10 years and4.9 per cent (63) have lived on PEI for less than five years.
• A break down of students by their communities reveals a large portion of the respondents thatparticipated in the survey reside in Charlottetown (20.5 per cent), Summerside (12.4 per cent),and Souris (5.2 per cent). A more detailed list of communities that the students reside in ispresented in Appendix B, Table 4.

Expectations of High School Graduates3
High School Course SelectionsOf the 1,294 students who responded to the survey, 1,252 attended Anglophone schools. The other 42students attended Francophone schools. The following section of the report is divided into Anglophoneand Francophone sections. Students were asked to list all the courses they took during their three yearsof high school. Courses are arranged in categories and information from previous surveys is included toidentify trends. Percentages have been shown to allow comparison across the academic years. SeeAppendix C for student counts by course.
Anglophone Course SelectionIn Table 1, there is a comparison of mathematics courses taken in the last four years. Academicmathematics, a required course, has a very a high enrolment rate and continues to grow while theenrolment numbers for general mathematics are declining. For advanced mathematics classes, we seethat there has been an increase in calculus courses and a decline in algebra courses. The advancedalgebra courses are only offered in four of the 11 Anglophone high schools on PEI which explains thelow percentages of students taking these courses. There has also been a drop in percentage of studentstaking geometry, while accounting courses indicate a slight change. The math curriculum has beenchanged and these numbers do not reflect the changes. The 2003 report will be updated to include thenew curriculum.
Table 1: Students Taking Mathematics Courses by Year
2002 2001 2000 1999Mathematics 421 95.2% 96.0% 84.6% 85.1%Mathematics 521 99.5% 87.1% 70.4% 78.4%Mathematics 621 75.5% 72.5% 63.4% 68.3%
Advanced Mathematics 611 2.0% 6.1% 15.8% *Advanced Mathematics 511 4.4% 5.8% 7.8% *Advanced Calculus 611 33.0% 22.3% 17.9% *
General Mathematics 531 4.6% 11.3% 13.7% 15.3%General Mathematics 631 2.6% 7.0% 9.1% 10.3%General Mathematics 431 4.2% 6.4% 10.8% 10.3%
Geometry 521 19.6% 24.0% 33.0% 35.0%Accounting 621 18.1% 14.0% 17.5% 10.6%
Accounting 801 3.6% 9.9% 8.2% *
* Not Available

Expectations of High School Graduates4
Table 2 shows a comparison of language courses selected for the past four years. Academic Englishcourses remain highly popular because they are required courses in all PEI high schools. There aremore students enrolling in academic English compared to previous years, rather than advanced orgeneral English. The increases in students taking French immersion courses and the decreases instudents taking core French courses suggests that students are now deciding to take the Frenchimmersion stream instead of the core French courses.
Table 2: Students Taking Language Courses by Year
2002 2001 2000 1999English 421 97.9% 96.8% 81.9% 89.6%English 521 93.3% 89.6% 81.9% 85.7%English 621 90.1% 83.8% 77.2% 81.7%
Advanced English 611 2.0% 3.4% 3.6% *Advanced English 511 1.7% 2.0% 2.4% *
General English 631 4.3% 10.9% 12.2% 12.1%General English 531 3.7% 8.0% 9.7% 10.5%General English 431 3.0% 4.8% 7.7% 7.9%
French 421 36.7% 42.1% 35.0% 32.1%French 521 18.3% 20.5% 15.7% 14.4%French 621 8.2% 17.2% 7.2% 8.1%
French Immersion 421 23.1% 14.8% 18.2% 21.0%French Immersion 521 21.9% 13.1% 16.3% 18.5%French Immersion 621 20.5% 11.0% 15.2% 15.6%
Writing 521 36.4% 35.6% 27.0% *
Media 531 3.4% 8.0% 9.7% *

Expectations of High School Graduates5
A comparison of science courses taken in the past four years has been presented in Table 3. Biology521 and Chemistry 521 are the most popular science courses and have similar enrolment. Physics stillremains well behind the other two science courses by enrolment percentage. It appears more studentsare choosing the academic route with increases for most of the science courses at this level. In return,there are fewer students enrolling in the advanced and general categories. In the advanced category,chemistry still remains the more popular choice.
Table 3: Students Taking Science Courses by Year
2002 2001 2000 1999Chemistry 521 64.2% 61.7% 51.3% 77.3%Biology 521 61.8% 60.1% 52.8% 81.3%Physics 521 41.5% 40.7% 41.0% 45.7%
Chemistry 621 44.9% 47.2% 42.9% 46.3%Biology 621 48.4% 47.0% 43.2% 46.6%Physics 621 34.1% 32.1% 35.3% 30.4%
Advanced Chemistry 511 5.2% 6.4% 9.9% *Advanced Chemistry 611 4.1% 3.5% 7.1% *Advanced Biology 511 3.6% 2.4% 4.6% *Advanced Biology 611 3.4% 2.3% 3.5% *
General Science 431 2.0% 4.1% 9.1% 24.6%General Biology 631 1.1% 2.4% 3.3% *
Science 421 83.2% 90.9% 83.3% *Agriscience 801 19.9% 15.6% 21.7% 22.7%Oceanography 621 5.4% 9.0% 11.7% *Conservation 701 2.8% 8.5% 4.6% 3.9%Animal Science 801 0.7% 3.8% 2.9% *
Animal Science 621 1.5% 3.4% 5.2% *

Expectations of High School Graduates6
Table 4 takes a look at the social studies course selection for the past four years. History was favouredover geography for the four years. History enrolment numbers have increased at all grade levels withmore students taking geography in grades 10 and 12 compared to last year. PEI History has seen amajor drop in enrolment.
Table 4: Students Taking Social Studies Courses by Year
2002 2001 2000 1999History 421 44.8% 40.3% 36.4% 42.9%History 621 33.5% 27.7% 35.4% 32.6%History 521 22.1% 21.0% 12.5% 22.5%PEI History 621 2.1% 11.5% * *
Geography 421 38.6% 32.9% 37.0% 34.1%Geography 521 17.5% 21.8% 10.1% 17.7%Geography 621 12.4% 7.6% 4.5% 6.3%
Canadian Law 521 48.1% 41.8% 42.9% *Economics 621 24.9% 25.1% 19.0% 25.0%Politics 521 4.1% 10.1% 5.3% 9.2%Politics 621 5.9% 9.4% 8.1% 8.5%Canadian Studies 401 0.0% 0.3% * *
General Geography 531 1.0% 2.8% 6.8% *General Geography 431 0.7% 1.4% 4.8% *General Geography 631 1.0% 1.1% 2.3% *
General History 631 0.6% 1.8% 1.4% *General History 431 1.1% 1.1% 3.5% *General History 531 0.2% 0.2% 0.0% *
General Canadian Law 531 1.5% 2.1% 6.0% *
General Canadian Studies 431 1.1% 0.1% * *

Expectations of High School Graduates7
In Table 5, a comparison of enrolment percentages for 20 of the most popular elective courses taken inIsland schools is presented (see Appendix C for a complete list of course selections). The table revealsthat there is a decline in numbers for quite a few courses when compared to the previous years. One ofthe main reasons for this could be the fact that there’s a different variety of elective courses beingoffered in each school in order to meet the students’ needs. Trade-specific courses such as motorvehicle repair and carpentry show a continuing decline in popularity. Computer-related courses remainthe most popular. This is not a surprise as computers are being used more and more in almost allcareers. Unlike the mandatory courses, these courses are electives, which means they are left totally upto the students to decide whether they want to take them or not. The general purpose of each course isto provide students with opportunities to explore the world of work and to have students developintroductory skills associated with specific careers. These electives have become very important tomany students in helping them make career decisions.
Table 5: Students Taking Career Exploration Courses by Year
2002 2001 2000 1999Typing 701 53.7% 45.9% 44.4% 44.2%
Computer Literacy 421 37.6% 38.7% 47.3% 44.4%Foods & Nutrition 421 5.6% 10.4% 7.8% 8.6%Advanced Keyboarding 801 3.2% 7.8% 11.6% 12.1%Visual Communications 701 3.1% 7.4% 3.0% 5.6%Welding 705 4.6% 7.1% 6.9% 6.1%Motor Vehicle Repair 704 5.2% 7.1% 9.7% 10.8%Housing 621 2.9% 6.2% 7.0% 6.2%Child Development 521 2.5% 6.1% 6.2% *Graphic Arts 701 3.4% 5.5% 4.9% *Carpentry 701 4.3% 4.6% 9.7% 11.9%Theatre Arts 701 1.1% 4.4% 0.0% 3.4%Woodworking Fundamentals 705 1.1% 3.9% 8.2% 10.3%Clothing 521 2.3% 3.9% 3.5% 1.3%Photography 801 0.0% 3.8% 6.5% 9.0%Hospitality/Tourism 801 5.0% 3.6% 5.5% 6.8%Crafts 701 2.2% 3.0% 1.9% 2.9%Drafting 701 1.1% 2.8% 4.0% 4.4%Power Mechanics 705 1.5% 2.8% 3.5% 3.8%Cosmetology 701 0.8% 2.3% 1.5% 2.4%
Child Care 704 3.0% 2.1% 1.2% 4.8%

Expectations of High School Graduates8
Academic courses are the overwhelming choice by Anglophone students. When compared to the lasttwo year’s percentages, there is an increase in students enrolling in academic classes. On the otherhand, there has been a decrease in advanced, general and practical courses being taken. It would appearthat more students are taking the traditional academic education. It is encouraging to see more studentstake an academic route versus general or practical. However, the drops in advanced courses maysuggest that fewer students feel they have the ability to successfully complete these courses or the risk intaking these courses outweighs the preparation they offer.
Note: Course Coding SystemAll courses are coded with a three-digit number. The second number refers to the course category.
0 = Open (academic unless stated advanced course)1 = Enriched or advanced2 = Academic3 = General5 = Practical
(e.g., English 421, Academic)

Expectations of High School Graduates9
Francophone Course SelectionThe following three tables show the percentage of courses taken by the 42 Francophone studentscompared to previous years for each grade. It is hard to see any trends in the data results as only42 students participated in the survey. Percentages for a few classes seem to be dropping but this islikely due to some new course offerings. Biology continues to be a very popular choice with bigincreases since 1999 and with continued growth at the Grade 12 level.
Table 6: Students Taking Grade 10 Courses by Year
% EnrolledGrade 10 Courses 2002 2001 2000 1999MAT 421 - Mathematiques 92.9% 100.0% 94.1% 90.9%EDP 421 - Education Physique 92.9% 90.0% 91.2% 77.3%HIS 421 - Histoire 52.4% 90.0% 85.3% 50.0%ANG 421 - Anglais 83.3% 85.0% 97.1% 86.4%FRA 421 - Francais l 100.0% 85.0% 97.1% 40.9%SCI 421 - Sciences Integrees 73.8% 65.0% 70.6% 22.7%INF 421 - L’informatique 54.8% 60.0% 70.6% 77.3%FRA 421 - Francais ll 95.2% 35.0% 94.1% 31.8%MUS 421 - Musiques 16.7% 25.0% 23.5% 4.5%
DRO 421 - Droit 0.0% 10.0% * *
Table 7: Students Taking Grade 11 Courses by Year
% EnrolledGrade 11 Courses 2002 2001 2000 1999MAT 521 - Mathematiques 95.2% 100.0% 94.1% 90.9%FRA 521 - Francais 97.6% 80.0% 94.7% 86.4%BIO 521 - Biologie 90.5% 80.0% 82.4% 31.8%CHI 521 - Chimie 88.1% 60.0% 94.0% 81.8%PHY 521 - Physique 81.0% 55.0% 100.0% 63.6%EDP 821 - Education Physique 26.2% 50.0% 44.2% 36.4%WRT 521 - Ecriture 52.4% 45.0% 79.4% 77.3%ANG 521 - Anglais 38.1% 35.0% 29.4% 31.8%HIS 521 - Histoire 81.0% 15.0%DRO 521 - Droit 2.4% 10.0% 64.7% 68.2%TEC 801 - Etudes De Technologie 0.0% 10.0% * *

Expectations of High School Graduates10
Table 8: Students Taking Grade 12 Courses by Year
% EnrolledGrade 12 Courses 2002 2001 2000 1999MAT 621 - Mathematiques 92.9% 100.0% 91.1% 95.5%ANG 621 - Anglais 90.5% 85.0% 100.0% 95.5%FRA 621 - Francais 95.2% 85.0% 97.0% 81.8%VHM 621 - Valeurs Humaines 0.0% 80.0% 97.1% 22.7%BIO 621 - Biologie 78.6% 80.0% 73.5% 63.6%CHI 621 - Chimie 57.1% 65.0% 82.3% 77.3%INF 621 - Linformatique 33.3% 55.0% 76.5% 54.5%HIS 621 - Histoire 53.2% 50.0% 35.3% *SOC 621 - Individue En Societe 42.8% 45.0% 64.7% 13.6%PHY 621 - Physique 42.9% 30.0% 55.9% 63.6%ORD 621 - Ordinateur 0.0% 30.0% * *MAT 611 - Avance Mathematiques 47.6% 15.0% * *
AFF 621 - Comptabilite 40.5% 15.0% 23.5% 36.4%
ECO 621 - Economie 33.3% 15.0% 11.7% 27.3%
New Course InterestsIn this year’s survey, students were also asked: “What course would you like to see offered at your highschool that is not presently offered?” Of the suggestions made by students, the most popular courseswere psychology, electronics, cosmetology and photography. These courses are now available at a fewPEI high schools but most schools are not offering them. Psychology was the course most oftensuggested, however, it is only offered at Colonel Gray Senior High School. Of the 209 students whocompleted the survey from Colonel Gray Senior High School, 49 (23.4 per cent) of them enrolled in thiscourse (see Appendix C).

Expectations of High School Graduates11
Factors Influencing Course SelectionThe factors which appear to have the most influence on high school course selection are: personalinterest chosen by 75.8 per cent (981), ability 42.3 per cent (547) and choice of career 35.9 per cent(464). From Figure 6 we can see that these three influences are having even more impact each year. Students seem to be putting more emphasis on their course selection by taking courses they have interestin and that will help them in their choice of career. It appears that more students are making their owndecisions rather than basing their decisions on the opinions of others. The effect of career days andschool counsellors on course selection is declining.

Expectations of High School Graduates12
Factors Influencing Career SelectionProminent factors appearing in student responses as having the most influence on choosing a job or acareer are very similar to those in making course selections. The results are personal interest at 77.4 percent (1,001), ability 59.3 per cent (767) and marks 27.6 per cent (358). The majority of students areseeking assistance from school counsellors but less are finding them to be an influence on their careerchoices (see Figure 7). Students appear to already have a career in mind and then seek guidance to helpthem achieve this career. School counsellors are now dealing more and more with social issues(behavioural, family, etc.) and less with course selection and career selection. The effect of career daysis also lessening.
Expectations of High School Graduates13
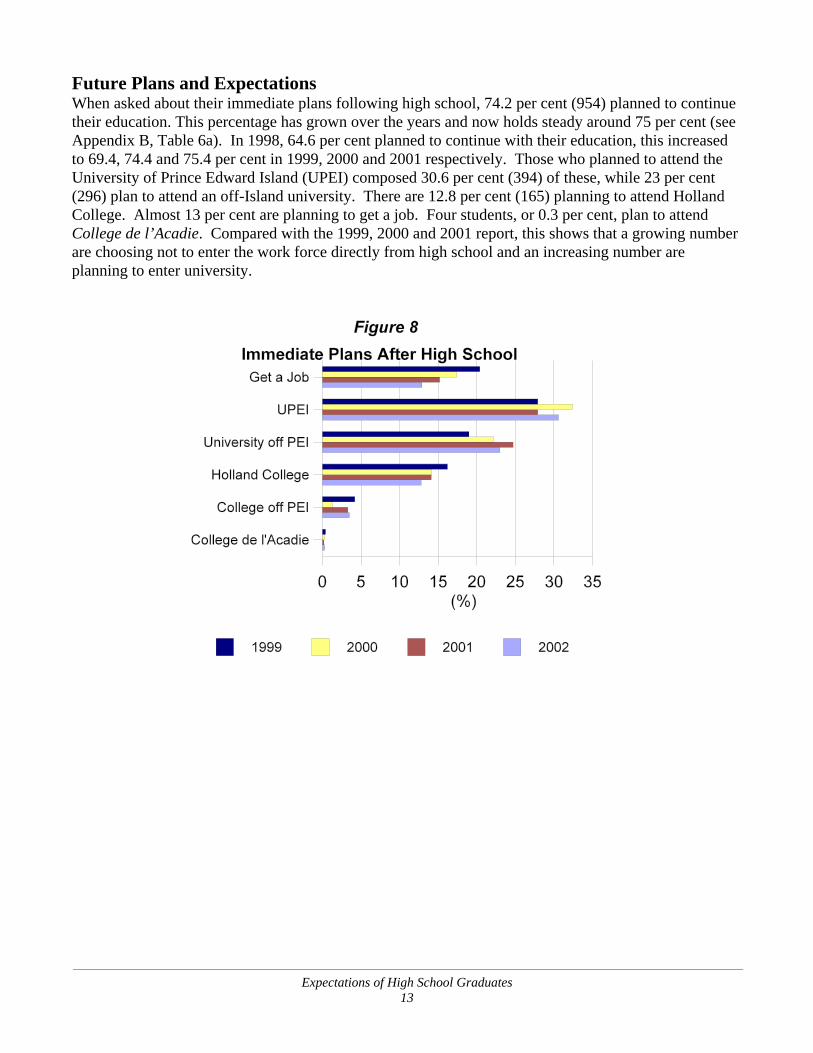
Future Plans and ExpectationsWhen asked about their immediate plans following high school, 74.2 per cent (954) planned to continuetheir education. This percentage has grown over the years and now holds steady around 75 per cent (seeAppendix B, Table 6a). In 1998, 64.6 per cent planned to continue with their education, this increasedto 69.4, 74.4 and 75.4 per cent in 1999, 2000 and 2001 respectively. Those who planned to attend theUniversity of Prince Edward Island (UPEI) composed 30.6 per cent (394) of these, while 23 per cent(296) plan to attend an off-Island university. There are 12.8 per cent (165) planning to attend HollandCollege. Almost 13 per cent are planning to get a job. Four students, or 0.3 per cent, plan to attendCollege de l’Acadie. Compared with the 1999, 2000 and 2001 report, this shows that a growing numberare choosing not to enter the work force directly from high school and an increasing number areplanning to enter university.

Expectations of High School Graduates14
When looking at the immediate plans of students by sex, more females are planning to attend university,while more males plan to start work or attend college (see Figure 9). The survey shows that 59.7 percent of females are planning to attend university; while for the males, 47.2 per cent plan to attend. Atable of Francophone students’ immediate plans after high school is presented in Appendix B, Table 6cand displays that university is their most popular choice with 48.9 per cent (24) choosing to go on touniversity.
The percentage of students who planned to work immediately after high school is 12.9 per cent (166)down from 15.2 per cent last year.

Expectations of High School Graduates15
When asked, “What do you think you will be doing five years after you leave high school?” 34.1 percent (436) of the students indicated that they plan to be working in the paid labour force, 36.8 per cent(471) answered they will still be studying, and 24 per cent (307) were unsure (see Figure 10). A modest0.7 per cent (nine) of the students plan to be working as a full-time homemaker five years out of highschool. The clearest trend indicated by this figure is the increase in those planning to still be studying.
The majority of the students (65.1 per cent or 801 students) plan to work in the paid labour force formore than 20 years, 16.6 per cent (204) for 11 to 20 years, 6.8 per cent (84) for five to 10 years, 10.2 percent (125) for less than five years, and 1.4 per cent (17) do not plan on working. This means that 35 percent of students do not plan on working in the paid labour force for more than 20 years.
When students were asked, “What type of job will you be looking for?” the most frequent responseswere, teacher 10.7 per cent (138), business owner or manager 4.9 per cent (63), doctor 4.0 per cent (52),nurse 2.8 per cent (36) and computer technology related jobs 3.2 per cent (42). All jobs that did nothave a significant amount were categorized as other which recorded 13.2 per cent (171). The othercategory includes professions such as athletic trainer, professional athlete, or recreation coordinator. Acomplete list of the jobs reported for the past four years is presented in Appendix B, Table 15. The tableshows several trends forming. Over the four years, there has been a continuing decrease in studentslooking to become accountants. There is an increase in students looking to become farmers. Teacherwas the most frequent response in all four years.

2 Expectations and Outcomes, PEI Department of Education, 2001.
3 Prince Edward Island Young Adult Research, Baker Consulting Inc., December 2001.
4 Expectations and Outcomes, PEI Department of Education, 2001.
Expectations of High School Graduates16
Table 9 displays the percentage as well as the number of students from each school who plan to attenduniversity after finishing high school. Of the 1,294 students who answered the question, 690 (53.6 per cent)said they planned to attend university. École François-Buote School had the highest percentage (10 of the13 students said they plan to attend university). Souris Regional High School had the lowest percentagewith 24 of the 74 reporting they plan to attend a university. In the 2000 Expectations and Outcomes reportit was reported that the rates by which students went directly from high school to the University of PrinceEdward Island were strongly related to the distance between the University of Prince Edward Island campusand the high school. It was estimated that each 10 kilometre distance is accompanied by a decline of 2.9 percent in the rate by which students transfer directly from high school to the University of Prince EdwardIsland. Those high schools with the lower rates of transition to the University of Prince Edward Islandgenerally had higher rates of transition of students to universities out of province2.
Table 9: Students Planning to Attend University by School
AttendUPEI
OtherUniv. Total Univ. Total
Resp.School # % # % # % #Grace Christian 6 50.0 3 25.0 9 75.0 12Morell 16 47.1 2 5.9 18 52.9 34Colonel Gray 88 42.1 51 24.4 139 66.5 209Francois Buote 2 15.4 8 61.5 10 76.9 13Kensington 13 20.6 23 36.5 36 57.1 63Kinkora 14 31.1 11 24.4 25 55.6 45Three Oaks 40 22.1 48 26.5 88 48.6 181Charlottetown Rural 74 42.5 39 22.4 113 64.9 174Évangeline 2 6.9 12 41.4 14 48.3 29Bluefield 67 46.9 28 19.6 95 66.4 143Souris 13 17.6 11 14.9 24 32.4 74Montague 20 14.7 30 22.1 50 36.8 136Westisle 39 22.5 30 17.3 69 39.9 173Average 29.2 26.3 55.5 1,307
It is interesting to note that the 2000 report stated 32.4 per cent of students were planning to attend theUniversity of Prince Edward Island; in a follow up survey it was reported that 33.3 per cent actually didattend the University of Prince Edward Island3. As well, the 1998 survey reported that 28.9 per centplanned to attend the University of Prince Edward Island with 25.6 per cent actually enrolled at theUniversity of Prince Edward Island4. This reveals that the educational expectations of the respondents isindeed a very good prediction of the actual outcomes.

5 Maritime Provinces Higher Education Commission, February 2002.
6 Maritime Provinces Higher Education Commission, February 2002.
Expectations of High School Graduates17
In 2001-2002, of the 3,336 PEI residents enrolled as full-time students at the university level in theMaritimes, 63.8 per cent (2,130) attended the University of Prince Edward Island. Of the 690 studentsin the 2002 survey who said they plan to attend university, 57.1 per cent of them said the University ofPrince Edward Island would be their choice. The other Maritime universities with the highest enrolmentnumbers of Prince Edward Island residents were Dalhousie University with 9.1 per cent (305);University of New Brunswick, 6.9 per cent (230), and Mount Allison University at 4.4 per cent (147)5.
In 2001, there were 621 students, aged 18 or under, who enrolled in a Maritime university and were aresident of Prince Edward Island. This was used as the estimate of students that went directly from highschool to university. Of the 621 students, 383 (61.7 per cent) of them enrolled at the University ofPrince Edward Island6. This 2002 report shows that of the students planning to attend university, 394(57.1 per cent) of them plan to attend the University of Prince Edward Island.
Choice of ProgramsThere were 311 students who responded to the question, “What program do you plan to take at atechnical school or community college?” The results showed that there is no overwhelming choice for aprogram as the results varied across most of the courses. The top choices also seem to be genderoriented with either the male or female dominating the program. Of these responses, 16 chose computerengineer, 13 chose automotive technology, and 12 selected early childhood care and education (seeAppendix B, Table 7).

Expectations of High School Graduates18
A comparison of program selections for the past four years shows that the expectations for collegeprograms is very uncertain. The seven programs shown below seem to be the most consistent choices,but percentages change from year to year. Figure 12 displays a decrease in nursing assistant, businessadministration, and tourism percentages, and an increase in students planning to take an accountingprogram compared to last year.
There were 671 students who responded to the question, “At university, what will be your major area ofstudy?” Of the respondents, 193 chose arts and sciences, 106 chose business/commerce, 77 chose healthprofessions, 46 chose engineering, and 56 selected education (see Appendix B, Table 8).
Expectations of High School Graduates19
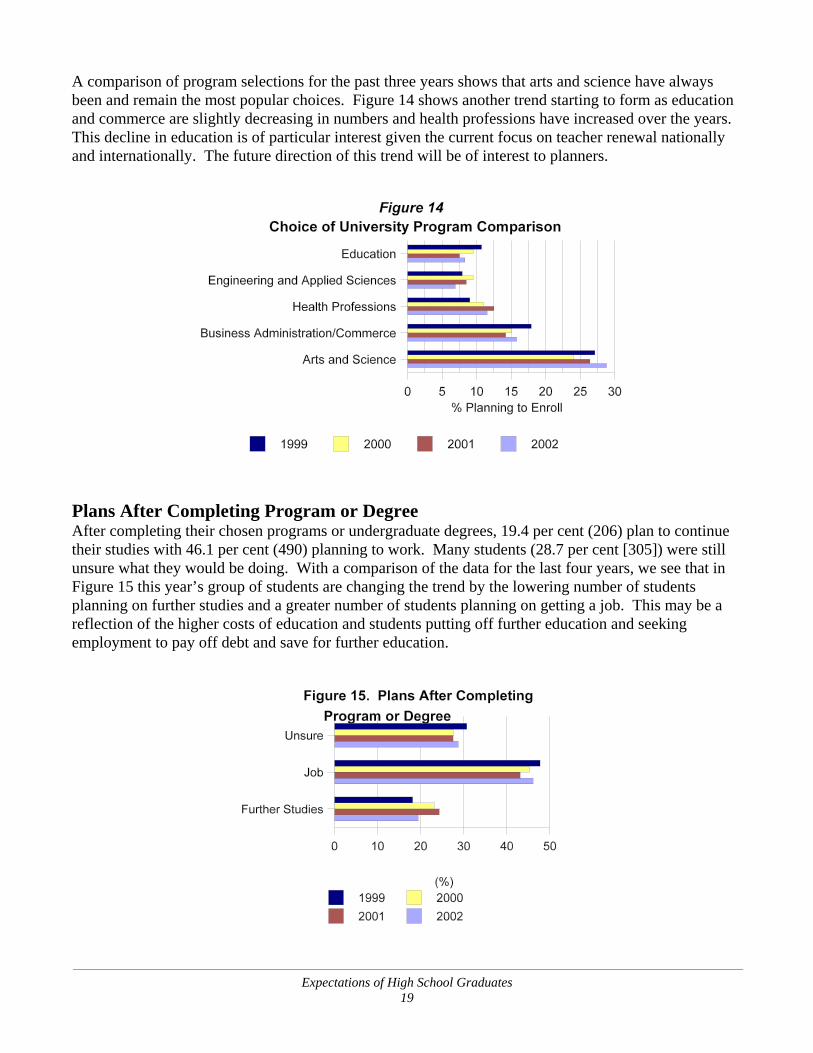
A comparison of program selections for the past three years shows that arts and science have alwaysbeen and remain the most popular choices. Figure 14 shows another trend starting to form as educationand commerce are slightly decreasing in numbers and health professions have increased over the years. This decline in education is of particular interest given the current focus on teacher renewal nationallyand internationally. The future direction of this trend will be of interest to planners.
Plans After Completing Program or DegreeAfter completing their chosen programs or undergraduate degrees, 19.4 per cent (206) plan to continuetheir studies with 46.1 per cent (490) planning to work. Many students (28.7 per cent [305]) were stillunsure what they would be doing. With a comparison of the data for the last four years, we see that inFigure 15 this year’s group of students are changing the trend by the lowering number of studentsplanning on further studies and a greater number of students planning on getting a job. This may be areflection of the higher costs of education and students putting off further education and seekingemployment to pay off debt and save for further education.

Expectations of High School Graduates20
Expected Mobility and Location of ResidenceWhen students were asked if they plan to live on Prince Edward Island on a permanent basis uponcompleting their education or training, 26.5 per cent (294) said yes while 25.1 per cent (279) said no. The remaining 48.4 per cent (538) were unsure. Figure 16 shows that when compared to the previousthree years, this years group of students have a higher percentage planning to stay on PEI. Of therespondents who answered no or unsure, 57.5 per cent (481) said they hope to return to PEI at a futuretime.
Of the students who plan to work after completing their first program or degree, 56.5 per cent (277) planto get a job on PEI. The other 43.5 per cent (213) are looking to get a job off-Island.
The uncertainty to live on PEI permanently is related to the expectancy of available work in their chosenfield. Many were hesitant when asked, “Do you expect to find work in your chosen occupation onPEI?” as 39.4 per cent (495) were unsure, 17.5 per cent (220) said no, while 43.1 per cent (541)answered yes (see table 13, Appendix B). The per cent that expect to find work in their chosenoccupation on PEI has continued to rise over the years from 35.6 per cent to 36 per cent to 41.1 per centin 1999, 2000 and 2001 respectively. Of the students that did not expect to find work for their chosenoccupation in PEI, almost all of them plan to be working off-Island after high school or after finishingtheir degrees. Of the students who plan to attend university and who do not expect to find a job for theirchosen occupation in the province, 70.1 per cent plan to enrol in university off-Island. Of the studentswho believe they will find a job on PEI, 66.4 per cent plan to attend the University of Prince EdwardIsland rather than other universities. This suggests a strong relationship between university of choiceand residence plans after completing university.

Expectations of High School Graduates21
When comparing those who plan to further their education with their residence plans after they finishtheir program or degree, there is a relationship (see Table 10). Of those who hope to enrol in university,college, or a program on-Island, more plan to get a job on-Island after they finish their program. Forthose who further their education off-Island, more are likely to expect finding work off-Island. Itappears that once students leave the Island for educational purposes most do not plan to return.
Table 10: Plans After Finishing Program or Degree
After Finishing Program or DegreePlans After High School Job on-PEI % Job off-PEI %UPEI 108 65.1 58 34.9Other universities 37 33.6 73 66.4Holland College and local technical programs 81 77.9 23 22.1Community college off-Island 10 33.3 20 66.7
Table 11 displays the expected residence of students by the educational level they plan to achieve. Students who plan to work immediately after finishing high school are more apt to live on PEI. But, as displayed in the table, the higher the education a student attains the more likely they are to resideoff-PEI. Those who achieve graduate degrees or advanced diplomas are much more likely to plan onresiding off-PEI.
Table 11: Residence After Finishing Education
ResidenceEducation Level On-PEI % Off-PEI %High School 135 77.6 39 22.4College/Private Training 86 62.8 51 37.2University (First Degree) 121 55.0 99 45.0Advanced Degree or Diploma 38 35.8 68 64.2

Expectations of High School Graduates22
Career Plans and ConfidenceA large number of the respondents (86.5 per cent or 1,105) were confident in their ability to achievetheir job or career plans compared to 1.1 per cent (14) who were less optimistic and 12.4 per cent (159)who were unsure if they would be successful. Of the 14 students who did not think they would be ableto achieve their goals, 57 per cent were male. There are 11.8 per cent of males who were unsure, while13 per cent of females said they were unsure (see Figure 18).
Reasons stated by those who do not believe or are unsure they will achieve their career goals include,unsatisfactory grades, hard to find jobs here and financial issues. When students were asked, “Whatsingle factor would best help you achieve your job or career goals?” 1,255 provided responses. Themost frequent responses are presented in Table 12. Of the students who said money, most wereplanning to attend university. Money and hard work were the top choices for males, while femalessuggested education as the most important factor to help them achieve their goals. These responses arein line with the larger proportion of females expecting to attend university. The other category consistsof all suggestions that could not be categorized into groups that would consist of any substantial amount.
Table 12: The Factor That Would Help You Achieve Your Goals
Factors Male Female TotalMoney 149 110 259Education 120 179 299Hard Work 140 122 262Determination 59 95 154Experience 69 57 126Motivation 45 41 86Other 28 22 50Total 620 635 1,255

Expectations of High School Graduates23
When asked if they considered establishing their own business, 34 per cent (433) said they hadconsidered it. Results for this question vary by gender. Of those who have considered establishing theirown business, 58.4 per cent (253) are male while 41.6 per cent (180) are female. Figure 19demonstrates a slight but steady decline in males thinking about starting their own business. Of thestudents who have considered starting their own business, the most popular choices for a business weresalon, bar, restaurant, computer and electronics and clothing.

Expectations of High School Graduates24
Careers in The TradesThe survey respondents were asked if they planned to register as an apprentice. Only 113 of the1,294 students who answered the question indicated they had any plans to become an apprentice and106 of these were male. There were 103 out of 1,306 students who planned to register as an apprenticein the 2001 survey. This number remains steady and suggests that the apprenticeship trades and trainingcontinue to be a less popular training and career path to youth. It is likely that these choices will showup as shortages in skilled trade persons on PEI in the future. As well, already existing shortages will beexacerbated.
The most popular apprenticeship areas as selected by the students are carpenter, automotive service,welder, vehicle body repair, and industrial electrician (see Appendix B, Table 12 b for a complete list). Female students seem to have a more difficult time identifying with the apprenticeship trades with onlyseven survey respondents planning to register. Cook was the most popular choice for females.
The survey shows that apprenticeship is generally a less popular career option to students and this isespecially true for female students. While 16.7 per cent of the male respondents indicated an interest inapprenticeship, only 1.1 per cent of female students indicated an interest in this field.

Expectations of High School Graduates25
School Guidance ServicesSince entering high school, 60.8 per cent (781) of the students have made use of the guidance servicesavailable to them in making their course selections. Fewer students (54.5 per cent or 696 students)chose to seek assistance from the school counsellors when planning their careers. There were 68.2 percent (883) of the students who met with a school counsellor at least once. With 46 per cent (594) of thestudents meeting with a school counsellor for help both with their courses and career. There were398 students who said they had never met with a school counsellor.
A cross-tabulation of the students’ immediate plans after high school and whether they chose to seekassistance from the school counsellors in planning their career was performed. The results indicate thatthe students who chose to seek assistance in planning their career are more likely in planning to attend apost-secondary institution and even more likely on planning to attend university.
A cross-tabulation for immediate plans after high school and whether students chose to seek assistancefrom the school counsellors for help choosing their courses shows that even higher proportions ofstudents, who received help with choosing their courses, planned to further their education. It appearsthat when planning to further your studies, course selection in high school is a very big decision andrequires assistance. Of the students who planned to enter the work force immediately, most did not seekassistance in choosing their courses.
In the survey, 35.8 per cent (458) of students answered yes to meeting with a labour market outreachworker. Just under half (47.3 per cent or 604) of the students participated in the Choices CareerPlanning Program. Of those who did use the program, 72 per cent (422) found it to be helpful and28 per cent (164) found it to be not at all helpful. When comparing these results to the data from theprevious three years, a growing number of students are finding the program to be of help.

7 Education Indicators for Atlantic Canada, Atlantic Provinces EducationFoundation, 1996.
8 Moving On, British Columbia Ministry of Education, 1997.
Expectations of High School Graduates26
Conclusion
The results of this year’s Expectations of High School Graduates are once again promising. An assuring71.7 per cent of Island graduates plan to further their post-secondary education immediately followinghigh school graduation. The expectation of pursuing post-secondary education continues to be highamong Prince Edward Island high school graduates.
This year’s results indicate that young women are more likely than young men to attend post-secondaryinstitutions as 77.1 per cent of female high school students plan to further their education, compared to66.2 per cent of males.
According to Education Indicators for Atlantic Canada 1996, the percentage of high school graduateswho enter university immediately following graduation was 42 per cent for females and 29 per cent formales in 1993-947. Expectations for enrolment at university has continued to rise since then. There are59.7 per cent of females who are planning to attend university; while for males, 47.2 per cent plan toattend.
Research conducted by the British Columbia Ministry of Education, found four categories of barriers tothe transition from secondary to post-secondary education8. The barriers identified are information,finance, personal and programs. The most significant of these barriers are information and finance asthey affect the greatest number of students.
Some short-term recommendations suggested by the Moving On report to reduce information barriersare: to provide information about post-secondary opportunities, labour market, and career options; toenhance financial planning for post-secondary education; and to provide information on the articulationand transfer of credit of possibilities of courses and programs within the post-secondary educationsystem.
The barriers identified above are similar to those identified by students in PEI. When students wereasked, “What single factor would best help you achieve your job or career goals?” the most frequentresponse was money. Financial issues are a general concern as tuition continues to rise and the numberof students seeking financial assistance continues to increase. Other factors that students suggestedwere, education, hard work and determination. Improvements in methods of communication to provideinformation to students about career options and the labour market would lead to better educated andinformed decision-making by students.
Other results of the survey indicate that male students remain more likely than female students toestablish their own businesses. It would be useful to further explore this statistic in order to identifypossible barriers which women perceive in becoming entrepreneurs.

Expectations of High School Graduates27
The 2002 survey has found that there is an increasing number of students planning to enrol at theUniversity of Prince Edward Island. The students who plan on going away for university seem to beless optimistic in returning to PEI for employment or to live permanently. Of the students who plan toenrol in university and who do not expect to find a job on PEI, 60 per cent plan to enrol in universityoff-Island. Students who expect to further their education off-Island plan to find a job off-Island afterthey graduate.
When comparing the percentage of students who plan to attend university by school, École FrançoisBuote had the highest percentage (10 of the 13 students said they plan to attend university). SourisRegional High School had the lowest percentage with 24 of the 74 reporting they plan to attend auniversity. It appears that the greater the distance from where students live and the University of PrinceEdward Island campus, the less likely they are to attend. The schools closest to the University of PrinceEdward Island, like Charlottetown Rural, Colonel Gray and Bluefield had the highest percentages ofstudents planning to enrol at the University of Prince Edward Island. This is probably linked toeconomic factors as students are able to live at home while attending university.
The research to this point has been positive. Further study into the plans and expectations of our Islandgraduates will continue to be helpful in assisting decision makers to become more responsive to theneeds of our high school students as they prepare for transition from secondary education to either post-secondary education or the world of work.

Expectations of High School Graduates28
References
Atlantic Provinces Education Foundation. Education Indicators for Atlantic Canada, 1996, Halifax,Nova Scotia.
Baker Consulting Inc. Prince Edward Island Young Adult Research, December 2001. Prepared forHolland College, Charlottetown, Prince Edward Island.
Government of British Columbia. Moving On: Secondary to Post-Secondary Transition, 1997, Ministryof Education, Skills and Training.
Maritime Provinces Higher Education Commission, February 2002.
Prince Edward Island Department of Education. Encouraging Island Graduates to Return/RemainHome1998: Report #1. Continuing Education and Training, Charlottetown, Prince Edward Island.
Prince Edward Island Department of Education. Encouraging Island Graduates to Return/RemainHome1999: Report #2. Continuing Education and Training, Charlottetown, Prince Edward Island.
Prince Edward Island Department of Education. Encouraging Island Graduates to Return/Remain Home2000: Report #3. Continuing Education and Training, Charlottetown, Prince Edward Island.
Prince Edward Island Department of Education. Preparation and Expectations: A Survey of IslandGrade 12 Students - 2001 Report No. 4, Charlottetown, Prince Edward Island.
Prince Edward Island Department of Education. Expectations and Outcomes: A Follow-up to the April1998 Survey of PEI Grade 12 Students, 2001, Continuing Education and Training.
Prince Edward Island Department of Education. Grade 12 Graduate List, June 2002.
Statistics Canada and Human Resource Development Canada. Youth in Transition Survey, 2000.

Expectations of High School Graduates29
Appendix A
Questions for Grade 12 Senior High StudentsPERSONAL INFORMATION WILL BE KEPT IN STRICT CONFIDENCE
Last Name: (Please Print) First Name & Initials:
Address:
Postal Code:
Home Telephone Permanent Contact Number(s) (Grandparents, etc., forpossible later follow-up survey)
E-mail address: (Write in “None” if no e-mail address)
BACKGROUND INFORMATION:
1. Which high school are you attending?9 Bluefield9 Charlottetown Rural9 Colonel Gray9 Grace Christian
9 Kensington9 Kinkora9 Montague9 Morell
9 Souris9 Three Oaks9 Westisle
2. Sex:9 Female 9 Male
3. With whom do you live most of the time? (Check only one)9 Mother/Female Guardian9 Father/Male Guardian9 Both Parents/Guardians9 Other (Please specify): ______
4. How long have you been a resident of PEI?

Expectations of High School Graduates30
9 Less than 5 years9 6 - 10 years
9 10 years or more
HIGH SCHOOL COURSE SELECTION
5. From the list below, please check all courses taken in grades 10, 11 & 12. Grade
10 11 12 Accounting 621 9 9 9Advanced Calculus 611 9 9 9 Agriscience 801 9 9 9Biology 521 9 9 9Biology 621 9 9 9Canadian Law 521 9 9 9Chemistry 521 9 9 9 Chemistry 621 9 9 9Computer Literacy 421 9 9 9Computer Literacy 521 9 9 9Computer Literacy 621 9 9 9Economics 621 9 9 9English 421 9 9 9English 521 9 9 9English 621 9 9 9Family Life 421 9 9 9 French (Core) 421 9 9 9French (Core) 521 9 9 9French (Core) 621 9 9 9French Immersion 421 9 9 9
Grade10 11 12
French Immersion 521 9 9 9French Immersion 621 9 9 9Geography 421 9 9 9Geography 521 9 9 9Geography 621 9 9 9Geometry 521 9 9 9History 421 9 9 9History 521 9 9 9History 621 9 9 9Math 421 9 9 9Math 521 9 9 9Math 621 9 9 9Physical Education 401 9 9 9Phys. Ed. (Life Style) 801 9 9 9Phys. Ed. (Leadership) 621 9 9 9Physics 521 9 9 9Physics 621 9 9 9Science 421 9 9 9Typing 701 9 9 9Writing 521 9 9 9

Expectations of High School Graduates31
Using course codes, (eg. ACC621A, ENG631A, MUS421A) please list below all the courses youhave taken in grades 10, 11 & 12 that were not presented in the list above. Please include allcareer exploration training courses and pre-vocational-technical courses.
Grade 10 Grade 11 Grade 12
6. What pre-vocational-technical course would you like to have offered at your high school that isnot presently offered?________________________________________________________________________
________________________________________________________________________
PERSONAL EXPECTATIONS AFTER HIGH SCHOOL
7. After High School, what are your immediate plans? (Check only one)9 To get a job (Skip to question 11) 9 To go to UPEI (Skip to question 9)9 To go to university off-Island (Skip to question 9)9 To go to Holland College on PEI9 To go to technical school/community college off-Island9 To go to Collège de l’Acadie9 To go to Compu College School of Business9 Other private training school on PEI (Please Specify):_____________________9 Upgrade high school9 Unsure9 Other (Please specify): _______________________________________________

Expectations of High School Graduates32
8. If you indicated in question 7 that you plan to attend a community college, technical college orprivate school training, what program do you plan to take? (Check only one)
9 Accounting Technology9 Administrative Assistant9 Aircraft Maintenance Technology9 Aquaculture Technology9 Architectural Technology9 Auto Body Repair9 Automotive Technology9 Business Administration9 Business Information SystemsDevelopment9 Business Information Technology9 Cabinetmaking9 Call Centre & Customer Service Excellence9 Carpentry9 Child & Youth Care Worker9 Civil Technology9 College Preparatory Training9 Computer Engineering Technology9 Conservation Enforcement9 Construction Technology9 Correctional Officer9 Cosmetology9 Culinary Arts9 Deck Officer9 Dental Assisting9 Early Childhood Care & Education9 Electrical9 Electromechanical Technology9 Electronics Engineering Technology9 Entrepreneurship9 Environmental Technology9 Events & Conventions Management9 Executive Secretary9 Farm Machinery9 Golf Business Management9 Golf Club Management9 Heating, Ventilation & Air Conditioning
9 Hotel & Restaurant Management9 Human Resource Management9 Human Services9 Information Systems Technology9 Introductory Cooking9 Journalism9 Justice Preparatory Program9 Learning Management9 Legal Secretary9 Life Skills Coach Training9 Machinist9 Marine Engineering9 Medical Support Services9 The New Enterprise Store9 Nursing Assistant9 Paramedicine9 Pastry Arts9 Photography9 Plumbing 9 Police Science (Cadet)9 Power Engineering9 Private Policing & Assets Protection9 Recreation & Leisure Management9 Renewable Resource Technology9 Retail Sales & Marketing 9 Secretary9 Small Business Counselling Program9 Steamfitting/Pipefitting9 Tourism & Travel Management9 Tourism Marketing & Advertising9 Urban & Rural Planning Technology9 Visual Communications9 Welding 9 Welding Fabrication9 Other (Please specify):________________________________________________________________________

Expectations of High School Graduates33
9. If you indicated in question 7 that you plan to attend university, what will be your major areaof study? (Check only one)9 Agriculture & Biological Sciences9 Arts & Science - General9 Business Administration/Commerce9 Education9 Engineering & Applied Sciences9 Fine & Applied Arts9 Health Professions9 Humanities & Related9 Mathematical & Physical Sciences9 Social Sciences9 Other (Please specify)________________________________________________
OCCUPATIONAL PLANS OR FURTHER STUDY PLANS
10. What are your plans after completing your program or degree? (Check only one)9 To get a job on PEI9 To get a job off-Island9 Take further studies9 Unsure9 Other (Please specify): ______________________________________________
11. Do you plan to live on PEI on a permanent basis?9 Yes (Skip to question 13) 9 Unsure9 No
12. Do you hope to return to PEI at some future time?9 Yes 9 Unsure9 No
13. What type of job will you be looking for? (Wherever possible, please use at least two words todescribe your choice of job or occupation. i.e. - radio announcer or service attendant)________________________________________________________________________
________________________________________________________________________
Expectations of High School Graduates34
14. Do you plan to register as an apprentice? 9 Yes9 No (Skip to question 16)
15. If yes, please indicate in which of the following trades: (Check only one)9 Automotive Service Technician 9 Baker9 Bricklayer9 Cabinetmaker 9 Carpenter9 Construction Electrician9 Cook9 Farm Equipment Mechanic9 Heavy Duty Equipment Mechanic9 Industrial Electrician9 Industrial Mechanic-Millwright9 Machinist
9 Motor Vehicle Body Repair9 Oil Burner Mechanic9 Plumber9 Powerline Technician9 Production Equipment Mechanic 9 Refrigeration and Air ConditioningMechanic9 Service Station Mechanic9 Sheet Metal Worker9 Steamfitter-Pipefitter9 Truck and Transport Mechanic9 Welder
16. Do you expect to find work in your chosen occupation on PEI?9 Yes 9 Unsure9 No
17. Have you considered establishing your own business?9 Yes9 NoIf Yes, what type of business?________________________________________________________________________
________________________________________________________________________
18. Do you think that you will be able to achieve your job or career goals?9 Yes 9 Unsure9 NoIf “No” or “Unsure”, why?________________________________________________________________________
________________________________________________________________________

Expectations of High School Graduates35
19. What single factor would best help you achieve your job or career goals? (Check only one)9 Money9 A Post Secondary Education9 Hard Work9 Determination9 Success in the K-12 System
9 Experience9 Motivation9 Information on Careers9 Other (Please Specify)________________________________________________________________________
20. What do you think you will be doing five years after you leave high school?(Check only one)9 Working in the paid labour force9 Working as a full-time homemaker9 Still studying9 Unsure9 Other (Please specify): _____________________________________________
21. How long do you plan to work in the paid labour force? (Check only one)9 Less than 5 years9 5 - 10 years9 11 - 20 years9 More than 20 years9 I do not plan on working
HIGH SCHOOL GUIDANCE SERVICES
22. Since entering Grade 10, have you ever met with a School Counsellor . . .
a) - for help in choosing courses?9 Yes9 NoIf No, why not?_______________________________________________________________________________________________________________________
b) - for help in planning your career?9 Yes9 NoIf No, why not? ______________________________________________________________________________________________________________________

Expectations of High School Graduates36
23. Since entering Grade 10, have you ever met with a Labour Market Outreach Worker or aChoices Worker?9 Yes 9 No
24. Have you ever done the Choices Career Planning program in selecting an occupation orcareer?9 Yes 9 No (Skip to question 26)
25. How helpful did you find the Choices Career Planning Program in selecting an occupation orcareer? (Check only one)9 Very helpful9 Helpful9 Not at all helpfulIf you chose “Not at all helpful”, why not?_____________________________________
________________________________________________________________________
INFLUENCES ON COURSE SELECTION AND CAREER PLANNING
26. Listed are some of the factors that may have influenced you when you were choosing courses. Please check the ones that influenced you the most. (Check no more than 4)9 Ability 9 School Counsellor(s)9 Advertising 9 Marks9 Brother(s)/Sister(s) 9 Media (Books, TV, Movies)9 Career Day 9 Mother/Female Guardian9 Choice of Career 9 Personal Interest9 Easy Courses 9 Schedule/Timetable9 Father/Male Guardian 9 Teacher(s)9 Friends 9 Other (Please specify) _________________
____________________________________
27. Listed are some of the factors that may influence you when you are choosing a job or career. Please check the ones that influence you the most.(Check no more than 4)9 Ability 9 Marks9 Advertising 9 Media (Books, TV, Movies)9 Brother(s)/Sister(s) 9 Mother/Female Guardian9 Career Day 9 Personal Interest9 Easy Courses 9 Schedule/Timetable9 Father/Male Guardian 9 Teacher(s)9 Friends 9 Other (Please specify)__________________ 9 School Counsellor(s) ____________________________________

Expectations of High School Graduates37
As this survey is intended to track Prince Edward Island graduates, we may wish to contact you in thefuture to determine the status of your labour market or post-graduation activities.
The Department of Education would like to thank you for your cooperation with this survey. Allinformation collected through this survey is strictly confidential, and at no point will any individualinformation be released.
Instructor or principal: Please return completed survey to:
Expectations of High School GraduatesRon Smith, Special Projects ConsultantCorporate Planning DivisionDepartment of EducationPO Box 2000Charlottetown PE C1A 7N8Tel: 368-5551Fax: 368-4663E-mail: [email protected]

Expectations of High School Graduates39
Appendix B
Results of Survey of Grade 12 Senior High Students1. Which school are you attending?
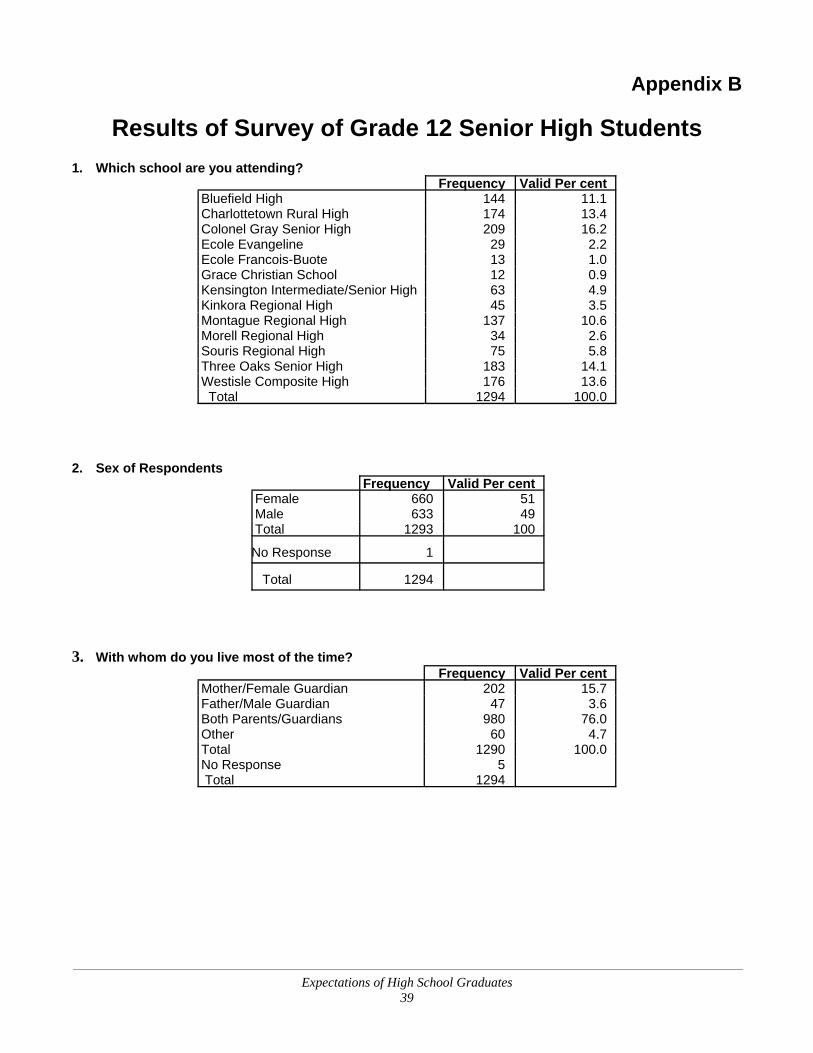
Frequency Valid Per cent Bluefield High 144 11.1 Charlottetown Rural High 174 13.4 Colonel Gray Senior High 209 16.2 Ecole Evangeline 29 2.2 Ecole Francois-Buote 13 1.0 Grace Christian School 12 0.9 Kensington Intermediate/Senior High 63 4.9 Kinkora Regional High 45 3.5 Montague Regional High 137 10.6 Morell Regional High 34 2.6 Souris Regional High 75 5.8 Three Oaks Senior High 183 14.1 Westisle Composite High 176 13.6 Total 1294 100.0
2. Sex of Respondents Frequency Valid Per cent
Female 660 51 Male 633 49 Total 1293 100
No Response 1
Total 1294
3. With whom do you live most of the time? Frequency Valid Per cent
Mother/Female Guardian 202 15.7 Father/Male Guardian 47 3.6 Both Parents/Guardians 980 76.0 Other 60 4.7 Total 1290 100.0 No Response 5 Total 1294

Expectations of High School Graduates40
4. What community do you live in?
Frequency Valid Per Albany 12 0.9 Alberton 28 2.1 Bedeque 8 0.6 Belfast 9 0.7 Belle River 2 0.2 Bonshaw 8 0.6 Borden 14 1.1 Canoe Cove 3 0.2 Cap-Egmont 6 0.4 Cardigan 36 2.8 Charlottetown 265 20.5 Cornwall 54 4.2 Crapaud 10 0.8 Earnscliffe 1 0.1 Ellerslie 16 1.2 Elmira 6 0.5 Elmsdale 17 1.3 French River 9 0.7 Georgetown 7 0.5 Glenwood 4 0.3 Hunter River 27 2.1 Kensington 56 4.3 Kinkora 16 1.2 Lennox Island 4 0.3 Mermaid 10 0.8 Miscouche 5 0.4 Montague 49 3.8 Morell 15 1.2 Mount Stewart 18 1.4 Murray Harbour 10 0.8 Murray River 15 1.2 New Haven 14 1.1 North Rustico 8 0.7 North Wiltshire 12 0.9
Frequency Valid Per O Leary 36 2.8 Richmond 7 0.5 Souris 67 5.2 St. Louis 16 1.3 St. Peters 8 0.6 Stratford 55 4.2 Summerside 161 12.4 Tignish 35 2.8 Tyne Valley 13 1.0 Vernon River 12 0.9 Wellington 24 1.8 Winsloe 35 2.8 York 27 2.1 No Response 26 2.0 Total 129.4 100.0

Expectations of High School Graduates41
5. How long have you been a resident of PEI? Frequency Valid Per cent Less than 5 years 63 4.9 6 - 10 years 69 5.3 10 years or more 1159 89.8 Total 1291 100.0 No Response 3 Total 1294
6 (a). What are your Immediate plans after High School? Frequency Valid Per cent Get a Job 166 12.9 UPEI 394 30.6 University off PEI 296 23.0 Holland College on PEI 165 12.8 Community College off PEI 45 3.5 College de l’Acadie 4 0.3 Compu College 9 0.7
Other Private Training School on PEI
10 0.8
Upgrade High School 31 2.4 Unsure 87 6.8 Other 79 6.1 Total 1286 100.0 No Response 8 Total 1294

Expectations of High School Graduates42
6 (b). Comparison of Males’ and Females’ plans after High School?
Male Female
Frequency Valid Per cent Frequency Valid Per cent
Get a JobUPEIUniversity off PEIHolland College on PEICommunity College off PEICollege de l’AcadieCompu CollegeGo to Other Private TrainingSchool on PEIUpgrade High SchoolUnsureOther Total
1031691278923124
195338
628
16.427.020.214.23.70.20.30.6
3.08.46.1
100.0
632251697622376
123441
658
9.634.025.711.63.30.51.10.9
1.85.26.2
100.0
6 (c). Francophone students’ immediate plans after high school Frequency Valid Per centGet a Job 3 0.1UPEI 4 0.1University off PEI 20 48.8Holland College on PEI 5 12.2Community College off PEI 1 0.1College de l’Acadie 3 0.1Compu College 1 0.1Upgrade High School 1 0.1Unsure 2 0.1Other 1 0.1 Total 41 100.0

Expectations of High School Graduates43
7. What program do you plan to take at a technical or community college? Frequency Valid Per cent
Accounting 11 4.0 Administrative Assistant 8 2.9 Aircraft Maintenance 2 0.7 Architect 3 1.1 Automotive Technology 13 4.8 Business Administration 5 1.8 Business Information Technology 3 1.1 Cabinetmaking 1 0.4 Carpentry 10 3.7 Child & Youth Care Worker 7 2.6 Computer Engineer 16 5.9 Conservation Enforcement 1 0.4 Construction Technology 4 1.5 Correctional Officer 4 1.5 Cosmetology 10 3.7 Culinary Arts 9 3.3 Dental Assisting 1 0.4 Early Childhood Care & Education 12 4.4 Electrical 5 1.8 Electromechanical Technology 1 0.4 Electronics Engineer 5 1.8 Entrepreneurship 3 1.1 Environmental Technology 1 0.4 Executive Secretary 2 0.7 Farm Machinery 1 0.4 Golf Business Management 2 0.7 Golf Club Management 3 1.1 Hotel & Restaurant Management 2 0.7 Human Resource Management 1 0.4 Human Services 9 3.3 Journalism 1 0.4 Justice Preparatory Program 7 2.6 Legal Secretary 2 0.7 Life Skills Coach Training 1 0.4 Machinist 1 0.4 Nursing Assistant 3 1.1 Paramedicine 3 1.1 Photography 2 0.7 Plumbing 2 0.7 Police Science (Cadet) 7 2.6 Private Policing & Assets Protection 1 0.4 Recreation & Leisure Management 1 0.4 Renewable Resource Technology 4 1.5 Secretary 3 1.1

Frequency Valid Per cent
Expectations of High School Graduates44
Tourism & Travel Management 11 4.0 Tourism Marketing & Advertising 1 0.4 Visual Communications 5 1.8 Welding 7 2.6 Welding Fabrication 2 0.7 Other 53 19.5 Total 272 100.0 No Response 1022 Total 1294
8 (a). At University, what will be your major area of study? Frequency Valid Per cent Agriculture & Biological Sciences 40 6.0 Arts & Science 193 28.8 Business/Commerce 106 15.8 Education 56 8.3 Engineering 46 6.9 Fine & Applied Arts 24 3.6 Health Professions 77 11.5 Humanities & Related 12 1.8 Mathematical Sciences 37 5.5 Social Sciences 24 3.6 Other 56 8.3 Total 671 100.0 No Response 623 Total 1294

Expectations of High School Graduates45
8 (b). Comparison of Males’ and Females’ area of study.Male Female
Frequency Valid Per cent Frequency Valid Per cent
Agriculture SciencesArts & ScienceBusiness/CommerceEducationEngineeringFine & Applied ArtsHealth ProfessionsHumanities & RelatedMathematical SciencesSocial SciencesOther Total
18808112356
114
169
21293
6.127.327.64.1
11.92.03.81.45.53.17.2
100.0
2211325441118668
211535
378
5.829.96.6
11.62.94.8
17.52.15.64.09.3
100.0
9. Plans after completing program or degree? Frequency Valid Per cent
Job on PEI 277 26.1 Job off PEI 213 20.0 Further Studies 206 19.4 Unsure 305 28.7 Other 62 5.8 Total 1063 100.0 No Response 231 Total 1294
10. Will you stay on PEI on a permanent basis? Frequency Valid Per cent
Yes 294 26.5 No 279 25.1 Unsure 538 48.4 Total 1111 100.0 No Response 183 Total 1294

Expectations of High School Graduates46
11. Do you hope to return to PEI at some future time? Frequency Valid Per cent Yes 481 57.5 No 45 5.4 Unsure 310 37.1 Total 836 100.0 No Response 458 Total 1294
12 (a). Do you plan to register as an apprentice? Frequency Valid Per cent
Yes 113 8.7 No 1181 91.3 Total 1294 100.0
12 (b). Which trade? Frequency Valid Per cent
Automotive Service 22 19.5 Baker 2 1.8 Bricklayer 1 0.9 Cabinetmaker 1 0.9 Carpenter 22 19.5 Construction Electrician 4 3.5 Cook 7 6.2 Heavy Duty Equipment Mechanic 3 2.7 Industrial Electrician 11 9.7 Machinist 2 1.8 Motor Vehicle Body Repair 5 4.4 Oil Burner Mechanic 1 0.9 Plumber 3 2.7
Production Equipment Mechanic 2 1.8 Refrigeration and Air Mechanic 1 0.9 Service Station Mechanic 2 1.8 Truck & Transport Mechanic 2 1.8 Welder 17 15.0 Total 113 100.0 No Response 1181 Total 1294

Expectations of High School Graduates47
13. Do you expect to find work in your chosen occupation on PEI? Frequency Valid Per cent
Yes 541 43.1 No 220 17.5 Unsure 495 39.4 Total 1256 100.0 No Response 38 Total 1294
14. Have you considered establishing your own business? Frequency Valid Per cent
Yes 433 34.0 No 839 66.0 Total 1272 100.0 No Response 22 Total 1294

Expectations of High School Graduates48
15. What type of job will you be looking for?2002 2001 2000 1999
Count Percent Count Per cent Count Per
cent Count Percent
Accountant 35 2.7 30 3.1 41 4.8 51 5Actor/Actress 7 0.5 6 0.6 7 0.8 6 0.6Animator/Artist 5 0.4 13 1.4 8 0.9 33 3.3Architect 5 0.4 18 1.9 4 0.5 4 0.4Business Owner or Manager 63 4.9 59 6.2 42 4.9 69 6.8Carpenter 14 1.1 15 1.6 8 0.9 5 0.5Child Care 12 0.9 22 2.3 30 3.5 31 3.1Computer Technology 42 3.2 49 5.1 67 7.8 71 7Conservation Officer 2 0.2 15 1.6 9 1 9 0.9Construction 6 0.5Cook/Chef 9 0.7 7 0.7 15 1.7 18 1.8Cosmetology 14 1.1 23 2.4 11 1.3 23 2.3Doctor 52 4.0 53 5.5 55 6.4 52 5.1Electrician 7 0.5Engineer 41 3.2 42 4.4 32 3.7 30 3Farmer 14 1.1 3 0.3 5 0.6 9 0.9Film Director/Producer 6 0.5 9 0.9 2 0.2 3 0.3Fishing 6 0.5 1 0.1 2 0.2 9 0.9Human Resources 4 0.3Lawyer 28 2.2 34 3.5 27 3.1 20 2Marine Biologist 3 0.2 10 1 7 0.8 7 0.7Marketing 6 0.5Mechanic 24 1.9 22 2.3 17 2 46 4.5Media Worker/Reporter 20 1.5 12 1.3 13 1.5 31 3.1Military Service 14 1.1 10 1 4 0.5 8 0.8Musician 8 0.6 16 1.7 6 0.7 10 1Nurse 36 2.8 50 5.2 31 3.6 29 2.9Nutritionist 9 0.7Other Medical 41 3.2 38 4 17 2 27 2.7Pharmacist 16 1.2 14 1.5 12 1.4 3 0.3Physiotherapist 8 0.6 1 2 22 2.5 14 1.4Police/Correctional Officer 52 4.0 24 2.5 33 3.8 44 4.3Priest 4 0.3Psychologist 23 1.8 28 2.9 15 1.7 25 2.5Secretary 20 1.5 12 1.3 10 1.2 12 1.2Social Worker 56 4.3 49 5.1 42 4.9 46 4.5Stock Broker 7 0.5Teacher/Professor 138 10.7 122 12.7 113 13.1 97 9.6Travel Agent 7 0.5 13 1.4 16 1.9 12 1.2Truck Driver 8 0.8 5 0.6 4 0.4Welding 18 1.4Other 171 13.2 111 11.6 134 15.5 157 15.5Total 1058 100 959 100 863 100 1015 100No Response 236 348 380 285 Total 1294 1307 1243 1300

Expectations of High School Graduates49
16. Do you think you are capable of achieving your career plans? Frequency Valid Per cent
Yes 1105 86.5 No 14 1.1 Unsure 159 12.4 Total 1278 100.0 No Response 16 Total 1294
17. What do you think you will be doing 5 years after you leave High School? Frequency Valid Per cent
Work in labour force 436 34.1 Full-time homemaker 9 0.7 Still studying 471 36.8 Unsure 307 24.0 Other 56 4.4 Total 1279 100.0 No Response 15 Total 1294
18. How long do you plan to work in the paid labour force? Frequency Valid Per cent
Less than 5 years 125 10.2 5 - 10 years 84 6.8 11 - 20 years 204 16.6 More than 20 years 801 65.1 I do not plan on working 17 1.4 Total 1231 100.0 No Response 63 Total 1294

Expectations of High School Graduates50
18. (a) Have you met with a School Counselor for help choosing courses? Frequency Valid Per cent
Yes 781 60.8 No 503 39.2 Total 1284 100.0 No Response 10 Total 1294
18. (b) Have you met with a School Counselor for help planning your career? Frequency Valid Per cent
Yes 696 54.5 No 582 45.5 Total 1278 100.0 No Response 16 Total 1294
19. Have you met with a Labour Market Outreach Worker? Frequency Valid Per cent Yes 458 35.8 No 820 64.2 Total 1278 100.0 No Response 16 Total 1294
20. Have you used the Choices Career Planning to help in selecting career? Frequency Valid Per cent Yes 604 47.3 No 673 52.7 Total 1277 100.0 No Response 17 Total 1294

Expectations of High School Graduates51
21. How helpful was the Choices Career Planning? Frequency Valid Per cent Very helpful 68 11.6 Helpful 354 60.4 Not at all helpful 164 28.0 Total 586 100.0 No Response 708 Total 1294
22. Listed are some of the factors that may have influenced you when you were choosing courses. Pleasecheck the ones that influenced you the most. (Check no more than 4)
Frequency Valid Per cent
AbilityAdvertisingBrother(s)/Sister(s)Career DayChoice of CareerEasy CourseFather/Male GuardianFriendsMarksMediaMother/Female GuardianPersonal InterestSchedule/TimetableSchool CounsellorsTeacher(s)Other
54741
15183
46413917243744266
19298113015528775
42.33.2
11.76.4
35.910.713.333.834.25.1
14.875.810.012.022.25.8

Expectations of High School Graduates52
23. Listed are some of the factors that may have influenced you when you were choosing a job orcareer. Please check the ones that influenced you the most. (Check no more than 4)
Frequency Valid Per cent
AbilityAdvertisingBrother(s)/Sister(s)Career DayEasy CourseFather/Male GuardianFriendsMarksMediaMother/Female GuardianPersonal InterestSchedule/TimetableSchool CounsellorTeacher(s)Other
76710870
1490
171275358126187
100112381
13894
59.38.35.4
11.50.0
13.221.327.79.7
14.577.49.56.3
10.77.3

Expectations of High School Graduates53
Appendix CAnglophone High School Course Selections
Grade 10 Through 12(Total Based on the 1,219 Anglophone Students Who Responded to the Question)
Grade 10 Grade 11 Grade 12 TotalCourse Selection # % # % # % %
Academic English 421 1176 96.5% 14 1.1% 4 0.3% 97.9%
521 7 0.6% 1099 89.6% 38 3.1% 93.3%621 2 0.2% 9 0.7% 1095 89.2% 90.1%
Academic Math 421 1115 91.5% 39 3.2% 7 0.6% 95.2%521 8 0.7% 1155 94.2% 57 4.6% 99.5%
621 4 0.3% 9 0.7% 914 74.4% 75.5%Academic Science 421 981 80.5% 23 1.9% 11 0.9% 83.2%
Physical Education 401 774 63.5% 23 1.9% 14 1.1% 66.5% (Leadership) 621 0.0% 16 1.3% 182 14.8% 16.1%
(Life Style) 801 32 2.6% 293 23.9% 70 5.7% 32.2%Chemistry 521 16 1.3% 735 60.0% 36 2.9% 64.2%
621 0.0% 18 1.5% 533 43.4% 44.9%Academic Biology 521 30 2.5% 670 54.6% 58 4.7% 61.8%
621 3 0.2% 35 2.9% 556 45.3% 48.4%Typing 701 466 38.2% 160 13.1% 30 2.4% 53.7%
Advanced Keyboarding 801 1 0.1% 22 1.8% 16 1.3% 3.2%French (Core) 421 437 35.8% 7 0.6% 3 0.2% 36.7%
521 3 0.2% 216 17.6% 5 0.4% 18.3%621 0.0% 2 0.2% 99 8.1% 8.2%
Academic Canadian Law 521 19 1.6% 531 43.3% 40 3.3% 48.1%Physics 521 13 1.1% 463 37.8% 33 2.7% 41.5%
621 2 0.2% 25 2.0% 392 31.9% 34.1%Academic History 421 530 43.5% 11 0.9% 5 0.4% 44.8%
521 18 1.5% 233 19.0% 20 1.6% 22.1%621 4 0.3% 23 1.9% 384 31.3% 33.5%
Computer Literacy 421 430 35.3% 24 2.0% 5 0.4% 37.6%521 6 0.5% 91 7.4% 20 1.6% 9.5%
621 0.0% 25 2.0% 132 10.7% 12.8%701 2 0.2% 2 0.2% 0.0% 0.3%
801 1 0.1% 8 0.7% 9 0.7% 1.5%Writing 521 154 12.6% 247 20.1% 44 3.6% 36.4%
Academic Geography 421 446 36.6% 23 1.9% 2 0.2% 38.6%521 12 1.0% 198 16.2% 5 0.4% 17.5%
621 0.0% 3 0.2% 149 12.1% 12.4%Introductory Economics 621 0.0% 10 0.8% 296 24.1% 24.9%
Family Life Education 421 307 25.2% 17 1.4% 23 1.9% 28.4%

Grade 10 Grade 11 Grade 12 TotalCourse Selection # % # % # % %
Expectations of High School Graduates54
621 0.0% 13 1.1% 44 3.6% 4.6%
Geometry 521 16 1.3% 221 18.0% 3 0.2% 19.6%Advanced Calculus 611 0.0% 4 0.3% 401 32.7% 33.0%
Agriscience 801 8 0.7% 115 9.4% 121 9.9% 19.9%
French Immersion 421 277 22.7% 3 0.2% 2 0.2% 23.1%521 1 0.1% 264 21.5% 4 0.3% 21.9%
621 0.0% 1 0.1% 251 20.4% 20.5%Music 421 188 15.4% 4 0.3% 1 0.1% 15.8%
521 1 0.1% 159 13.0% 1 0.1% 13.1%621 0.0% 1 0.1% 127 10.3% 10.4%
801 0.0% 2 0.2% 9 0.7% 0.9%The World of Business 701 62 5.1% 14 1.1% 3 0.2% 6.5%
Accounting 621 2 0.2% 30 2.4% 190 15.5% 18.1%801 1 0.1% 22 1.8% 21 1.7% 3.6%
Cooperative Work Study 5 0.4% 27 2.2% 80 6.5% 9.1%PEI History 621 0.0% 4 0.3% 22 1.8% 2.1%
Art 401 56 4.6% 5 0.4% 1 0.1% 5.1%501 0.0% 43 3.5% 8 0.7% 4.2%
601 0.0% 2 0.2% 33 2.7% 2.9%Foods & Nutrition 421 48 3.9% 13 1.1% 7 0.6% 5.6%
Introductory Politics 521 16 1.3% 30 2.4% 4 0.3% 4.1%Advanced Political Studies 621 1 0.1% 5 0.4% 67 5.5% 5.9%
English In Transition 421X 116 9.5% 0.0% 0.0% 9.5%Language Arts 421 0.0% 0.0% 0.0% 0.0%
Oceanography 621 0.0% 5 0.4% 61 5.0% 5.4%Entrepreneurship 521 0.0% 21 1.7% 13 1.1% 2.8%Media 531 18 1.5% 16 1.3% 8 0.7% 3.4%
Visual Communications 701 24 2.0% 10 0.8% 4 0.3% 3.1%Welding 705 13 1.1% 24 2.0% 19 1.5% 4.6%
Motor Vehicle Repair 704 33 2.7% 28 2.3% 2 0.2% 5.2%804 1 0.1% 1 0.1% 29 2.4% 2.5%
General Math 431 31 2.5% 19 1.5% 1 0.1% 4.2%531 0.0% 46 3.8% 10 0.8% 4.6%
631 0.0% 3 0.2% 29 2.4% 2.6%Advanced Chemistry 511 0.0% 62 5.1% 2 0.2% 5.2%
611 0.0% 0.0% 50 4.1% 4.1%Housing 621 0.0% 8 0.7% 28 2.3% 2.9%
Conservation 701 22 1.8% 9 0.7% 3 0.2% 2.8%Child Development 521 1 0.1% 27 2.2% 3 0.2% 2.5%Advanced Math 511 0.0% 54 4.4% 0.0% 4.4%
611 0.0% 4 0.3% 20 1.6% 2.0%Graphic Arts 701 27 2.2% 7 0.6% 7 0.6% 3.4%

Grade 10 Grade 11 Grade 12 TotalCourse Selection # % # % # % %
Expectations of High School Graduates55
Psychology 621X 2 0.2% 1 0.1% 46 3.7% 4.0%General English 431 30 2.5% 6 0.5% 0.0% 3.0%
531 0.0% 41 3.3% 4 0.3% 3.7%631 0.0% 3 0.2% 50 4.1% 4.3%
Carpentry 701 24 2.0% 21 1.7% 7 0.6% 4.3%
801 0.0% 6 0.5% 19 1.5% 2.0%Theatre Arts 701 3 0.2% 8 0.7% 2 0.2% 1.1%
801 2 0.2% 3 0.2% 0.0% 0.4%General Science 431 21 1.7% 3 0.2% 1 0.1% 2.0%
Woodworking Fundamentals 705 14 1.1% 0.0% 0.0% 1.1%Clothing 521 2 0.2% 16 1.3% 10 0.8% 2.3%
Personal Development 801 0.0% 0.0% 0.0% 0.0%Photography 801 0.0% 1 0.1% 0.0% 0.1%Hospitality/Tourism 801 2 0.2% 12 1.0% 47 3.8% 5.0%
Peer Counselling 0.0% 12 1.0% 38 3.1% 4.1%Animal Science 621 0.0% 0.0% 19 1.5% 1.5%
801 0.0% 6 0.5% 3 0.2% 0.7%Record Keeping 701 26 2.1% 1 0.1% 0.0% 2.2%
Crafts 701 19 1.6% 4 0.3% 4 0.3% 2.2%Industrial Arts 401 11 0.9% 0.0% 0.0% 0.9%
601 0.0% 0.0% 4 0.3% 0.3%701 8 0.7% 4 0.3% 2 0.2% 1.1%
801 2 0.2% 5 0.4% 6 0.5% 1.1%Foods & Clothing 421 47 3.9% 10 0.8% 0.0% 4.7%
Power Mechanics 705 7 0.6% 6 0.5% 5 0.4% 1.5%Drafting 701 6 0.5% 7 0.6% 1 0.1% 1.1%
801 0.0% 6 0.5% 18 1.5% 2.0%General Human Biology 631 1 0.1% 3 0.2% 10 0.8% 1.1%
Advanced Biology 511 0.0% 44 3.6% 0.0% 3.6%611 0.0% 2 0.2% 40 3.3% 3.4%
Dramatic Arts 801 2 0.2% 9 0.7% 19 1.5% 2.4%Cosmetology 701 8 0.7% 2 0.2% 0.0% 0.8%
801 0.0% 0.0% 4 0.3% 0.3%Child Care 704 22 1.8% 10 0.8% 5 0.4% 3.0%
General Canadian Law 531 1 0.1% 13 1.1% 5 0.4% 1.5%Advanced Visual Comm. 801 1 0.1% 6 0.5% 6 0.5% 1.1%
Advanced English 511 0.0% 21 1.7% 0.0% 1.7%611 0.0% 2 0.2% 22 1.8% 2.0%
Environmental Studies 701 20 1.6% 5 0.4% 10 0.8% 2.9%Academic English (Band) 421AB 1 0.1% 0.0% 0.0% 0.1% (Math) 421AM 0.0% 0.0% 0.0% 0.0%

Grade 10 Grade 11 Grade 12 TotalCourse Selection # % # % # % %
Expectations of High School Graduates56
General Geography 431 8 0.7% 0.0% 1 0.1% 0.7%531 0.0% 10 0.8% 2 0.2% 1.0%
631 0.0% 1 0.1% 11 0.9% 1.0%Practical Social Studies 451 1 0.1% 0.0% 0.0% 0.1%
551 0.0% 0.0% 0.0% 0.0%General History 431 13 1.1% 0.0% 0.0% 1.1%
531 0.0% 2 0.2% 0.0% 0.2%631 0.0% 0.0% 7 0.6% 0.6%
Electricity & Electronics 705 5 0.4% 2 0.2% 1 0.1% 0.7%Automotive Technology 801 12 1.0% 7 0.6% 9 0.7% 2.3%
Bible Studies 421 9 0.7% 0.0% 0.0% 0.7%521 0.0% 9 0.7% 0.0% 0.7%
621 0.0% 0.0% 8 0.7% 0.7%Jazz Studies 521X 1 0.1% 15 1.2% 14 1.1% 2.4%
Construction Technology 801 2 0.2% 0.0% 0.0% 0.2%Workplace Dynamics 601 0.0% 0.0% 0.0% 0.0%
Electrical Wiring 704 0.0% 0.0% 0.0% 0.0% 804 0.0% 0.0% 0.0% 0.0%
Canadian Studies 401 0.0% 0.0% 0.0% 0.0%Practical Math 451 3 0.2% 0.0% 0.0% 0.2%
551 1 0.1% 3 0.2% 1 0.1% 0.4%651 0.0% 1 0.1% 1 0.1% 0.2%
Special Needs Services 801 0.0% 0.0% 0.0% 0.0%Furniture Design 801 0.0% 0.0% 0.0% 0.0%
Automotive Services 802 0.0% 0.0% 0.0% 0.0%Information Tech. Comm. 401 4 0.3% 1 0.1% 3 0.2% 0.7%
Career Education & Guidance 400 0.0% 0.0% 0.0% 0.0%Fishery 701 0.0% 0.0% 0.0% 0.0%Office Procedures 601 0.0% 0.0% 0.0% 0.0%
Practical English 451 3 0.2% 0.0% 0.0% 0.2%551 0.0% 3 0.2% 0.0% 0.2%
651 0.0% 0.0% 5 0.4% 0.4%General Canadian Studies 431 13 1.1% 0.0% 0.0% 1.1%
Construction Woodworking 802 0.0% 0.0% 1 0.1% 0.1%History (French) 421 132 10.8% 0.0% 0.0% 10.8%
521 0.0% 0.0% 0.0% 0.0%Law (French) 521 0.0% 62 5.1% 7 0.6% 5.6%
Social Studies (French) 621 13 1.1% 14 1.1% 49 4.0% 6.2%Economics (French) 621 0.0% 0.0% 0.0% 0.0%