expectancy theory as a predictor of faculty …
TRANSCRIPT

Clemson UniversityTigerPrints
All Dissertations Dissertations
8-2010
EXPECTANCY THEORY AS A PREDICTOROF FACULTY MOTIVATION TO USE ACOURSE MANAGEMENT SYSTEMMarian TurcanClemson University, [email protected]
Follow this and additional works at: https://tigerprints.clemson.edu/all_dissertations
Part of the Education Commons
This Dissertation is brought to you for free and open access by the Dissertations at TigerPrints. It has been accepted for inclusion in All Dissertations byan authorized administrator of TigerPrints. For more information, please contact [email protected].
Recommended CitationTurcan, Marian, "EXPECTANCY THEORY AS A PREDICTOR OF FACULTY MOTIVATION TO USE A COURSEMANAGEMENT SYSTEM" (2010). All Dissertations. 586.https://tigerprints.clemson.edu/all_dissertations/586

EXPECTANCY THEORY AS A PREDICTOR OF
FACULTY MOTIVATION
TO USE A COURSE MANAGEMENT SYSTEM
A Dissertation
Presented to
The Graduate School
Of Clemson University
In Partial Fulfillment
Of the Requirement for the Degree of
Doctor of Education
Career and Technology Education
By
Marian Turcan
August 2010
Accepted by:
Dr. William Paige, Committee Chair
Dr. Fred Switzer
Dr. Cheryl Poston
Dr. James Rieck

ii
ABSTRACT
The aim of this study was to explore the relationships between the elements of the
Expectancy theory and faculty motivation to use a course management system.
Specifically it analyzed if the elements of the Expectancy theory (Valence,
Instrumentality and Expectancy) were useful in predicting faculty motivation when using
Blackboard tools in teaching their courses.
A self-administered survey questionnaire was developed and used as the research
instrument for this study. Four hundred and forty eight faculty members were randomly
selected from eleven schools from the Atlantic Coast Conference (ACC). Qualitative and
quantitative methods were used to analyze the data for the study.
The results of quantitative analysis showed that in a multiple regression between
the elements of the VIE theory and faculty motivation to use Blackboard tools,
Instrumentality and Valence did not have a significant influence on the model but had a
significant relationship with the dependent variable by itself. Expectancy was the only
element with a significant influence on the model. Based on the data, the model of the
Expectancy theory was not useful in predicting faculty motivation when using
Blackboard tools.
Based on the number of answers in the survey, there were more women using
Blackboard compared to men and among non-users men accounted for sixty percent of
non-users. The relationship between gender and use of Blackboard was not significant to
conclude that women were more likely to use Blackboard than men. Faculty perceived
iii
that even if Blackboard requires a lot of time to setup initially, it does save time in the
long run when used as a tool to facilitate classroom instruction.
The results of the qualitative analysis in this study found that faculty was more
motivated to use those Blackboard tools that facilitated their jobs while teaching.
Specifically, those tools that help disseminate course materials, post grades and
communicate with students.
The greatest number of users of Blackboard was between twenty eight and forty
one years old. From one hundred and one participants, faculty members with eleven to
fifteen years of teaching experience were the dominant group of Blackboard users.
Among the five departments questioned, there were more users of Blackboard in
Sciences and the least in Education. Most of the Blackboard users were on tenure track
faculty positions.
iv
ACKNOWLEDGEMENTS
I wish to thank all the members of my dissertation committee for their help,
support, patience, time and encouragement. Without them, the writing of this dissertation
would have been more complicated. Their guidance and experience helped me stay on
track and reach my goals.
I would like to thank my committee chair, Dr. William Paige, for his time and
patience and good advice. His enthusiasm and positive spin on things kept me afloat
during the writing process of my dissertation. He has been a good adviser, professor and
mentor during the time of my doctoral program. Dr. Fred Switzer deserves special
appreciation for his guidance and help. His patience, enthusiasm and moral support of my
research was very valuable. I would like also to thank Dr. Cheryl Poston for her great
experience, support and time dedicated to this dissertation. Last but not least, I am
grateful to Dr. James Rieck for his patience and help in the analysis of data, also for his
suggestions, guide and time dedicated to reviewing the details of the dissertation.
Finally, I would like to thank my family for their support and encouragement.
They have always been there for me with help or advice and provided the means to
support my education.
I would like to express my gratitude to Dr. Jo Ann McNatt and Dr. John Lawson.
Without them, my education in the United States would have been impossible. They have
always been there for me and helped me a lot. I have become a part of their family and
they have always respected and treated me like one of their own children.

v
TABLE OF CONTENTS
Page
TITLE PAGE .................................................................................................................... i
ABSTRACT ..................................................................................................................... ii
ACKOWLEDGEMENTS ............................................................................................... iv
LIST OF TABLES .......................................................................................................... ix
LIST OF FIGURES ....................................................................................................... xv
CHAPTER
I. INTRODUCTION
Research Background .............................................................................. 1
Statements of the Problem ....................................................................... 3
Significance of the Study ......................................................................... 5
Research Objectives ................................................................................. 6
Research Questions .................................................................................. 6
Research Design and Hypotheses ............................................................ 7
Limitations of the Study........................................................................... 8
Definitions of Terms ................................................................................ 9
Organization of the Study ...................................................................... 10
II. LITERATURE REVIEW
History of Technology in Education ...................................................... 12

vi
Table of Contents (Continued)
Page
E-learning ............................................................................................... 16
E-learning Evolution .............................................................................. 18
Advantages and Disadvantages of E-learning ....................................... 21
E-learning Environments ....................................................................... 25
E-learning Trends................................................................................... 26
Course Management Systems ................................................................ 31
Motivational Theories ............................................................................ 35
Use of Technology in Education ............................................................ 47
III. RESEARCH METHODOLOGY
Restatement of purpose .......................................................................... 51
Research Design..................................................................................... 52
Restatement of Research Questions and Hypotheses ............................ 53
Sampling and Data Collection Procedure .............................................. 56
Sample Size ............................................................................................ 56
Development of the research instrument ............................................... 58
Survey Instrument .................................................................................. 61
Variables ................................................................................................ 64
Data Analysis ......................................................................................... 66
Pilot Study .............................................................................................. 66
Validity .................................................................................................. 67
Reliability test ........................................................................................ 68
Data Collection ...................................................................................... 69

vii
Table of Contents (Continued)
Page
Data Coding ........................................................................................... 71
Survey Data Analysis ............................................................................. 72
Descriptive Statistics .............................................................................. 72
Multiple Regression Analysis ................................................................ 73
Examination of Assumptions ................................................................. 73
IV. FINDINGS AND ANALYSIS
Introduction ............................................................................................ 75
Data Collection ...................................................................................... 76
Data Screening ....................................................................................... 77
Descriptive Analysis .............................................................................. 78
Statistical Analysis ................................................................................. 99
Answers to the research questions ......................................................... 99
V. CONCLUSIONS AND RECOMMENDATIONS
Introduction .......................................................................................... 120
Conclusions .......................................................................................... 122
Recommendations ................................................................................ 132
APPENDICES ............................................................................................................. 135
A: Survey Questionnaire................................................................................. 136
B: Cover Letter for the Questionnaire ............................................................ 142

viii
Table of Contents (Continued)
Page
C: IRB Validation letter and approval of research ......................................... 143
REFERENCES ............................................................................................................ 144

ix
LIST OF TABLES
Table Page
2.1 Variations from the Expectancy......................................................................... 46
3.1 Cronbach’s alpha for questions of the survey .................................................... 68
4.1 Summary of respondents.................................................................................... 77
4.2 Using Blackboard will result in spending more time setting
up my courses ................................................................................................ 79
4.3 Using Blackboard will allow me, in the long run, to save
time for other professorial activities ............................................................. 80
4.4 Using Blackboard would allow me to better organize my
course materials ............................................................................................. 80
4.5 Using Blackboard would allow me to engage more students
with different learning styles ......................................................................... 80
4.6 Using Blackboard could allow me to extend my teaching
beyond my classroom .................................................................................... 81
4.7 Using Blackboard may lead to a feeling of accomplishment ............................ 81
4.8 Using Blackboard allows me to do my job more effectively............................. 81
4.9. Getting an incentive pay or raise ....................................................................... 82

x
List of Tables (Continued)
Table Page
4.10 Having more opportunities for a promotion ........................................................ 82
4.11 Getting better ratings on my student evaluations ................................................. 83
4.12 Improving my reputation among colleagues and department
chairs ............................................................................................................... 83
4.13 Having more control over my job by using the time I save
on other professorial activities ........................................................................ 83
4.14 Having a feeling of accomplishment ................................................................... 84
4.15 Having a better reputation among students .......................................................... 84
4.16 Overall, my department values the use of this course
management tool ............................................................................................. 85
4.17 Getting an incentive pay or raise ......................................................................... 85
4.18 Having more opportunities for promotion ........................................................... 86
4.19 Getting better ratings on my student evaluations ................................................. 86
4.20 Improve my reputation among colleagues and
department chairs ............................................................................................ 86

xi
List of Tables (Continued)
Table Page
4.21 Having more control over my job by using the time
I save on other professorial activities ............................................................ 87
4.22 Having a feeling of accomplishment ................................................................. 87
4.23 Having a better reputation among students ........................................................ 88
4.24 It is important that my department wants to use this course
management tool ........................................................................................... 88
4.25 To what extent did you make an effort to use Blackboard
in the past?..................................................................................................... 89
4.26 Please rate the present level of effort using Blackboard .................................... 89
4.27 I like Blackboard because it is easy to use ......................................................... 89
4.28 Overall, I had a good experience while using Blackboard ................................ 90
4.29 Motivation associated with Blackboard tools when
planning courses ............................................................................................ 90
4.30 Overall, how likely are you to use Blackboard in the
next semester? ............................................................................................... 91

xii
List of Tables (Continued)
Table Page
4.31 Based on your current satisfaction with Blackboard,
if you had to buy it for your teaching activities, how much
would you pay for its license? ....................................................................... 92
4.32 Based on your satisfaction with Blackboard, how likely are
you to recommend it to your colleagues? ...................................................... 92
4.33 What is your age?............................................................................................... 93
4.34 How many years have you been teaching in higher education
institutions? ................................................................................................... 93
4.35 Which of the following best describes your specialization area? ...................... 94
4.36 What is your faculty rank? ................................................................................. 94
4.37 What was your tenure status at your present institution
during the past term? ..................................................................................... 95
4.38 Why have you not used Blackboard for your classroom
instruction? .................................................................................................... 96
4.39 What is your age?............................................................................................... 97
4.40 How many years have you been teaching in higher
education institutions? ................................................................................... 97

xiii
List of Tables (Continued)
Table Page
4.41 Which of the following best describes your
specialization area?........................................................................................ 98
4.42 What is your faculty rank? ................................................................................. 98
4.43 What was your tenure status at your present institution
during the past term? ..................................................................................... 99
4.44 Descriptive statistics for dependent and independent
variables....................................................................................................... 104
4.45 Pearson Correlation matrix between independent and
dependent variables ..................................................................................... 105
4.46 Correlation coefficients .................................................................................... 106
4.47 Analysis of Variance ........................................................................................ 107
4.48 Coefficients of the regression model ............................................................... 108
4.49 Pearson Correlation coefficients for Intentions and
the elements of Motivation to use BB tools ................................................ 109
4.50 Parameters for variable E1 TimeSetup ............................................................ 115
4.51 Parameters for Variable E2 SaveTime ............................................................. 116

xiv
List of Tables (Continued)
Table Page
4.52 Correlations between variables E1 Time Setup,
E2 SaveTime and Intentions........................................................................ 117
4.53 Gender and Blackboard usage demographic data ............................................ 117
4.54 Chi square analysis between gender and Blackboard usage ............................ 118

xv
LIST OF FIGURES
Figure Page
2.1 Formula for Expectancy Theory ........................................................................ 40
4.1 The graph of standardized residuals (*ZRESID) against regression
standardized predicted value (*ZPRED) ................................................... 102
4.2 Normal distribution of the regression standardized residuals .......................... 103
4.3 Frequency distribution of answers to survey question number 2 .................... 113
4.4 Frequency distribution of answers to survey question number 3 .................... 114

1
CHAPTER ONE
INTRODUCTION
Research Background
Technology in one form or another has been used in education for a long time.
Socrates “complained” that the discovery of the alphabet would create forgetfulness in
the learners’ souls, because they will not use their memories. Presumably, some feel that
technology is interfering with education, while others will adopt the latest available tools
to teach their students. The emergence of pencil and paper that replaced the handheld
chalkboard had a big impact on how students completed their assignments. The overhead
projector challenged instructors in classrooms to do things differently and was looked
upon by some as a replacement for the instructor (Schultz, 1965). In the last half of the
century alone the emergence of new instructional technologies has outpaced all previous
centuries combined (Epper, 1995).
In the last decade, a new technological tool, called e-learning, was introduced and
it has changed the role of a traditional instructor. Salmon (2004) refers to instructors as
e-moderators because e-learning systems are rapidly transforming these instructors into
facilitators, moderators and mentors, besides the traditional role of just a “transmitter of
knowledge.” Now teachers have the opportunity to become designers of experiences,
processes and contexts for learning activity.
2
In a today’s highly mobile society, e-learning is an essential tool that is becoming
more popular and more institutions of higher education are adopting these e-learning
technologies to cope with the demand of a more flexible education system (Bates, 1999;
Souleles, 2005). The availability of high speed internet, not only on computers but also
on mobile devices, allows students to access information anytime and anywhere.
In spite of the technological innovations, there are still faculty members who want
nothing to do with these new teaching technologies. In a group study, Byron (1995)
explained why some faculty are less likely to use these tools and why they objected to the
presence of technology in a classroom. Their main concern was that the technology was
going to substitute for thinking on part of the student. They also believe that a teacher is
present in the classroom to help with the process of learning. These teachers doubt that
there is learning going on if studying is done while using a computer and not even seeing
a professor (Byron, 1995). Research by Surry (2000) found that in the instructional
process, faculty’s use of technology for teaching purposes is low. In other words, teachers
are either not making enough use of the instructional technology or are not using the
technology to its full potential. Surry (2000) noted that even though new technologies are
being adopted by educational institutions, most of them are used for administrative
purposes or data management. The rate of integration of these technologies into
classrooms is still low (Surry, 2000).
It is complicated to understand why professors are not using these technologies at
their full potential. Could it be because of limited availability or unfamiliarity with these
new tools? Or are they present and available, but the professors’ lack the motivation to

3
use them? There are several potential reasons for the failure of faculty to employ
technology in classrooms. One, as mentioned above, is technology being seen as
impedance in the classroom (Byron, 1995). Other reasons for not using technology
include the lack of time, training, rewards, awareness, and understanding how the new
technology can be effectively implemented (Byron, 1995; Stephens, 1992,; Todd, 1993;
Topp, Mortenson & Grandgenett, 1995).
No matter the reason, educational institutions in the face of instructors have not
fully realized the use of technology in their classrooms. There is an increased demand
from the student population who want to see professors apply these e-leaning tools in
their process of learning.
Statement of the problem
It is important that institutions of higher education get the most from the e-
learning technology they purchase. A smart use of e-learning tools could benefit students
as they obtain the necessary information for functioning in today’s academic setting and
making sure that the institutions are investing wisely into e-learning systems that are to
be used. One way to ensure that both of these goals are met is to have faculty members
introduce new e-learning technologies to students. The need for incorporation of web
based technology into instructional curriculum has been widely investigated (Chou, 2004;
Ertmer, Addison, Lane, Ross, & Woods, 1999; Groves & Zemel, 2000). Unfortunately,
some faculty members are less willing to integrate technology into their classroom
learning experiences or think it would not be useful (Lee, 2001; Maguire, 2005; Rakes &

4
Casey, 2002). Research at Carnegie Mellon University indicated that arts instructors were
not likely to use technology in their instruction, preferring to stick to their tried and true
methods. However, the first disciplines to use Web based technology were humanities,
social sciences, and engineering disciplines, similar to those in theatre (Gerlich & Perrier,
2003).
Educational institutions that implement these e-learning systems need to find
ways to motivate professors to use them more often. Motivation is a complex process and
is typically linked to two dimensions: external and external. External motivation includes
factors that are beyond control of the individual faculty member. Internal motivation is
related to personal reasons and beliefs. Ferguson (2000) defines motivation as an internal
process that pushes or pulls the individual, and the push or pull relates to some external
event. Motivation is the determinants of individual’s thought and action: why individual’s
behavior is initiated, persists, and stops, as well as what choices are made by the
individual (Weiner, 1992). Motivation can also affect an individual’s perception,
learning, and attitudes (Ferguson, 2000, Loudon & Bitta, 1993, Kotler, 1984).
As faculty members represent the important mediator in the process of education,
understanding what motivates them to use an instructional medium could be beneficial
for companies that design the course management systems as well as for the
administration of educational institutions. Ultimate decisions to invest large amounts of
financial resources and time should come from the demand of professors wanting to use
these e-learning tools.

5
Significance of the study
Current research in e-learning is focusing around several aspects. Specifically,
researchers are interested to see the use of e-learning on mobile devices; use of open
source course management systems like Moodle, Sakai, etc, and their compatibility and
integration with other software (Nagel, 2010). Also, current research focuses on
explorations on new instructional models, discussion of effective assessment,
explorations of the technical, managerial and structural requirements for e-learning,
discussion of staff development, the protocols and standards for transferability of
materials in e-learning environment, as well as issues related to accessibility, copyright
and plagiarism (Conole, Oliver & Isroff, 2004; Souleles, 2005). Tony Bates Associates
Inc (2006) in a literature review from 2003-2005 included over 2000 reviewed papers in
English/Spanish/French and it revealed that e-learning research focused about 10% on
policies and strategies, 30% on teaching and learning and about 60% on the use of
technology.
Very little research has been done on faculty motivation associated with use of
course management systems. In a study by Baker-Eveleth and Stone (2008), Expectancy
theory was used to assess behavioral intentions to use computer applications. Their study
focused on behavioral intentions to use Digital Measures that is affected by the ease of
system use that impacted self-efficacy and outcome expectancy.
This study was designed to investigate several aspects of a specific e-learning
technology. It looked at faculty motivation associated with the use of course management

6
systems also called learning management systems and evaluated the level of utilization of
a course management system, specifically Blackboard. The researcher selected Vroom’s
Expectancy theory, also called VIE theory (1964), to explain how the process of
motivation affects the use of Blackboard tools. The last part of this research looked at
how faculty members perceive Blackboard and if it is viewed as a time saving tool in
their daily teaching activities. A successful application of the Expectancy theory may
provide a better understanding of faculty motivation to use of e-learning in classrooms.
Research Objectives
The objectives of this research were to:
1) Investigate the current level of utilization of Blackboard in the institutions of
higher education selected for this study.
2) Apply Vroom’s Expectancy theory (VIE) to explain faculty motivation to use
nine Blackboard tools.
3) Examine the relationships between the elements of the VIE theory and the
Motivation to use Blackboard tools.
4) Evaluate if using Blackboard is related to saving time during for the instructional
process.
Research Questions
1. Does the VIE model predict faculty motivation to use Blackboard?
2. What is the strongest motivational factor that drives faculty to use course
management tools in facilitating classroom teaching?
7
3. Is there a relationship between Valence and a faculty member’s motivation to use
Blackboard tools for facilitating classroom teaching?
4. Is there a relationship between Instrumentality and a faculty member’s motivation
to use Blackboard tools for facilitating classroom teaching?
5. Is there a relationship between Expectancy and a faculty member’s motivation to
use Blackboard tools for facilitating classroom teaching?
6. Does a faculty member perceive using Blackboard course management tools as
saving time?
7. Is there a relationship between utilization of course management tools and gender?
Research Design and Hypotheses
The research design used in this study was a combination of quantitative and
qualitative methods. The fusion of quantitative research design and qualitative research
design allowed the researcher to explore and examine several different relationships. The
qualitative methods were used to collect responses from participants with the help of the
survey instrument of this study. The relationships between variables were analyzed using
quantitative methods. Multiple regressions, correlation coefficients, analysis of variance
(ANOVA), t-test and Chi-square were used to analyze the results.
The statistical analysis of this study was based on the following hypotheses:
Hypothesis 1: There is a relationship between a faculty member’s motivation to
use Blackboard and the Elements of VIE theory.

8
Hypothesis 2: Valence is useful in predicting a faculty member’s motivation to use
Blackboard.
Hypothesis 3: Instrumentality is useful in predicting a faculty member’s
motivation to use Blackboard.
Hypothesis 4: Expectancy is useful in predicting a faculty member’s motivation to
use Blackboard.
Hypothesis 5: A faculty member perceives using Blackboard course management
tools as saving time.
Hypothesis 6: There is a relationship between utilization of course management
tools and gender.
Limitations of Study
The following limitations were inherent to this study due to the availability of
funds, respondents and research resources.
1) The population of this study was limited to the Atlantic Coast Conference
universities, consisting of 12 schools most of them on the East coast of the United
States.
2) Other Course Management Systems besides Blackboard were not analyzed or
included in this study.
3) The sampling of participants at each university was done mostly from 5 colleges:
Business, Sciences (Engineering), Education, Arts, Health and Medicine.

9
4) The survey instrument designed for this study was not collecting information
opinions, attitudes or experiences with Blackboard or any other course
management systems.
Definition of terms
Throughout this dissertation specific terms were used. In order to better
understand their meaning in the context of this study the following definitions define the
terms.
Technology: in this study technology refers to using web based applications on
computers during the instructional process.
Expectancy theory: the theory of motivation developed by Vroom (1964). It explains
the process of individual decision making based on various behavioral alternatives.
Its theoretical formula: Motivation Force= Valence x Instrumentality x Expectancy.
Faculty motivation: the process or act that stimulates a faculty member to work.
Expectancy: represents the perceived probability that effort will lead to good
performance. Variables that could affect expectancy include: self-efficacy, goal difficulty
and perceived control.
Instrumentality: the perceived probability that performance will lead to desired
outcomes. Some of the factors affecting instrumentality are: trust, control and policies.
Valence: the value an individual places on rewards. It is affected by needs, goals, values
and preferences.

10
Extrinsic motivator: rewards which are doled out by supervisors to ensure that work is
done properly and that the rules are followed. They include things like salaries, bonuses,
commissions, perks, benefits, and cash rewards (Thomas, 2002).
Intrinsic motivator: Rewards that come to faculty members directly from the work that
they do-satisfaction such as pride of teaching or the sense that they are helping a student
(Thomas, 2002).
Web based tools: provide reporting and data transmission capabilities through the use of
standard Internet technology. Helps visualize and disseminate instructional materials to
students.
E- learning- is defined as instruction delivered on a computer via internet or CD-ROM
(Clark & Mayer, 2007).
Course Management System/Learning Management System - an online proprietary
virtual learning environment system that is sold to colleges and other institutions and
used on many campuses for e-learning. Instructors can add to their courses tools such as
discussion boards, mail systems and live chat, along with content including documents
and web pages.

11
Organization of the Study
Chapter two provides a comprehensive literature review of the use of technology in
education, the process of e-learning and a couple of theories that explain the process of
human motivation.
Chapter three represents the methodology and the procedures used in this research. It
starts with the description of the research objectives, questions and hypotheses. Also it
provides information about the process of development of the self-administered survey.
The section continues with a pilot study conducted to test the validity and reliability of
the research instrument. It explains the data sampling procedure, the process of data
encoding and collection and the statistical methods used to analyze the raw data of this
study.
Chapter four presents the findings from the survey respondents and a statistical analysis
for each hypothesis and research question that was tested.
Chapter five describes the conclusions drawn as a result of the data analysis.
Recommendations for further research and conclusions are provided.

12
CHAPTER TWO
REVIEW OF LITERATURE
History of technology in education
In a literature review done by Merritt R. Jr. (1998) about technology used in
classrooms, there is a good overview of how this technology has evolved over the years.
Merritt mentioned that in 1933, Arnsparger completed his Teachers college doctoral
dissertation on how the “new” sound pictures could be used in the classroom. In his
work, Arnsparger noted that there were few studies that had been done to determine “the
effectiveness of sound pictures as teaching aids” and since there was a lack of studies to
the newness of the sound picture, several studies pointed to some interesting findings. A
1931 study New York University found that sound pictures “are as effective as identical
lecture demonstrations in conveying specific information to mature students”. However,
it is interesting to point out that when films which emulated a lecture were compared to
silent films, which had the exact same visual content, the silent films were considered to
be more effective “ in conveying specific information” (Arnsparger 1933, p.5-6).
A second study cited by Arnsparger from the Teachers College found in all
situations that those who saw the talking picture scored better on subsequent tests.
Various scenarios were tested including having learners see the picture and not read the
monograph. Sixty percent of those who saw the picture and did not read the monograph
“made a score higher than the average of those spent on the average 2.61 hours reading
the monograph” (p.8). This could be the first case of “why read the book, when one can
13
wait for the movie”. In Arnsparger’s 1933 study, he found that in elementary classes
across the country, children in experimental groups consistently scored better than those
in the control groups. Experimental groups were ones that used the “new” technology of
educational sound pictures. He noted that his work, done specifically in natural science
and music, is somewhat narrow but nonetheless “suggest many other possibilities for
fruitful research, the results of which should be of greatest importance to the whole field
of education (p.89). Time showed that Asnsparger was correct in his assumption that the
sound picture would be of great importance to education, as most people experienced the
use of movies at all levels of education. That tradition continues today, although the film
projector has been replaced by the much quieter video cassette, and later by a DVD
player or digital files on the computer.
A technology that did not fare as well as the sound picture was in the radio. As
Stubblefield and Keane (1994) report, radio had some informal use as a learning tool.
News programs and opportunities to hear political leaders provided an informal
educational tool for Americans in the 1930s. However, and unexpected educational
experience was obtained through soap operas which “served an education function for
housewives by helping them realize that others shared their problems, by showing how
others responded to and resolved conflict, and by reinforcing their values. In the late
1920s, “sixty-five colleges and universities were using radio” to reach students. But
during the Great Depression, it was difficult to purchase time on commercial stations and
the cost of operating radio stations was too high for most institutions. Therefore, the great
promise of radio as an educational medium was dashed by the 1940s. The option was to

14
turn to correspondence type activities, a method of distance learning that continues to be
used in conjunction with other media.
Television followed radio onto the educational scene. The discussions that took
place at the Wayne-RCA invitational Conference on Televised Instruction in 1961, it was
noted that televised instruction was beginning to take hold (Dreyfus, 1962). Also at that
conference, Samuel Brownell pointed out that televised teaching was reliable and could
effectively save time by having a single individual teach a lesson and deliver that lesson
to several classrooms. This particular position brought out a question concerning the job
security of teachers with the onset of technology.
Another point brought out in the 1961 conference was departmental recognition.
This may be one of the first discussions about the subject of support for instructors using
technology. Secrist and Herrman (1961) reported that they did have support of their
departments. Another consideration is the effectiveness of television in the classroom.
Both Holmes (1962) and Weld (1962) noted that the technology (in this case television)
was not going to solve inherent problems with individual instructor’s teaching. Thus, the
concept that technology could affect what is learned by students is not a new idea.
Holmes suggested at the 1961 conference on television that a title of similar conference
on education technology held 2000 years ago “might have been the use of Papyrus as in
Instructional medium, or 400 years ago-Print as an instructional Medium”.
Computers are now the new technology being considered for classroom use.
Many of the technologies available to the instructor are computer driven. Such as

15
computer graphics, use of CDs, computer screen projection and even work processing.
The computer has found its application in higher education since its emergence on the
scene just over 50 years ago. The initial all-electronic computer was called ENIAC.
According to Dawson (1997), the machine could go for about five days before repair was
needed and its computing ability compared to what one can obtain with a hand held
calculator. The use of computers has increased immensely since ENIAC came on the
scene at the University of Pennsylvania in 1947. One indication of the expansion of
computers in higher education is the use of electronic mail. Dawson points out that in
1996 “The U.S. Postal Service delivered a record 180 billion pieces of mail…however,
there were over 1 trillion e-mail messages sent.” (p.1). Today, computer ownership is
something that is taken for granted. In 1972 only 150,000 computers existed in the world.
Within two years a single company, Apple computer Inc., was be responsible for
shipping 100 million computers.
It is most likely that a majority of those computers will be used to explore the
Internet. The Internet is a system of computers linked together and is accessible using a
modem or network connection. On the Internet are pages which can be accessed using a
Uniform Resource Locator (URL). The content of those pages can satisfy any human
interest. Individuals can find information on nearly any topic that interests them. It seems
that the Internet is relative newcomer to the computer, but it has actually been around
since the 1960s. During that decade, the federal government funded a project called
ARAPNET (Gates, Myhvold, & Rinearson, 1995). ARAPNET was the predecessor of the
Internet, much like two lane highways that spanned the United Stated were the

16
predecessors of interstate highways. Also available in the late 1980s was BITNET which
stood for “Because it’s Time network”. (http://www.netlingo.com/more/bitnet.html,
1998). BITNET was changed to CREN (Corporation for Research and Educational
Networking) in 1987. In 1989, funding for ARAPNET was cut off and the Internet was
set up in its place. University professors from science and engineering fields were the
initial users of the Internet.
Now, a couple of decades later, the Internet has grown into a matured business
and educational tool. The success of the Internet has led many institutions to use this
resource for distance learning. Other institutions have come into existence because of the
technology. The issue of instructional technology has a long-standing history and can be
traced back to any new medium that comes along. Currently, the technology is focused
on distance learning as well as the use of the computer learning tools in the classroom.
E-learning
According for Valentine (2002), distance learning started very early in Europe in
the form of correspondence courses. Initially it was what the name implies,
correspondence. Students would get their assignments and mail them when they were
complete. With technological advances, this practice evolved when instructional radio
and television become popular, roughly in the middle of the twentieth century.
Over the years, distance learning kept changing and adding new methods of
instructional delivery. The conventional methods are still around, some of them being
modified to accommodate the new technological advances. For example, tape lectures

17
have evolved into streaming video and podcasts, the new digital formats intended for
digital audio/video players.
The most radical changes in distance education in the last decades were due to
appearance of the Internet. New formats and compression of video/audio signals allowed
for real-time delivery of distance education. The instant desire for learning was there to
gratify those hungry for knowledge.
O’Mahony (2003) mentioned that several factors contributed and assisted to the
convergence of this new form of distance education. Increasingly sophisticated web
browsers; increasingly sophisticated web scripting languages; increasing bandwidth,
improved data compression techniques; increased access to powerful personal computing
devices; and increased levels of user knowledge and understanding are some of these
factors. (p. 685).
So what does e-leaning, really mean? There is some overlap between computer-
assisted learning and e-leaning, but e-leaning is often associated with instruction
conducted online or using web-based tools. There are multiple definitions for e-leaning in
the literature. O’Mahony (2003) mentioned that e-learning differs from regular computer
assisted learning by the use of web-enables technologies. Morrison and Khan (2003),
which states that e-learning is “an innovative approach for delivering electronically
mediated, well-designed, learner-centered and interactive learning environments to
anyone, anyplace, anytime by utilizing the internet and digital technologies in concert
with instructional design principles” Valentine (2002), on the other hand, provided a few
definitions for distance learning, which in essence, point to the primary distinction of

18
distance learning, namely the separation between the instructor and students by space, but
not necessarily by time. And the most obvious example of this would be the use of
compressed video which can be delivered in real time.
Chang (2008) in his literature review of e-learning stated that in the evolution of
e-learning components that are used today, one will find that it has really only been about
a decade since the emergence of many components that support the current e-learning
system. In 1990s, Tim Berners-Lee proposed his idea for a World Wide Web. During the
fall of 1994, the early version of Netscape launched. In late 1995, both Windows 95 and
the first Internet Explorer were launched. And in 1996, both the early version of WebCT
and Blackboard were released.
E-learning evolution
Computer assisted training or teaching has not been around for such a long time.
Before the appearance of e-learning, the only possible way to get knowledge from a
qualified instructor was in a regular classroom. The evolution of computer technologies
and well as the lower costs associated with using and developing instructional materials
allowed for delivery of instructional materials via computers.
In the early 1990s, the most popular medium used for instruction were videotapes.
It represented a very small market and lacked the 'scalability' that is so important in
today's applications (Cooke, 2004). It was a good idea to use video tapes, although it had
some problems: a) it was hard to customize according to the needs of the users; b)
expensive to maintain and c) it was difficult to upgrade. Users had to find the necessary

19
equipment to watch the video tapes and there was practically no interaction that would
evaluate the progress and assess the knowledge acquired.
Clearly, the method of video tapes was not the best solution for instruction. As a
result of appearance of Windows, Macintosh, CD-ROMs and PowerPoint, Computer
based training emerged. Kiffmeyer (2004) notes that history of e-learning could be
divided into several chapters:
Instructor-Led Training Era (Pre 1983)
before computers were widely available, instructor - led training (ILT was
the primary training method.
Multimedia Era - (1984 to 1993)
Windows 3.1, Macintosh, CD-ROMs, PowerPoint marked the technological
advancement of the Multimedia Era. In an attempt to make training more
transportable and visually engaging, CT courses were delivered via CD-ROM.
Web Infancy - (1994 - 1999)
As the Web evolved, training providers began exploring how this new
technology could improve training. The advent of email, Web browsers, HTML,
media players, low fidelity streamed audio/video and simple Java began to
change the face of multimedia training.
Next Generation Web - (2000 - 2005)
Technological advance including Java/IP network applications, rich streaming
media, high-bandwidth access, and advance Web site design - are

20
revolutionizing the training industry. Today, live instructor led training
(ILT) via the Web can be combined with real-time mentoring, improved learner
services, and up-to-date, engaging "born on the web" content to create a
highly-effective, multi-dimensional learning environment. Mobile devices allow
the user to access just-in-time learning using their mobile devices. It has been
estimated that there will be more mobile devises in the year 2005 than there will
be integrated desktops. These sophisticated training solutions provide even greater
cost savings, higher quality learning experiences and are setting the standards for
the educational standards of the future.
Even though initially CR-ROMs were viewed as the solution for delivering
instruction using computers, it still lacked the ability to track user’s performance in a
central database and also was not easily upgradeable. Internet was viewed as the perfect
solutions, however there was a problem, when the content was places on the web, it was
simply text with very little graphics. No one really cared about the effectiveness of this
new medium – it was just really cool. (Cooke, 2004)
Clark (2002) mentioned that instructors and users began to realize that just
posting information on the web without a learning strategy was pointless. He mentioned
that in order to improve learning, this method of instruction must fit into students’ lives
and not the other way around. As a result, e-learning was born.
Learning Management System or LMS was the first innovation in e-learning. The
first Learning Management Systems (LMS) offered off-the-shelf platforms for front-end

21
registration and course cataloging, and they tracked skills management and reporting on
the back-end (Clark, 2002). This allowed schools and companies to place courses online
and be able to track students' progress, communicate with students effectively and
provide a place for real-time discussions.
The next step in the evolution process was e-Classroom. It was a web-based
application with synchronization of events and integration of computer-based training
and simulations (Clark, 2002). Centra is one of the application that is used often today.
e-Classrooms are often called Live Instructor-Lead Training or ILT. Live
instructor-led training (ILT) via the Web can be combined with real-time mentoring,
improved learner services, and up-to-date, engaging "born on the Web" content to create
a highly-effective, multi-dimensional learning environment (Kiffmeyer, 2004).
Modern trends and evolving technologies continue to improve and amaze with
possibilities that instructional methods hold. As long as training is continually geared
towards the learners and strategies are used in the training e-learning programs will
continue to serve their purpose.
Advantages and disadvantages of e-learning
E-learning has several advantages over traditional methods of instruction.
Cantoni, Cellario, and Porta (2003) point out that e-learning is usually less expensive to
deliver. E-learning is more cost effective than traditional learning because less time and
money is spent traveling. Since e-learning can be done in any geographic location and

22
there are virtually no travel expenses, this type of learning is much less costly than doing
learning at a traditional institution. It will not be restricted by physical location; this could
allow saving money on renting rooms for instruction in several locations and times of
instruction.
Flexibility is another major benefit of e-learning. E-learning has the advantage of
student being able to take a class anytime anywhere. Education is available when and
where it is needed. E-learning can be done at the office, at home, on the road, 24 hours a
day, and seven days a week. E-learning also has measurable assessments which can be
created so the both the instructors and students will know what the students have learned,
when they've completed courses, and how they have performed (Chang, 2008).
Student like e-learning because it accommodates different types of learning styles
and allows them to learn at own pace. Various activities could be utilized that apply to
many different learning styles learners have. Learners can fit e-learning into their busy
schedule. If they hold a job, they can still be working with e-learning. If the learner needs
to do the learning at night, then this option is available. Learners can sit in their home get
comfortable and do the learning if they desire. It also could benefit instructors who have
to manage large groups of students in their distance education courses. Large groups of
people are not a problem anymore. E-learning could handle a large number of students in
several locations simultaneously (Chang, 2008).
To make learning more enjoyable and effective, e-learning content subject are
often presented using a combination of visual and audio elements to improve learner’s

23
retention. The interaction and communication between learners and instructors are often
encouraged through the use of chat room, discussion boards, instant messaging and
email. E-learning also makes it possible for learners to customize learning materials to
their own needs, leading to more effective learning and hence a faster learning curve
when compared to instructor-led training. The benefit of e-learning environment being a
virtual world provides learners the courage and opportunity to explore new materials
without having to worry about being identified or making upfront exposure (Cantoni,
Cellario and Porta, 2003).
There are several disadvantages of e-learning. First of all, institutions that
promote e-learning need to purchase new technologies required operating these
instructional programs which could be expensive. Having those new technologies without
the knowledge of how to operate it is purposeless. Thus, it is necessary to hire or train
staff members who are going to operate and develop these systems. There could be
frustration among users if new technologies cause problems. (Chang, 2008)
A reliable computer and a fast Internet is essential for users of these e-learning
systems. Otherwise, it is necessary to spend additional time to train the users how to use a
computer. A slow internet connection would require longer times to download the rich
multimedia contents (Cantoni, Cellario and Porta, 2003).
Not to disregard that e-learning activities could be time consuming just as much
time for attending class and completing assignments as any traditional classroom course.
This means that students have to be highly motivated and responsible because all the

24
work they do is on their own. Learners with low motivation or bad study habits may fall
behind (Salmon, 2004).
The fact that the instructor is not physically present or unavailable during the
instruction required the learners to have a discipline to work independently without the
instructor's assistance. E-learners also need to have good writing and communication
skills. This will help them express their ideas and when instructors and other learners
aren't meeting face-to-face it is possible to misinterpret what was meant (Cantoni,
Cellario and Porta, 2003).
E-Learning Environments
According to data from the National Education Technology Plan (2004) by the
US Department of Education, at least 15 states provide some form of virtual schooling to
supplement regular classes or provide for special needs. Hundreds of thousands of
students are taking advantage of e-learning 2010 school year. About 25 percent of all K-
12 public schools now offer some form of e-learning or virtual school instruction. The
federal government predicts that in the next decade a majority of schools will be on board
and offering distance-learning classes to students.
E-learning environments used today in major universities could be classified into
two categories: commercial Learning Management Systems such as Blackboard and the
open source systems such as LAMS, SAKAI and Moodle. Weller (2006) points out that
“The commercial Learning Management Systems (LSM) set the foundation for the
current open source LMS that are available.” The drawbacks of the commercial LMS,
when coupled with some aspects of the conceptual framework of certain open source

25
LMS, set a good foundation for the development of a future LMS. Weller calls Learning
Management Systems (LMS) as Virtual Learning Environment (VLE) and mentioned
that some characteristics of the commercial VLE (or LMS) are the following:
1. Content focused.
2. No strong pedagogy.
3. Based around a teacher-classroom model.
4. Combine a number of average tools, but not the best ones.
5. Do not feature a particular tool.
6. Operate on a lowest common denominator approach.
7. Do not meet the needs of different subject areas.
8. It is difficult to exchange content between them, despite claims to
interoperability.
Weller (2006) mentioned that although these characteristics helped VLEs become
popular, they are also seen as drawbacks because these characteristics did not help e-
learning to be integrated aggressively into the educational process. These tools and
features that are present in VLEs are very suitable for integration with current educational
practices and do not require big changes to the current teaching style and educational
practices.
Commercial VLEs or LMSs gained ground and trust from users and as a result
became popular. These systems and their innovations attracted conventional users and
enthusiasts. For some, commercial VLEs were not satisfying, so the enthusiast began
looking for something more, specifically for solutions to address the pedagogical needs

26
of e-learners. As a result, the open source LMS came into play, such as LAMS and
Moodle, as well as closely integrated systems such as portals and e-portfolios (Weller,
2006 p. 100).
E-learning Trends
In a paper published by the Department of Mathematics and Computer Science
Technical University by Carabaneanu, Trandafir and Mierlus-Mazilu (2006), the authors
analyzed what trends are in e-learning. The paper specifies the following trends:
1. Mobile technologies
Future predictions indicate that learning solutions will be integrated into mobile
technologies as mobile phones, PDAs, digital pen and paper and other devices that are to
appear in the future. In the near future there is even a possibility of learning solutions to
be integrated into electronic appliances and information interfaces.
There are new potential markets that could evolve using e-learning on mobile devices,
specifically we are talking about:
a. The market of learning services for people that do not have access to well
built infrastructure like internet and learners in developing countries.
b. The second market is for people who are merely on the move because of their
jobs, students that need individualized learning.
In the United States, PDAs have been used in schools and for workers on the
move and has significant results in terms of improved learning effectiveness. In Europe,
mobile learning is beginning to develop, and telecommunications companies such as

27
Nokia and Vodafone have already integrated these technologies into their training and
development systems.
However, the real growth across this sector remains to be seen. Any growth in this
market is likely to happen in the medium to long term future.
2. Simulations in e-learning process
Simulated programs have played an important role in the learning process of aviation,
aeronautical industry and the department of defense. Due to high costs and lack of
technological tools needed to develop such applications, simulation programs have not
been popular on a large scale. These days we are in a different situation and simulations
are being adopted in other industries and for a broad range of skills and competence
development. Technology and cost barriers are continuing to shrink, opening up the
potential for wider adoption of simulation technology. One of the most popular
applications today, Abode Flash, has become the core of e-leaning simulation-
development and vendors are offering more industry- and topic-specific simulation
templates.
Computed mediated simulations are expected to gain a larger share of education
and training activities. Simulations may offer advantages over handbooks and they can
complement lectures, demonstrations and real world practice opportunities.
The market for these kinds of learning services will probably continue to grow as
simulation technologies become more sophisticated and more cost effective to build.

28
3. Adaptive learning environments (ALEs)
Developers and users of e-learning are becoming more aware about the potential
benefits of an adaptive environment.
Individualized learning or learning adapted to specific needs of an individual is hard to
achieve especially on a large scale using traditional approaches. A more diverse
population is participating in learning activities, and every individual has his/her own
way of accessing the media used to collaborate and manipulate that educational content
for their own needs.
A learning environment is considered adaptive if it is capable of: monitoring the
activities of its users; interpreting results on the basis of domain-specific models;
inferring user requirements and preferences out of the interpreted activities, appropriately
representing these in associated models; and, finally, acting upon the available
knowledge on its users and the subject matter at hand, to dynamically facilitate the
learning process.
Adaptive behavior on the part of a learning environment can have several manifestations:
• Adaptive Interaction refers to adaptations in the system’s interface and are
intended to facilitate or support the user’s interaction with the system, without, modifying
in any way the learning “content” itself. Examples of adaptations at this level include:
the employment of alternative graphical or color schemes, font sizes, etc., to
accommodate user preferences, requirements or disabilities at the lexical (or physical)
level of interaction; the reorganization or restructuring of interactive tasks at the syntactic

29
level of interaction; or the adoption of alternative interaction metaphors at the semantic
level of interaction.
• Adaptive Course Delivery constitutes the most common and widely used
collection of adaptation techniques applied in learning environments today. In particular,
the term is used to refer to adaptations that are intended to tailor a course (or, in some
cases, a series of courses) to the individual learner. The intention is to optimize the “fit”
between course contents and user characteristics / requirements, so that the “optimal”
learning result is obtained, while, in concept, the time and interactions expended on a
course are brought to a “minimum”.
• Content Discovery and Assembly refers to the application of adaptive techniques
in the discovery and assembly of learning material / “content” from potentially
distributed sources/ repositories. The adaptive component of this process lies with the
utilization of adaptation- oriented models and knowledge about users typically derived
from monitoring, both of which are not available to non-adaptive systems that engage in
the same process.
• Adaptive Collaboration Support is intended to capture adaptive support in
learning processes that involve communication between multiple persons (and, therefore,
social interaction), and potentially, collaboration towards common objectives. This is an
important dimension to be considered as we are moving away from “isolationist”
approaches of e-learning, which are at odds with what modern learning theory
increasingly emphasizes: the importance of collaboration, cooperative learning,
communities of learners, social negotiation, and apprenticeship in learning.

30
One of the problems regarding the adaptive learning environments now is that existing
standards do have some provisions for adaptation, but require substantial extensions to
accommodate common practice in adaptive learning environments (ALEs). The
motivation for seeking standardization in adaptive e-Learning is directly linked to cost
factors related to the development of ALEs and adaptive courses.
4. Blended learning
Another trend involves blended learning programs. The term “blended learning”
has come to describe a well thought-out combination of e-learning and other traditional
training methods. The combination is meant to increase effectiveness in the process of
learning, due to the fact that a single delivery method is no longer sufficient to handle all
training needs. Blended learning has the advantage that preserves the necessary
consideration of how people learn, but at the same time offers options for learning and
produce measurable savings in learning offerings promised by e-learning.
5. Virtual environments and learning games.
Cantoni, Cellario and Porta (2003) emphasized the visual component of the e-
learning experience as a significant feature for effective content development and
delivery. It is projected that the adoption of new interaction paradigms based on multi-
dimensional metaphors and perceptive interfaces as necessary direction to take in order to
achieve a more natural and effective e-learning experiences (p. 333).
The benefits of such multi-dimensional interfaces can be understood through the effect of
3D virtual artifacts. A 3D virtual artifact is able to provide real communication and
interaction among people beyond the physical-geographical limitations and constraints.

31
An active engagement with real artifacts improves student memory-learning mental
models (Cantoni, Cellario, & Porta, 2003): “student may actively explore existing pre-
built worlds (discovery learning) and build related internal models (constructivism), or
actively create-modify worlds, to fully integrate their own models of the world
(constructionism), while eventually sharing their evolving knowledge representations in a
virtual collaborative environment” (p. 342).
Connolly and Stansfield (2006) described the development of e-learning and
game-based e-learning applications as applied to students and highlight that such
technologies can contribute to help overcome the difficulties in teaching Information
Systems (IS). The games could have the following advantages:
• provide a challenging and complex real-world environment within which to apply their
theoretical knowledge;
• overcome difficulties in dealing with ambiguity and vagueness;
• develop and apply transferable analytical and problem-solving skills;
• develop self confidence and increased motivation;
• allow students time to reflect upon their practice and develop meta-cognitive strategies
capable of adapting to new and evolving situations.
Unfortunately, with financial constraints that educational institutions have, these
applications are still far beyond the possibilities of many.
Course Management Systems
In Dixon’s (2008) literature review about faculty use of courseware to teach
counseling theories she mentioned that over the past decade, higher education has

32
invested heavily in course management systems (CMS) which serve as the teaching
environment for online distance education (Morgan and Schlais, 2005). This is very
beneficial for students who could use this system anytime to access available course
materials. This virtual environment has a determined functionality predetermined by
software and the look and interface is determined by programming. One of the
advantages of this system is that it allows the participation of students who are busy with
their jobs or families, live far away from the location of university’s campus, or just
prefer to learn from home.
Faculty members are often encouraged to teach online courses or to blend online
instruction with face-to-face classroom instruction. From a university administrator’s
perspective, a real advantage of online instruction is the ability to enroll more students
without having to build more classrooms (Bonk and Dennen, 2003).
Online Courses
Faculty became engaged with the idea of using these Course Management
Systems when the increased demand for online learning coincided with wide adoption of
these course management systems by universities, making web-based teaching easier
than before (Bonk, 2006). Problems still persisted and instructors have become aware of
the multiple levels of complexity in learning environments as they attempt to translate an
existing course into a web based version (Sawyer, 2000). The translation of existing
materials into a medium of online courses is not always adequate. Teaching strategies are
different from those of the traditional classroom. Text-based asynchronous

33
communication in online courses has largely replaced lectures, discussions, and printed
hand-outs. In a recent survey of factors important to successful online teaching,
instructors’ need for an online pedagogy ranked significantly higher than their need for
technical expertise (Bonk & Kim, 2006).
Malikowski et al (2007) developed a model for research on course management
systems based on five categories: (a) transmitting course content; (b) evaluating students;
(c) evaluating courses and instructors; (d) creating class discussions; and (e) creating
computer-based instruction. The study found that the instructors most frequently used the
CMS for transmitting course content such as the syllabus, readings, and assignments. A
second most used form of transmitted content was announcements created within the
CMS, followed by the built-in grade book. Two of the categories moderately used were
evaluating students through online quizzes and creating class interactions through
discussion boards. The CMS was rarely used to evaluate course and instructors or for
computer based instruction.
In a study that examined faculty adoption and implementation of features from
Blackboard, West, Waddoups and Graham (2007) found that instructors rarely adopted
all of the features of a course management system. Faculty chose a feature at a time and
re-evaluated the use of other features. Overtime, they experienced technical or
pedagogical challenges. Some grew more comfortable with the tool and tried adapting it
to support different pedagogies. Depending on how successful the instructor was in
overcoming implementation challenges, the instructor chose one of three paths:

34
1. To continue to use the tool or some of its features,
2. To scale down their use of the tool or reduce the number of features used, or
3. Discard the tool completely in favor of other options.
Ely (1999) found eight conditions that contributed to instructors’ successful
implementation of educational technology. Among them were: dissatisfaction with the
status quo, existence of knowledge and skills, availability of resources, availability of
time to learn the technology, existence of rewards or incentives to try it, participation in
deciding how to implement the technology, commitment to the process, and continuing
support from the leadership that showed enthusiasm for the work at hand.
Hybrid and Blended Instruction
Hybrid and blended courses combine the features of online and face-to-face
instruction. For instance, students might attend classes at the university every other week,
alternating with participating in an activity, such as watching an educational video and
posting their responses to the class discussion board. The following week the students
would meet face-to-face, where the teacher begins the class by leading a discussion about
ideas expressed online. This method encourages students to watch the video on their own,
allowing the instructor to use valuable class time for other activities. (Sawyer, 2000)
Students are able to stay connected between class meetings through required
online communications. Instructors report getting to know students better through the use
of online discussion boards, where students are required to contribute their thoughts, than

35
in a face-to-face class where some students do not speak up in discussions (Morgan,
2003). Instruction varies widely within hybrid and blended learning, but both instructors
and students have reported positive opinions of blended instruction, to which some
faculty attributed increased communications with students (Gahungu, Dereshiwsky,
Moan, 2006).
Motivational theories
A concept related to the use of technology in the classroom is related to
motivation. In this section, an overview of the most prominent motivational theories will
be explained and an effort will be made to connect them to the current use of technology
in higher education.
Process theories
Champion (2008), in her literature review of motivational theory, mentioned that
there are two major classifications of motivation theories: content theories and process
theories. The process theory includes expectancy theory together with behavior
modification or reinforcement theory, goal setting theory, and equity theory. All these
theories focus on the importance of how to energize, direct, and sustain behavior (Kini
&Hobson, 2002). Frederick W. Taylor, in his Principles of Scientific Management in
1911, was the one who originally defined this task. His use of the concept was, at the
time, for blue-collar workers only. “The work of every workman was fully planned out
by the management at least one day in advance, and each man received in most cases
complete written instructions, describing in detail the task which had to be accomplished

36
as well as the means to be used in doing the work.” (Taylor, 1992, p. 359) This theory
later known as goal setting theory, states that specific goals influence what a person
achieves and those goals lead to an improved performance. Research has shown that
people who have specific goals tend to perform better compared to those with vague
goals.
According to the theory, a goal is a method by which one can measure one’s
satisfaction; the more goals one reaches the higher one’s satisfaction (Latham, 2004).
Goal setting has become a major factor in many programs. This theory is used to
ensure that employees understand the goals and desired results of the organization’s
programs which involve the tasks. Also, research indicates that feedback boosts the
efficacy of goal setting, Panza (2002) points out that results are measured by the
performance of the organization’s employees. She presents a human performance system
comprised of four elements: expectations, resources, consequences, and feedback. The
driver for the other three is expectations, as they drive the human performance system.
All four elements must be considered in the system as they are linked to, and support, the
process steps and the organizational results. A breakdown in any of the four elements can
reduce the probability of success. Following are the main points of each element:
1) Expectations-performers must know clearly what is expected up front;
2) Resources-performers must have necessary job skills or learning and must be
provided with the tools for required job tasks;
3) Consequences-these should support correct/desired performance;
4) Feedback-performers should receive information about their performance.

37
This feedback should be: relevant, accurate, timely, frequent, and specific (Panza, p. 37).
A second process theory is known as equity theory. Vroom and Deci (1992) stated
that in equity theory “people will be most satisfied and work most effectively when they
believe that their rewards or outcomes are in balance with their inputs.” Equitable
rewards are frequently determined from social norms and social comparative processes.
In this theory, it is important to note that people must be rewarded equitably; those who
are over-rewarded or under-rewarded can become uncomfortable. This theory involves a
social support system that indicates people often compare themselves to others in their
social group. Individuals often desire to maintain fair or equitable relationships,
particularly on the job. For example, a lead team member of a group who receives open
recognition may feel self-conscious when none of the other team members, who worked
equally hard, are recognized.
Another process theory is reinforcement theory. This theory has its base in B.F.
Skinner’s theory of behavior control. “The concept of reinforcement is implicitly
motivational” (Deci, 1992, p. 10). Satterfield (2004) states that reinforcement involves
the idea that rewarded behaviors will be repeated and that incentives constitute the
positive consequences required to ensure repeated behavior. But as has been pointed out:
“Employers intuitively use rewards in their attempts to modify and influence behavior,
but their efforts often produce limited results because the methods are used improperly,
inconsistently, or ineffectively” (Hamner, 1974, p. 69).

38
Many workers are now considered self-managing, which requires more initiative
and commitment on their part than incentives from their employer can elicit. This
commitment or engagement depends on satisfaction which comes from the work itself.
This intrinsic motivation is crucial for a company to keep good workers, as more workers
are choosing to leave jobs that they consider unrewarding (Thomas, 2002). “With global
competition, few organizations can afford the cost of recruiting and training replacements
for many of their workers” (Thomas,2002, p. 8)
Expectancy theory, introduced by Victor Vroom in 1964, has three relationships
to motivational behavior. According to Hersey and Blanchard (1988), the three parts
include “a positive relationship between good performance and rewards, a positive
relationship between effort and performance, and the delivery or achievement of valued
outcomes and rewards” (p.29). In other words if a worker has a high degree of effort, this
translates to increased performance which in turn leads to the reward that is due such a
positive performance. Using the example of the person trying to use technology, a high
effort would include many attempts that work out well. This in turn will lead to positive
feedback and a connection built between effort and achievement that affects future
performance. Hersey and Blachard warn that this could break down if their relationships
do not hold true. If the person trying to use technology develops several online courses
and works hard at developing video courses only to have things go wrong, the system has
broken down. The delivery of value to the outcomes did not play out as expected. In
future positions, the individual would probably work much less at using technology in the
classroom. Essentially, due to this breakdown, the motivation to perform at the standards

39
already achieved would not be present, because the individual is unsure of the delivery of
feedback that he or she feels is due.
Vroom’s Expectancy Theory has been selected for this study because, according
to Fudge and Schlacter (1999), this theory has been rigorously tested and has received
strong support. Smith and Rupp (2003) also indicate that “expectancy theory provides a
general framework for assessing, interpreting, and evaluating employee behavior” (p.
109). “Expectancy theory has also undergone extensive research in business and industry
settings.” (Howard, 1989, p. 201). Expectancy theory has become popular as a means of
understanding motivation. Researchers have used the theory to test in a variety of settings
with a number of adult populations, ranging from university students to public school
teachers.
The results were varied as well, showing that the expectancy component of
motivation is supported by the research, but “the individual elements of the theory are not
consistently supported” (Howard, 1989, p. 201). He further states that the reason for this
inconsistency lies in problems with the methodology and in a model which cannot fully
explain the relation between the expectancy process variables and other variables, such as
need satisfaction or reward system.
Vroom’s Expectancy Theory is often referred to as the VIE theory, standing for
the major components of the theory-valence, instrumentality and expectancy. The theory
uses extrinsic and intrinsic motivators to describe the possible causes for behaviors in the
workplace. The extrinsic motivators are those that bring about satisfaction through
salaries, bonuses, commissions, perks, benefits and cash, while the intrinsic motivators,

40
such as pride of workmanship or the sense of helping customers come to the workers
directly from the work they do (Thomas, 2002).
The VIE theory proposes three conditions that move an individual forward based
on motivation:
1) That the expenditure of personal effort will result in an acceptable level of
performance;
2) That the achieved performance level will bring about a specific outcome for the
person;
3) That the achieved outcome is personally valued (Issac, Zerbe, & Pitt, 2001).
=
Figure 2.1: Formula for Expectancy Theory. From Human Resource Development.
Desimone, Werner, & Harris, 2002.
Vroom stated: “Expectancy is defined as a momentary belief concerning the
likelihood that a particular act will be followed by a particular outcome” (p. 20). His
theory links expectancy with strength values: the greater the strength the more likely that
the act will be followed by a certain outcome. Pinder (1984) stated that if a person judges
that he can achieve an outcome, and then he will be more motivated to try; the higher the
expectancy, then the more likely a person will exert energy to accomplish the outcome.
MOTIVATION
EXPECTANCY
Belief in
possibility of
outcome
INSTRUMENTALITY
Belief in results of
outcome
VALENCE
Desirable or
Undesirable
outcomes

41
The second condition, Instrumentality, according to Vroom (1995), is an outcome
association. Instrumentality is a probability belief linking one outcome (performance
level) to other outcomes (Pinder, 1984). The range of Instrumentality could be:
1) + 1 strongly positive-performing a task will lead to a certain outcome;
2) 0 there is no relationship between the task and an outcome;
3) - 1 strongly negative-performing a task will prevent a certain;
It can take values ranging from -1, indicating a belief that attainment of the second
outcome is certain without the first outcome and impossible with it, to +1, indicating that
the first outcome is believed to be a necessary and sufficient condition for the attainment
of the second outcome (Vroom, 1995, p. 21). Zero instrumentality usually means that
there is no relationship between task and outcome. An instrumentality of -1 is one that
will guarantee a negative outcome, such as being punished for negative actions.
The third condition, Valence, has the same ranges as instrumentality and refers to
the value that an individual places on the outcome. Vroom (1995) refers to valence as
“affective orientations toward particular outcomes” (p. 18). It is important to note that
since valence is affective (emotional), there can be a difference between the valence of
the outcome and the value of this outcome to the person. Vroom states that there may be
substantial discrepancies between the desired outcome and the actual satisfaction. For
example, a person may do his job satisfactorily because such performance may lead to a
promotion.
The most important feature of valence concerns work-related outcomes and has to
do with expectations and not with actual value. This makes expectancy theory abstract.

42
A person perceives a particular task outcome to be positive, negative, or indifferent
according to the satisfaction or dissatisfaction he expects to receive. However, an original
negative valence may later become a positive one. An example is a person who loses his
job but finds that he is healthier, happier, and wealthier with a new job (Pinder, 1984).
Since, as previously indicated, all three factors are multiplied by each other, any
weak factor directly impacts the other two, leading to increased or decreased success. For
motivation to be established the individual must focus on all three factors in order to
reach the desired goal. The individual can only be successful if he believes that he can be
successful in the task, sees the connection between the success and the activity, and
values the results of the success (Huitt, 2001).
The motivational theories described above can be used to help explain why
faculty members use or do not use technology in the classroom. In addition to the
concept both been rewarded tenure, the faculty member in a non-tenure track position
may not use technology because all of his or her uncertainty of using it successfully.
Thus, relative to expectancy theory there would be a high performance level and
therefore no rewards for attempting to use the technology. If the rewards, for example a
pay raise, do not materialize then the need for security, described by a Maslow, would not
be met.
There were several studies that used Vroom’s Expectancy Theory in their
research. These studies focus on links between expectancy theory and leadership, learned
helplessness, performance rating and pay, and faculty research.

43
Issac, Zerbe and Pitt (2001) seek to link expectancy theory and leadership
concepts in order to determine if leader interactions with followers allow the
establishment of higher motivational working environments. The researchers found that
expectancy theory can be used by individuals to achieve their leadership goals by
equipping them with the necessary tools to impact the behavior of their followers. High
levels of performance occur when we establish motivational environments that inspire
followers to achieve levels of performance that meet our expectations and perhaps exceed
their initial beliefs in their own capabilities (Issac, Zerbe & Pitt, 2001, p. 223).
Schepman and Richmond (2003) investigated expectancy theory and the concept
of learned helplessness. This concept of individual psychology states that if people see no
predictable relationship between their actions and the outcomes of those actions, then
they will learn to believe that they have no control over those outcomes. These
researchers looked at one of the key conditions of expectancy theory, expectation. At its
base, employees have to believe that they will have some control over the outcome
associated with their own behavior. In other words, “the employees must believe that
they will have the needed skills/abilities to achieve their performance targets
expectancy.” (p. 405). The study is used to further explore the relationship between
expected control over future outcomes and the different levels of helplessness training.
Schepman and Richmond (2003) conclude that in fact the lack of control may come from
a perceived lack of skills or abilities rather than feelings of low-expectancy. Per Vroom
(1995), expectancy is one important connection between requirements and the
employees’ perception of their ability to fulfill the necessary requirements.

44
Smith and Rupp (2003) looked at expectancy theory in relation to performance
rating, pay scale, and motivation. Workers’ motivation and general morale improve when
they are a part of the decision making processes. The study found that the greater the
possibility of decision making for an employee, the greater the sense of ownership for the
outcomes of the decisions, which in turn lead to more engagement on the part of the
worker. Simply put, people work harder because of the increased involvement and
commitment that comes from having more control and say in their work people work
smarter because they are encouraged to build skills and competencies; and people work
more responsibly because more responsibility is placed in hands of employees farther
down in the corporation (Pfeffer & Veiga, 1999, p. 39).
Chen, Gupta and Hoshower (2006) analyzed expectancy theory and factors that
motivate business faculty to conduct research. This study focused on faculty members’
perceptions of factors that influence research productivity from a behavior perspective
and how these perceptions are translated into the motivation to publish. The study found
a definite correlation between tenured and non-tenured faculty and how these two types
of faculty view intrinsic and extrinsic rewards. This study shows that tenured faculty are
motivated more by intrinsic rewards while non-tenured faculty is more motivated by
extrinsic rewards. Chen, Gupta and Hoshower conclude that with “...successful
application of expectancy theory, we were able to provide a better understanding of the
behavioral intention (motivation) of faculty members’ devotion to research” (p. 180).
Champion (2008) conducted a study regarding Victor Vroom’s Expectancy
Theory, and its impact on employees’ task performance and engagement. The primary

45
question of this study was: “Will the use of Victor Vroom’s Expectancy Theory create a
high valence in a corporate customer service team when it is applied in a pre-training
module?” and to establish the existence of a relationship between expectancy and
improved performance. The researcher predicted that the use of expectancy theory, using
expectancy, instrumentality, and valence, as part of a pre-training module would have a
positive effect of increase employee engagement in their work and its outcome on the
division in general. The results of this study were inconclusive for a number of reasons.
Increasing engagement did indeed seem to aid in accomplishing the goal of management,
which was to decrease the number of errors and decrease employee retraining. Still, this
study is inconclusive, as the statistics do not uniquely support the fact that the results
were impacted only by the inclusion of the pre-training module. The researcher
determined that the application of the theory could be used in other training initiatives to
create a positive impact on the training results.
Several new theories emerged based on VIE: Porter & Lawler’s Expectancy
Theory (1968) and Campbell, Dunnette, Lawler, & Weick’s Hybrid Expectancy theory.
As shown in the Table 2.1, even if different researchers use slightly different terms,
expectancy theories are comprised of two basic components: (1) expectancy and (2)
valence (value of outcomes). In addition to these two factors, Porter & Lawler (1968)
introduce the concepts of (1) abilities and traits, (2) role perceptions, (3) perceived
equitable rewards, and (4) satisfaction. On the other hand, Campbell et al. (1970),
propose external task goals and internal task goals.

46
Table 2.1: Variations from the Expectancy Theory:
Vroom Porter & Lawler Campbell,
Dunnette, Lawler,
& Weick
Expectancy:
Perceived probability
that effort will lead to
good performance.
Effort-Reward Probability: the
probability that reward
depends upon performance and
the probability that
performance depends upon
effort
Expectancy I and
II: Expectancy I is a perceived
probability of goal accomplishment,
given a particular individual and
situation and Expectancy II is a
perceived probability of
receiving first level outcome
(rewards), given achievement of the
task goal.
Valence: Value of
expected outcomes to
the individual
Value of reward (Intrinsic
rewards and/or Extrinsic
rewards): the attractiveness of
possible outcomes to individual.
Valence of first-level
outcomes and second-level
outcomes: first-level outcomes
(incentive or reward) and second-
level outcomes (needs satisfaction)
have specific valences.
Instrumentality:
Perceived probability
that good
performance will lead
to desired outcomes.
There exists a positive
relationship between
performance and rewards
(desirable outcomes or returns to
an individual).
The valence of a first level outcome
is a function of the
Instrumentality of that outcome for
obtaining second level outcomes and
valences of the relevant second level
outcomes.
Abilities and Traits
Role Perceptions
Perceived Equitable
Rewards
Satisfaction
First-level outcomes
(Incentive or Reward)
Second-level
outcomes (needs
satisfaction)
External task goals
Internal task goals
Essentially, the motivation to use technology relates to personal needs and if using the
technology in the classroom will not meet those needs then it will be futile for the faculty
member to attempt to use it. The next discusses the use of technology use in higher
education.

47
Use of technology in higher education
The use of technology in education is a major issue today for administrators and
faculty members. When academics gather to discuss technology, there is a great deal
more to discuss than the use of computers, including video, audio tapes, language
laboratories, and various forms of telecommunications.
In a report from the American federation of teachers (ATF, 1996), sponsored by
AFL-CIO, concerning technology in higher education, there was information published
about how technology was used in higher education. They found some interesting
information. “According to one study, nearly one third of faculty has made use of
software in the classroom.” (p.4). It was also noted in the report that the task force,
assigned to investigate the use of technology for instruction, believes the number “who
use technology for instruction as a matter of course is probably lower, between five and
ten percent” (p.4). From the AFT’s report it was unclear what percentage of faculty
members were using software in their classrooms. The report was also vague concerning
the use of electronic mail in higher education. While 13% of the faculty may use
electronic mail for classroom purposes, another 20% may use e-mail for research or other
purposes.
MacDonald and Watson (1970) provided an example of technology being used in
the classroom. They are librarians at Florida Southern College (FSC). In their article, they
pointed out that in the fall of 1996, FSC had installed “a campus-wide network for
electronic mail and graphic Internet and World Wide Web access. (p.1).This brought an
48
interchange from the information superhighway to the FSC campus. The authors
volunteered to use this new technology in the classroom. They used sections of the
freshman seminar to implement the new technology. The technologies they used included
presentation software in class, electronic mail to communicate assignments and to
facilitate student-instructor, and the WWW for research purposes and a class project.
They found that “nearly all students met basic course requirements, with many exceeding
expectations” (p.3). They also noted that the use of such technology can be implemented
in the classroom and provides an example of what is currently happening on college
campuses.
A study from Rosen (1995) demonstrated the steps an instructor should take to
bring the WWW into the classroom. Rosen points out “it is important to remember that
the WWW is merely a tool, as it is chalkboard, overhead projector, or VCR, tools don’t
teach” (p.1). This is important to understand, as many instructors may believe that
introducing technology into the classroom means taking the instructor out of the role as
teacher. The concept is to integrate the tools into the classroom and not to have the
technology to replace the instructor. Rosen (1995) provides steps to integrate the WWW
into the classroom. She says, the instructor must be comfortable with the technology and
the technology must help the students meet the goals of the class. Implementing the
WWW is a bit tricky because of the amount of information available.
Rosen (1995) notes that specific goals are extremely important to avoid
overwhelming the students with the amount of information available. Rosen notes that

49
specific goals are extremely important to avoid overwhelming the students with the
amount of information available. She also notes that instructors using technologies, such
as the Internet, may encounter technical problems. There are ways around this and
instructors can use many resources available on most campuses to help with what she
calls” anti-glitch insurance” (p.2).
A final important point is that there must be some sort of assessment for the
technology. This helps instructors evaluate how students learn and how technology
enhanced that learning. She suggests that faculty members become creative in their
assessments and to move away from the “traditional test of the facts” (p.3).
While there are many positive uses for the new and emerging technologies, there
are also warnings about negative aspects of technology. Nigohosian (1997) mentioned
that World Wide Web is a powerful tool, but the quality of information it provides also
can be difficult to assess. Using his own students he demonstrated an example his
community college history course. The students were asked to search the word “slavery”
in the search box and analyze the results. He was trying to make the point that from the
25 hits that were returned to the viewer, only about 3 were of any value at all. Nigohosian
(1997) emphasized that using technology could help the learner by finding many high
quality sources if the learner identified the research needs.
Another important issue is the validity of the information. The researcher should
review the author’s reputation, the currency of the information and look for any
affiliations or bias in the article related to external motivation. Sometimes articles are

50
being written to boost the value of a product as a result of author or article sponsorship
from the maker of a product being discussed. That’s why some materials might be
subjective and require a careful review. While there are potential problems in doing the
research on the internet, Nigoshosian (1997) believed that there are opportunities for the
savvy researcher. However, he warns that the future may find “students subject to a more
massive manipulation by the media and the information industry” (p.9).
The next chapter will describe and discuss in detail the methodology, variables
and procedures used in this study.

51
CHAPTER THREE
RESEARCH METHODOLOGY
The purpose of this study was to investigate faculty motivation associated with
the use of course management systems to support classroom learning and teaching.
Course Management Systems (CMS) have been adopted by many institutions of higher
education and they are still mostly used for administrative purposes and less for teaching.
With the emergence of new mobile technologies, students are demanding that faculty
diversify their teaching methods and include CMSs on a larger scale. There are several
course management systems available to be used in higher education. Currently, one of
the most popular CMSs used is Blackboard Academic Suite. According to a 2009 survey
done by Instructional Technology Counsel, Blackboard’s market share among ITC’s
constituents was about fifty nine percent. Moodle and Sakai are Blackboard’s biggest
competitors.
For this study, Blackboard was selected because it of its wide spread use and
familiarity. The aim of this study was to look at what motivates faculty to use a Course
Management System and attempt to explain how the process of motivation takes place
using Vroom’s Expectancy theory.
This chapter includes a description of the research design, the identification of the
research variables, and the statistical procedures used in the study. Additionally, the
chapter covers the instrumentation, data collection techniques, and the data analysis for
the study.

52
Research Design
The research design used in this study was a combination of quantitative and
qualitative methods. Using both methods helped the researcher examine different
relationships between the variables of this study.
The purpose of a quantitative research design was to generalize from a given
sample to a similar population so that inferences would be made about a behavior or
characteristic (Creswell, 1994). Quantitative research methods were used to characterize
faculty by determining what proportion of them has certain behaviors, behavioral
intentions, attitudes, and knowledge related to Blackboard usage and motivation.
The qualitative research design method used in this study helped design some
aspects of the survey questions that were used to gather information relevant to this
study. Open-ended questions were used to obtain more information from the participants.
The combination of the two methods of research allowed assessing what qualitative
methods or quantitative methods could not accomplish individually.
The data were collected during a specified period of time from the targeted
sample population, which were analyzed and described to explain the relationships
between variables of the study using the appropriate statistical procedures. Creswell
(1994) stated that a researcher must “provide a rationale for the data collection procedure
by using arguments based on costs, availability, and convenience” (p. 119). The research
survey was developed with the help of Subject Matter Experts and based on previous

53
Expectancy theory (VIE) and Course Management Systems (CMS) research. The study
instrument used was modified to meet the needs of this research.
The research model was tested using Vroom’s Expectancy theory (VIE). The
expectancy theory of motivation of Victor Vroom, unlike Maslow’s and Herzberg’s
theories does not concentrate on needs, but rather focuses on outcomes. Thus this study
was interested in examining what outcomes influence faculty motivation to use
Blackboard. The specific aim of this study was to (1) investigate if the elements of VIE
theory formula predict faculty motivation to use Blackboard and (2) examine the
relationship between Valence, Instrumentality, Expectancy and Faculty Motivation to use
Blackboard tools.
Research Questions and Hypotheses
The following research questions guided this study:
1. Does the VIE model predict faculty motivation to use Blackboard?
2. What is the strongest motivational factor that drives faculty to use course
management tools in facilitating classroom teaching?
3. Is there a relationship between Valence and a faculty member’s motivation to
use Blackboard tools for facilitating classroom teaching?
4. Is there a relationship between Instrumentality and a faculty member’s
motivation to use Blackboard tools for facilitating classroom teaching?
5. Is there a relationship between Expectancy and a faculty member’s motivation
to use Blackboard tools for facilitating classroom teaching?

54
6. Does a faculty member perceive using Blackboard course management tools as
saving time?
7. Is there a relationship between utilization of course management tools and
gender?
Research Hypotheses
To address the research questions, the following hypotheses were tested.
Hypothesis 1: There is a relationship between faculty member’s motivation to use
Blackboard and the Elements of VIE theory.
To test the hypothesis, the researcher conducted a multiple regressions analysis to view
the relationship between faculty motivation to use Blackboard tools and the elements of
Expectancy Theory (VIE).
Hypothesis 2: Valence is useful in predicting a faculty member’s motivation to use
Blackboard.
To test this hypothesis, a regression analysis between faculty motivation to use
Blackboard tools and Valence was conducted.
Hypothesis 3: Instrumentality is useful in predicting a faculty member’s
motivation to use Blackboard.
To test this hypothesis a regression analysis between faculty motivation to use
Blackboard tools and Instrumentality was conducted.

55
Hypothesis 4: Expectancy is useful in predicting a faculty member’s motivation to
use Blackboard.
To test this hypothesis the researcher utilized a regression analysis between faculty’s to
use Blackboard tools and Expectancy.
Hypothesis 5: A faculty member perceives using Blackboard course management
tools as saving time.
The researcher was interested to see if Blackboard is perceived as saving time when it is
used in the didactic process. T-tests were used to analyze the data to see if the answers
support researcher’s claim that Blackboard did save time.
Hypothesis 6: There is a relationship between utilization of course management
tools and gender.
The question related to gender and the use of course management tools was addressed by
doing a non-parametric analysis between gender and use of Blackboard tools, a Chi
Square analysis helped calculating this relationship.
Sampling and Data collection procedure
This study used a stratified random sampling design to conduct the self-
administrated survey. Since this study was intended to analyze motivation in academia,
the target population consisted of faculty members from twelve universities included in
the Atlantic Coast Conference (ACC). The following twelve universities are part of this
organization:

56
Boston College,
Clemson University,
Duke University,
Florida State University,
Georgia Tech,
University of Maryland,
University of Miami,
University of North Carolina at Chapel Hill,
NC State University,
University of Virginia,
Virginia Tech, and
Wake Forrest.
After a background analysis, only 11 schools listed in the ACC used Blackboard
as their main Course Management System as of October, 2009. Georgia Tech was using
T-Square since 2007, thus faculty from Georgia Institute of Technology were not
included in this study. During the process of data collection and analysis, the survey
results revealed that Virginia Tech was in the process of converting to Scholar, the
University of Virginia was moving to Collab Course Management System and NC State
to Moodle.

57
Sample size
The sample is the selected group of people chosen to participate in a study. The
researcher decided to randomly select ten participants from five specific colleges:
Business, Arts, Sciences (Engineering), Education, and Health or Medicine. This
procedure selected forty faculty members from every university, resulting in an initial
total of 440 survey participants.
After the first email was sent to faculty, eight invalid email addresses were
reported that they could not be delivered. In the second phase of the data collection, the
researcher added another eight participants from the ACC universities that were still
using Blackboard. This was done to compensate for the loss of those eight email
addresses that were undeliverable. The first phase of the data collection showed that
another three schools from the ACC were transitioning from Blackboard to a different
courser management system. All the selected participants were added to a database that
was used during the data collection. The contact information of every individual
participant was publicly available on their institutional websites.
Usually, the sample size needed for a statistical analysis is dependent on the type
of the analysis. When calculating a sample size, several factors are taken into
consideration. These are: the power of the study, the effect size, variance and finally the
level of significance. The power of a statistical test is the probability that the test will
reject a false null hypothesis. As power increases, the chances of a Type II error decrease
(Cohen, 1988).

58
The level of significance in hypothesis specifies the maximum allowable
probability of making Type I error. The most common level of significance is 0.05 and
0.01.
It is also important to take into consideration the type of analysis to be conducted.
This type of analysis will determine the appropriate number of observations needed to
make a proper statistical inference. Since the main analysis in this study is based on
multiple regressions, the minimum sample size required to run this study, according to
the statistical calculators of Soper (2010), was 76 participants. The following parameters
were used in the calculation of the sample size: alpha level of 0.05, three predictors, an
anticipated effect size of 0.15 (by convention, effect sizes of 0.02, 0.15, and 0.35 are
considered small, medium, and large, respectively) and a statistical power level of 0.8.
The statistical power should be greater or equal to 0.8 (Keuhl, 2000).
Development of research instrument
The instrumentation of this study was developed based on findings from a
comprehensive literature review. Specifically, previous studies of the expectancy theory
by Chiang (2006); Miskel, Bloom & McDonald (1983) and research based on motivation
were analyzed. Advice and recommendations from subject matter experts knowledgeable
in Vroom’s Expectancy theory was used to design and modify the research instrument in
this study.
Previous research showed that that faculty motivation is affected by internal and
external factors that result from subjective beliefs of choices among various options of
effort leading to different outcomes. Typically, the following strategies to motivate

59
faculty are used: encouraging creativity and peer coaching; financial and moral support;
providing ongoing staff development; offering flexible technology choices; addressing
faculty complaints; explaining the relevance of educational technology, etc (Ennis, W
&Ennis, D. 1996). Several other motivation strategies were selected based on their
importance and relevance to be included in the design of the survey. Those strategies
were included in the questionnaire of the survey for interviewing faculty that was using
Blackboard.
The researcher referred to the study of Colorado & Butler (2007) about the
Blackboard features used by faculty to identify the most useful and least useful
Blackboard tools to be included in some of the survey questions. According to their
survey the top five most useful Blackboard features were: Assignments, Gradebook,
Email, Discussion Board and Announcements. The least five Blackboard features were:
Electric Blackboard, Virtual Classroom, Adaptive Release, Virtual Chat and Address
Book. Different features in Blackboard have been observed by other scholars (Anderson,
2003; Halawi and McCarthy, 2007; Heaton-Shrestha, Gipps, Edirisingha, and Linsey,
2007; Woods, Baker and Hooper, 2004).
Another source for the development of the instrument was the Expectancy theory
of motivation developed by Vroom (1964), which explains the process of individual
decision making for various behavioral alternatives. The original expectancy theory is
calculated using the following formula:
Motivation force= Valence x Instrumentality x Expectancy

60
The force of motivation is theorized to be a product of expectancy,
instrumentality and valence. Vroom proposed that each individual could use this formula
to carry out mental calculations, which are approximated by this formula, resulting in a
force of motivation performed in action. The elements of the Expectancy theory used in
this study were in a multiple regression using an additive model. Such as Expectancy plus
Instrumentality and Valence were predicting Faculty motivation to use Blackboard tools,
not to be confused with the Force of Motivation that is defined by a multiplication in
Vroom’s theoretical model.
Questions related to expectancy were developed taking into account that
expectancy is based on the perceived effort-performance relationship. One’s effort should
lead to the desired performance and is based on the past experience, self-confidence, and
the perceived difficulty of the performance goal. Expectancy could be influenced by
individual’s past and personal experience with this course management tool.
Instrumentality is based on the perceived performance-reward relationship.
Instrumentality is the belief that if one does meet performance expectations, he or she
will receive a greater reward. Both internal and external factors were taken into
consideration when the survey questions were developed. Internal factors included:
personal job control, feeling of accomplishment, faculty reputation, etc. Among external
factors the researcher included: better pay, promotions, and better student evaluations.
Valence is the value the individual places on rewards. This is a function of needs,
goals and values. Vroom (1964) mentions “Valence” and Porter & Lawler (1968) state

61
“value of reward”. Regardless of the terms, these concepts represent individual’s
subjective judgment about possible outcomes. As a result, there can be substantial
discrepancy between the anticipated value of an outcomes and the actual value from an
outcome (Vroom, 1964).
Survey instrument
To collect data, the researcher used a questionnaire consisting of forty questions.
The instrument consisted of both open-ended questions and multiple choice questions
(Appendix A). Among the questions asked, there were thirty two related to the subject
researched and eight demographic and classification questions. For data confidentiality
and tracking each participant was assigned a number for data encoding.
To measure each variable, the researcher asked several questions per each variable.
Questionnaire:
The questions of the survey were divided into several sections:
Questions related to experience and use of Blackboard
This part of the survey consisted of two questions related the use of Blackboard.
The first question could be answered with a yes/no. A “yes” answer, allowed the
participant to continue with the regular survey. If a participant selected the “no”
answer, that took the participant directly to the demographic section and asked the
person several questions about their decisions for not using Blackboard. Question two
asked about the number of courses taught with Blackboard.
Questions related to expectancy

62
There were seven questions designed to measure a participant’s beliefs about the
probability of certain outcomes when using Blackboard. Questions related to
Blackboard included: spending more time setting up courses; saving time on
professorial activities; helping better organize course materials; engaging students
with different learning styles; extending teaching beyond classroom; leading to a
feeling of accomplishment and doing the job more effectively.
Questions related to instrumentality
The questions related to instrumentality measured the probability of getting
certain rewards attainable while using Blackboard. Participants were asked opinions
about: getting better pay, opportunities for promotion, getting better ratings on
student evaluations, improving reputation among colleagues and department chairs,
having more control over the job by using the spare time on other activities, having a
feeling of accomplishment, having a better reputation among students and that the
department values their use of Blackboard.
Questions related to valence
Questions in this section were similar to those that measured instrumentality.
Participants were asked to rate the importance of each outcome that might result from
using Blackboard, namely: getting better pay, opportunities for promotion, getting
better ratings on student evaluations, improving reputation among colleagues and
department chairs, having more control over the job by using the spare time on other
activities, having a feeling of accomplishment, having a better reputation among
students and that the department values their use of Blackboard.

63
Questions related to satisfaction using Blackboard
The researcher developed four satisfaction related questions in this section. The
purpose of this section was to estimate the level of satisfaction with Blackboard. Two
of the questions asked about the level of effort in the past and present and two
questions about their experience and satisfaction in using Blackboard.
Questions related to motivation to use Blackboard tools
Nine Blackboard tools were selected for these questions. These tools fell into two
categories: tools that are most useful and the least useful. These tools included:
Course assignments, Grade book, Discussion board, Email, File exchange, E-
reserves, Virtual classroom, Calendar and Adaptive release.
Questions related Intention to use Blackboard tools
Intentions are the most important factor when forming one’s process of
motivation. Three questions were designed to measure this construct. Participants
were asked to rate their likelihood of using Blackboard next semester, the amount of
money they would pay for Blackboard if they had to buy it and how likely they were
to recommend this Course Management System to other colleagues.
Demographic questions: Gender, Age and Position or Title, etc.
This section of the survey had two sections. The first was for users of Blackboard
and the second for non users. The participants were asked to fill out the demographic
information that was used for classification purposes. Non-users had one
supplemental question about the reasons behind not using Blackboard. They were
given several answer options plus a fill in the blank response.

64
Variables
In this section the researcher listed the variables used in this study and explain
how they were defined.
Faculty Motivation to use BB tools is a cumulative variable based on the participants’
scores from nine questions related to motivation to use Blackboard tools (Q30). The
numerical value for this variable was computed using the formula below. The names of
the variables listed were names of variables used in SPSS.
TotalMotivationBBTools= ( MotCourseAssign + MotGradeBook +
MotDiscussBoard + MotEmail + MotFileXchange + MotEreserves +
MotVirtualClass +MotCalendar + MotAdaptiveRelease)/9.
Where TotalMotivationBBTools denoted the variable Faculty motivation to use BB tools,
and the factors in the parenthesis denote each motivation to use each tool respectively.
This variable was the dependent variable in the multiple regression analysis.
Expectancy was one of the independent variables. Expectancy numerical values have
been obtained from questions three through eight of the survey. The following formula
was used to calculate the variable:
TotalExpectancy= (E1TimeSetup +E2SaveTime + E3BetterOrgnz +
E4EngageStud + E5ExtendClass +E6FeelingAccom +E7DoJobEffect)/7
.
Variables in the parenthesis are marking expectancy measured from seven questions.
Coding: E-stands for expectancy; followed by the number of the expectancy question and
a short description.
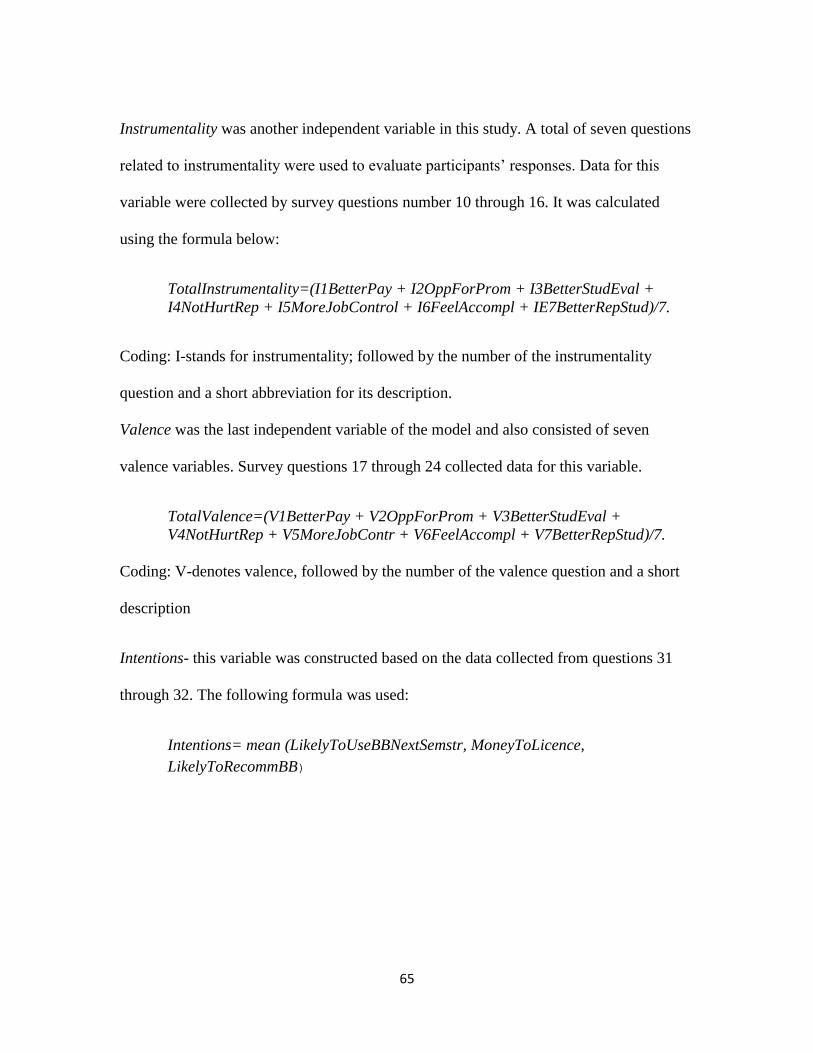
65
Instrumentality was another independent variable in this study. A total of seven questions
related to instrumentality were used to evaluate participants’ responses. Data for this
variable were collected by survey questions number 10 through 16. It was calculated
using the formula below:
TotalInstrumentality=(I1BetterPay + I2OppForProm + I3BetterStudEval +
I4NotHurtRep + I5MoreJobControl + I6FeelAccompl + IE7BetterRepStud)/7.
Coding: I-stands for instrumentality; followed by the number of the instrumentality
question and a short abbreviation for its description.
Valence was the last independent variable of the model and also consisted of seven
valence variables. Survey questions 17 through 24 collected data for this variable.
TotalValence=(V1BetterPay + V2OppForProm + V3BetterStudEval +
V4NotHurtRep + V5MoreJobContr + V6FeelAccompl + V7BetterRepStud)/7.
Coding: V-denotes valence, followed by the number of the valence question and a short
description
Intentions- this variable was constructed based on the data collected from questions 31
through 32. The following formula was used:
Intentions= mean (LikelyToUseBBNextSemstr, MoneyToLicence,
LikelyToRecommBB)

66
Data Analysis
Pilot study
A pilot study was conducted before the actual data collection. The aim of this
procedure was to test the reliability and validity of the study instrument. The pilot study
was conducted using 10 faculty members at Clemson University. Surveys were
distributed to the committee members, who selected 10 people in their departments and
asked them to fill out the questionnaire. The main concern of the researcher was to make
sure that the questions being asked were understood and produced the desired answers
related to the VIE elements. All of the participants were asked to evaluate the survey and
provide suggestions. Feedback from these sources helped the researcher better understand
how effectively the instrument measured the variables of the research questions. Upon
completion of the pre-testing, comments were made to rephrase certain questions,
eliminate filler words and be more concise on certain time phrases. Overall, the
participants in the pre-testing phase were satisfied with the survey and suggested to
modify the following:
1. Move all the questions related to demographics and classification to the end of the
survey.
2. Change the rating scale from seven to five items. It was going to benefit the
participants by giving them fewer options to choose from, as a result reducing the
time needed to respond to the survey, and for the researcher, facilitating the
process of data coding and analysis.

67
3. Change the wording in two survey questions (13, 21) turning them from negative
to positive implications, i.e. Not hurting to improving. These changes made the
rating scales consistent and positive, also improved the readability and helped the
participants better understand the questions.
4. Reword and shorten the directions for each section of the survey.
Validity
The validity of the instrument in this study was assessed through content validity,
pre-testing and a pilot study.
Content Validity
The questions of this survey instrument were designed taking into consideration
formats, recommendations and wording specific to the Expectancy theory. Expectancy
questions typically have to address personal beliefs from effort- performance
relationship. Instrumentality assesses the probability of getting a reward in the
performance-outcomes relationship. Valence estimates the subjective value each
individual places on rewards.
Internal consistency was improved as a result of changing the problematic survey
questions. Being asked to estimate the likelihood of each event occurring, the initial
question of “Not being punished for not keeping up with school policies” was modified to
“Improving my reputation among colleagues and department supervisors”. Also
“Nothing, my department does not value the use of this course management tool was

68
changed to “Overall, my department values the use of this course management tool.” The
negative wording seemed to confuse most the participants involved in the pilot test.
Reliability Test
To test the reliability (coefficient alpha value) of the constructs the researcher
tested all the items of the survey except for the demographic and classification part. A
coefficient of 0.747 was achieved indicating a good level of reliability. A separate test
was conducted for each construct and component. The results of this test are presented in
the Table 3.1 below:
Table 3.1: Cronbach’s alpha for questions of the survey
Constructs and Components Coefficient Alpha
Total Expectancy .829
E1-Time to setup .645
E2-Time I save .863
E3-Better organization of courses .898
E4-Engage students with different learning styles .854
E5-Extend my teaching beyond classroom .851
E6-Feeling of accomplishment .906
E7-Do my job more effectively .792
Total Instrumentality .757
I1-Better pay .680
I2-Opportunities for promotion .922
I3-Better student evaluations .686

69
Table 3.1 Continued
I4-Improving reputation among colleagues .473
I5-More Job control .906
I6-Feeling of accomplishment .909
I7-Better reputation among students .768
I8-Department values the use of CMS .714
Total Valence .656
V1-Better Pay .656
V2-Opportunites for promotion .780
V3-Better student evaluations .853
V4-Improving reputation among colleagues .322
V5-More job control .875
V6-Feeling of accomplishment .928
V7-Better reputation among students .750
V8-Important that department want to use CMS .085
Data collection
Taking into consideration that this was a study of a technological tool, the
researcher decided to use a web based survey, eliminating the need to mail regular paper
surveys. This method of data collection was less costly, relatively easy and took less time
compared to regular mail or personal survey. According to a recent study, the survey
medium does not seem to have a significant effect on overall study results (Walt,
Atwood, & Mann, 2008).

70
Before any data collection could be done, the survey was approved and mandated
by the Institutional Review Board at Clemson University (Appendix C), which was
necessary according to Federal laws and regulations. The surveyor had to ask permission
from every IRB office of each university participating in the study. This was done at the
recommendation of Clemson IRB office.
To facilitate the process of data assessment, the selected faculty members
received a customized standard letter (Appendix B) via email and were asked to complete
the survey online. A letter explaining the purpose and survey questionnaire was included
in that email. The letter contained a link in the body of the message, redirecting the
participant to www.surveymonkey.com where the survey instrument was located.
The researcher had to take into consideration that even though Blackboard was
used at the universities included in this study, there was no guarantee that all the people
who had been selected to participate were users of this CMS. Because of this, logic
questions were added to the survey, where faculty members that did not use this tool were
redirected to a short non-user survey, asking them about the reasons for not using
Blackboard. This allowed collecting supplemental statistical data about the non-users of
Blackboard.
Thirty days were dedicated to data collection procedures. Partial or delayed
answers were eliminated from the study. There was a courteous follow up by email to
remind the participants about the survey completion. Upon the completion of data

71
collection, all the information was downloaded from the web site to a secure location and
encoded accordingly.
Data coding
Data entry and coding in this study was done in three steps:
1. Coding of the survey questionnaire
2. Initial data entry and output
3. Final data retrieval and coding for statistical analysis.
Coding the Questionnaire
The questions of the survey were designed using a five point Likert-type scale. The
response to each statement was coded to numerical values ranging from one to five.
Depending on the questions the values of the scales had different descriptions.
In the section of the survey where expectancy was evaluated the numerical option
indicated the following:
1-Never 2-Seldom 3-Sometimes 4-Often 5-Almost Always
In the sections concerning instrumentality and intentions the answer options were:
1-Not likely at all 2-Somewhat likely 3-50/50 chance 4-Quite likely 5-Extremely likely
For Valence section the answer options were:
1-Less important 2-Moderately important 3-Important 4-Quite important 5-Very
important
In the section where participants were asked to rate their experience using Blackboard,
the answer options were:
1-Very low 2-Low 3-Moderate 4-High 5-Very high

72
Questions 28 and 29, related to the level of satisfaction using Blackboard, as well as the
section related to the motivation to use Blackboard tools both had the following options:
1-Not at all 2-Not very 3-Neutral 4-Somewhat 5-Very much
The statement evaluating the license price in question 32 had the following scales:
1) $0 to$100 2) $100 to $200 3) $300 to $400 4)$400 to $500 5)$500+
Upon the initial data entry process, the hard copy of the survey was printed and data
was verified to control any data entry errors. The last step of the process consisted of
downloading the raw data from the dedicated survey web site and inserting all the data
into a spreadsheet of study variables.
Survey Data Analysis
The data resulting from this study were analyzed using SPSS for Windows version 17.
Descriptive Statistics
Descriptive statistics provided the researcher with an overall view of the
distribution of data. In order to have a full data set and to make sure that all the questions
of the survey were answered, missing values in this study were controlled by a JavaScript
code embedded in the online questionnaire. If a participant skipped or missed an item, the
JavaScript code on the survey page reminded the participant to complete all items before
the submitting the answers.
It was important to examine outliers because they can cause a regression model to
be biased and affect the values of the estimated regression coefficients. The researcher

73
was able to assess the presence of outliers through the values of residuals. Cook’s
distance in SPSS showed how significant those distances were. Means and standard
deviations provided the researcher an indication of the centrality and variability of the
data. Correlation matrixes provided an overall view of the correlation between variables.
Normality of data was identified through a histogram with normality curve.
The following relationships were analyzed:
Expectancy, Instrumentality, Valence and Motivation to use Blackboard tools
Expectancy and Motivation to use Blackboard tools
Instrumentality and Motivation to use Blackboard tools
Valence and Motivation to use Blackboard tools
Intentions and Time
Gender and Blackboard use.
Multiple Regression Analysis
A multiple regression analysis was conducted using SPSS to assess the
importance of the three variables: expectancy, instrumentality and valence.
The multiple regression equation was represented by the following:
Faculty Motivation (Y) = Bo+B1E+B2I+B3V
The values for the weights, Bo and the Bjs, were determined using the method of least
squares.
In order to draw the correct conclusions about the regression there were several
assumptions examined concerning multiple regression analysis that needed to be met.
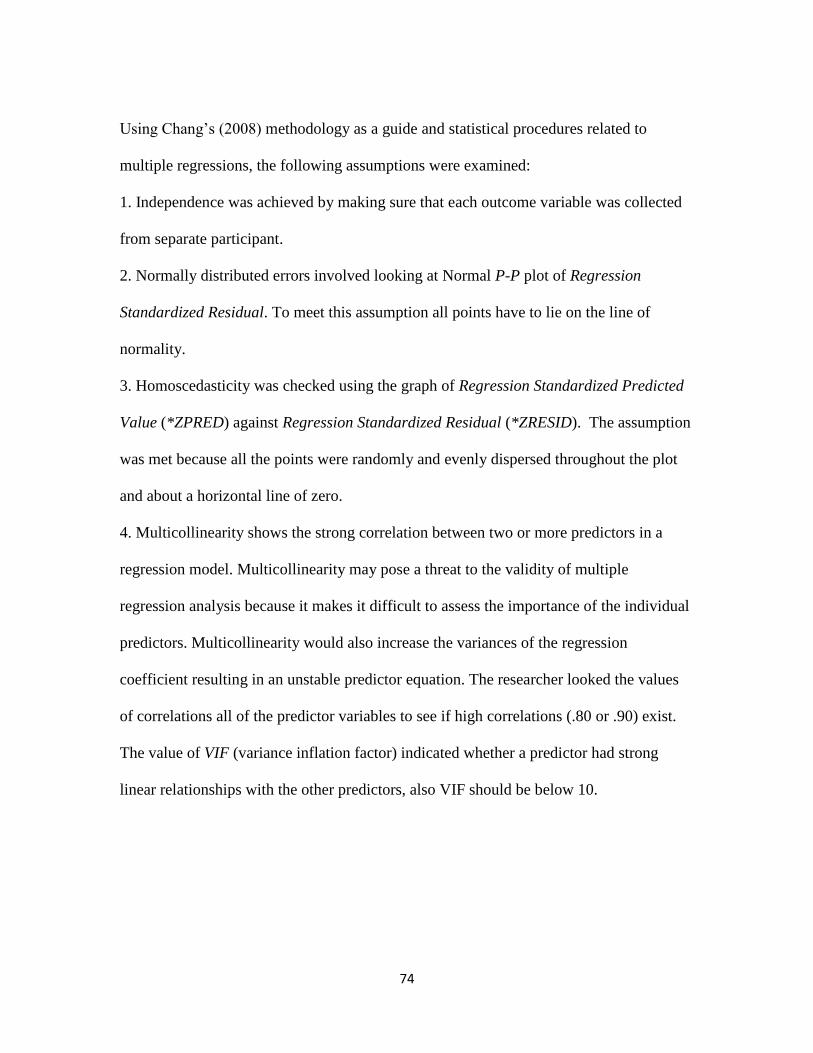
74
Using Chang’s (2008) methodology as a guide and statistical procedures related to
multiple regressions, the following assumptions were examined:
1. Independence was achieved by making sure that each outcome variable was collected
from separate participant.
2. Normally distributed errors involved looking at Normal P-P plot of Regression
Standardized Residual. To meet this assumption all points have to lie on the line of
normality.
3. Homoscedasticity was checked using the graph of Regression Standardized Predicted
Value (*ZPRED) against Regression Standardized Residual (*ZRESID). The assumption
was met because all the points were randomly and evenly dispersed throughout the plot
and about a horizontal line of zero.
4. Multicollinearity shows the strong correlation between two or more predictors in a
regression model. Multicollinearity may pose a threat to the validity of multiple
regression analysis because it makes it difficult to assess the importance of the individual
predictors. Multicollinearity would also increase the variances of the regression
coefficient resulting in an unstable predictor equation. The researcher looked the values
of correlations all of the predictor variables to see if high correlations (.80 or .90) exist.
The value of VIF (variance inflation factor) indicated whether a predictor had strong
linear relationships with the other predictors, also VIF should be below 10.

75
CHAPTER FOUR
FINDINGS AND ANALYSIS
The purpose of this study was to determine if the elements of the Expectancy theory
predict faculty motivation to use a course management system like Blackboard. The
collected information served for the investigation of the following specific research
questions:
1. Does the VIE model predict faculty motivation to use Blackboard?
2. What is the strongest motivational factor that drives faculty to use course
management tools in facilitating classroom teaching?
3. Is there a relationship between Valence and a faculty member’s motivation to
use Blackboard tools for facilitating classroom teaching?
4. Is there a relationship between Instrumentality and a faculty member’s
motivation to use Blackboard tools for facilitating classroom teaching?
5. Is there a relationship between Expectancy and a faculty member’s motivation
to use Blackboard tools for facilitating classroom teaching?
6. Does a faculty member perceive using Blackboard course management tools as
saving time?
7. Is there a relationship between utilization of course management tools and
gender?

76
From 448 faculty members surveyed, 121 of them responded to the web survey.
Among the respondents, 101 indicated that had used Blackboard previously and twenty
had not. The response rate to this survey was twenty seven percent.
Data Collection
The procedure of data collection started with the input of contacts into the
database on the dedicated website (surveymonkey.com). The first email invitation for
participation was sent on February 23, 2010 to a list of 448 people that had been
previously selected and categorized. To remind the participants about the completion of
the survey, a follow-up email was sent on March 10, 2010. The second email was sent to
371 participants who had not completed the survey before March 10, 2010. The
programming on surveymonkey.com allowed the message to be sent just to the list of
participants who had not yet responded. Four weeks into administration of the survey
provided 121 responses; twenty people had no previous experience or were not users of
Blackboard. The initial design of the survey allowed collecting some information about
non-users of Blackboard as well. Demographic, classification and information about the
reasons for not using this Course Management System was collected as well.
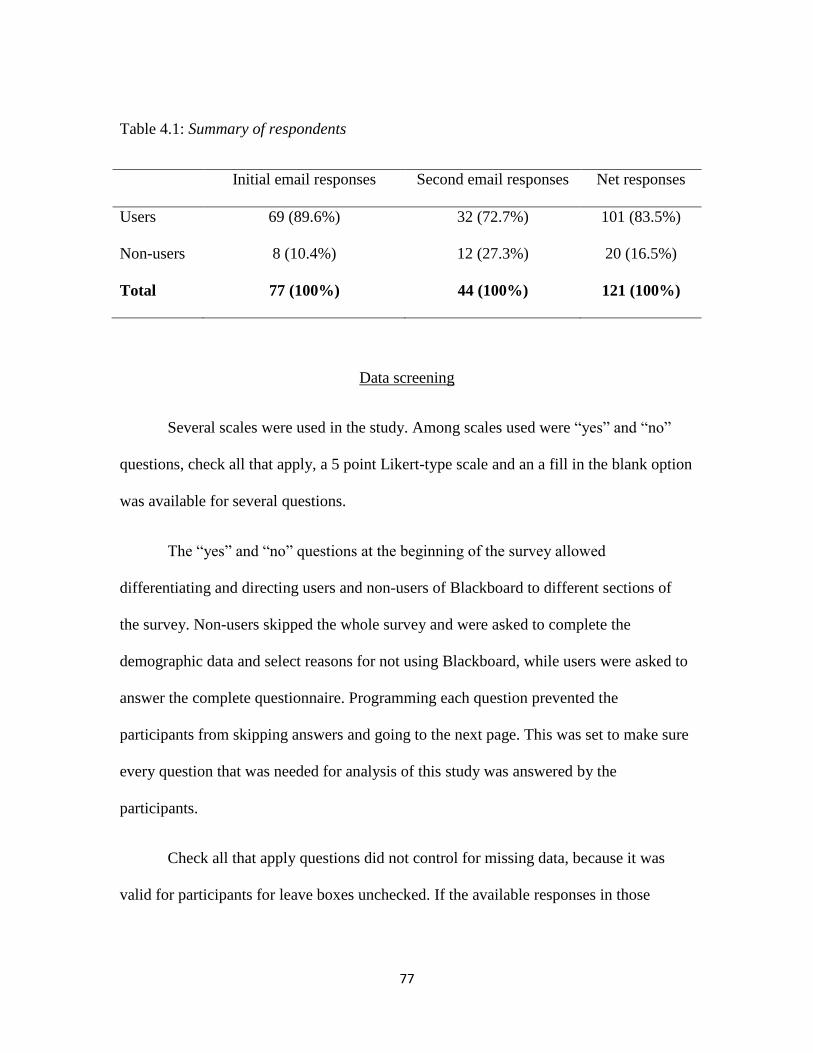
77
Table 4.1: Summary of respondents
Initial email responses Second email responses Net responses
Users 69 (89.6%) 32 (72.7%) 101 (83.5%)
Non-users 8 (10.4%) 12 (27.3%) 20 (16.5%)
Total 77 (100%) 44 (100%) 121 (100%)
Data screening
Several scales were used in the study. Among scales used were “yes” and “no”
questions, check all that apply, a 5 point Likert-type scale and an a fill in the blank option
was available for several questions.
The “yes” and “no” questions at the beginning of the survey allowed
differentiating and directing users and non-users of Blackboard to different sections of
the survey. Non-users skipped the whole survey and were asked to complete the
demographic data and select reasons for not using Blackboard, while users were asked to
answer the complete questionnaire. Programming each question prevented the
participants from skipping answers and going to the next page. This was set to make sure
every question that was needed for analysis of this study was answered by the
participants.
Check all that apply questions did not control for missing data, because it was
valid for participants for leave boxes unchecked. If the available responses in those

78
questions did not meet the conditions of the respondent, they had a chance to fill the
“other” option that allowed for input of personalized text.
During the initial process of data collection, feedback from survey participants
allowed correcting some programming issues that were not obvious during the pilot test
of the survey. Specifically, in the “check all that apply question”, there was a code that
would not allow leaving the boxes unchecked and just choosing “Other.”
Descriptive Analysis
Demographic data collected from both users and non-users of Blackboard
included answers to questions related to gender, age, years of teaching in higher
education, specialization area, faculty rank and tenure status. For descriptive analysis,
data from 121 respondents was used. Only 101 participants who used Blackboard were
included in the analyses involving multiple regressions.
Findings
The following is the summary of all responses for each survey question. The
responses have been summarized and presented in tables below.
Section 1: Users and non-users of Blackboard
Question 1: Have you ever used any Blackboard course management tools?
From 121 participants in the survey, the percentage of the participants that used
Blackboard was 83.5%, while the percentage of participants that did not use Blackboard
was 16.5%.

79
Question 2: How many courses have you taught using Blackboard?
The data collected showed that from 101 faculty members: 10 participants or 9.9% have
taught just one course using Blackboard; 4 participants or 3.9% taught two courses; 8
participants or 7.9% have taught a total of three courses; 7 participant or 6.9%; four
courses 72 or 71.4% of respondents or claimed that they taught five or more courses
using Blackboard.
Section 2: Elements of the Expectancy theory (VIE)
This section included eight questions related to expectancy; every question was
measuring a specific expectancy related to Blackboard use.
Expectancy (Questions 3 through 9)
Table 4.2: Using Blackboard will result in spending more time setting up my courses.
Never Seldom Sometimes Often Almost Always
9.9% (10) 22.8% (23) 24.8% (25) 23.8% (24) 18.9% (19)
The results revealed that answers in the range of sometimes to almost always account for
67.5 % (68) percent of the responses.
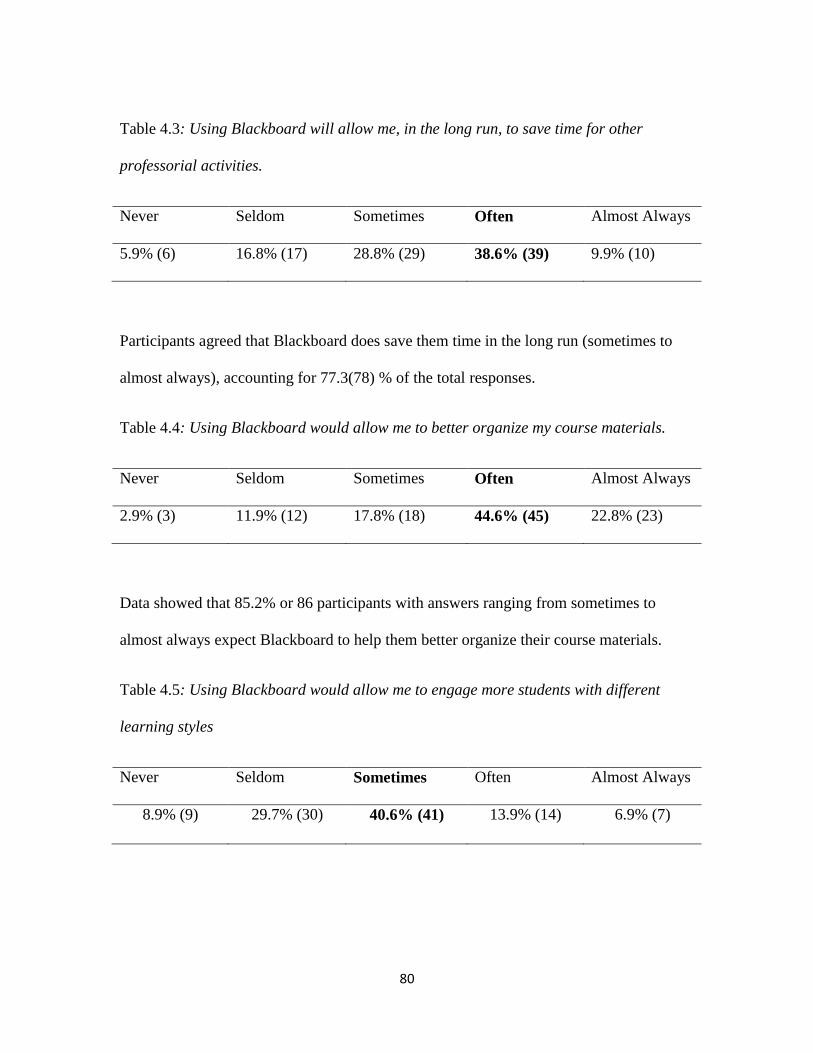
80
Table 4.3: Using Blackboard will allow me, in the long run, to save time for other
professorial activities.
Never Seldom Sometimes Often Almost Always
5.9% (6) 16.8% (17) 28.8% (29) 38.6% (39) 9.9% (10)
Participants agreed that Blackboard does save them time in the long run (sometimes to
almost always), accounting for 77.3(78) % of the total responses.
Table 4.4: Using Blackboard would allow me to better organize my course materials.
Never Seldom Sometimes Often Almost Always
2.9% (3) 11.9% (12) 17.8% (18) 44.6% (45) 22.8% (23)
Data showed that 85.2% or 86 participants with answers ranging from sometimes to
almost always expect Blackboard to help them better organize their course materials.
Table 4.5: Using Blackboard would allow me to engage more students with different
learning styles
Never Seldom Sometimes Often Almost Always
8.9% (9) 29.7% (30) 40.6% (41) 13.9% (14) 6.9% (7)

81
According to the answers, 61.4% or 62 faculty members expected that with the help of
Blackboard they could engage students with different learning styles.
Table 4.6: Using Blackboard could allow me to extend my teaching beyond my classroom
Never Seldom Sometimes Often Almost Always
7.9% (8) 27.7% (28) 28.7% (29) 23.8% (24) 11.9% (12)
Data showed that 64.4 % or 65 faculty members’ responses or fall into the category
between sometimes and almost always.
Table 4.7: Using Blackboard may lead to a feeling of accomplishment
Never Seldom Sometimes Often Almost Always
24.7% (25) 40.6% (41) 24.8% (25) 5.9% (6) 4.0% (4)
Faculty expectancy that Blackboard might provide them with a feeling of
accomplishment was 34.7% or 35 responses ranging from sometimes to almost always.
Table 4.8: Using Blackboard allows me to do my job more effectively.
Never Seldom Sometimes Often Almost Always
1.9% (2) 17.8% (18) 25.8% (26) 38.7% (39) 15.8% (16)

82
Data showed that 80.3 % or 81 respondents (sometimes-often-almost always) expected
Blackboard to be an effective tool in used in their jobs.
Instrumentality (Questions 10 through 17)
The next eight questions asked about the probability of each event occurring as a result of
Blackboard use.
Table 4.9: Getting an incentive pay or raise
Not likely at all Somewhat likely 50/50 chance Quite likely Extremely likely
93.1% (94) 4.9% (5) 0.0% (0) 1.0% (1) 1.0% (1)
Data showed that 98% or 99 faculty members thought the probability of getting an
incentive pay from Blackboard use is not likely or somewhat likely.
Table 4.10: Having more opportunities for a promotion
Not likely at all Somewhat likely 50/50 chance Quite likely Extremely likely
92.1% (93) 5.9% (6) 0.0% (0) 1.0% (1) 1.0% (1)
The likelihood of getting a promotion from Blackboard use was low. 98% or 99 faculty
members selected not likely at all or somewhat likely that this could happen.

83
Table 4.11: Getting better ratings on my student evaluations
Not likely at all Somewhat likely 50/50 chance Quite likely Extremely likely
25.7% (26) 35.7% (36) 23.8% (24) 12.9% (13) 1.9% (2)
Only 38.6 % or 39 people with answers ranging from 50/50 to extremely likely, believed
that it is possible to get better ratings on student evaluations might get better ratings just
because they use Blackboard to teach their courses.
Table 4.12: Improving my reputation among colleagues and department chairs
Not likely at all Somewhat likely 50/50 chance Quite likely Extremely likely
70.3% (71) 21.8% (22) 5.9% (6) 1.0% (1) 1.0% (1)
The chances of improving faculty reputation as a result of Blackboard use were not
likely. 92.1% or 93 participants viewed that it was not likely at all or somewhat likely to
happen.
Table: 4.13: Having more control over my job by using the time I save on other
professorial activities.
Not likely at all Somewhat likely 50/50 chance Quite likely Extremely likely
27.7% (28) 35.6% (36) 17.8% (18) 15.8% (16) 3.0% (3)

84
Only 36.6% or 37 participants with responses ranging from 50/50 chance to extremely
likely thought that Blackboard give them more job control.
Table 4.14: Having a feeling of accomplishment
Not likely at all Somewhat likely 50/50 chance Quite likely Extremely likely
41.6% (42) 35.7% (36) 10.9% (11) 7.9% (8) 3.9% (4)
The data collected indicated that the probability of having a feeling of accomplishment
from Blackboard use was really low, 77.3% or 78 people selected answers from not likely
at all to somewhat likely to this question.
Table 4.15: Having a better reputation among students
Not likely at all Somewhat likely 50/50 chance Quite likely Extremely likely
21.8% (22) 37.7% (38) 22.8% (23) 15.8% (16) 1.9% (2)
Sixty faculty members or 59.5% chose answers from not likely at all to somewhat likely
to show that the probability or having better reputation among students because of
Blackboard use was low.

85
Table 4.16: Overall, my department values the use of this course management tool
Not likely at all Somewhat likely 50/50 chance Quite likely Extremely likely
22.8% (23) 33.7% (34) 25.7% (26) 13.9% (14) 3.9% (4)
Data from this question showed personal subjective beliefs of faculty and if they thought
that their department valued their use of Blackboard. 56.5% of the responses (not likely at
all-somewhat likely) showed that there was a small probability of that the statement being
true.
Valence (Questions 18- 25)
In the next section, eight questions related to valence were included. Participants were
asked to rate the importance of each outcome.
Table 4.17: Getting an incentive pay or raise
Less important Moderately
important
Important Quite important Very important
22.7% (23) 7.9% (8) 24.8% (25) 24.8% (25) 19.8% (20)
Faculty member with answers between important to very important added to 69.4 % or
70 respondents, who viewed monetary incentives as important to them.

86
Table 4.18: Having more opportunities for promotion
Less important Moderately
important
Important Quite important Very important
26.7% (27) 11.9% (12) 16.8% (17) 21.8% (22) 22.8% (23)
Data showed that 61.4% or 62 people selected answers from important to very important.
Table 4.19: Getting better ratings on my student evaluations
Less important Moderately
important
Important Quite important Very important
11.9% (12) 10.9% (11) 29.7% (30) 28.7% (29) 18.8% (19)
Faculty thought it was important to have better ratings from student evaluations, 77.2%
(78 people) of responses were in the range of important to very important.
Table 4.20: Improve my reputation among colleagues and department chairs
Less important Moderately
important
Important Quite important Very important
20.8% (21) 11.9% (12) 32.6% (33) 22.8% (23) 11.9% (12)

87
Reputation was viewed as important; 67.4% (68 people) of responses ranging from
important to quite important were selected by participants.
Table 4.21: Having more control over my job by using the time I save on other
professorial activities
Less important Moderately
important
Important Quite
important
Very important
7.9% (8) 10.9% (11) 17.8% (18) 34.7% (35) 28.7% (29)
Most of the participants indicated that they cared about more job control and using their
free time on other activities. 81.2% of the responses were in the range of important to
very important.
Table 4.22: Having a feeling of accomplishment
Less important Moderately
important
Important Quite important Very important
17.8% (18) 13.9% (14) 35.6% (36) 13.9% (14) 18.8% (19)
Sixty nine faculty members or 68.3 percent chose answers from important to very
important, showing that care about having a feeling of accomplishment.

88
Table 4.23: Having a better reputation among students
Less important Moderately
important
Important Quite important Very important
9.9% (10) 7.9% (8) 42.5% (43) 24.8% (25) 14.9% (15)
Answers from important to very important were chosen by 82.3% of faculty or 83 people.
Table 4.24: It is important that my department wants to use this course management tool
Less important Moderately
important
Important Quite important Very important
27.8% (28) 39.6% (40) 24.8% (25) 5.9% (6) 1.9% (2)
Sixty eight people or 67.4% or selected answers ranging from less important to
moderately important, showing that there were less interested in what their department
wants.
Section 3: Blackboard experience
In this section of the survey, 2 questions were included to evaluate user experience with
Blackboard.

89
Table 4.25: To what extent did you make an effort to use Blackboard in the past?
Very low Low Moderate High Extremely high
4.9% (5) 8.9% (9) 24.8% (25) 33.7% (34) 27.8% (28)
Sixty two people or 61.4% indicated that their level effort was from moderate to
extremely high when they used Blackboard in the past. The high level of effort was the
dominant answer.
Table 4.26: Please rate the present level of effort using Blackboard
Very low Low Moderate High Extremely high
8.9% (9) 6.9% (7) 49.5% (50) 21.8% (22) 12.9% (13)
Even if the level of effort from moderate to extremely high accounted for 84.7% of the
responses, the number of moderate effort is predominant in this category.
Section 4: Satisfaction using Blackboard
Two questions to assess the level of user satisfaction were included in this section.
Table 4.27: I like Blackboard because it is easy to use
Not at all Not very Neutral Somewhat Very much
5.9% (6) 12.9% (13) 32.7% (33) 36.6% (37) 11.9% (12)

90
Users agreed (48.5 %) that they like Blackboard because it was simple to use. Some
(18.8%) did not agree with this statement.
Table 4.28: Overall, I had a good experience while using Blackboard
Not at all Not very Neutral Somewhat Very much
5.0% (5) 6.9% (7) 28.7% (29) 46.5% (47) 12.9% (13)
Participants (59.4%) with answers within the range somewhat to very much, reported that
they had a good experience while using Blackboard.
Section 5: Motivation to use Blackboard tools
In this section, questions assessed the level of motivation with 9 Blackboard tools.
Table 4.29: Motivation associated with Blackboard tools when planning courses
Not at all Not very Neutral Somewhat Very much
BB Course assignments 13.9% (14) 6.9% (7) 4.9% (5) 30.7% (31) 43.6% (44)
BB Grade book 19.9% (20) 5.9% (6) 2.9% (3) 15.9% (16) 55.4% (56)
BB Discussion board 25.7% (26) 21.8% (22) 7.9% (8) 27.8% (28) 16.8% (17)
BB Email 16.9% (17) 3.9% (4) 1.9% (2) 21.9% (22) 55.4% (56)
BB File exchange 23.8% (24) 14.9% (15) 15.8% (16) 30.6% (31) 14.9% (15)
BB E-reserves 37.6% (38) 14.9% (15) 18.8% (19) 22.8% (23) 5.9% (6)
BB Virtual Classroom 48.6% (49) 22.8% (23) 21.8% (22) 5.9% (6) 0.9% (1)

91
Table 4.29 continued
Not at all Not very Neutral Somewhat Very much
BB Calendar 48.6% (49) 19.9% (20) 23.7% (24) 6.9% (7) 0.9% (1)
BB Adaptive release 49.5% (50) 14.8% (15) 26.7% (27) 4.9.0% (5) 3.9% (4)
The table 4.29 shows how motivated faculty members were to use the 9 tools
from Blackboard. Based on the responses most liked tools were (somewhat-very much):
Email (77.3%), Course Assignment (74.3%), Gradebook (71.3%). Among the least
favorite tools were (not at all-not very): Virtual Classroom (71.4%), Calendar (68.5) and
Adaptive release (64.3%).
Section 6: Intentions
The questions in this section measured faculty intentions about Blackboard.
Table 4.30: Overall, how likely are you to use Blackboard in the next semester?
Not likely at all Somewhat
unlikely
50/50 chance Quite likely Extremely
likely
13.9% (14) 2.9% (3) 4.9% (5) 30.7% (31) 47.6% (48)
Faculty members, specifically 78.2% of them indicated that they were likely to use
Blackboard in the next semester (responses from 50/50 chance to extremely likely).

92
Table 4.31: Based on your current satisfaction with Blackboard, if you had to buy it for
your teaching activities, how much would you pay for its license?
$0-100 $100-200 $200-300 $400-500 $500+
73.4% (74) 17.9% (18) 4.9% (5) 1.9% (2) 1.9% (2)
Price is a good indicator of the satisfaction level, 73.3% indicated that they would pay up
to one hundred US dollars to use this course management system. The other 26.6% would
pay from one hundred US dollars and above.
Table 4.32: Based on your satisfaction with Blackboard, how likely are you to
recommend it to your colleagues?
Not likely at all Somewhat
unlikely
50/50 chance Quite likely Extremely
likely
9.9% (10) 8.9% (9) 34.7% (35) 38.6% (39) 7.9% (8)
Data indicated that 81.2% of the respondents (50/50 chance to extremely likely) would
recommend Blackboard to their colleagues.
Section 7: Demographics and classification for Blackboard users
These questions collected information about 101 participants that used Blackboard.
Question 1: What is your gender?

93
Male 45.5% (46), Female 54.5% (55)
There were more female users of Blackboard as it could be seen from the results.
Table 4.33: What is your age?
Age Percentage (number of responses)
<27 1% (1)
28-44 40.6% (41)
45-54 36.6% (37)
55-64 19.80%(20)
65+ 2%(2)
The dominant age group of Blackboard users was between the age of 28 and 44 with
77.2% of respondents.
Table 4.34: How many years have you been teaching in higher education institutions?
Years Percentage (Number of responses)
1-5 16.8%(17)
6-10 21.8% (22)
11-15 22.8%(23)
16-20 17.8% (18)
20+ 20.8%( 21)

94
People with 6-10, 11-15 and those with more than 20 years were among the top users of
Blackboard, a total of 65.4%.
Table 4.35: Which of the following best describes your specialization area?
Area Percentage (Number of responses)
Business 23.8%(24)
Arts 9.9% (10)
Sciences 27.7% (28)
Education 16.8% (17)
Health 14.9% (15)
Engineering (sciences) 6.9% (7)
Faculty members in the departments of science and business were the majority of
Blackboard users (58.4%). Arts and health had the lowest number of users.
Table 4.36: What is your faculty rank?
Faculty rank Percentage (Number of responses)
Instructor/Lecturer 5.9% (6)
Assistant Professor 41.6% (42)
Associate Professor 25.7% (26)
Professor 26.7% (27)

95
Based on the results, most of the users of Blackboard were among Assistant
professors (41.6%).
Table 4.37: What was your tenure status at your present institution during the past term?
Tenure Percentage (Number of responses)
No tenure system 0% (0)
Non-tenure track 11.9% (12)
Tenure-track 44.6% (45)
Tenured 43.6%(44)
Faculty on tenure track had the lead in using Blackboard, followed by tenured professors.
Section 8: Demographics and classification for Blackboard non-users
This part of the survey collected information about those participants that did not
use Blackboard in their teaching activities. Twenty participants in the survey reported
being non-users of Blackboard for several reasons. The participants could select the
options provided below or fill out the “other” answer with their specific reason. Most of
the non-users (65%) or 13 participants indicated that they could do without Blackboard in
their teaching. Fifteen percent indicated that they do not use Blackboard due to lack of
time. The faculty that did not know about Blackboard’s existence and that gave up
because it is complicated to use got 10% for each category. Among other option, the
predominant answer was that participants were using an alternative CMS.

96
Table 4.38: Why have you not used Blackboard for your classroom instruction?
Response Options Percentage (number of responses)
I did not know about its existence 10% (2)
I do not have time to use it 15 %(3)
It was too complicated to use and I gave up 10%(2)
I can do without it 65% (13)
I dread technology 0% (0)
Other
1.We use a different system
2.We switched to a different course management system
3.Our institution does not provide Blackboard
4.Using a different CMS
5.Blackboard is not offered
6.I use Sakai
7. My university is switching to Sakai for its CMS, and I am
using it instead.
8.We use Moodle
Qualitative analysis of twenty non-users of Blackboard
Question 2: What is your gender?
Male 60% (12), Female 40% (8)
From the data set, there were more male non-users compared to female non-users.

97
Table 4.39: What is your age?
Age Percentage (number of responses)
<27 0% (0)
28-44 25% (5)
45-54 50% (10)
55-64 25% (5)
65+ 0% (0)
Half of the non-users were between the ages of 45 to54. The results show that there were
no people younger than 27 or older than 65 that did not use Blackboard. The other two
groups each had 25% of responses or 5 people in each category.
Table 4.40: How many years have you been teaching in higher education institutions?
Age Percentage (number of responses)
1-5 10% (2)
6-10 20%(4)
11-15 30% (6)
16-20 30% (6)
20+ 10%(2)
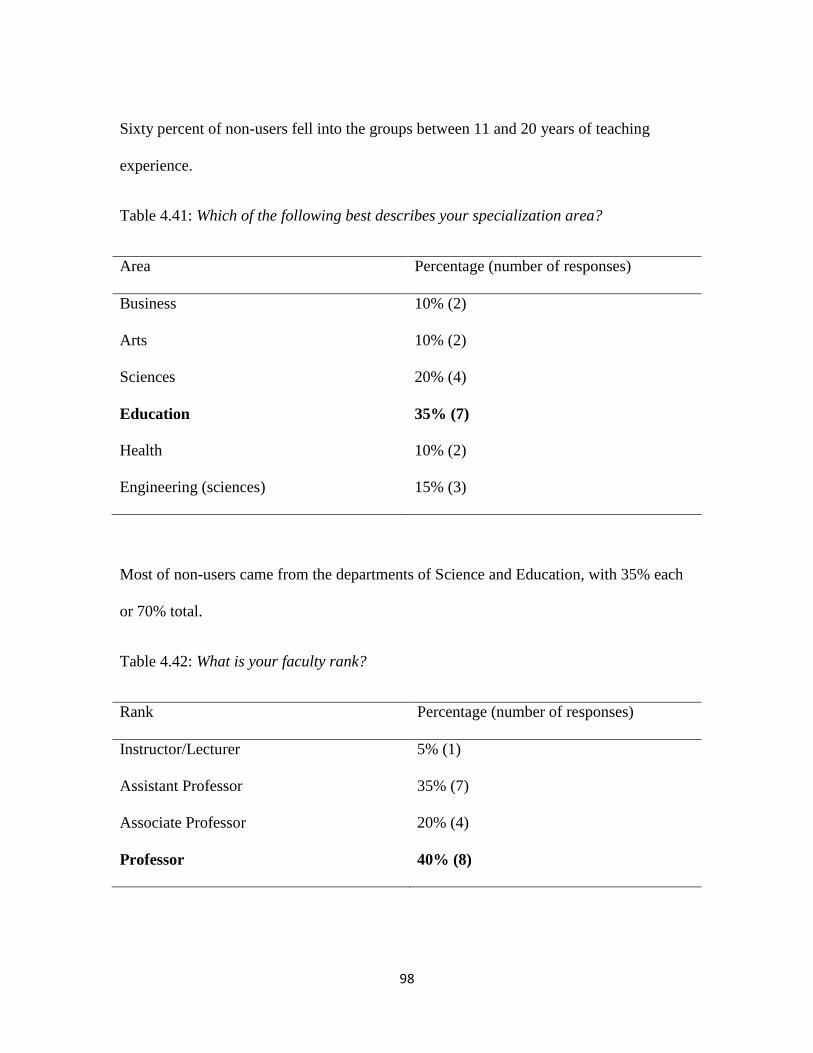
98
Sixty percent of non-users fell into the groups between 11 and 20 years of teaching
experience.
Table 4.41: Which of the following best describes your specialization area?
Area Percentage (number of responses)
Business 10% (2)
Arts 10% (2)
Sciences 20% (4)
Education 35% (7)
Health 10% (2)
Engineering (sciences) 15% (3)
Most of non-users came from the departments of Science and Education, with 35% each
or 70% total.
Table 4.42: What is your faculty rank?
Rank Percentage (number of responses)
Instructor/Lecturer 5% (1)
Assistant Professor 35% (7)
Associate Professor 20% (4)
Professor 40% (8)

99
Professors and assistant professors were 75% of non-users.
Table 4.43: What was your tenure status at your present institution during the past term?
Tenure Percentage (number of responses)
No tenure system 5%(1)
Non-tenure track 25% (5)
Tenure-track 15% (3)
Tenured 55% (11)
Fifty five percent of tenured faculty was not using Blackboard in their courses.
Statistical Analysis
The following is the summary of statistical analysis for each of the research
questions.
Data Analysis for Research Question No. 1
Research question 1: Does the VIE model predict faculty motivation to use Blackboard?
Hypothesis 1: There is a relationship between a faculty member’s motivation to
use Blackboard tools and the Elements of VIE theory.
The level of significance used in this study was 0.05. The assumption was made
that there was a linear relationship between the elements of VIE (Expectancy,
Instrumentality and Valence) and motivation to use Blackboard tools. Statistically the
relationship was expressed using the following formula:

100
Motivation to use BB tools=B0+Eb1+Ib2+Vb3
Where, E is expectancy, I is instrumentality and V is validity, and b1, b2, b3 are
the regression coefficients and B0 is Y-intercept of the line. The analysis was able to test
if the independent variables (Expectancy, Instrumentality and Valence) predicted the
dependent variable (Faculty Motivation).
Assessment of the Regression Model
Before proceeding to a full scale data analysis, it was essential to assess the
regression model by looking if the model a good fit for the data that is being analyzed.
This means observing if the model has been affected by a small number of influential
cases.
Outliers and Influential Cases
The assessment of outliers was performed by using the value of standardized
residuals as a guideline. The SPSS output revealed that there were 3 cases with
standardized residuals outside an absolute value 2. None of the cases were outside an
absolute value 3.0. According to Field (2000), in a normally distributed sample, 95% of
standardized residuals should have an absolute value of 2, and 99% of standardized
residuals should have an absolute value of 3. Any standardized residual with an absolute
value greater than 3 is a cause for concern. In this data set, with a sample of 101 cases, it
is reasonable to expect about 5 cases (5%) to have standardized residuals outside of
absolute value 2. The output revealed only 3 cases, therefore, it is reasonable to consider
the regression model as a good representation of the sample data.

101
The assessment of influential cases was performed by examining Cook’s distance,
which usually indicates the overall influence of a case on a model. Cook’s distance
revealed values below 1, which implies that there was no concern about some cases
having excessive influence on the parameter of the model.
Examinations of Assumptions
To ensure a regression equation with unbiased estimates of parameters, all
assumptions must be met. Some assumptions can be checked directly against the result of
descriptive statistics while others need further statistical testing to verify. Variables in the
model met the assumption of being quantitative and continuous.
The assumptions of the non-zero variance in predictors were met. The variances
for the predictors were 1.15 (Valence), 0.42 (Expectancy), 0.39 (Instrumentality). As
mentioned before, each value of the outcome variable came from a separate subject, so
the assumption of independence of values among subjects was met. An examination of
the assumptions such as multicollinearity between predictors, homoscedasticity, linearity,
and normally distributed errors was conducted.
"VIF" values for each predictor also check for multicollinearity. The VIF, which
stands for variance inflation factor. Usually, a VIF value greater than 10 may merit
further investigation. Multicollinearity is not a problem for this model; all variables have
a VIF below 10.
A graph of standardized residuals was plotted against standardizes predicted
values, showing the homoscedasticity of the values.
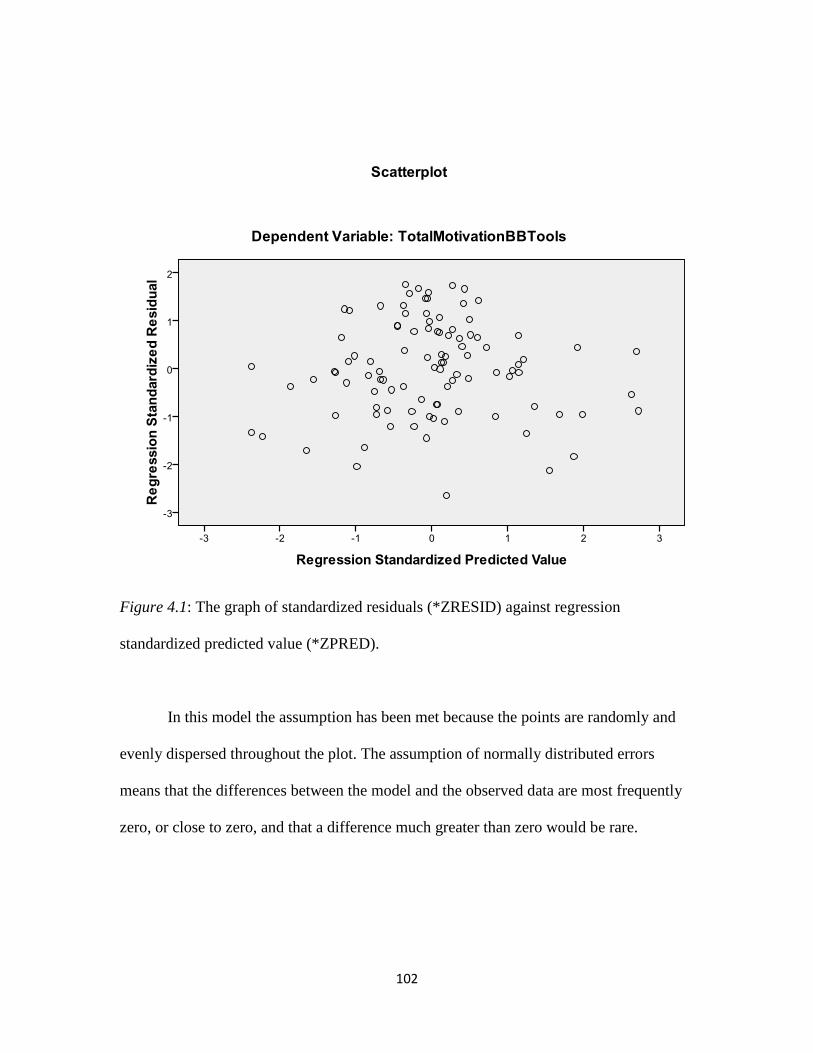
102
Figure 4.1: The graph of standardized residuals (*ZRESID) against regression
standardized predicted value (*ZPRED).
In this model the assumption has been met because the points are randomly and
evenly dispersed throughout the plot. The assumption of normally distributed errors
means that the differences between the model and the observed data are most frequently
zero, or close to zero, and that a difference much greater than zero would be rare.

103
This assumption can be examined through the Normal P-P plot of regression standardized
residual. In this case the assumption had been met because most of all the observed
residuals, represented by the points, lie on the straight line which represents a normal
distribution. Firgure 4.2 illustrates how residuals fall around the line
Figure 4.2: Normal distribution of the regression standardized residuals.

104
Descriptive statistics
Table 4.44 summarizes the mean, variance and standard deviations of the variables used
to answer research question number one.
Table 4.44: Descriptive statistics for dependent and independent variables
Descriptive Statistics
N Min Max Mean Std. Deviation Variance
TotalMotivBBTools 101 1.00 4.22 2.8548 .80488 .648
TotalValence 101 1.00 5.00 3.1881 1.07227 1.150
TotalInstrumentality 101 1.00 4.71 1.8020 .62759 .394
TotalExpectancy 101 1.57 4.71 3.1103 .65118 .424
The correlation matrix in Table 4.45 showed the strength of the relationships
between the predictors and the criterion variable, as well as the relationship between each
of the predictors. The values of Pearson correlations (as presented in the Correlations)
show the relationships between each pair of independent variables.
The results show strong correlations but not significant relationships (r< 0.5).

105
Table 4.45: Pearson Correlation matrix between independent and dependant variables
TotalMotivBBTools TotalExpectancy TotalInstrumentality TotalValence
Pearson
Correlation
TotalMotivBBTools 1.000 .408 .355 .237
TotalExpectancy .408 1.000 .574 .128
TotalInstrumentality .355 .574 1.000 .281
TotalValence .237 .128 .281 1.000
Sig.
(1-tailed)
TotalMotivBBTools . .000 .000 .008
TotalExpectancy .000 . .000 .100
TotalInstrumentality .000 .000 . .002
TotalValence .008 .100 .002 .
Of all the predictors, Total Expectancy had the highest correlation with Total
Motivation to use BB tools, criterion variable (r = .408), followed by Total
Instrumentality (r = .355), and then Total Valence (r = .237). The correlation matrix
shows that the three independent variables (Expectancy, Instrumentality and Valence)
each had a positive relationship with the criterion or dependent variable. The relationship
is not significant but it does exist.
Model summary
The coefficient of determination, represented by R 2
was 0.212. R 2
is the
proportion of variability in the dependent variable that can be predicted from the
independent variables. The R 2
value indicated that the linear combination of all the

106
independent variables accounted for approximately 21.2% of the variability of the
motivation to use Blackboard. The shrinkage, or loss of predictive power when the model
is used in another sample, can be examined through the adjusted R 2
generated by SPSS.
In this case, the R 2
adj was 0.188, which is about 12 % difference from the value of R 2
.
Data on these coefficients in presented in Table 4.46.
Table 4.46: Correlation coefficients
Model Summaryb
Model R Square Adjusted R Square Std. Error of the Estimate
1 .212 .188 .72538
a. Predictors: (Constant), TotalValence, TotalInstrumentality, TotalExpectancy
b. Dependent Variable: TotalMotivationBBTools
The F value tells whether the independent variables reliably predict the dependent
variable. In this case, the F value is significant, F =8.708, p = .000. Therefore the linear
combination of the independent variables can be used to predict the dependent variable,
Motivation to use Blackboard tools (TotalMotivationBBTools). Table 4.47 shows the
results of the analysis of variances.

107
Table 4.47: Analysis of Variance
ANOVAb
Model Sum of Squares df Mean Square F Sig.
1 Regression 13.745 3 4.582 8.708 .000a
Residual 51.039 97 .526
Total 64.784 100
a. Predictors: (Constant), TotalValence, TotalInstrumentality, TotalExpectancy
b. Dependent Variable: TotalMotivationBBTools
Model Parameters
The individual contribution of each predictor to the model can be examined from
the estimates of coefficients for the model. Table 4.48 presents the table of coefficients.
The t value indicated whether a predictor was making significant contribution to the
model. In this model, not all predictors were not making a significant contribution, (r<.5).
However, Total Expectancy had a relatively higher contribution than other two predictors
because it had a large t-value. Therefore, Expectancy was considered the most important
predictor. Both Valence and Instrumentality had lower t-values and were not significant,
p-value>0.05.
The value β (beta) tells the relationship between the criterion variable and each
predictor. A positive value implies a positive relationship between the predictor and
response factor. Detailed information of the results is presented in Table 4.48.

108
Table 4.48: Coefficients of the regression model
Model Unstandardized Coefficients Standardized Coefficients
t
Sig. B Std. Error Beta
1 (Constant) .967 .395 2.447 .016
TotalExpectancy .386 .136 .312 2.836 .006
TotalInstrumentality .168 .146 .131 1.149 .253
TotalValence .120 .071 .161 1.708 .091
95.0% Confidence Interval for B Correlations Collinearity
Statistics
Model Lower Bound Upper Bound Zero-order Partial Part Tolerance VIF
(Constant) .183 1.751
TotalExpectancy .116 .657 .408 .277 .256 .669 1.495
TotalInstrumentality -.122 .458 .355 .116 .104 .626 1.596
TotalValence -.020 .261 .237 .171 .154 .919 1.088
The relative importance of each predictor can also be examined from part
correlations. A part correlation is the unique correlation of each predictor with the
criterion variable, partially taking out the effects of all other predictors in the model from
the predictor but not the criterion variable. Expectancy had a partial correlation of (.277)
with the criterion variable, followed by Valence (.171) and Instrumentality (.116).
Data Analysis for Research Question No. 2
Research question 2: What is the strongest motivational factor that drives faculty
to use Blackboard course management tools in facilitating classroom teaching?
To answer this question, a correlation between variable “Intentions” (the answers
to Questions 31, 32 and 33 of the questionnaire) and 9 Variables of Motivation to use BB
tools (Question 30) was assessed. The “Intentions” variable was selected to be correlated

109
to the Motivation to use Blackboard tools because it best explains faculty behavior.
Motivation is seen as a process that leads to forming of behavioral intentions.
Table 4.49: Pearson Correlation coefficients for Intentions and the elements of
Motivation to use BB tools
N=101 Intentions
Intentions Pearson Correlation 1
MotCourseAssign Pearson Correlation .492**
Sig. (2-tailed) .000
MotGradeBook Pearson Correlation .463**
Sig. (2-tailed) .000
MotDiscussBoard Pearson Correlation .152
Sig. (2-tailed) .130
MotEmail Pearson Correlation .418**
Sig. (2-tailed) .000
MotFileXchange Pearson Correlation .041
Sig. (2-tailed) .681
MotEreserves Pearson Correlation .114
Sig. (2-tailed) .258
MotVirtualClass Pearson Correlation .202*
Sig. (2-tailed) .043
MotCalendar Pearson Correlation .079
Sig. (2-tailed) .430
MotAdaptiveRelease Pearson Correlation .171
Sig. (2-tailed) .087
From the table 4.49 of Pearson correlations, the strongest correlation of
motivation was using Blackboard Course Assignment tool (MotCourseAssign). In the
correlation analysis some other tools with a strong correlation of motivation use were:
Grade Book and Email. File exchange, Calendar and E-reserves provided the least
motivation for faculty.

110
Data Analysis for Research Question No. 3
Research question 3 stated: Is there a relationship between Valence and a faculty
member’s motivation to use Blackboard tools for facilitating classroom teaching?
Hypothesis 2: Valence is useful in predicting a faculty member’s motivation to use
Blackboard.
This question could be answered by looking at the output from research question
number one. Valence shows a good relationship with the Total Motivation to use BB
tools (r=.237) It is significant as an individual variable, but not as a part of the regression
model.
From Table 4.48, the t value indicated whether a predictor was making a
contribution to the model. For this model, Valence had a t value t(101)=1.708 and a p-
value >0.05,indicating that it was not making a significant contribution to the model. The
β was positive for Valence indicating a positive relationship between the predictor and
the criterion variable.
From the results, it could be inferred that even though Valence does not have a
significant impact on the model, independently it is useful in the prediction of faculty
motivation to use Blackboard.
Data Analysis for Research Question No. 4
Research question 4 stated: Is there a relationship between Instrumentality and a
faculty member’s motivation to use Blackboard tools for facilitating classroom teaching?

111
Hypothesis 3: Instrumentality is useful in predicting a faculty member’s
motivation to use Blackboard.
This question could be answered by using the output from research question
number one. Instrumentality showed a good relationship with the Total Motivation to use
BB tools (r=.355).
From Table 4.48, the t value for Instrumentality had a small contribution
compared to other two predictors, t (101) =1.149 and was not significant p-value>0.05.
The β was positive for valence indicating a positive relationship between the predictor
and the response factor.
The results lead to the conclusion that Instrumentality was significant by itself not as a
part of the regression model.
Data Analysis for Research Question No. 5
Research question 5 stated: Is there a relationship between Expectancy and a
faculty member’s motivation to use Blackboard tools for facilitating classroom teaching?
Hypothesis 4: Expectancy is useful in predicting a faculty member’s motivation to
use Blackboard.
The quantitative analysis for this question was done using the output from
research question number one. Table 4.45 showed that Expectancy had a strong and
significant relationship with the Total Motivation to use BB tools (r=.408).
Table 4.48 showed that Expectancy was making a substantial contribution to the
regression model t (101) =2.836, t-value was the highest among the 3 predictors. The β

112
was positive for valence indicating a positive relationship between the predictor and the
response factor. In conclusion, it could be stated that Expectancy showed a strong
relationship with the dependent variable, making a significant contribution to the
regression model.
Data Analysis for Research Question No. 6
Research question 6 stated: Does faculty perceive using Blackboard course
management tools as saving time? The following hypothesis was tested.
Hypothesis 5: A faculty member perceives using Blackboard course management
tools as saving time.
The purpose of the data analysis was to identify if using Blackboard is perceived
by faculty as saving them time in their teaching activities. The researcher looked at two
Expectancy items from the questionnaire related to time (Expectancy E1 and E2). One
variable was estimating the time presently required to setup Blackboard and the other was
estimating faculty beliefs of future time savings when using Blackboard.

113
Survey Question 2: Using Blackboard will result in spending more time setting up my
courses.
Figure 4.3: Frequency distribution of answers to survey question number 2.
The histogram in figure 2 shows the number of cases per unit of scales so that the
height of each bar is equal to the proportion of total people in the survey who fall into
that category. The area under the curve represents the total number of cases (N=101)

114
Survey Question 3: Using Blackboard will allow me, in the long run, to save time for
other professorial activities.
Figure 4.4: Frequency distribution of answers to survey question number 3.
The histogram in figure 3 represents the number of cases per unit of scales, each
bar indicating the number of people that selected an answer from a scale of one to five.
A single tail T-test was used for examining this hypothesis. The researcher compared the
mean value of the answers the respondents provided to the mean of scales, which equals
to 3 in this study, based on a 5 point Likert scale.

115
To address survey question number 2: Using Blackboard will result in spending
more time setting up my courses, a value greater than 3 would indicate that Blackboard
does take more time to setup. The following hypotheses were tested:
Alternative hypothesis: μ <3
Null Hypothesis: μ ≥ 3
One sample t-test was used to compare the mean of the response to this question with the
mean of scales.
Table 4.50: Parameters for variable E1TimeSetup
Test Value = 3
N Mean t t obs Sig. (1-tailed) Mean Difference
E1TimeSetup 101 3.19 1.497 1.658 0.931 .18812
As the Table 4.50 shows, t-value for the perception that it takes more time to
setup your courses was 1.497, which is less than t critical value of 1.658.Using the p-
value there is insufficient evidence at level of significance 0.05 to conclude that
Blackboard saves time based on the time required to setup Blackboard for courses.
The next step involved testing the hypothesis for survey question 3: Blackboard saves
time in the long run.

116
Alternative hypothesis: μ >3
Null Hypothesis: μ ≤ 3
Table 4.51: Parameters for Variable E2SaveTime
Test Value = 3
N Mean t t obs Sig. (1-tailed) Mean Difference
E1SaveTime 101 3.3 2.832 1.658 .003 .29703
From table 4.51, the t-value for the perception that Blackboard saves time in the
long run was 2.832, which is greater than the t critical value of 1.658. Its p-value
indicated that there is sufficient evidence, at level of significance of 0.05 to conclude that
faculty expects Blackboard to them time in the long run.
Results in Table 4.52, showing Pearson correlations between the two time
variables (E1TimeSetup, E2SaveTime) and Intentions show that there is a strong and
significant relationship between Intentions and the expectancy that Blackboard will save
time in the long run. The correlation between Intentions and the expectancy that
Blackboard will require more time to setup the courses was small and not significant,
showing faculty perceived that using Blackboard will require more time upfront when
setting up instructional courses.

117
Table 4.52: Correlations between variables E1TimeSetup, E2SaveTime and Intentions
E1TimeSetup EI2SaveTime Intentions
E1TimeSetup Pearson Correlation 1 -0.163 -0.141
Sig. (2-tailed) 0.104 0.160
E2SaveTime Pearson Correlation -0.163 1 0.374**
Sig. (2-tailed) 0.104 .000
Data Analysis for Research Question No. 7
Research question 7: Is there a relationship between the utilization of course
management tools and gender?
Hypothesis 6: There is a relationship between utilization of course management
tools and gender.
To analyze this hypothesis the researcher compared the response rate of females
and males in both users and non-users of Blackboard. All the data is shown below
Table 4.53: Gender and Blackboard usage demographic data
Gender BB Users BB Non-users
Male 45.5% 60%
Female 54.5% 40%
To analyze the relationship between usage of Blackboard and gender, a test for
Chi square statistic was used between gender and usage for both users and non-users of

118
Blackboard. Chi-square statistic is usually used to determine if there is a significant
relationship between two categorical variables.
The results From Table 4.54 indicate that there was no statistically significant
relationship between the usage of Blackboard and gender (chi-square with one degree of
freedom = 2.529, p = 0.112), such that women were not more likely to use Blackboard
than men.
Table 4.54: Chi square analysis between gender and Blackboard usage
gender * BBUsage Crosstabulation
BBUsage Total
No Yes
gender female 7 55 62
male 13 46 59
Total 20 101 121
Value Df Asymp. Sig. (2-sided) Exact Sig. (2-sided) Exact Sig. (1-sided)
Pearson Chi-Square 2.529a 1 .112
Continuity Correctionb 1.810 1 .178
Likelihood Ratio 2.557 1 .110
Fisher's Exact Test .144 .089
Linear-by-Linear Association 2.508 1 .113
N of Valid Cases 121
a. 0 cells (.0%) have expected count less than 5. The minimum expected count is 9.75.

119
Summary
Chapter four provided a detailed analysis of the data collected through the research
instrument. Quantitative and qualitative analyses were conduced to help address the 7
research hypothesis mentioned in Chapter one. The quantitative analyses found that
expectancy had a strong and significant relationship and with faculty motivation to use
Blackboard tools and as part of the regression model. Even if Valence and
Instrumentality were significant by themselves, these variables were not significant as
part of the regression model. Qualitative analysis showed that the difference between
male users and female users was not significant to conclude that one group was more
likely to use Blackboard.
120
CHAPTER FIVE
CONCLUSIONS AND RECOMMENDATIONS
Introduction
Today new technologies are changing how instructional materials are being
delivered. It is really surprising that course management systems have been adopted at a
high rate by institutions of higher education that typically are known for holding onto
traditional methods of teaching (West, Waddoups, Kennedy, and Graham, 2006).
These systems were initially designed to support distance education, but today
they are being used to compliment traditional campus based classroom courses. All of the
major universities tend to have a course management system, even though they tend to
have a complex nature (Coates, James & Baldwin, 2005). Initiation, maintenance and
support of these systems require a great investment of financial resources, time and
technical expertise of support staff. It is crucial to recognize faculty’s expectations and
their attitudes toward the use of course management systems to enhance learning and
teaching methodologies. Accepting a technology depends on whether faculty members
believe that the technology will benefit them.
This study was undertaken to analyze if Vroom’s Expectancy theory predicts the
process of motivation that takes place among faculty members when they use a course
management system. Blackboard is one of the most commonly used commercial
Learning/Course Management Systems globally (Chang, 2008). Due to its familiarity and
wide spread use, Blackboard was chosen to conduct this research.

121
Seeing what motivates faculty is important because it provides valuable
information to university administrators who decide what course management systems to
use and what resources to allocate. Software developers could use this information to
decide how to better design the interface of a course management system and what
specific tools to create.
Several questions guided this study. The first five research questions investigated
the relationship between the elements of the Expectancy theory (Valence, Instrumentality
and Expectancy) and the process of motivation when using Blackboard tools during
teaching activities. To be more specific, nine tools used in Blackboard were selected
based on previous research about the most useful and least useful features of Blackboard
(Colorado & Butler, 2007). The researcher analyzed the data to see which elements of the
VIE model, if any, had a significant influence on motivation to use those tools.
The next question focused on the relationship between the use of a course
management system and time. The analysis focused around the issue of saving time while
using Blackboard. The last research question was designed to investigate if gender is
related in any way with the use of a course management system.
A survey questionnaire was used to answer these research questions. Several
scales were used to collect qualitative and quantitative data, among them: a five point
Likert scale, check-all-that apply and several open-ended questions.
The survey was placed on a web site and sent to 448 faculty members with two
follow ups. Data collected rendered 121 responses, obtaining a response rate of 27

122
percent. From those that participated in this survey, 101 faculty members indicated that
had previously used Blackboard and twenty had not. Among those that had not used
Blackboard before, two respondents stated that they did not know about Blackboard’s
existence. The rest of the respondents had different reasons for not using it, 83% of them
stated that they could do without Blackboard in their instructional process.
To answer the research questions data from 101 respondents was used. This data
set was analyzed using SPSS version 17. Multiple regressions have been used to analyze
the responses and to understand how the elements of VIE theory interact with faculty
motivation to use Blackboard. A separate qualitative analysis was done for the twenty
non-users of Blackboard.
Conclusions
This study aimed to examine if Expectancy theory can predict faculty motivation
to use a course management system. Qualitative and quantitative methods of analysis
were used. Seven research questions and six hypotheses were tested and analyzed.
Quantitative Conclusions
Research question 1 asked: Does the VIE model predict faculty motivation to use
Blackboard?
The value of the coefficient of determination (R 2
) indicated that the linear
combination of all the independent variables accounted for approximately 21.2% of the
variability of the motivation to use Blackboard, showing that the variables tend to

123
increase or decrease together. The results show that all the three independent variables
each had a positive relationship with the outcome variable. The value of the coefficient of
determination was not high, R2
= 0.212, but it showed that there is a good fit between the
variables. The Analysis of Variance showed that the F value was significant F =8.708, p
<0.05, and that the combination of the independent variables could be used to predict the
dependent variable. The individual contribution of each predictor was examined from the
estimates of the coefficient for the model. In this model not all of the variables were
significant. Based on the p-values, which were greater than 0.05, Valence and
Instrumentality were not making a significant contribution.
Research question 2 asked: What is the strongest motivational factor that drives
faculty to use course management tools in facilitating classroom teaching?
The analysis for this question involved using Pearson’s correlation matrix
between variable Intentions and nine variables of Motivation to use Blackboard tools.
The results revealed that Motivation to use the Course Assignment tool had the strongest
relationship with Intentions, r=0.492, followed by the Motivation to use Grade Book
r=0.463 and Motivation to use Email tool in Blackboard, r=0.418. This was consistent
with the findings of Woods, Bakerb and Hoope (2004) that showed that Blackboard was
primary used for distribution of course materials to students and posting grades. Based on
the value of the correlation coefficients, File exchange, Calendar and E-reserves provided
the least motivation for faculty to use Blackboard.

124
Research question 3 asked: Is there a relationship between Valence and a faculty
member’s motivation to use Blackboard tools for facilitating classroom teaching?
The output from question one was used to answer this question. Valence had a
good correlation with the Motivation to use Blackboard tools (r=0.237), but for this
model, Valence had a t value t(101)=1.708 and its p-value was greater than
0.05,indicating that it was not making a significant contribution to the model
Research question 4 asked: Is there a relationship between Instrumentality and a
faculty member’s motivation to use Blackboard tools for facilitating classroom
teaching?
Instrumentality showed a good correlation with the Motivation to use Blackboard
tools, a value of r=0.355, which was higher than Valence. The contribution of this
variable based on its t-value, t(101)=1.149, was small and not signification, p-value was
greater than 0.05.
Research question 5 asked: Is there a relationship between Expectancy and a
faculty member’s motivation to use Blackboard tools for facilitating classroom
teaching?
Expectancy had the strongest relationship with the Motivation to use Blackboard
tools; the value of the correlation coefficient was =0.408. It was also significant, its p-
value was smaller than 0.05. Expectancy was also making a significant contribution to
the model based on its t-value, t (101) =2.836, it had the highest value among the 3
predictors.

125
Research question 6 asked: Does a faculty member perceive using Blackboard
course management tools as saving time?
Two time variables derived from survey questions number 2 and 3 were used for
this analysis. One question asked if faculty members believed that using Blackboard will
result in spending more time setting up their courses and the next question was asking if
using Blackboard will allow them to save time in the long run, the time that they could
use on other professorial activities. The hypothesis was tested comparing the mean of
scales to the mean of the responses to this question.
Using Variable E1 Time required to setup Blackboard the hypothesis was tested
using one sample t-test, the results revealed that the p-value was larger than 0.05,
providing insufficient evidence to conclude that Blackboard saves time based on time
required to setup courses.
The second time variable, E2 Blackboard saves time in the long run, was tested the
same way as E1, its p-value was smaller than 0.05, providing sufficient evidence to
conclude that Blackboard does save time in the long run. The correlation matrix between
these two time variables and intentions showed that Time to setup had negative
relationship with intentions and the correlation to Time that BB saves in the long run was
positive and significant.
Research question number 7 asked: Is there a relationship between utilization of
course management tools and gender?

126
To analyze this relationship a Chi-square test was used. The responses from 121
participants, both users and non-users of Blackboard were used. Even though the
qualitative results revealed that more women used Blackboard, the results of Chi square
analysis, χ2
=2.529, p>0.05, indicated that the relationship is not statistically significant to
conclude that women were more likely to use Blackboard than men.
Qualitative conclusions
A survey questionnaire was used to collect the necessary data from the
participants. The results of the survey revealed that from 121 participants in this survey
83.5percent have used Blackboard before. From 101 participants that have used
Blackboard before, the vast majority 71.3 percent have taught more than five classes
using Blackboard. Based on the familiar concept that typically males are more interested
in technology, the results of this study demonstrated quite the opposite; according to this
survey 54 percent of users were female. Among non users of Blackboard males
accounted for the greatest number, 60 percent. The predominant age group that used
Blackboard was between 28-41 years old, accounting 40.6 percent of users followed by
the group of 45-54 years old, with 36.6 percent. The difference was small and according
to current research, technology use is becoming age neutral (Stroud, 2009), even if before
people thought that younger generations tend to use technology more. Skelly(2009)
pointed out that even though people in their twenties are seen as tech savvy, those
between the ages of 45-54 are becoming more comfortable with the technological tools.
On the other hand, non-users were predominantly in the same age group of 45-54 with 50
percent, followed by 28-44 and 55-64 years of age with both 25 percent.

127
Faculty members with 11-15 years of teaching experience in higher education
institutions accounted for 22.8 percent of the users of Blackboard, followed by those with
more than 20 years of experience with 20.8 percent. The majority of non-users fell into
the category of 11-15 and 16-20 and years of experience, with 30 percent each. Most of
the Blackboard users came from Sciences with 27.7 percent; non-users were mostly in the
areas of Education with 35 percent. The predominant faculty rank among users of
Blackboard was Assistant Professor with 41.6 percent, among non-users Assistant
Professors were the dominant group with 35 percent. Most of the users of Blackboard,
44.6 percent, were on tenure track positions, followed by tenured professors with 43.6
percent. Most of non-users of Blackboard fell in the category of tenured professors.
The question related to reasons for not using Blackboard revealed some
interesting results. Before the data collection, the researcher believed that most of the
participants that did not use Blackboard would choose: “I do not have time to use it.”
However, that choice accounted for only 25 percent of the responses. The vast majority,
83.3 percent, chose “I can do without Blackboard”. The answer options “I did not know
about Blackboard’s existence” and “It was too complicated and I gave up” both had 16.7
percent of the answers. None of the respondents selected the answer “I dread
technology.” This was a good indication that among the participants in the survey, there
were no people that resisted using technology and that more faculty members are feeling
comfortable with technology in their instruction.

128
Some participants were kind enough to leave their own comments about reasons
for not using Blackboard. Most of the answers showed that their institution was in the
process of switching from Blackboard, which is a commercial course management
system, to an open source course management system, such as Moodle or Sakai. There
could be several reasons for that change. One could be financial, because commercial
course management systems require license fees to be paid to the company that develops
and maintains these systems and these days universities have less financial resources
available to be spent on such programs. Another reason might be the open source systems
might better meet the needs of instructors and students compared the commercial ones.
These CMSs allow more personalization and focus on more on teaching activities than
administrative options. According to <www.4moodle.com> ,which is a Dutch portal,
Moodle’s advantages over Blackboard include: easier to maneuver, less area
monopolized for navigation, easier to incorporate multimedia elements, more useful tools
available (like journal, glossary, poll, etc), track student activity to see which parts of the
course are preferred, quiz tools provide scores and details on the student’s use, could be
customized to add desired features, features are robust, surveys allow as few as 2 choices.
Expectancy theory and Blackboard use conclusions
In this study, faculty motivation was measured according to the postulates of
Vroom’s Expectancy theory. Before the actual data collection and analysis, the
anticipation was that Valence would be the most important predictor of faculty
motivation to use Blackboard. The main reason for this assumption was that faculty

129
might see the list of suggested outcomes very desirable and rewarding for their
performance. Even thought Valence did not have a significant influence in this model.
The most preferred outcomes ranked by faculty were:
1) Having a course management system that gives faculty more job control and
saves them time for other activities.
2) Getting better rating on their student evaluations.
3) Having better reputation among students.
4) Getting an incentive pay or raise, universities have not established a strong
connection between getting monetary incentives and active use of a course
management system.
5) Having opportunities for promotion and having a feeling of accomplishment had
the same importance.
6) Faculty was least interested in improving their reputation among colleagues and
department chairs.
Administrators could ask teachers more about the list of possible outcomes, rewards
for a high performance that they desire from the use of a course management system.
Even though rewards and outcomes tend to be very subjective, using the results of this
study could help the administration see what motivates faculty members to use
Blackboard. Even if monetary rewards are not always possible, other rewards could be
used.

130
Instrumentality has to do with the belief that if certain actions were completed it
could lead to a specific outcome. Among seven instrumentalities related to beliefs about
Blackboard, faculty ranked them as follows:
1) Having better reputation among students.
2) Having a course management system that gives faculty more job control and
saves them time for other activities.
3) Getting better ratings on student evaluations.
4) Having a feeling of accomplishment.
5) Improving their reputation among colleagues and department chairs.
6) Having opportunities for promotion.
7) Getting an incentive pay or raise.
University administration, having control over certain extrinsic rewards, could affect
faculty’s instrumentality beliefs. Instrumentality data that was analyzed showed that this
factor of the VIE model was not significant as part of the regression model when
predicting faculty motivation to use Blackboard.
Expectancy is a belief and typically based on past experience, self-confidence,
and the perceived difficulty of the performance goals. The analysis of results showed that
Expectancy was the only significant element in the model that predicted faculty
motivation to use Blackboard. It showed that faculty members were more motivated by
the convenience of the tools that Blackboard has to offer. Based on faculty members’

131
beliefs that their efforts would lead to certain level of performance, the expectancies were
ranked as follows:
1) Better organize their course materials.
2) Do their job more effectively.
3) Would save them time in the long run.
4) Would like to see Blackboard take less time to setup their courses.
5) Extend their courses beyond classroom.
6) Engage students with different learning styles.
7) Finally, having a feeling of accomplishment.
Faculty expectancy beliefs could be modified by presenting ideas, features and
trainings to show how effective Blackboard could be in their teaching. Based on the
results of this study, Vroom’s Expectancy theory was not very useful in predicting faculty
motivation to use Blackboard. Two of the predictors in the regression model were not
significant, although all the variables were useful independently based on their
correlations with the Motivation to use Blackboard tools. If university administration
would use the top three expectancies, instrumentalities and valences to modify some
faculty beliefs, rewards and policies, they could increase faculty motivation to use a
course management system.

132
Recommendations
The data collected in this study provided some ideas and recommendations for
future research studies that could use course management systems and faculty to get more
information about the process of motivation. The results obtained from the study suggest
that it might be necessary to review the list of instrumentalities and valences associated
with Blackboard use. The list used in this study had low rankings indicating that faculty
did not see the list of valences or instrumentalities relevant or desirable when associated
with Blackboard use. Higher rankings among instrumentalities and valences might make
the model a better fit when predicting faculty motivation. Thus, the following
recommendations were made:
a) After the selection of participants for a new study, conduct interviews with a
big number of them, if possible, asking detailed questions regarding what
expectancies, instrumentalities and valences faculty members believe could be
relevant when using a course management system.
b) In this study, the researcher used a simple list of outcomes, instrumentalities
and expectancies derived from literature that faculty members were asked to
rate. It would be interesting to conduct a study where a group of faculty would
be engaged in a training session on features and tools of a course management
system and compare this group to faculty that did not get the training. The
interviews conducted after this study could collect information about

133
expectancies, valences and instrumentalities and analyze if there were
significant changes in these elements.
c) By researching course management systems and their features, it would be
possible to have studies on a larger scale that would involve using 3-4 major
course management systems and analyze if there is a significant change in
faculty motivation. It would be necessary to identify similar features in all the
course management systems and develop a comparable analysis of their tools.
d) Based on the results of the survey, there were many answers that some
institutions were transitioning to a different course management system.
Further research could look at that population and see if motivation to use
Blackboard is any different from the new course management system that was
implemented at those universities.
e) If financial and time constraints would not be an issue, future researchers
could select more universities to be involved in a similar study. By selecting
schools to represent the whole United States would allow getting results that
could be generalized to a larger population.
f) Another possibility for this study is to change its direction and analyze how to
motivate non-users of course management systems, see what incentives and
attitudes could become attractive for that population to become active users of
these instructional tools. The information could collect priceless information
about faculty beliefs and attitudes that could be very valuable to the
developers of course management systems. By trying to meet the needs of

134
faculty they could expand the market share of their product and supply a
product that would be greatly appreciated.
In summary, this study adds some knowledge to the research of Vroom’s
expectancy theory and its usefulness in predicting faculty motivation. Data from the
survey used in this research showed that faculty preferred or were motivated by
Blackboard tools that would allow them to do their job more effectively. Based on
results, rewards in forms of student evaluations and student ratings were more important
than monetary or promotion incentives. Faculty believed that using Blackboard would
allow them to meet the needs of the student population followed by their own needs for
saving time when they prepare for teaching classes. The administration could increase
faculty awareness about the benefits of using Blackboard in the instructional process,
changing faculty attitudes and beliefs which could significantly boost the motivation to
use these course management systems.

135
APPENDICES
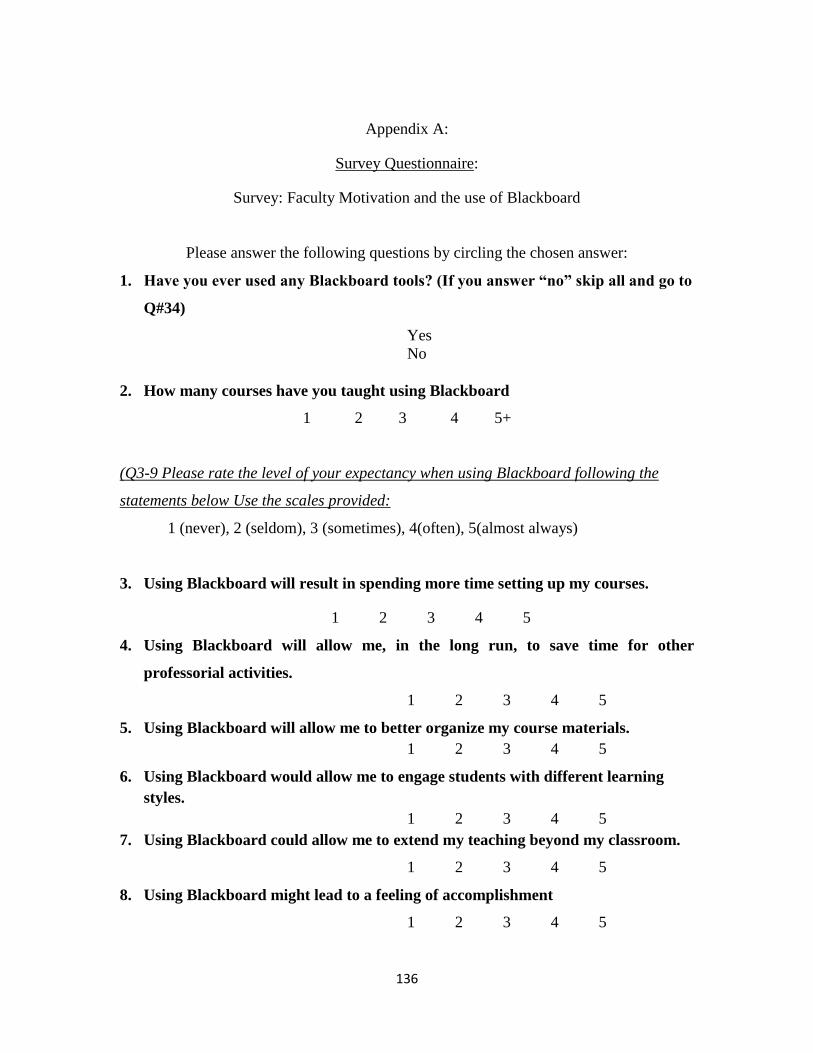
136
Appendix A:
Survey Questionnaire:
Survey: Faculty Motivation and the use of Blackboard
Please answer the following questions by circling the chosen answer:
1. Have you ever used any Blackboard tools? (If you answer “no” skip all and go to
Q#34)
Yes
No
2. How many courses have you taught using Blackboard
1 2 3 4 5+
(Q3-9 Please rate the level of your expectancy when using Blackboard following the
statements below Use the scales provided:
1 (never), 2 (seldom), 3 (sometimes), 4(often), 5(almost always)
3. Using Blackboard will result in spending more time setting up my courses.
1 2 3 4 5
4. Using Blackboard will allow me, in the long run, to save time for other
professorial activities.
1 2 3 4 5
5. Using Blackboard will allow me to better organize my course materials.
1 2 3 4 5
6. Using Blackboard would allow me to engage students with different learning
styles.
1 2 3 4 5
7. Using Blackboard could allow me to extend my teaching beyond my classroom.
1 2 3 4 5
8. Using Blackboard might lead to a feeling of accomplishment
1 2 3 4 5

137
9. Using Blackboard allows me to do my job more effectively.
1 2 3 4 5
(Q10-17) Here are some situations that could result from using Blackboard in your
teaching activity. Please rate the likelihood of each event occurring: Please use the
following ranking scale:
1 (Not at all likely), 2(Somewhat unlikely), 3 (50/50 chance) 4
(Quite likely), 5 (Extremely likely)
Using Blackboard might result in…
10. Getting an incentive pay or raise
1 2 3 4 5
11. Having more opportunities for a promotion
1 2 3 4 5
12. Getting better ratings on my student evaluations.
1 2 3 4 5
13. Improving my reputation among colleagues and department supervisors.
1 2 3 4 5
14. Having more control over my job by using the time I save on other professorial
activities.
1 2 3 4 5
15. Having a feeling of accomplishment
1 2 3 4 5
16. Having a better reputation among my students
1 2 3 4 5
17. Overall, my department values the use of this course management tool.
1 2 3 4 5
(Q18-25) Please rank how important to you is each of the following outcomes. Please
use the following ranking scale:

138
1 (Less Important), 2(Moderately important), 3 (Important) 4 (Quite
important), 5 (Very important)
18. Getting an incentive pay or raise.
1 2 3 4 5
19. Having more opportunities for a promotion
1 2 3 4 5
20. Getting better ratings on my student evaluations
1 2 3 4 5
21. Improving my reputation among colleagues and department supervisors.
1 2 3 4 5
22. Having more control over my job by using the time I save on other professorial
activities.
1 2 3 4 5
23. Having a feeling of accomplishment.
1 2 3 4 5
24. Having a better reputation among my students.
1 2 3 4 5
25. It is important that my department want to use this course management tool.
1 2 3 4 5
(Q26-33) Please rank your level of satisfaction while using Blackboard
26. To what extent did you make an effort to use Blackboard in the past?
1 (Very Low), 2(Low), 3 (Moderate), 4(High), 5(Extremely High)
27. Please rate the level of effort that you spent using Blackboard today.
1 (Very Low), 2(Low), 3 (Moderate), 4(High), 5(Extremely High)
28. I like Blackboard because it is easy to use.
1 (Not at all), 2(Not very), 3 (Neutral), 4(Somewhat),
5(Very much)
29. Overall, I have had a good experience while using Blackboard.
1 (Not at all), 2(Not very), 3 (Neutral), 4(Somewhat),
5(Very much)

139
30. How motivated are you to use the following Blackboard (BB) tools when
planning your courses?
Not at all Not very No
opinion
Somewhat Very
much
BB Course
Assignments
1 2 3 4 5
BB Grade book 1 2 3 4 5
BB Discussion
board
1 2 3 4 5
BB Email 1 2 3 4 5
BB file exchange 1 2 3 4 5
BB e-reserves 1 2 3 4 5
BB Virtual
classroom
1 2 3 4 5
BB Calendar 1 2 3 4 5
BB Adaptive
release
1 2 3 4 5
31. Overall, how likely are you to use Blackboard in the next semester?
1 (Not at all likely), 2(Somewhat unlikely), 3 (50/50 chance) 4 (Quite
likely), 5 (Extremely likely)
32. Based on your current satisfaction with Blackboard, if you had to buy it for
personal use in your courses, how much would pay for the license to use it.
<$100
$100-300
$300-500
>$500
33. How likely are you to recommend Blackboard as a course management tool to
your colleagues?
1 (Not at all likely), 2(Somewhat unlikely), 3 (50/50 chance) 4 (Quite
likely), 5 (Extremely likely)
Alternative questions for people answering “NO” to: Have you ever used Blackboard
tools?

140
34. Why have you not used Blackboard for your classroom instruction? Check all
that apply.
___I did not know about its existence
___I do not have time to use it
___It was too complicated to use and I gave up
___I can do without it
___I dread technology
Other
35. What is your gender?
Male
Female
36. What is your age (in years)?
< 27
28-44
45-54
55-64
65 +
37. How many years have you been teaching in higher education institutions?
1-5
6-10
11-15
16-20
20+
38. Which of the following best describes your specialization area?
Business
Arts & Humanities
Sciences
Education
Health (Medicine, Nursing)
Engineering
Other________________
39. What is your current faculty rank?
Instructor / Lecturer

141
Assistant Professor
Associate Professor
Professor
40. What was your tenure status at this institution during the past term?
Tenured
Tenure-track
Non-tenure-track
No tenure system

142
Appendix B:
Cover letter for the Questionnaire
Dear Faculty Member,
My name is Marian Turcan, a doctoral student in the program of Career and Technology
Education at Clemson University. Currently, I am working on my dissertation entitled
“Expectancy theory as a predictor of faculty motivation to use a course management software
tool.”
This study is being conducted to learn about a teacher’s motivation to use Blackboard. Hopefully,
the results of this research will lead to an increased understanding of one’s motivation related to
the use of a course management tool like Blackboard. All information provided will be
confidential. No names will be included in the study and all data is going to be summarized and
coded. Your participation in this survey is voluntary and greatly appreciated.
Please take a few minutes of your time and answer the questions included in the survey using the
link at the end of this letter. Estimated time to complete this survey is about 15-20 minutes.
If you are interested in the results please contact me at [email protected] and I will provide
you with a summary of my findings and a list of tips of exactly how to use Blackboard more
effectively.
Thank you so much for your time and cooperation.
Sincerely,
Principal Investigator
William Paige, PhD
Career and Technology Education
Eugene T. Moore School of Education
Clemson University
Co-investigator
Marian Turcan
Ed.D candidate
Career and Technology Education
Eugene T. Moore School of Education
Clemson University
If you have any questions or concerns about this study or if any problems arise, please contact
William Paige at Clemson University at 864.656.7647. If you have any questions or concerns
about your rights as a research participant, please contact the Clemson University Office of
Research Compliance at 864.656.6460.

143
Appendix C:
Validation of IRB Protocol #IRB2010-011: Expectancy Theory as a Predictor of Faculty
Motivation to Use a Course Management System
Dear Dr. Paige,
The Chair of the Clemson University Institutional Review Board (IRB) validated the
protocol identified above using Exempt review procedures and a determination was made
on February 9, 2010, that the proposed activities involving human participants qualify as
Exempt from continuing review under Category B2, based on the Federal Regulations
(45 CFR 46). You may begin this study with the understanding that you will not begin
research at any institution without the acceptance of this approval by the IRB at that
particular institution.
Please remember that no change in this research protocol can be initiated without prior
review by the IRB. Any unanticipated problems involving risks to subjects,
complications, and/or any adverse events must be reported to the Office of Research
Compliance (ORC) immediately. You are requested to notify the ORC when your study
is completed or terminated.
Please review the Responsibilities of Principal Investigators (available at
http://www.clemson.edu/research/compliance/irb/regulations.html) and the
Responsibilities of Research Team Members (available at
http://www.clemson.edu/research/compliance/irb/regulations.html) and be sure these
documents are distributed to all appropriate parties.
Good luck with your study and please feel free to contact us if you have any questions.
Please use the IRB number and title in all communications regarding this study.
All the best,
Nalinee Nalinee D. Patin IRB Coordinator Clemson University Office of Research Compliance Institutional Review Board (IRB) Voice: (864) 656-0636 Fax: (864) 656-4475 E-Mail: [email protected] Web site: http://www.clemson.edu/research/compliance/irb/

144
REFERENCES
American Federation of Teachers. (1996). Measuring up: the AFT’s criteria for good
charter school legislation Retrieved
from:<http://www.aft.org.research/reports/charter/csweb/csweb.doc>
Anderson, J. W. (2003). Faculty perspectives of the Blackboard course delivery system.
The Annual Meeting of the Mid-South Educational Research Association
(Biloxi,MS, November 5-7, 2003).
Arnsparger, V.C. (1933). Measuring the effectiveness of sound pictures as teaching aids.
New York: Bureau of Publications, Teachers College, Columbia University.
Baker-Eveleth, L. & Stone, R.W.(2008). Expectancy Theory and Behavioral Intentions to
use computer applications. Interdisciplinary Journal of Information, Knowledge,
and Management, Volume 3 .pp.135-146.
Bates, A. W. (1999). Managing technological change. San Francisco: Jossey-Bass.
Bates T. and Associates Inc, (2006) Research in E-learning. Retrieved from
http://www.tonybates.ca/wp-content/uploads/2008/07/research-in-e-learning.pdf
Berners-Lee,T. (1990) Original proposal for a global hypertext project at CERN.
Retrieved from < http://www.w3.org/History/1989/proposal.html>
Blinco,K. Mason,J. McLean,N., Wilson, S.(2004, July) Trends and Issues in E-learning
Infrastructure Development .
Bonk, C. & Dennen, V.(2003). Frameworks for reserach, design, benchmarks, training,
and pedagogy in web-based distance education. En M. Moorey W. Anderson
(Eds.) Handbook of distance education (pp. 245-260). New Jersey: L. Erlbaum
Associates.
Bonk C. J. & Kim, K. (2006). “The Future of Online Teaching and Learning in Higher
Education: The Survey Says”. Educause Quarterly November. pp.22 – 30.
Bonk, C. (2006). Bucaneer Bonk and his belated Blackboard the Pirate top ten list.
Weblog entry, August 6.TravelinEdMan.Retrived from
http://travelinedman.blogspot.com/2006/08/bucaneer-bonk-and-his-belated.html>

145
Byron, S. (1995). Computing and other instructional technologies: Faculty perceptions of
current practices and views of future challenges (ERIC Document Reproduction
Service No. Ed 390 381).
Campbell, J. P., Dunnette, M. D., Lawler, E. E., & Weick, K. E. (1970). Managerial
behavior, performance, and effectiveness. New York: McGraw Hill.
Cantoni, V., Cellario, M., & Porta, M. (2003, October). Perspectives and challenges in e-
learning: Towards natural interaction paradigms. Journal of Visual Languages
and Computing, 15(2004), 333-345.
Carabaneanu,L., Trandafir, R. and Mierlus-Mazilu, I. (2006), Trends in E-learning,
Department of Mathematics and Computer Science Technical University of Civil
Engineering Bucharest, Romania.
Champion, M, R, (2008). Creating Engagement: The Use of Expectancy theory in
Corporate Customer Service teams. Dissertation. Capella University.
Champion, M.R. (2008). Creating engagement: The use of expectancy theory in
corporate customer service teams. Dissertation. Capella University.
Chang, C.L. (2008). Faculty Perceptions and utilization of a learning management system
in higher education. Dissertation. Ohio University.
Chen,Y.,Gupta, A.,Hoshower, L.,(2006). Factors that motivate business faculty to
conduct research: An expectancy theory analysis. Journal of Education for
Business. Heldref Publications. March/April.
Chiang, C.F. (2006). An Expectancy Theory Model for Hotel Employee Motivation: The
Moderating role of communication satisfaction. Dissertation. Kankas State
University.
Chou, C. C. (2004). A model of learner-centered computer-mediated interaction for
collaborative distance learning. International Journal on E-Learning, 3(1), 11-18.
Clark, David James. (2002, January). Big bang or steady evolution?. Retrieved from
<http://www.learningtechnologies.co.uk/magazine/article_full.cfm?articleid=6&is
sueid=7§ion=1>
Clark, R., and Mayer, R. (2007). E-learning and the science of instruction: Proven
Guidelines for Consumers and Designers of Multimedia Learning. Pfeiffer. 2n
edition. 496 p.

146
Coates, H., James, R. & Baldwin, G. (2005). A critical examination of the effects of
Learning Management Systems on university teaching and learning. Tertiary
Education and Management, 11, 19-36.
Cohen, J. (1988): Statistical Power Analysis for the Behavioral Sciences. (2nd ed.)
Colorado, J. and Butler, M. (2007). Report. Faculty Use of Blackboard features. Emporia
State University. Retrieved from <
http://net.educause.edu/ir/library/pdf/EDU07117.pdf>
Connolly, T. & Stansfield,M.(2006) Using Games-Based eLearning Technologies in
Overcoming Difficulties in Teaching Information Systems, Journal of
Information Technology Education Volume 5.
Conole, C., Oliver, M., & Isroff, K. (2004). Addressing methodological issues in e-
learning research. In S. Banks, P. Goodyear, V. Hodgson, C. Jones, V. Lally, D.
McConnell & C. Steeples (Eds.), Proceedings of the Fourth International
Conference on Networked Learning, 92-97. Lancaster: Lancaster University &
University of Sheffield.
Cooke, M. (2004). Clomedia: The evolution of e-learning. Retrieved from
<http://www.clomedia.com/content/templates/clo_webonly.asp?articleid=571&zo
neid=78>
Cozby, P.C. (2001). Methods in behavioral research. New York, NY: McGraw Hill
Cradler, J., Freeman, M., McNabb M. Research Implications for Preparing Teachers to
use Technology. Learning & Leading with Technology, Volume 30 number
1.p.50.
Creswell, J.W. (1994). Research design: Qualitative & quantitative approaches. Sage
publications.228 p
Darboe, K. (2000). An Empirical study of the social correlated of job satisfaction among
plant science graduates of a Midwestern University: A Test of Victor H. Vroom’s
(1964) Expectancy Theory. Dissertation. South Dakota State University.
Dawson, J. (1997). The future of Educational Technology. Technology tools for Today’s
Campuses. May, 1997.Retrieved from
<http://sungsite.unc.edu/horizon/mon..instructional technology/dawson.html>

147
Deci, E. L. (1992). The relation of interest to the motivation of behavior: A self-
determination theory perspective. In K. A. Renninger, S. Hidi, & A. Kapp (Eds.).
The Role of Interest in Learning and Development (pp. 43-67). Hillsdale, NJ:
Erlbaum.
Desimone, R.L., Werner, J.M., Harris, D. M., (2002) Introduction to ISD Analysis.
Human Resource Devepment. Mason, Ohio: Thompson South Western.
Dixon, J. (2008) Literature Review for Faculty Use of Courseware to Teach Counseling
Theories, from <http://cnx.org/content/m32409/latest/>
Dreyfus, L. S. (1962). Introduction in L.S. Dreyfus & W.M. Bradley (Eds.), Televised
instruction: A series of lectures from Wayne-RCA invitational conference on
televised instruction. June 19-22, 1961. (p.1) Detroit, MI: Mass Communication
Center Wayne State University.
Ely, D. P. (1999). New perspectives on the implementation of educational technology
innovation. Paper delivered at the Association for Educational Communications
and Technology Annual Conference, Houston, TX, Feb., 1999.
Ennis, W.,Ennis, D., (1996).One Dozen Ways to Motivate Teacher Education Faculty to
Use Technology in Instruction. Journal of Computing in Teacher Education, v12
n2 p29-33 Win 1995-96
Epper, R. (1995). Coordination and competition in postsecondary distance education: A
comparative case study of statewide policies. Unpublished doctoral dissertation,
University of Denver.
Ertmer, P. A., Addison, P., Lane, M., Ross, E., & Woods, D. (1999). Examining teachers'
beliefs about the role of technology in the elementary classroom. Journal of
Research on Computing in Education, 32(1), 54-71.
Ferguson, E. D. (2000). Motivation: A biosocial and cognitive integration of motivation
and emotion. New York: Oxford University Press
Field, A. (2000). Discovering statistics using SPSS for Windows. London:
SagePublications.
Franklin, S. T. (2001) Motivations related to consumer use of online services.
Dissertation. University of Texas at Arlington.
Fudge, R. S. &. Schlacter, J. L. (1999). Motivating Employees to Act Ethically: An
Expectancy Theory Approach. Journal of Business Ethics. 18 (3), 295-304.

148
Gahungu, A., Dereshiwsky, M. I., and Moan, E. (Summer, 2006). Finally, I can be with
my students 24/7, Individually and in a Group. A Survey of faculty teaching
online. Journal of Interactive Online Learning, 5 (2). Retrieved from <
http://www.ncolr.org/jiol/issues/PDF/5.2.1.pdf.>
Gates, B., Myhrvold, N., & Rinearson, P. (1995). The road ahead. New York; Viking
Penguin.
Gerlich, B. K., & Perrier, A. (2003). Arts instruction in the age of technology: Providing
library services to support studio and survey faculty who use technology for
instruction. Information Technology and Libraries, 22(2), 79- 83.
Groves, M. M., & Zemel, P. C. (2000). Instructional technology adoption in higher
education: An action research case study. International Journal of Instructional
Media, 27(1), 57-65.
Halawi, L. and McCarthy, R. (2007). Measuring faculty perceptions of blackboard using
the technology acceptance model. Issues in Information Systems, 8(2), 160-165.
Hamner, W.C. (1974). Reinforcement theory and contingency management in
organizational settings. In V.H. Vroom & E.L. Deci (Eds.), Management and
Motivation (pp. 65-77). London: Penguin Books.
Heaton-Shrestha, C., Gipps, C., Edirisingha, P., & Linsey, T. (2007). Learning and e-
learning in HE: The relationship between student learning style and VLE use',
Research Papers in Education, 22(4), 443 – 464.
Hersey, P., Blanchard, K. (1988). Management of Organizational Behavior. Prentice
Hall; 5th edition, 464 p.
Holmes, P.D. (1962). Television as an instructional medium. In L.S. Dreyfys & W. M.
Bradley (Eds), Televised instruction: A Series of lectures from Wayne-RCA
invitational conference on televised instruction, June 19-22, 1961. (pp.53-60).
Detroit, MI: Mass Communications Central Wayne State university.
Howard, K. (1989). A comprehensive expectancy motivation model: Implications for
adult education and training. Adult Education Quarterly, 39, (4), 199-210
Hoogeveen, K. (1986). An Empirical examination of Expectancy theory as a framework
for analyzing the motivational impact of merit pay for classroom teachers.
Dissertation. University of Nebraska.

149
Huitt, W. (2001). Motivation to learn: An overview. Educational Psychology Interactive.
Valdosta, GA: Valdosta State University. Retrieved from
<http://www.edpsycinteractive.org/col/motivation/motivate.html>
Isaac, R.G, Zerbe, W.J., Pitt ,D.C. (2001). The Effective Application of Expectancy
Theory. Journal of Managerial Issues. Retrieved from:<
http://www.entrepreneur.com/tradejournals/article/77386453.html>
Johnson, P. (2003). Top 10 reasons Faculty fail when using Blackboard CMS. From <
http://www.micsymposium.org/mics_2003/Johnson.PDF>
Keuhl, R.O. (2000). Design of experiments: Statistical principles of research design and
analysis. Pacific Grove, CA: Duxbury Press.
Kiffmeyer, M. (2004). The evolution of e-learning. Retrieved from
<http://knowledgemanagement.ittoolbox.com/documents/popular-q-and-a/the-
evolution-of-elearning-2902>
Kim, K.-J., & Bonk, C. J. (2006). The future of online teaching and learning in higher
education: EDUCAUSE Quarterly, 29(4), pp. 22-30.
Kini, R.B., & Hobson, C.J. (2002, December). Motivational theories and successful total. International Journal of Management, 19(4), 605-613
Kotler, P. (1984). Marketing Essentials. Englewood, N.J. Prentice-Hall, Inc.
Latham, G.P. (2004). The motivational benefits of goal-setting. Academy of Management
Executive, (18)4, 126-129. Retrieved from Academic Search.
Lee, J. (2001). Instructional support for distance education and faculty motivation,
commitment, satisfaction. British Journal of Educational Technology, 32, 153-
160.
Lee, S. (2007). Academic library service consumer motivation study based on expectancy
theory. Dissertation. Florida State University.
Lopes, V.,M.,(2008). The Efficacy of a course management system in learning:
perceptions of students and faculty at one Ontario College. Dissertation.
University of Toronto.
Loudon, D. L. & Della Bitta, A. J. (1993). Consumer Behavior. N.Y. McGraw-Hill

150
MacDonald, R.M. & Watson, E.S. (1997). Electronic resources in the freshman seminar
classroom: Promoting the use of emerging technologies. Technology tools for
today’s campuses.
Maguire, L. L. (2005). Literature review - faculty participation in online distance
education: Barriers and motivators. Online Journal of Distance Learning
Administration, 8(1). Retrieved from
<http://www.westga.edu/~distance/ojdla/spring81/maguire81.htm>
Malikowski, S., M. Thompson, et al. (2007). “A model for research into course
management systems: bridging technology and learning theory.” Journal of
Educational Computing Research 36(2): 149-173.
Marcinkiewicz, H. R., (1996) Motivation and Teachers’ Computer Use. Report National
Convention of the Association for Educational Communications and Technology.
Massy, J. (2004). Study of the e-learning suppliers’ “market” in Europe” Advanced
Distributed Learning (ADL), Sharable Content Object Reference Model
(SCORM®) 2nd Edition Overview.
Merritt. C. Jr. (1998). Technology use in classroom: Motivation for Faculty. Dissertation.
University of Denver.
Miskel, C., McDonald, D., & Bloom, S. (1983). Structural expectancy linkages within
schools and organizational effectiveness. Educational Administration Quarterly,
19 (1), 49-82.
Moore D.S., & McCabe, G.P. (2006). Introduction to the practice of statistics. New York,
NY: W.H. Freeman Clark R., Mayer. R (2007). e-Learning and the Science of
Instruction: Proven Guidelines for Consumers and Designers of Multimedia
Learning.
Morgan, G. (2003). Faculty use of course management systems. Retrieved from
<http://www.educause.edu/ir/library/pdf/ers0302/rs/ers0302w.pdf.>
Morgan, G., Schlais, H. (2005). How do faculty use course management systems? A
Modular approach. 18th annual conference on distance teaching and learning.
From <http://www.uwex.edu/disted/conference/>.
Morrison, J., Badrul, K. (2003). “The Global e-Learning Framework: An Interview with
Badrul Khan.” The Technology Source, May-June. Retrieved from
<http://technologysource.org/article/global_elearning_framework/. Archived at
http://www.webcitation.org/5XWfxg4jP>.

151
Nagel, D. (2010). Blackboard Mobile learn Debuts on iPad. The Journal. Retrieved from
< http://thejournal.com/articles/2010/04/05/blackboard-mobile-learn-debuts-on-
ipad.aspx>.
Nigohosian, R. H. (1997). Scholarly Internet Research: Is it real? Report. Department of
Finance and Economics, Salt Lake City Community college.
O’Mahony, C. (2003). E-Learning component evolution and integration: A case study.
From
<http://66.102.1.104/scholar?hl=en&lr=&q=cache:YnGxTMT2uVMJ:plum.yunte
ch.edu.tw/icce2004/Theme3/083_OMahony.pdf>.
Panza, C.M. (2002). Performance analysis: Linking it to the job. In G. M. Piskurich (Ed.),
HPI essentials (pp. 23-40). Alexandria, VA: American Society for Training and
Development.
Paramythis, A, Loidl-Reisinger, S.(2004). Adaptive Learning Environments and e-
Learning Standards.
Pfeffer, J., and Veiga, J. (1999). Putting people first for organizational success. Academy
of Management Executive, 13: 37-48.
Pinder, C.C. (1984). Work motivation: Theory, issues, and applications. Glenview, IL:
Scott, Foresman, and Company.
Porter, L. W., & Lawler, E. E. 1968. Managerial Attitudes and Performance. Homewood,
IL: Richard D. Irwin, Inc.
Pulichino, J.(2005, March). Current Trends in e-Learning. Research Report, quality
initiatives. International Journal of Management, 19 (4), 605-613.
Rakes, G. C., & Casey, H. B. (2002). An analysis of teacher concerns toward
instructional technology. International Journal of Educational Technology, 3.
Retrieved March 14, 2003 from
<http://www.aio.uiuc.edu/ijet/v3n1/rakes/index.htm>
Rofofsky Marcus, S. (2006) Factors Affecting theatre faculty use of web based
technologies in their undergraduate courses. Dissertation. Toura University
International.
Rosen. L.D (1995). Computer Availability, computer experience and Technophobia
among public schools teachers. Computers in Human Behavior, Volume 11,
number 1, pp.9-31.

152
Salmon, G. (2004). E-Moderating: The key to teaching and learning online. London:
Kogan Page.
Satterfield, T. (2004, June). Engaging employees: Designing incentive programs that
work. B & C Solutions. Retrieved from
<http://www.bcsolutionsmag.com/archives>
Sawyer, R. (2000). Mentoring But Not Being Mentored: Improving Student-to-Student
Mentoring Programs to Attract Urban Youth to Teaching. Urban Education,
36(1), 39-59.
Sawyer, R.D. (2000). Adapting Curriculum to Student Diversity: Patterns of Perceptions
among alternate-route and college-based teachers. The Urban Review, 32(4), 343-
364.
Schepman, S.B. & Richmond, L.(2003). Employee expectations and motivations: An
application form the “learned helplessness” paradigm. Journal of American
Academy of Business, 3, 405.
Schopieray, S.E. (2006). Understanding Faculty Motivation to teach online courses.
Dissertation. Michigan State University.
Schultz, M.J. (1965). The Teacher and overhead projection: A treasury of ideas, used and
techniques. Englewood Cliffs, NJ: Prentice-Hall.
Secrist, J. Herrman, H. (1962). The faculty viewpoint: A panel discussion. In L.S.
Dreyfys & W. M. Bradley (Eds), Televised instruction: A Series of lectures from
Wayne-RCA invitational conference on televised instruction, June 19-22, 1961.
(pp.71-92). Detroit, MI: Mass Communications Central Wayne State university.
Skelly, B. (2009) Age is no barrier to technology use, retrieved from
<http://archives.tcm.ie/businesspost/2009/04/05/story40767.asp>
Smith, A.D. and Rupp, W.T. (2004) 'Managerial challenges of e-recruiting: extending the
life cycle of new economy employees', Online Information Review, Vol. 28, No.
1, pp. 61-74.
Soper, D.S. (2010) "The Free Statistics Calculators Website", Online Software,
<http://www.danielsoper.com/statcalc/>
Souleles, N. (2005). E-learning in Art and Design: Perceptions and practices of teachers
in undergraduate studio-based disciplines. Retrieved from
<http://www.elearningartdesign.org/researc.htm>

153
Star, S. (2003). Application of Mobile Technology in Learning and Teaching: “M-
leaning”. Briefing paper, Canterbury Christ Church University College.
Stephens, R.E. (1992). Faculty development and institutional technology in selected
colleges and universities. Association for Educational Communications and
Technology ( ERIC Document Reproduction Service No. ED 348 027)
Stroud, D. (2009), Technology Use Is Becoming Age-neutral, retrieved from
<http://www.futurelab.net/blogs/marketing-strategy-
innovation/2009/12/technology_use_becoming_age_ne.html>
Stubblefield, H. W. & Keane, P (1994). Adult education in the American Experience:
From the colonial period to the present. San Francisco, CA” Jossey-Bass.
Surry, D. W. (2000). Strategies for motivating higher education faculty to use
technology. Innovations in Education and Training International, 37(2), 145-153.
Nagel, D. (2010) Moodle Connects with Adobe Acrobat Connect.
Taylor, F. W. (1911). The Principles of Scientific Management. New York and London,
Harper & brothers. Thomas, K.W. (2002). Intrinsic motivation at work: Building
energy and commitment. San Francisco: Berrett-Koehler.
Tien. F.F. (2000). To what degree does the desire for promotion motivate faculty to
perform research? Testing the Expectancy theory. Research in Higher Education,
Volume 41, number 200, pp.723-749.
Todd, N.L. (1993). Faculty concerns as gateways to teacher competency with computer
technologies. New Orleans, LA: Convention of the Association for Educational
Communications and Technology. (ERIC Document Reproduction Service No.
362 209)
Topp, N.W., Mortenson, R.,& Grandgenett, N. (1995). Goal: Technology-using teachers;
Key: Technology-using education faculty. San Antonio, TX: Proceedings of the
international Conference of the Society for Information Technology and Teacher
Education. (ERIC Document Reproduction Service No. Ed 385 240)
United States Distance Learning Association (2010). Resources, statistics, and distance
learning resources. http://www.usdla.org/html/aboutUs/researchInfo.htm
US Department of Education Office of the Secretary (2004). New Educational
Technology Plan 2004. Retrieved from < http://www.ed.gov/technology/plan/>

154
Valentine, D. (2002). Distance learning: Promises, problems, and possibilities. Online
Journal of Distance Learning Administration, V(III). Retrieved January 28, 2008,
from http://www.westga.edu/~distance/ojdla/fall53/valentine53.html
Vereyken, S,E.M. (1984). Expectancy Theory of Motivation as a predictor of teacher
performance. Dissertation. University of Tulsa.
Vroom,V H.(1964). Work and Motivation. New York: Wiley, 331 p.
Vroom,V H.(1995). Work and Motivation, Revised Edition, Jossey-Bass Classics
Vroom, V.H. & Deci, E.L. (1992). Introduction to the second edition. In V.H. Vroom and
E.L. Deci (Eds.), Management and Motivation (2nd ed.). London: Penguin Group.
Waight,C.L., Willging. P.A.,Wentling T.L.,Recurrent Themes in E-Learning: A Meta-
Analysis of Major E-Learning Reports.
Walt, N., Atwood, K., and Mann, A. (2008). Does survey medium affect responses? An
exploration of electronic and paper surveying in British Colombia Schools. The
Journal of Technology, Learning and Assessment. Volume 6 (7), April.
Webber, M.J. (2006, May). A Study of Computer Technology and Technology
Leadership of Texas Elementrary Public School Principals. Dissertation.
University of North Texas.
Weiner, B. (1992). Human motivation: Metaphors, theories, and research. Newbury
Park, CA: Sage.
Weld. A (1962). Organization of TV instruction. In L.S. Dreyfys & W. M. Bradley (Eds),
Televised instruction: A Series of lectures from Wayne-RCA invitational
conference on televised instruction, June 19-22, 1961. (pp.61-70). Detroit, MI:
Mass Communications Central Wayne State university.
Weller, M. (2006). VLE 2.0 and future directions in learning environments. In R. Philip,
A Voerman & J. Dalziel (Eds.), Proceedings of the First International
LAMSConference 2006: Designing the Future of Learning (pp 99-106). 6-8
.December 2006, Sydney: LAMS Foundation. Retrieved January 3, 2008,
retrieved from <http://lamsfoundation.org/lams2006/papers.htm>
West, R., Waddoups, G., & Graham, C. (2007). Understanding the experiences of
instructors as they adopt a course management system. Education Technology
Research & Development, 55(1), 1-26.

155
Woods, R., Bakerb, J. D., & Hopper, D. (2004). Hybrid structures: Faculty use and
perception of web-based courseware as a supplement to face-to-face instruction.
The Internet and Higher Education, 7(4), 281-297.