expanded analysis chapter 11 © 2011 cengage learning. all rights reserved. may not be scanned,...
TRANSCRIPT

ExpandedAnalysis
Chapter 11
© 2011 Cengage Learning. All Rights Reserved. May not be scanned, copied or duplicated, or posted to a publicly accessible website, in whole or in part.
Chapter 11, Slide #2
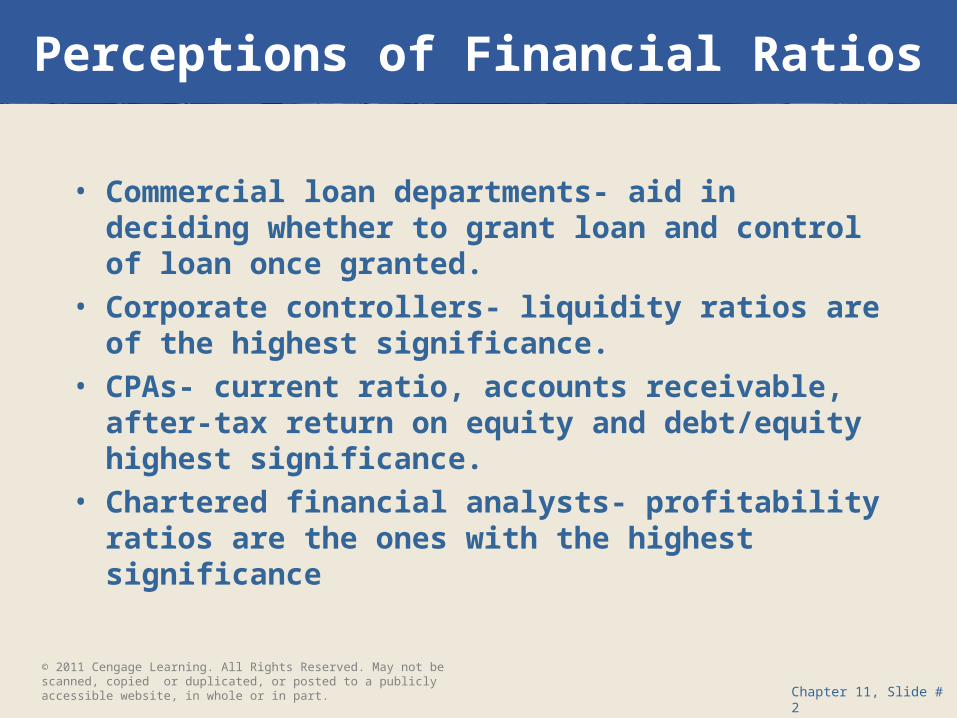
• Commercial loan departments- aid in deciding whether to grant loan and control of loan once granted.
• Corporate controllers- liquidity ratios are of the highest significance.
• CPAs- current ratio, accounts receivable, after-tax return on equity and debt/equity highest significance.
• Chartered financial analysts- profitability ratios are the ones with the highest significance
Perceptions of Financial Ratios
© 2011 Cengage Learning. All Rights Reserved. May not be scanned, copied or duplicated, or posted to a publicly accessible website, in whole or in part.
Chapter 11, Slide #3
Commercial Loan Departments
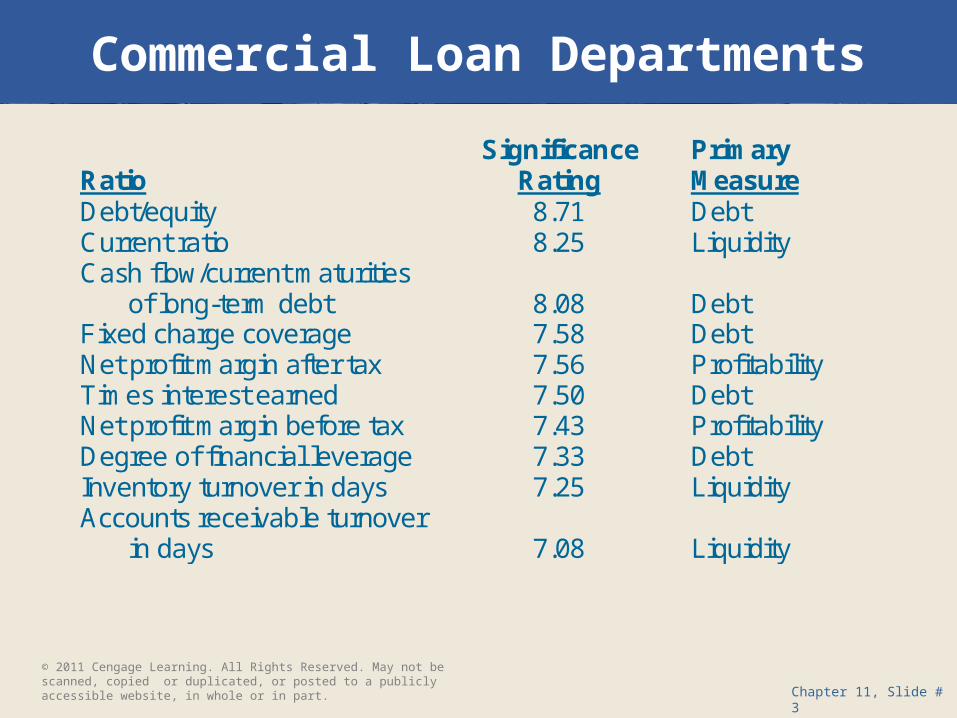
Significance Primary Ratio Rating Measure Debt/equity 8.71 Debt Current ratio 8.25 Liquidity Cash flow/current maturities
of long-term debt 8.08 Debt Fixed charge coverage 7.58 Debt Net profit margin after tax 7.56 Profitability Times interest earned 7.50 Debt Net profit margin before tax 7.43 Profitability Degree of financial leverage 7.33 Debt Inventory turnover in days 7.25 Liquidity Accounts receivable turnover
in days 7.08 Liquidity
© 2011 Cengage Learning. All Rights Reserved. May not be scanned, copied or duplicated, or posted to a publicly accessible website, in whole or in part.

Chapter 11, Slide #4
Corporate Controllers
Primary Ratio Percentage* Measure Earnings per share 80.6 Profitability Debt/equity ratio 68.8 Debt Return on equity after tax 68.5 Profitability Current ratio 62.0 Liquidity Net profit margin after tax 60.9 Profitability Dividend payout ratio 54.3 Other Return on total invested capital after tax 53.3 Profitability Net profit margin before tax 52.2 Profitability Accounts receivable turnover in days 47.3 Liquidity Return on assets after tax 47.3 Profitability *Percentage of firms indicating that the ratio was included in corporate objectives.
© 2011 Cengage Learning. All Rights Reserved. May not be scanned, copied or duplicated, or posted to a publicly accessible website, in whole or in part.
Chapter 11, Slide #5
Certified Public Accountants
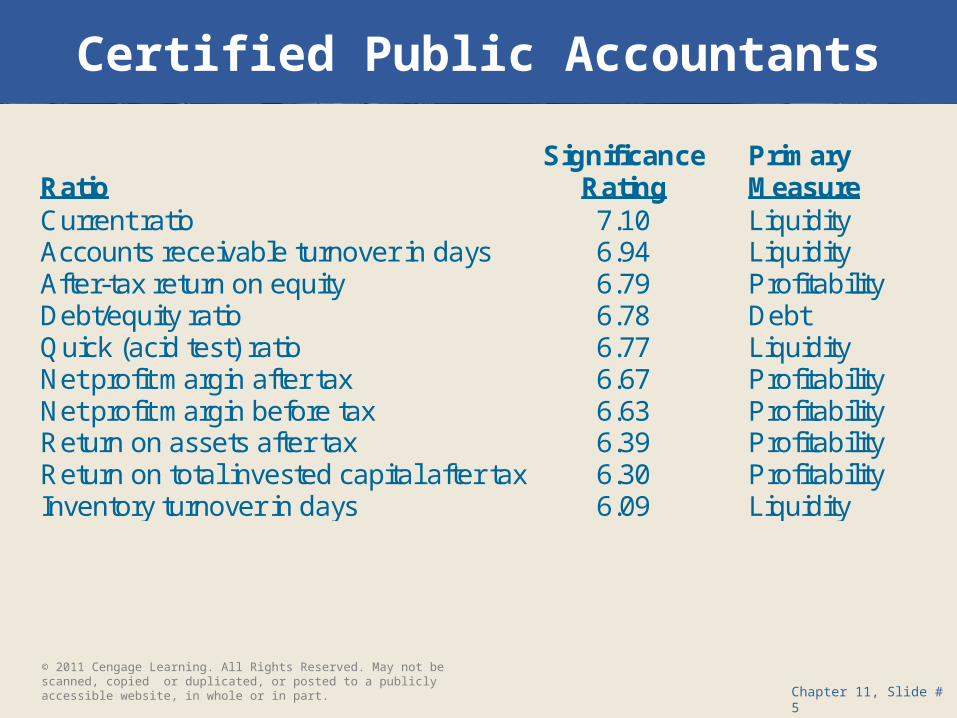
Significance Primary Ratio Rating Measure Current ratio 7.10 Liquidity Accounts receivable turnover in days 6.94 Liquidity After-tax return on equity 6.79 Profitability Debt/equity ratio 6.78 Debt Quick (acid test) ratio 6.77 Liquidity Net profit margin after tax 6.67 Profitability Net profit margin before tax 6.63 Profitability Return on assets after tax 6.39 Profitability Return on total invested capital after tax 6.30 Profitability Inventory turnover in days 6.09 Liquidity
© 2011 Cengage Learning. All Rights Reserved. May not be scanned, copied or duplicated, or posted to a publicly accessible website, in whole or in part.

Chapter 11, Slide #6
Chartered Financial Analysts
Significance Primary Ratio Rating Measure Return on equity after tax 8.21 Profitability Price/earnings ratio 7.65 Other Earnings per share 7.58 Profitability Net profit margin after tax 7.52 Profitability Return on equity before tax 7.41 Profitability Net profit margin before tax 7.32 Profitability Fixed charge coverage 7.22 Debt Quick (acid test) ratio 7.10 Liquidity Return on assets after tax 7.06 Profitability Times interest earned 7.06 Debt
© 2011 Cengage Learning. All Rights Reserved. May not be scanned, copied or duplicated, or posted to a publicly accessible website, in whole or in part.

Chapter 11, Slide #7
Comparison of Responses byLoan Departments, Controllers, CPAs, and CFAs
Significance Ranking
Loan Departments
Corporate Controllers CPAs CFAs
1 Debt/EquityEarnings per
ShareCurrent Ratio
Return on Equity After Tax
2 Current RatioDebt/Equity
RatioAccts Rec Turnover
Price/Earnings Ratio
3
Cash Flow/Current Maturities LT
Debt
Return on Equity After
Tax
Return on Equity After
Tax
Earnings per Share
4Fixed Charge
CoverageCurrent ratio
Debt/Equity Ratio
Net Profit Margin
5Net Profit
Margin After Tax
Net Profit Margin After
TaxQuick Ratio
Return on Equity Before
Tax
Key: Debt Liquidity Profitability Other© 2011 Cengage Learning. All Rights Reserved. May not be scanned, copied or duplicated, or posted to a publicly accessible website, in whole or in part.
Chapter 11, Slide #8
Financial Ratios in Annual Reports
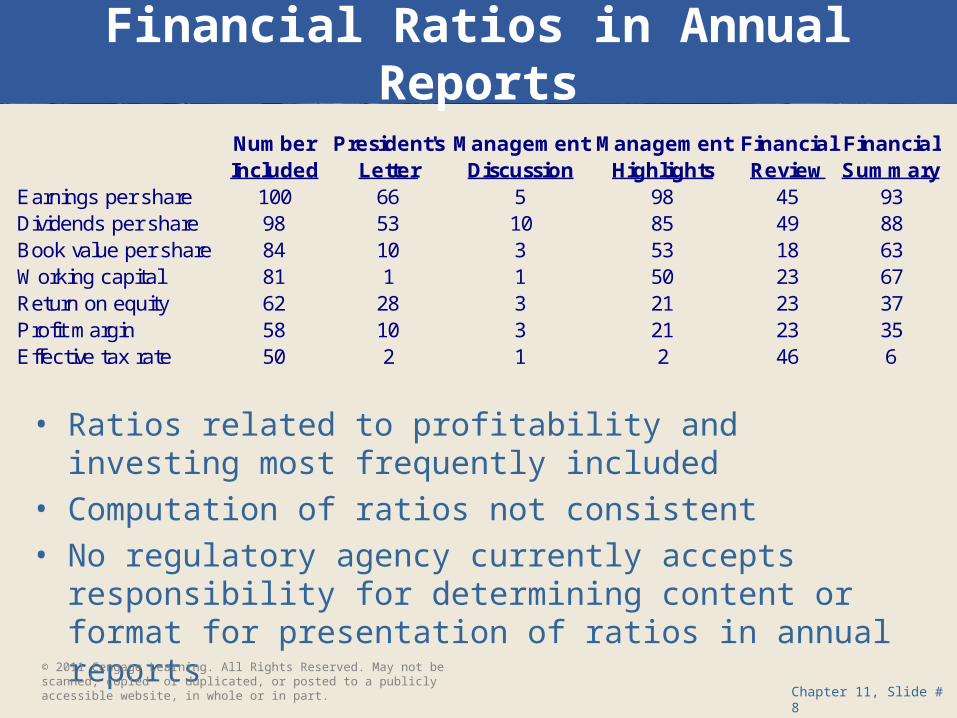
Number President's Management Management Financial FinancialIncluded Letter Discussion Highlights Review Summary
Earnings per share 100 66 5 98 45 93Dividends per share 98 53 10 85 49 88Book value per share 84 10 3 53 18 63Working capital 81 1 1 50 23 67Return on equity 62 28 3 21 23 37Profit margin 58 10 3 21 23 35Effective tax rate 50 2 1 2 46 6
• Ratios related to profitability and investing most frequently included
• Computation of ratios not consistent• No regulatory agency currently accepts responsibility for
determining content or format for presentation of ratios in annual reports
© 2011 Cengage Learning. All Rights Reserved. May not be scanned, copied or duplicated, or posted to a publicly accessible website, in whole or in part.

Chapter 11, Slide #9
Conservatism and Quality of Earnings
• Conservatism– Achieved through the slowest reporting of net income– Yields higher quality of earnings
• Inventory (in periods of inflation)– LIFO reports highest cost of goods sold and lowest
asset (inventory) value
• Fixed Assets– Accelerated depreciation methods– Shorter life estimates
© 2011 Cengage Learning. All Rights Reserved. May not be scanned, copied or duplicated, or posted to a publicly accessible website, in whole or in part.

Chapter 11, Slide #10
Conservatism and Quality of Earnings (cont’d)
• Intangible Assets– Shorter life estimates– Expensing of R&D as incurred
• Pensions– Assumed discount rate– Rate of compensation increase
© 2011 Cengage Learning. All Rights Reserved. May not be scanned, copied or duplicated, or posted to a publicly accessible website, in whole or in part.

Chapter 11, Slide #11
Forecasting Financial Failure
• Financial failure defined as– Liquidation– Deferment of payments on debt– Passing on preferred dividend
• Financial failure criteria– No standard set of criteria
© 2011 Cengage Learning. All Rights Reserved. May not be scanned, copied or duplicated, or posted to a publicly accessible website, in whole or in part.

Chapter 11, Slide #12
Forecasting Financial Failure (cont’d)
• Isolate ratios that may forecast failure; construct model– Used by management as a preventative measure– Used by investors in portfolio management– Used by creditors in lending decisions– Used by auditor to assess ‘going concern’ status
• Recognized models– Univariate [Beaver]– Multivariate [Altman]
© 2011 Cengage Learning. All Rights Reserved. May not be scanned, copied or duplicated, or posted to a publicly accessible website, in whole or in part.

Chapter 11, Slide #13
Univariate [Beaver] Model
• Single variable• Identified ratios
– Cash flow/total debt– Net income/total assets (return on assets)– Total debt/total assets (debt ratio)
• Observed relationships– Failed firms have less cash– Failed firms have higher receivables– Failed firms have less inventory
© 2011 Cengage Learning. All Rights Reserved. May not be scanned, copied or duplicated, or posted to a publicly accessible website, in whole or in part.

Chapter 11, Slide #14
Multivariate [Altman] Model
• Multiple regression model with five ratios
Z = .012X1 + .014X2 + .033X3 + .006X4 + .010X5
X1 = Working Capital ÷ Total Assets X2 = Retained Earnings ÷ Total Assets X3 = Earnings Before Interest and Taxes ÷ Total Assets X4 = Market Value of Equity ÷ Book Value of Total Debt X5 = Sales ÷ Total Assets
• The lower the “Z” score, the more likely is failure
© 2011 Cengage Learning. All Rights Reserved. May not be scanned, copied or duplicated, or posted to a publicly accessible website, in whole or in part.
Chapter 11, Slide #15
Forecasting Financial Failure
• Many academic studies exist• Weaker ratios indicate higher risk of failure• No conclusive model has been identified• Use an integrated approach
© 2011 Cengage Learning. All Rights Reserved. May not be scanned, copied or duplicated, or posted to a publicly accessible website, in whole or in part.

Chapter 11, Slide #16
Analytical Review Procedures
• Auditors isolate– Significant fluctuations– Unusual items
• Performed in various stages of the audit– Planning– Fieldwork as substantive tests– Review
© 2011 Cengage Learning. All Rights Reserved. May not be scanned, copied or duplicated, or posted to a publicly accessible website, in whole or in part.

Chapter 11, Slide #17
Management’s Use of Analysis
• Relative liquidity, debt, and profitability– Financial ratios– Common-size analysis
• Indicative of investor’s perception of the firm• As part of corporation planning
– General and specific objectives– Budgeting
© 2011 Cengage Learning. All Rights Reserved. May not be scanned, copied or duplicated, or posted to a publicly accessible website, in whole or in part.
Chapter 11, Slide #18
Use of LIFO Reserves
• Firms that use LIFO for financial reporting• Disclosure:
– LIFO cost basis of inventory– Approximate current cost of that inventory– Difference is the LIFO reserve
© 2011 Cengage Learning. All Rights Reserved. May not be scanned, copied or duplicated, or posted to a publicly accessible website, in whole or in part.

Chapter 11, Slide #19
Use of LIFO Reserves (cont’d)
• Determine adjusted financial statement information based on LIFO reserve– Inventory– Deferred income tax– Cost of goods sold– Net income– Liquidity, debt, and profitability ratios
© 2011 Cengage Learning. All Rights Reserved. May not be scanned, copied or duplicated, or posted to a publicly accessible website, in whole or in part.

Chapter 11, Slide #20
Graphing Financial Information
• Line graph– A set of points connected by a line– Shows change over time
0
1
2
3
4
5
6
7
2002 2003 2004 2005 2006
Fiscal Year
Net
Sal
es (
in b
illio
ns)
© 2011 Cengage Learning. All Rights Reserved. May not be scanned, copied or duplicated, or posted to a publicly accessible website, in whole or in part.

Chapter 11, Slide #21
Graphing Financial Information (cont’d)
• Column graph– Most appropriate for accounting data
$0
$5
$10
$15
$20
$25
$30
$35
Apr May Jun Jul Aug Sep
Sa
les
(0
00
s)
Shoes Socks Shorts© 2011 Cengage Learning. All Rights Reserved. May not be scanned, copied or duplicated, or posted to a publicly accessible website, in whole or in part.

Chapter 11, Slide #22
Graphing Financial Information (cont’d)
• Pie graph– Presented in segments– Segments aggregate to 100%
Other18%
Europe26%
USA34%
Asia22%
© 2011 Cengage Learning. All Rights Reserved. May not be scanned, copied or duplicated, or posted to a publicly accessible website, in whole or in part.

Chapter 11, Slide #23
Management of Earnings
• Cash basis of accounting– Recognize revenue when cash is collected– Recognize expenses when cash is paid– Does not usually provide reasonable determination of income
over the short run
• Accrual basis of accounting– Usually provides reasonable determination of income over the
short run– Realization concept (revenue recognized when earned)– Matching concept (expenses recognized when incurred)– Requires use of estimates, assumptions, and judgment
© 2011 Cengage Learning. All Rights Reserved. May not be scanned, copied or duplicated, or posted to a publicly accessible website, in whole or in part.

Chapter 11, Slide #24
Management of Earnings (cont’d)
• Manipulate earnings through– Improper use of estimates– Improper judgment– Intentional errors
• Revenue recognition is often the focus of financial manipulation– Premature recognition of revenue– Inventory cutoff– Receivable timing and valuation
© 2011 Cengage Learning. All Rights Reserved. May not be scanned, copied or duplicated, or posted to a publicly accessible website, in whole or in part.

Chapter 11, Slide #25
Enron
• 2001– October: reduced after-tax income by $500 million– November: restated 1997–2000 net income– December: filed for bankruptcy
• Techniques– Special-purpose entities– Complex and opaque financial statements
© 2011 Cengage Learning. All Rights Reserved. May not be scanned, copied or duplicated, or posted to a publicly accessible website, in whole or in part.

Chapter 11, Slide #26
WorldCom
• 2002– June: $3.8 billion of overstated profits over 5
quarters– November: special bankruptcy court examiner
reported that the improper accounting would exceed $7.2 billion
• Techniques– Moved funds from reserve accounts to bolster
profits– Capitalized operating costs
© 2011 Cengage Learning. All Rights Reserved. May not be scanned, copied or duplicated, or posted to a publicly accessible website, in whole or in part.
Chapter 11, Slide #27
The Housing Bust
• Fannie Mae and Freddie Mac
-because of implied protection of the Federal Government received AAA from Standard and Poor’s
-controlled trillions of dollars of mortgages
-2003 and 2004 government auditors found company’s manipulated accounting rules
- 2007 and 2008 mortgage market blew creating collapse of major financial institutions
© 2011 Cengage Learning. All Rights Reserved. May not be scanned, copied or duplicated, or posted to a publicly accessible website, in whole or in part.
Chapter 11, Slide #28
Restatement of Prior Financial Statements
• Restatements have become a substantial problem when analyzing financial statements.
• Review companies that are being analyzed for restatement during period of time being analyzed.
- Make similar review for companies that
companies is being compared with.
- Analysis can’t guard against industry data that
should not be relied on.
© 2011 Cengage Learning. All Rights Reserved. May not be scanned, copied or duplicated, or posted to a publicly accessible website, in whole or in part.

Chapter 11, Slide #29
Valuation
• A process of estimating the value of a firm or some component of a firm
• Approaches to valuation– Fundamental analysis– Discounted valuation models
© 2011 Cengage Learning. All Rights Reserved. May not be scanned, copied or duplicated, or posted to a publicly accessible website, in whole or in part.

Chapter 11, Slide #30
Fundamental Valuation Analysis
• Acceptance– Not well accepted by traditional financial literature – Preferred by security analysts and fund managers
• Utilize basic accounting measures– Reported earnings– Cash flow– Book value
• Use one or more multiples– Price-to-earnings– Price-to-book– Price-to-operating cash flow– Price-to-sales
© 2011 Cengage Learning. All Rights Reserved. May not be scanned, copied or duplicated, or posted to a publicly accessible website, in whole or in part.

Chapter 11, Slide #31
Multiperiod Discounted Valuation Models
• Acceptance– Strongly supported by financial literature– Not widely used by analysts
• Discounted earnings models– Discounted abnormal earnings– Residual income
• Discounted cash flow models– Free cash flow– Dividend discount model– Discounted cash flow
© 2011 Cengage Learning. All Rights Reserved. May not be scanned, copied or duplicated, or posted to a publicly accessible website, in whole or in part.

Chapter 11, Slide #32
Discounted Earnings Models
• Discounted abnormal earnings (DAE)– The value of the firm’s equity is the sum of its book
value and discounted forecasts of abnormal earnings
• Residual income (RI)– Discounted future expected earnings– Earnings are a periodic measure of shareholder
wealth creation
© 2011 Cengage Learning. All Rights Reserved. May not be scanned, copied or duplicated, or posted to a publicly accessible website, in whole or in part.

Chapter 11, Slide #33
Discounted Cash Flow Models
• Free cash flow (FCF)– The projected future stream of free cash flows are
discounted to the present
Operating cash flows– Interest– Cash outlays for operating capacity– Debt repayments– Preferred dividends = Free cash flow
© 2011 Cengage Learning. All Rights Reserved. May not be scanned, copied or duplicated, or posted to a publicly accessible website, in whole or in part.
Chapter 11, Slide #34
Discounted Cash Flow Models (cont’d)
• Dividend discount model (DDM)– The projected future stream of common stock
dividends are discounted to the present
• Discounted cash flow (DCF)– Projected future cash flows are discounted to the
present at the firm’s cost of capital
© 2011 Cengage Learning. All Rights Reserved. May not be scanned, copied or duplicated, or posted to a publicly accessible website, in whole or in part.
Chapter 11, Slide #35
What Analysts Use
• Barker European Accounting Review (1999,8:2)– Price-earnings ratio was the preferred method of valuation– Valuation models are important in the context of one another
rather than in isolation
• Demirakos, et al Accounting Horizons (2004,18:4)– Price-earnings ratio is predominant– Analysis tailor valuation methodologies to the industry
• Asquith, et al Journal of Financial Economics (2005,75)– Market-to-book value used as the asset multiple
© 2011 Cengage Learning. All Rights Reserved. May not be scanned, copied or duplicated, or posted to a publicly accessible website, in whole or in part.

Chapter 11, Slide #36
Valuation and Management Consultants
• Discounted cash flows provide a more reliable picture of a company’s value than an earnings-multiple approach
• Discounted cash flows drive the value of a company• Focus on long-term cash flows
– Short-term cash flows are subject to manipulation
• Mergers and acquisitions– Shareholders of the acquired company experience greater
returns– Acquiring companies may pay too much for the acquired
company
© 2011 Cengage Learning. All Rights Reserved. May not be scanned, copied or duplicated, or posted to a publicly accessible website, in whole or in part.
Chapter 11, Slide #37
Dot.com Companies
• Apply classic methods to pricing of dot.coms• High investments in customer acquisitions• Factors for customer-value analysis
– Average revenue per customer per year– Total number of customers– Contribution margin per customer– Average per-customer acquisition cost– Customer churn rate
© 2011 Cengage Learning. All Rights Reserved. May not be scanned, copied or duplicated, or posted to a publicly accessible website, in whole or in part.