exome-scale discovery of hotspot mutation …...protein structure models, we substantially increase...
TRANSCRIPT
Integrated Systems and Technologies: Mathematical Oncology
Exome-Scale Discovery of Hotspot MutationRegions in Human Cancer Using 3D ProteinStructureCollin Tokheim1, Rohit Bhattacharya1, Noushin Niknafs1, Derek M. Gygax2,Rick Kim2, Michael Ryan2, David L. Masica1, and Rachel Karchin1,3
Abstract
The impact of somatic missense mutation on cancer etiologyand progression is often difficult to interpret. One commonapproach for assessing the contribution of missense mutationsin carcinogenesis is to identify genes mutated with statisticallynonrandom frequencies. Even given the large number ofsequenced cancer samples currently available, this approachremains underpowered to detect drivers, particularly in lessstudied cancer types. Alternative statistical and bioinformaticapproaches are needed. One approach to increase power is tofocus on localized regions of increased missense mutationdensity or hotspot regions, rather than a whole gene or proteindomain. Detecting missense mutation hotspot regions in three-dimensional (3D) protein structure may also be beneficialbecause linear sequence alone does not fully describe thebiologically relevant organization of codons. Here, we presenta novel and statistically rigorous algorithm for detecting mis-sense mutation hotspot regions in 3D protein structures. Weanalyzed approximately 3 � 105 mutations from The CancerGenome Atlas (TCGA) and identified 216 tumor-type–specific
hotspot regions. In addition to experimentally determinedprotein structures, we considered high-quality structural mod-els, which increase genomic coverage from approximately5,000 to more than 15,000 genes. We provide new evidencethat 3D mutation analysis has unique advantages. It enablesdiscovery of hotspot regions in many more genes than previ-ously shown and increases sensitivity to hotspot regions intumor suppressor genes (TSG). Although hotspot regions havelong been known to exist in both TSGs and oncogenes, weprovide the first report that they have different characteristicproperties in the two types of driver genes. We show how cancerresearchers can use our results to link 3D protein structure andthe biologic functions of missense mutations in cancer, and togenerate testable hypotheses about driver mechanisms. Ourresults are included in a new interactive website for visualizingprotein structures with TCGAmutations and associated hotspotregions. Users can submit new sequence data, facilitating thevisualization of mutations in a biologically relevant context.Cancer Res; 76(13); 3719–31. �2016 AACR.
IntroductionMissense mutations are perhaps the most difficult mutation
type to interpret in human cancers. Truncating loss-of-functionmutations and structural rearrangements generate majorchanges in the protein product of a gene, but a single missensemutation yields only a small change in protein chemistry. Theimpact of missense mutation on protein function, cellularbehavior, cancer etiology, and progression may be negligibleor profound, for reasons that are not yet well understood.Missense mutations are frequent in most cancer types, account-ing for approximately 85% of the somatic mutations observedin solid human tumors (1), and the cancer genomics
1Department of Biomedical Engineering and Institute for Computa-tional Medicine, Johns Hopkins University, Baltimore, Maryland. 2InSilico Solutions, Fairfax, Virginia. 3Department of Oncology, JohnsHopkins University School of Medicine, Baltimore, Maryland.
Note: Supplementary data for this article are available at Cancer ResearchOnline (http://cancerres.aacrjournals.org/).
Corresponding Author: Rachel Karchin, Johns Hopkins University School ofMedicine, 217AHackermanHall, 3400N. Charles St., Baltimore, MD21218. Phone:410-516-5578; Fax: 410-516-5294; E-mail: [email protected]
doi: 10.1158/0008-5472.CAN-15-3190
�2016 American Association for Cancer Research.
Major FindingsWe used The Cancer Genome Atlas mutation data and
identified 3D clusters of cancer mutations ("hotspot regions")at amino-acid-residue resolution in 91 genes, of which 56 areknown cancer-associated genes. The hotspot regions identifiedby our method are smaller than a protein domain or protein–protein interface and in many cases can be linked preciselywith functional features such as binding sites, active sites, andsites of experimentally characterized mutations. The hotspotregions are shown to be biologically relevant to cancer, andwediscovered that there are characteristic differences betweenregions in the two types of driver genes, oncogenes and tumorsuppressor genes (TSG). These differences include region size,mutational diversity, evolutionary conservation, and aminoacid residue physiochemistry. For the first time, we quantifywhy the greatmajority of well-known hotspot regions occur inoncogenes. Because hotspot regions in TSGs are larger, moreheterogeneous than those inoncogenes, they aremore difficultto detect using protein sequence alone and are likely to beunderreported. Our results indicate that protein structure–based 3Dmutation clustering increases power to find hotspotregions, particularly in TSGs.
CancerResearch
www.aacrjournals.org 3719
on August 6, 2020. © 2016 American Association for Cancer Research. cancerres.aacrjournals.org Downloaded from
Published OnlineFirst April 28, 2016; DOI: 10.1158/0008-5472.CAN-15-3190

community has prioritized the task of identifying importantmissense mutations discovered in sequencing studies. Whole-exome sequencing (WES) studies of cancer have created newopportunities to better understand the importance of missensemutations. This enormous collection of data now allowsdetection of patterns with power that was unheard of a fewyears ago.
The first approaches to identify cancer drivers from WESmutations looked for significantly mutated genes (SMG), har-boring a larger number of somatic mutations than expected by
chance (2–5). Metrics to call SMGs now appear to be under-powered given the size of current cohorts in The CancerGenome Atlas (TCGA) and International Cancer GenomeConsortium (ICGC). A recent study suggested that approxi-mately 1,500 cases of endometrial cancer would need to besequenced to attain 90% power to detect mutations in 90% ofgenes with a mutation frequency of 2% with the SMG approach(5). The recognition of the limitations of the SMG paradigmhas motivated interest in orthogonal analysis techniques todetect mutational patterns associated with drivers (1, 6–9).
Quick Guide to Equations and AssumptionsAn experimentally determined or theoretically modeled protein structure consists of a set of atoms, each with a unique
coordinate in three-dimensional (3D) Euclidean space. Each amino acid residue consists of many atoms and may harbor zero,one, or multiple missense mutations in a cohort of sequenced cancer samples. Two key mathematical concepts in our study arethe density of local missense mutations in 3D space, which underlies our statistical measure to define missense mutationhotspot regions, and mutational diversity of a hotspot region. Local missense mutation density
Dkr ¼
Xn2Nk
r
Mkn
is defined for each amino acid residue r and each protein structure k. It considers the sum of the count of missense mutationsthat occurred at r and those that occurred at residues proximal to r, that is, in its "neighborhood." Proximity is measured in 3Dspace and the neighborhood is limited to residues up to 1 nm away from r, where 1 nm was chosen because it is the order ofmagnitude of an amino acid side chain. The term Mk
n is the missense mutation count for the nth residue neighbor of r. Theobserved value of Dk
r is compared with simulations of its value under an empirical null distribution, where the total number ofmissense mutations observed in k remains the same, but they are distributed uniformly in 3D. Residue r has significantlyincreased Dk
r if its adjusted P value is �0.01 after multiple testing correction. A 3D hotspot region is a grouping of residueswith significantly increased Dk
r that are linked as connected components in a neighbor graph. Our algorithm can find 3Dhotspot regions directly on protein complexes, enabling detection of hotspot regions that occur on both sides of a protein–protein interface. It also handles complexes with multiple chains originating from a single gene product (e.g., a homodimer)by running identical simulations simultaneously.
Mutational diversity is computed for each hotspot region sgi (where i indexes the region and g indexes the gene) based on the
Shannon entropy of the joint probability of a missense mutation occurring at a specific residue r and having a specific mutantamino acid m
H Rsgi ; Msgi� �
¼ �X
r2Rsgi
X
m2Msgir
P Rsgi ¼ r; Msgi ¼ m� �
log2P Rsgi ¼ r; Msgi ¼ m� �
Because themaximum possible Shannon entropy grows with the number of residues in a hotspot region, the score is normalizedso hotspot regions of different sizes can be compared.
MD sgi� � ¼
H Rsgi ; Msgi
� �
Hmax N; R; Að ÞN is the number of mutations in the hotspot region, R is the number of residues, and A is the number of possible alternateamino acids per residue. In this work, mutational diversity is found to be significantly different between hotspot regions thatoccur in oncogenes versus those that occur in tumor suppressor genes.
Major assumptions of the model:* In the absence of selection for drivers, somatic missense mutations in cancers are equally likely to appear at any amino acid
residue position in a protein structure of interest.* Many driving missense mutations have significantly increased local mutation density.* Residues with significantly increasedmutation density and proximal to each other in three dimensions are likely to be subject to
similar selective pressures and can be grouped together into hotspot regions.* The most parsimonious number of hotspot regions in a protein structure is preferred.* Carefully filtered theoretical protein structure models are accurate enough to capture local missense mutation densities and
groupings of proximal residues with significantly increased densities.
Tokheim et al.
Cancer Res; 76(13) July 1, 2016 Cancer Research3720
on August 6, 2020. © 2016 American Association for Cancer Research. cancerres.aacrjournals.org Downloaded from
Published OnlineFirst April 28, 2016; DOI: 10.1158/0008-5472.CAN-15-3190

Recurrence of somatic missense mutations in cancers at thesame amino acid residue position is well known to be a charac-teristic feature of both oncogenes (OG) and tumor suppressorgenes (TSG; ref. 10). The observation that somatic mutations alsofrequently occur in positions proximal in protein sequence to themost highly recurrent positions has suggested that positionalclustering of somatic missense mutations might be used toidentify drivers (7). These clusters, known as "hotspots," areregions where somatic missense mutations occur closer togetherin protein sequence than would be expected by chance. Hotspotregions can be rationalized as areas in a protein under positiveselection in the cancer environment; missense mutations occur-ring in these regions are selected for because they alter proteinfunction in a manner advantageous to the cancer cell. Severalalgorithms have been developed to identify protein functionaldomains and genes in which these regions are enriched (8, 11),and to identify specific missense mutations in hotspots (7, 12).These algorithms consider mutations in a coordinate systembased on one-dimensional (1D) protein sequence. WES studiesof cancer cohorts are increasingly incorporating missense "hot-spot" detection as a routine analysis step in the search for newdrivers.
Finding missense mutation hotspot regions in 1D is limitedby the fact that functional proteins tend to fold into three-dimensional (3D) structures (with the exception of intrinsi-cally disordered regions). Thus, positional clustering donein 1D will likely miss many hotspots that are present in 3Dafter folding. Gene- and protein domain-level testing mayindicate the possibility of a 3D hotspot but cannot identifythe specific positions in the hotspot. An algorithm thatleverages 3D protein structure information, but still performsclustering in 1D through a dimensionality reduction step,has shown utility in detecting OGs (9). A recent study of anaggregated collection of TCGA cancer mutations from 21tumor types presented an algorithm to identify cancer genesbased on 3D clustering of somatic missense mutations, yield-ing ten such genes. They reported low correlation between 3Dand 1D hotspot regions (13).
Here, we present HotMAPS (Hotspot Missense mutationAreas in Protein Structure), a new, sensitive algorithm and aweb-based community resource for high-throughput analysis ofcancer missense mutation 3D hotspot regions. HotMAPS findsclusters of amino acid residues with significantly increased localmutation density in 3D protein space, compared with an empir-ical null distribution. The statistical model is designed to handlehigher-order protein complexes and can capture regions thatspan protein–protein interfaces. We apply HotMAPS to mis-sense mutations from 23 tumor types sequenced by TCGA. Bycareful use of both experimentally derived protein biologicassemblies in the Protein Data Bank (PDB) and theoreticalprotein structure models, we substantially increase the numberof amino acids that can be mapped into 3D protein space andthe number of detectable hotspot regions (13).
HotMAPS systematically delineates 3D hotspot regions onthe level of amino acid positions, and we provide a detailedcatalog of 216 tumor-type–specific regions. We show how thecatalog can be used as a discovery tool so that the links between3D protein structure and the biologic functions of missensemutations in cancer can be better utilized by the community.The catalog provides comprehensive identification of hotspotregions that overlap with many key biologic features of proteins
available in the literature (e.g., residue positions at active sites,small-molecule and metal-binding sites, protein interfaces,positions with published experimental mutagenesis results).This information can potentially provide a researcher withmore fine-grained mechanistic understanding of missensemutation cancer relevance than is possible by 1D clusteringor domain and gene enrichment approaches. Using the catalog,we were able for the first time to systematically analyze char-acteristic properties of 3D hotspot regions and differencesbetween 3D hotspot regions in OGs and TSGs.
Materials and MethodsTCGA mutation collection
TCGA mutation annotation format (MAF) file data for 23tumor types was downloaded from Xena data store (https://genome-cancer.soe.ucsc.edu/proj/site/xena/hub/) using theirAPI.
3D protein structure and theoretical model collection andprocessing
PDB structures were obtained from the Worldwide ProteinData Bank (10/17/2015). Only structures solved by x-ray crystal-lography and containing at least one human protein chain wereused. Single-domain, theoretical protein structure models con-structed on the basis of homology to nonhuman proteins wereincluded to increase coverage over a greater proportion of genes.Theoretical models were obtained from the ModPipe human2013 dataset (ftp://salilab.org/databases/modbase/projects/gen-omes/H_sapiens/2013/), built with Modeller 9.11 (14). In addi-tion to criteria required by ModPipe, we filtered the theoreticalmodels to increase the quality of structures used in our assessmentbased on minimum length, target-template sequence identity,loop content, and radius of gyration (Supplementary Materialsand Methods).
Models were assessed by comparing 3D hotspot regionsidentified by HotMAPS in experimental structures with thoseidentified in theoretical models of the same protein. First, wefound all pairs of experimental structures and theoretical mod-els of the same protein, in which there was overlap of the sameamino acid residues. The agreement of a structure/model pairwas the overlap of their hotspot region–mutated residues. Afalse-positive error was called when a model had a mutatedresidue in a hotspot region that was not in a hotspot region forany protein structure that it had been paired with. A false-negative error was called when a structure had a mutated residuein a hotspot region that was not in a hotspot region for any ofthe models it had been paired with.
HotMAPS algorithmHotMAPS identifies residue positions with higher local
mutation density in each protein structure or model thanexpected from an empirical null distribution, based on simula-tions of a discrete uniform distribution. Residues are consid-ered significant for increased local mutation density at FDRthreshold of 0.01, after correction for multiple testing (Benja-mini Hochberg). Three-dimensional missense mutation hot-spots are identified as groupings of significant residues accord-ing to the principle of maximum parsimony, based on con-nected components in a neighbor graph. Construction of theneighbor graph and connected components are illustrated in
Exome-Scale Discovery of Hotspot Mutation Regions
www.aacrjournals.org Cancer Res; 76(13) July 1, 2016 3721
on August 6, 2020. © 2016 American Association for Cancer Research. cancerres.aacrjournals.org Downloaded from
Published OnlineFirst April 28, 2016; DOI: 10.1158/0008-5472.CAN-15-3190
Supplementary Fig. S1. HotMAPS is designed to run on bothsingle-chain protein structures and biologic assemblies withmultiple chains originating from the same gene. Mathematicaldetails are provided in Supplementary Materials and Methods.
Results3D missense mutation hotspot regions identified in TCGAwhole-exome sequencingMutation hotspot regions detectable in 3D. Applying HotMAPSto 19,368 PDB protein structures (PDB bioassemblies in whichin vivo protein structure is represented) and 46,004 theoreticalmodels, we identified 107 unique 3Dmutation hotspot regions(aggregated across tumor types), of which 30 were only detect-able by clustering in 3D (Supplementary Table S1). Whenstratified by tumor type, 216 3D missense mutation hotspotregions were found in 19 of the 23 TCGA tumor types, withnone in adrenocortical carcinoma (ACC), kidney renal papil-lary cell carcinoma (KIRP), liver hepatocellular carcinoma(LIHC), or kidney chromophobe (KICH; Supplementary TableS2). KICH is known to be driven by alterations other than pointmutation, such as structural breakpoints in the TERT promoter.Among all 23 tumor types, sample and mutation count is lowerfor these four tumor types (P ¼ 0.02 for sample count, P ¼ 0.04for mutation count; Wilcoxon rank-sum test), suggesting that atleast for tumor types driven by missense mutations, largersample size might increase our power to find more 3D regions.Our approach enabled us to consider the 3D protein environ-ment of a much higher fraction of TCGA mutations than hasbeen described previously. We were able to map and analyzeapproximately 53% of the missense mutations in 23 TCGAtumor types (Supplementary Table S3). Of these missensemutations, approximately 10% could be mapped to PDB pro-tein structures and an additional 42% mapped to theoreticalmodels, in the absence of PDB structure. Using hotspot regionsidentified in the PDB structures as a control, we estimate thatthe hotspots called in the models have a false-positive rate of0.058 and a false-negative rate of 0.138. Therefore, very fewhotspot regions found in the models are the result of modelingerrors, justifying the increase in mutation coverage obtained.
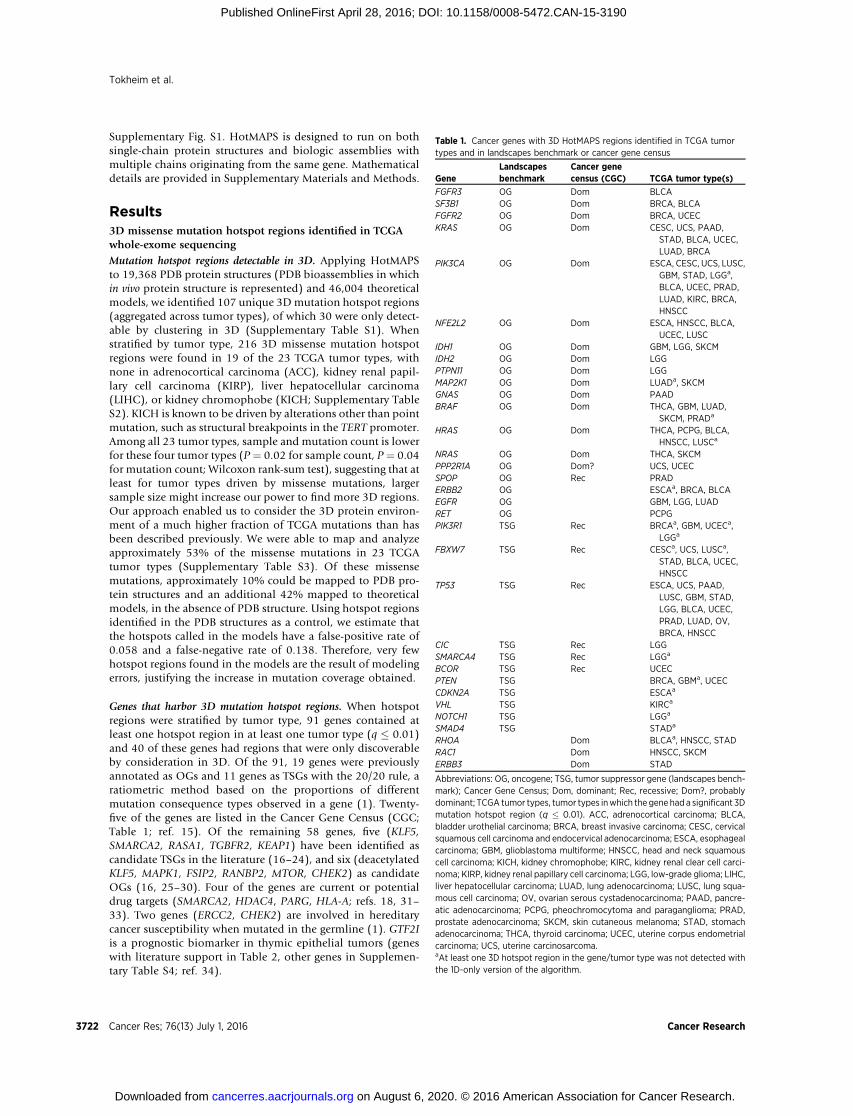
Genes that harbor 3D mutation hotspot regions. When hotspotregions were stratified by tumor type, 91 genes contained atleast one hotspot region in at least one tumor type (q � 0.01)and 40 of these genes had regions that were only discoverableby consideration in 3D. Of the 91, 19 genes were previouslyannotated as OGs and 11 genes as TSGs with the 20/20 rule, aratiometric method based on the proportions of differentmutation consequence types observed in a gene (1). Twenty-five of the genes are listed in the Cancer Gene Census (CGC;Table 1; ref. 15). Of the remaining 58 genes, five (KLF5,SMARCA2, RASA1, TGBFR2, KEAP1) have been identified ascandidate TSGs in the literature (16–24), and six (deacetylatedKLF5, MAPK1, FSIP2, RANBP2, MTOR, CHEK2) as candidateOGs (16, 25–30). Four of the genes are current or potentialdrug targets (SMARCA2, HDAC4, PARG, HLA-A; refs. 18, 31–33). Two genes (ERCC2, CHEK2) are involved in hereditarycancer susceptibility when mutated in the germline (1). GTF2Iis a prognostic biomarker in thymic epithelial tumors (geneswith literature support in Table 2, other genes in Supplemen-tary Table S4; ref. 34).
Table 1. Cancer genes with 3D HotMAPS regions identified in TCGA tumortypes and in landscapes benchmark or cancer gene census
GeneLandscapesbenchmark
Cancer genecensus (CGC) TCGA tumor type(s)
FGFR3 OG Dom BLCASF3B1 OG Dom BRCA, BLCAFGFR2 OG Dom BRCA, UCECKRAS OG Dom CESC, UCS, PAAD,
STAD, BLCA, UCEC,LUAD, BRCA
PIK3CA OG Dom ESCA, CESC, UCS, LUSC,GBM, STAD, LGGa,BLCA, UCEC, PRAD,LUAD, KIRC, BRCA,HNSCC
NFE2L2 OG Dom ESCA, HNSCC, BLCA,UCEC, LUSC
IDH1 OG Dom GBM, LGG, SKCMIDH2 OG Dom LGGPTPN11 OG Dom LGGMAP2K1 OG Dom LUADa, SKCMGNAS OG Dom PAADBRAF OG Dom THCA, GBM, LUAD,
SKCM, PRADa
HRAS OG Dom THCA, PCPG, BLCA,HNSCC, LUSCa
NRAS OG Dom THCA, SKCMPPP2R1A OG Dom? UCS, UCECSPOP OG Rec PRADERBB2 OG ESCAa, BRCA, BLCAEGFR OG GBM, LGG, LUADRET OG PCPGPIK3R1 TSG Rec BRCAa, GBM, UCECa,
LGGa
FBXW7 TSG Rec CESCa, UCS, LUSCa,STAD, BLCA, UCEC,HNSCC
TP53 TSG Rec ESCA, UCS, PAAD,LUSC, GBM, STAD,LGG, BLCA, UCEC,PRAD, LUAD, OV,BRCA, HNSCC
CIC TSG Rec LGGSMARCA4 TSG Rec LGGa
BCOR TSG Rec UCECPTEN TSG BRCA, GBMa, UCECCDKN2A TSG ESCAa
VHL TSG KIRCa
NOTCH1 TSG LGGa
SMAD4 TSG STADa
RHOA Dom BLCAa, HNSCC, STADRAC1 Dom HNSCC, SKCMERBB3 Dom STAD
Abbreviations: OG, oncogene; TSG, tumor suppressor gene (landscapes bench-mark); Cancer Gene Census; Dom, dominant; Rec, recessive; Dom?, probablydominant; TCGA tumor types, tumor types inwhich the gene had a significant 3Dmutation hotspot region (q � 0.01). ACC, adrenocortical carcinoma; BLCA,bladder urothelial carcinoma; BRCA, breast invasive carcinoma; CESC, cervicalsquamous cell carcinoma and endocervical adenocarcinoma; ESCA, esophagealcarcinoma; GBM, glioblastoma multiforme; HNSCC, head and neck squamouscell carcinoma; KICH, kidney chromophobe; KIRC, kidney renal clear cell carci-noma; KIRP, kidney renal papillary cell carcinoma; LGG, low-grade glioma; LIHC,liver hepatocellular carcinoma; LUAD, lung adenocarcinoma; LUSC, lung squa-mous cell carcinoma; OV, ovarian serous cystadenocarcinoma; PAAD, pancre-atic adenocarcinoma; PCPG, pheochromocytoma and paraganglioma; PRAD,prostate adenocarcinoma; SKCM, skin cutaneous melanoma; STAD, stomachadenocarcinoma; THCA, thyroid carcinoma; UCEC, uterine corpus endometrialcarcinoma; UCS, uterine carcinosarcoma.aAt least one 3D hotspot region in the gene/tumor type was not detected withthe 1D-only version of the algorithm.
Tokheim et al.
Cancer Res; 76(13) July 1, 2016 Cancer Research3722
on August 6, 2020. © 2016 American Association for Cancer Research. cancerres.aacrjournals.org Downloaded from
Published OnlineFirst April 28, 2016; DOI: 10.1158/0008-5472.CAN-15-3190
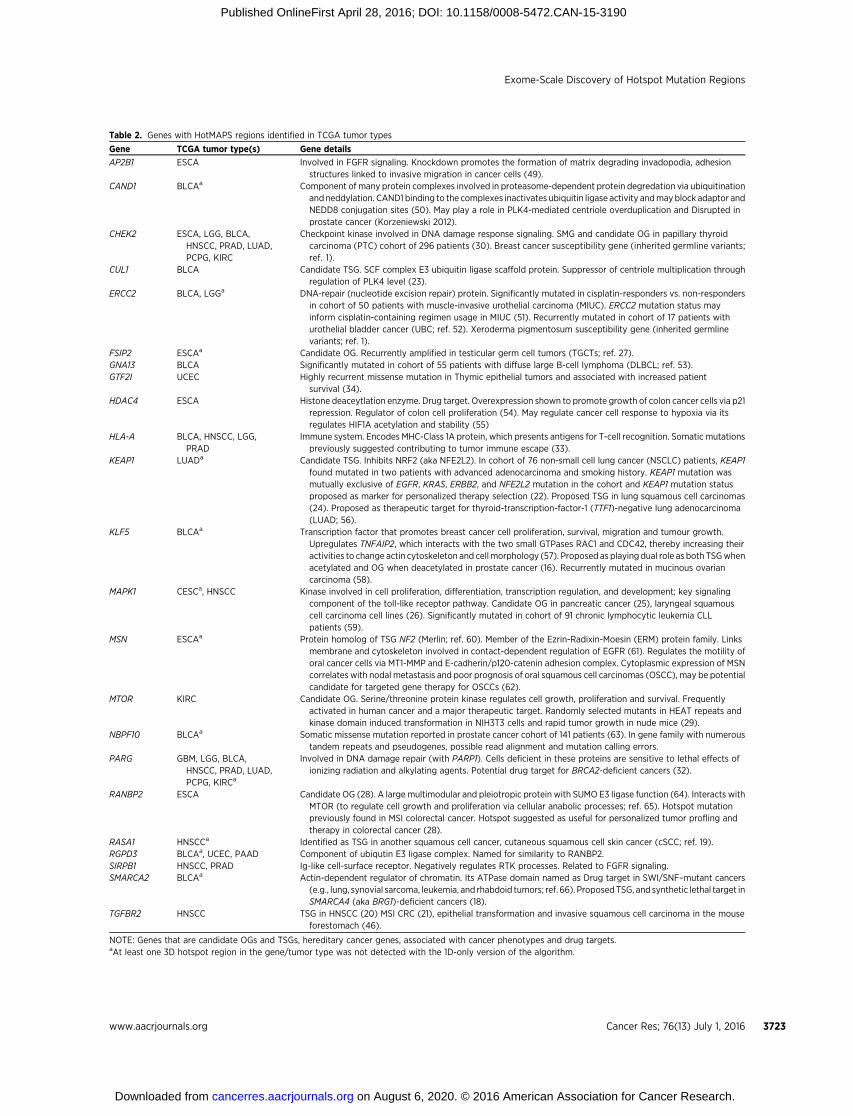
Table 2. Genes with HotMAPS regions identified in TCGA tumor types
Gene TCGA tumor type(s) Gene details
AP2B1 ESCA Involved in FGFR signaling. Knockdown promotes the formation of matrix degrading invadopodia, adhesionstructures linked to invasive migration in cancer cells (49).
CAND1 BLCAa Component of many protein complexes involved in proteasome-dependent protein degredation via ubiquitinationand neddylation. CAND1 binding to the complexes inactivates ubiquitin ligase activity andmayblock adaptor andNEDD8 conjugation sites (50). May play a role in PLK4-mediated centriole overduplication and Disrupted inprostate cancer (Korzeniewski 2012).
CHEK2 ESCA, LGG, BLCA,HNSCC, PRAD, LUAD,PCPG, KIRC
Checkpoint kinase involved in DNA damage response signaling. SMG and candidate OG in papillary thyroidcarcinoma (PTC) cohort of 296 patients (30). Breast cancer susceptibility gene (inherited germline variants;ref. 1).
CUL1 BLCA Candidate TSG. SCF complex E3 ubiquitin ligase scaffold protein. Suppressor of centriole multiplication throughregulation of PLK4 level (23).
ERCC2 BLCA, LGGa DNA-repair (nucleotide excision repair) protein. Significantly mutated in cisplatin-responders vs. non-respondersin cohort of 50 patients with muscle-invasive urothelial carcinoma (MIUC). ERCC2 mutation status mayinform cisplatin-containing regimen usage in MIUC (51). Recurrently mutated in cohort of 17 patients withurothelial bladder cancer (UBC; ref. 52). Xeroderma pigmentosum susceptibility gene (inherited germlinevariants; ref. 1).
FSIP2 ESCAa Candidate OG. Recurrently amplified in testicular germ cell tumors (TGCTs; ref. 27).GNA13 BLCA Significantly mutated in cohort of 55 patients with diffuse large B-cell lymphoma (DLBCL; ref. 53).GTF2I UCEC Highly recurrent missense mutation in Thymic epithelial tumors and associated with increased patient
survival (34).HDAC4 ESCA Histone deaceytlation enzyme. Drug target. Overexpression shown to promote growth of colon cancer cells via p21
repression. Regulator of colon cell proliferation (54). May regulate cancer cell response to hypoxia via itsregulates HIF1A acetylation and stability (55)
HLA-A BLCA, HNSCC, LGG,PRAD
Immune system. Encodes MHC-Class 1A protein, which presents antigens for T-cell recognition. Somatic mutationspreviously suggested contributing to tumor immune escape (33).
KEAP1 LUADa Candidate TSG. Inhibits NRF2 (aka NFE2L2). In cohort of 76 non-small cell lung cancer (NSCLC) patients, KEAP1found mutated in two patients with advanced adenocarcinoma and smoking history. KEAP1 mutation wasmutually exclusive of EGFR, KRAS, ERBB2, and NFE2L2 mutation in the cohort and KEAP1 mutation statusproposed as marker for personalized therapy selection (22). Proposed TSG in lung squamous cell carcinomas(24). Proposed as therapeutic target for thyroid-transcription-factor-1 (TTF1)-negative lung adenocarcinoma(LUAD; 56).
KLF5 BLCAa Transcription factor that promotes breast cancer cell proliferation, survival, migration and tumour growth.Upregulates TNFAIP2, which interacts with the two small GTPases RAC1 and CDC42, thereby increasing theiractivities to change actin cytoskeleton and cellmorphology (57). Proposed as playing dual role as both TSGwhenacetylated and OG when deacetylated in prostate cancer (16). Recurrently mutated in mucinous ovariancarcinoma (58).
MAPK1 CESCa, HNSCC Kinase involved in cell proliferation, differentiation, transcription regulation, and development; key signalingcomponent of the toll-like receptor pathway. Candidate OG in pancreatic cancer (25), laryngeal squamouscell carcinoma cell lines (26). Significantly mutated in cohort of 91 chronic lymphocytic leukemia CLLpatients (59).
MSN ESCAa Protein homolog of TSG NF2 (Merlin; ref. 60). Member of the Ezrin-Radixin-Moesin (ERM) protein family. Linksmembrane and cytoskeleton involved in contact-dependent regulation of EGFR (61). Regulates the motility oforal cancer cells via MT1-MMP and E-cadherin/p120-catenin adhesion complex. Cytoplasmic expression of MSNcorrelates with nodal metastasis and poor prognosis of oral squamous cell carcinomas (OSCC), may be potentialcandidate for targeted gene therapy for OSCCs (62).
MTOR KIRC Candidate OG. Serine/threonine protein kinase regulates cell growth, proliferation and survival. Frequentlyactivated in human cancer and a major therapeutic target. Randomly selected mutants in HEAT repeats andkinase domain induced transformation in NIH3T3 cells and rapid tumor growth in nude mice (29).
NBPF10 BLCAa Somatic missense mutation reported in prostate cancer cohort of 141 patients (63). In gene family with numeroustandem repeats and pseudogenes, possible read alignment and mutation calling errors.
PARG GBM, LGG, BLCA,HNSCC, PRAD, LUAD,PCPG, KIRCa
Involved in DNA damage repair (with PARP1). Cells deficient in these proteins are sensitive to lethal effects ofionizing radiation and alkylating agents. Potential drug target for BRCA2-deficient cancers (32).
RANBP2 ESCA Candidate OG (28). A large multimodular and pleiotropic protein with SUMO E3 ligase function (64). Interacts withMTOR (to regulate cell growth and proliferation via cellular anabolic processes; ref. 65). Hotspot mutationpreviously found in MSI colorectal cancer. Hotspot suggested as useful for personalized tumor profling andtherapy in colorectal cancer (28).
RASA1 HNSCCa Identified as TSG in another squamous cell cancer, cutaneous squamous cell skin cancer (cSCC; ref. 19).RGPD3 BLCAa, UCEC, PAAD Component of ubiqutin E3 ligase complex. Named for similarity to RANBP2.SIRPB1 HNSCC, PRAD Ig-like cell-surface receptor. Negatively regulates RTK processes. Related to FGFR signaling.SMARCA2 BLCAa Actin-dependent regulator of chromatin. Its ATPase domain named as Drug target in SWI/SNF–mutant cancers
(e.g., lung, synovial sarcoma, leukemia, and rhabdoid tumors; ref. 66). ProposedTSG, and synthetic lethal target inSMARCA4 (aka BRG1)-deficient cancers (18).
TGFBR2 HNSCC TSG in HNSCC (20) MSI CRC (21), epithelial transformation and invasive squamous cell carcinoma in the mouseforestomach (46).
NOTE: Genes that are candidate OGs and TSGs, hereditary cancer genes, associated with cancer phenotypes and drug targets.aAt least one 3D hotspot region in the gene/tumor type was not detected with the 1D-only version of the algorithm.
Exome-Scale Discovery of Hotspot Mutation Regions
www.aacrjournals.org Cancer Res; 76(13) July 1, 2016 3723
on August 6, 2020. © 2016 American Association for Cancer Research. cancerres.aacrjournals.org Downloaded from
Published OnlineFirst April 28, 2016; DOI: 10.1158/0008-5472.CAN-15-3190
3D mutation hotspot regions are important in cancer3Dhotspot regions are enriched in well-known cancer genes.Amongthe set of genes with available protein structure or models (n ¼15,697), the genes harboring a 3D hotspot region are enrichedfor OGs and TSGs (P ¼ 6.1E�30 for OGs and P ¼ 2.4E�13 forTSGs; one-tailed Fisher exact test). They are also enriched forgenes in the CGC list (P ¼ 1.4E�30; one-tailed Fisher exacttest). The subset of these genes harboring only a 3D hotspotregion not detectable in 1D is also significantly enriched (P ¼4.3E�09 for OGs, P ¼ 7.9E�12 for TSGs, P ¼ 8.0E�11 for CGCgenes; one-tailed Fisher exact test). An additional 23 genes thatare proposed OGs, TSGs, and/or drug targets or hereditarycancer genes contained at least one 3D hotspot region. Thisenrichment of known and candidate driver genes supports ourclaim that many of the regions are biologically relevant and notsimply artifacts. While regions were detected in only approx-imately 18% of established cancer genes, we expect that manyof these genes harbor drivers other than missense mutations,some are drivers in tumor types not represented in our studyand many lack structural coverage.
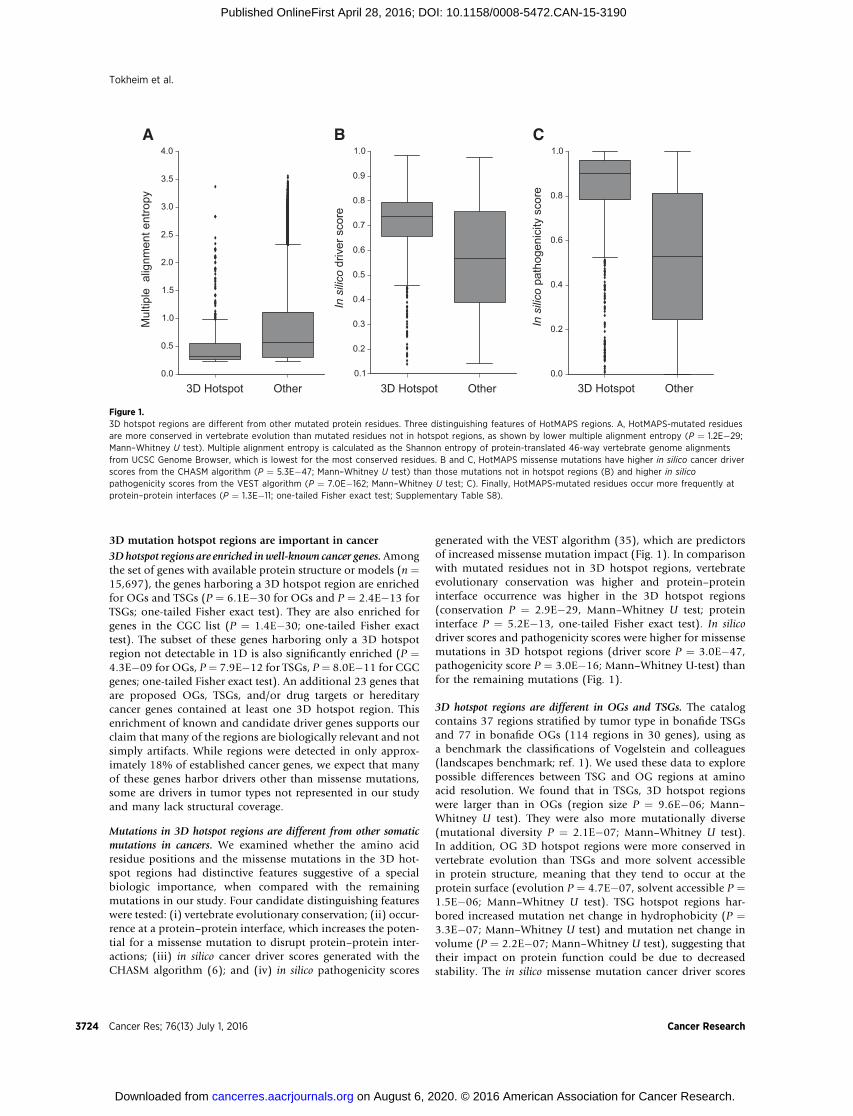
Mutations in 3D hotspot regions are different from other somaticmutations in cancers. We examined whether the amino acidresidue positions and the missense mutations in the 3D hot-spot regions had distinctive features suggestive of a specialbiologic importance, when compared with the remainingmutations in our study. Four candidate distinguishing featureswere tested: (i) vertebrate evolutionary conservation; (ii) occur-rence at a protein–protein interface, which increases the poten-tial for a missense mutation to disrupt protein–protein inter-actions; (iii) in silico cancer driver scores generated with theCHASM algorithm (6); and (iv) in silico pathogenicity scores
generated with the VEST algorithm (35), which are predictorsof increased missense mutation impact (Fig. 1). In comparisonwith mutated residues not in 3D hotspot regions, vertebrateevolutionary conservation was higher and protein–proteininterface occurrence was higher in the 3D hotspot regions(conservation P ¼ 2.9E�29, Mann–Whitney U test; proteininterface P ¼ 5.2E�13, one-tailed Fisher exact test). In silicodriver scores and pathogenicity scores were higher for missensemutations in 3D hotspot regions (driver score P ¼ 3.0E�47,pathogenicity score P ¼ 3.0E�16; Mann–Whitney U-test) thanfor the remaining mutations (Fig. 1).
3D hotspot regions are different in OGs and TSGs. The catalogcontains 37 regions stratified by tumor type in bonafide TSGsand 77 in bonafide OGs (114 regions in 30 genes), using asa benchmark the classifications of Vogelstein and colleagues(landscapes benchmark; ref. 1). We used these data to explorepossible differences between TSG and OG regions at aminoacid resolution. We found that in TSGs, 3D hotspot regionswere larger than in OGs (region size P ¼ 9.6E�06; Mann–Whitney U test). They were also more mutationally diverse(mutational diversity P ¼ 2.1E�07; Mann–Whitney U test).In addition, OG 3D hotspot regions were more conserved invertebrate evolution than TSGs and more solvent accessiblein protein structure, meaning that they tend to occur at theprotein surface (evolution P ¼ 4.7E�07, solvent accessible P ¼1.5E�06; Mann–Whitney U test). TSG hotspot regions har-bored increased mutation net change in hydrophobicity (P ¼3.3E�07; Mann–Whitney U test) and mutation net change involume (P ¼ 2.2E�07; Mann–Whitney U test), suggesting thattheir impact on protein function could be due to decreasedstability. The in silico missense mutation cancer driver scores
Mul
tiple
alig
nmen
t ent
ropy
In s
ilico
driv
er s
core
In s
ilico
pat
hoge
nici
ty s
core
3D Hotspot
CBA
Other3D Hotspot Other 3D Hotspot Other
Figure 1.3D hotspot regions are different from other mutated protein residues. Three distinguishing features of HotMAPS regions. A, HotMAPS-mutated residuesare more conserved in vertebrate evolution than mutated residues not in hotspot regions, as shown by lower multiple alignment entropy (P ¼ 1.2E�29;Mann–Whitney U test). Multiple alignment entropy is calculated as the Shannon entropy of protein-translated 46-way vertebrate genome alignmentsfrom UCSC Genome Browser, which is lowest for the most conserved residues. B and C, HotMAPS missense mutations have higher in silico cancer driverscores from the CHASM algorithm (P ¼ 5.3E�47; Mann–Whitney U test) than those mutations not in hotspot regions (B) and higher in silicopathogenicity scores from the VEST algorithm (P ¼ 7.0E�162; Mann–Whitney U test; C). Finally, HotMAPS-mutated residues occur more frequently atprotein–protein interfaces (P ¼ 1.3E�11; one-tailed Fisher exact test; Supplementary Table S8).
Tokheim et al.
Cancer Res; 76(13) July 1, 2016 Cancer Research3724
on August 6, 2020. © 2016 American Association for Cancer Research. cancerres.aacrjournals.org Downloaded from
Published OnlineFirst April 28, 2016; DOI: 10.1158/0008-5472.CAN-15-3190
were higher for OG regions (P ¼ 0.003; Mann–Whitney U test).We also tested differences between in silico pathogenicity scoresand occurrence at protein–protein interfaces between OG andTSG regions, but these were not significant (pathogenicityscores P ¼ 0.37, protein interface P ¼ 0.34; Mann–WhitneyU test).
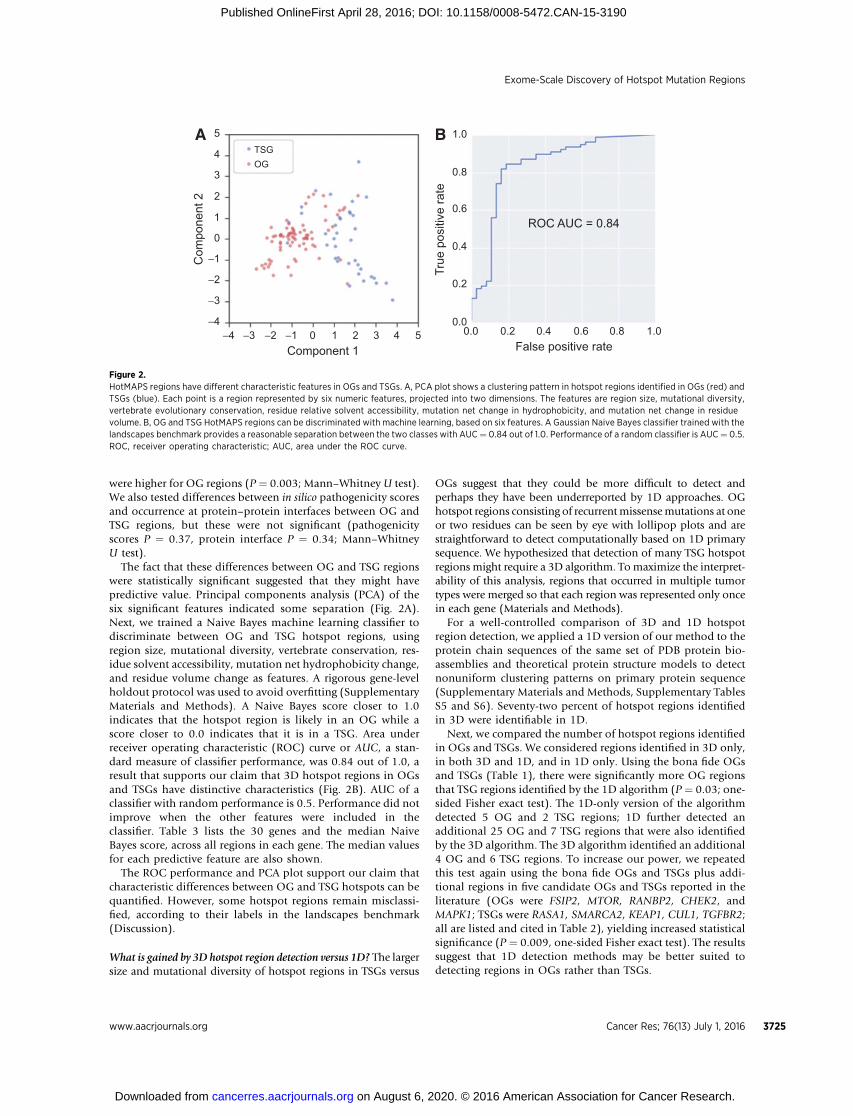
The fact that these differences between OG and TSG regionswere statistically significant suggested that they might havepredictive value. Principal components analysis (PCA) of thesix significant features indicated some separation (Fig. 2A).Next, we trained a Naive Bayes machine learning classifier todiscriminate between OG and TSG hotspot regions, usingregion size, mutational diversity, vertebrate conservation, res-idue solvent accessibility, mutation net hydrophobicity change,and residue volume change as features. A rigorous gene-levelholdout protocol was used to avoid overfitting (SupplementaryMaterials and Methods). A Naive Bayes score closer to 1.0indicates that the hotspot region is likely in an OG while ascore closer to 0.0 indicates that it is in a TSG. Area underreceiver operating characteristic (ROC) curve or AUC, a stan-dard measure of classifier performance, was 0.84 out of 1.0, aresult that supports our claim that 3D hotspot regions in OGsand TSGs have distinctive characteristics (Fig. 2B). AUC of aclassifier with random performance is 0.5. Performance did notimprove when the other features were included in theclassifier. Table 3 lists the 30 genes and the median NaiveBayes score, across all regions in each gene. The median valuesfor each predictive feature are also shown.
The ROC performance and PCA plot support our claim thatcharacteristic differences between OG and TSG hotspots can bequantified. However, some hotspot regions remain misclassi-fied, according to their labels in the landscapes benchmark(Discussion).
What is gained by 3D hotspot region detection versus 1D? The largersize and mutational diversity of hotspot regions in TSGs versus
OGs suggest that they could be more difficult to detect andperhaps they have been underreported by 1D approaches. OGhotspot regions consisting of recurrentmissensemutations at oneor two residues can be seen by eye with lollipop plots and arestraightforward to detect computationally based on 1D primarysequence. We hypothesized that detection of many TSG hotspotregions might require a 3D algorithm. Tomaximize the interpret-ability of this analysis, regions that occurred in multiple tumortypes were merged so that each region was represented only oncein each gene (Materials and Methods).
For a well-controlled comparison of 3D and 1D hotspotregion detection, we applied a 1D version of our method to theprotein chain sequences of the same set of PDB protein bio-assemblies and theoretical protein structure models to detectnonuniform clustering patterns on primary protein sequence(Supplementary Materials and Methods, Supplementary TablesS5 and S6). Seventy-two percent of hotspot regions identifiedin 3D were identifiable in 1D.
Next, we compared the number of hotspot regions identifiedin OGs and TSGs. We considered regions identified in 3D only,in both 3D and 1D, and in 1D only. Using the bona fide OGsand TSGs (Table 1), there were significantly more OG regionsthat TSG regions identified by the 1D algorithm (P ¼ 0.03; one-sided Fisher exact test). The 1D-only version of the algorithmdetected 5 OG and 2 TSG regions; 1D further detected anadditional 25 OG and 7 TSG regions that were also identifiedby the 3D algorithm. The 3D algorithm identified an additional4 OG and 6 TSG regions. To increase our power, we repeatedthis test again using the bona fide OGs and TSGs plus addi-tional regions in five candidate OGs and TSGs reported in theliterature (OGs were FSIP2, MTOR, RANBP2, CHEK2, andMAPK1; TSGs were RASA1, SMARCA2, KEAP1, CUL1, TGFBR2;all are listed and cited in Table 2), yielding increased statisticalsignificance (P ¼ 0.009, one-sided Fisher exact test). The resultssuggest that 1D detection methods may be better suited todetecting regions in OGs rather than TSGs.
TSG
5A B4
3
2
1
0
5 0.00.0
0.2
0.2 0.4
0.4
0.8
1.0
ROC AUC = 0.84
True
pos
itive
rate
Com
pone
nt 2
Component 1 False positive rate0.8 1.0
0.6
0.643210
−1
−1
−2
−2
−3
−3−4
−4
OG
Figure 2.HotMAPS regions have different characteristic features in OGs and TSGs. A, PCA plot shows a clustering pattern in hotspot regions identified in OGs (red) andTSGs (blue). Each point is a region represented by six numeric features, projected into two dimensions. The features are region size, mutational diversity,vertebrate evolutionary conservation, residue relative solvent accessibility, mutation net change in hydrophobicity, and mutation net change in residuevolume. B, OG and TSG HotMAPS regions can be discriminated with machine learning, based on six features. A Gaussian Naive Bayes classifier trained with thelandscapes benchmark provides a reasonable separation between the two classes with AUC¼ 0.84 out of 1.0. Performance of a random classifier is AUC¼ 0.5.ROC, receiver operating characteristic; AUC, area under the ROC curve.
Exome-Scale Discovery of Hotspot Mutation Regions
www.aacrjournals.org Cancer Res; 76(13) July 1, 2016 3725
on August 6, 2020. © 2016 American Association for Cancer Research. cancerres.aacrjournals.org Downloaded from
Published OnlineFirst April 28, 2016; DOI: 10.1158/0008-5472.CAN-15-3190

A further problem with sequence-based 1D hotspot regiondetection is that larger regions detectable in 3D may be onlypartially characterized and/or split into multiple pieces. Figure 3shows an example of a TSG hotspot region in FBXW7 found in 3Dby HotMAPS that has been split into two pieces by the 1Dalgorithm. In 1D protein sequence, residue 465 is not closeenough to residues 502 and 505 to be identified in one hotspotregion. On the 3Dprotein structure of FBXW7 (PDB code 2OVQ),the three residues are spatially close and a single hotspot region isdetected.
3D hotspot regions may increase interpretability of drivermechanisms.
Three-dimensional consideration of hotspot regions in proteinstructure can potentially provide researchers with a rich sourceof hypothesis generation about driver mechanisms. While gene-or domain-level mutation enrichment analysis can point topotential protein functions, interactions, biologic processes, andpathways important for cancer etiology and progression, moredetailed information may be available once a specific setof mutated amino acid residues has been identified as significant.
For many of the 3D hotspot regions found by HotMAPS, theliterature contains evidence that they are in direct contact with orproximal to amino acid residues of known functionalimportance. Figure 4 shows six cancer-associated proteins in
which the hotspot region is either overlapping or proximal toimportant functional sites.
RAC1 hotspot in squamous head and neck cancer. RAC1 is a RhoGTPase important in signaling systems that regulate the organi-zation of actin cytoskeleton and cell motility. The hotspot over-laps the GTP/GDP-binding site and could impact regulation ofnormal RAC1 cycling between GTP- and GDP-bound states(Fig. 4A). It contains a previously identified recurrent mutationin melanoma (P29S), which dysregulates RAC1 by a fast cyclingmechanism (36).
SPOP hotspot in prostate cancer (PRAD). SPOP is the substraterecognition component of a cullin3-based E3 ubiquitin–pro-tein ligase complex, which targets multiple substrates for pro-teasomal degradation. The hotspot overlaps with a bindinggroove harboring five residue positions (pink) where mutagen-esis has strongly reduced affinity for the substrate (annotated inthe UniProtKB).
ERCC2 hotspot in bladder cancer. ERCC2 is an ATP-dependenthelicase that is part of the protein complex TFIIH involved inRNA polymerase II transcription and nucleotide excision repair(NER). We identified a hotspot region, proximal to the DEAHbox, a highly conserved motif containing residues that interact
Table 3. Median scores and feature values for oncogene and tumor suppressor gene hotspot regions
GeneLandscapesbenchmark
Naive Bayesscore
Regionsize
Mutationaldiversity Conservation
Change inhydrophobicity
Residue solventaccessibility
Change involume
FGFR3 OG 1.00 1.00 0.00 0.29 �3.00 0.61 �1.80KRAS OG 1.00 2.50 0.58 0.26 4.49 0.73 �1.90NRAS OG 1.00 2.50 0.37 0.25 6.24 0.49 �0.98BCOR TSG 1.00 1.00 0.00 0.32 �5.40 0.55 0.84PIK3R1 TSG 1.00 1.00 0.00 0.26 4.20 0.08 �0.70BRAF OG 1.00 4.00 0.25 0.25 8.70 0.42 �0.07HRAS OG 1.00 2.00 0.62 0.32 4.72 0.43 �1.27PTPN11 OG 1.00 1.00 0.00 0.41 10.80 0.25 �0.75FGFR2 OG 1.00 1.50 0.13 0.41 8.91 0.34 �1.81PPP2R1A OG 0.99 3.00 0.43 0.29 4.82 0.21 �1.84PIK3CA OG 0.99 2.00 0.35 0.26 0.63 0.32 �0.81MAP2K1 OG 0.97 2.00 0.71 0.25 �1.02 0.29 �0.49NFE2L2 OG 0.97 3.00 0.69 0.27 �1.49 0.30 �0.34SF3B1 OG 0.96 3.00 0.30 0.25 0.01 0.23 0.29ERBB2 OG 0.93 1.50 0.41 0.31 �0.95 0.20 �1.27RET OG 0.92 1.00 0.00 0.26 2.20 0.10 1.56GNAS OG 0.84 1.00 0.33 0.29 �10.73 0.38 1.10CIC TSG 0.79 6.00 0.55 0.41 �8.41 0.39 �0.68SMAD4 TSG 0.69 5.00 0.92 0.30 �5.15 0.16 �0.34FBXW7 TSG 0.61 5.00 0.72 0.28 �10.28 0.27 1.96PTEN TSG 0.61 6.00 1.00 0.26 �1.33 0.07 0.80IDH2 OG 0.60 1.00 0.67 0.28 �7.85 0.10 0.49SMARCA4 TSG 0.11 1.00 0.00 0.30 �13.30 0.08 3.78NOTCH1 TSG 0.08 1.00 0.00 0.55 �0.80 0.17 0.79IDH1 OG 0.07 1.00 0.22 0.41 �9.83 0.16 1.09SPOP OG 0.06 7.00 0.73 0.25 1.37 0.09 2.46CDKN2A TSG 0.05 2.00 0.58 0.60 �4.27 0.35 �0.57VHL TSG 0.04 8.00 0.89 0.40 0.92 0.02 0.87EGFR OG 0.01 8.00 0.53 0.34 �1.01 0.30 �0.76TP53 TSG 0.00 30.50 0.81 0.44 �4.11 0.19 �0.09
NOTE: Thirty genes classified as OGs or TSGs in landscapes benchmark. The genes contain a total of 114 tumor-type–specific hotspot regions. Each row in the tableshows themedian Naive Bayes classification score for the regions in the gene. Scores close to 1.0 predict that a region is in an OG and scores close to 0.0 predict thatregion is in a TSG. Genes are ranked in decreasing order by the Naive Bayes scores. Ranking generally agrees with the landscapes benchmark. Also shown for eachgene is themedian value of the six features used to train the Naive Bayes classifier. The features are region size (number of residues), mutational diversity, vertebrateevolutionary conservation (Shannon entropy of alignment position, where lower entropy ¼ higher conservation), mutation net hydrophobicity change, residuesolvent accessibility, and mutation net volume change.
Tokheim et al.
Cancer Res; 76(13) July 1, 2016 Cancer Research3726
on August 6, 2020. © 2016 American Association for Cancer Research. cancerres.aacrjournals.org Downloaded from
Published OnlineFirst April 28, 2016; DOI: 10.1158/0008-5472.CAN-15-3190

with Mg2þ and are critical for ATP binding and helicase activity(Fig. 4C). This proximity suggests that the hotspot mutationscould disrupt ATPase activity and yield defective NER (37).
PTEN hotspot. PTEN is a phosphatase for both proteins andphosphoinositides, and it removes a phosphate from PIP3,critical for signaling to AKT. The hotspot region identified inendometrial cancer (UCEC) spans two functionally importantloops in the protein (P and WPD loops) at the boundary of theactive site pocket. Residues in these loops are critical forcatalysis (blue dot) and are important for the P-loop's confor-mation. Mutagenesis of residues in the WPD loop reducesphosphatase activity and increases colony formation in cellculture (38). Pink dots show residues that impact phosphataseactivity.
RHOA hotspots. RHOA is a small GTPase oncogene, and likeRAC1 is a member of the Ras superfamily (39). We identifiedhotspot regions in bladder cancer (BLCA), head and necksquamous cell cancer (HNSCC), and stomach adenocarcino-ma (STAD). The hotspot regions overlap with the RHOAeffector region, a highly conserved motif that is involved inRas superfamily signaling with downstream effector proteins.The regions are immediately proximal to a magnesium ion,which has been implicated in regulating the kinetics of Rhofamily GTPases (40).
VHL hotspot (KIRC). VHL is a component of an E3 ubiquitinprotein ligase complex, and it ubiquitinates the OG transcrip-tion factor HIF1A, targeting it for proteasomal degradation(41). One impact of VHL loss of function with failure toubiquitinate HIF1A is increased protein expression of HIF1A.The hotspot region is proximal to its interaction site with HIF1Aand could potentially have an impact on this interaction(Fig. 4F). The TCGA kidney cancer (KIRC) samples were strat-ified on the basis of their missense mutation status: VHL hot-
spot, non-hotspot, or no missense (WT). HIF1A protein expres-sion was not significantly different between VHL non-hotspotand VHL WT groups (P ¼ 0.5; Mann–Whitney U test), butwas significantly higher between VHL hotspot and VHL WTgroups (P ¼ 0.03; Mann–Whitney U test). This result is con-sistent with a special role for VHL hotspot missense mutationsin regulating HIF1A protein expression. However, increasedHIF1A expression in these KIRC samples is likely impactedby additional genetic and other factors. We might see a sub-stantially lower P value if VHL hotspot mutations were theonly cause of the observed increase. Also, there are many VHLmissense mutations outside of the hotspot region, and it islikely that several of these also have a functional impact. Inparticular, several of them are at the interface of VHL andthe TCEB1 and TCEB2 in the complex and could impactVHL/TCEB binding.
DiscussionCatalog of TCGA 3D missense mutation hotspot regions atamino acid resolution
The large-scale WES and mutation calling efforts of theTCGA have identified hundreds of thousands of somatic mis-sense mutations in human cancers. Although some of thesemutations are private, many are shared across multiplepatients and multiple tumor types. The biologic and therapeu-tic relevance of these shared mutations is of great interest to thecancer research community. For example, patients can bestratified for clinical trials and treatment protocols selectedon the basis of missense mutation status in several key drivergenes, including BRAF, KRAS, and EGFR. A special type ofshared missense mutations are those that occur recurrently notonly at the same genomic codon, but at neighboring codons intranslated protein sequence and more generally, neighboringamino acid residues in protein 3D structure. These clusters ofneighboring missense mutations are known as missense
Region-1
F-box
465 502, 505
HotMAPS 3Dregion in theTSG FBXW7
A
B
Region-2 Figure 3.Comparison of hotspot detection in theTSG FBXW7 in 1D and 3D. A, a simplified1D version of HotMAPS found two regionsin FBXW7. The 3D version of HotMAPSfound a single larger region,encompassing both regions. Diagramshows protein sequence of FBXW7,whichcontains a single F-box functionaldomain. Region-1, residue 465 (leftlollipop); Region-2, residues 502 and505 (right lollipops). B, HotMAPSidentifies a single 3D hotspot region inFBXW7. Structure of SCFFbw7 ubiquitinligase complex (PDB 2OVQ), containingFBXW7 (green), SKP1 (blue), and CCNE1fragment (degron peptide; black).Residue coloring: 1D Region-1, gold;1D Region-2, purple. Residues missed by1D detection but included in HotMAPS 3D,gray. Although the 1D regions are far inthe primary protein sequence, residues505 and 465 spatially contact at theinterface with CCNE1. Protein structurefigureswere generated by JSMol inMuPIT(http://mupit.icm.jhu.edu/).
Exome-Scale Discovery of Hotspot Mutation Regions
www.aacrjournals.org Cancer Res; 76(13) July 1, 2016 3727
on August 6, 2020. © 2016 American Association for Cancer Research. cancerres.aacrjournals.org Downloaded from
Published OnlineFirst April 28, 2016; DOI: 10.1158/0008-5472.CAN-15-3190

mutation hotspot regions. They have been proposed to haveparticular relevance to oncogenic processes (12), as theincreased frequency of missense mutation at a highly localizedregion in a protein may be a signature of positive selection(42). Missense hotspot regions may be informative in detect-ing driver genes (7). A number of groups have developedalgorithms to detect enrichment of these regions on the gene-and domain-level (7–9, 11–13), but until now, there havebeen not been systematically characterized on a large numberof protein structures and models at the resolution of individualamino acid residues.
We systematically identify 3D missense hotspot regions usingTCGA somatic mutation data from 6,594 samples in 23 tumortypes. HotMAPS identified 107 unique, tumor-type–aggregatedgene-level regions, and 216 unique tumor-type–specific gene-level regions (Materials and Methods; Supplementary Tables S1
and S2). This catalog enables assessment of how the specificmissense mutations in a hotspot contribute to cancer-associatedmolecular mechanisms.
TCGA 3D hotspot regions have functional importanceWe compared features of residues in 3D hotspot regions to
other missense mutated residues in the TCGA data. The hot-spot regions have characteristic features that support theirputative functional importance: high evolutionary conserva-tion, high in silico-predicted missense mutation impacts, andincreased frequency of occurrence at protein interfaces. Genescontaining the 3D hotspot regions appear to be particularlyrelevant to cancer. Landscapes benchmark TSG and OGs areoverrepresented and the list includes many candidate TSGs,OGs, drug targets, and hereditary cancer genes (Tables 1 and 2).For several TSGs and OGs, the regions coincide with enzymatic
Figure 4.HotMAPS hotspot regions overlap and are proximal to important functional sites. A, HNSCC hotspot region (red) in RAC1 (green) and GTP/GDP-bindingresidues (dark gray; PDB 2FJU). B, PRAD hotspot region (red) in SPOP–substrate complex (PDB 3HGH) with SPOP (blue) and H2AFY substrate (green). Left,five residues (pink) that when mutated show strongly reduced affinity for substrate. C, BLCA hotspot region (red) in ERCC2 (gray) shown on theoretical modelof ERCC2 helicase ATP-binding domain. The hotspot is proximal to the DEAH box (blue), a highly conserved motif containing residues that interact with Mg2þand are critical for ATP-binding and helicase activity. D, UCEC hotspot region (red) in PTEN (PDB 1D5R) with active site phosphocysteine residue (blue),residues when mutated annotated to reduce phosphatase activity (pink). E, STAD hotspot region (red) in RHOA with a GTP analog bound (sticks; PDB 1CXZ).GTP-binding residues and effector region, dark blue. F, KIRC hotspot region (red) in VHL–TCEB1–TCEB2 complex, bound to HIF1A peptide (PDB 4AJY).Proximity to the interaction site of VHL (green) and HIF1A (blue) suggests possible decreased ubiquitination of HIF1A, resulting in increased proteinexpression of HIF1A. TCEB1 and TCEB2, gray.
Tokheim et al.
Cancer Res; 76(13) July 1, 2016 Cancer Research3728
on August 6, 2020. © 2016 American Association for Cancer Research. cancerres.aacrjournals.org Downloaded from
Published OnlineFirst April 28, 2016; DOI: 10.1158/0008-5472.CAN-15-3190

active sites, positions that have been shown to alter proteinfunction in experimental mutagenesis assays and sites ofinteraction with protein and nucleotide interaction partners(Fig. 4; Supplementary Table S7).
TCGA hotspot regions are different in OGs and TSGsAlthough recurrent missense mutations have long been
known to occur in both OGs and TSGs (10), they havebeen observed more frequently in OGs. We show that thereare systematic differences in hotspot regions found in OGsand TSGs. OG regions are smaller, less mutationally diverse,more evolutionarily conserved, and more solvent accessiblethan TSG regions. TSG regions are more likely to harbormutations that may impact protein stability through changesin hydrophobicity or volume. Potential explanations forthese differences are that there are more ways to lose thefunction of a protein than to gain function (43). Loss-of-function tumor suppressor mutations can occur at manyresidue positions and involve many types of amino acidresidue substitutions, while oncogene mutations will occurat a few functionally important positions and involve fewersubstitution types.
A consequence of these differences is that TSG regions areharder to detect visually or by 1D clustering approaches thanOG regions. Thus, they have been missed by 1D analysismethods. A major contribution of 3D analysis is enablingdetection of hotspot regions in TSGs in addition to thosein OGs. We suspect that novel hotspot regions in TSGs willcontinue to be discovered as more samples are sequenced inmore tumor types.
We are able to leverage the characteristic differences todistinguish between hotspot regions in TSGs and OGs, witha simple machine learning method, achieving an area underthe receiver operating characteristic curve (ROC AUC) ofapproximately 0.80. However, not all regions are correctlyclassified by this method. Interestingly, we find that some ofthese "undistinguishable" genes may act as both TSGs andOGs, depending on context or be atypical of their class. PIK3R1has been described as an OG (44) and SPOP as a TSG (45), inagreement with our Naive Bayes scores, but not with thelandscapes benchmark. The OGs IDH1 and IDH2 both havehigh net hydrophobicity changes, which are protein destabi-lizing and characteristic of TSGs. IDH1/IDH2 hotspot muta-tion may cause a (TSG-like) partial loss of enzymatic function,yielding accumulation of 2 hydoxyglutarate (2HG), a carcino-genic catalytic intermediate (46). EGFR has two regions inGBM and LGG, which are scored as TSG-like. In these tumortypes, EGFR mutation patterns are atypical, because EGFRamplification is an early event. This amplification has beenlinked to increased mutation load in EGFR itself, including inaberrant extrachromosomal copies of EGFR (43). Supplemen-tary Figure S2 indicates the locations of these misclassifiedregions on the plot.
HotMAPS has increased sensitivity and coverage thanprevious 3D hotspot detection algorithms
A disadvantage of working with experimentally derivedprotein structures is that they are available for a limitednumber of human proteins (39%). For many of these genes,the structure data are incomplete, so that only a single protein
domain or small fragment is represented in PDB. In this work,by careful use of biologic assemblies of PDB structures andalso theoretical protein models, we mapped approximately53% of unique residue positions harboring a TCGA missensemutation into 3D protein space. In a recent study of 21 TCGAtumor types that used a different algorithm and PDB struc-tures only, 11.2% positions were mapped (13). We note thattheoretical protein models are well suited for this kind ofanalysis. HotMAPS considers the center of geometry for eachamino acid residue, a metric that is not highly sensitive toatomic-resolution errors common in theoretical protein mod-els (47). The increased sensitivity and coverage of HotMAPSare supported by the number of tumor types in which 3Dhotspot regions were detected (19 of 23), the total number ofregions detected (107 unique, tumor-type–aggregated gene-level regions and 216 unique tumor-type–specific gene-levelregions), and the number of genes in which regions weredetected (91). The only previous systematic attempt to find3D hotspots in TCGA data detected statistically significantregions in 10 genes, based on 21 TCGA tumor types (13), and9 of these were also detected by HotMAPS.
We hope that some HotMAPS regions found by our algo-rithm point to novel driver genes; however, functional stu-dies are warranted to find out if they are discoveries or falsepositives.
An interactive 3D protein viewer where users can submittheir own mutations and compare with the HotMAPS catalog(48) is available at http://mupit.icm.jhu.edu/.
HotMAPS software is open source at https://github.com/karchinlab/HotMAPS.
Additional material is available in Supplementary Materialsand Methods: detailing mapping from genomic coordinates toprotein structures (Supplementary Fig. S3), overview flow chartof HotMAPS (Supplementary Fig. S4), an example of single-residue hotspot region discovery in 1D versus 3D (Supple-mentary Fig. S5), a stratified analysis of HotMAPS properties bysolvent accessibility (Supplementary Fig. S6), and in Supple-mentary Tables, a list of blacklisted residues (SupplementaryTable S9).
Disclosure of Potential Conflicts of InterestNo potential conflicts of interest were disclosed.
Authors' ContributionsConception and design: C. Tokheim, D.L. Masica, R. KarchinDevelopment of methodology: C. Tokheim, R. Bhattacharya, M.C. RyanAcquisition of data (provided animals, acquired and managed patients,provided facilities, etc.): C. TokheimAnalysis and interpretation of data (e.g., statistical analysis, biostatistics,computational analysis): C. Tokheim, N. Niknafs, R. Kim, M.C. Ryan,D.L. Masica, R. KarchinWriting, review, and/or revision of the manuscript: C. Tokheim, R. Bhatta-charya, R. KarchinAdministrative, technical, or material support (i.e., reporting or organizingdata, constructing databases): D.M. Gygax, M.C. RyanStudy supervision: R. Karchin
AcknowledgmentsThe authors thank Drs. Bert Vogelstein and Jing Zhu of the UCSC Xena team
for valuable discussion on the manuscript.
Exome-Scale Discovery of Hotspot Mutation Regions
www.aacrjournals.org Cancer Res; 76(13) July 1, 2016 3729
on August 6, 2020. © 2016 American Association for Cancer Research. cancerres.aacrjournals.org Downloaded from
Published OnlineFirst April 28, 2016; DOI: 10.1158/0008-5472.CAN-15-3190

Grant SupportThis work was supported by NIH, National Cancer Institute fellowship
F31CA200266 (C. Tokheim) and grant U01CA180956 (R. Karchin).The costs of publication of this article were defrayed in part by the
payment of page charges. This article must therefore be hereby marked
advertisement in accordance with 18 U.S.C. Section 1734 solely to indicatethis fact.
Received November 30, 2015; revised February 25, 2016; accepted April 1,2016; published OnlineFirst April 28, 2016.
References1. Vogelstein B, Papadopoulos N, Velculescu VE, Zhou S, Diaz LA Jr, Kinzler
KW. Cancer genome landscapes. Science 2013;339:1546–58.2. Wood LD, Parsons DW, Jones S, Lin J, Sjoblom T, Leary RJ, et al. The
genomic landscapes of human breast and colorectal cancers. Science 2007;318:1108–13.
3. Greenman C, Stephens P, Smith R, Dalgliesh GL, Hunter C, Bignell G, et al.Patterns of somatic mutation in human cancer genomes. Nature 2007;446:153–8.
4. Dees ND, Zhang Q, Kandoth C, Wendl MC, Schierding W, Koboldt DC,et al. MuSiC: identifying mutational significance in cancer genomes.Genome Res 2012;22:1589–98.
5. LawrenceMS, Stojanov P, Polak P, Kryukov GV, Cibulskis K, Sivachenko A,et al. Mutational heterogeneity in cancer and the search for new cancer-associated genes. Nature 2013;499:214–8.
6. Carter H, Chen S, Isik L, Tyekucheva S, Velculescu VE, Kinzler KW, et al.Cancer-specific high-throughput annotation of somatic mutations:computational prediction of driver missense mutations. Cancer Res 2009;69:6660–67.
7. Gonzalez-Perez A, Perez-Llamas C, Deu-Pons J, Tamborero D, SchroederMP, Jene-Sanz A, et al. IntOGen-mutations identifies cancer drivers acrosstumor types. Nat Methods 2013;10:1081–2.
8. Nehrt NL, Peterson TA, Park D, Kann MG. Domain landscapes of somaticmutations in cancer. BMC Genomics 2012;13 Suppl 4:S9.
9. Ryslik GA, Cheng Y, Cheung K-H, Modis Y, Zhao H. Utilizing proteinstructure to identify non-random somatic mutations. BMC Bioinformatics2013;14:190.
10. Hollstein M, Sidransky D, Vogelstein B, Harris CC. p53 mutations inhuman cancers. Science 1991;253:49–53.
11. Tamborero D, Gonzalez-Perez A, Lopez-Bigas N. OncodriveCLUST:exploiting the positional clustering of somaticmutations to identify cancergenes. Bioinformatics 2013;29:2238–44.
12. Ye J, Pavlicek A, Lunney EA, Rejto PA, Teng C-H. Statistical method onnonrandom clustering with application to somatic mutations in cancer.BMC Bioinformatics 2010;11:11.
13. Kamburov A, Lawrence MS, Polak P, Leshchiner I, Lage K, Golub TR, et al.Comprehensive assessment of cancer missense mutation clustering inprotein structures. Proc Natl Acad Sci U S A 2015;112:E5486–95.
14. Pieper U, Eswar N, Webb BM, Eramian D, Kelly L, Barkan DT, et al.MODBASE, a database of annotated comparative protein structure modelsand associated resources. Nucleic Acids Res 2009;37(Database issue):D347–54.
15. Futreal PA, Coin L, Marshall M, Down T, Hubbard T, Wooster R, et al. Acensus of human cancer genes. Nat Rev Cancer 2004;4:177–83.
16. Atala A. Re: Interruption of KLF5 acetylation converts its function fromtumor suppressor to tumor promoter in prostate cancer cells. J Urol2015;194:1505.
17. Helming KC, Wang X, Roberts CW. Vulnerabilities of mutant SWI/SNFcomplexes in cancer. Cancer Cell 2014;26:309–17.
18. Hoffman GR, Rahal R, Buxton F, Xiang K, McAllister G, Frias E, et al.Functional epigenetics approach identifies BRM/SMARCA2 as a criticalsynthetic lethal target in BRG1-deficient cancers. Proc Natl Acad Sci U S A2014;111:3128–33.
19. Pickering CR, Zhou JH, Lee JJ, Drummond JA, Peng SA, Saade RE, et al.Mutational landscape of aggressive cutaneous squamous cell carcinoma.Clin Cancer Res 2014;20:6582–92.
20. Rothenberg SM, Ellisen LW. The molecular pathogenesis of head and necksquamous cell carcinoma. J Clin Invest 2012;122:1951–7.
21. Biswas S, Trobridge P, Romero-Gallo J, Billheimer D, Myeroff LL, WillsonJK, et al. Mutational inactivation of TGFBR2 in microsatellite unstablecolon cancer arises from the cooperation of genomic instability and theclonal outgrowth of transforming growth factor beta resistant cells. GenesChromosomes Cancer 2008;47:95–106.
22. Sasaki H, Suzuki A, Shitara M, Okuda K, Hikosaka Y, Moriyama S, et al.Mutations in lung cancer patients. Oncol Lett 2013;6:719–21.
23. Korzeniewski N, Zheng L, Cuevas R, Parry J, Chatterjee P, Anderton B,et al. Cullin 1 functions as a centrosomal suppressor of centriolemultiplication by regulating polo-like kinase 4 protein levels. CancerRes 2009;69:6668–75.
24. Hast BE, Cloer EW,GoldfarbD, LiH, Siesser PF, Yan F, et al. Cancer-derivedmutations in KEAP1 impair NRF2 degradation but not ubiquitination.Cancer Res 2014;74:808–17.
25. Furukawa T, Kanai N, Shiwaku HO, Soga N, Uehara A, Horii A. AURKA isone of the downstream targets of MAPK1/ERK2 in pancreatic cancer.Oncogene 2006;25:4831–9.
26. Kostrzewska-Poczekaj M, Giefing M, Jarmuz M, Brauze D, Pelinska K,Grenman R, et al. Recurrent amplification in the 22q11 region in laryngealsquamous cell carcinoma results in overexpression of the CRKL but not theMAPK1 oncogene. Cancer Biomark 2010;8:11–9.
27. Litchfield K, Summersgill B, Yost S, Sultana R, Labreche K, Dudakia D, et al.Whole-exome sequencing reveals the mutational spectrum of testiculargerm cell tumours. Nat Commun 2015;6:5973.
28. Gylfe AE, Kondelin J, Turunen M, Ristolainen H, Katainen R, PitkanenE, et al. Identification of candidate oncogenes in human colorectalcancers with microsatellite instability. Gastroenterology 2013;145:540–3e22.
29. Murugan AK, Alzahrani A, Xing M. Mutations in critical domains conferthe human mTOR gene strong tumorigenicity. J Biol Chem 2013;288:6511–21.
30. The Cancer Genome Atlas Research Network. Integrated genomic charac-terization of papillary thyroid carcinoma. Cell 2014;159:676–90.
31. West AC, Johnstone RW. New and emerging HDAC inhibitors for cancertreatment. J Clin Invest 2014;124:30–9.
32. Fathers C, Drayton RM, Solovieva S, Bryant HE. Inhibition of poly(ADP-ribose) glycohydrolase (PARG) specifically kills BRCA2-deficient tumorcells. Cell Cycle 2012;11:990–7.
33. Shukla SA, Rooney MS, Rajasagi M, Tiao G, Dixon PM, Lawrence MS, et al.Comprehensive analysis of cancer-associated somatic mutations in class IHLA genes. Nat Biotechnol 2015;33:1152–58.
34. Petrini I,Meltzer PS, Kim IK, LucchiM, ParkKS, FontaniniG, et al. A specificmissense mutation in GTF2I occurs at high frequency in thymic epithelialtumors. Nat Genet 2014;46:844–9.
35. Douville C, Carter H, Kim R, Niknafs N, Diekhans M, Stenson PD, et al.CRAVAT: cancer-related analysis of variants toolkit. Bioinformatics2013;29:647–48.
36. Davis MJ, Ha BH, Holman EC, Halaban R, Schlessinger J, Boggon TJ.RAC1P29S is a spontaneously activating cancer-associated GTPase. ProcNatl Acad Sci U S A 2013;110:912–7.
37. Winkler GS, Araujo SJ, Fiedler U, VermeulenW,Coin F, Egly JM, et al. TFIIHwith inactive XPD helicase functions in transcription initiation but isdefective in DNA repair. J Biol Chem 2000;275:4258–66.
38. Lee JO, Yang H, Georgescu MM, Di Cristofano A, Maehama T, Shi Y, et al.Crystal structure of the PTEN tumor suppressor: implications for itsphosphoinositide phosphatase activity and membrane association. Cell1999;99:323–34.
39. Rojas AM, Fuentes G, Rausell A, Valencia A. The Ras protein superfamily:evolutionary tree and role of conserved amino acids. J Cell Biol 2012;196:189–201.
40. Zhang B, Zhang Y, Wang Z, Zheng Y. The role of Mg2þ cofactor in theguanine nucleotide exchange and GTP hydrolysis reactions of Rho familyGTP-binding proteins. J Biol Chem 2000;275:25299–307.
41. Gossage L, Eisen T, Maher ER. VHL, the story of a tumour suppressor gene.Nat Rev Cancer 2015;15:55–64.
42. Wagner A. Rapid detection of positive selection in genes and genomesthrough variation clusters. Genetics 2007;176:2451–63.
Tokheim et al.
Cancer Res; 76(13) July 1, 2016 Cancer Research3730
on August 6, 2020. © 2016 American Association for Cancer Research. cancerres.aacrjournals.org Downloaded from
Published OnlineFirst April 28, 2016; DOI: 10.1158/0008-5472.CAN-15-3190

43. Nikolaev S, Santoni F, Garieri M, Makrythanasis P, Falconnet E, GuipponiM, et al. Extrachromosomal driver mutations in glioblastoma and low-grade glioma. Nat Commun 2014;5:5690.
44. Philp AJ, Campbell IG, Leet C, Vincan E, Rockman SP,Whitehead RH, et al.The phosphatidylinositol 30-kinase p85alpha gene is an oncogene inhuman ovarian and colon tumors. Cancer Res 2001;61:7426–9.
45. Li C, Ao J, Fu J, Lee DF, Xu J, Lonard D, et al. Tumor-suppressor role for theSPOPubiquitin ligase in signal-dependent proteolysis of the oncogenic co-activator SRC-3/AIB1. Oncogene 2011;30:4350–64.
46. Yang H, Ye D, Guan KL, Xiong Y. IDH1 and IDH2 mutationsin tumorigenesis: mechanistic insights and clinical perspectives.Clin Cancer Res 2012;18:5562–71.
47. Baker D, Sali A. Protein structure prediction and structural genomics.Science 2001;294:93–6.
48. Niknafs N, Kim D, Kim R, Diekhans M, Ryan M, Stenson PD, et al.MuPIT interactive: webserver for mapping variant positions to anno-tated, interactive 3D structures. Hum Genet 2013;132:1235–43.
49. Pignatelli J, Jones MC, LaLonde DP, Turner CE. Beta2-adaptin bindsactopaxin and regulates cell spreading, migration and matrix degradation.PLoS One 2012;7:e46228.
50. Bosu DR,Kipreos ET. Cullin-RINGubiquitin ligases: global regulation andactivation cycles. Cell Div 2008;3:7.
51. Van Allen EM, Mouw KW, Kim P, Iyer G, Wagle N, Al-Ahmadie H, et al.Somatic ERCC2 mutations correlate with cisplatin sensitivity in muscle-invasive urothelial carcinoma. Cancer Discov 2014;4:1140–53.
52. Balbas-Martinez C, Sagrera A, Carrillo-de-Santa-Pau E, Earl J,Marquez M,Vazquez M, et al. Recurrent inactivation of STAG2 in bladder cancer is notassociated with aneuploidy. Nat Genet 2013;45:1464–9.
53. Lohr JG, Stojanov P, Lawrence MS, Auclair D, Chapuy B, Sougnez C, et al.Discovery and prioritization of somatic mutations in diffuse large B-celllymphoma (DLBCL) bywhole-exome sequencing. ProcNatl Acad Sci U SA2012;109:3879–84.
54. Wilson AJ, Byun DS, Nasser S, Murray LB, Ayyanar K, Arango D, et al.HDAC4 promotes growth of colon cancer cells via repression of p21.Mol Biol Cell 2008;19:4062–75.
55. Geng H,Harvey CT, Pittsenbarger J, Liu Q, Beer TM, Xue C, et al. HDAC4protein regulates HIF1alpha protein lysine acetylation and cancer cellresponse to hypoxia. J Biol Chem 2011;286:38095–102.
56. Cardnell RJ, Behrens C, Diao L, Fan Y, Tang X, Tong P, et al.An Integrated Molecular Analysis of Lung Adenocarcinomas Identi-fies Potential Therapeutic Targets among TTF1-Negative Tumors,Including DNA Repair Proteins and Nrf2. Clin Cancer Res 2015;21:3480–91.
57. Jia L, Zhou Z, Liang H,Wu J, Shi P, Li F, et al. KLF5promotes breast cancerproliferation, migration and invasion in part by upregulating the tran-scription of TNFAIP2. Oncogene 2016;35:2040–51.
58. Ryland GL, Hunter SM, Doyle MA, Caramia F, Li J, Rowley SM, et al.Mutational landscape of mucinous ovarian carcinoma and its neoplasticprecursors. Genome Med 2015;7:87.
59. Wang L, Lawrence MS,Wan Y, Stojanov P, Sougnez C, Stevenson K, et al.SF3B1 and other novel cancer genes in chronic lymphocytic leukemia. NEngl J Med 2011;365:2497–506.
60. Golovnina K, Blinov A, Akhmametyeva EM,Omelyanchuk LV, Chang LS.Evolution and origin of merlin, the product of the Neurofibromatosis type2 (NF2) tumor-suppressor gene. BMC Evol Biol 2005;5:69.
61. Chiasson-MacKenzie C, Morris ZS, Baca Q, Morris B, Coker JK,Mirchev R, et al. NF2/Merlin mediates contact-dependent inhibition ofEGFR mobility and internalization via cortical actomyosin. J Cell Biol2015;211:391–405.
62. Li YY, Zhou CX, Gao Y. Moesin regulates the motility of oral cancer cellsvia MT1-MMP and E-cadherin/p120-catenin adhesion complex. OralOncol 2015;51:935–43.
63. Manson-Bahr D, Ball R, Gundem G, Sethia K,Mills R, Rochester M, et al.Mutation detection in formalin-fixed prostate cancer biopsies taken at thetime of diagnosis using next-generation DNA sequencing. J Clin Pathol2015;68:212–7.
64. Zhu T, Wang J, Pei Y, Wang Q, Wu Y, Qiu G, et al. Neddylationcontrols basal MKK7 kinase activity in breast cancer cells. Oncogene2015.
65. Kazyken D, Kaz Y, Kiyan V, Zhylkibayev AA, Chen CH, Agarwal NK, et al.The nuclear import of ribosomal proteins is regulated by mTOR. Onco-target 2014;5:9577–93.
66. Vangamudi B, Paul TA, Shah PK, Kost-Alimova M, Nottebaum L, Shi X,et al. The SMARCA2/4 ATPase domain surpasses the bromodomain as adrug target in SWI/SNF-mutant cancers: insights from cDNA rescue andPFI-3 inhibitor studies. Cancer Res 2015;75:3865–78.
www.aacrjournals.org Cancer Res; 76(13) July 1, 2016 3731
Exome-Scale Discovery of Hotspot Mutation Regions
on August 6, 2020. © 2016 American Association for Cancer Research. cancerres.aacrjournals.org Downloaded from
Published OnlineFirst April 28, 2016; DOI: 10.1158/0008-5472.CAN-15-3190
2016;76:3719-3731. Published OnlineFirst April 28, 2016.Cancer Res Collin Tokheim, Rohit Bhattacharya, Noushin Niknafs, et al. Cancer Using 3D Protein StructureExome-Scale Discovery of Hotspot Mutation Regions in Human
Updated version
10.1158/0008-5472.CAN-15-3190doi:
Access the most recent version of this article at:
Material
Supplementary
http://cancerres.aacrjournals.org/content/suppl/2016/04/28/0008-5472.CAN-15-3190.DC1
Access the most recent supplemental material at:
Cited articles
http://cancerres.aacrjournals.org/content/76/13/3719.full#ref-list-1
This article cites 65 articles, 27 of which you can access for free at:
Citing articles
http://cancerres.aacrjournals.org/content/76/13/3719.full#related-urls
This article has been cited by 28 HighWire-hosted articles. Access the articles at:
E-mail alerts related to this article or journal.Sign up to receive free email-alerts
Subscriptions
Reprints and
To order reprints of this article or to subscribe to the journal, contact the AACR Publications Department at
Permissions
Rightslink site. Click on "Request Permissions" which will take you to the Copyright Clearance Center's (CCC)
.http://cancerres.aacrjournals.org/content/76/13/3719To request permission to re-use all or part of this article, use this link
on August 6, 2020. © 2016 American Association for Cancer Research. cancerres.aacrjournals.org Downloaded from
Published OnlineFirst April 28, 2016; DOI: 10.1158/0008-5472.CAN-15-3190