exixting dataparti
TRANSCRIPT

RW2-4-5
Preparation of Rwanda Land Use and Development Master Plan
Report on Collection of Existing Data
March 2009
Report on Collection of Existing Data
1 (274)
Table of Contents LIST OF TABLES .......................................................................................................... 8
10
12
14
17
21
2122222323272828282929
31
31
323435363738383838404143474748525455
2.5 Demography ...................................................................................................57 57575859
LIST OF FIGURES ......................................................................................................
LIST OF BOXES ..........................................................................................................
ABBREVIATIONS AND ACRONYMS.....................................................................
SUMMARY ...................................................................................................................
1 INTRODUCTION.............................................................................................
1.1 Organisation of Report..................................................................................21 1.2 Purpose of Report ..........................................................................................21 1.3 Project Background....................................................................................... 1.4 Project Description ........................................................................................ 1.4.1 Project aims and objectives.............................................................................. 1.4.2 Delimitations.................................................................................................... 1.4.3 Project methodology ........................................................................................ 1.4.4 Capacity building ............................................................................................. 1.5 Progress........................................................................................................... 1.5.1 Inception .......................................................................................................... 1.5.2 Collection of secondary data............................................................................ 1.5.3 National geodetic system ................................................................................. 1.5.4 Aerial photography and changes to TOR.........................................................
2 CONTEXT......................................................................................................
2.1 Introduction.................................................................................................... 2.2 Rwanda’s Political Origins and Evolution ..................................................31 2.2.1 Post 1994 political reconstitution and governance reforms............................. 2.2.2 National unity, justice and reconciliation ........................................................ 2.2.3 Decentralisation ............................................................................................... 2.2.4 Local government ............................................................................................ 2.2.5 District.............................................................................................................. 2.2.6 Sector ............................................................................................................... 2.2.7 Cell................................................................................................................... 2.3 The Economy.................................................................................................. 2.3.1 Vision 2020...................................................................................................... 2.3.2 Economic Development and Poverty Reduction Strategy (EDPRS) Paper..... 2.3.3 Economic performance .................................................................................... 2.3.4 Economic growth and general poverty reduction but widening inequality ..... 2.4 Physical Geography ....................................................................................... 2.4.1 Relief................................................................................................................ 2.4.2 Soils and subsoil .............................................................................................. 2.4.3 Weather and climate ........................................................................................ 2.4.4 Hydrography .................................................................................................... 2.4.5 Land cover .......................................................................................................
2.5.1 Introduction...................................................................................................... 2.5.2 Population statistics ......................................................................................... 2.5.3 Temporal demographic trends ......................................................................... 2.5.4 Spatial and gender analysis of population trends.............................................

Report on Collection of Existing Data
2 (274)
2.5.5 The issues......................................................................................................... 626262636465666868687171727374
75
75757576
79
8383
85
858586
888991919192939494949595959696
2.6 Health .............................................................................................................. 2.6.1 Introduction...................................................................................................... 2.6.2 Rwanda’s health sector .................................................................................... 2.6.3 Major illnesses afflicting population ............................................................... 2.6.4 Accessibility of health services........................................................................ 2.6.5 Expansion of health services............................................................................ 2.7 Education........................................................................................................ 2.7.1 Introduction...................................................................................................... 2.7.2 Primary education ............................................................................................ 2.7.3 Distribution of primary schools ....................................................................... 2.7.4 Secondary education ........................................................................................ 2.7.5 Technical and Vocational Education and Training (TVET)............................ 2.7.6 Higher education.............................................................................................. 2.7.7 Issues................................................................................................................
3 SOILS..............................................................................................................
3.1 Summary......................................................................................................... 3.2 Introduction.................................................................................................... 3.2.1 Background...................................................................................................... 3.2.2 Methodology.................................................................................................... 3.3 Soil Map of Rwanda.......................................................................................76 3.4 Agricultural zones.......................................................................................... 3.5 Land Capability Classification .....................................................................80 3.6 Crop Suitability Classification......................................................................81 3.7 Hydrogeological Map, Wells Archive ..........................................................82 3.8 Geological Map of Rwanda...........................................................................83 3.9 Issues ............................................................................................................... 3.9.1 General.............................................................................................................
4 AGRICULTURE..........................................................................................
4.1 Summary......................................................................................................... 4.2 Introduction.................................................................................................... 4.3 DDPs................................................................................................................ 4.4 Present agricultural situation .......................................................................88 4.4.1 Statistics on national agricultural production .................................................. 4.4.2 Major agricultural crops................................................................................... 4.4.3 DDP Perceptions.............................................................................................. 4.5 Agricultural Problems................................................................................... 4.5.1 General problems ............................................................................................. 4.5.2 Specific problems............................................................................................. 4.5.3 Storage, marketing and processing .................................................................. 4.5.4 Livestock production ....................................................................................... 4.5.5 Fisheries ........................................................................................................... 4.5.6 Beekeeping....................................................................................................... 4.6 Issues ............................................................................................................... 4.6.1 Land use planning ............................................................................................ 4.6.2 Regionalisation ................................................................................................ 4.6.3 Imidugudu ........................................................................................................ 4.6.4 Urban agriculture .............................................................................................

Report on Collection of Existing Data
3 (274)
4.7 Way forward................................................................................................... 9797
98
989899
100100102
104104106107107107108109110111111112
114
114114
115115116116117
118122122122
123
123126126126
128129129
4.7.1 Tools ................................................................................................................
5 FORESTRY....................................................................................................
5.1 Summary......................................................................................................... 5.2 Introduction.................................................................................................... 5.3 Methodology ................................................................................................... 5.4 Current Characteristics of Forestry Sector...............................................100 5.4.1 Context........................................................................................................... 5.4.2 Historical background of forestry sector........................................................ 5.4.2 Current level of forest resource...................................................................... 5.5 Role of Forest in Economy ..........................................................................104 5.5.1 Introduction.................................................................................................... 5.5.2 Economic functions of productive forests ..................................................... 5.5.3 Socio-recreational functions of the national parks......................................... 5.5.4 Ecological functions and protection forests................................................... 5.6 Forest management...................................................................................... 5.6.1 General policy frameworks............................................................................ 5.6.2 Specific policy frameworks ........................................................................... 5.6.3 Forest planning and management .................................................................. 5.6.4 Administration of forestry sector and institutions ......................................... 5.7 Issues ............................................................................................................. 5.7.1 Challenges...................................................................................................... 5.7.2 Way forward ..................................................................................................
6 ENVIRONMENT.........................................................................................
6.1 Summary....................................................................................................... 6.2 Introduction.................................................................................................. 6.3 Environment and Natural Resources.........................................................115 6.3.1 Wetlands ........................................................................................................ 6.3.2 Land ............................................................................................................... 6.3.3 Forests ............................................................................................................ 6.3.4 Biodiversity.................................................................................................... 6.3.5 Areas Protected .............................................................................................. 6.4 Policy and regulatory framework...............................................................118 6.4.1 National framework ....................................................................................... 6.4.2 Institutional Framework................................................................................. 6.5 Issues ............................................................................................................. 6.5.1 Broad environmental issues for present Project.............................................
7 ECOLOGY ...................................................................................................
7.1 Summary....................................................................................................... 7.2 Introduction.................................................................................................. 7.3 Methodology ................................................................................................. 7.3.1 Data collection and data standards................................................................. 7.4 Need for Ecological Consideration in the Planning Process ....................128 7.4.1 The importance of biodiversity and functioning ecosystems ........................ 7.5. Ecological Footprint..................................................................................... 7.5.1 Definition ....................................................................................................... 7.5.2. Ecological deficit in Rwanda ......................................................................... 131

Report on Collection of Existing Data
4 (274)
7.6 Climate Change............................................................................................130 7.6.1 Universal and African impacts....................................................................... 130 7.6.2 Impact in Rwanda .......................................................................................... 131
131133136136136137137139139140140140140141143144
147147149149149150150152152153154
156157158158
165
165165166
168168169169170
7.7 Legal and Policy Context.............................................................................131 7.7.1 International commitments ............................................................................ 7.7.2 National policies and legal instruments ......................................................... 7.8 Geographical context ................................................................................... 7.8.1 Physical geography ........................................................................................ 7.8.2 Climate........................................................................................................... 7.8.3 Hydrography .................................................................................................. 7.8.4 Eco-region...................................................................................................... 7.8.5 Agro-ecological region .................................................................................. 7.8.6 Soils................................................................................................................ 7.9 Biodiversity Inventory ................................................................................. 7.9.1 Eco-systems in Rwanda ................................................................................. 7.9.2 Cropland and natural vegetation mosaic........................................................ 7.9.3 Forest.............................................................................................................. 7.9.4 Wetlands and water bodies ............................................................................ 7.9.5 Important Bird Areas (IBAs) in Rwanda ....................................................... 7.9.6 Red Data Listed (RDL) Species..................................................................... 7.10 Threats to Ecosystem Services and Biodiversity.......................................147 7.10.1 General........................................................................................................... 7.10.2 Habitat conversion and destruction................................................................ 7.10.3 Pollution......................................................................................................... 7.10.4 Over-exploitation ........................................................................................... 7.10.5 Climatic conditions ........................................................................................ 7.10.6 Invasive species ............................................................................................. 7.10.7 Drivers of ecological threats .......................................................................... 7.11 Protected Areas ............................................................................................ 7.11.1 General........................................................................................................... 7.11.2. Need for Buffer Areas, Corridors and Protected Areas ................................. 7.12 Indicators ...................................................................................................... 7.13 Findings and Issues ......................................................................................156 7.13.1 Availability of data ........................................................................................ 7.13.2 Justification to include environmental concerns in Master Plan ................... 7.13.3 Areas of special ecological importance ......................................................... 7.13.4 Threats to biodiversity ................................................................................... 7.14. Recommendations for Present Project.......................................................160
8 SOCIAL INFRASTRUCTURE.................................................................
8.1 Summary....................................................................................................... 8.2 Introduction.................................................................................................. 8.2.1 Prior consultations on emerging issues.......................................................... 8.2.2 Export crops and change of use restrictions .................................................. 167 8.2.3 Rental land use conditions ............................................................................. 168 8.2.4 Land market and land use strategising........................................................... 8.2.5 Livestock issues ............................................................................................. 8.2.6 Lakeshore issues and fisheries ....................................................................... 8.2.7 Marshlands and small scale clay extraction................................................... 8.2.8 Soil erosion ....................................................................................................
Report on Collection of Existing Data
5 (274)
8.2.9 Small scale mineral extraction ....................................................................... 170170172172173173175
181
181181181182185
186188188188190190192195195195198199199200203203203203
204206206206207207207208208
209210
8.2.10 Landholding patterns, including fragmentation and consolidation................ 8.2.11 Land sharing................................................................................................... 8.2.12 Informal settlement upgrading....................................................................... 8.2.13 Expropriation and change of use.................................................................... 8.2.14 Imidugudu and participatory planning........................................................... 8.3 Methodology ................................................................................................. 8.4 Assessment of Existing Data and Recommendations Arising..................176 8.5 Key Findings of Field Study........................................................................177 8.6 Implications for National Parks .................................................................179 8.7 Recommendations for Further Studies......................................................179
9 PHYSICAL INFRASTRUCTURE.............................................................
9.1 Introduction.................................................................................................. 9.2 Transport ...................................................................................................... 9.2.1 General........................................................................................................... 9.2.2 Problems related to transportation ................................................................. 9.2.3 Roads as the principal sub-sector................................................................... 9.3 Public Transport in Rwanda ......................................................................186 9.3.1 Road Transport............................................................................................... 9.3.2 Air Transport.................................................................................................. 9.4 Roads............................................................................................................. 9.4.1 General existing situation and jurisdiction .................................................... 9.4.2 General road inventory .................................................................................. 9.4.3 Problems associated with road infrastructure ................................................ 9.4.4 Plans and programmes ................................................................................... 9.5 Railways ........................................................................................................ 9.5.1 Background.................................................................................................... 9.5.2 First stage objectives...................................................................................... 9.5.4 Isaka Dry Port ................................................................................................ 9.6 Air Transport ............................................................................................... 9.6.1 Overview........................................................................................................ 9.6.2 Kigali airport.................................................................................................. 9.6.3 Plan to improve other airports and aerodromes ............................................. 9.7 Water Transport .......................................................................................... 9.7.1 Akagera River Navigability Study................................................................. 9.7.2 Construction of seven quays on Lake Kivu ................................................... 9.8 Policies and legal framework on transport................................................204 9.8.1 National Transport Policy .............................................................................. 9.8.2 Transport Master Plan.................................................................................... 9.8.3 Road Agency.................................................................................................. 9.8.4 Road Maintenance Strategy ........................................................................... 9.8.5 Road Classification ........................................................................................ 9.8.6 The National Transport Development Board................................................. 9.8.7 Other issues envisaged by MININFRA ......................................................... 9.8.8 New Partnership for African Development (NEPAD) .................................. 9.8.9 The Sub-Saharan Africa Transport Policy Program (SSATP) ...................... 9.9 Issues related to transportation ..................................................................209 9.9.1 Roads.............................................................................................................. 9.9.2 Intermediary Means of Transport (IMT) .......................................................

Report on Collection of Existing Data
6 (274)
9.9.3 Railways......................................................................................................... 212213213213213214214215217218219220221221223224224226226226227227228228229
229230231232232233234234235235235235236
237238238239
242
245
245245
9.9.4 Airports .......................................................................................................... 9.9.5 Water Transport ............................................................................................. 9.10 Energy ........................................................................................................... 9.10.1 Background.................................................................................................... 9.10.2 Sub-sector profiles ......................................................................................... 9.10.3 Overview........................................................................................................ 9.10.4 Current national energy constitution.............................................................. 9.10.5 Vision 2020 and EDPRS initiatives............................................................... 9.10.6 Electricity Transmission and distribution ...................................................... 9.10.7 Summary of distributed electricity in Rwanda .............................................. 9.10.8 Potential electric energy principal sources .................................................... 9.10.9 Micro-hydro electricity .................................................................................. 9.10.10 Methane gas from Lake Kivu ........................................................................ 9.10.11 Solar energy ................................................................................................... 9.10.12 Thermal Solar................................................................................................. 9.10.13 Biomass.......................................................................................................... 9.10.14 Biogas ............................................................................................................ 9.10.15 Wind Energy .................................................................................................. 9.10.16 Geo-thermal energy ....................................................................................... 9.10.17 Inter-connections to import and export electricity......................................... 9.10.18 The Kampala–Kigali oil pipeline project....................................................... 9.10.19 Prospects for oil exploration in Rwanda........................................................ 9.10.20 Bio-fuels......................................................................................................... 9.10.21 Conversion of Methane Gas........................................................................... 9.11 Water and Sanitation...................................................................................229 9.11.1 Overview........................................................................................................ 9.11.3 Sources of water............................................................................................. 9.11.4 Expansion and Strategic Plans ....................................................................... 9.11.5 Water treatment and distribution ................................................................... 9.11.7 Toilet ‘waste’ ................................................................................................. 9.11.8 Toilet wastes .................................................................................................. 9.11.9 Eco-sanitation ................................................................................................ 9.11.10 Management of human end products in urban areas ..................................... 9.11.11 Industrial effluent........................................................................................... 9.12 Solid ‘waste’.................................................................................................. 9.12.1 Production...................................................................................................... 9.12.2 Collection and dumping................................................................................. 9.12.3 Separating ...................................................................................................... 9.13 Information and communication Technology (ICT) ................................237 9.13.1 Overview........................................................................................................ 9.13.2 A Mile Stones in ICT Evolution .................................................................... 9.12.3 National ICT human resources ...................................................................... 9.13.4 Telecommunication........................................................................................ 9.13.5 Various indicators in ICT evolution .............................................................. 240 9.13.6 The ICT Bus Project ......................................................................................
10 LAND USE AND DEVELOPMENT PLANNING ...................................
10.1 Introduction.................................................................................................. 10.2 Land Use Management................................................................................
Report on Collection of Existing Data
7 (274)
10.2.1 Vision 2020.................................................................................................... 245245246246248250250250251251252255255255255256256256256257257257257258258258258258259259259260261262
265
10.2.2 EDPRS ........................................................................................................... 10.2.3 Urbanisation Policy........................................................................................ 10.2.4 Land policy, laws and regulations ................................................................. 10.2.5 Land administration structures....................................................................... 10.3 Development Planning................................................................................. 10.3.1 Introduction.................................................................................................... 10.3.2 Urbanisation................................................................................................... 10.3.3 Context........................................................................................................... 10.3.4 Urban development........................................................................................ 10.3.5 EDPRS ........................................................................................................... 10.4 Urbanisation Policy...................................................................................... 10.4.1 Introduction.................................................................................................... 10.4.2 Population evolution ...................................................................................... 10.4.3 Urban Population Distribution....................................................................... 10.4.4 Regional and International Context ............................................................... 10.5 Major challenges .......................................................................................... 10.5.1 Lack of plots and basic infrastructure............................................................ 10.5.2 Lack of basic urban data ................................................................................ 10.5.3 Inappropriate urbanisation and construction norms and standards................ 10.5.4 Low percentage of registered land tenure...................................................... 10.5.5 Lack of financial resources for people with expropriated land...................... 10.5.6 Lack of appropriate planning and urban management tools.......................... 10.6 Basic principles............................................................................................. 10.6.1 Balanced and sustainable development ......................................................... 10.6.2 Urbanisation process...................................................................................... 10.6.4 Development planning ................................................................................... 10.6.5 Policy vision, objective and strategies ........................................................... 10.7 Housing ......................................................................................................... 10.7.1 Introduction.................................................................................................... 10.7.2 EDPRS ........................................................................................................... 10.7.3 National Human Settlement Policy................................................................ 10.7.4 National Grouped Settlement Policy ............................................................. 10.7.5 Urban and rural infrastructure........................................................................
REFERENCES............................................................................................................
APPENDIX 1...............................................................................................................273
Report on Collection of Existing Data
8 (274)
List of Tables Table 2.1- Real growth rate trends by activities (5-year averages in percent) .............. 42
444646525960616364686979828790909395
101102102103
Table 2.2 - Poverty headcount (share of population and number)................................. Table 2.3 Wellbeing self-ranking or categorisation ...................................................... Table 2.4 - Major perceived causes of poverty............................................................... Table 2.5 - Meteorological stations ................................................................................ Table 2.6 – Ever used any method of contraception (% of method)............................... Table 2.7 - Population structure ..................................................................................... Table 2.8 - Male-female ratios........................................................................................ Table 2.9 - Childhood mortality and maternal mortality rate ........................................ Table 2.10 - HIV prevalence in population aged 15-49 disaggregated by sex............... Table 2.11- Reported literacy levels for individuals aged 15 and above (%) ................ Table 2.12– Net primary school enrolment rate by gender and stratum (%)................. Table 3.1 - Dataset layers relevant to the present Project ............................................. Table 3.2 – Drilling Register .......................................................................................... Table 4.1 - DDP problems identified and ranked in one typical district........................ Table 4.2 - Production of some food crops in Rwanda 1986 and 2006 in tonnes .......... Table 4.3 - Livestock 2006 .............................................................................................. Table 4.4 – Comparative crop yields between farmers’ and research stations’ fields .. Table 4.5 - Regionalisation of crops by agro bio-climatic zones ................................... Table 5.1 - Critical events in the history of the forestry sector in Rwanda .................. Table 5.2 - Evolution of the Rwanda forest cover in time ............................................ Table 5.3 - Forest plantations in 2007 in ha ................................................................ Table 5.4- Natural forests of Rwanda........................................................................... Table 5.5 - Annual wood production (m3).................................................................... 105
106107140141142142143144145147155158160184186186191192193193193200216217
Table 5.6 - Place of wood in energy supply in Rwanda................................................ Table 5.7 – Tourist revenue from forest........................................................................ Table 7.1– Eco-system areas by type ............................................................................ Table 7.2 - Forest cover and change in forest area in Rwanda ................................... Table 7.3 - Wetland surface area by district (old classification) ................................ Table 7.4 - Lakes and marshes .................................................................................... Table 7.5 – Important bird areas .................................................................................. Table 7.6 – RDL plant species ...................................................................................... Table 7.7 - Threatened animal species ......................................................................... Table 7.8 – Threats to ecosystem service by province.................................................. Table 7.9- CBD Sustainability Indicators..................................................................... Table 7.10 -Areas of special ecological importance .................................................... Table 7.11 - Features for the National Land Use and Development Master Plan....... Table 9.1 - Distances and times of transit towards ports ............................................. Table 9.2 – Transportation per sub-sector ................................................................... Table 9.3 - Major arteries used by public transport..................................................... Table 9.4 – Problems associated with sub-standard roads .......................................... Table 9.5 – On-going or completed works re paved road network .............................. Table 9.6 - Projects in pipeline re paved road network ............................................... Table 9.7 - New Road constructions re paved road network........................................ Table 9.8– On-going maintenance contracts re rural gravel road network................. Table 9.9 - Rwanda Airports and Aerodromes ............................................................. Table 9.10 - Production costs of electricity in Rwanda by source ............................... Table 9.11 - Household consumption of electricity in some neighbouring countries ..

Report on Collection of Existing Data
9 (274)
Table 9.12 - Quantitative presentation of institutions earmarked for solar power installation ............................................................................................... 224
231233239240240246
253
253263263
Table 9.13 - Piped water sources in Rwanda ............................................................... Table 9.14 - Indication of access to toilet facilities 2005-6.......................................... Table 9.15 - Indicators of ICT infrastructure development .......................................... Table 9.16 - Estimated level of computers usage by staff per sector............................ Table 9.17 - Estimated level of internet usage by staff per sector ................................ Table 10.1 - Projected land use planning ..................................................................... Table 10.2 - Progress towards Vision 2020 targets by Millennium Development Goals Table 10.3 – Envisaged projection by EDPRS on infrastructure, habitat and
urbanisation ............................................................................................. Table 10.4 – Roads and network................................................................................... Table 10.5 – School, health and market .......................................................................

Report on Collection of Existing Data
10 (274)
List of Figures Figure 1.1- Participatory training and monitoring cycle .............................................. 27
3637
4548495051515354555667717778
103104105127128129138163183188188188188189196
197197199203211212215216220222222222225227
Figure 2.1 - Organisation structure of the province...................................................... Figure 2.2 - The District organisational structure ......................................................... Figure 2.3 - Changes in poverty at regional and national level (poor as % of the
population) ................................................................................................. Figure 2.4- Map showing Rwanda relief distribution .................................................... Figure 2.5 – Carte pédologique du Rwanda................................................................... Figure 2.6 - Soil texture classes of dominant soil units in Rwanda................................ Figure 2.7 - Soil depth classes of dominant soil units in Rwanda .................................. Figure 2.8 - Drainage classes of dominant soil units in Rwanda................................... Figure 2.9 – Map showing Rwanda temperature distribution........................................ Figure 2.10 – Map showing Rwanda climate ................................................................. Figure 2.11 - Rainfall distribution in Rwanda................................................................ Figure 2.12 – Map showing Rwanda land cover ............................................................ Figure 2.13– Map of Rwanda showing health centres ................................................... Figure 2.14 – Map of Rwanda showing schools............................................................. Figure 3.1 - Soil boundaries with soil vector data at 1:50000 scale.............................. Figure 3.2- Soil map with raster data at 1:50000 scale ................................................. Figure 5.1- Forest plantations of Rwanda.................................................................... Figure 5.2 - Natural forests of Rwanda ........................................................................ Figure 5.3 - Annual wood production in Rwanda ........................................................ Figure 7.1 - Red Data List Criteria .............................................................................. Figure 7.2 - Ecosystem services.................................................................................... Figure 7.3 - Ecosystem services and drivers of change................................................ Figure 7.4- Global 200 Eco-regions in Rwanda .......................................................... Figure 7.5 – Conservation zoning ................................................................................ Figure 9.1- Rwanda sub-regionally landlocked .......................................................... Figure 9.2 - Taxi-Mini Buses ........................................................................................ Figure 9.3 - Kigali City, Mount Kigali in background ................................................ Figure 9.4 - Kigali International Airport: ............................................................... Figure 9.5 - National Flag Carrier............................................................................... Figure 9.6 - General Road Map of Rwanda. ................................................................ Figure 9.7 - Schematic view of the proposed railway alignment ................................. Figure 9.8- Schematic presentation of part of the proposed railway towards Kigali and
environs, in relation to other transport infrastructure ............................ Figure 9.9 - Schematic presentation of part of the proposed railway: Link to Burundi Figure 9.10 - Kigali City in relation to the location of new airport ............................. Figure 9.11 – Major long-term accesses to the new airport site.................................. Figure 9.12 - Common Intermediary Means of Transport ........................................... Figure 9.13 - Illustrations of use of animals of burden as an IMT............................... Figure 9.14- Energy consumption in Rwanda .............................................................. Figure 9.15 - Trend of electricity tariffs in Rwanda ..................................................... Figure 9.16 - Potential Energy Sources ...................................................................... Figure 9.17 - View of Lake Kivu ................................................................................... Figure 9.18 - Map of Lake Kivu.................................................................................... Figure 9.19 – Kivu methane gas extraction rig ............................................................ Figure 9.20 - Gisovu tea factory firewood Figure 9.21 - Domestic use firewood...... Figure 9.22- Regional interconnections of electric power ...........................................

Report on Collection of Existing Data
11 (274)
Figure 9.23 - Overrun Kigali City dumpsite at Nyanza................................................ 236236237239
240240241243250251252254254261262262263
Figure 9.24 - Burning due to biogas formation ............................................................ Figure 9.25 – Separation of organic matter, compressing and briquettes ................... Figure 9.26 - Subscribers of mobile, fixed telephones and internet development ........ Figure 9.27 - Percentage of educational institution with internet, website and teachers
using PC at home ..................................................................................... Figure 9.28 - Percentage of health institutions with PC, internet and website............ Figure 9.29 - Percentage of ICT indicators urban vs Rural......................................... Figure 9.30 – Interior of ICT bus ................................................................................. Figure 10.1 - Diagram of land administration organisation........................................ Figure 10.2 - Examples of urban morphology.............................................................. Figure 10.3 - Positive association between population density and poverty incidence Figure 10.4 - EDPRS planning linkages to achieve its objectives ............................... Figure 10.5 - Planning and reporting tools for implementing EDPRS ........................ Figure 10.6 - Upgrading or bulldozing? ...................................................................... Figure 10.7 - Exising umugududu neighbourhood ...................................................... Figure 10.8 - Layout of unugududu ............................................................................. Figure 10.9 - Medium density housing in Kigali .........................................................
Report on Collection of Existing Data
12 (274)
List of Boxes Box 1.1 – Project ten steps.............................................................................................. 24
3133344143889697
121130132133135135136137138141143146151152162166167167167168171174198201202204206214219221224225225226226229237242248
Box 2.1 - Rwanda and Berlin conference ....................................................................... Box 2.2 - Office of the Ombudsman ................................................................................ Box 2.3- Gacaca courts................................................................................................... Box 2.4 - Sector strategies .............................................................................................. Box 2.5 – Trade deficit.................................................................................................... Box 4.1 - DDP participation .......................................................................................... Box 4.2 – Danish land reform......................................................................................... Box 4.3 – Urban agriculture in Kampala ....................................................................... Box 6.1 - International obligations............................................................................... Box 7.1 - Carbon foot print and carbon credit ............................................................. Box 7.2 - International conventions, treaties and protocols signed by Rwanda .......... Box 7.3 - Rwanda Ramsar contracting party................................................................ Box 7.4 - Legal instruments on forestry........................................................................ Box 7.5 – Wetland areas legal instruments .................................................................. Box 7.6 - Protected areas legal instruments ................................................................. Box 7.7 - Basins, freshwater source and withdrawal rate ............................................ Box 7.8 - Rift forests, moorlands and rift valley lakes.................................................. Box 7.9 - Natural forests ............................................................................................... Box 7.10 - Important birds areas .................................................................................. Box 7.11 - Nearly threatened, endemic and extinct birds............................................. Box 7.12 - Policy, legal framework and constraints..................................................... Box 7.13 - Reduced parks forest reserves reduced or gone.......................................... Box 7.14 - Ecologically important areas ...................................................................... Box 8.1 – National Land Tenure Reform Programme 2006 field consultations .......... Box 8.2 –Tea and change of use ................................................................................... Box 8.3 – C offee and change of use ............................................................................. Box 8.4 - Pyrethrum and change of use ....................................................................... Box 8.5 – Renting-in land ............................................................................................. Box 8.6 – Average size landholdings ............................................................................ Box 8.7 - NLTRP raised imidugudu concerns ............................................................. Box 9.1 – Dry port history ............................................................................................ Box 9.2 – Existing airport limitations........................................................................... Box 9.3 - Proposed Implementation phasing ................................................................ Box 9.4 – Project aspects.............................................................................................. Box 9.5 - Inspiration ..................................................................................................... Box 9.6 – Stand-by diesel generators ........................................................................... Box 9.7 – Measures to improve transmission and distribution .................................... Box 9.8 – Micro-hydro sites and plants ........................................................................ Box 9.9 – Costly panels hamper market growth ........................................................... Box 9.10- Government measures .................................................................................. Box 9.11 – Alternative biomass sources ....................................................................... Box 9.12 - Untapped African potential ......................................................................... Box 9.13 – Clean source of energy ............................................................................... Box 9.14 - Ethical issue? .............................................................................................. Box 9.15 - Biogas from ‘waste’ could bring change .................................................... Box 9.16 - ICT Specific Projects................................................................................... Box 10.1 – Organic land Law provisions. ....................................................................

Report on Collection of Existing Data
13 (274)
Box 10.2 – Land management institutions .................................................................... 249251260
Box 10.3 - Population growth ....................................................................................... Box 10.4 – Rapid urban population growth .................................................................

Report on Collection of Existing Data
14 (274)
Abbreviations and Acronyms ACNR Association pour la Conservation de la Nature au Rwanda AEC Agro-Ecological Zoning AIS Alien and Invasive Species ANCR Association for the Conservation of Nature in Rwanda BADEA Arab Bank for Economic Development in Africa BEST Biomass Energy Strategy CBD Convention on Biological Diversity CGIS–NUR Centre of Geographic Information Systems of NUR CITES Convention on International Trade in Endangered Species CR Critically Endangered DHS Demographic and Health Survey DFGF Dian Fossey Gorilla Fund EAC East African Community EBA Endemic Bird Areas EDPRS Economic Development and Poverty Reduction Strategy EN Endangered ESRI GIS software brand ESSP Education Sector Strategic Plan EW Extinct in the Wild EX Extinct FAO United Nations Food and Agriculture Organisation FFN Fonds Forestier National (National Forestry Fund) GCC Global Conservation Concern GDP Gross Domestic Product GIS Geographical Information System GIS-NUR Geographic Information System Research Centre, NUR GOR Government of Rwanda GTZ German Technical Cooperation HSSP Health Sector Strategic Plan HIPC Heavily Indebted Poor Country HIMO Haute Intensité de Main d’Oeuvre (High Labour Intensive Work) ha hectar IBA Important Bird Area ICRAF World Agro forestry Centre IFAD International Fund for Agricultural Development IISD International Institute for Sustainable Development IMCE Integrated Management of Critical Ecosystems IPCG International Programme for the Conservation of the Gorillas IRST Institut National de Recherche Scientifique et Technologique IRWR Internal Renewable Water Resource ISAR Institut des Sciences Agronomiques du Rwanda ISRT Institute for Scientific and Technological Research IMT Intermediary Means of Transport ITRF International Terrestrial Reference Frame IUCN International Conservation Union IUGG International Union of Geodesy and Geophysics JADF Joint Action Development Forum
Report on Collection of Existing Data
15 (274)
KRC Karisoke Research Centre LTSFF Long Term Strategy and Financial Framework MA Millennium Ecosystem Assessment MAB Man and Biosphere Programme MDG Millennium Development Goals MINAGRI Ministry of Agriculture and Animal Resources MINALOC Ministry of Local Government and social affairs MINECOFIN Ministry of Finance and Economic Planning MINICOM Ministry of Commerce, Industry, Investment promotion, Tourism
and Cooperatives MININFRA Ministry of Infrastructures MINIRENA Ministry of Natural Resources MINITERE Ministry of Lands, Environment, Water, Forest and Mines
(former, now MINIRENA) MTEF Medium-Term Expenditure Framework MOH Ministry of Health NAFA National Forestry Agency NGO Non Governmental Organisation NICI National Information and Communications Infrastructure NIS National Investment Strategy NT Near Threatened NTFP Non Timber Forest Products NUR National University of Rwanda OECD Organisation for Economic Co-operation and Development OPEC Organization of the Petrolium Exporting Countries ORTPN Tourism and National Parks Authority PAFOR Projet d'Appui à l'Aménagement des Forêts au Rwanda PAREF Programme d’Appui à la Reforestation au Rwanda PCFN Project for the Conservation of Nyungwe Forest PIGU Project d’infrastructures et de gestion urbaine PNILP National Malaria Control Programme RDL Red Data List REMA Rwanda Environment Management Authority RIEPA Rwanda Investment and Export Promotion RRS Restricted Range Species RSA Rwanda Standardisation Authority PSTA Strategic Plan for Agricultural Transformation in Rwanda RURA Rwanda Utilities Regulatory Agency RWDA Rwanda Workforce Development Authority Sida Swedish International Development Cooperation Agency SOER State of the Environment Report STRABAG European construction company based in Vienna, Austria TOR Terms of Reference TVET Technical and Vocational Education and Training TSC Teacher Service Commission UN United Nations UNDP United Nations Development Programme UNEP United Nations Environment Programme UNESCO United Nations Education, Social and Cultural Organisation

Report on Collection of Existing Data
16 (274)
USAID United States Agency for International Development VU Vulnerable WCS World Conservation Society WB World Bank WWF World Wide Fund for Nature
Report on Collection of Existing Data
17 (274)
Summary Introduction. Project purpose, background, aims and objectives, delimitations, methodology and progress are provided in Section 1 of this report of data collection. The purpose of this report of collection of existing data is to provide the Project team with enough background and information to enable them to meaningfully engage in the next phases in the Project. It is written to be useful to a wide set of stakeholders in the preparation of the Rwanda national land Use and Development Master Plan. The Project background is imbedded in a need to operationalise the objectives and provisions of the National Land Policy and Organic Law. Government is, thus, enjoined to put in place the master plan to guide use and management of land in Rwanda towards efficient, effective and equitable use of the country’s natural resources. Swedesurvey, having won the tender for the project, works in close collaboration with the National land Centre (NLC). The Project aim and objectives comprise two interlinked components – preparation of a national Land Use and Development Master Plan and assistance in the planning and setting up of an organisational structure for collecting and managing land use data at NLC. The former concerns assistance with preparation of a master plan that will engender more rational, efficient, equitable and sustainable management of land and related resources. The latter entails assisting NLC to establish an organisation to manage land use data. Whereas taking cognisance of these, Plan preparation is delimited in that it will not focus per se on conditions for land management aspects below the District level. Validity of the Plan will depend on continuous evaluation and up-dating. Whereas a mechanism for this is to be built into the plan, the plan itself cannot guarantee this. The plan preparation methodological approach is guided by Rwandan land policy conception of land as a common heritage for past, present and future generations for all. Its methods will utilise up-from technology, especially with use of GIS as decision making tool. Techniques will involve consultation and participation as crucial elements in seeking to ensure Plan relevance with broad and deep Rwandan ownership. On progress, an inception report has been submitted in parallel with Project mobilisation. This report, based on individual sectoral specialists’ reports – primarily using secondary but also primary data sources - is the result of the collection of existing data period in the project. It has been conducted together with studies of the national geodetic system and a GIS specification for NLC. Aerial photography from 3000 m has also been carried out over around 70 % of Rwanda with following ground controls and orthophoto production. The latter results in high resolution map images for land registration and detailed spatial planning purposes, among other uses, is scheduled to be completed by end of June this year, a month when the remaining part of the country is to be photographed for securing completing orthophotos to cover the whole of Rwanda for up-to date mapping.
Context. The Rwandan context to the project is provided in Section 2. It outlines the country’s political origins and evolution, political reconstruction and governance reforms, entailing national unity, justice and reconciliation. It accounts for decentralisation with local government through de-concentration and devolvement of power to District, Sector and Cell levels. The economic approach in Rwanda is dealt with through Vision 2020 and Economic Development and Poverty Reduction Strategy (EDPRS), with reference also to economic performance and growth, and its relation to poverty reduction and inequality. The Rwandan physical geography is given regarding soils, weather and climate, hydrography and land cover. He country’s demographic is

Report on Collection of Existing Data
18 (274)
situation is accounted for with general population statistics, temporal demographic trends, spatial and gender trends and by Project team perceived emerging issues. The section also addresses the situation on health by visiting the Health Sector Strategic Plan, the health sector itself, major illnesses and accessibility of health services. Concluding, Section 2 accounts for the education situation in Rwanda. The introduction shows that there are lacking skills to move the economy forward towards the knowledge-based transition, Primary, secondary, technical and vocational education and training, and higher education are outlined. Also to education related issues are raised.
Soils A brief overview of the existing data on the soil situation in Rwanda is found in Section 3. It is complimented by more detailed accounts on soil inherent in the sections on agriculture, forestry and ecology in this report. By way of an introduction, focus is on the existing soils map of the country, which is considered highly useful together with accompanying data package. Mapped agricultural zones and land and crop capability classifications are outlined, as well as existing hydrological and geological maps. The few issues raised concern lack of seamlessness in soil map related data and ministerial soil survey unit with limited resources.
Agriculture. An overview of existing data regarding the agricultural situation in Rwanda is given in Section 4. It informs that the most up to date agricultural data corresponds to former administrative units in Rwanda. Due to absence of a conversion programme to transform the data to new administrative situation, the utility of the data suffers. The data in the District Development Plans (DDPs), however, are found highly useful in compensation. An overview of the present agricultural situation is presented with statistics, together with major agricultural crops. General and specific problems related to agriculture are outlined as relating to: storage, marketing and processing; livestock production; fishing; and, beekeeping. Issues focus on those pertaining to a perceived need for land use planning, to regionalisation, cost-benefit of Imidugudu and urban agriculture. Use of GIS as a tool in agriculture is suggested as part of a way forward, as well as pilot projects. An in-depth complimentary study on agro-ecological issues is to be conducted following the initial data collection, which is subject to this report. It will also seek to secure data that was difficult to access or use during the initial audit.
Forestry. Existing data regarding forestry in Rwanda is outlined in Section. It identifies the forest as a party in completing land uses situation in Rwanda. After declaring the methodology for the Project inventory on forestry, current characteristics of the forestry sector are given. It includes reference to general context, historical background, level of the forest resource including its productive economic and ecological functions. Forest management is outlined through visits to general and specific policy, planning and management, administration of forestry sector and related institutions. Challenging issues include high wood demand exceeding supply, high dependency on wood as source of household energy and high competition for land among different uses in conflict with forest. Ways forward propose an integrated orientation.
Environment. A an overarching view of existing data pertaining to the environmental situation in section in Rwanda is provided in Section 6. It is complimented by sections on agriculture, forestry, ecology and social and physical infrastructure in this report. By introduction it defines environment and outlines its current problems due to lack of environmental awareness, care and know-how. Moreover it advances its crosscutting nature with a need for a holistic approach. On environmental and natural resources overview, the section accounts for the environmental state of wetlands, land and
Report on Collection of Existing Data
19 (274)
forests. It accounts for the depleted bio-diversity situation and of protected areas in a response attempt. Regarding the Rwandan policy and regulatory framework, the role vis-à-vis environment of Vision 2020, Rwanda Environment Management Authority (REMA), Sectoral Policy on Water and Sanitation and National Land Policy is surmised. Rwanda’s international obligations on environment are given. Issues for the present Project concern efficient, equitable and sustainable land use and development planning with minimal impact on the environment. Particular reference is given to land degradation, water resources decline, forest resources destruction, wetland degradation and loss of scenic and recreational resources.
Ecology. Existing data regarding ecology in Rwanda is found in Section 7. It is both universal in its approach and local-specific. Its beginning therefore, discusses priorities, ecosystems prerequisites and threats with justification of a need for ecological consideration in the planning process. The concept of the ecological footprint is explained with an account of the ecological deficit in Rwanda. Global climate change and its impact on Rwanda are outlined. The section also audits the situation in Rwanda regarding legal and policy context. It accounts for the country’s geographical situation including climate, hydrography and eco-region role. A bio-diversity inventory overview is provided ranging from eco-systems, cropland and natural vegetation mosaic, forest, wetland an d water bodies and important bird areas, red data listed species. The section accounts for threats to eco-system services and biodiversity generally and specifically with reference in the latter to deforestation, erosion and unsustainable utilisation of wetlands. It makes reference to existing extend and degree of pollution, over-exploitation, floods and drought, invasive species, drivers of ecological threats and protected areas in the country. The need for buffer areas, corridors and protected area and indicators are given. On findings and issues, the section advances that spatial and biodiversity for GIS analyses is limited and indicates the particular parts of this lacuna concerning ecology. Reiterating in the audited Rwandan ecological context, the section by means of conclusion, provides a justification for including environmental concerns in the present Project, refereeing also to environmental justice. It lists areas of special ecological importance and threats to biodiversity. It also makes Project recommendations including a need to accumulate further GIS data.
Social infrastructure. A condensed version of the Project Specialist’s report on data collection in this area of social infrastructure is provided in Section 8. A comprehensive and systematic audit of existing data sources and data regarding all Project sectors with extracts and notes is provided in her Project report. It also contains a purpose-designed field study on emerged issues (Annex 1). The section on social infrastructure, by way of introduction, accounts for the different elements of socio-economic inventory input, including earlier familiarisation with review of existing data. It outlines the context and prior consultation on emerging issues, which include those relating to; export crops and change of land use restrictions; rental land use conditions; land market and land use strategising; livestock; lake shore and fisheries; marshland and small scale clay extraction; soil erosion; small scale mineral extraction; land holding patterns including fragmentation and consolidation, land sharing; informal settlement upgrading; expropriation and change of use; Imidugudu and participatory planning; and, expropriation and change of use. The section accounts for adopted data collection methodology. It also gives an assessment of existing data with recommendations for the project arising. Key findings of the field study are given together with perceived

Report on Collection of Existing Data
20 (274)
socio-economic implications for the National parks. Concluding, suggestions for further study are provided.
Physical Infrastructure. Covering a broad range of components, existing data on physical infrastructure is accounted for I Section 9. It deals with transport, energy, water and sanitation, solid ‘waste’ and ITC. On transport, after a general definition, it outlines a range of inherent Rwandan-specific problems including those of challenging topography and ‘landlockedness’. The public transport situation in the country is outlined regarding all modes. Focus is then provided on transportation pertaining to roads, railways, air and water. Polices and legal framework and institutions on transportation is visited through National Transport Policy, Transport Master Plan and Road Agency. Issues related to all existing and envisaged Rwandan transportation means are raised including those related to Intermediary Means of Transport (MIT). The section also addresses the situation in the country concerning energy, starting with the context and current energy constitution and policy. Existing electricity provision in all its existing forms in Rwanda is accounted for including its generation and transmission. Proposed approaches and projects are accounted for. A Rwandan water and sanitation overview is given. On the former, supply, sources, treatment and distribution are provided. On the latter toilet waste handling is outlined with reference to the existing lacking - and to health detrimental - situation in contrast with eco-sanitation potential. Solid ‘waste’ is accounted for. Concluding, the section deals with Information and Communication Technology (ICT) by means of an overview of policy aspirations and justification. Focus is given to telecommunication and associated services potential.
Land use and development planning. As a stepping stone to continuing work, leading to Project proposals for land use and development in the preparation of the national land Use and Development Master Plan, an overview of existing data on land use and development planning is provided in Section 10. By introduction, the section intimates the Rwandan focus on a need for urbanisation. It outlines the approaches on land use management and development planning inherent in Vision 2020 and Rwanda Development and Poverty Reduction Strategy (EDPRS). Different other policies, laws and regulations, which explicitly and implicitly steer land management, are also accounted for. Land administration structures are outlined. Attention is then given to development planning with general reference to competing land uses, urbanisation and urban development. The role and direction of EDPRS in this context is provided with targets. Urbanisation policy in Rwanda is then focused on through accounting for population evolution, urban population distribution, also in a regional and international context. Major challenges with lack of: plots and basic infrastructure; urban data; appropriate norms and standards; secure tenure; finances for relocation after expropriation; and, adequate planning and management tools. The section also discusses universally accepted basic principles on urbanisation and development planning, and outlines Rwandan policy vision, strategies and objectives in this context. Concluding, it deals with housing through national policy and strategies including the national human settlement policy and EDPRS. It also outlines the National Grouped Settlement Policy. Urban and rural infrastructure approach is accounted for through reference to address to it in EDPRS. Implicit in the section, topic related emerging issues are raised.

Report on Collection of Existing Data
21 (274)
1 Introduction 1.1 Organisation of Report Editor and authors. This report has been edited by Dr, Nils Viking, the Rwanda Land Use and Development Master Plan Project Manager and Team Leader, who assumes responsibility for any mistakes related to editing. He is also responsible for compiling the section on environment. Other sections in the report emanate from Project Specialist’ own reports of data collection. The report by the Project Socio-economist, by nature of the cross-cutting nature of her subject area, is voluminous per se. As it also contains references to and extracts from source material of interest to all Project areas of interest, it is annexed in full to the present report. The section on social infrastructure in the present report, is, therefore, condensed. The report is the result of contributions of:
• Dr Emmanuel Nkurunziza, Project Core Team Member – Sections 1.2-2 on Introduction and Context;
• Mr Ola Wennerby, Swedesurvey, HQ – Section 3 on Soils;
• Mr Ole Olsen, Project Consultant – Section 4 on Agriculture;
• Mr Aphrodise Mbonyintwali, Project Consultant – Section 5 on Forestry;
• Ms Birgitta Farrington, Project Consultant – Section 7 on Ecology;
• Dr Liz Daley, Project Consultant – Section 8 on Social Infrastructure (also Annex 1);
• Mr Paul Gasinzigwa, Project Consultant – Section 9 on Physical Infrastructure; and,
• Mr Dismas Nkubana, Project Core Team Member – Section 10 on Land Use and Development Planning.
1.2 Purpose of Report Essential knowledge base for project team. Whereas it is accepted that this report vital to the project team as a prerequisite stepping stone for engaging in the next phases in the project, it is written in an attempt also to be useful to a wide set of stakeholders outside the realms of the Ministry of Natural Resources (MINIRENA), ie to other sectoral, parastatal, private sector, civic society representatives with a stake in the project.
1.3 Project Background A national Land Use and Development Master Plan. In line with Rwanda’s long-term development vision, important institutional reforms in the land sector, aimed at fostering desirable spatial development across the country, are underway. Amongst the key outputs of the reform process so far are the National Land Policy and the Organic Law determining the use and management of land in the country. To operationalise the broad objectives and provisions of the two instruments, the government is enjoined to put in place a land use and development master plan to guide the use and management of land across Rwanda. The plan should ultimately lead to more efficient, effective and equitable use of the country’s natural resources. It was in a bid to effect this requirement that the then ministry in charge of lands,

Report on Collection of Existing Data
22 (274)
Ministry of Lands, Environment, Forest, Water and Mines (MINITERE), constituted a taskforce to develop terms of reference (TOR) for this task and call tenders from international companies with expertise and experience in this field.
In collaboration with NLC. Having won the tender, Swedesurvey, the overseas agency of the Swedish government’s National Land Survey, has been charged with the responsibility of developing the Rwanda National Land Use and Development Master Plan since September 2007. The project falls under Ministry of Natural Resources (MINIRENA), although it has implications for virtually all sectors of the economy. In executing this project, Swedesurvey works in close collaboration with the National Land Centre (NLC). To this end, besides preparation of the plan, the project is also expected to assist in building the capacity of the newly established NLC, specifically in areas of managing land use data using GIS. The project will also produce orthophotos that will be used in systematic adjudication and registration of land. Moreover they are to be used in overall and detailed spatial development planning of Rwanda.
1.4 Project Description Technical Proposal. The aim of this sub-section is to briefly describe the nature of the national Land Use and Development Plan Project, highlighting its aim and objectives as well as the methodology adopted and expected outputs. Given that the nature of the Project has not materially changed from what was agreed during the inception phase, this section will generally reiterate the commitments made in Swedesurvey’s Technical Proposal – found in the bid submission that awarded the project to the company - as subsequently affirmed in the project inception report. The sub-section presents, below, the Project aims and objectives, as given in the Project Tender Invitation TOR before presenting the approach adopted to realise these.
1.4.1 Project aims and objectives Two linked components. The project comprises two relatively distinct components, albeit interlinked: first, preparation of a national Land Use and Development Master Plan; and, second, assistance in the planning and setting up of an organisational structure for collecting and managing land use data at the NLC.
Aim one. The first, and main component, of the Project is aimed at producing a national Land Use and Development Master Plan that will engender a more rational, efficient, effective, equitable and sustainable management and use of land and other resources thereon. To achieve this aim, there are a number of objectives that have to be realised along the way, and these are:
• preparation of an up-to-date national base map at a scale of 1:50000;
• completing a land audit in terms of land tenure and land use classes as specified in the organic land law;
• understanding the existing situation in the country, and identifying the key planning issues through collecting and analysing relevant secondary sources planning data from both state and non-state agencies;
• undertaking specific studies of key issues such as the socio-economic conditions of certain areas and groups of people, soil conditions, ecology and environment to complement the secondary sources referred above;

Report on Collection of Existing Data
23 (274)
• preparation of alternative land use and development master plan proposals for consultation and public hearings – the plan shall be inherently spatial showing how conflicting land use and land related interests may be reconciled, and it shall be based on different population projections;
• preparation of a draft law for the implementation of the land use and development master plan; and,
Aim two. The second component that aims at planning and setting up an organisational structure at NLC for collecting and managing land use data has the following specific objectives:
• providing training in land use data collection and management to staff in charge of land management, land use, monitoring and evaluation; and,
• preparation of technical specifications for the procurement of a GIS and database for land use monitoring.
1.4.2 Delimitations Cover and validity. Two project delimitations, although not stated in its TOR, may be envisaged at this juncture, ie:
• whereas the national land use and development master plan will consider aggregate information regarding the existing situation and needs at administrative levels below the district, it will not make detailed and specific proposals for planning based at disaggregated data at these levels – it may, however, provide an example of how national land use and development planning policy may be materialised at levels below that of the district, eg how Imidugudu settlements may be spatially organised; and,
• whereas every effort is made to make the plan relevant as a dynamic and to national policy complimentary instrument for guiding national land use and development master planning, its validity will depend on continuous evaluation and up-dating – feasibility for such revalidation can be built in to the plan, but it cannot be guaranteed by the plan itself.
1.4.3 Project methodology Preparation for guiding and process-orientation for regular review and up-dating. We seek to prepare a national land use and development master plan that can be used as an effective planning instrument for medium to longer term strategic decisions and annual programming and budgeting for land use and development management at national, provincial and district levels. The plan should reflect both the long to medium term visions and the short term implementation capacities. The plan will, therefore, be more than a physical layout with zoning regulations – it will need to have a guiding spatial plan component, but this will be complimented by process-orientated socio-economic and other components that directly address national and local authority governance issues and implementation capacity. The plan will need to be prepared so that it may function in a foreseeable future through regular review and up-dating. The regularity of such review and up-dating will need to be agreed.
Approach follows Rwandan land policy. The approach we follow is guided by fundamental principles underpinning the Rwandan national land policy, particularly the conception of land as a common heritage for past, present and future generations, and whose management, therefore, should be participatory and inclusive of all

Report on Collection of Existing Data
24 (274)
citizens and other stakeholders. The national land policy has as one of its principles the protection of existing fragile zones that are of national interest. It also contends that the determination of the real purpose of land and information about land is a pre-requisite to good management and rational use of land, which is the basic element of development and source of life. This, therefore, demands that any planning undertaking should take into account all the various types of land-related information, which constitute land databases as they vary in times and space.
Use of up-front technology and scientific information. As asserted by the national land policy, physical planning should utilize the best available scientific technology and information to identify and protect significant natural resources and to ensure the viability of both human and natural communities. Our methodology will, therefore, introduce methods and techniques, which make it possible to predict the socio-economic and environmental impact of various decisions and discuss alternatives at every stage of the project. Indicators showing whether plans promote or work against the achievement of socio-economic and environmental objectives shall be presented to stakeholders throughout the planning process.
Use of GIS as decision making tool. Our methods and techniques will make use of – and show how to make use of - Geographical Information System (GIS) as a decision support tool. This tool will not only be used in testing sustainable environmental solutions, but also in developing standard procedures in generating alternative spatial in all the plan preparation steps. It will introduce the stakeholders to planning techniques and standards, GIS analysis techniques in the assessment of socio-economic, institutional, infrastructure and environmental conditions, graphic user interfaces and developed formal decision support models. We will also explore and show the advantages of using the latest remote sensing techniques, such as change detection analyses, for environmental monitoring. These utilise GIS in, for example, overlay analyses to determine suitable areas for the development of various public services and utilities.
The preparation of the national land Use and Development Master Plan, thus, follows Rwandan land policy. To this end it is purpose-designed for a comprehensive and integrated development approach in the Technical Proposal’s ‘Ten Steps’, which remain relevant (Box 1.1, below). Box 1.1 – Project ten steps
Step 1 - Getting organised to work and identifying stakeholders. The timely and smooth preparation of the national Land Use and Development Master Plan is greatly dependent on how well the anticipation and mobilization of the resources that will be needed for the surveying and planning activities have been established. The greater part of the project inception phase was, thus, devoted to reassessing the resource projections presented in the project technical proposal and securing as many of these as possible, depending on how soon they will be needed for deployment. This phase of the project has been well accomplished through acquisition of good working premises and mobilising the physical and human resources needed to execute the project. Whereas extra resources will continue to be mobilised as of demands of different project activities, the major infrastructure and set-up to run the project is in place.
Step 2 – The Vision. The Ministry of Natural Resources, MINIRENA, which has a leading role in the master plan preparation process, has a vision, goal and objectives. MINIRENA’s sector-specific visionary statements draw upon the national development framework articulated in key national policy instruments such as Vision 2020 and international development commitments like the Millennium Development Goals (MDG). The vision and
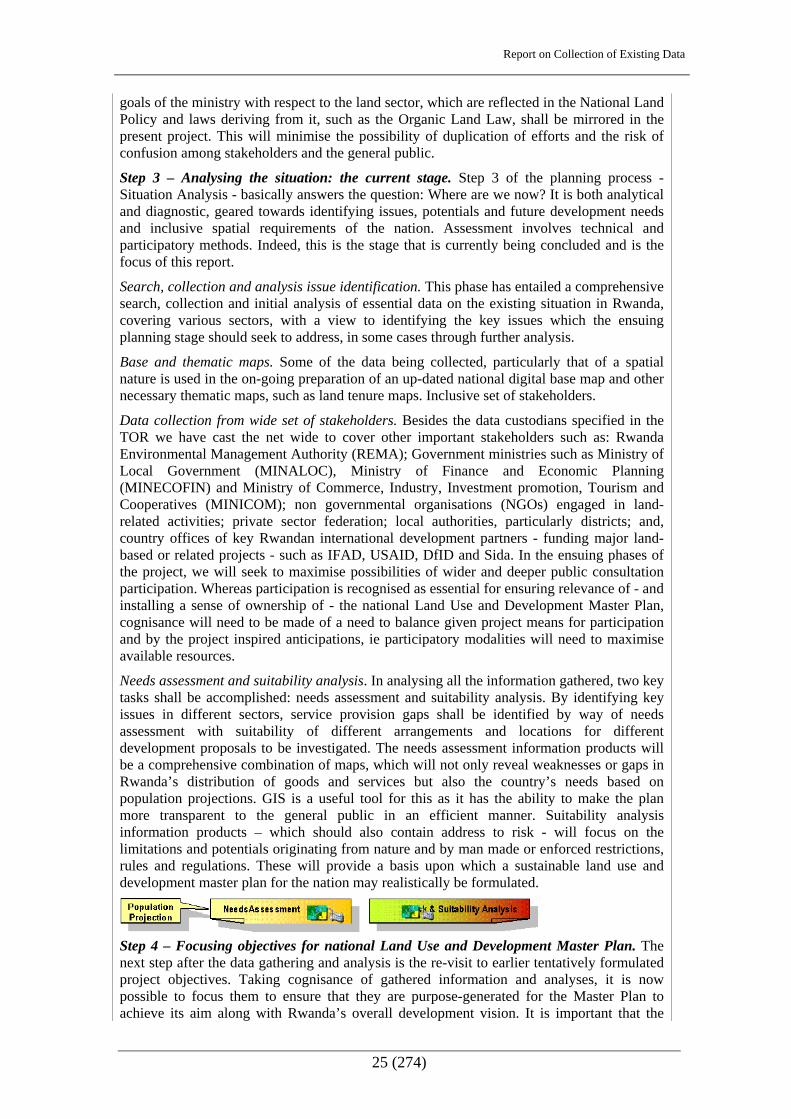
Report on Collection of Existing Data
25 (274)
goals of the ministry with respect to the land sector, which are reflected in the National Land Policy and laws deriving from it, such as the Organic Land Law, shall be mirrored in the present project. This will minimise the possibility of duplication of efforts and the risk of confusion among stakeholders and the general public.
Step 3 – Analysing the situation: the current stage. Step 3 of the planning process - Situation Analysis - basically answers the question: Where are we now? It is both analytical and diagnostic, geared towards identifying issues, potentials and future development needs and inclusive spatial requirements of the nation. Assessment involves technical and participatory methods. Indeed, this is the stage that is currently being concluded and is the focus of this report.
Search, collection and analysis issue identification. This phase has entailed a comprehensive search, collection and initial analysis of essential data on the existing situation in Rwanda, covering various sectors, with a view to identifying the key issues which the ensuing planning stage should seek to address, in some cases through further analysis.
Base and thematic maps. Some of the data being collected, particularly that of a spatial nature is used in the on-going preparation of an up-dated national digital base map and other necessary thematic maps, such as land tenure maps. Inclusive set of stakeholders.
Data collection from wide set of stakeholders. Besides the data custodians specified in the TOR we have cast the net wide to cover other important stakeholders such as: Rwanda Environmental Management Authority (REMA); Government ministries such as Ministry of Local Government (MINALOC), Ministry of Finance and Economic Planning (MINECOFIN) and Ministry of Commerce, Industry, Investment promotion, Tourism and Cooperatives (MINICOM); non governmental organisations (NGOs) engaged in land-related activities; private sector federation; local authorities, particularly districts; and, country offices of key Rwandan international development partners - funding major land-based or related projects - such as IFAD, USAID, DfID and Sida. In the ensuing phases of the project, we will seek to maximise possibilities of wider and deeper public consultation participation. Whereas participation is recognised as essential for ensuring relevance of - and installing a sense of ownership of - the national Land Use and Development Master Plan, cognisance will need to be made of a need to balance given project means for participation and by the project inspired anticipations, ie participatory modalities will need to maximise available resources.
Needs assessment and suitability analysis. In analysing all the information gathered, two key tasks shall be accomplished: needs assessment and suitability analysis. By identifying key issues in different sectors, service provision gaps shall be identified by way of needs assessment with suitability of different arrangements and locations for different development proposals to be investigated. The needs assessment information products will be a comprehensive combination of maps, which will not only reveal weaknesses or gaps in Rwanda’s distribution of goods and services but also the country’s needs based on population projections. GIS is a useful tool for this as it has the ability to make the plan more transparent to the general public in an efficient manner. Suitability analysis information products – which should also contain address to risk - will focus on the limitations and potentials originating from nature and by man made or enforced restrictions, rules and regulations. These will provide a basis upon which a sustainable land use and development master plan for the nation may realistically be formulated.
Step 4 – Focusing objectives for national Land Use and Development Master Plan. The next step after the data gathering and analysis is the re-visit to earlier tentatively formulated project objectives. Taking cognisance of gathered information and analyses, it is now possible to focus them to ensure that they are purpose-generated for the Master Plan to achieve its aim along with Rwanda’s overall development vision. It is important that the

Report on Collection of Existing Data
26 (274)
Plan aims and objectives, apart from seeking to ensure that they are in tandem with those in national policies and visions, reflect the ‘common good’ or consensus of the broader community, without compromising the legally enshrined rights of the individual. Only then will implementation of the Master Plan effectively engage all sectors, and ownership be shared nationally and inclusively. We shall achieve this by conducting participatory goal-setting processes in public settings where the ‘situation and risk and suitability analysis information products’ be presented and discussed with the intention of being used.
Step 5 – Establishing the development thrust and spatial strategies. This step is critical in determining the future spatial development of the Rwanda, and involves broad and deep understanding of an inclusive set of stakeholders of what is appropriate, feasible and possible through an exploration of different land use and development plan alternatives or scenarios. After exploring at least three alternatives, a draft plan will be prepared based on a preferred alternative. Only the land use and spatial planner’s imagination can define the limits of the use GIS in this step. Most probably the use of this tool will be limited to actual presentation and display work in the beginning. When the planner acquires advanced skills in the use of GIS, more sophisticated spatial analysis is possible. The information products in this step will be three alternative land use and development master plan scenarios towards a preferred plan. It may also be called a ‘national physical structure plan’, a ‘national spatial structure plan’, ‘national physical concept plan’ or a ‘national spatial concept plan’.
Step 6 - Preparing the Draft. It is at this stage that the national land use and development master plan, or national spatial concept plan, components and their spatial organisation and details are put into a final draft form. It also provides more detailed information relevant to checking use regulations or controls at district and local levels, among others. GIS will be useful in furnishing templates, which are based on map standards as regard to format and symbology. To facilitate the implementation of national strategies, we propose that the draft plan should be capable of being ‘broken-down’ into provincial and district master plans.
Step 7 - Conducting hearings. This will involve a 3-stage process namely: public display and information dissemination; consultations; and, consultations. The objective of this process is to inform the general public and ensure an objective and participatory review of the draft Master Plan. Moreover it is to encourage ownership of the plan and to gain support for its implementation.
Step 8 – Review, approval and adoption. The mandatory and comprehensive review of the national Land Use and Development Plan will take place at this stage, after which approval, enactment and adoption of it by the Client is scheduled. GIS benefits from permitting work in a digital mode, compared to the time consuming and laborious process of reviewing analogue maps and sketch proposals. Its capability of showing easily comprehendible visual proposals of different themes and at different scales – and in different locations, ideally with electricity so as to reduce needs for numerous paper copies, or hard copies, makes it not only efficient but pedagogic in this step.
Step 9 – Flexible implementation. Implementing the national Land Use and Development Master Plan requires available resources, complimented with functioning institutional structures and procedures. It is, therefore, recommended that the required draft legislation for implementation of the Master Plan should allow – within defined limits – as much flexibility as possible in its interpretation depending on the local context, as long as within legal administrative and other frameworks.
Step 10 – Monitoring, evaluation, updating and participation. The combination of attribute and spatial data, which is a unique advantage of GIS, greatly facilitates the measurement of development outcomes and trends. As the tools’ software is developing rapidly into a more user-friendly interface, it will also facilitate a growing demand for transparency and participatory planning.
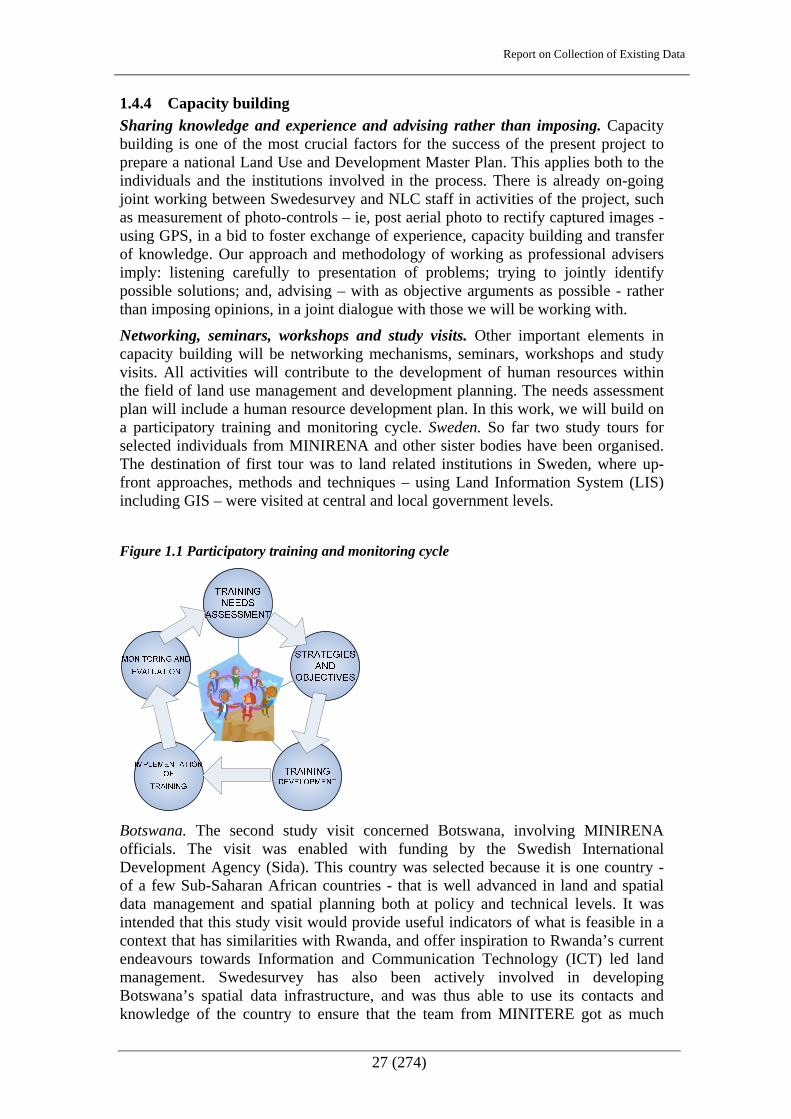
Report on Collection of Existing Data
27 (274)
1.4.4 Capacity building Sharing knowledge and experience and advising rather than imposing. Capacity building is one of the most crucial factors for the success of the present project to prepare a national Land Use and Development Master Plan. This applies both to the individuals and the institutions involved in the process. There is already on-going joint working between Swedesurvey and NLC staff in activities of the project, such as measurement of photo-controls – ie, post aerial photo to rectify captured images - using GPS, in a bid to foster exchange of experience, capacity building and transfer of knowledge. Our approach and methodology of working as professional advisers imply: listening carefully to presentation of problems; trying to jointly identify possible solutions; and, advising – with as objective arguments as possible - rather than imposing opinions, in a joint dialogue with those we will be working with. Networking, seminars, workshops and study visits. Other important elements in capacity building will be networking mechanisms, seminars, workshops and study visits. All activities will contribute to the development of human resources within the field of land use management and development planning. The needs assessment plan will include a human resource development plan. In this work, we will build on a participatory training and monitoring cycle. Sweden. So far two study tours for selected individuals from MINIRENA and other sister bodies have been organised. The destination of first tour was to land related institutions in Sweden, where up-front approaches, methods and techniques – using Land Information System (LIS) including GIS – were visited at central and local government levels.
Figure 1.1 Participatory training and monitoring cycle
Botswana. The second study visit concerned Botswana, involving MINIRENA officials. The visit was enabled with funding by the Swedish International Development Agency (Sida). This country was selected because it is one country - of a few Sub-Saharan African countries - that is well advanced in land and spatial data management and spatial planning both at policy and technical levels. It was intended that this study visit would provide useful indicators of what is feasible in a context that has similarities with Rwanda, and offer inspiration to Rwanda’s current endeavours towards Information and Communication Technology (ICT) led land management. Swedesurvey has also been actively involved in developing Botswana’s spatial data infrastructure, and was thus able to use its contacts and knowledge of the country to ensure that the team from MINITERE got as much

Report on Collection of Existing Data
28 (274)
benefit from the visit as possible. Moreover, as Swedesurvey’s project Kigali office Team Leader, who accompanied the team, has an extended experience as a land use planner and legal drafter of Botswana’s current Development Control Code1, he could show in-situ examples of outcomes of, purpose-designed, enabling land use and development legislation.
1.5 Progress
1.5.1 Inception Report. The start period of the three-year project was September 2007 with work on the project’s inception phase ending in December 2007. The inception phase was successfully completed and the Inception Report arising there from accepted by the then Ministry of Lands, Environment, Water, Forest and Mines (MINITERE), currently MINIRENA.
Mobilisation. This period also served the important purpose of mobilising all the essential human and physical resources necessary for the execution of this project. It has been possible to set up a well equipped project office in Kigali to avail working space to project staff and appropriate storage facilities for the project products. Various types of equipment have also been secured, including software to work with the images captured and other types of data.
1.5.2 Collection of secondary data Sources, review and analyses. The next phase of the project involved collecting secondary data from various ministries, governmental agencies, parastatals, private sector and NGOs. This collection is to provide a basis for assessing the pertinent issues relating to land and development that exist in the country with a view to making remedial proposals in the Master Plan. The present report is an outcome of the data sources identification, review and analysis resulting from collection during this phase.
Secondary and primary data. Whereas this phase of the project was primarily directed towards collecting secondary data, it was deemed pertinent to supplement this with primary information where necessary. The nature of secondary data collected from both published and unpublished materials includes policy documents, research papers, maps, correspondences, statistical abstracts and published literature on Rwanda’s political economy and land tenure development. The search for, and review of, secondary materials was undertaken at national to district levels, and in diverse locations and organisations. At both levels key policy and legal instruments were identified and studied, and reports on land management and general economic trends were examined. Information on country’s population dynamics and other demographic attributes was obtained from National Institute of Statistics (NISR). However, because it is almost six years since a national population census was conducted, there is considerable reliance on the more up-to-date spell out (EICV) reports despite them being sample-based. To supplement this data were maps and plenty of vector data collected from different organisations such as Ministry of
1 A legal instrument – under the Town and Country Planning Act - that regulates spatial development on individual parcels of residential, civic and community, commercial, industrial and mixed land use (Ministry of Local Government, Lands and Housing, 1995. Republic of Botswana – Development Control Code, 1995. The Government Printer. Gaborone. Purpose-drafted to be enabling to a disadvantaged majority, it won a UN HABITAT award 1996.

Report on Collection of Existing Data
29 (274)
Agriculture and Livestock (MINAGRI), National Land Centre (NLC), NISR and RURA.
Data verification. Documentary search was also conducted in a number of government ministries, starting with what is posted on their websites followed by physical visits to their offices. For purposes of gap-filling, data triangulation and corroboration, key informant interviews were conducted with some of the officials visited. Semi-structured interviews were used to elicit important information at both national and district levels, primarily targeting key policy makers and administrators. These respondents were very valuable in providing insights into policy issues otherwise not available in documentary form and thus not in the public domain.
1.5.3 National geodetic system Geodesy report submitted. Alongside the collection of existing information, work has been carried out on the national geodetic system. We started off by investigating the existing geodetic system with a view to assessing its suitability as a framework for collecting and managing spatial data in the country. What we found was a mixture of uncoordinated systems operating concurrently, creating potential for confusion and major errors in the use and management of spatial data. We have produced a report, detailing our findings and proposals for a unified modern system. We propose to change the national geodetic system to what is referred to as International Terrestrial Reference Frame (ITRF) as adopted by the International Union of Geodesy and Geophysics (IUGG). We are also proposing changes to the national map grid system so that, once mapped, the entire territory of Rwanda falls within one mapping zone as opposed to the current two. This would eliminate some accuracy errors that tend to occur at the meeting points of two different mapping zones. These proposals have been presented to MINIRENA
1.5.4 Aerial photography and changes to TOR Initial mixture of high and low level. To facilitate the planning process, the present project is supposed to prepare an up-to-date base map for the country. To do this, an aerial photography campaign was planned to generate orthophotos from which such a map would be produced. In the initial project terms of reference, the aerial photography programme was divided into two parts: low altitude photography, from 1250 m above ground level, for urban centres; and, high altitude photography, from 5000 m above ground level, for the rest of the country., As the project was underway, however, it was felt by MINIRENA that the aerial photography campaign should be carried out in such a way that the orthophotos produced can, besides being used in base-map preparation, support not only land registration processes, which are central to the government’s land reform efforts, but also detailed spatial planning. An example of the latter is the on-going detailed planning for a new Central Business District (CBD) of the City of Kigali. Negotiations between Swedesurvey and MINIRENA, through the National Procurement Authority, were initiated to this effect an addendum to the original contract was signed in June 2008. This addendum brought major changes to the aerial photography programme.
Intermediate level with high resolution. Because the orthophotos produced from high altitude photography at 5000 m are at a smaller scale with lesser resolution, they cannot be easily used in demarcating and registration of land parcels. It was, thus, agreed that the whole country be photographed from an intermediate altitude of 3000 m so that the outputs – with higher resolution - can be efficiently used for

Report on Collection of Existing Data
30 (274)
preparing the national land use and development master plan and support the processes of land registration and detailed spatial planning at the same time. The images produced from this altitude have a resolution of up to 25 cm2, making them usable for land parcel demarcation and detailed spatial planning.
Aerial photo with challenges. Addendum signed, aerial photography got underway starting from June 19, 2008. Two major challenges were encountered during the campaign regarding inclement weather and permissions from neighbouring countries to over fly their common borders with Rwanda. Aerial photography needs clear skies and good visibility to ensure quality images for mapping purposes, but it is seldom realised in Rwanda. Despite this, good aerial photography conditions existed from the second week of June up to around July 16. From then onwards, haze and heavy cumulus clouds became a problem for most parts of the country. Aircraft and crew, however, stayed mobilised in Rwanda in anticipation of an improvement in the weather conditions, but once it was clear that the weather was not getting any better and a statistically inclement weather period was to be expected, demobilisation was effected August 29, 2008. At the time of demobilisation, almost three quarters of the country had been completed. It is now expected that the remaining areas, located in the West and North-west, will be flown in June-July 2009. In the meantime, ground control measurements, needed in the preparation of orthophotos are concluded, and continuous delivery of completed orthophotos has started. It will continue with so far photographed parts of the country to be delivered at the end of June, and is scheduled to be concluded - with the remaining photography carried out – through to and including December 2009.
Aerial photo report submitted. An aerial photo report has been submitted to MINIRENA.
2 Ie, an object like a white 25 cm disc can be seen on the images.
Report on Collection of Existing Data
31 (274)
2 Context 2.1 Introduction Facilitating background information. Whereas the some contents of this report section, like the Sub-section, below, on the country’s political origins and evolution, is familiar with many readers of the present report or stakeholders in the preparation of the Rwanda national land Use and Development Plan, it is intended to familiarise others without this familiarity or serve as a reminder. The following sub-sections on existing Rwandan economy, physical geography, demography, health and education, in this context section, are intended to serve most readers and stakeholders as useful contextual Project backgrounds.
2.2 Rwanda’s Political Origins and Evolution Kingdom with clan groups. The Republic of Rwanda traces its origins to one of the oldest kingdoms in the East and Central African sub-region. Due to absence of records, it is not clear when this kingdom was founded. However, it is generally agreed that somewhere between the 14th and 16th centuries, the kingdom of Rwanda existed as a fully-fledged well administered, highly centralised entity. Other historical accounts, however, suggest that since the 11th century, Rwanda existed as a nation founded on a common history of its people, shared values and a single language and culture, extending well beyond the current boarders of the country. The unity of the Rwandan nation was also based on the clan groups and common rites with no discrimination based on ethnicity (MINECOFIN, 2000). Whereas the seat of the kingdom tended to move from one hill to another, these were invariably located in Nyanza near Butare. Kigali, the current capital of Rwanda bears no historic significance, having been created after the arrival of Europeans. It was in Kigali that the Germans established their headquarters, and built the residence of the colonial governor. Box 2.1 - Rwanda and Berlin conference
Reduced territory. Following the 1885 Berlin conference, Rwanda was given to Germany to be administered jointly with Burundi. As a result of the conference partitioning of Africa, Rwanda lost a big part of its territory to neighbouring countries where ethnic Rwandans can be found even today. Because Rwanda was not considered suitable for white settlement, it was not seen as a colony but rather a protectorate and, therefore, German authority and administration were exercised through indirect rule. The first European residence in Kigali was established in 1907. This was followed by setting up a military camp and thereafter some commercial buildings in the neighbourhood.
Belgian administration with League of Nations mandate. German control of Rwanda, however, did not last long as this came to an end following German’s defeat in the First World War. Indeed, it was on May 6, 1916 that Belgian troops entered Kigali, signalling the defeat of the Germans. When the war ended three years later, Belgian administration of Rwanda was formalised but this was to be undertaken on behalf of the League of Nations following the declaration of Rwanda and Burundi as mandate territories of the League of Nations. Whereas the main administrative centre for the Rwanda-Urundi mandate was in Bujumbura - in today’s Burundi - Kigali served as local seat of the colonial administration inside Rwanda.

Report on Collection of Existing Data
32 (274)
Ethnic conflict supported by colonial administration. Like for most African countries, the road to independence was marred also by Rwanda by ethnic conflict. In the case of Rwanda it pitted the majority Hutu against minority Tutsi, all of which was fanned and supported by the Belgian colonial administration as well as the powerful Catholic Church. The results were the massacres of Tutsis, many of whom fled into exile in neighbouring countries. These conflicts also culminated into the overthrow of the centuries-old monarchy, and Rwanda became a republic.
Genocide. Rwanda’s post-colonial history has also been marked by sporadic periods of upheavals and state-sponsored marginalisation of certain sections of the population within the country. The state also invested a lot of efforts in denying those Rwandans who had fled into exile the right to return to their country. Having sought all peaceful means to resolving issues, Rwandans, particularly those in exile resorted to waging a liberation war in the early 1990s. The civil upheavals of the 1990s culminated into the 1994 genocide, which claimed more than one million lives and created a similar number of refugees and displaced persons.
2.2.1 Post 1994 political reconstitution and governance reforms National level governance reforms. The genocide had a devastating effect on the Rwanda’s social, economic and political fabric, as well as on its human resource base and institutional capacity. The situation returned to normal with the restoration of peace, the return of refugees and the undertaking of prudent liberalised economic policies and programmes with the assistance of international donors. The disruptive legacy of the 1990s has now been largely corrected, and the country’s economic and social recovery has been strong and steady About a decade-and-a-half since the genocide, Rwanda has made tremendous strides in rebuilding its socio-political landscape, and significant achievements have been registered, including restoration of security for people and property across the country, putting in place and capacitating key state institutions.
Security and reforms. The government of Rwanda has also invested significant efforts in improving relations with the international community and neighbouring countries. The country has played a significant role in the international conference on the Great Lakes Region, and is contributing to the African Union and United Nations peace-keeping missions. This has led to improved peace, security and stability in the region, while also improving the image of Rwanda. Several reforms have also been effected in public, corporate and civic sectors by introducing new institutions while revamping old ones to ensure effective service delivery, better financial management, democratic governance, and cramping down on corruption. More importantly the government has been able to restore security over the country’s entire territory, with the only major threat to national security being remnants of genocide perpetrators camped in the Democratic Republic of Congo (DRC).
Democratisation and citizen participation. Having dealt with immediate political and security problems following the genocide, the government of Rwanda has embarked on consolidation and deepening of good governance on several fronts. Through public consultations and national referendum (May 2003), a new constitution was developed and promulgated. The constitution sought to rectify the ills in the past political dispensation that culminated in the genocide, and has since been a basis for regular democratic elections of leaders ranging from the lowest levels of local government to the President. This has opened horizons for creating a
Report on Collection of Existing Data
33 (274)
progressively stable environment that creates confidence for Rwandans as well as foreign investors. The new constitution has provided a framework for representation and participation of citizens, bringing into existence key institutions including the two chambers of Parliament, an independent judiciary, the National Electoral Commission, the Office of the Ombudsman and the Office of the Auditor-General, among others. Having identified corruption and injustice as two of the main evils that undermine good governance in many countries, the Government of Rwanda sought to put in place institutions to deal with these issues. Box 2.2 - Office of the Ombudsman
Prevent and fight injustice, corruption and related infractions. In 2003, the Office of the Ombudsman was created, and its primary mandate is to prevent and fight injustice, corruption and related infractions. The institution serves as an intermediary between the population and government or private administrative entities, and therefore, receives and examines petitions filed by the population on individual basis and those of private associations concerning activities of government employees, as well as those of the private sector and seeks to mediate settlements in such cases. The Ombudsman also receives, verifies and archives annual data on wealth declarations by civil servants as required by law.
Participation in the planning process secured. Within a short period of time Rwanda’s has, thus, managed to establish internationally recognised democratic credentials as evidenced by regular, peaceful, free and fair elections. Regarding citizen participation, empowerment, transparency and accountability, the new constitution has provided a framework for representation and participation of citizens in the district planning process. Several mechanisms to promote citizen empowerment, voice and accountability have been adopted. At the national level, citizens participate through parliamentary elections, opinion polls and town meetings. A number of mechanisms have been strengthened to promote accountability links between citizens and local governments, including umudugu meetings, social audits, ubudehe participatory programmes, abunzi mediators, service satisfaction surveys, imihigo reviews, debates on radio and television, the Joint Action Development Forum (JADF), and Youth and Women’s Councils. These mechanisms are complemented by a contractual performance approach between service providers and local governments or national policy makers. Furthermore, the accountability links between local governments and national policy makers work through inspections, audits and imihigo.
Free political competition and the independence of the media and civil society. Deliberate efforts have been put into creating space and provide a platform for civil society organisations to fully participate in affairs of the country. A policy on civil society, to increase its role in national governance issues has been drafted. At the national level, several initiatives, such as the Joint Governance Framework, the Millennium Challenge Corporation and the creation of independent think tanks, are underway to improve harmonisation with regard to the assessment of governance in Rwanda. Free political competition and the independence of the media and civil society have been reinforced through several mechanisms including the establishment of a political party forum and of the Rwanda Civil Society Platform. These shall also continue serving the promotion of effective partnerships between public, private sector and civil society through, among others, Joint Action Development Forums at local level and twinning programmes.
Report on Collection of Existing Data
34 (274)
Gender address with highest 55 % female parliamentarians. There has also been significant progress on gender equality, as indicated by both girls’ primary school enrolments and women’s representation in parliament, where Rwanda has the highest proportion of female parliamentarians in the world at 55%. Much remains to be done, however. A great deal of violence against women, such as rape and domestic assault, goes unreported and hence unpunished. And there remain problems with the Land Law: women who are not legally married have no legal entitlement to their ‘husband’s’ land. Efforts by local communities with regard to encouraging couples to legalise their marriages are yielding fruits through group marriage ceremonies.
2.2.2 National unity, justice and reconciliation Box 2.3 Gacaca courts
Alternative to the classical judicial system. One of the ills that characterised post-colonial Rwanda before 1994 was the culture of impunity for those with state power. The post-genocide government of Rwanda sought to deal with the culture of impunity by dispensing justice while fostering national reconciliation. To this effect, Gacaca community courts were introduced to speed up the delivery of justice related to genocide crimes and despite the enormity of this challenge, the trials are almost complete. Before introducing Gacaca courts, the government had set up special chambers to handle genocide related crimes and other crimes against humanity but with nearly 120000 persons in Rwanda’s prisons accused of having organized or participated in the genocide and more than a million cases to dispense with, it soon became evident that these special chambers did not have the capacity to handle the task. Following extensive national consultations, spearheaded by the President of the Republic in 1998, Gacaca courts - based on Rwanda’s traditional dispute resolution mechanisms - were adopted as alternative to the classical judicial system. One of the principles of Gacaca Jurisdictions is to bring the accused to places where they were alleged to have committed their crimes in the presence of the accusers, witnesses and adult residents of the area. Through these sessions, attempts were made to reconstruct the genocide events in question, establish the truth pointing out the preparation and the execution of the genocide, and the identification of authors, co-authors and accomplice of the genocide and the establishment of individual responsibility. The courts are headed by elected individuals, referred to as ‘inyangamugayo’ (persons of integrity). Gacaca proceedings are also underpinned by seeking voluntary confessions by the accused, guilt pleading, repentance, forgiveness of the accused by the accusers and the community, which are all geared towards reconciliation. Gacaca courts initially did not have jurisdiction over what were classified as Category 1 genocide crimes that included the primary planners and authors of the genocide. However, having staisfcatorily completed most of the cases under them by the end of 2007, their mandate was raised to cover even category 1 crimes.
Unity and reconciliation. Following the genocide there was, arguably, nothing more urgent and challenging to the government as restoring a sense of unity in a severely divided nation. For any sustainable development and durable peace in the country, it was imperative that robust efforts be channelled towards the restoration and consolidation of national unity in Rwanda. Efforts, aimed at fostering unity and reconciliation, have been mainstreamed at all levels of government, with the Commission for Unity and Reconciliation (CNUR) taking a lead role in overseeing their implementation. The Commission has, in collaboration with different administrative entities at various levels, embarked on a concerted campaign to sensitize the population against all forms of divisions and genocide ideology. A national training centre has been established at Nkumba in Musanze district to host

Report on Collection of Existing Data
35 (274)
training programmes for several categories of the population, including local authorities, teachers, students having completed secondary schools who are admitted to university, the repatriated and infiltrators who dissociated themselves from interahamwe and ex-FAR (Forces Armees Rwandaises) the co-ordinators of unity and reconciliation and, finally, ex-prisoners etc, on the origins of genocidal ideology and the mechanisms to eradicate it :Generally, such training targets individuals deemed to have some authority or influence on the population. The youth have also been specifically targeted because they are seen as the future of this country and therefore capable of serving a pivot for sustainable unity and reconciliation in their respective areas. Indeed, there has been established Unity and Reconciliation clubs in most secondary schools across the country. There are also other associations for the promotion of unity and reconciliation in different parts of the country, which are all monitored, supported and coordinated by the CNUR.
Human rights commission. There has also been established a National Commission for Human Rights (CNDP) whose primary mandate is to promote and protects human rights in the country. The Commission discharges its responsibilities through actions of education and sensitization on human rights and receiving/addressing complaints of human rights abuse from individual citizens or groups. Like the CNUR, the key targets for CNDP’s sensitisation programmes are the local administrative authorities, students as well as inmate and released prisoners.
2.2.3 Decentralisation Devolvement of centralised power. One of the key elements of Rwanda’s governance reforms is devolving power and authority from the central to levels of government close to the population. Historically, Rwanda has been characterised by highly centralised forms of governance right, through colonial times to 1994. Successive post independence central governments tended to monopolise decision-making authority and resources so as to ensure domination over political, social and economic life of the population. While exercise of authority was top-down, accountability of the public sector was invariably upwards toward the centre, rather than to citizens and communities. Following the 1994 genocide and subsequent national introspection, the government of Rwanda decided to embark on an ambitious governance reform programme, giving greater say to common people in the management of their affairs. The National Decentralization Policy, officially adopted in May 2000, sets out a new course of citizen participation through elected organs at the local level. Hence, citizens will be able to gain access to decisions that affect them and participate in civic affairs. As clearly outlined in the decentralisation policy document, the objectives of Rwanda’s decentralisation programme are:
• promotion of community participation in the decision-making process engendered by devolving powers and resources to the local level;
• strengthening accountability and transparency by public offices and local authorities with respect to the communities they serve by establishing a clear link between taxes paid and service delivery;
• enhancing the response capacity and sensitivity of public administration to the local environment by placing the planning, financing, and management of service delivery at the delivery point;
• enhancing and sustaining local planning and management capacity as a means to promote economic development and poverty reduction; and,

Report on Collection of Existing Data
36 (274)
• strengthening the efficiency of service delivery.
Reduced number of administrative units. By the time the Government of Rwanda adopted the current National Decentralisation Policy in May 2000, the country’s administrative structure comprised of 11 prefectures including Kigali City, 106 Districts, 1545 Sectors and 9165 cells. Subsequent to the latest territorial reform in 2005, with a view to using scarce financial and human resources more efficiently, the country territory has have been restructured into 4 provinces plus Kigali city, 30 Districts, 416 Sectors and 2148 Cells.
Province de-concentrated organ. The province serves as a co-ordinating organ of the central government to ensure the efficiency in government’s planning, execution and supervision of the decentralized services. As de-concentrated bodies, the provinces are not identified as local governments. The central government retains a strong degree of authority over the provinces and the decision making remains within the same level of government.
Kigali City Council with special provincial administration. Kigali City Council (KCC) is a special kind of provincial administration. Besides undertaking strategic planning for urban development for the Kigali area, KCC also co-ordinates, monitors and evaluates development plans of local governments under its jurisdiction so as to ensure uniform development of the city. KCC is also responsible for providing services regarded as complex or cutting across jurisdictions of individual district authorities. Figure 2.1 Organisation structure of the province
Source: MINALOC website.
2.2.4 Local government Local government – districts and ‘below’. Local government structures refer to the districts, and under them, the sectors and cells. Districts have a significant level of autonomy as they prepare their own budgets and are governed by elected councils. Districts also have their own taxing powers from which they can raise revenue to

Report on Collection of Existing Data
37 (274)
supplement central government transfers. Districts are generally responsible for the overall co-ordination of economic development, and ensuring the planning, financing and implementation of service delivery at sector levels as well as promoting co-operation with other local governments. The management structure of the district is as follows.
n
and their elected council in matters pertaining to
e district ts employed in the district.
Figure 2.2 - The District organisational structure
2.2.5 District District or Akarere Council. The District Council is the policy making and legislative body at the district level. It functions as a parliament of the district through which the people, through their representatives, can exercise their decisiomaking, planning and control powers to determine the development of the district.
District Executive Committee. In its inaugural meeting, the District Council together with all the members of the Sector Executive Committees and Chairpersons of the Cell Councils constitute an electoral college to elect the chairperson of the District Council among the elected councillors of the district and four members of the Executive Committee. The Executive Committee is the day-to-day contact point between the people of the district service delivery and development.
District Executive Secretary. The head of administration at the district is the Executive Secretary. He/she heads the management and technical units of thand is the overall supervisor of the public servan
Source: MINALOC website.

Report on Collection of Existing Data
38 (274)
2.2.6 Sector Sector, Umurenge, Council. This is the political organ responsible for policy-making at the sector level. The number of Sector Council members is determined by the number of Cells forming the Sector. The Council’s functions include approval of Sector, Umurenge, plans and action programmes and ensuring the follow-up of their implementation.
Sector, Umurenge, Executive Committee. The Sector Council elects the Sector Executive Committee to support the preparation and implementation of its policies, plans, and decisions. This committee is composed of 10 members and executes the day-to-day administration of the Sector and the implements the decisions and plans of the Sector Council. The Sector Executive Committee works with the technical support of its two sub-committees: the Political and Administrative Committee (PAC) and the Community Development Committee (CDC).
Sector - main service delivery node. Sectors - and in the future cells - have been earmarked as main service delivery nodes due to their proximity to the population. Whereas districts were initially established as the focal level for service delivery, there have been consistent efforts to devolve further the fiscal and service delivery responsibilities to the sector level. The sector will, thus, increasingly shoulder the responsibility for the delivery of services, coordination and the management of several basic services such as local development planning, local tax collection, statistics, education and social affairs, land use and development planning, housing, and local infrastructures, etc. A sector is run by an executive secretary assisted by other technical and support staff.
2.2.7 Cell Finally, the cell, Akagari, is the smallest politico-administrative unit in the country and hence closest to the people. Therefore, this is the unit through which the problems, priorities and needs of the people at a grassroots level are identified and addressed. The key organisational bodies of the Cell or Akagari are outlined below.
The Cell, Akagari, Council. All citizens resident in the Cell who are aged 18 and above are members of the Cell Council. The Cell Council mobilises the residents of the Cell, identifies, discusses and prioritises the problems of Cell, and takes decisions for their resolution.
The Cell Executive Committee. The Cell Council elects the Cell Executive Committee composed of ten members. The Committee executes functions related to administration and community development, including the day-to-day administration of the Cell and the implementation of decisions taken by the Cell Council. The Cell Executive Committee works through its technical committee (the Community Development Committee) to identify and prioritise needs, design development plans, mobilise development resources and implement the plans.
2.3 The Economy
2.3.1 Vision 2020 Background. Following years of mismanagement, war and genocide, the economy of Rwanda had virtually reached total collapse by 1994. The immediate aftermath of the genocide, government’s efforts were entirely deployed in resettling displaced

Report on Collection of Existing Data
39 (274)
people and returning refugees, and effecting basic reconstruction of essential infrastructure so as to the country functioning again.
Vision 2020. As some form of stability returned, the government sought to look forward and establish long-term development plans for Rwanda. A national consultative process conducted at Village Urugwiro in 1998-9 galvanised national consensus towards a need to define the country’s future and how to get there. It was this framework that provided the basis for the formulation of the country’s Vision 2020 that is currently the guiding document for Rwanda’s development path and strategies. Overall, Vision 2020 seeks to bring about fundamental transformation of Rwanda moving it from one of the least developed countries in the world into a middle-income economy by the year 2020. In measurable terms, the country’s annual per capita income will have to rise USD 900 from USD 290 in 2000 - date of Vision adoption, the poverty rate will have to drop from 64 % in 2000 to 30 %, and the average life expectancy should rise from 49 years - in 2000 - to of 55. Vision 2020 provides more detailed development targets to be achieved by 2020 (MINECOFIN, 2000:25-6).
Six ‘pillars’. The broad agenda of the Vision 2020 is centred around six pillars clearly outlined in the Vision document as:
• reconstruction of the nation and its social capital anchored on good governance, underpinned by a capable state;
• transformation of agriculture into a productive, high value, market oriented sector, with forward linkages to other sectors;
• development of an efficient private sector spearheaded by competitiveness and entrepreneurship;
• comprehensive human resources development, encompassing education, health, and ICT skills aimed at public sector, private sector and civil society -to be integrated with demographic, health and gender issues;
• infrastructural development, entailing improved transport links, energy and water supplies and ICT networks; and,
• promotion of regional economic integration and cooperation . at all times, these will be affected by a number of cross-cutting issues including, gender equality and sustainable environmental and natural resource management (ibid:3-4).
Guide for implementation. Besides espousing aspirations shared by the people of Rwanda, Vision 2020 presents a ‘roadmap’ that will guide the implementation and eventual realisations of the set targets. A strategy for translating Vision 2020 into operational medium and short-term instruments is clearly articulated in the Vision 2020 document. It enjoins all development strategies in the country to be formulated within the Vision’s guiding framework. At the national level, some of these multi-sectoral instruments incorporate the Economic Development and Poverty Reduction Strategy (EDPRS), the National Investment Strategy (NIS) and the National Information and Communications Infrastructure (NICI) plan. National instruments, such as the EDPRS, are also to be made further made operational through medium-term sector strategies, which inform provincial and district development plans. The sector strategies and the decentralised development plans will be implemented through the Medium-Term Expenditure Framework (MTEF), ie, three-year fully
Report on Collection of Existing Data
40 (274)
integrated budgets that mainstream the Public Investment Programmes (PIP) and translate them into concrete action plans costed through annual budgets. The poverty reduction achieved through the MTEF will be monitored, and will feed back into the elaboration of sector and provincial plans.
Key assumption premises. The realisation of Vision 2020 targets is premised upon some key assumptions with regard to the macro-economic situation of Rwanda over the period leading to 2020. These assumptions can be summarised as follows:
• an average population growth rate of about 2.7 %;
• a minimum annual GDP growth rate of about 7 %; and,
• annually investment level of 30 % of GDP;
• contributions to GDP amounting to 45 %, 30 % and 37 % by agriculture, industry and services respectively up to 2010, with the latter two sectors - industry and services - taking over dominance from agriculture by 2020 when they services should be contributing 42 %, industry 26 % and agriculture 33 % of GDP;
• private investment to account for an average of 20 % of GDP and public investment 8 %; and,
• public capital expenditure is assumed to increase to RWF 605 billion (ibid, 2000).
2.3.2 Economic Development and Poverty Reduction Strategy (EDPRS) Paper Document with process-orientation. One of the key instruments in operationalising the aspirations and goals espoused by the Vision 2020 is, hence, the Economic Development and Poverty Reduction Strategy (EDPRS). EDPRS is described as both a document and a process. As a document, it sets out the Rwanda’s development objectives, priorities and major policies for the next five years, ie 2008-12. It provides a process guide for government, development partners, private sector and civil society, pointing to where the country wants to go, the means and mechanisms to get there, and how these means are to be secured (ibid, 2006).
Sustainable Growth for Jobs and Exports – first of three Programmes. EDPRS priorities are grouped into three ‘flagship’ programmes namely: Sustainable Growth for Jobs and Exports; Vision 2020 Umurenge; and, Governance. Top priority is accorded to the programme aimed at accelerating growth to create employment and generate exports. This, it is intended, will be achieved through making deliberate high quality public investments with the objective of reducing the operational costs of business. With an improved business climate, it is further expected that, the private sector will be incentivised to increase its investment rate in subsequent years. Given the demographics structure of Rwanda that shows a predominantly young population - two thirds of it is aged less than twenty-five years - expanding the job market to absorb this vast labour pool will also be an area of particular emphasis (ibid, 2007a).
Second programme. Vision 2020 Umurenge, as the second programme, will seek to accelerate the rate of poverty reduction by promoting a ‘pro-poor’ components of the national economic growth efforts. Again, this will seek to tap into Rwanda’s main resource – its human resource – by adopting strategies that release the productive capacity of the disadvantaged majority in rural areas through a combination of
Report on Collection of Existing Data
41 (274)
public works, credit packages and direct support. Vision 2020 Umurenge is, in essence, a highly decentralised integrated rural development programme designed to accelerate extreme poverty reduction in the country. It is currently being piloted in thirty of the least advantaged sectors (Imirenge) of the Rwanda (GOR, 2007).
Third programme. Finally, the third flagship, ‘Governance’ seeks to build on some of the commendable achievements of the government of Rwanda within the governance sphere such as its reputation as a country with a low incidence of, and zero toleration for corruption, to boost its profile as proffered destination of international investment. Rwanda has already demonstrated its ability to come up with innovative home-grown mechanisms to deal with governance issues such as conflict resolution, unity and reconciliation and is investing significantly in developing a regional comparative advantage in ‘soft infrastructure’, that is, those aspects of governance, such as well-defined property rights, efficient public administration, transparency and accountability in fiscal and regulatory matters (ibid). Box 2.4 - Sector strategies
Settlement pattern planning tools to be developed – a possible task for the present project. EDPRS also examines different sectors and offers strategies on how these can be developed into a holistic goal of meeting the Vision 2020 aspirations. For instance, in the environmental and land sector, the priorities defined include protecting existing ecosystems and rehabilitating those that are degraded, paying special attention to sustainable land tenure security through the planning and management of land registration and rational land use, soil and water conservation, reforestation, preservation of biological diversity and adaptation and mitigation against impacts of climate change. In the habitat sub-sector, it is proposed that planning tools for restructuring the Rwanda’s settlement patterns should be developed, and so should master plans for new urban residential zones and Imidugudu sites. EDPRS also incorporates a number of cross-cutting issues (CCIs) which include gender, HIV, the environment, social inclusion and youth. Wherever possible, issues relating to CCIs have been integrated into the discussion of sectoral policies and programmes (MINECOFIN, 2007.a).
Estimated implementation costs. The cost of implementing the EDPRS is estimated at RWF 5151 billion over the five years 2008-12. This amount includes public recurrent expenditure, public capital expenditure and private investment. The public component amounts to RWF 3434 billion, representing two-thirds of the total cost. The extra public financing requirement is RWF 352 billion, equivalent to USD 700 million over 2008-12, or an average of USD 140 million per year (MINECOFIN, 2007).
2.3.3 Economic performance Recovering growth rate. Following the immediate post-genocide emergency and recovery phase, Rwanda has recorded significant economic growth and modest but important rates of poverty reduction. Between 1996 and 2000, high rates of economic growth were recorded, averaging about 10% per annum. This was in part a reflection of the deep abyss from which the economy was recovering. This pattern of growth slowed down to 0.3 % in 2003, reflecting adverse weather conditions and unfavourable terms of trade for agricultural produce such as coffee and tea, before recovering to about 4.0% in 2004. However, GDP has been growing at an average rate of 6 % over the last three years and Government has set an ambitious target of 7.2 % for 2008-9. The key factors in the economic growth are increase in private

Report on Collection of Existing Data
42 (274)
consumption and rise in the contribution of the service sector to the economy. Despite the impressive expansion of the service sector, agriculture remains an important component of the country’s GDP and the largest employer of Rwandans (Table 2.1, below) Table 2.1- Real growth rate trends by activities (5-year averages in percent)
Share of total GDP (%)
Average annual growth (%)
Activity
1996-2000
2001-2006
1996-2000
2001-2006
Gross Domestic Product (GDP) 100.0 100.0 10.8 6.4
Agriculture 37.7 36.4 9.5 4.8
Food crop 31.9 31.4 9.9 5.1
Export Crop 1.0 1.1 11.7 6.3
Livestock 3.0 2.2 7.8 3.5
Forestry 1.5 1.3 10.7 3.7
Fisheries 0.3 0.4 29.9 3.7
Industry 15.1 14.2 7.5 8.1
Mining and quarrying 0.3 0.6 24.5 41.3
Manufacturing 8.2 6.8 4.1 6.0
Of which: Food 1.5 1.7 8.1 9.1
Beverages, tobacco 4.2 2.5 -4.4 4.6
Others 2.4 2.7 19.5 6.5
Electricity, gas, water 0.6 0.5 11.3 4.2
Construction 6.0 6.3 11.9 9.6
Services 41.9 43.8 11.7 7.4
Wholesale & retail trade 10.7 9.7 2.2 6.0
Hotels and restaurants 0.8 0.9 25.2 6.6
Transport, storage, communication 4.8 6.0 15.5 9.4
Finance, insurance 2.6 3.5 17.7 13.3
Real estate, business services 10.3 9.6 11.2 5.0
Public administration, education, health 12.4 13.2 21.0 7.9
Other personal services 0.3 0.9 141.2 12.1
Adjustments 5.4 5.7 38.5 5.6
Less: Imputed bank service charge -1.6 -1.7 4.7 9.6
Plus: VAT and other taxes on products 7.0 7.4 23.4 6.4
Source: National Institute of Statistics data, extracted from EDPRS, MINECOFIN, 2007:6.
Report on Collection of Existing Data
43 (274)
Agriculture still dominating. In 2006, agriculture was the major contributor to GDP, at 43.2 %, and the main source of livelihood for 90 % of the population. The share of industry is growing - 20.5 % in 2006 compared with 16 % in 2000 - and the tertiary sector contributes 37.2 %. Services, construction and mining are strong performers and are driving economic growth. However, given constraints including high electricity prices and uncertain electricity supply, the manufacturing sector is faced with strong competition from other countries of the region. Structural reforms in the tea and coffee sectors are expected to lead to increased investment and production, and it is hoped that quality improvements will stimulate exports (ibid, 2007).
Improvement in fiscal performance. The government’s economic policies and fiscal management is a significant contributor to experienced continued economic growth. Over the past seven years, there has been marked improvement in fiscal performance, with revenue collection growing to around 13 % of GDP in 2006. Rwanda has also benefited from both the Heavily Indebted Poor Country (HIPC) and Multilateral Debt Relief (MDR) initiatives resulting in a sustainable debt position, in which the net present value of debt to export ratio is less than 60 %. The use of both the internally generated revenues and those supplied by international development partners through these relieves and general budget support has been increasingly more effective in targeting the needs that are considered ‘pro-poor’ (ibid). Box 2.5 – Trade deficit
Widening gap between imports and exports In terms of trade, Rwanda still has considerable deficit despite a steady rise of exports, growing at an average annual rate of 12.5 % since 2001. The deficit owes in part to imports of capital goods and fuel coupled with increased public expenditures because of the Government’s commitment to investing against poverty, mainly in infrastructure. The Monetary policy implementation is improving steadily and helping to contain inflation at its current level of 7.5 % per annum. The country’s key export earners are coffee, tourism and tea, accounting for 60 % of the USD 152 million earned in 2005. Despite the noted rise in exports, the expenditure on imports has been much higher given the high capital requirements necessary at this stage of Rwanda’s development trajectory. Indeed, imports have been increasing at an average annual rate of 1 5% over the same period, resulting in the widening of the national trade deficit as a percentage of GDP from 8 % in 2001 to 12 % in 2006 (ibid).
Land related reasons for reduction in agricultural production as GDP contribution. Whereas government efforts at diversifying the export product base seems to be paying dividends, as reflected by, for instance, increased revenues from the tourism sector - rising from USD 5 million in 2002 to USD 33 million in 2006 - efforts to increase production in the traditional sectors such as agriculture need to be strengthened. The reduction in contribution to national GDP by the agriculture sector has been attributed to a number of land related factors, including scarcity, fragmentation, degradation, poorly defined administration system and ill-suited settlement patterns in rural areas. There are also issues of low farming technology, poor infrastructure and inadequate human and physical capital in rural areas (ibid).
2.3.4 Economic growth and general poverty reduction but widening inequality More than one third below extreme poverty line. Analyses from EICV studies undertaken in 2000-1 and 2005-6 reflect a modest decline in the incidence of consumption poverty both Rwanda’s rural and urban (Table 2.2, below). The Rates of poverty reduction recorded over the five-year period covered by the survey are

Report on Collection of Existing Data
44 (274)
not deemed fast enough to meet either the targets set in Vision 2020 or MDG. More than one third of the population is classified as falling below the extreme poverty line, defined as the level of expenditure needed to provide minimum food requirements of 2100 kcal per adult per day. The surveys also identified an upper poverty line referring to inability to meet other non-food basic requirements and over half of country’s population falls below this line (ibid, 2007.b). Table 2.2 - Poverty headcount (share of population and number)
Poverty headcount (share of population)
Number of poor (millions)
Type of poverty
EICV1 EICV2 EICV1 EICV2
Upper poverty line
Kigali 16.1% 13.0% 0.11 0.09
Other urban 46.5% 41.5% 0.29 0.36
Rural 66.1% 62.5% 4.43 4.93
National 60.4% 56.9% 4.82 5.38
Extreme poverty line
Kigali 8.4% 6.3% 0.06 0.04
Other urban 28.5% 25.3% 0.18 0.22
Rural 45.7% 40.9% 3.06 3.23
National 41.3% 36.9% 3.30 3.49
Source: NISR, 2006.
Provincial differences in poverty trends. A comparison of consumption-related poverty trends 2000-6 by province indicates significant differences, with rapid poverty reduction in the Eastern Province in contrast to stagnating and rising poverty in the Southern Province and marginal declines in. the Northern Province and in the City of Kigali. Calculations show that 68 % (MINECOFIN, 2007.b) of the total reduction of poverty in the country over the period in question was accounted for by poverty reduction in Eastern Province. The positive trends in the Eastern province may due to several reasons, including poor initial conditions due to the severe drought experienced in the region in 2000-1, the fast growth of cereals over the period, trade with neighbouring countries and low population density (Figure 2.3, below).
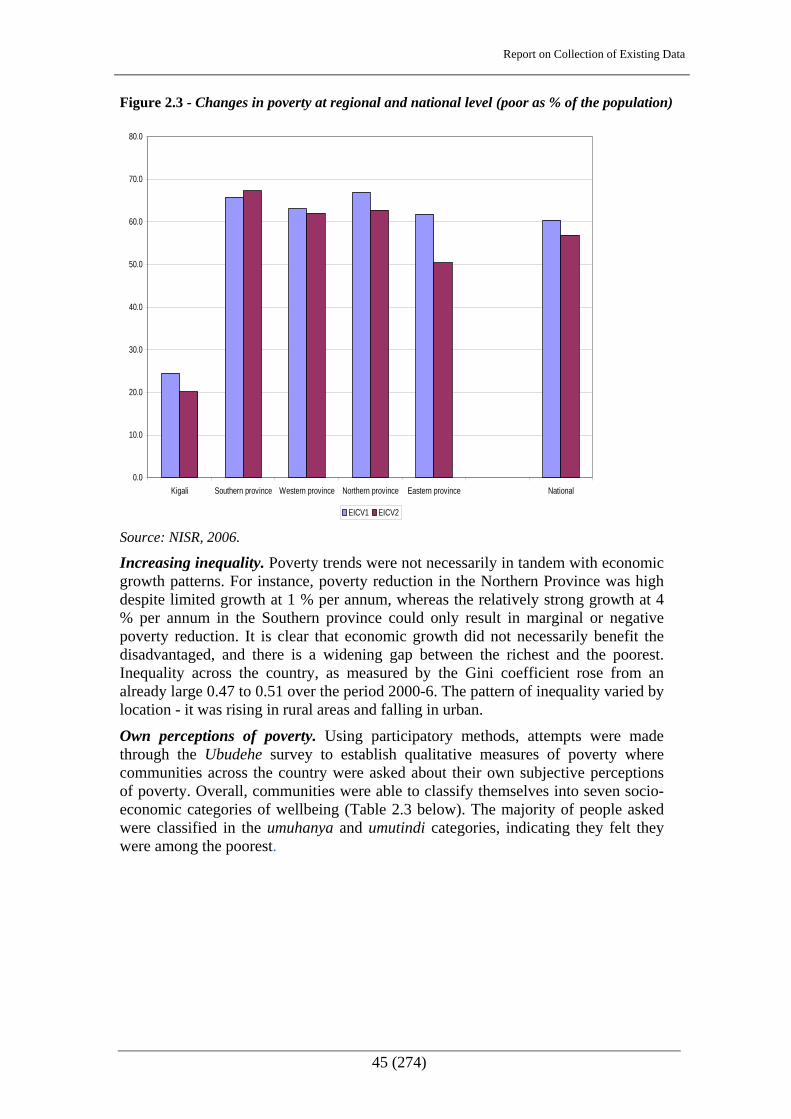
Report on Collection of Existing Data
45 (274)
Figure 2.3 - Changes in poverty at regional and national level (poor as % of the population)
0.0
10.0
20.0
30.0
40.0
50.0
60.0
70.0
80.0
Kigali Southern province Western province Northern province Eastern province National
EICV1 EICV2
Source: NISR, 2006. Increasing inequality. Poverty trends were not necessarily in tandem with economic growth patterns. For instance, poverty reduction in the Northern Province was high despite limited growth at 1 % per annum, whereas the relatively strong growth at 4 % per annum in the Southern province could only result in marginal or negative poverty reduction. It is clear that economic growth did not necessarily benefit the disadvantaged, and there is a widening gap between the richest and the poorest. Inequality across the country, as measured by the Gini coefficient rose from an already large 0.47 to 0.51 over the period 2000-6. The pattern of inequality varied by location - it was rising in rural areas and falling in urban.
Own perceptions of poverty. Using participatory methods, attempts were made through the Ubudehe survey to establish qualitative measures of poverty where communities across the country were asked about their own subjective perceptions of poverty. Overall, communities were able to classify themselves into seven socio-economic categories of wellbeing (Table 2.3 below). The majority of people asked were classified in the umuhanya and umutindi categories, indicating they felt they were among the poorest.

Report on Collection of Existing Data
46 (274)
Table 2.3 - Wellbeing self-ranking or categorisation
Perceived poverty classification
Share of respondents (%)
Destitute, Umuhanya 18.0
Poorest, Umutindi nyakujya 52.5
Poorer, Umutindi 9.8
Poor, Umukene 7.1
Vulnerable, Utishoboye 4.8
Surviving, umukene wifashije 1.1
Others, Abandi 6.8
Total 100.0
Source: MINECOFIN, 2007..
Percieved land related reasons for experienced poverty. Major perceived causes of poverty identified by the Ubudehe survey respondents were lack of land, poor soils, unpredictable weather and lack of livestock (Table 2.4, below). Exit strategies out of poverty were identified as paid employment, commerce and livestock. Over half of the households sampled felt that their income or livelihood had not improved in the past three years. Principal activities to be undertaken in future Ubudehe work were identified in the areas of as livestock rearing, agriculture, small business, water and roads. Table 2.4 - Major perceived causes of poverty
Cause Share of respondents (%)
Lack of land (Kutagira isambu) 49.5
Poor soils (Ubutaka butera) 10.9
Drought/weather (Izuba ryinshi) 8.7
Lack of livestock (Kutagira itungo) 6.5
Ignorance (Ubujiji) 4.3
Inadequate infrastructure (Ibikorwa remezo bidahagije) 3.0
Inadequate technology (Ikoranabuhanga ridahagije) 1.7
Sickness (Uburwayi) 1.7
Polygamy (Ubuharike) 1.2
Lack of access to water (Kubura amazi) 1.1
Population pressure (Ubwiyongere bw'abaturage) 0.7
Others(Izindi) 10.6
Total 100.0
Source: MINECOFIN, 2007.

Report on Collection of Existing Data
47 (274)
Poverty highest in cases of agricultural wage labour. Evidence from the EICV survey shows that the incidence of poverty is highest in households whose main source of income is agricultural wage labour. In 2005-6, 91 % of such households lived below the poverty line, which is a similar proportion to that in 2000-1. Households, which depend on combining self-employment in agriculture with agricultural wage labour, are not much better off, as 82 % of this group live in poverty. This is a cause for concern because the proportion of individuals aged 15 and above whose main job is agricultural wage labour doubled from 4 % in 2000-1 to 8 % in 2005-6. Such development reflects the acute shortage of land in many areas and the lack of rural non-farm employment opportunities. This occupational group is likely to continue increasing its share of the agricultural labour force in the medium term (ibid).
2.4 Physical Geography
2.4.1 Relief Mille Collines. Rwanda has been described as the country of ‘a thousand hills’ because of the numerous highly dissected hills, often with flat peaks and convex slopes, separated by relatively narrow valleys covered with alluvium matter. The average altitude is 1250 m above sea level. The country’s relief presents varieties. From east to west, the altitude varies between 1000-4500 m. The setting of this relief is composed mainly in the east by lowlands; in the centre by hills and in the west by high mountains (Figure 2.4, below).
The Congo-Nile Ridge. This is a range of mountains, with an altitude ranging between 2500-3000 m. Overhanging Lake Kivu, it divides Rwanda’s waters in two parts: those which flow into the Congo basin in the west; and, those which flow into the Nile in the east. The Congo-Nile Ridge is dominated in the north-west by the volcanoes range, which consists of five massifs, the highest of which is Kalisimbi with an altitude of 4507 m.
The Central Plateau. With an altitude ranging between 2000-1500 m, the central plateau’s relief is made of hills with tops that are sometimes stretched, sometimes round, separated by deep valleys of 50-15 m, often filled up with alluvial deposits.
The lowlands of the East. The lowlands are dominated by a depression of the relief, generally undulating between 1500-1100 m of altitude.
The lowlands of the South West in the plain of Bugarama. This is part of a tectonic depression of the African Rift, and it has an altitude of 900 m.
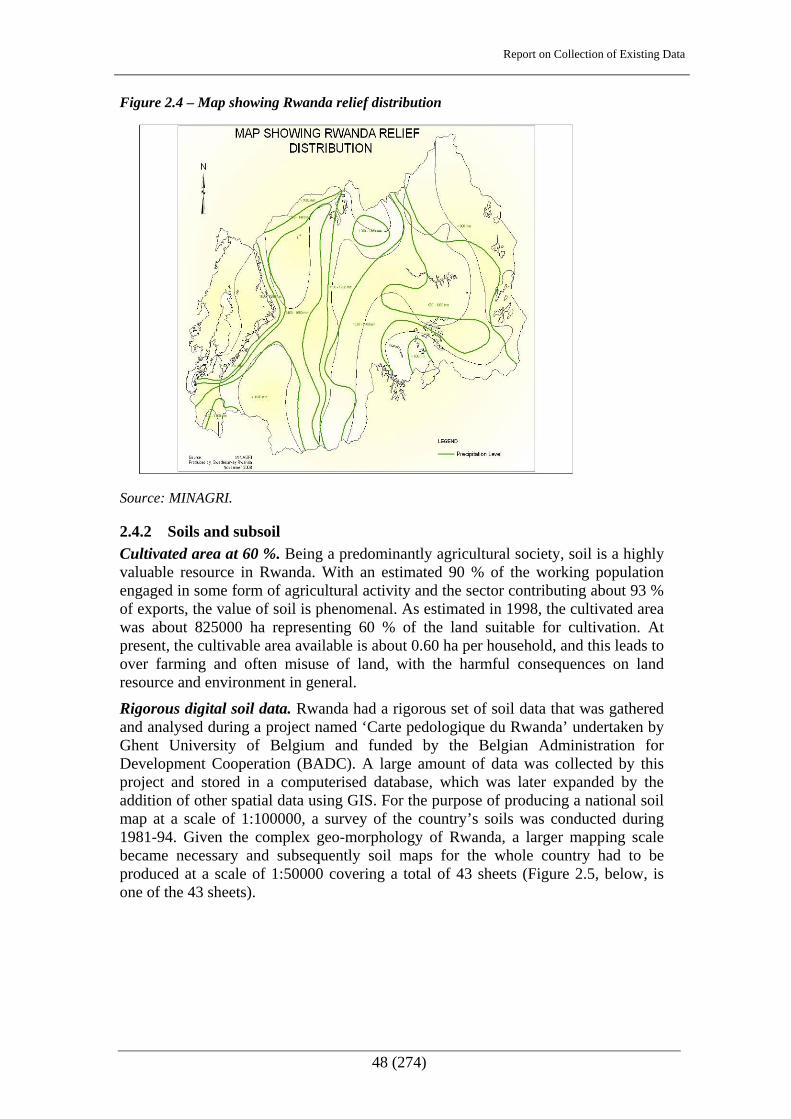
Report on Collection of Existing Data
48 (274)
Figure 2.4 – Map showing Rwanda relief distribution
Source: MINAGRI.
2.4.2 Soils and subsoil Cultivated area at 60 %. Being a predominantly agricultural society, soil is a highly valuable resource in Rwanda. With an estimated 90 % of the working population engaged in some form of agricultural activity and the sector contributing about 93 % of exports, the value of soil is phenomenal. As estimated in 1998, the cultivated area was about 825000 ha representing 60 % of the land suitable for cultivation. At present, the cultivable area available is about 0.60 ha per household, and this leads to over farming and often misuse of land, with the harmful consequences on land resource and environment in general.
Rigorous digital soil data. Rwanda had a rigorous set of soil data that was gathered and analysed during a project named ‘Carte pedologique du Rwanda’ undertaken by Ghent University of Belgium and funded by the Belgian Administration for Development Cooperation (BADC). A large amount of data was collected by this project and stored in a computerised database, which was later expanded by the addition of other spatial data using GIS. For the purpose of producing a national soil map at a scale of 1:100000, a survey of the country’s soils was conducted during 1981-94. Given the complex geo-morphology of Rwanda, a larger mapping scale became necessary and subsequently soil maps for the whole country had to be produced at a scale of 1:50000 covering a total of 43 sheets (Figure 2.5, below, is one of the 43 sheets).

Report on Collection of Existing Data
49 (274)
Figure 2.5 – Carte pédologique du Rwanda
Source: MINAGRI.
Six types of soil. The physical properties that characterise soil vary with underlying parent material that weathers into mineral soil upon the impact of climatic elements such as temperature and rainfall. Rwanda’s pedology is characterised by six types of soil:
• about 50% are said to derive from schistose, sandstone and quartzite formations;
• 20 % of soils in the country derive from granite and gneissic formations - this is especially important in the north-eastern savannah and the agricultural zone of the granitic ridge;
• soils derived from intrusive basic rocks cover close to 10 % of the national territory;
• soils derived from recent volcanic materials also occupy about 10 % of the territory;
• soils derived from old volcanic materials, cover about 4 % of the territory; and,
• alluvial and colluvial soils, features of marshes in Rwanda, occupy 6 % of the territory.
Varying soil development status. The soil development stage also varies across the country. In 33 % of the soils, a well-developed argillic horizon has been recorded. It is the dominant stage found in the western and north-central part of the country. In the east and in the old volcanic region, most soils are characterised by an intergrade between argillic and oxic horizon, covering 19 % of the area. In the north-east, in the east near Akagera River and in Bugesera, ultimate weathering has resulted in the formation of oxic horizons. The valleys of these regions are frequently filled with

Report on Collection of Existing Data
50 (274)
strongly decomposed organic material or with soil showing vertic properties, occupying 3 % and 2% of the country, respectively (Figure 2.6, below). Figure 2.6 - Soil texture classes of dominant soil units in Rwanda
Source: MINAGRI Website
Soil depth. The Carte pedologique du Rwanda soil survey, was also able to investigate soil depth and texture, establishing five major soil texture categories that range from fine clay soils to sandy soils. Soils developing on granite or shale intervened by quartzite are loamy and generally have a clay content between 20-35%. This texture applies to 17 % of Rwanda’s surface area. Very clayey soils are developing on the old volcanic materials, whereas the vertisols of the eastern valleys are characterised by clay content over 60 % - together they cover 10 % of the country’s territory. In terms of depth, 66 % of the soils in Rwanda are deeper than 1 m. In steep sloping areas, on quartzite, granite or volcanic materials, soil depth can be between 0.5-1 m (15%) or even shallower (25%). In 19 % of the soils, soil depth is limited by the presence of stones and gravel of different origin. For instance, volacanic ejecta limit the soil depth in the Virunga, whereas laterite is frequently found in the strongly weathered soils of the east. In addition to high volumes of coarse fragments, soil depth can also be limited by the presence of a lithic, paralithic or petroferric contact. Shallow lithic or paralithic contacts are frequently found in the steeply sloping areas of the quartzite ridges and occupy 22 % of Rwanda’s surface area (Figure 2.7, below).

Report on Collection of Existing Data
51 (274)
Figure 2.7 - Soil depth classes of dominant soil units in Rwanda
Source: MINAGRI Website
Soil drainage. As far as drainage is concerned, the soils in Rwanda are generally well to excessively drained in most, ie 95 %, parts of the country. The valley soils are moderately to imperfectly drained, representing 2 % of Rwanda, but sometimes the drainage is even worse, resulting in poorly drained soils, found in 4% of the country’s land area (Figure 2.8, below). Figure 2.8 - Drainage classes of dominant soil units in Rwanda
Source: MINAGRI Website (http://www.minagri.gov.rw).

Report on Collection of Existing Data
52 (274)
Subsoil minerals. Rwanda’s subsoil contains deposits of ore such as tin ore, wolfram, colombo-tentalite, gold, all of which are exploited on a small-scale. The country also has industrial minerals and materials for building, which are also exploited using traditional methods. From 1999 to 2001, minerals played an important role in Rwanda’s export earnings in the following proportions: 1999 - 5.9 %; 2000 - 12.58%; 2001 - 42.64%. In 2001, mineral exports took the second position after coffee.
2.4.3 Weather and climate Records of meteorological observations. Weather and climate are atmospheric conditions that affect the day to day activities of humankind and contribute to socio-economic development activities. Meteorological observations commenced in earnest around 1873 but for Rwanda they started around 1906 at Save, in Butare. By 1930, there were about 40 meteorological stations in the country but these were damaged by the 1959 upheavals. Rehabilitation work on some of the destroyed stations was undertaken between 1962 and 1970 with additional stations for collecting rainfall and temperature data established. In addition to these stations, conspectus stations with the ability to collect all atmospheric parameters on a 24 h-day basis were constructed 1967-95. It was not until 1988 that agro- meteorological stations were established. By time of the genocide in 1994 Rwanda had more than 150 meteorological stations of which five were conspectus, 139 climatological while six were agro- meteorological stations. However, the war destroyed more than 80 % of the stations and personnel. Despite recent efforts to rehabilitate some of the stations, their ability to function is severely hampered by lack of qualified personnel (Table 2.5, below). Table 2.5 - Meteorological stations
Year Type of station
1994 (pre-genocide) 2002
Climatological stations 139 10
Conspectus stations 5 3
Agro-Meteorological stations 6 1
Total 150 14
Systematic analysis of climatic data. Besides the routine data collected by the national meteorological department, there was an attempt by the national soil survey project, executed by Ghent University, to undertake a systematic analysis of climatic data. Suring the survey, a time series of monthly climatic data recorded between 1973 and 1989 in 197 meteorological stations was gathered. Temperature and humidity was measured in part of them while the values for the other stations were estimated through a correlation with altitude. Recently the data has been extended with data from the meteorological service in Kigali. This database contained daily temperature, rainfall, relative humidity, sunshine duration, wind direction and wind speed data, recorded in different meteorological stations over a time period varying from a few years to several decades, depending on the station.

Report on Collection of Existing Data
53 (274)
Temperate, continental, tropical climate. As a general description, despite located close to the equator, Rwanda’s climate is not the typical hot and humid equatorial climate associated with the region and this is primarily due to moderation arising from its high altitude. The country enjoys a temperate continental tropical climate characterised by relatively stable and consistent temperature and rainfall patterns. The average temperature ranges 16°-17°C in the high altitude region to the Northwest of the country, 18°-21°C in the Central Plateau, and 20°-24°C in the lowlands of the East and West. It is generally estimated that temperature changes by 0.5°C for every 100 m change in altitude. Besides spatial stability across the country, there are also limited temporal variations, with daily temperature minima ranging 16.2-17.6°C while the daily maxima varies 27.3-31.0°C (Figure 2.9, below). Figure 2.9 – Map showing Rwanda temperature distribution
Source: MINAGRI.
Dry and wet seasons have been less predictable. The amount of rainfall received annually has in the past been relatively stable, but the pattern has been more erratic in the past few years. In general, there are notable variations in the annual rainfall received across the four relief regions. On average annual rainfall across the country varies between 700-1400 mm in the lowlands of the east and west, between 1200-1400 mm in the Central Plateau, and between 1400-2000 mm in the high altitude region. Two rainy seasons peaking around April and November, alternating with two dry seasons, can be distinguished. The main rainy season falls between March-May whereas an extended dry season stretches between June-September. Perhaps, due to effects of global warming, the dry and wet seasons have been less predictable, with the country experiencing increasingly long periods of drought particularly in the regions of Bugesera, Mayaga and Umutara in the Eastern Province. The effects of extended dry weather were particularly felt in 2003 when water levels in major lakes

Report on Collection of Existing Data
54 (274)
and rivers went precariously low affecting not only agriculture but also hydro-power generation both in Rwanda and neighbouring countries. Figure 2.10 – Map showing Rwanda climate
Source: MINAGRI.
2.4.4 Hydrography System split into two by Congo-Nile ridge. Whereas Rwanda is known more for its numerous hills, the country is also endowed with a generous water system consisting of an extensive network of rivers, lakes and wetlands. The country’s hydro-graphic system is split into two by the Congo-Nile ridge, with water systems to the west of the ridge flowing into the Congo basin, whereas those to the east of ridge pour into the Nile basin. Of the two hydrographic sub-systems, the Nile-basin covers the greatest part of the country and includes some of the country’s major river systems. Most rivers such as Nyabarongo, Akanyaru, and Akagera, with their numerous tributaries, are part of this sub-system together with numerous lakes such as Rweru, Cyohoha, Ihema and Muhazi. These rivers are also closely associated with vast marshes and numerous shallow lakes. The Congo basin generally consists of less significant and short rivers, which flow into Lake Kivu. The main outflow of this sub-sytem is into the Rusizi river, which flows into Lake Kivu. Its principal tributary, the Ruhwa, marks the border between Rwanda and Burundi in the western part of their common border, whereas the Sebeya in the north flows into Lake Kivu at Gisenyi (Figure 2.11 below).

Report on Collection of Existing Data
55 (274)
Figure 2.11 - Rainfall distribution in Rwanda
Source: MINAGRI Website.
Ground water. Ground water in Rwanda is primarily within the vast alluvial aquifers adjacent to major rivers. Lesser amounts of ground water can be found within the fractured bedrock of porous volcanic rock. It has been estimated that the total ground water resources of Rwanda have a renewable extraction rate of approximately 66 m3 per second, with a total existing yield of all sources.
2.4.5 Land cover Vegetation. The importance of vegetation attributes are manifested in their contribution to the national economy and well-being of the citizens. In Rwanda the livestock and wildlife industries are based on the use of vegetation, which covers most of the country’s landscapes, land units and forms. They provide grazing resources, food and energy sources besides offering protection against elements of soil erosion. Vegetation cover also significantly improves micro-climates in areas that are forested through increased rainfall – this is the case in areas around Nyungwe forest and the Volcanoes.
Varying land cover. Rwanda’s land cover varies according to the relief and the distribution of rainfall, ranging from the dense forests to the west and north-west to the semi-arid savannah lowlands of the east. According to Verdoot and van Ranst (2003), the vegetation can best be characterised as a regional mosaic, including sections of Guineo-Congolian and Sudanian vegetation. The Congo-Nil ridge is generally covered by mountainous tropical forests, whereas the central plateau and east and west lowlands of the country are characterised by what may be called East African bush land of varying density. Invariably, natural vegetation, outside the protected areas such as national parks, has increasingly been replaced or modified by human activity, with both positive and negative outcomes. For instance, whereas human activity has encroached upon some of the natural forests, there have been positive afforestation efforts in some parts of the country.
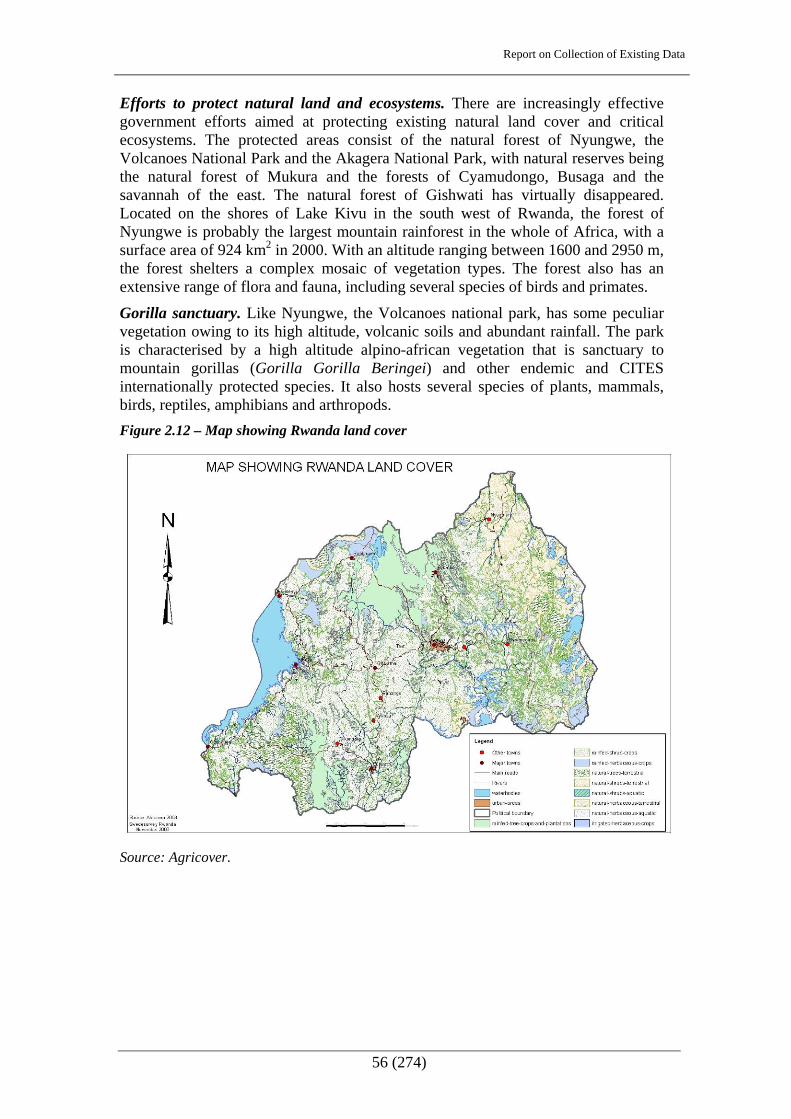
Report on Collection of Existing Data
56 (274)
Efforts to protect natural land and ecosystems. There are increasingly effective government efforts aimed at protecting existing natural land cover and critical ecosystems. The protected areas consist of the natural forest of Nyungwe, the Volcanoes National Park and the Akagera National Park, with natural reserves being the natural forest of Mukura and the forests of Cyamudongo, Busaga and the savannah of the east. The natural forest of Gishwati has virtually disappeared. Located on the shores of Lake Kivu in the south west of Rwanda, the forest of Nyungwe is probably the largest mountain rainforest in the whole of Africa, with a surface area of 924 km2 in 2000. With an altitude ranging between 1600 and 2950 m, the forest shelters a complex mosaic of vegetation types. The forest also has an extensive range of flora and fauna, including several species of birds and primates.
Gorilla sanctuary. Like Nyungwe, the Volcanoes national park, has some peculiar vegetation owing to its high altitude, volcanic soils and abundant rainfall. The park is characterised by a high altitude alpino-african vegetation that is sanctuary to mountain gorillas (Gorilla Gorilla Beringei) and other endemic and CITES internationally protected species. It also hosts several species of plants, mammals, birds, reptiles, amphibians and arthropods. Figure 2.12 – Map showing Rwanda land cover
Source: Agricover.

Report on Collection of Existing Data
57 (274)
2.5 Demography
2.5.1 Introduction Population, resources and productivity for development. One of the critical factors in the development of a country is the level of productivity and dependency ratios of the population. Aware of this crucial to national development, the government of Rwanda has, over the years, attempted to devise strategies aimed at striking an optimum balance between population growth and available resources, and link them with productivity. One notable early initiative was the family planning campaign started in 1980, which provided training to family planning mobilisers or communicators - locally referred to as abakangurambaga - and improved access to family planning services across the country. The scope of this initiative was expanded in 1990 to incorporate measures aimed at reducing fertility rates through behavioural change. These measures included promotion of women education, public health improvements, employment and general advancement of women.
Population policy towards slowing growth. Post genocide population policy has sought to make more specific links between population growth, national development and quality of life. Whereas during the immediate post-genocide years, there was no formally constituted population policy, there were concerted attempts to make the measures aimed at curbing population growth that was part and parcel of the then foremost concern of rehabilitation and resettlement of internally displaced people and returning refugees. A new national population policy that was finalised in 2003 places emphasis on the quality of life by providing strategies for influencing fertility and mortality as well as addressing the linkages between population growth and socio-economic factors. The policy’s main thrust focuses on slowing demographic growth and relating this to broader issues of sustainable natural resources management, food safety, equal opportunity and participation by both men and women in national development. This approach is reflected in one of the four stated priorities of the Economic Development and Poverty Reduction Strategy (EDPRS), which is “…to slow down population growth through reducing infant mortality; family planning and education outreach programmes, while also improving the quality of health care and schooling, particularly for girls.” (MINECOFIN, 2007:28). EDPRS specifically aims to reduce total fertility rates from 6.1 to 4.5 children per woman (ibid).
2.5.2 Population statistics High population growth rate. The most recent comprehensive population and housing census was conducted in 2002, although other studies and sample surveys have been conducted since to give a more up-to-date picture of the population dynamics. Some useful baseline studies are currently underway, but the next national population and housing census is due in 2012. According to the 2002 census, the population of Rwanda was 8128553 people (MINECOFIN, 2003:3), but recent estimates put the figure at about 9.05 million. The current population growth rate, estimated at around 3 %, is greater than the 2.6 % projected by the census, and this is the same with the fertility rate. It was projected to be 5.9 % as compared to current estimates of 6.1 %. The rate of population increase had significantly declined, however, from 3.1 %, during the inter-census period 1978-91, to 1.2 % between 1991-2002 (NISR, 2006:3). The sharp decline could be partly attributed to the loss of about 1 million people in the 1994 genocide, although it would appear that this
Report on Collection of Existing Data
58 (274)
effect was gradually offset by the post genocide return of more than one million Rwandans who had been living in exile in neighbouring countries since the 1959 civil strife.
As far as household size and composition are concerned, the Demographic and Health Survey 2005 estimates the average household size in Rwanda to be 4.6 persons, varying from 4.5 in rural areas to about 4.8 in urban areas. It is also estimated that 66 % of Rwandan households are male-headed, whereas 34% are female-headed. The female-headed households are shown to have increased from 21 % in 1992 to 34 % in 2005. Again, this is partly attributable to the effects of the 1994 genocide.
2.5.3 Temporal demographic trends No shift towards growth rate reduction. As indicated above, despite government efforts to reduce population growth, there has been moderate success. The currently estimated population growth rate of 3 % is likely to be unsustainable and so is the fertility rate. The fertility of Rwandan women remains high, with women having an average of 6.1 children by the end of their childbearing years. Disaggregated into rural and urban categories, the fertility levels in urban areas are about 4.9 % and 6.3 % in rural areas with infant mortality rate higher in rural areas. This was the same level of fertility recorded in the 1992 Demographic and Health Survey, signifying no shift at all over the 13 years between the two surveys. Levels of primary infertility in Rwanda have also consistently remained at a low level and were estimated to be 1.2 % by the 2005 Demographic and Health Survey.
Low and reduced level of contraception. To partly explain the unabating fertility levels, the findings of the 2005 Demographic and Health Survey on knowledge and use of contraception are instructive. It was found out that whereas nearly all women and men know of a modern contraceptive method, only 10 % of the women between the ages of 15-49, married or unmarried but sexually active, used any contraceptive method at the time of the survey; 6 % were using a modern method, with 4 % using a traditional method. The level of contraceptive use had, surprisingly, gone down from the 13 % recorded in the 1992 Demographic and Health Survey to 10 % in 2005 (NISR, 2006:55). To try and assess the level of contraceptive use at any time in the women’s reproductive life other than the just looking at the time of survey, women were asked whether they had ever used any method of contraception. The results are tabulated below and whereas they are not any better, there is evidence of intermittent use of contraception. It would be interesting to find out why this is the case if sustained use is to be made a reality.

Report on Collection of Existing Data
59 (274)
Table 2.6 – Ever used any method of contraception (% of method)
Age group Any method Modern method Traditional method
15-19 1.3 1.2 0.3
20-24 12.3 7.8 6.7
25-29 27.3 19.3 14.3
30-34 33.1 22.3 17.9
35-39 36.6 25.7 17.9
40-44 36.3 27.5 14.8
45-49 34.2 25.8 15.6
50-54 21.4 15.2 10.5
Source: NISR, 2006:53.
Majority to use contraception. Given the relative widespread awareness of contraception and the apparent willingness of most women to use them, improved access may help the current dismal levels of contraceptive use. The Demographic and Health Survey 2005 indicates that among the women who were not using contraception at the time of the survey 59 % stated that they intended to use a contraceptive method in the future. 7 % were not sure and 34 % had no intention of using contraception. The reasons given by those who do not plan to use contraception in future may guide the development of an effective family planning marketing strategies. These reasons included: fertility/infertility related reasons such as infrequent sex/no sex; menopause; the desire to have as many children as possible and low fertility (44 %); opposed to contraception mainly because of religious or cultural reasons (22 %); health concerns and fear of side effects (22 %); and, lack of knowledge (2 %) (ibid).
Education and fertility rate. The level of education of women is also a key factor in family planning and birth control as it has been shown to be inversely correlated to the total fertility rate of a woman. In Rwanda, the total fertility rate among women with no education is 6.9 %, dropping to 6.1 % for those with primary education and 4.3 amongst women with secondary or higher education (ibid).
2.5.4 Spatial and gender analysis of population trends Highest population density in Africa. Given the small surface area of Rwanda and the continued population growth, the country’s density has been steadily rising from 191 persons per km2 in 1978 to 283 in 1991 and 321 in 2002 (NISR, 2006:3). Rwanda currently has the highest population density in Africa. The distribution of the population is such that the highest densities are in the north and north-west, ie Ruhengeri-Gisenyi area, whereas the lowest are in the Eastern Province in areas bordering the Akagera National park. As far as the rural-urban divide is concerned, the Rwandan population is largely rural, with about 83.1 % of the population residing in the countryside in 2002. The urban population was projected to rise from 16 % in 2002 to 19.8 % in 2007. Detailed analysis of the spatial distribution of the population is not only complicated by the changes in administrative units engendered by several rounds of local administration reforms, but is also affected by the population displacements arising from the 1994 genocide. The latter entailed

Report on Collection of Existing Data
60 (274)
resettlement of returning refugees and problems of insecurity in some parts of the country that persisted for several years after the genocide (ibid).
High dependency ratios. As far as population structure is concerned, the Rwanda population is generally young with high dependency ratios. According to the 2002 census, more than two-thirds (67 %) of the population were under the age of 20. Recent estimates show that this trend is continuing with under 5s constituting 16.3 % of the population and under 15s making up 55.2 %. Only 2.7 % are over 65 years of age (NISR, 2008). Regarding gender, females are in the majority, constituting 52 % of the population, with males at 48 %. Table 2.7 - Population structure
Age group Male Female Urban Rural Total
0-4 655090 665141 194051 1126180 1320231
5-9 563351 577688 157009 984030 1141039
10-14 536876 558349 149787 945438 1095225
15-19 526563 552276 184874 893965 1078839
20-24 382561 428120 177151 633530 810681
25-29 253180 302329 130102 425407 555509
30-34 208742 239697 100840 347599 448439
35-39 177816 204820 76430 306206 382636
40-44 168934 194133 63795 299272 363067
45-49 122615 145647 43450 224812 268262
50-54 86925 106457 30845 162537 193382
55-59 50480 73388 18782 105086 123868
60-64 45221 66588 15483 96326 111809
65-69 35178 49750 11333 73595 84928
70-74 30970 40050 8790 62230 71020
75-79 16255 21734 4451 33538 37989
80-84 12081 14707 3295 23493 26788
85+ 6610 8231 2136 12705 14841
Total 3879448 4249105 1372604 6755949 8128553
Source: MINECOFIN, 2003:5-9.
The over-representation of women is reflected both in rural and urban populations, although in the rural areas the gap is narrower in the age groups below 20 years. In the Demographic and Health Survey conducted in 2005, it was found out there are more males than females in the under 20 age groups (DHS, 2005:11).

Report on Collection of Existing Data
61 (274)
Table 2.8 - Male-female ratios
Rural Urban Age group
Male Female Male Female
0-4 557973 568207 97117 96934
5-9 485703 498327 77648 79361
10-14 464929 480509 71947 77840
15-19 436987 456978 89576 95298
20-24 284416 349114 98145 79006
25-29 179131 246276 74049 56053
30-34 148871 198728 59871 40969
35-39 131699 174507 46117 30313
40-44 130100 169172 38834 24961
45-49 96608 128204 26007 17443
50-54 69252 93285 17673 13172
55-59 40919 64167 9561 9221
60-64 37928 58398 7293 8190
65-69 30012 43583 5166 6167
70-74 26945 35285 4025 4765
75-79 14332 19206 1923 2528
80-84 10703 12790 1378 1917
85+ 5768 6937 842 1294
Total 3152276 3603673 727172 645432
Source: MINECOFIN, 2003:9.
Migrant workers explain figures. As far as urban areas are concerned, the overall total number of females is lower than that of males, but this is not the case for all age groups. In the age groups less than 20 years and over 59 years, there are more females than males, but in the middle age groups men dominate. This is likely to be a result of migrant workers who tend to be men moving from the rural areas in search of work in towns.
High fertility but higher mortility. The data from the Demographic and Health Survey conducted in 2005 reveals similar population characteristics as those depicted above, but goes further to make very pertinent analyses. The age pyramid constructed from the survey shows a wide base that rapidly narrows as it reaches the upper age limits, which is interpreted as symptomatic of a population with high fertility and even higher mortality. The survey also highlights the population gender imbalances (Table 2.8, above), and shows how there is significant drop in male numbers in the 30-34 and 45-49 age groups. It is surmised that this may have been caused by the excess mortality during the 1994 genocide.
Report on Collection of Existing Data
62 (274)
2.5.5 The issues Dependency levels potentially threaten. As shown by the data presented in the sub-sub-section above, the rate of population growth in Rwanda appears unsustainable - past population control intervention measures have registered limited success. Worse still, the population structure that is so wide at the base that it engenders high dependency levels. These potentially threaten to significantly reduce the impact of even the highest levels of economic growth on the population’s quality of life. The effects of the 1994 genocide on the population structure, reflected by phenomena such as the high percentage of female-headed households, increases the number of vulnerable categories of people whose plight needs targeted interventions.
Need for curbing population growth. The problem of high population growth is further compounded by the majority of the population deriving its livelihood from direct use of land, a commodity that is increasingly becoming scarce. It is thus imperative that as much effort is put on curbing population growth as it is on avenues of accelerating economic growth. As reflected in EDPRS, there is increasing realisation that other sources of livelihood have to be explored because long-term dependence on land is no longer a realistic option for most Rwandans. It is thus critical that the change of focus from land-based livelihood strategies to other alternatives such as building a knowledge-based economy be intensified.
2.6 Health
2.6.1 Introduction Broad inventory with present Project interface. Given the critical position of the health sector in a country’s fabric, it is imperative that in the planning process, the needs and demands of such an important sector are taken into consideration. It is in that vein that the existing situation in the sector is being examined in this section of the present report. Whereas a broad coverage of the sector will be attempted, the area of most interest is the interface between health sector service provision and land use and development planning, including spatial planning that is the concern of the present Project. Issues of geographical accessibility of the population to health services and location of health facilities are of primary concern. This, however, does not diminish the importance of understanding some of the key indicators of the state of health of the Rwandan population, the performance of the health system in general and future direction of the sector.
Health Sector Strategic Plan. The importance of the health can, thus, be overstated. The state of this sector determines the human capabilities, and, hence, overall individual productivity that is a critical input into the long-term development of a country. The Government of Rwanda places the health of its population amongst its top-most priorities as reflected by its budget allocations to the sector. The Government budget allocation to health has increased substantially, showing almost a twofold (185 %) nominal increase between 2002-4 (MOH, 2005:6). The allocation to health constituted 6.1 % of the total budget in 2005, but this is targeted to rise to 12 % by 2010. Government is also committed to broader international goals in the area of health such as the MDG - particularly health-related MDG 1 and 4-6). To achieve these goals the Ministry of Health has been designated as the principal government agency responsible for health sector development. More specifically the Ministry is responsible for setting policy, setting standards, regulating, mobilising resources and monitoring activities in the sector. The overall vision of Government
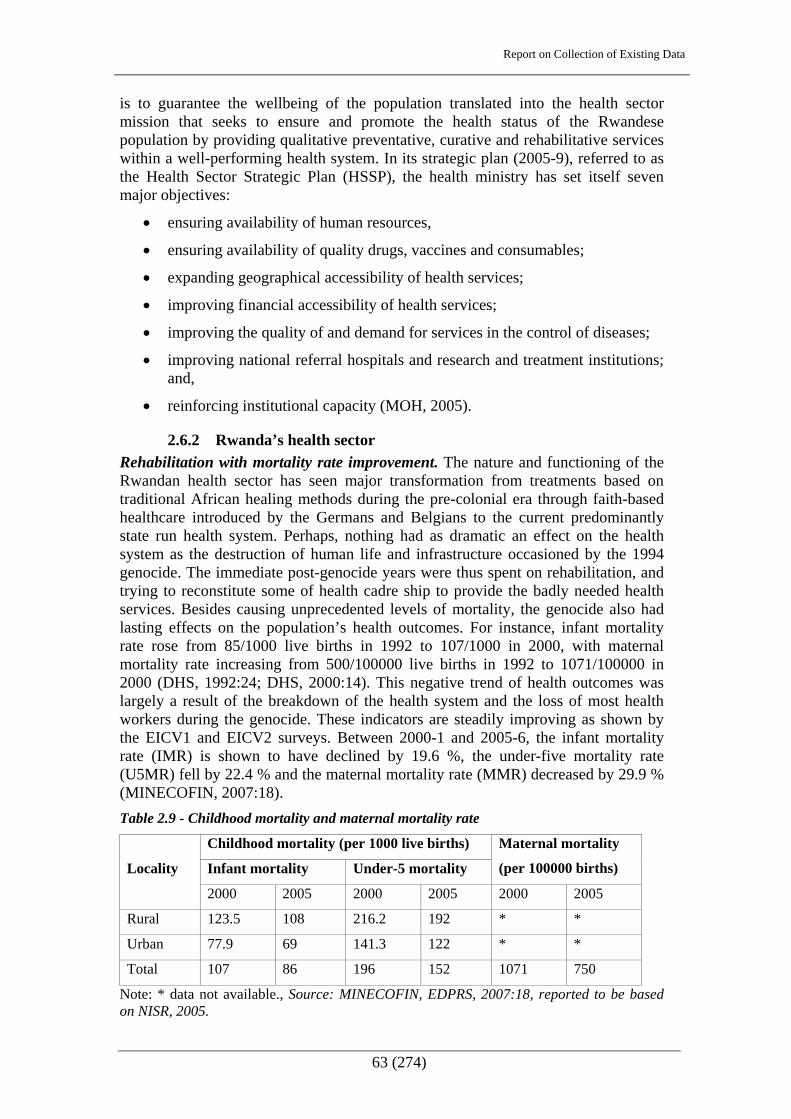
Report on Collection of Existing Data
63 (274)
is to guarantee the wellbeing of the population translated into the health sector mission that seeks to ensure and promote the health status of the Rwandese population by providing qualitative preventative, curative and rehabilitative services within a well-performing health system. In its strategic plan (2005-9), referred to as the Health Sector Strategic Plan (HSSP), the health ministry has set itself seven major objectives:
• ensuring availability of human resources,
• ensuring availability of quality drugs, vaccines and consumables;
• expanding geographical accessibility of health services;
• improving financial accessibility of health services;
• improving the quality of and demand for services in the control of diseases;
• improving national referral hospitals and research and treatment institutions; and,
• reinforcing institutional capacity (MOH, 2005).
2.6.2 Rwanda’s health sector Rehabilitation with mortality rate improvement. The nature and functioning of the Rwandan health sector has seen major transformation from treatments based on traditional African healing methods during the pre-colonial era through faith-based healthcare introduced by the Germans and Belgians to the current predominantly state run health system. Perhaps, nothing had as dramatic an effect on the health system as the destruction of human life and infrastructure occasioned by the 1994 genocide. The immediate post-genocide years were thus spent on rehabilitation, and trying to reconstitute some of health cadre ship to provide the badly needed health services. Besides causing unprecedented levels of mortality, the genocide also had lasting effects on the population’s health outcomes. For instance, infant mortality rate rose from 85/1000 live births in 1992 to 107/1000 in 2000, with maternal mortality rate increasing from 500/100000 live births in 1992 to 1071/100000 in 2000 (DHS, 1992:24; DHS, 2000:14). This negative trend of health outcomes was largely a result of the breakdown of the health system and the loss of most health workers during the genocide. These indicators are steadily improving as shown by the EICV1 and EICV2 surveys. Between 2000-1 and 2005-6, the infant mortality rate (IMR) is shown to have declined by 19.6 %, the under-five mortality rate (U5MR) fell by 22.4 % and the maternal mortality rate (MMR) decreased by 29.9 % (MINECOFIN, 2007:18). Table 2.9 - Childhood mortality and maternal mortality rate
Childhood mortality (per 1000 live births)
Infant mortality Under-5 mortality
Maternal mortality
(per 100000 births) Locality
2000 2005 2000 2005 2000 2005
Rural 123.5 108 216.2 192 * *
Urban 77.9 69 141.3 122 * *
Total 107 86 196 152 1071 750
Note: * data not available., Source: MINECOFIN, EDPRS, 2007:18, reported to be based on NISR, 2005.

Report on Collection of Existing Data
64 (274)
Mortality rate differentials. There are, however, large differentials in health outcomes across Rwanda. Rural rates of mortality remain over one-and-a-half times those in urban areas, and the gap has not narrowed over time. U5MR is highest in the Eastern Province at nearly one-in-four children (233/1000) and lowest in Kigali city at one-in-eight children (124/1000). Southern, Western and Northern provinces have similar rates of mortality (around 170/1000) (MINECOFIN, 2007).
2.6.3 Major illnesses afflicting population Malaria and HIV/AIDS. The two biggest ailments that strain the health system are Malaria and HIV/AIDS. In Rwanda in 2005 malaria accounted for 41 % of all consultations in health centres (MOH, 2005:10). On a positive note, there have notable declines in HIV/AIDS prevalence, having risen in 2000 to a high of about 13.2 % in Kigali, 6.3 % in other urban areas and 3.1 % in rural areas (DHS, 2000:232). More recent estimates (2005) put the prevalence rate among Rwandans aged 15-49 at 3 %, with the rate among women in this age group at 3.6 % and their male counterparts at 2.3 % (DHS, 2005:231). The infection ratio of women to men is, therefore, 1.6, meaning that 160 women are infected to every 100 men (Table 2.10, below). Table 2.10 - HIV prevalence in population aged 15-49 disaggregated by sex
Age group Male (%) Female(%)
15-19 0.4 0.6
20-24 0.5 2.5
25-29 2.1 3.4
30-34 4.2 5.9
35-39 2.3 6.9
40-44 7.1 6.3
45-49 5.3 4.1
Source: DHS 2005:231.
HIV/AIDS higher in urban areas. The prevalence rate of HIV/AIDS is also higher in urban areas at 8.6 % among women and 5.8 % among men than rural areas at 2.6 % among women and 1.6 % among men. Prevalence rates also vary with other socio-demographic characteristics such as level of education, wealth and marital status (DHS, 2005: 232-7).
Malaria main cause of mortality. Whereas HIV/AIDS has tended to attract more attention internationally, malaria remains the biggest killer in much of Sub-Saharan Africa. It afflicts 300-500 million people worldwide every year, killing between one and two million (DHS, 2005:119). More than 80 % of those afflicted and 90 % of the deaths occur in Africa. Malaria is also estimated to cost 1.3 percentage points in GDP growth annually, and is a major contributor to school absenteeism. In Rwanda, malaria is the main cause of mortality, and in 2005 about 30 % of all malaria cases were among children under the age of five (DHS, 2005:120). Given the enormity of the problem of malaria, the Government of Rwanda established the National Malaria Control Programme (PNILP) in 1999 with strategies and activities to combat the disease through managing reported illness cases, prevention, epidemiological

Report on Collection of Existing Data
65 (274)
surveillance, health education, community participation and operational research. Spatially, Rwanda is divided into four natural malaria eco-zones: the first stratum extends from Lake Kivu to the Congo-Nile ridge and in this zone the plasmodicindices among children are between 5 % and 30 %. The second zone consists of a north-south band 160 km long and 20-50 km wide located east of the first stratum between elevations of 1800 m and 3000 m. The plasmodic index in this zone is under 2 %. The third stratum is located on the central plateau between elevations of 1000m and 2000 m. The plasmodic indices vary widely in this zone, ranging from 10 % to 50 %. The area is at risk of malaria epidemics, with the valleys being the main malaria-endemic pockets from which malaria epidemics may spring. The fourth stratum covers the lower eastern parts of the country at elevations ranging from 1000 m to 1500 m, where malaria is endemic.
High maternal mortality. Besides malaria and HIV/AIDS, diseases related to childbirth are responsible for high levels of maternal mortality. Infant and child mortality is also high in the country, largely caused by neonatal complications, malaria, diarrhoea, HIV/AIDS and malnutrition. The state of malnutrition remains very high: an examination of recent trends in child nutrition reveals a mixed picture. The incidence of stunting amongst children rose from 42 % to 45 % in 2000-5 and is highest in Northern Province (52 %) followed by the Western Province (47 %) (MINECOFIN, 2007:19). In contrast, nutritional indicators, which are more sensitive to short-term fluctuations, like wasting and underweight, improved over the period from 7 % to 4 % and from 25 % to 23 %, respectively (ibid). A possible reason for this could be that the increase in under-five survival means that stunted children who would previously have died are now recorded in the sample. Rwanda is also prone to regular epidemics of cholera, dysentery and meningitis.
Safe water precondition for improving health. Overall, more than 80 % of diseases that afflict Rwandans are waterborne, meaning that access to safe water is a precondition for improving environmental and personal health. The number of people with access to safe water increased 2000-5, but there was neither change in the proportion of households having access to safe water (64%), nor was there any reduction in the average distance a household had to travel to fetch safe water (0.5 km). The EICV2 survey found that, of all public services, Rwandans are least satisfied with access to drinking water (only 50% express satisfaction). The results of the Ubudehe (MINECOFIN, 2007) survey also suggest Rwandans would rank water access as highest priority in infrastructure services, followed by roads, health, schools and electricity. It is, therefore, important that issues of access to safe water are addressed if the desired health outcomes amongst the population are to be realised (ibid) (See Section 9 on Water and Sanitation).
2.6.4 Accessibility of health services Mixed progress. Access to and use of health and health-related services have improved in some areas, but not in others. Improved access is reflected in progress in maternal and child health care. For example, according to baseline data in EDPRS, 95 % of women of reproductive age in Rwanda who have ever been pregnant received antenatal care during their last pregnancy (MINECOFIN, 2007:20). Other programmes such as immunisation coverage have stalled since 2000, with the percentage of children receiving all vaccines remaining at 75 %, though falling in urban areas. Sustained sensitisation campaigns in the rural areas may explain why rural rates of immunisation are now higher than urban (ibid).

Report on Collection of Existing Data
66 (274)
Unequal use of health consultations. All quintiles covered by EICV2 reported an increase in the proportion of households, which consulted a medical practitioner 2000-5. Nevertheless, inequalities in access to health care remain. Of those individuals reporting themselves as ill in EICV2, 20 % of the poorest consumption quintile saw a medical practitioner, compared with 43 % of those in the highest quintile (NISR, 2006:18). One factor that contributes to this difference is the proximity of medical facilities. People in the lowest quintile live an average of 15 minutes further away from the nearest health care centre than those in the highest quintile. Similarly, poor people live an hour’s walk further from the nearest district hospital than those in the highest quintile (NISR, 2006).
User satisfaction with health services. Improvements in the health sector were assisted by a strong strategic plan from early in the PRSP period with careful targeting of all groups of the population, for example through the roll out of the mutuelles3 health insurance scheme. Government efforts to extend health insurance coverage are bearing fruit with 38 % of the EICV2 sample included in mutual insurance schemes and a further 5 % covered by other forms of insurance (NISR, 2006:19). Users’ evaluation of health services appears favourable with 77 % of EICV2 user-respondents declaring they were satisfied with their nearest health care centre and 74 % registering satisfaction with their district hospital. Similar results emerge from the Ubudehe survey (MINECOFIN, 2007) where 60 % of respondents considered the mutual insurance scheme to be a success and 52 % considered that health service delivery had greatly improved (ibid).
2.6.5 Expansion of health services Kigali best served. A contribution to the health sector that can be made by land use and development planning with regard to the objective of ’expanding geographical accessibility of health services’ (introductory sub-sub-section above), is determination of areas or populations that lack or have constrained geographical access to health facilities; it can identify space requirements for proposed expansion of health infrastructure and mediate these requirements with those of other land uses so as to identify appropriate locations of the necessary health physical infrastructure. According to the Health Sector Strategic Plan (2005-9), the health infrastructure in Rwanda is generally satisfactory after considerable rehabilitation and construction undertaken since 1994. It is stated that in the public and government assisted not-for-profit sectors there are: 385 health centres - having increased from 333 in 1997; 34 district hospitals - an increase from 30 in 1997; and, four national referral hospitals (MOH, 2005:10). Besides these, there is a thriving private sector health provision, consisting of about 325 dispensaries and clinics4. More than half (52 %) of these privately owned facilities are, however, located in the City of Kigali (ibid). This qualifies their general accessibility.
4 It must be conceded that given the pace of development the number of health facilities are likely to have increased since this data was captured. It will, thus, be necessary to update this information before detailed analysis of catchment areas and determination of future land needs for health infrastructure is undertaken.

Report on Collection of Existing Data
67 (274)
Figure 2.13– Map of Rwanda showing health centres
Source: NUR-CGIS.
Functioning health accessibility by 2009. In general, geographical health access in Rwanda is comparable to that in other countries within the sub-region. It is estimated that 60 %5 of the Rwandan population is within 5 km of a health centre with 85 % within 10 km of such a facility. However, it should be noted that this information masks regional differences since these are national averages. There is also an issue of the quality of services available at these health facilities. They vary greatly, particularly with respect to staff and equipment. Detailed catchment analysis will have to be undertaken so as to identify the gaps that need filling. The deficiencies in the data notwithstanding, the Health Sector Strategic Plan seeks to expand the geographical accessibility to functioning health services through:
• constructing and rehabilitating health centres and district hospitals in health districts with worst geographical access;
• establishing an efficient equipment procurement system;
• providing health districts with adequate transportation for emergency referral to district hospitals;
• ensuring there is a functioning laboratory network in place;
• ensuring functioning and regular inspection of health facilities; and,
• promoting use of private sector health facilities.
Targets surpassed. The targets accompanying these objectives, which are to be realised by the end of 2009, include increasing the 60 % population with 5 km of a functioning health facility to 70 %. If data presented in EDPRS is reliable then this
5 Baseline data used by the EDPRS shows this figure to have reached 75% (MINECOFIN, 2007:20)
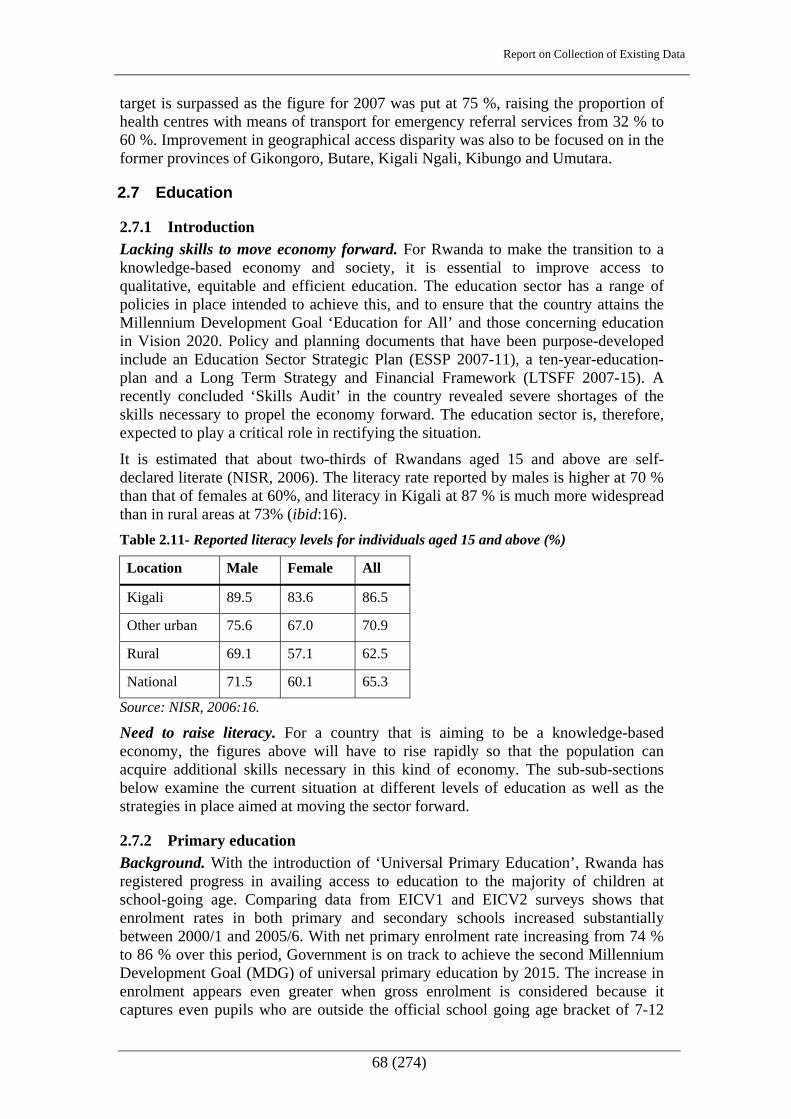
Report on Collection of Existing Data
68 (274)
target is surpassed as the figure for 2007 was put at 75 %, raising the proportion of health centres with means of transport for emergency referral services from 32 % to 60 %. Improvement in geographical access disparity was also to be focused on in the former provinces of Gikongoro, Butare, Kigali Ngali, Kibungo and Umutara.
2.7 Education
2.7.1 Introduction Lacking skills to move economy forward. For Rwanda to make the transition to a knowledge-based economy and society, it is essential to improve access to qualitative, equitable and efficient education. The education sector has a range of policies in place intended to achieve this, and to ensure that the country attains the Millennium Development Goal ‘Education for All’ and those concerning education in Vision 2020. Policy and planning documents that have been purpose-developed include an Education Sector Strategic Plan (ESSP 2007-11), a ten-year-education-plan and a Long Term Strategy and Financial Framework (LTSFF 2007-15). A recently concluded ‘Skills Audit’ in the country revealed severe shortages of the skills necessary to propel the economy forward. The education sector is, therefore, expected to play a critical role in rectifying the situation.
It is estimated that about two-thirds of Rwandans aged 15 and above are self-declared literate (NISR, 2006). The literacy rate reported by males is higher at 70 % than that of females at 60%, and literacy in Kigali at 87 % is much more widespread than in rural areas at 73% (ibid:16). Table 2.11- Reported literacy levels for individuals aged 15 and above (%)
Location Male Female All
Kigali 89.5 83.6 86.5
Other urban 75.6 67.0 70.9
Rural 69.1 57.1 62.5
National 71.5 60.1 65.3
Source: NISR, 2006:16.
Need to raise literacy. For a country that is aiming to be a knowledge-based economy, the figures above will have to rise rapidly so that the population can acquire additional skills necessary in this kind of economy. The sub-sub-sections below examine the current situation at different levels of education as well as the strategies in place aimed at moving the sector forward.
2.7.2 Primary education Background. With the introduction of ‘Universal Primary Education’, Rwanda has registered progress in availing access to education to the majority of children at school-going age. Comparing data from EICV1 and EICV2 surveys shows that enrolment rates in both primary and secondary schools increased substantially between 2000/1 and 2005/6. With net primary enrolment rate increasing from 74 % to 86 % over this period, Government is on track to achieve the second Millennium Development Goal (MDG) of universal primary education by 2015. The increase in enrolment appears even greater when gross enrolment is considered because it captures even pupils who are outside the official school going age bracket of 7-12
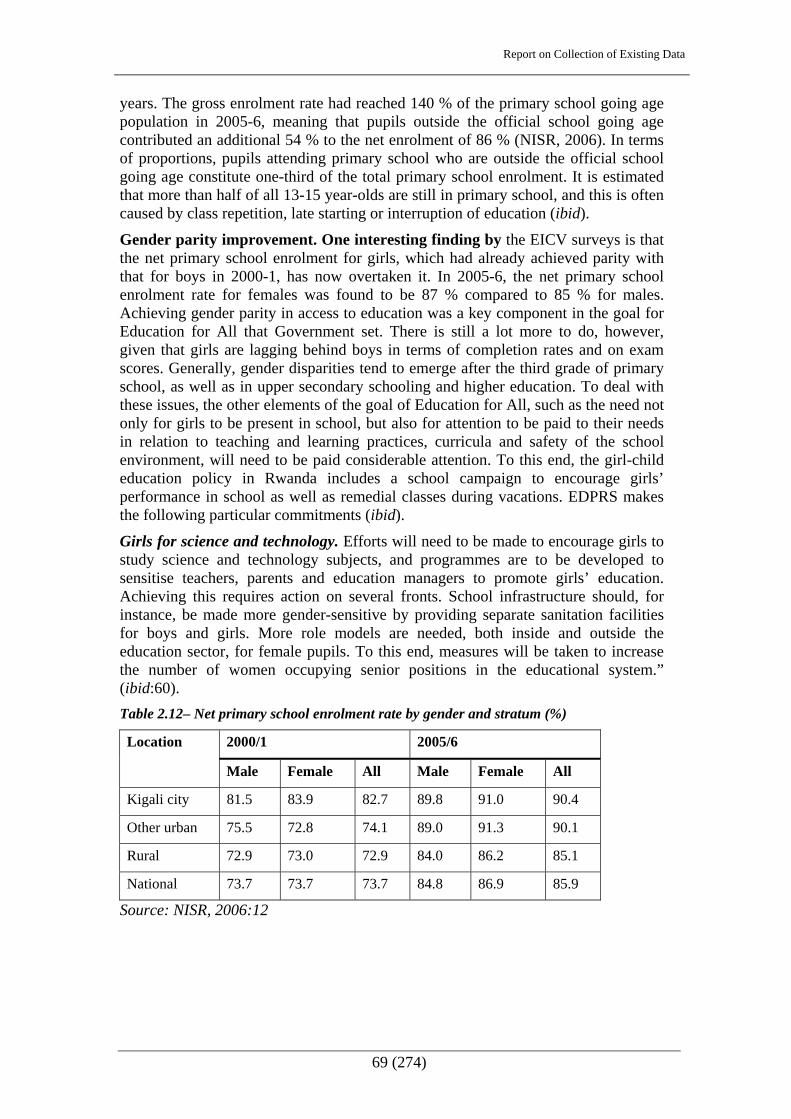
Report on Collection of Existing Data
69 (274)
years. The gross enrolment rate had reached 140 % of the primary school going age population in 2005-6, meaning that pupils outside the official school going age contributed an additional 54 % to the net enrolment of 86 % (NISR, 2006). In terms of proportions, pupils attending primary school who are outside the official school going age constitute one-third of the total primary school enrolment. It is estimated that more than half of all 13-15 year-olds are still in primary school, and this is often caused by class repetition, late starting or interruption of education (ibid).
Gender parity improvement. One interesting finding by the EICV surveys is that the net primary school enrolment for girls, which had already achieved parity with that for boys in 2000-1, has now overtaken it. In 2005-6, the net primary school enrolment rate for females was found to be 87 % compared to 85 % for males. Achieving gender parity in access to education was a key component in the goal for Education for All that Government set. There is still a lot more to do, however, given that girls are lagging behind boys in terms of completion rates and on exam scores. Generally, gender disparities tend to emerge after the third grade of primary school, as well as in upper secondary schooling and higher education. To deal with these issues, the other elements of the goal of Education for All, such as the need not only for girls to be present in school, but also for attention to be paid to their needs in relation to teaching and learning practices, curricula and safety of the school environment, will need to be paid considerable attention. To this end, the girl-child education policy in Rwanda includes a school campaign to encourage girls’ performance in school as well as remedial classes during vacations. EDPRS makes the following particular commitments (ibid).
Girls for science and technology. Efforts will need to be made to encourage girls to study science and technology subjects, and programmes are to be developed to sensitise teachers, parents and education managers to promote girls’ education. Achieving this requires action on several fronts. School infrastructure should, for instance, be made more gender-sensitive by providing separate sanitation facilities for boys and girls. More role models are needed, both inside and outside the education sector, for female pupils. To this end, measures will be taken to increase the number of women occupying senior positions in the educational system.” (ibid:60). Table 2.12– Net primary school enrolment rate by gender and stratum (%)
2000/1 2005/6 Location
Male Female All Male Female All
Kigali city 81.5 83.9 82.7 89.8 91.0 90.4
Other urban 75.5 72.8 74.1 89.0 91.3 90.1
Rural 72.9 73.0 72.9 84.0 86.2 85.1
National 73.7 73.7 73.7 84.8 86.9 85.9
Source: NISR, 2006:12
Report on Collection of Existing Data
70 (274)
Narrowing urban-rural enrolment disparities. It is not only the gender gap that has narrowed but also the disparity between urban and rural areas (Table 2.12, above). The enrolment rates are still higher in the City of Kigali than elsewhere in the country, but rural areas have considerably narrowed the gap from a 10 % deficit to about 5 % between 2000-1 and 2005-6. Large disparities in school attendance remain across income distribution, with enrolment increasing with household income. In the richest consumption quintile, 92 % of primary-age students attend primary school, as compared to 79 % of those in the lowest quintile. However, this gap of 13 % is smaller than the 19 % gap observed in 2000-01. This indicates that enrolment rates have risen faster among students in the lowest income group than among those in the highest income group. There is hardly any difference in the likelihood to attend primary school by children living in female-headed households, including widows, as compared to those from male-headed households. However, more research is needed to determine whether girls and boys from female-headed households drop out sooner or perform more poorly.
General improvements but teacher absenteeism. It is not just enrolment that has improved, but other aspects such as the rise in the number of qualified primary school teachers by 40 %. There has also been an improvement in the completion and repetition rates to 42 % and 17 %, respectively (MINECOFIN, 2007). EICV2 also examined the level of satisfaction with primary schools amongst the concerned households, which was found to be high. Almost four out of every five households are satisfied with the service the schools provide, and one-third reported observing an improvement in the twelve months preceding the EICV2 survey. These findings are confirmed by the results of the Ubudehe survey in which 70 % of respondents considered that the delivery of primary education had improved greatly in the last three years. Educational priorities identified by Ubudehe were ranked as follows: more classrooms, more kindergarten schools, more qualified teachers, higher salaries for teachers and access to adult education. Citizen Report Cards reported satisfaction with primary education, but also pointed to serious problems with teacher absenteeism. This needs to be addressed to further cut down the repetition and drop-out rate (ibid).
Means to increase completion rates. At primary level, Government aims to increase completion rates significantly by reducing the high rates of drop out and repetition in schools. Rwanda currently has one of the highest pupil-teacher ratios (71:1) in Sub-Saharan Africa, and reducing this will be vital to improving the quality of education in primary schools. Increased access and completion in primary schools will require increases in the civil service wage bill, as well as acceleration in the numbers of teachers being trained in teacher training colleges. The Teacher Service Commission (TSC) has been put in place to develop strategies for teacher motivation and retention including the set up of teacher co-operatives. The current EDPRS also provides for the construction of extra classrooms that meet minimum quality to reduce class size. It further seeks to reduce the student-textbook ratio to 1:1 in core subjects accompanied by the in-service training of teachers in the effective use of learning materials. An ongoing programme will equip all 2200 primary schools in the country with a science corner to promote fundamental information about science (ibid).

Report on Collection of Existing Data
71 (274)
2.7.3 Distribution of primary schools Umudugudu to school or vice versa. There are about 2200 primary schools spread across Rwanda, with inevitably the highest concentration in Kigali city. In planning for further primary school provision, an analysis of the catchment areas of existing schools will have to be undertaken. It is also likely to be the case that more efforts will have to be directed to expand classroom a space in existing facilities to accommodate the numbers that will be brought in by the recent change from six-year primary school system to nine years. If the ‘villagisation’ policy is fully implemented, it may have implications for future primary school provision depending on where the collective villages will be located in relation to existing or proposed new primary schools or which primary schools may be relocated. The villagisation policy also provides standards of service provision to be adhered to, including access to schools. It will thus be necessary to bear all these factors into consideration during the analysis and planning phase of the present national Land Use and Development Master Plan Project so as to determine the appropriate number and locations of additional primary schools (ibid). Figure 2.14 – Map of Rwanda showing schools
2.7.4 Secondary education Background. Unlike with primary school education, only a small fraction of children attend secondary education in Rwanda. Because of this, one of the priority objectives of the country’s recent education policy is to increase secondary school enrolment, so that all children complete nine years of basic education, which until recently was divided into six years of primary school plus three years at lower secondary level (tronc commun). Recent policy changes seek to merge lower secondary education with primary school education so that there are more continuous nine years of basic education. The plan is to make all the nine years of

Report on Collection of Existing Data
72 (274)
basic education free. This policy change is to have effect starting 2009, which means that it too early to speculate on how effective it is going to be (NISR, 2006).
More teachers – not proportionately more pupils. To achieve its educational objectives at secondary level, the government of Rwanda increased the number of teachers by 40 %, the number of qualified teachers by 45 % and the number of schools by 47 % between 2000-1 and 2005-6. Expansion at the tronc commun level has been mostly done through the public sector, whereas at upper secondary level there has been a strong component of growth among the providers of private schooling. The effect of this expansion on school enrolment has, however, been modest. Over the same period, net secondary school enrolment rose from 7 to 10 %. The rate is now slightly higher for boys at 10.6 % than for girls at 9.5 %, which reverses the situation observed in 2000-1. It is striking that the increased use of qualified teachers had little effect on enrolment. This may be due to the slow growth of number of classrooms and because at the time of the EICV2 survey, secondary schools were still charging enrolment fees for the tronc commun (ibid).
Highly unequal secondary school enrolment. The disparity in enrolment in secondary schooling between the poorest and richest households is greater than at the primary level, and has increased over time. In 2005-6, net secondary school enrolment among children from the highest consumption quintile was ten times higher at 26 % than among children from the lowest quintile 2.6 %. Membership of a female-headed or widow-headed household has little effect on enrolment rates. However, enrolment in secondary school among full orphans is much higher than for non-orphans. This reflects the greater probability of full orphans being found in the top consumption quintile where enrolment rates are highest. Only 57 % of user-households expressed satisfaction with secondary schools, which is substantially less than was the case among users of primary schools at almost 80%. Furthermore, less than one-quarter of user-households reported improvements in secondary schools during the previous twelve months as compared with one-third for primary schools (ibid).
30 % enrolment by both girls and boys 2012. To improve enrolment at secondary school level, the government education plan has set gross enrolment targets of 30 % for boys and girls to be achieved by 2012, rising to 60 % by 2020, and also ensuring that a higher proportion of those who enrol finish this cycle of their education. The completion rate for the tronc commun is intended to double from 20 % to 40 %, with that for upper secondary planned to rise from 11 % to 16% (MINECOFIN, 2007).
2.7.5 Technical and Vocational Education and Training (TVET) Background. For Rwanda to achieve the socio-economic transformation implied by the targets of Vision 2020, the country must quickly develop a wide range of skills among its labour force. Equipping new entrants to the labour force with the skills needed to operate and manage a continuous flow of new technologies requires that measures must be taken to update the vocational educational system to ensure competitiveness in regional and international markets. Besides, Rwanda cannot meet its ambition of being the regional ICT hub unless it expands access to Technical and Vocational Education and Training (TVET), ensuring that existing centres are adequately equipped (MINECOFIN, 2007).
More instructors and training centres. In 2007, the graduate output from vocational training institutions was 8250, but the this is planned to rise to about 135000 by

Report on Collection of Existing Data
73 (274)
2012 (ibid) To achieve this target, EDPRS proposes to retrain already operating instructors and new ones to be trained, increasing their number to 300. Five regional vocational training centres are also to be established and tasked with co-ordinating training activities in their respective geographical jurisdiction. The location of these centres is not yet specified, but it would appear that there will be one for each of the four provinces and the City of Kigali. Thes centres will also have a business enterprise unit, which will match the students of the schools with employment opportunities. The overall overview of implementing the TVET policy will lie with a TVET board that will co-ordinate all public and private stakeholders to ensure the provision of outcomes-based TVET as well as to co-ordinate the TVET strategy with economic and district development strategies. The Rwanda Workforce Development Authority (RWDA) will guide, co-ordinate and regulate vocational training in the country to provide quality assurance. EDPRS also proposes the preparation of a fully-fledged strategic master plan for vocational education and training.
2.7.6 Higher education Background. The 2002 census showed that there are only 0.5 % of graduates in the population of Rwanda, which is much lower than the African average of 4 %. However, the gross enrolment rate at tertiary level is 3.2 %, which is regionally comparable. It is important to note, however, that the numbers of students enrolled in higher institutions of learning have been steadily rising, increasing from a total of 10000 in 2002 to 27787 in 2005 with the institutions of higher learning rising to 18, including six that are publicly funded. For Rwanda to compete effectively in the global economy, increasing access to higher education is a priority. Equally important is the need to improve the quality of provision so that graduates have the requisite transferable skills required. EDPRS seeks to increase higher education gross enrolment rate from 3.2 % to 4.5 %, while quality will be enhanced by ensuring that the proportion of teachers with appropriate qualifications in higher education rises from less than 20 % to 30 %. These targets are to be achieved through an expansion of full and part-time programmes with the use of ICT enabling open and distance modes of learning. Furthermore, efforts will be put in expanding the range and diversity of programmes, with new priority subjects identified to meet EPDRS needs included in the curriculum. Key curriculum areas for growth are planned to include offerings in: environment and sustainable development; logistics and supply chain management; food science, processing and manufacture; tourism, leisure and hospitality management; and, engineering and design. To ensure that graduates’ skills meet labour demands, EDPRS proposes that academic staff transform their approach, consistent with a more student-centred and practically-oriented philosophy. Higher learning institutions are to place emphasis on industrial attachment and practical work in their courses (MINECOFIN, 2007).
Science-based programmes encouraged. Despite the steady rise in higher education enrolment, there has been little change in the number of students undertaking science and technology subject. Many of the curriculum offerings in Rwanda’s institutions of higher learning are of a generalist nature and are in the arts and the humanities, with insufficient numbers in science and technology. Government is, however, directing its efforts at encouraging science-based programmes at universities and colleges. For instance, expenditure for science laboratories and equipment is being prioritised in the budget. Study loans and grants are being targeted to the priority areas of science and technology. Attempts are also being made to recruit

Report on Collection of Existing Data
74 (274)
international expertise in these areas to help build local capacity in teaching science and technology subjects at university (ibid).
2.7.7 Issues Increased quality. There is need general for increased access at all levels of education but, perhaps, more especially it is imperative that the gains registered in primary school enrolment be consolidated and improved upon. There are issues of quality that relate to teacher-pupil ratio, availability of textbooks and other scholastic materials as well as qualified teachers. The positive quantitative achievements need to be built upon with improvements on quality. EDPRS makes solid proposals aimed at addressing the above issues. The recent expansion of primary school education from six years to nine years is positive as it will provide avenues for more efficient use of land given that instead of setting up separate premises for the first three of secondary education, these will be incorporated in existing primary schools. What is needed is to explore ways of expanding facilities in existing primary to accommodate the inevitably increased pupil population.
Land for schools and imidugudu. Identifying future land needs for developing school facilities, particularly primary schools ought to be undertaken in tandem with the implementation of the villagisation policy. It is only when locations of imidugudu have been identified that proper school catchment analysis can be undertaken and needs identified or vice versa. Implementing the villagisation policy is a complex task. It may time to be completed, thereby holding back decisions on appropriate locations for services, including education.
Land for TVET centres. It is also important that the proposed strategic master plan on Technical and Vocational Education and Training is expedited so that land needs for the necessary centres can be ascertained. The government is keen on expanding vocational training considerably with space implications addressed.

Report on Collection of Existing Data
75 (274)
3 Soils 3.1 Summary Assignment approach. The TOR for the assignment of specialist on Soils in the present Project has required the author of the present section to make an inventory and report of the existing soils related data for the Project and raise issues emerging there from. A first hand observation is that there is a great deal of relevant existing soils related data in Rwanda for the present Project. Soils data exists, and is fairly well, or well, presented in analogue maps or in digital, or computerised, formats, also in shape files in an ESRI environment. The approach for achieving the objectives set in the TOR has been to capture and analyse secondary data during initial inventory engagement by the author. After the inventory search, interviews and discussions were held with relevant key persons.
Soil map. A national soil survey project, Carte Pédologique du Rwanda, started in 1981 and was finalised in 1994. This semi-detailed survey has resulted in a soil map at 1:50000 scale, presented on 43 topographical sheets covering the country. The soil data from all observation points (>200 soil profiles, corresponding to 176 different soil series described) have been stored in a master, ‘natural resources’, database (in Access DB). The custodianship of this database, including its soil maps is with the Ministry of Agriculture and Animal Resources (MINAGRO). The organisation to deal with the soil mapping - and interlinked production of land capability and crop suitability classifications and mapping - is the Soil Survey Unit at MINAGRO.
Soil suitability classification. A prerequisite for the preparation of a national land use and development master plan - especially for a country highly dependant on agriculture like Rwanda – is availability of information on the capability of the land for agricultural production. To such end, a land suitability classification exists for 12 Rwandan crops. The classification is based on the suitability classes offered by FAO (1976 classification). For each of the 12 crops a crop suitability map at a scale of 1:250 000 is available.
Useful package for Project. The thoroughly conducted semi-detailed soil survey of Rwanda has, thus, resulted in a highly useful soil map and data set package. The map and package will fully suffice to meet the specific requirements of the present Project at national and district planning levels. Whereas, an existing agricultural zones map may be used only for reference for general national planning purposes in the present Project, the land capability and crop suitability mapping will meet the specific requirements of the Project national-wide.
An issue. The constrained management capacity of the soil map and associated data set package with the Soil Survey Unit with MINAGRI needs urgent address for it to efficiently utilise and enhance the data set it is currently custodian of.
3.2 Introduction
3.2.1 Background Cover also computerisation plans. The TOR for the assignment requires the author of the present report to make an inventory and report of the relevance of the existing soils related data for the Project. A first hand observation is that there is a great deal of different data captured. Relevant soils data does exist. It is fairly well, or well, presented in analogue maps or in digital, or computerised, formats, with shape files
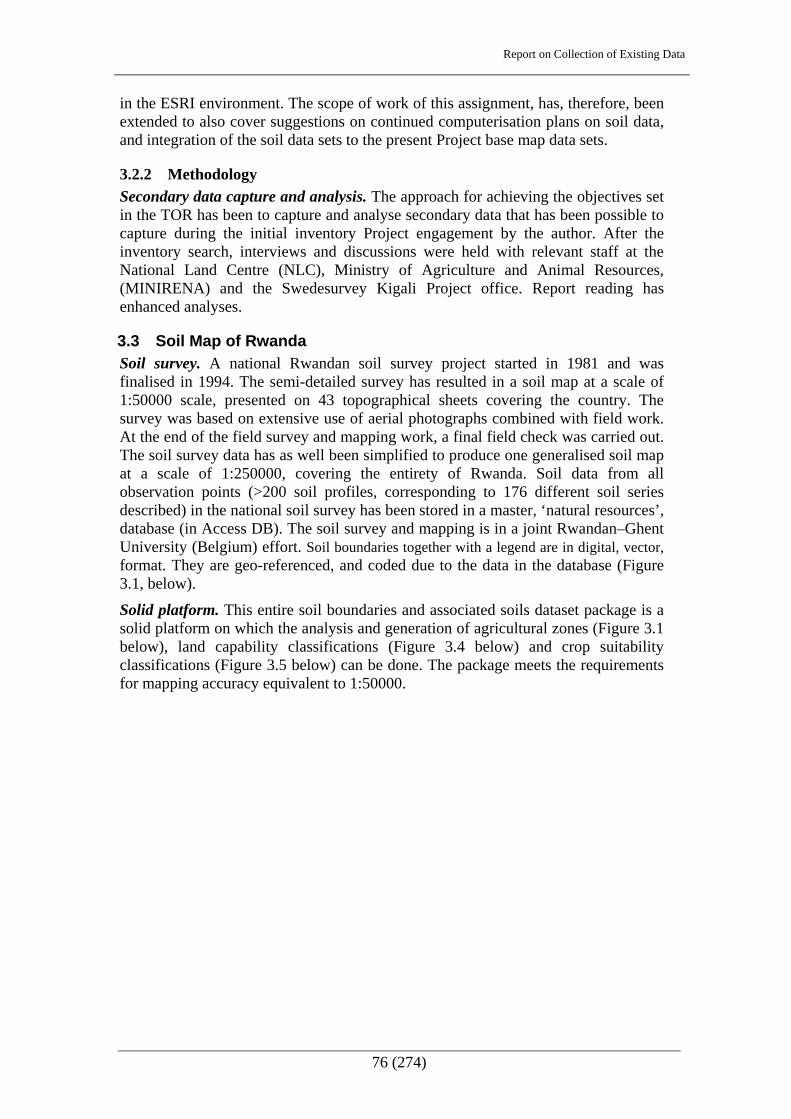
Report on Collection of Existing Data
76 (274)
in the ESRI environment. The scope of work of this assignment, has, therefore, been extended to also cover suggestions on continued computerisation plans on soil data, and integration of the soil data sets to the present Project base map data sets.
3.2.2 Methodology Secondary data capture and analysis. The approach for achieving the objectives set in the TOR has been to capture and analyse secondary data that has been possible to capture during the initial inventory Project engagement by the author. After the inventory search, interviews and discussions were held with relevant staff at the National Land Centre (NLC), Ministry of Agriculture and Animal Resources, (MINIRENA) and the Swedesurvey Kigali Project office. Report reading has enhanced analyses.
3.3 Soil Map of Rwanda Soil survey. A national Rwandan soil survey project started in 1981 and was finalised in 1994. The semi-detailed survey has resulted in a soil map at a scale of 1:50000 scale, presented on 43 topographical sheets covering the country. The survey was based on extensive use of aerial photographs combined with field work. At the end of the field survey and mapping work, a final field check was carried out. The soil survey data has as well been simplified to produce one generalised soil map at a scale of 1:250000, covering the entirety of Rwanda. Soil data from all observation points (>200 soil profiles, corresponding to 176 different soil series described) in the national soil survey has been stored in a master, ‘natural resources’, database (in Access DB). The soil survey and mapping is in a joint Rwandan–Ghent University (Belgium) effort. Soil boundaries together with a legend are in digital, vector, format. They are geo-referenced, and coded due to the data in the database (Figure 3.1, below).
Solid platform. This entire soil boundaries and associated soils dataset package is a solid platform on which the analysis and generation of agricultural zones (Figure 3.1 below), land capability classifications (Figure 3.4 below) and crop suitability classifications (Figure 3.5 below) can be done. The package meets the requirements for mapping accuracy equivalent to 1:50000.
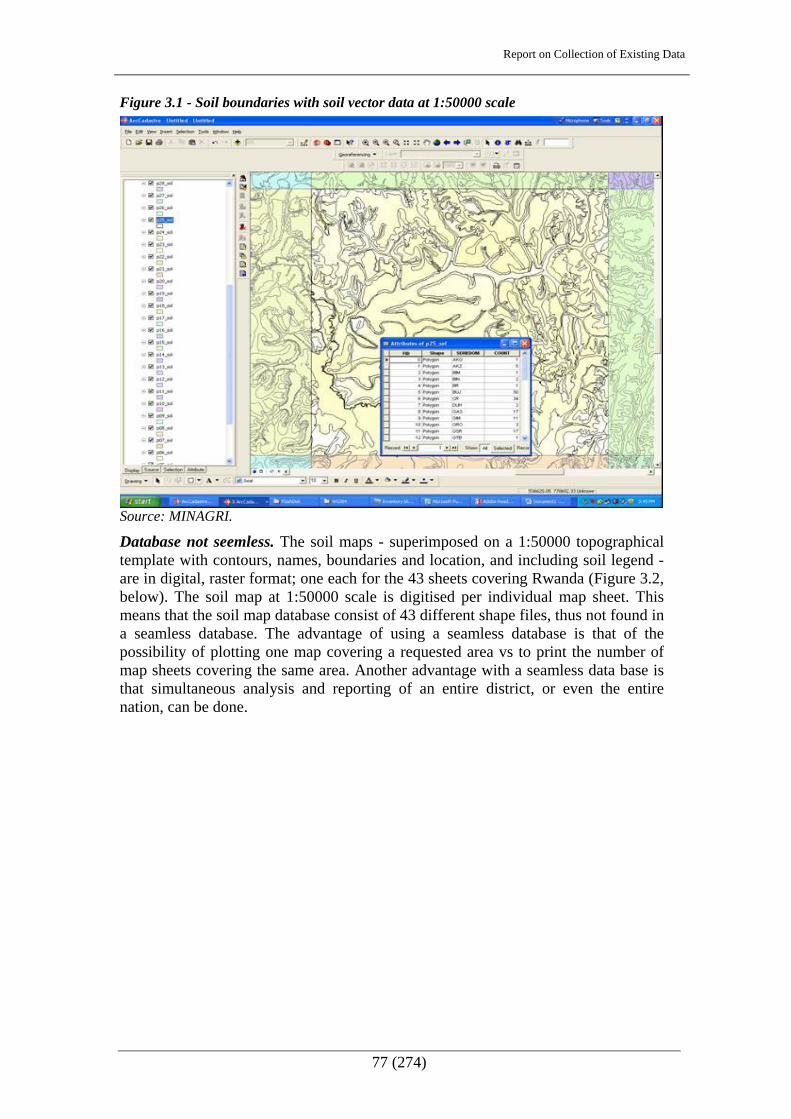
Report on Collection of Existing Data
77 (274)
Figure 3.1 - Soil boundaries with soil vector data at 1:50000 scale
Source: MINAGRI. Database not seemless. The soil maps - superimposed on a 1:50000 topographical template with contours, names, boundaries and location, and including soil legend - are in digital, raster format; one each for the 43 sheets covering Rwanda (Figure 3.2, below). The soil map at 1:50000 scale is digitised per individual map sheet. This means that the soil map database consist of 43 different shape files, thus not found in a seamless database. The advantage of using a seamless database is that of the possibility of plotting one map covering a requested area vs to print the number of map sheets covering the same area. Another advantage with a seamless data base is that simultaneous analysis and reporting of an entire district, or even the entire nation, can be done.
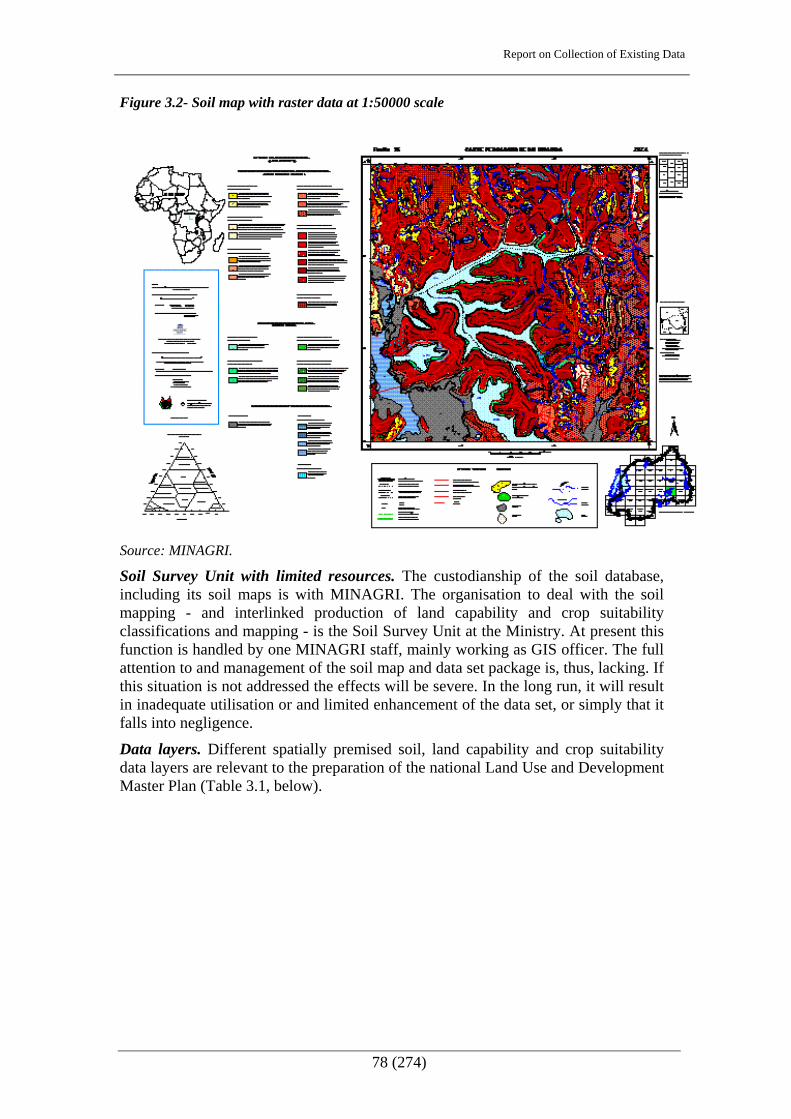
Report on Collection of Existing Data
78 (274)
Figure 3.2- Soil map with raster data at 1:50000 scale
Source: MINAGRI.
Soil Survey Unit with limited resources. The custodianship of the soil database, including its soil maps is with MINAGRI. The organisation to deal with the soil mapping - and interlinked production of land capability and crop suitability classifications and mapping - is the Soil Survey Unit at the Ministry. At present this function is handled by one MINAGRI staff, mainly working as GIS officer. The full attention to and management of the soil map and data set package is, thus, lacking. If this situation is not addressed the effects will be severe. In the long run, it will result in inadequate utilisation or and limited enhancement of the data set, or simply that it falls into negligence.
Data layers. Different spatially premised soil, land capability and crop suitability data layers are relevant to the preparation of the national Land Use and Development Master Plan (Table 3.1, below).

Report on Collection of Existing Data
79 (274)
Table 3.1 - Dataset layers relevant to the present Project Type of dataset Mandate of data Status RemarksNLC Development planAdministrativeNational (Rwanda incl. Coastline) NIS Digital VectorProvincial NIS Digital VectorDistrict NIS Digital VectorCell NIS Dig. (Gasabo, Musanze) VectorNames ( related to administrative areas and map Land tenure (Customary, Public- and Private- NLCProtected areas (Parks, Wetland, Forests) ORTPN / MINAGRI / REMACensusConstituencyGrid Sheet index for old 1:50 000 topographical NLCGrid Sheet index for 2007-08 orthophotos NLCElevationGeodetic reference NLC Digital VectorContour lines, 10 m NLC Digital VectorContour lines, 25 m NLC Digital VectorElevation model (DEM), 90 m NLC Digital RasterInfrastructure, Hydrography, Land cover NLC
Orthophoto NLC Digital 2007, 2008Raster. res.12,5
cm, 25 cmBuilt-Up (Residential, Institutional, Commercial, Industrial, Health, Education, Religious,Recreation)
1:50 000
Roads NLC (NIS?) 1:50 000Railway NLC 1:50 000Airport 1:50 000PowerlineHydrographic - Lakes NLC 1:50 000Hydrographic - Rivers, streams, waterways NLC (NIS?) 1:50 000Hydrographic - Wetland NLC 1:50 000Hydrology - Bore holes District Authority
Landcover - Soil data Digital 1:50 000, Vector and Raster
Landcover - Vegetation (natural-, planted NLCClimateMeterological ( Rainfall, Temperature, Wind,Humidity, Sunshine)GIS applicationsLandcover - Land capability MINAGRI / NLC Digital 1:250 000, RasterLandcover - Crop Suitability MINAGRI / NLC Digital 1:250 000, RasterLandcover - Erosion pronessed areas MINAGRI / NLCLandcover - Agriculture (crop-, animalproduction, horticulture, fishing)
MINAGRI / NLC 1: 250 000, 12 zones
Hillshade NLC Digital, coverage ? Raster Source: MINAGRI.
3.4 Agricultural zones 12 mapped zones. For Rwanda the agricultural potential has been delimited into 12 zones (ISAR, 1974). Together with a description, the agricultural zones have also been mapped. In this context, land productivity is a variable of:
• chemical and physical properties characterising the soil; • climate, ie temperature and rainfall; • topography, ie the slope gradient, the altitude; • actual natural vegetation; and,

Report on Collection of Existing Data
80 (274)
• management practices. The agricultural potential is an interaction of above interdependent factors. The ‘Agricultural zones in Rwanda’ is in digital, raster, format at a scale of 1:250000 (Figure 3.3, below). Figure 3.3 - Agricultural zones with raster data at 1:250000 scale
Source: MINAGRI.
3.5 Land Capability Classification Arable land for agriculture. A prerequisite for the preparation of a national land use and development master plan - especially for a country highly dependant on agriculture like Rwanda – is availability of information on the capability of the land for agricultural production. The land capability classification of arable land is ordered according to its potentials and limitations for sustained agricultural production. The non-arable land is ordered according to its potentials and limitations for the production of permanent vegetation.
The 1:250000 soil map (3.3, above), together with topographical and climatic data, has been used to prepare mapping for land capability for agricultural production mapping of Rwanda. A purpose-designed GIS analysis tool (ESRI software) has been utilised in the preparation. The analysis was conducted by Ghent University. The ‘Land capability map’ is in digital, raster, format at a scale of 1:250000 (Figure 3.4, below).
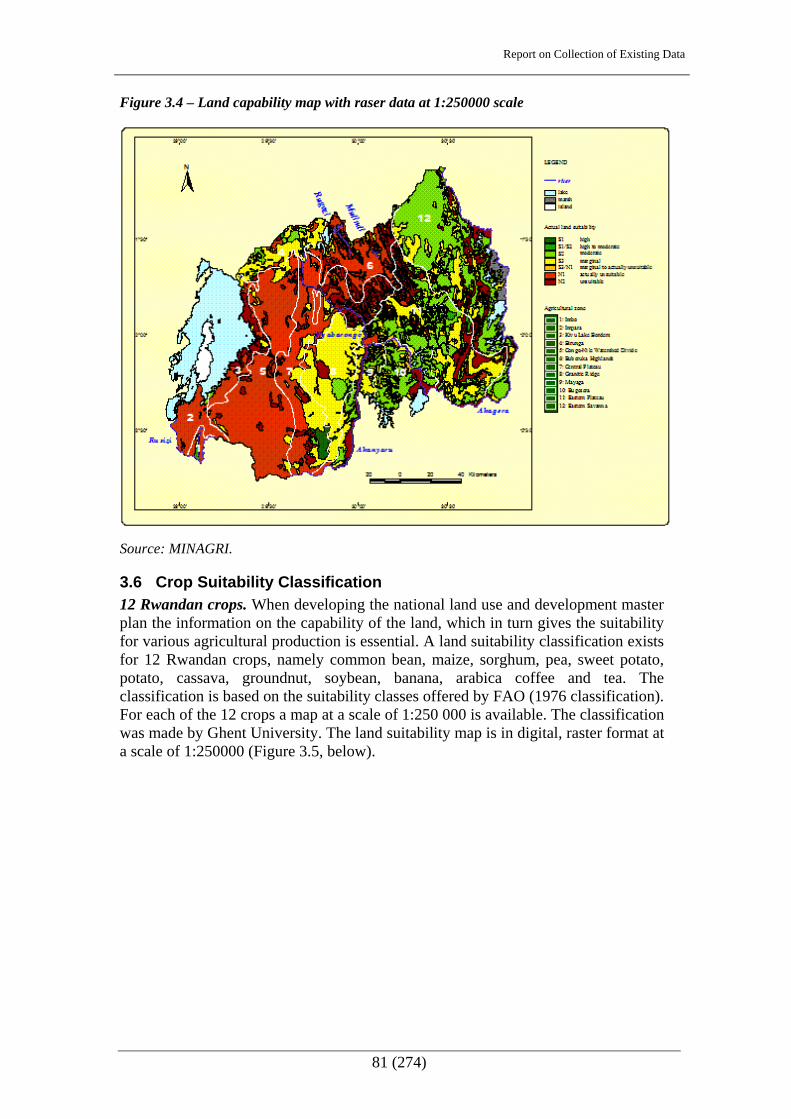
Report on Collection of Existing Data
81 (274)
Figure 3.4 – Land capability map with raser data at 1:250000 scale
Source: MINAGRI.
3.6 Crop Suitability Classification 12 Rwandan crops. When developing the national land use and development master plan the information on the capability of the land, which in turn gives the suitability for various agricultural production is essential. A land suitability classification exists for 12 Rwandan crops, namely common bean, maize, sorghum, pea, sweet potato, potato, cassava, groundnut, soybean, banana, arabica coffee and tea. The classification is based on the suitability classes offered by FAO (1976 classification). For each of the 12 crops a map at a scale of 1:250 000 is available. The classification was made by Ghent University. The land suitability map is in digital, raster format at a scale of 1:250000 (Figure 3.5, below).

Report on Collection of Existing Data
82 (274)
Figure 3.5 – Crop suitability map with raster data at 1:250 000 scale
Note: Map is depicting suitability for bean production.
Source: MINAGRI.
3.7 Hydrogeological Map, Wells Archive Through an IFAD funded project on borehole drilling carried out in three districts in the Eastern Province in 2006-7, a spread sheet containing technical descriptions is identified. The descriptions involve design, depth, water capacity, ground water level and geographical position (Table 3.2, below).
Table 3.2 – Drilling Register
Dis
tric
t
Secto
r
S ite na
me
X UTM
/UPS
Y UTM
/UPS
Altitu
de in
m ab
ove s
ea le
vel
Date
complet
ion
Contr
actor
Nature
base
ment:
grani t
e=gr
schis
t=sc
mica
schis
t+msc
quart
zite=
qz w
eath
ered=
w
Water s
trike
1 in
mbg
Water
strike
2 in
mbg
Water s
trike 3
in m
bg
Water s
trike 4
in m
bg
Water
strike
5 in m
bg
uPVC P
ipe in
terna
l diam
eter i
n mm
Sta tic W
ater le
vel
Yield d
uring
drilli
ng m
3/hr
Yield
at de
velop
ment m
3/hr
Total
depth
Yield
pump t
est m
3/hr (
A
Dra
Gatsibo Rwim bogo Ndam a 214171 9820120 1437 28-01-07 Dri llcon 81,85 gr 51 55 57 72 110 21,09 0,80 0,80 0 ,70 12,53 182 Gatsibo Rwim bogo Mucucu IV 229654 9830627 1317 05-02-07 Dri llcon 81,85 sc 55 72 78 110 29,17 2,25 2,25 1 ,62 10,27 405 Gatsibo Rwim bogo Mucucu I 232495 9827510 1357 07-02-07 Dri llcon 90,05 sc - - - - - - - - Gatsibo Rwim bogo Mucucu III 232491 9827507 1356 09-02-07 Dri llcon 53 gr 39 43 47 110 27,71 0,73 0,73 0 ,95 2,91 167
Gatsibo Munini Kabeza 222524 9817694 13-06-07 Dri llcon 45,2 qz 30 36 39 42 45 110 25,40 2,70 2,70 2 ,06 3,90 394
Kayonza Mwil i Kageyo 1 238488 9796784 1306 03-11-06 Dri llcon 90,95 qz 87 110 46,39 0,20 0,20 Kayonza Mwil i Kageyo 2 238550 9797126 1312 04-11-06 Dri llcon 91,05 qz 73 76 91 110 18,80 4,80 4,80 2,11 6,19 427 Kayonza Mwil i Kageyo 3 239773 9796015 1301 03-12-06 Dri llcon 90,68 sc 85 90 110 36,76 0,50 0,70 0,57 28,24 157 Kayonza Mwil i Kageyo 4 238554 9797122 1312 06-07-07 Dri llcon 89,85 sc - - - Kayonza Mwil i Kageyo 5 239381 9796456 1301 07-07-07 Dri llcon 89 sc - - - - Kayonza Mwil i Murori 228743 9790588 08-09-07 Dri llcon 40,57 gr 12 20 26 110 1,52 0,78 0,78 0,70 12,38 165
Kayonza Gahini Kahi 230995 9807708 1446 23-03-07 Dri llcon 86 s c + qz - - - - - - Kayonza Gahini Ts ima I 232315 9796800 1448 24-03-07 Dri llcon 76,85 sc 51 59 65 74 110 33,95 3,20 3,20 2,03 8,87 140 Kayonza Gahini Ts ima II 233583 9794673 1432 29-03-07 Dri llcon 91,05 sc - - - - -
Nyagatare Karangazi Mbar e II 208764 9845728 1359 21-04-07 Dri llcon 34,85 qz 12 16 110 10,40 2,40 2,40 1,05 3,98 578 Nyagatare Karangazi Karangazi II 210139 9846486 1360 15-12-06 Dri llcon 56,85 qz 19 23 31 110 5,27 6,00 6,00 1,91 8,88 514 N
- - - -
- -
-
yagatare Karangazi Karangazi I 209023 9845003 1361 18-12-06 Dri llcon 51,2 msc 19 33 37 110 12,20 2,70 2,70 2,63 6,38 898 Nyagatare Karangazi Karama 208208 9831076 1395 09-04-07 Dri llcon 67 gr - - - N
- - yagatare Karangazi Musenyi II 210052 9833556 1362 23-01-07 Dri llcon 66,85 gr 41 54 56 58 110 17,70 2,00 2,00 0 ,87 11,25 248
N Iyagatare Karangazi Musenyi 209727 9834038 1361 18-08-07 Dri llcon 35 msc 23 110 15,11 2,00 2,00 1 ,05 2,71 336
Nyagatare Ny agatare Burumba I 206894 9855907 1326 09-01-07 Dri llcon 70 msc + gr 47 57 110 29,29 2,45 2,45 0 ,95 15,64 316 Nyagatare Ny agatare Bushoga 201294 9849448 1370 16-02-07 Dri llcon 45 gr 25 35 110 6,78 1,60 2,57 2 ,59 22,85 185 Nyagatare Ny agatare Barija 203135 9859257 1429 08-01-07 Dri llcon 90,75 gr 13 66 82 110 3,15 1,20 1,20 0 ,77 17,40 626
N 204203 9839759 147yagatare Katabage Ny ak igando 2 01-01-07 Dri llcon 91 msc + gr 91 110 0,17 0,17 yagatare Katabage Rutoma 200361 9840510 1397 09-03-07 Dri llcon 40 gr 15 18 27 33 110 1,87 3,00 3,00 1,74 17,N 35 297
Nyagatare Katabage Ntom a 202565 9838350 1387 03-03-07 Dri llcon 41 gr 9 23 110 17,04 0,76 0,75 0,71 5,04 259 Nyagatare Katabage Katabagem u 197903 9837220 1407 18-03-07 Dri llcon 43 qz 11 19 31 110 3,00 2,55 2,55 1,80 21,10 193 Source: MINAGRI.

Report on Collection of Existing Data
83 (274)
3.8 Geological Map of Rwanda Rock outcrops. With the Department of Geology and Mining, MINIRENA, there is a geological map at a scale of 1:250000 dated 1982. The map is in digital, raster, format (Figure 3.7, below). The map, together with superimposed topographical contours can be utilised for identifying and demarcating rock outcrops. Figure 3.7 – Geological map with raster data at 1:250000 scale
Source: MINAGRI.
3.9 Issues
3.9.1 General Need to address seamlessness in soil data base. Whereas there is an excellent Rwandan soil map at a scale of 1:50000 and an associated soil data set package that will fully suffice to meet the specific requirements of the present Project, the situation that the soil map database is not found in a seamless database is an issue that need to be addressed for multi-purpose advantages towards soil data management efficiency in the country. The recommendation is to establish a seamless – edge-matching of soil boundaries - soil map database.
Agricultural zones map accuracy limited. The agricultural zones map may be used at a national planning and reporting level in the present Project. With the variety of parameters depicting the different zones, the mapping accuracy achieved, however, will only allow for an equivalent scale of 1:250000.
Land capability and crop suitability map accuracy limited. The land capability and crop suitability mapping in 1:250000 will suffice to meet generalized requirements of the present Project on national planning level. To meet the specific requirements

Report on Collection of Existing Data
84 (274)
at district planning level there is a need to make the land capability and crop suitability analysis directly from more accurate 1:50000 soil maps.
Ministry soil mapping capacity needs strengthening. The soils related data is with the custodianship of MINAGRI. The institution to deal with the soil mapping - and interlinked production of land capability and crop suitability classifications and mapping - is the Ministry’s Soil Survey Unit. At present this function is handled by one staff, mainly working as GIS officer. For maintenance, as well further development of the soils data set, there is a need to increase human resources and technical capacity. The recommendation is that the Soil Survey Unit is strengthened to this end.

Report on Collection of Existing Data
85 (274)
4 Agriculture 4.1 Summary Focus on DDPs. The inventory of data pertaining to agriculture in Rwanda is essentially based on the 30 District Development Plans (DDPs) completed in 2007. Resources and efforts have been spent at all levels from central to local, including cell and village, levels to achieve nationwide prioritised planning through a participatory approach. The analyses made for this purpose have lead also to identification of major problems and constraints, and each District has ranked the identified 10 problems considered as most important. The first priority set of problems, in most cases, has been identified in the DDPs as low level of agricultural production, ie crops and livestock, deforestation, and erosion - all key issues in the agricultural sector. One of the key concerns is the decrease in average farm size - at 1.0 ha in 1983 to 0.72 ha in 2006 - to a level where it can hardly provide sustainable livelihood for a family, and not allow developing modern, rational farming systems with increased productivity.
Better practices and land use and settlement plan. Some DDPs include, more or less specifically, address to development of a district land use and settlement development master plan, management of marshland or wetland, irrigation works, retention structures for rainwater, etc, as tools for balanced development of the district. They also include a need for identification of fertile areas for cultivation, grouping homesteads in rural centres, ie imidugudu, and thus, a quest for liberating land for agriculture to allow for mechanised farming. A related aspect, raised in the DDPs is ‘La regionalisation agricole’, which entails growing crops and keeping livestock adapted to the specific edaphic and climatic conditions in a certain area, thus providing potential for high production. An agricultural sub-sector not specifically mentioned in the DDPs is urban agriculture, which is already practised in the capital and bigger towns in Rwanda. It may, nonetheless, be virtuous to investigate if there is a need for structuring and organising such a sub-sector to fully exploit its potential for contributing to improved food security. Kampala, in Uganda, offers an interesting case in point as of the most advanced cities in this respect, and the results achieved there may give inspiration for similar development in Rwanda.
Need for GIS among issues. The DDPs are the result of a recent, thorough development planning exercise, including the agricultural sector and land use issues. Their further elaboration will benefit from a GIS backed planning environment at the district level as a planning and implementation tool for implementation of the Plans. Pilot exercises with such environment with 3-4 districts could be useful in this connection. Sub-section 4.8, below, presents land use related problematic issues, which have emerged of relevance for the national land Use and Development master Plan Project as result of the so far carried out inventory of agricultural data.
4.2 Introduction Available data with limitations. The most up to date agricultural statistics the author of this section of the present report has secured is the Rwanda Agricultural Survey 2006 (NISR, 2007). The structure of the data, however, corresponds to the former administrative units, ie 11 Provinces including Kigali Ville/Kigali Ngari. There is according available information, no developed conversion programme to adapt the data in the survey to the present administrative structure in the country with four
Report on Collection of Existing Data
86 (274)
provinces and Kigali City, comprising altogether 30 Districts. The District Development Plans (DDPs), finalised mid 2007, include data on the present situation relating to agriculture in each district and, a few, of its sectors6. Whereas useful reference has been made to the Rwanda Agricultural Survey 2006 in the present Project agricultural inventory, inventory data from the DDPs have been found more useful in relation to the needs for preparing the present Project national Land Use and Development Master Plan. Notwithstanding, the found data is sometimes limited, not always ‘inter-DDPs consistent’. As far as agro-ecological zones are concerned, the situation regarding available data is the same as reported by the present Project Ecologist, ie mapping of the zones will need to be done in accordance with recent a GIS mapping exercise undertaken by MINAGRI as part of the ‘2002 Schema d’Amenagement des Marais, de Protection des Bassin Versants et de la Conservation des Sols’. This study includes a database with shape files relating to land suitability, agro-climatic and agro-ecological zoning and soil distribution. The database and shape files were, however, were not available at the time of writing. It should also be considered to what extent the ‘A Large-Scale Land Suitability Classification for Rwanda’ (Verdoodt and van Ranst, Ghent University, 2003) can be used.
4.3 DDPs DDP with local priorities in line with Government policy. The DDPs are found in conformity with Government policy for development of the Rwanda, which means they comply with: Vision 2020 (July 2000); Vision 2020 Umurenge; An integrated Local Development Program to Accelerate Poverty Eradication, Rural Growth and Social Protection; EDPRS Flagship Program Document (August 2007); National Agricultural Policy (March 2004); Strategic Plan for Agricultural Transformation In Rwanda (October 2004); and, others. The DDPs are also found congruent with Governments’ Good Governance Policy, and Decentralisation Policy, and, therefore, with the national administrative reform with effect from 1st January 2006 - entailing 5 provinces, 30 Districts and 413 Sectors, as well as with the policy of promoting the private sector. Significant resources and efforts have, thus, been spent at all levels - from central to local, including cell and village, levels to achieve nationwide district-prioritised planning through a participatory approach.
Identification of problems and constraints. The DDPs are based on analyses of the existing situation in the districts and proposals for ways forward, which has embraced reviewing current and future public and private sector engagement in education, health and physical infrastructure. With regards to agriculture this engagement including crop and livestock production, processing and marketing. These analyses lead to identification of major problems and constraints to the wanted development. These have been ranked according to importance as perceived at sector level. In many cases the low agricultural production - often below food self-sufficiency - is considered to be the most important problem (Table 4.1, below).
6 The total number of Sectors in Rwanda is currently 413.

Report on Collection of Existing Data
87 (274)
Table 4.1 - DDP problems identified and ranked in one typical district
Problem ranking
Major problems identified Sector
1 low level of agricultural production, ie crops and livestock, deforestation and erosion
agriculture and livestock
2 difficult access to drinking water and poor hygiene water and sanitation
3 insufficient infrastructure and equipment related to schools and education
education
4 difficult access to health services health 5 Living areas anarchistic and not organized
physical planning and urbanisation
6 insufficient capital and poor organization of co-operatives
financial systems and co-operative movement
7 insufficient buildings for the administration
administration and good governance
8 isolated location of communities, ie insufficient and isolated poor state of roads and communication infrastructure
transports and communication
9 insufficient availability of electric energy energy 10 only few opportunities for youth and
recreational possibilities only little developed youth, sports and recreation
Source: DDP Gicumbi, 2007:iv.
Priorities of the population. Any development plans, like the DDPs, will only be relevant if they are based on thorough knowledge of the existing situation and developed through consultation and participation, ie with support from the population, local administration and, possibly, development partners, be they private sector businesses, donors or NGOs. If local revenues are not sufficient, central government may also need to assist with human and other resource capacity including finance. The backbone of Rwandan DDPs is interventions responding to priorities of the population formulated as projects within the relevant sectors. The Plans have been approved by the District Councils after deliberations with participation of representatives from civil society and the population at large. In the Rwandan DDP case, a stated perceived particular problem is fear that the stipulated planning process may not be respected. The compilation of DDP information about the local situation is made at cell level, and are based on the results coming from the villages, imidugudu, in the cell. It is supported by the different decentralised administrative units of district departments. All categories of the population are given a voice in a concerted action to prepare the DDPs in a response to the realities of the district and on the national strategy for economic development and poverty reduction as defined in EDPRS, objectives of the Millennium Development Goals (MDG) and Vision 2020.

Report on Collection of Existing Data
88 (274)
Box 4.1 – DDP participation
Accelerated Participatory Research. The preparation of the DDPs has involved all layers of the population. The methodology used is based on ‘Accelerated Participatory Research’, which is based on participation of the population in the identification of the needs, analysis of problems and major constraints that are perceived to constrain development of the district and the communities living in towns and villages that constitute the habitat that the district wants to progress between now and 2012. The search for solutions with a participatory modality encourages the population to engage actively in the formulation of development proposals. To be implicated means that the population makes its priorities. Because they are likely to know the local specificities best, participants in the DDP preparation are able to base their needs on what, at least, they perceive as realities.
Intensification and rationalisation. Economic development in Rwanda currently depends heavily on agriculture, including crop and livestock production as well as fisheries for subsistence and diversified and refined products for export. The development vision and policy of Government puts strong emphasis on intensification and rationalisation of agriculture, and to decrease the proportion of the population working in this sector from 80-90 % to 50 % by 2002. To achieve this will require development of small and medium enterprises, financial systems with credit and savings and increasing investments in the rural sector. It will need address to crosscutting issues of gender and environment, among others, and the introduction and adoption of Information and Communication Technology (ICT) as a development tool. Poverty reduction will be a product of combined efforts from all participants. It will be necessary to increase the productivity of the land, ie production per unit of surface or yield, in a parallel effort to create employment outside the agricultural sector.
4.4 Present agricultural situation
4.4.1 Statistics on national agricultural production Context. In 2006 the agricultural population was 7567443 and the total number of households 1524424 NISR, 2006:13. The average farm size was 0.72 ha, which means a reduction over 24 years by 30 %. Compared to 1983, the average size was 1.0 ha (ibid:16). To prevent the trend, Government conceived 2005 through the Ministry of Agriculture and Animal Resources (MINAGRI) a National Agricultural Policy and a Strategic Plan for Agricultural Transformation in Rwanda (PSTA) – it is imperative that is implemented as a priority.
General statistics. The following statistics are obtained from Rwanda Agricultural Survey 2006 (ibid:16-8).
• there are two active members per household - a calculation shows that main farming activities on 0.72 ha require 103 days per season7, ie 57 % of 180 days;
• on 97.16 % of the land the production depends on rainfall - only 1.64 % is under irrigation and 12 % has been drained;
• cultivation methods are traditional, ie manual with hoe and machete, on 98 % of the land - only on 1.4 % is used animal traction and only on 0.1%
7 It should be remembered that there are two agricultural seasons per year and in some areas three.

Report on Collection of Existing Data
89 (274)
machinery - these figures show that much can still be done to improve productivity and production;
• on average 29 % of the cultivated land has no protection against erosion and only 12.5 % have terraces, whereas 25.7 % are protected with trenches - it is estimated that of the land protected against erosion, 36.9 % have radical terraces, 12 % progressive terraces and 40.7% trenches.
Fertiliser use. The use of fertiliser is as follows:
• compound fertilisers, with a content of Nitrogen, Phosphorous and Potassium (NPK) - used by 70964 households;
• di-ammonium phosphate (DAP) - used by 18379 households;
• nitrogen fertilizer, urea - used by 14014 households; and,
• lime to neutralise excessive acidity – used by 4740 households.
73 % of households using fertiliser live in Gisenyi and Ruhengeri area, where production of potatoes, vegetables and pyrethrum is common. All the households using lime live in the Gikongoro area where large areas have acid soils.
4.4.2 Major agricultural crops Cereals and legumes. The national production of maize is lower than consumption. The deficit is covered from imports, some of which from Uganda. Rice production is increasing and some is exported to DRC. About 80 % of households in Rwanda produce beans, which are a major source of protein, ‘the poor man’s meat’. Peas are considered a minor crop, and are mainly produced in high altitude areas. They require a relatively fertile soil and application of manure and/or chemical fertiliser. Groundnut is also a minor crop although it is one of the sources of vegetable oil in Rwanda. Soya is more important for oil production, which is vital because the majority of the rural population do not get enough fat in the diet. The soya is mainly produced in the Gitarama area where processing is also taking place. Sunflower production is also increasing and becoming more important as a source of vegetable oil.
Roots, tubers and banana. Cassava is mainly produced in the southern part of the country where it is both a food crop and a cash crop. One of the constraints on cassava production is the plant disease ‘mosaic’ virus. Rwanda is exporting cassava flour to Europe. Sweet potato production has decreased - to some extent because rice is replacing it in cultivated marshland and wetland areas. It is grown throughout the country and is considered a food security crop. ‘Irish’ Potato production is concentrated in the northern part of the country, and has increased considerably. Some is exported to Burundi. Banana production is by volume the most important crop in Rwanda. Part of a production decrease over the last 20 years is due to disease problems. New, resistant – and higher yielding – plant material is needed to overcome this problem. Bananas are imported from DRC and Uganda to meet the domestic demand (Table 4.2, below).

Report on Collection of Existing Data
90 (274)
Table 4.2 - Production of some food crops in Rwanda 1986 and 2006 in tonnes
1986 season A+B 2006 season A+B Crop
Total production Total production
Change 1986-2006
Cereals
sorghum 158878 206520 +47642 (+30 %)
maize 135003 94145 -40858 (-30 %)
wheat 14919
rice 34197
Legumes
beans 278286 389396 +111110 (+40 %)
peas 19036 41161 +22125 (+116 %)
groundnuts 12332
soya 19624
Banana
cooking 554635 385186 -169449 (-31 %)
for wine 1596038 834497 -761541 (-48 %)
apple banana 247408 85881 161527 (-65 %)
Total 2398379 1305564 -1092815 (-46 %)
Roots and Tubers
sweet potatoes 861904 741497 -120407 (-14 %)
potato 241466 654,889 +413423 (+171 %)
cassava 361899 323981 -37918 (-10 %)
taro 95176
Source: NISR, 2006:20-7.
Rabbits, goats and cattle dominate. The livestock situation in Rwanda is recorded in 2006 (Table 4.3, below). Table 4.3 - Livestock 2006
Category of livestock Total Local breed Improved breed
cattle 1122179 1035402 86777
sheep 695367 683616 11751
goats 2655798 2640362 15436
pigs 527531
chickens/fowls 1714989 2936
other poultry 97120
rabbits 418361
Source: NISR, 2006:36-7.
Report on Collection of Existing Data
91 (274)
4.4.3 DDP Perceptions Variation on common theme. Each of the 30 DDPs presents the situation 2006-07 in the district with similar types of problems and constraints for development of the agricultural sector. There is, however, variation between and within districts, in the perceived importance of problems by the populations.
Economic engine with problems. Emerging from the review of DDPs is an inherent common understanding that the agricultural sector – occupying about 80 % of the population - remains the engine in economic development, although it is faced with the constraint of lack of arable land coupled with degradation of the cultivated land by erosion. It is necessary to develop other sectors, which can give employment for the artisan sector, industry and tourism to contribute to achieving Vision 2020.
Change of mindset needed. There is, among general constraints, observed opposition among the rural population - classified in the DDPs as ‘obscurantism’ and ‘conservatism’. A category of farmers do not adapt easily to changes intended to improve practices through adoption of modern techniques. A change of mentality and know-how is, thus, required in changing a subsistence economy to a market economy.
Below poverty line. The majority of the rural population lives with incomes below the poverty level. In the DDPs mentioned reasons for this are the use of traditional methods in crop and livestock production, little investment in the rural sector as such, high population growth rate and the artisan and industrial sector being only little developed.
4.5 Agricultural Problems
4.5.1 General problems Pertaining from the initial present Project inventory of the agricultural situation in Rwanda, the general problems concerning the country’s agriculture may be listed, without internal ranking, as follows:
• reduction of the area of arable land because of increasing population pressure;
• continuous division of land into smaller areas and holdings;
• demographic growth not proportionate to the growth of resources at disposal;
• low total production due to lack of arable land;
• overexploitation of land;
• distribution of rains not appropriate;
• climatic risks with drought and flooding;
• scattered location of homesteads makes a rational allocation of land and optimal use difficult;
• lack of knowledge among farmers of modern agricultural technology;
• limited technical knowledge of the use of inputs;
• insufficient extension service and lack of extension agents and veterinarians;
Report on Collection of Existing Data
92 (274)
• lack of financial means at the disposal of the farmers - difficult access to agricultural credit; and,
• week co-operation between civil society, private sector and the public sector.
4.5.2 Specific problems As of the initial present Project inventory of the agricultural situation in Rwanda, specific problems concern crop production. They are listed, without internal ranking, as follows:
• cultivation without fallow;
• cultivation manual with farmers lacking knowledge of use of draft animals;
• lack of irrigation facilities;
• irrigation technology not known therefore almost only rain fed agriculture;
• soil erosion is a handicap for the agricultural development;
• erosion is removing every year considerable amounts of the arable soil layer;
• low fertility acid soils;
• marshland and wetland suffer from stagnant water and deposition of soil particles due to erosion in higher altitudes;
• lack of improved seed, chemical fertilizer and manure;
• not enough agricultural input stores;
• lack of improved banana planting material;
• lack of fruit tree seedlings;
• old coffee trees with low productivity have been abandoned because coffee growers do not all know need for regular maintenance of the coffee trees;
• lack of agro forestry tree seedlings;
• agricultural tools at disposal are practically limited to hoe and machete; and,
• where radical terraces have been constructed and marshland and wetlands have been reclaimed, these areas are not fully exploited because of lack of inputs, etc.
Cattle for manure. The soil is degraded to a degree where people in some cases keep cattle that are not their own - not just to have an animal, but to get manure for application on their land. This is the consequence of the land being degraded to an extent where it will not produce if fertiliser or manure is not applied. The value of the soil lost every year can be calculated as the value of the amounts of plant nutrients lost if they were to be replace by application of fertiliser.
Potential. The yields are low because in general traditional cultivation methods and practices - as well as not improved seed and plant propagation material8 - are still used. In spite of general and specific problem, she potential for increase in productivity and production in Rwanda is high (Table 4.4, below).
8 Multiplication of banana, cassava, sweet potato, (Irish) potato and others is not done by seed, but by cuttings, of shoots ao.
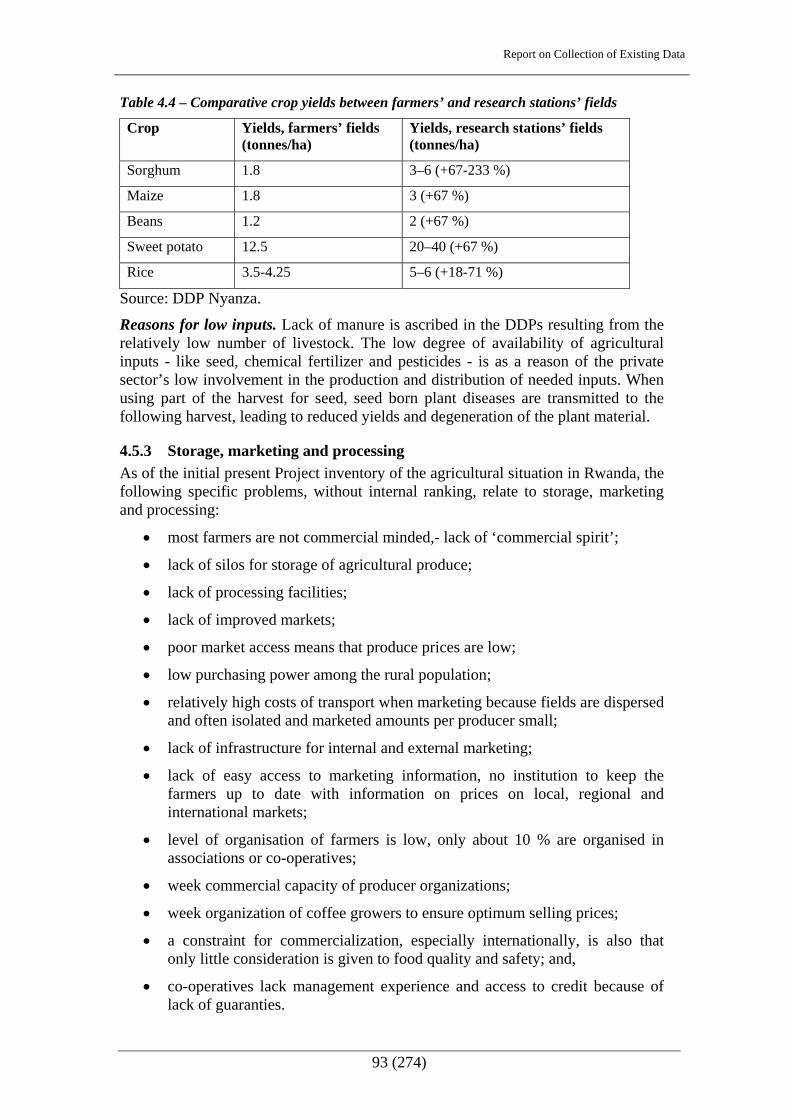
Report on Collection of Existing Data
93 (274)
Table 4.4 – Comparative crop yields between farmers’ and research stations’ fields
Crop Yields, farmers’ fields (tonnes/ha)
Yields, research stations’ fields (tonnes/ha)
Sorghum 1.8 3–6 (+67-233 %)
Maize 1.8 3 (+67 %)
Beans 1.2 2 (+67 %)
Sweet potato 12.5 20–40 (+67 %)
Rice 3.5-4.25 5–6 (+18-71 %)
Source: DDP Nyanza.
Reasons for low inputs. Lack of manure is ascribed in the DDPs resulting from the relatively low number of livestock. The low degree of availability of agricultural inputs - like seed, chemical fertilizer and pesticides - is as a reason of the private sector’s low involvement in the production and distribution of needed inputs. When using part of the harvest for seed, seed born plant diseases are transmitted to the following harvest, leading to reduced yields and degeneration of the plant material.
4.5.3 Storage, marketing and processing As of the initial present Project inventory of the agricultural situation in Rwanda, the following specific problems, without internal ranking, relate to storage, marketing and processing:
• most farmers are not commercial minded,- lack of ‘commercial spirit’;
• lack of silos for storage of agricultural produce;
• lack of processing facilities;
• lack of improved markets;
• poor market access means that produce prices are low;
• low purchasing power among the rural population;
• relatively high costs of transport when marketing because fields are dispersed and often isolated and marketed amounts per producer small;
• lack of infrastructure for internal and external marketing;
• lack of easy access to marketing information, no institution to keep the farmers up to date with information on prices on local, regional and international markets;
• level of organisation of farmers is low, only about 10 % are organised in associations or co-operatives;
• week commercial capacity of producer organizations;
• week organization of coffee growers to ensure optimum selling prices;
• a constraint for commercialization, especially internationally, is also that only little consideration is given to food quality and safety; and,
• co-operatives lack management experience and access to credit because of lack of guaranties.

Report on Collection of Existing Data
94 (274)
One DDP advances that livestock and beekeeping are developing thanks to one major market outlet – a weekly market with hundreds of traders from surrounding districts and from RDC. In many cases marketing is difficult because of bad roads. Farmers are motivated to increase the production on condition that chances of an additional income are sufficiently high. This requires that transportation and marketing are efficient, facilities for storage of perishable produce available and market prices favourable.
4.5.4 Livestock production As of the initial present Project inventory of the agricultural situation in Rwanda, the following specific problems, without internal ranking, relate to livestock production:
• number of livestock has been reduced during the Genocide in 1994;
• livestock population is almost only traditional, low yielding breeds;
• breeding programmes for genetic improvements of livestock population, eg artificial insemination and introduction of breeding bulls, are weak;
• lack of pastures, low productivity of pastures, overgrazing;
• insufficient cultivation of fodder crops;
• lack of drinking water supply for livestock;
• insufficient nutrition of livestock, in terms of quantity and quality, because of poor pastures, lack of water and limited use of agricultural by-products for fodder;
• livestock diseases;
• lack of veterinarians;
• lack of veterinary services like dispensaries, pharmacies, laboratories and cattle dips;
• lack of veterinary medicine and other veterinary inputs;
• lack of infrastructure for storage and processing of livestock products (milk and meat cold stores; and,
• livestock markets not organised.
4.5.5 Fisheries As of the initial present Project inventory of the agricultural situation in Rwanda, the following specific problems, without internal ranking, relate to fisheries:
• fish ponds damaged;
• poor organisation of fishing; and,
• week organisation of fishermen in co-operatives.
4.5.6 Beekeeping As of the initial present Project inventory of the agricultural situation in Rwanda, the following specific problem relate to beekeeping:
• majority of the beehives are of traditional types.

Report on Collection of Existing Data
95 (274)
The yield from traditional bee hives are about two kg honey per year, compared to 50 kg from improved types of hives. The price paid to the producer is about the equivalent of one USD per kg.
4.6 Issues
4.6.1 Land use planning Need for land use and development plan to manage a range of issues. Some DDPs, eg that of Kirehe’s, advance specifically land use and development planning as an important element in the development of the agricultural sector, and that it is precondition for development of the district. It should pave the way for construction of basic infrastructure like energy - hydroelectric, biogas or solar energy – and roads. They see the need for development of a master plan to manage land use and settlement, marshlands and wetlands, irrigation and retention of rainwater. The master plan should include topographical, pedological and geological maps. The purpose of the land use plan should among others be to:
• identify fertile areas, and, thereby, reserve these for the cultivation of appropriate crops; and,
• group the homesteads in rural centres to liberate land for agriculture and allow mechanised cultivation.
4.6.2 Regionalisation Consideration of non-agro bio-climatic factors. The term, regionalisation of agriculture, means growing crops and keeping livestock, which are adapted to the specific edaphic9 and climatic conditions in a certain area where they have a potential for high production. Introduction of agriculture based on regionalisation is considered an important means by Government for developing the agricultural sector in Rwanda (MINAGRI, 1998). In its logical conclusion, it would entail that less than 10 crops would be grown in the district (Table 4.5, below). Table 4.5 - Regionalisation of crops by agro bio-climatic zones
Zones Very favourable crops Favourable crops
Southern Plateau (Bwanamukali) rice
soya
coffee
babana
haricot volubil
sorghum
Mayaga rice
soya
sugar cane
coffee
manioc
beans (haricot nain)
sorghum
Source: MINAGRI, 1998.
In the context of edaphic and climatic suitability for crop cultivation and livestock keeping, it should be noted that other factors than these agro bio-climatic ones may be taken into consideration in the choice of crop or type of livestock, ie: food security and market prices. The present Project agricultural specialist has not found
9 Influenced by factors inherent in the soil rather than by climatic factors.

Report on Collection of Existing Data
96 (274)
analyses and assessments of the costs and benefits - short term and long term - of the proposed regionalisation of agriculture in Rwanda if non-agro bio-climatic considerations were considered (see also Section 8 on Social Infrastructure).
4.6.3 Imidugudu Cost-benefit analyses. Generalised, there are two types of homesteads in Rwanda - dispersed and grouped. The former not only makes it difficult to supply quality services and basic infrastructure. It is also a waste of land, which could be used for crops or pastures. Grouping homesteads is, therefore, considered of vital importance by Government to increase the area of land that can be cultivated and to facilitate access to basic infrastructure, like drinking water, sanitation and health posts, and management of the environment including reclamation of swamps, protection of slopes, etc. The present Project Agricultural specialist has not found any short-long term cost-benefit analyses of the proposed grouping of homesteads, but claims that it is known from Denmark, when a land reform was implemented around the end of 1700, the effect of reallocation and redistribution of land was enormous, and is considered the kick-start of the development of the agricultural sector and in rural parts of the country. Box 4.2 – Danish land reform
Consolidation. Each farmer had small pieces of land scattered around the village. The land was surveyed, and the good and poor qualities assessed. Farmers were then resettled with their land consolidated around the homesteads. The total farm size was adjusted according to the previous total area and quality, so that the result - before and after - could be as neutral as possible. A fantastic achievement at the end of the eighteenth century.
4.6.4 Urban agriculture Definition. Urban agriculture can be defined as distinguished from rural agriculture by its integration into the urban economic and ecological system. Urban Agriculture is an industry located within (intra urban) or on the fringe (peri urban) of a town, city or metropolis, which grows or raises, processes and distributes a diversity of food and non-food products and services found in and around that urban area, and in turn supplies human and material resources, products and services largely to that urban area.
Address to potential. Urban agriculture is noticeably already practised in Rwanda, not least in the capital, Kigali. Considering that the current national agricultural policy visions is that the agricultural population should decrease from 80-90 % to 50 % before 2020 and the imidugudu grouping homesteads, the feasibility of consolidating the concept of urban agriculture should be considered. Observation of one of the districts in the City of Kigali, however, shows that already practiced urban agriculture in the district is not organised or regulated. Address to the potential of urban agriculture could lead to better utilisation of scarce resources and benefits. Its sustainable practice, however, requires both health and environmental considerations. The risks of using polluted water for irrigation and of leaching of agricultural chemicals, for instance, would need to be eliminated.
Report on Collection of Existing Data
97 (274)
Box 4.3 – Urban agriculture in Kampala
Urban agriculture enabled. In Kampala, the capital of Uganda, the urban local government has a whole department dealing with agriculture, and has developed a typology of urban and peri-urban farming systems to apply to what goes on within its boundaries. Kampala City Council (KCC) has carried out a review of legislation governing urban food production and distribution. New by-laws on urban agriculture, livestock, milk, meat and fish production, processing and marketing passed in 2004 and came into force in 2006. It is recommended, that Kigali and the bigger towns in Rwanda take a look at the situation in Kampala, to identify measures, which could be of interest in developing urban agriculture in Rwanda.
4.7 Way forward
4.7.1 Tools Updating of maps and use of GIS. Updating of maps is of utmost importance as a tool in the development process, not least in the development of the agricultural sector that in many countries is the biggest player in the management and use of land. Geographical Information Systems (GIS) have been introduced in the so called developed countries as a tool also in the implementation and enforcement of rules and regulations related to land use. In Rwanda, at this stage, a detailed, functional GIS, accessible not only central level, but also district and, possibly, sector level, would be extremely useful.
Pilot projects. In the present Project, ensuing proposals - in a situation of competing and conflicting land use demands – should attempt to embrace how development, implementation, maintenance and use of GIS at the local government level may benefit also the agricultural sector. In practise this could be initiated through pilot activities with a limited number of districts. Selection criteria of piloting districts could be such that a range of districts were chosen, from those with already demonstrated high planning skills to those where planning skills could be improved.

Report on Collection of Existing Data
98 (274)
5 Forestry 5.1 Summary Forest for livelihood and woos supply. This report presents the current situation of the Rwandan forestry sector in the framework of the preparation of the Rwanda national Land Use and Development Master Plan. To this end, documentation and literature has been reviewed, and contacts taken with relevant institutions and stakeholders involved in the management of the forestry sector. Among these are the forest service of MINIRENA, NAFA, CGIS-NUR, ISAR and REMA. Interviews were also held with resource persons, knowledgeable in the field. The data and information collected so far allows for an in inventory of the situation of the Rwandan forestry sector in terms of the:
• forest resource available;
• management of the forest resource and the sector in general and the institutions involved; and
• forest products and their utilisations, and more specifically the demand and supply of wood.
The report also sheds light on the importance of the forests and the forestry sector in the economy of the country and the livelihoods of the population.
Issues and challenges. During the collection process, it was possible to identify issues and challenges facing the development of the forestry sector. The main ones are the following:
• high wood deficit (the imbalance between the demand and the supply) and more specifically the high dependency on biomass as a source of household energy which has a negative impact on the forest ecosystems of the country;
• high competition from other land uses - agriculture, livestock, imidugudu human settlements - threatening in some areas the existence of the forest;
• forest management practices, which are not environmentally sensitive (old, degraded and unproductive forest plantations with soil erosion underneath); and
• weak administrative structures for the implementation of existing forest laws, regulations and other legal instruments.
5.2 Introduction Competing land use. Within the framework of the present Rwanda national Land Use and Development Master Plan Project, thematic studies are to be undertaken and the forestry is identified as one of the sectors to be analysed. The common aim of these studies is to collect and compile relevant data, and to subsequently analyse it to get information that can feed in the preparation of the Master Plan preparation. The forestry sector is perceived as important in this process primarily because forest is one of the land uses that require a high quantity of land, and is, therefore, likely to compete or conflict with other land uses. The report, which is the basis for this collection of data report, is a first step in this process. It aims at providing a broad and overall picture of the current situation of the Rwandan forestry sector Annex 5).
Report on Collection of Existing Data
99 (274)
Inventory of existing situation. The TOR for the initial forestry data collection, which is the basis for this section in the present main report of data collection, requires statistically backed inventory of:
• current situation vis à vis forestry and associated livelihood practices; and,
• existing forestry units in different zones comprising data pertaining to potential production and its destination.
Emerging issues. This section, thus, presents and describes the current situation of the Rwandan forestry sector with supporting relevant statistical data and information. Emerging issues from the inventory are raised. After a brief overview, below, of the methodology used in data collection, the report provides the following information on:
• forest resource available;
• management of the forest resource and the sector in general and the institutions involved;
• forest products and their utilisations, and more specifically the demand and supply of wood;
• issues and challenges faced by the development of the forestry sector; and,
• way forward understood in terms of issues for future consideration.
The particular section on ecology in this report (Section 7, below) (see also Annex 7) deals with the overall framework of ecology and biodiversity conservation aspects, and hence this section on forestry only addresses these aspects as they are rooted in forestry.
5.3 Methodology In trying to understand the current situation on the Rwandan forestry sector, several methods and techniques were used for the collection of relevant data and information. They are accounted for in this sub-section.
Documentation review. There is considerable documentation on the forestry sector in Rwanda, which gives basic information on the sector. This documentation is found in institutions dealing with forestry matters such as the ‘forest services’ at:
• MINIRENA;
• Environment division at district offices;
• ISAR;
• CGIS-NUR; and,
• ORTPN.
Visits to key institutions. The forestry specialist had the opportunity to accompany present Project ecology and soil specialists on on their visits to institutions be it in Kigali or outside Kigali. With the former REMA, ORTPN, and ISAR - forestry department (Ruhande), CGIS-NUR, IRST, WCS and ACNR - were visited. With the atter ISAR – Karama and the district of Bugesera - were visited. These occasions were used as opportunities to raise forestry issues during discussions held with the persons met.
Report on Collection of Existing Data
100 (274)
Discussions with key resource-persons. Interviews, on individual to individual basis, were held with resource persons who are also key stakeholders in the management of the forestry sector. Essentially, these were the professionals at the forest service in MINIRENA, the cadres at NAFA and researchers at ISAR – forestry department.
Participation in meetings and workshops. At meetings and workshops - in which issues related to land use are addressed - the author of the Master Plan Project forestry study and the present report section on forestry has informed participants of the existence of the Project. Requests, reactions and inputs by the author have on the whole been provided.
Generally, the combined use of these methods has permitted the securing of data and information related to the following aspects of the Rwandan forestry sector:
• existing forest resource;
• policies and strategies;
• management in terms of administration and institutions, planning, implementation of activities on the field, demand and supply of forest products, forest research, forest education, etc;
• legal framework; and,
• issues and challenges for the development of the sector.
5.4 Current Characteristics of Forestry Sector
5.4.1 Context Pressurised life support system. Forests are a key component of the life-support system in view of both the products and services they provide. This is particularly so in Rwanda where forests protect watersheds, thus making agriculture viable, and meet the energy needs of the majority of the population. Furthermore, forests generate direct monetary income for households, public entities and the country in general. Due to high population densities in the country - at 321 inhabitants/km2 in 2002 - farming land per household is decreasing fast, and most of the soils have been exhausted. As a result, cultivation is pushed into marginal areas, particularly in steep slopes, leading to widespread landslides and soil erosion. In addition to land degradation, there is reduction of vegetation including forest cover, siltation of water bodies, frequent droughts and unreliable precipitation. These negative tendencies within the natural resources domain are putting severe pressure on the life-support systems, including that of forestry, of the country.
5.4.2 Historical background of forestry sector Forest products now rare. Traditionally in Rwanda, wood and other forest products have been extracted from the natural forests. Towards the 1920s, the forests started either being encroached by agricultural activities or being gazetted as national parks, ie the Virunga national park in the north–west in 1924, the Akagera national park in the north–east in 1934 and the Nyungwe national park in the south-west in 2007. Natural forest products have became rare.

Report on Collection of Existing Data
101 (274)
Plantations with ups and downs. The first artificial plantations were established in Rwanda in the early 1930s when eucalyptus was introduced in the country to supplement wood production from natural forests. The plantation rhythm slowed down during the 1940s-50s, period of securing independence the at end of the 50s - beginning of the 60s and during ensuing periodic social unrest. Forest plantations started to gain momentum in the late 1960s when the first forestry project, ie PPF10 was started in Kibuye at the initiative of Swiss donor co-operation. Later other projects were launched with the peak around the 1980s. These forest and tree planting programmes saw considerable financial support from external bilateral or multilateral donors, be it in the form of loans or grants. The early 1990s saw another slowdown of the plantation programmes due to war and insecurity, but around 1996 they were renewed. Forests and trees were planted at a large scale, although the survival rate has not been as intended. In short, the history of the Rwandan forestry practice is characterized by ‘ups and downs’ depending on the socio-political situation of the moment.
1988 forest resources law. A National Forestry Law was enacted by the government in 1988 and this was meant to regulate the use of the forest resources in the country. The late 1990s saw another slowdown of forest programmes due to war and insecurity, but around 1996 the programme was renewed again. Forests and trees were again planted at a large scale although the survival rate has been questionable in many instances. The history of the Rwandan forestry practice is, thus, characterised by ‘ups and downs’ depending on the socio-political situation at the time (Table 5.1, below). The evolution of the Rwandan forest cover over time is shown in Table 5.2, below. Table 5.1 - Critical events in the history of the forestry sector in Rwanda
Year/Period Event 1924 creation of Albert National Park – ‘Volcanoes National Park’ in Rwanda 1934 creation of Akagera National Park 1970 start of academic training of foresters in universities in Africa, Europe
and America 1973-90 implementation of major forestry projects 1976 institutionalisation of the National Tree Planting Day 1988 promulgation of the first forestry law 1989 creation of the National Forest Fund (NFF) 1991-96 encroachment to forests for agriculture and settlement and illegal tree
felling in public forests 2000 institutionalisation of the National Tree Planting Week 2002 starting up of Rwanda Forest Management Support Project (PAFOR)
10 PPF: Projet Pilote Forestier (de Kibuye).

Report on Collection of Existing Data
102 (274)
Table 5.2 - Evolution of the Rwanda forest cover in time Periodic evolution of forest cover (area in ha) Type of
forest Name of forest
1960 1970 1980 1990 1996 1999 2000 2002
Nyungwe National Park + Cyamudongo
114000 108800 97500 97500 94500 92400 92400 92400
Gishwati 28000 28000 23000 8800 3800 600 600 600
Mukura 3000 3000 2100 2100 1600 1200 1200 1200
Volcano National park
34000 16000 15000 12760 12760 12000 12000 12000
Akagera National Park
241000 241000 241000 241000 241000 90000 90000 90000
Hunting domain Umutara
64000 45000 45000 34000 0 0 0 0
Natural Forest
Galerie Forest - East
150000 150000 90000 55000 30000 25000 25000 25000
Sub total natural forest 634000 591800 513600 451160 383660 221200 221200 221200
Artificial forest plantations 24500 27160 80 000 247500 232000 252000 282563 306663
Source: FAO, 2005, cited by Thaddée, 2007:10.
5.4.2 Current level of forest resource There exist in the documentation various sources of statistics related to the forest resource available in the country. In 2007, a national forest mapping and inventory activity was completed under the auspices of MINIRENA. This activity was carried out by the CGIS-NUR and ISAR, and the results are currently considered by most of the stakeholders in the sector as the most up-to-date and most reliable available. Hence, they are used in the main Project forest inventory report and in the present data collection report section (Table 5.3 for artificial forest plantations) (Table 5.4 for natural forests). Table 5.3 - Forest plantations in 2007 in ha
Province Eucalyptus Pinus Total
East 11090,4 11090,4
South 80836,3 5995,2 86831,5
West 97801 5921,4 103722,4
North 35273,3 102,4 35375,7
City of Kigali 3626,9 1,4 3628,3
Total 228627,9 12020,4 240648,3
Source: CGIS-NUR and ISAR, 200:34.
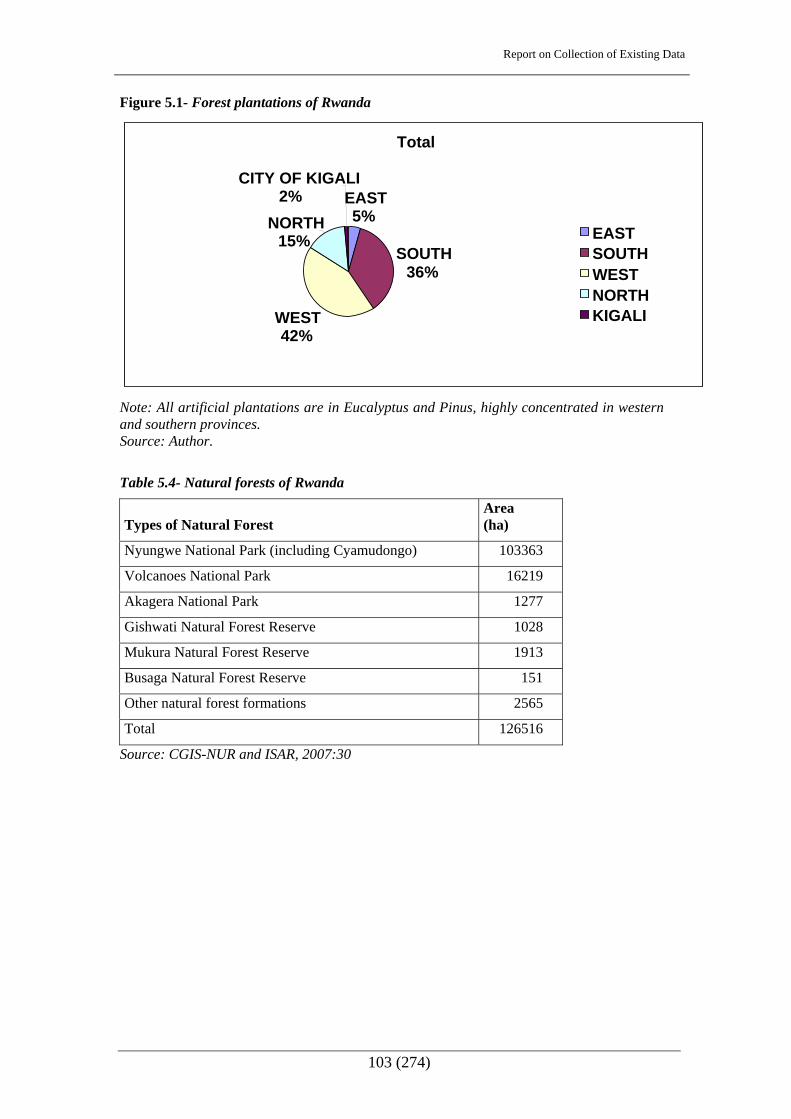
Report on Collection of Existing Data
103 (274)
Figure 5.1- Forest plantations of Rwanda
Total
Note: All artificial plantations are in Eucalyptus and Pinus, highly concentrated in western and southern provinces. Source: Author.
Table 5.4- Natural forests of Rwanda
Types of Natural Forest Area (ha)
Nyungwe National Park (including Cyamudongo) 103363
Volcanoes National Park 16219
Akagera National Park 1277
Gishwati Natural Forest Reserve 1028
Mukura Natural Forest Reserve 1913
Busaga Natural Forest Reserve 151
Other natural forest formations 2565
Total 126516
Source: CGIS-NUR and ISAR, 2007:30
EASTCITY OF KIGALI
2% 5%NORTH EAST 15%
SOUTH SOUTH 36% WEST
NORTH KIGALI WEST
42%
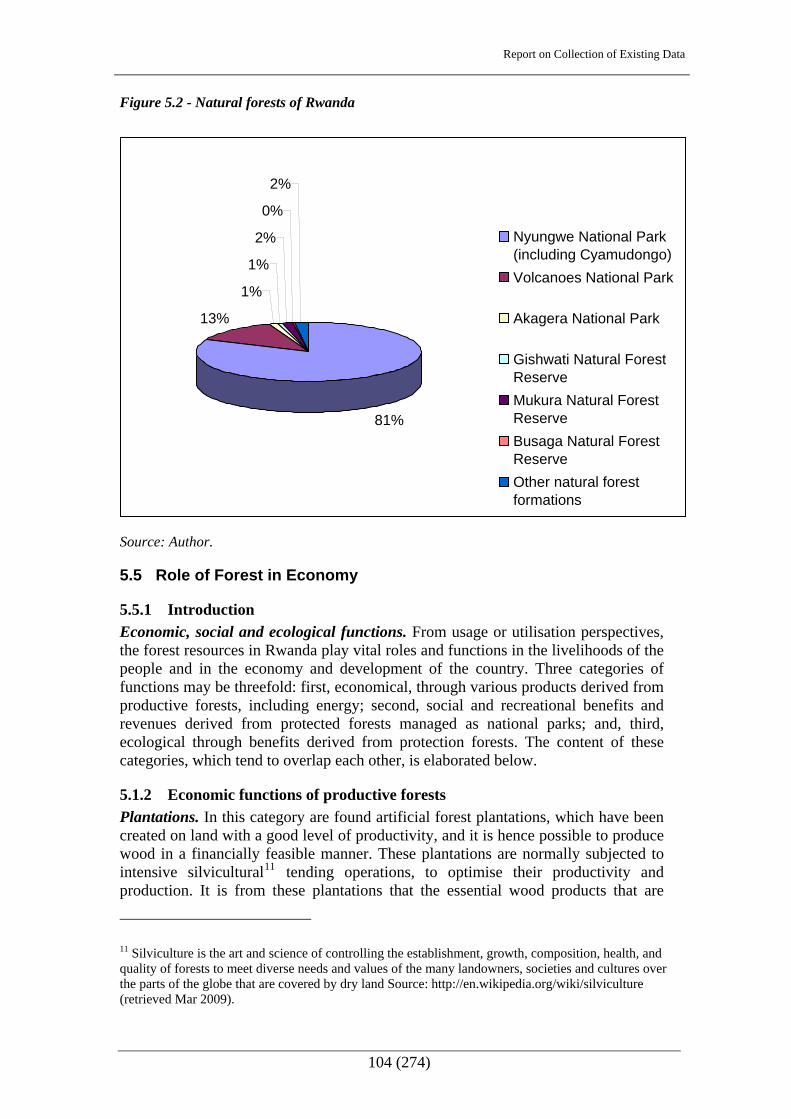
Report on Collection of Existing Data
104 (274)
Figure 5.2 - Natural forests of Rwanda
2%
0%
Nyungwe National Park2%(including Cyamudongo)
1%Volcanoes National Park
1%
Akagera National Park13%
Gishwati Natural ForestReserve Mukura Natural ForestReserve 81%Busaga Natural ForestReserve Other natural forestformations
Source: Author.
5.5 Role of Forest in Economy
5.5.1 Introduction Economic, social and ecological functions. From usage or utilisation perspectives, the forest resources in Rwanda play vital roles and functions in the livelihoods of the people and in the economy and development of the country. Three categories of functions may be threefold: first, economical, through various products derived from productive forests, including energy; second, social and recreational benefits and revenues derived from protected forests managed as national parks; and, third, ecological through benefits derived from protection forests. The content of these categories, which tend to overlap each other, is elaborated below.
5.1.2 Economic functions of productive forests Plantations. In this category are found artificial forest plantations, which have been created on land with a good level of productivity, and it is hence possible to produce wood in a financially feasible manner. These plantations are normally subjected to intensive silvicultural11 tending operations, to optimise their productivity and production. It is from these plantations that the essential wood products that are
11 Silviculture is the art and science of controlling the establishment, growth, composition, health, and quality of forests to meet diverse needs and values of the many landowners, societies and cultures over the parts of the globe that are covered by dry land Source: http://en.wikipedia.org/wiki/silviculture (retrieved Mar 2009).

Report on Collection of Existing Data
105 (274)
consumed in the country are extracted. In this regard, areas of interest for analysis are the following:
• wood production (supply) and consumption (demand);
• non timber forest products; and,
• employment creation.
Wood production and consumption. Current estimates of wood produced in Rwanda are based on results of the national forest inventory carried out by ISAR in 2007 mentioned earlier. This one estimates the average productivity of Rwandan forest plantations at 13 m3/ha/year and 5 m3/ha/ year for pines and eucalyptus plantations respectively (Table 5.5, below). Table 5.5 - Annual wood production (m3)
Province Eucalyptus Pinus Total
South 526523 62244 588767
West 376706 74022 450728
North 188957 18267 207224
East 19302 19302
Kigali City 8687 364 9051
Total 1120175 154897 1275 072
Figure 5.3 - Annual wood production in Rwanda
Annual wood production per Province
1%
2%
16% South
46% WestNorthEast Kigali City35%
Source: Author.
With regards to wood consumption, the main uses of wood produced in Rwanda are accounted for below.

Report on Collection of Existing Data
106 (274)
Energy. The importance of wood in the provision of energy consumed cannot be understated (Table 5.6, below). Table 5.6 - Place of wood in energy supply in Rwanda
Place of consumption Type of energy
Kigali City Other urban Rural National
Fire wood 23.1 73.7 95.5 88.2
Charcoal 72.4 19.6 1.1. 7.9
Gas 0.2 0.1 0.0
Electricity 0.2 0.1 0.0 0.1
Kerosine 0.8 0.3 0.0 0.1
Agricultural residues 0.1 2.5 3 2.7
Others 3.3 3.4 0.4 0.9
Percentage 100 100 100 100
Source: BEST, 2008:26.
Construction and Furniture. Wood in Rwanda is also used in construction, be it in rural areas or in urban areas. The consumption figure is estimated at around 420000 m3 in rural areas and 15-20000 m3 in urban areas. Also, part of the wood produced is sawn and used in furniture making. The current consumption is estimated at around 36 000 m3 (Habiyambere, 2007:22).
Non timber forest products. Among the non timber forest products extracted from the Rwandan forests are the following:
• medicinal plants by herbalists;
• shrubs used by various artisans; and,
• honey produced either with traditional or modern beehives by beekeepers.
Employment creation. Activities undertaken in the forests and in the forestry sector in general are opportunities of employment, especially in the rural areas. Below are a few examples derived from the limited data available in that area:
• Graduate with university degree of different levels – 33;
• Forestry technicians with secondary school level – 78;
• Forest rangers with around three years of secondary school – 182;
• Carpenters and wood artisans – 2000; and,
• Char coalers - 1500 (Habiyambere, 2007:19).
5.5.3 - Socio-recreational functions of the national parks Tourist revenues. A large proportion of the Rwandan forests, around 57 %, is protected and managed as ‘national parks’. As such, they have significance at local, national and international levels. To mention one example, monetary revenues earned in hard currency through tourism activities are at an increase since 2005. Recent statistics obtained from the ORTPN website give an indication of that trend (Table 5.7, below).

Report on Collection of Existing Data
107 (274)
Table 5.7 – Tourist revenue from forest
Year Revenue (USD)
No of tourists
2007 1380000 826374
2008 2140000 1000000
2009 2240000 1140000
Source: www.ortpn.kwita izina ceremony.org
These figures places the tourism sector in the top position in earning foreign exchange for the country, a place that had been occupied by coffee or so long. And this is without taking into account all the local related local economic activities and all the employment which is generated.
5.5.4 - Ecological functions and protection forests Although the above identified three categories of forests in Rwanda play an ecological role related to environment protection and conservation in general, there exist forests that have had a sole ecological objective. These forests are as a rule located on steep slopes or are part of ecologically fragile ecosystems. The ecological functions of the forest, in general, are understood in terms of:
• protecting soil against rain water erosion;
• preventing land slides;
• serving as water reservoirs;
• regulating the local micro climate; and,
• useful in carbon sequestration.
Furthermore, the ecological footprint12 analysis points to the importance of forests in the equation. In the case of Rwanda, information given in on ecology in the present report (Section 7) (see also Annex 7) show that Rwanda has already a deficit in this regard, meaning that the demand exceeds what nature can durably sustain. This is a critical dimension to take into account during the development planning phase of the national Land Use and Development Master Plan preparation process.
5.6 Forest management
5.6.1 General policy frameworks The current situation of the Rwandan forestry sector has to be analyzed and understood in the overall development context of the country. There are at present key policy development documents, the most prominent ones being:
• Vision 2020;
• Decentralization and community development;
• Economic Development and Poverty Reduction Strategy; and,
12 Ecological footprint: "The Ecological footprint measures the bio productive area (whether land or water) a population would require to sustainably produce all the resources it consumes and to absorb the waste it generates using prevailing technology."
Report on Collection of Existing Data
108 (274)
Vision 2020. Vision 2020 is the basic policy statement that outlines the vision of the country in terms of desired and expressed development targets. It ‘main pillars’ are:
• good political and economic governance;
• rural economic transformation;
• development of services, infrastructures and mining;
• human resources development;
• lower risks and costs of doing business in Rwanda an development of the private sector;
• regional and international economic integration; and,
• poverty reduction.
Reduced role of wood in national energy. In relation with the forestry sector, Vision 2020 expresses the following aspirations: “Rwanda will be producing enough energy for economic and social development, while avoiding the degradation of the environment. The country will have considerably reduced the role of wood in national energy use while expanding the use of electricity and renewable energy. Despite Rwanda’s population growth, pressure on natural resources (land, water, biodiversity, mines) will have considerably eased and the process of environmental pollution and degradation will have been reversed.” (MININFRA, 2004:8).
Decentralisation and community development. The decentralization policy aims at empowering local communities so that they can own the processes that shape their development. It hence has community development as sister policy as this last one defines the roles and responsibilities of the different stakeholders and actors in community development. Both policies devote a fundamental role to local communities and local leaders in the management of local public affairs, including the public forest plantations. (MINITERE, 2004:12).
Economic Development and Poverty Reduction Strategy (EDPRS). EDPRS is a five–year (2007-11) comprehensive development plan, which is derived from Vision 2020. It was developed as a follow-up plan to PRSP 1. In relation with forestry, EDPRS puts emphasis on reforestation to increase the forest resource base of the country (ibid).
5.6.2 Specific policy frameworks Sectoral forest policy. In 2004, a new forest policy was adopted by the government of Rwanda and this one highlights the major objectives and orientations that shall govern the management of the Rwandan forest sector. This policy includes also elements of strategy, although clarification around this aspect is still yet to come. The specific objectives outlined in the new policy are the following:
• increase and diversify of forest resource;
• improve management of existing forest resources;
• improve forestry education and extension;
• give value to wood products and non wood forestry products;
• develop appropriate research in forestry and agro forestry;

Report on Collection of Existing Data
109 (274)
• develop economics of wood;
• strengthen capacity of government forestry institutions;
• evaluate contribution of forestry sector to national economy;
• strengthen regional and international cooperation; and,
• integrate gender dimension in management of forestry sector.
5.6.3 Forest planning and management Forestry planning. Currently, there are two planning processes which are underway in the forestry sector. At the national, an activity for the elaboration of a ‘National Forestry Plan’ for a ten –year period has been launched in 2006 and it is still on going. It started with a national forest mapping and inventory for forests areas of and above 0.5 ha and this has been completed and results are available and already in use by different stakeholders. Another activity of mapping the forests areas below 0.5 ha and agro-forestry resources is still to be organized and then the elaboration of the plan document. At district level, there is also a process of elaboration of the ‘District Forest Management Plan’ and the process is halfway i.e. 16 districts already have their plans.
Forest management. By management, the understanding in this section is that operations in the field aiming at wood and other forest products production. In the current context of Rwanda, forest activities in the field are implemented through different mechanisms, characterised essentially by tree and forest planting. The follow-up silvicultural operations have been neglected most of the time.At the sector level of administration, there is always a community tree nursery, and seedlings are planted during the ‘tree planting week’ through Umuganda community work. There are also forest projects which are implemented with external financial support, the major current being:
• PAFOR, funded by the African Development Bank and covers 18 Districts - it has been going on for more than five years, and it is expected to end in December 2009;
• PAREF I, supported by Belgian co-operation, it has just started and it shall last four years and it covers six districts;
• PAREF II, supplementary to PAREF I, supported by Netherlands co-operation - it shall also last for four years and covers nine Districts; and,
• V-LIFE, supported by Swedish co-operation - it is a household livelihood project with an agro forestry component.
International and local NGOs, with the financial support of external donors are also implementing some forestry related activities in many parts of the country:
• CARE International – it implements a project funded by the European Commission aiming at the dissemination within the communities of improved charcoal making techniques and improved fuel cooking stoves;
• FAO - is also funding similar activities to those of CARE International; and,
• HelpAge Rwanda – implements with Netherlands funding a HIMO type of project aiming at soil/land conservation/protection through appropriate agro forestry techniques.

Report on Collection of Existing Data
110 (274)
5.6.4 Administration of forestry sector and institutions In Rwanda, there are a limited number of institutions, which are involved in the management of the forestry sector. There are those acting at the central level and those acting at the local level.
National Forest Service. This is a service, which is located in the Ministry (MINIRENA) under the direct supervision of the Unit of Planning and Human Resources Development. It is responsible for sector policy and strategies formulation and the monitoring and evaluation of their implementation. Also, it entertains external relations and synergies with other development sectors at its level.
National Forest Protection Service. This is a specific service under the supervision of the Permanent Secretary at MINIRENA, and it is responsible for the protection of all the forests which are on the Rwandan territory. This service ensures the implementation and respect of instructions and regulations which are provided in the National Forestry Law.
National Forestry Fund. This is a special fund provided for in the National Forestry Law and it is expected to be a fund through which all funding and donations in the forestry sector are channelled. Currently, it has a “Board of administration” but it is still has to get a “permanent secretariat” so that it can be fully operational.
District Environment officer. At the district level, an environment officer co-ordinates, activities of the forestry sector under the management of the usual leadership of the district. Direct technical support is provided from the National Forestry Service.
Sector Agricultural officer. At the sector level, an agriculture officer co-ordinates the administration of forest activities related to tree planting.
The National Forestry Agency (NAFA). A new institution in the administration of the forestry sector in Rwanda, NAFA has been legalised by the government. It is not yet operational on the ground, but is expected to co-ordinate the implementation of forestry activities - apart from MINIRENA’s National Forest Service, all other services and institutions shall be co-ordinated and supervised by NAFA.
Office Rwandais du Tourisme et des Parcs Nationaux (ORTPN). ORTPN is in charge of all the three national parks. It has the mandate of conservation of these parks and the promotion of tourism.
Rwanda Environmental Management Authority (REMA). REMA is another institution that has a stake in the management of the Rwandan forests as it has the mandate of co-ordination of all environmental conservation and protection activities. Essentially, REMA ensures that all the different laws and regulations related to the management of forested areas are in line and conformity with the Organic Law on Environment.
National Institute for Agricultural Research (ISAR). The major part of the forestry research is done through the ‘Lands and Forest Research Centre’ of ISAR. The centre is based in Ruhande, Huye district (formerly Butare). The agro-forestry component of this centre is technically and financially supported by the Agro forestry Research Centre (ICRAF) in Nairobi.
Specialist studies by individual. Specific and specialised studies are sometimes done by individual specialists. These are mainly expatriates who occasionally come to the country for short missions. A recent example of such a study is the Biomass Energy

Report on Collection of Existing Data
111 (274)
Strategy (BEST), conducted by the private consulting company MARGE in collaboration with GTZ.
Forestry education. Forestry education in Rwanda is threefold. It is provided at secondary school, college and university. At secondary school level there is ‘Ecole Secondaire de Kibisabo’, located since 1985 in Nyabihu district in the Western Province. A technical school was opened 1988 in the southern province at Kitabi, ie Kitabi College of Conservation and Environment (KCCE). It has the mandate of training technical staff for the management of the sector of bio-diversity conservation and wildlife in particular. Since 2004, an agro-forestry option at the level of A1 is offered at Institut d’Agriculture et Elevage (ISAE). At university level, the Faculty of Agriculture at the National University of Rwanda (NUR) initiated 2006 a special programme of MSc in agro-forestry with the financial assistance of the Netherlands government. Other forest related university degrees at BSc and MSc levels are mainly pursued in Kenya and Tanzania.
Forestry Legislation. The first legislation on forestry was law 47/88 enacted late 1988, covering the following:
• to have forest plans for all forest owners of more than two hectares namely State, Districts and Private sector;
• modalities of excision and harvesting of forests, transport and marketing of wooden forest products. These modalities aim to discourage bad practices of clearing forests;
• collection of statistics on forests and forest products; and, • gazetting of roadsides plantations, ie reserving in 10-15 m State forest road
reserve on both sides of public roads. This law has, however, not been effectively implemented. Consequently, forest plantations and natural forests have been further degraded through excision, encroachment for agriculture, wild fires, grazing and uncontrolled harvesting.
5.7 Issues
5.7.1 Challenges Currently, there are many of issues and challenges facing the management and development of the Rwandan forests and forestry sector. Focus in this report is on those that have a direct or indirect relation with land use and development master planning.
The demand in wood exceeds the supply. Although there are no reliable statistics on wood demand (consumption) in the country, there are clear and visible indications that the demand is too high compared to the productive capacity of annual wood production of the forest available - deforestation is observable in many parts of the country, and agricultural residues13 are used as a source of energy in many rural households. Such a situation puts severe pressure on life-support systems of the country. The root cause of this problem seems to lie in population growth pressure and the low level of development of the country, unable to find for alternatives to wood.
13 ‘Agricultural residues’ refer to biomass remains after agricultural crop harvest.

Report on Collection of Existing Data
112 (274)
The high dependency on wood as a source of household energy. Current statistics indicate a high dependency on biomass as a source of household energy, either in the form of firewood or charcoal. Not only are other sources of energy scarce, they are expensive and hence inaccessible to the vast majority of Rwandans. The current situation is environmentally unsustainable. On the one hand, there is a need to make more efforts in the promotion of more efficient and energy saving techniques and practices, and, on the other, a need for expanding and encouraging the use of other sources of energy ,eg, electricity, biogas, peat and solar.
The high competition for land among different uses. The Rwandan reality is that land is scarce given the current levels of population pressure for land and the alternative livelihood source inherent in diversified economic activities including Information and Communication Technologies (ICT) among technological, financial or other development of the country. In the past, including in the recent years, officials have most of the time turned to forested lands to get space for various development activities, and, more specifically, to re settle people in the agglomerations commonly known as imidugudu. This practice has negatively impacted on the environmental equilibrium of the country. Whereas there exist good national environment law and regulations - and also international conventions and treaties that Rwanda has ratified to protect the environment - bold action needs to be taken to enforce and implement them on the ground for the benefit of all stakeholders.
Irrational forest management practices. Among many technical shortcomings observed in the management of Rwandan forests, the silvicultural tending operations that are overdue in many forest plantations - especially those in the buffer zone on the Congo-Nile Crest – are central. The current lack of this, leads to reduced production, low quality of wood and soil erosion underneath. In the context of scarce land, all measures have to be taken to ensure optimum production on all land, including the forested lands.
Weak administrative institutions and structures. Useful legal instruments are, thus, in place but their implementation is lacking, mainly because the administrative institutions and structures for their enforcement are weak. Staff available is still insufficient both in terms of quality and number.
Weak legal framework. Although the forestry law was promulgated in 1988, most of the ministerial decrees envisaged to clarify and accompany the implementation of this law have not been issued. Hence, the legal management and development of the forest sector is hampered.
Insufficient reliable statistics. Statistics currently used - derived mainly from old and outdated documents, surveys and projections - are not always reliable and valid. Only in 2007 a national forestry mapping and inventory was undertaken. It gives the information on wood supply, but it does not take into account wood production from woodlots and agro-forestry. So statistics are incomplete.
5.7.2 Way forward Integrated orientation. With stock of the existing forest and forestry related situation in Rwanda accounted for, this sub-sub-section focuses on identified issue based considerations that constitute the basis for the next discussions with the national Land Use and Development Master Plan stakeholders. The orientation
Report on Collection of Existing Data
113 (274)
around these issues attempts to integrate political, social, economical, technical, etc, considerations.
30 % National Forest area target as of Vision 2020. Vision 2020 sets a target of 30 % of the national area to be covered by forests. What approaches and strategies are going to be needed to reach that target – ie, increasing the forest resource base? It is proposed that the following will need to be examined in the next phase of the present Project:
• role of agro-forestry and woodlots;
• involvement of new actors and institutions in the management of forests;
• role of the communities in the whole management process; and,
• productivity of existing forest plantations.
How can the forestry sector benefit from the present Project? The following are some of the possibilities that stakeholders may pursue through the project:
• improvement on the existing forest atlas;
• furthering of forest inventory with availability of aerial photos at high resolution;
• improvement of protection of existing forest land; and,
• improvement of information on available land for forests.
Report on Collection of Existing Data
114 (274)
6 Environment 6.1.Summary Significance to land use and development planning. This section describes the state of environment and its significance to socio-economic development in general and its relevance to land use and development planning in Rwanda in particular. It reviews existing information regarding the state of the environment. Through partnership with UNEP Rwanda has conducted a Post Conflict State of Environment Report. There is also a recent and more comprehensive draft State of Environment (SoE) report under final preparation. Although a draft, it contains details of the status of environmental resources and the drivers, pressures and threats to different natural resources. Complimenting related Project sectors. Complimenting detailed accounts of existing data with regard to the different Project sectoral areas related to the environment - like agriculture, forestry and ecology – this section attempts to reinforce the recognition of environment as a crosscutting own ‘sector’ with importance for overall sustainable development. Environment as a sector in it own right is important in the land use and development planning process as it constituters a necessary overriding criterion in the decision making process – a process that entails compromising between competing and often conflicting land uses, while maintaining the ecological function of land as a prerequisite resource. Recognition of the importance of the environment and adequate address to it ensures sustainability of all economic development activities without impacting negatively on natural resources. An understanding of the environment as a crosscutting sector facilitates the important general establishment of the impacts of land use on core ecosystem services. It also benefits more directly appreciable and affected socio-economic sectors such as tourism and recreation.
6.2 Introduction Definition. The national environment law, ie Organic Law N° 04/2005 of 08/04/2005, defines the natural environment to be composed of soil and subsoil, water, air, biodiversity, mountains and landscapes, tourist sites and monuments. Problems from lack of environmental care. Rwanda is a land locked country, characterised by a predominantly hilly and, partially, mountainous landscape. Population pressure for subsistence and cash crop and pastoral land, against the backdrop of this terrain, is a contributing factor to land degradation that has been identified as the major environmental issues that needs immediate response. The country is endowed with diverse ecosystems, from high altitude rainforests, savannah grasslands, wetlands and lakes, which are home to a variety of flora fauna species. The majority of the population is dependent - directly on indirectly - on this natural capital for their sustenance. The recent increase in population has significantly accelerated the decline of natural resources as people encroach and over-exploit the resources in search of primary materials for socio-economic activities. The increasing population density has triggered natural resources decline, witnessed through the encroachment of critical ecosystem in search for agricultural land and the expansion of human settlement. Over the years these natural resources have been subject to unsustainable management methods, without appropriate redeeming policy focus and budget allocation. It has been observed that the major challenges have been the inadequacy of policy instruments and management tools in ensuring the sustainability of the natural capital. Low technical know-how. Rwanda has had low technical capacities and purposely-directed financial resources for effective planning and management of the country’s natural resources
Report on Collection of Existing Data
115 (274)
endowment. Without these, likely to be in combination with unawareness, natural resources have been over-utilised without consideration of their sustainability. This has resulted in the failure to sustainably maximise the economic productivity of the resources. The country also possesses a dense hydrological network of both surface and ground water, but access to drinking water is still low. Environmental decline is a result of an amalgamation of several weak natural resources management practices over time, resulting in a situation where efforts to reverse these trends will requires concerted efforts and the adoption of lessons learnt and best practices acquired in the local context. Crosscutting nature with holistic approach. In recognition of the importance of the environment, the Government has instituted several measures to put in place a policy and institutional framework that will facilitate sustainable utilisation of natural resources, and, in parallel with the strategic actions required as of the Economic Development and Poverty Reduction Strategy (EDPRS). The crosscutting nature of environment - and its level of integration onto the EDPRS - ensures a holistic policy and programme planning approach through the sectors of economic development. Several institutions such the Rwanda Environment Management Authority (REMA), National Forest Authority (NFA) and National Land Centre (NLC) have been established and mandated to oversee the management of the different components of the environment while maintaining the overall strategic and priority targets of the environment sector.
6.3 Environment and Natural Resources
6.3.1 Wetlands Unsustainable encroachment. Wetlands in Rwanda are heavily relied on for subsistence agriculture, which supports close to 90 % of the population. Increasing utilisation of these, coupled with unsustainable farming methods, have led to decreased soil fertility and subsequently a reduction in yields. This trend forces the population to encroach on undisturbed wetland for agricultural land to meet its food demand. These are however temporary and unsustainable solutions that irreversibly destroy the wetlands. The Government has, thus, gazetted the Rugezi marshland complex, in the former provinces of Ruhengeri and Byumba, as a RAMSAR site (see Section 7 on Ecology). Severely decreased and degraded wetlands. In low-lying and wetland areas, pressure for agricultural space and inappropriate marsh cultivation has caused stream flow changes, increased water evaporation, and reduced water tables and groundwater recharge (Odada et al, 2004; World Bank, 2004). Currently, at least 93754 ha of the total 164947 ha of wetland surface area have been cultivated (Kanyarukiga and Ngarambe, 1998). In the Lakes Cyohoha, Bugesera and Rweru region in the Kigali-Ngali Province, and, in the Lake Mugesera area of the Kibungo region, reclamation, siltation, flood damage and water weed infestation have severely decreased and degraded wetlands. In the Bugesera region of the Kgali-Ngali Province, the Gashora marsh was drained for food emergency assistance in 2000 (FAO, 2001).
6.3.2 Land Soil erosion with impacts on yields. There are basically five distinct ecosystem areas in Rwanda: cropland and natural vegetation form 47 % of total land; 32 % is under scrublands, savannah and grasslands; 12 % is under forest; 8 % is wetlands and water bodies; and, about 1 % is sparse or barren vegetation (World Resources Institute. 2003d). With a hilly topography, the country carries out expansive subsistence agriculture on its numerous
Report on Collection of Existing Data
116 (274)
slopes, leaving its hill slopes bare and exposed to soil erosion causative factors. Soil erosion is a very serious problem that has obvious and immediate impacts on the agricultural yields in the country.
6.3.3 Forests Drastic clearing. The forest resources in Rwanda have been subjected to increasing pressure mainly through increased forest clearing. Nyungwe forest surface was reduced from 114125 ha in 1958 to 97138 ha in 1978 a 15 % reduction. Nyungwe is now estimated at 90000 ha. In efforts to halt further loss, the forest was declared a protected area in 2000. The Volcano forest, in the Northern Province, with an area of 35000 ha has been reduced – giving way to extensive pyrethrum growing and other agricultural activities – to 15000 ha. The Gishwati forest at 21000 ha in 1930 has now been reduced by more than 80 %. The forest was mainly converted for agricultural use and human re-settlement (MINIRENA, 2004). No remedial large scale plantation. The problems related to forestry in Rwanda primarily stem from the forest resource depletion as a result of no effective measures in place to address the increasing rural and urban demand for forest products. The natural forest has diminished dramatically over time, and yet there has been no corresponding effort to establish large scale plantation forest to counter the over-decline in forest cover. The major problems of the forest sector may be considered threefold. First, excessive felling - fuel wood is the basic source of energy for more than 90 % of the population, and with the rapid increase in population demand for wood has increased with increased pressure on the forest resources. Second, low afforestration and reforestration - figures from the Forestry Unit of MINAFRI indicate that comparisons of annual forested land and free space show that forest expansion is still low. FAO standards put optimal forest area required per individual at 1 Ha, in order to satisfy his/her wood needs while maintaining an ecological balance. The average forest area per individual is approximately 0.059 ha, much less than the FAO standard (National Forest Policy, 2004). Third, insufficient sylvicultural practice - tree cropping and harvesting activities are not adequately planned or rotated to effectively address current wood demands. This negatively impacts on the vigour, health and growth of forest stands. Poor practices like clear cutting and monoculture have progressively led to the decline and degradation of the forest resources. Fourth, insufficient information - lack of reliable and up-to-date data on the forests resources limits planning and financing of forest management initiatives. Economic valuation for planning and budget allocation is not possible and more often the forest resources are undervalued because their primary ecological functions are not easily presented in the monetary equivalent which can allow the forest sector appropriate priority and budgetary allocation as compared to other sectors of development. The inability to demonstrate the economic value of forest in clear terms for decision makers often results in disproportionate representation in economic planning and public expenditure.
6.3.4 Biodiversity Loss of variability. Ecosystems in Rwanda - the primary source of biodiversity, genetic resources and bio-chemicals - are composed of forests at 12 % of total land area, savannah at 32 %, wetlands at 8 % and mixed cropland/natural vegetation at 47 %. Rapid deforestation and conversion of natural habitats to agricultural systems, however, has caused a loss in the variability across them (World Resources Institute 2003d). Currently, Rwanda protects 7.7 per cent of its total land area and, thus, only a small proportion of its biodiversity (World Resources Institute 2003a). Rwanda’s remaining protected areas, namely the Volcans National Park in the north-west (Gisenyi and Ruhengeri), Nyungwe
Report on Collection of Existing Data
117 (274)
Montane Forest Reserve in the south-west (Cyangugu), and Akagera National Park in the north-east (Umutara), hold exceptional biodiversity. Today, Akagera is considered the most complex savannah ecosystem in eastern Africa, combining wetlands and savannah habitats, and is home to 12 species of primates (Kanyamibwa, 1998). The Volcanoes National Park is home to approximately half (320) of the world’s population of mountain gorillas, which consume vegetation from more than 70 different plant species (World Bank, 2004). Nyungwe’s flora alone comprises more than 250 tree and plant species, including more than 100 orchid species, and is dominated by the bamboo Arundinaria alpine (Kanyamibwa 1998). It is also home to the owl-faced monkey Ceropithecus hamylini and 275 known bird species (Kanyamibwa, 1998; World Bank 2004). Figures on biodiversity loss. Factors influencing biodiversity loss Biodiversity loss in Rwanda is severe and mainly due to the progressive disappearance of national parks and large-scale habitat destruction (World Bank 2004). Between 1958-79, Volcanoes National Park lost 55 % of its natural habitat mainly for pyrethrum growing (Kalpers, 2001). During the genocide, in addition to human casualties, direct fighting and bombs killed wildlife throughout Rwanda; large-scale fighting occurred inside Akagera National Park and soldiers killed many animals. Akagera National Park lost approximately 90 % of its mega-fauna, and approximately two-thirds of its original area. Since the genocide, Akagera National Park and Mutara Game Reserve have been taken over by 700000 grazing cattle from Uganda, and temporary and permanent buildings are widespread with Nyungwe Montane Forest Reserve now fragmented by agriculture (Kanyamibwa, 1998). Moreover, natural forests have declined by 78 % since 1990 (World Resources Institute 2003d). Rwanda’s most recent biodiversity strategy (2003) states that the Mukura and the Gishwati forests have particularly high rates of deforestation (Rwanda Ministry of Lands, Resettlement and Environment 2003). Red listed plant and animal species. Three plant and 13 animal species are IUCN red listed - as critically endangered, endangered and vulnerable - and primates are threatened by habitat destruction and poaching (FAO 2003b; World Bank, 2004). Loss of agro-diversity is occurring as the genetic base erodes for cattle breeds, crops, and vegetables/fruits; fewer benefits are realized from local variety qualities, which traditionally increase tolerance, productivity and resilience; and, there is growing dependence on exotic seeds and imported varieties. Fish diversity is also decreasing along with a loss of wetland biodiversity and habitat, though exact data is lacking (World Bank 2004). In addition, the invasion of water hyacinth into East Africa’s Lake Victoria 13 years ago has reduced water quality and threatened biodiversity, particularly along the Kagera River system, at the eastern border (Moorhouse, Agaba and McNabb, 2000) (see also Section 7 on Ecology).
6.3.5 Areas Protected Huge loss of mega-fauna and area. During the 1990-94, large scale fighting occurred inside the Akagera National Park and many animals were killed. Animals migrated to more peaceful land in the neighbouring countries of Uganda and Tanzania. Akagera National Park lost approximately 90 % of its mega-fauna and approximately 67 % of its original area. Immediately after the war in 1994, resulting from the need to resettle returning refugees, the Akagera National Park and Mutara Game Reserve were invaded by 700,000 grazing cattle (Kanyamibwa 1998). Adding to increased domestic animal prevalence, the area was also used for the construction of temporary and permanent buildings. Although exact data is missing, fish catch trends show a decrease in fish diversity along with a loss of wetland
Report on Collection of Existing Data
118 (274)
biodiversity and habitat (World Bank, 2004). The invasion of the Akagera river system has reduced water quality and is threatening biodiversity (Moorhouse, Agaba and McNabb 2000).
6.4 Policy and regulatory framework
6.4.1 National framework Economic Development and Poverty Reduction Strategy (EDPRS) and environment. EDPRS is a follow up strategy of the Poverty Reduction Strategy Paper (PRSP), which - although it had a substantial planning component for economic development - did not sufficiently incorporate the environment as a priority area that needs action. The strategy recognises the importance of environment, however, and aims at improving environmental management through increased address to forest cover, reduction in annual wood consumption and rehabilitation of critically degraded ecosystems. EDPRS plans strategic actions to manage the environment and ensure optimal utilisation of natural resources through:
• rehabilitation of degraded wetlands/ecosystems and other protected areas to ensure the preservation of biological diversity;
• creating an enabling environment for an effective regulatory and policy framework for environment management;
• adoption of clean development mechanism throughout the industrial sector; • development and disseminating various sector guidelines for conducting
Environmental Impact Assessment (EIA); and, • establishing land management institutions to ensure the optimal utilisation of land,
effective land registration mechanisms and upholding rights and ownership of land. Priority areas of action. EDPRS further details priority areas of action for optimal utilisation of natural resources under its ‘flagship programme’ on complementary sectoral interventions to achieve the strategy targets. As a crosscutting issue, environment will be taken into consideration through joint sector initiatives such as activity planning and policy formulation intended to ensure minimal negative impacts on the environment. Such joint initiatives are to include:
• agricultural sector collaboration with the environment sector to address, soil erosion, soil degradation and soil fertility issues;
• collaboration of the forestry, energy and environment sectors to address the energy issues as they explore alternatives for more efficient energy options; and,
• adjustments to the mining sector to avert the environmental degradation resulting from quarries and other mining activities.
Water and sanitation plan. Through the water and sanitation sector, EDPRS anticipates to improve water resources management and increase access to potable water. Key areas include: preparation of a national water and sanitation master plan; increasing access to water for domestic, industrial and agricultural demands; strengthening capacity in the water and sanitation sector; and, putting in place a suitable institutional and policy framework for the implementation of the national water and sanitation master plan. Vision 2020 and environment. Vision 2020 recognises the increased pressure on the natural resources, which is primarily made worse by the increasing population. Among its priority strategies, in addressing environmental decline, is: increasing access to safe water from 64 % in 2006-7 to 100 % in 2020; increasing land under protection against soil erosion to 100

Report on Collection of Existing Data
119 (274)
% in 2020; achieving land tenure security for 60 % of land parcels in 2020; increasing forest cover to 30 % in 2020; and, reducing wood energy consumption to 50 % in 2020 (MINECOFIN, 2000). Under the ‘pillar’ on infrastructure development, the vision aims at:
• reducing fuel wood dependence by increasing energy production through the development of hydroelectric power, exploitation of methane gas in L. Kivu and solar energy generation;
• increasing utilisation of the numerous water resources so that 100 % of the population will have access to portable water by 2020; and,
• increasing access to adequate drainage and sewage disposal facilities or services for both the rural and urban populations.
In addition, protection of environment and sustainable natural resource management is considered as one of the crosscutting areas that will be implemented along with the other pillars of Vision 2020. Environment law. The Organic Law N° 04/2005 of 08/04/2005 - determining the modalities of protection, conservation and promotion of environment in Rwanda - recognises that environment in the country constitutes a common national heritage and it the duty of all Rwandans to protect, conserve and promote it. The law generally aims at:
• conserving the environment with the interests of the people as priority; • establishing principles that will guide environmental protection and prohibit or limit
the degradation and destruction of natural resources; • maximising and supporting equitable and wise use of natural resources in the
promotion of social welfare of the population; • guaranteeing sustainable development and social welfare of the population and
ensuring the quality and quantity of the natural resources for the future generations; and,
• putting in place institutions mandated with the planning, management and protection of the environment in accordance to the provisions and directives of the organic law.
The law ascribes to the fundamental principles of: protection; sustainability of environment and equal opportunities among generations; the polluter pays; community sensitisation in conservation and protection of the environment; and, co-operation. It also makes provisions for: obligation of involvement of central and local governance structures and local population in environmental management; establishing institutions such as the Rwanda Environment Management (REMA), responsible for environmental management; directives and guidelines for conducting of Environmental Impact Assessment (EIA) for development projects; incentives for persons that conserve the environment; and, preventive and punitive measures for destruction or negative impacts to the environment. REMA Act. Law N° 16/2006 of 03/04/2006 establishes and determines the organisation, functioning and responsibilities of Rwanda Environment Management Authority (REMA). It gives the organisation legal credence, and allows it to enforce the environment policy with the support of other existing instruments. The law provides the authority with the mandate as the policy implementation arm of the Ministry of Natural Resources (MINIRENA), and spells out the specific responsibilities that will guide the functioning of REMA. The authority is the organisation in charge of supervision, follow up and mainstreaming of environment in all development planning both at the central and decentralised level of governance. The law provides among others the following as specific responsibilities of REMA:

Report on Collection of Existing Data
120 (274)
• implementation and monitoring the implementation of the environment law and policies;
• advice to government on policies, strategies and legislation related to the management of the environment as well as the international and regional environment agreements Rwanda is partner to;
• regular inventories, carrying out of comprehensive supervision of environmental management and publishing of the State of Environment (SoE) every two years;
• review and approval of environmental impact assessment studies; and awarding of EIA certificates for all socio-economic activities with potential negative impacts;
• Preparation of and publishing of guidelines and manuals that will raise the general public awareness of environmental issues and will facilitate greater incorporation of environment concerns in development activities - increased knowledge of the environment will allow greater participation of the population on environmental protection; and,
• regular monitoring and conducting of environmental audits of development programmes and projects.
Sectoral Policy on Water and Sanitation. The overall objective of the sector is to improve the living conditions of the population through optimal use of water resources and access for all to water and sanitation services. The specific objects of the policy include: the sustainable management of water resources; increased access to drinking water and water for agriculture; catchment and watershed protection; increasing hydroelectric power generation; and, capacity building for better water resources management. The policy sets the sector priorities based on the following principles:
• water is a social and economic good with value that requires protection - the environment functions of water resources need to be considered as well;
• each person has the right to access to clean water; • priority should be given to the development of water resources to satisfy the national
demands; • water resources management should be an integrated approach, that should involve
all partners and it should cover larger water sheds; and, • quality of water should be monitored and maintained according to regulations and
established standards. The sector envisions achieving the following:
• 100 % of the population with access to clean drinking water and sanitation services; • adoption of improved water collection and retention techniques for domestic and
agriculture water needs; and, • protection of natural water reservoirs and watersheds.
National Land Policy on Environment. The objective of the National Land Policy is to facilitate sustainable development through the establishment of a land tenure system that ensures tenure security for all Rwandans and gives guidance for the management and rational use of land resources. The specific objectives of the policy are:
• putting in place mechanisms and incentives for the promotion of investments in land; • allocating land according to appropriate land use type to ensure optimal allocation
and utilisation of land resources; • effective land valuation to ensure the contribution of land resources in the country’s
socio-economic development.

Report on Collection of Existing Data
121 (274)
• conservation and sustainable utilisation of wetlands; • focusing land management towards more viable and sustainable production; • establishing institutional land administration arrangements that reflect the actual
market value of land; and, • increasing knowledge dissemination and awareness raising of the public at all levels
on environmental protection and good land management practices. Box 6.1 - International obligations
Rwanda is signatory to the following: International Convention on Biological Diversity and its Habitat signed in RIO DE JANEIRO in BRAZIL on 5 June 1992, as approved by Presidential Order n° 017/01 of 18 March 1995; United Nations Framework Convention on Climate Change, signed in RIO DE JANEIRO in BRAZIL on 5 June 1992, as approved by Presidential Order n° 021/01 of 30 May 1995; STOCKHOLM Convention on persistent organic pollutants, signed in STOCKHOLM on 22 May 2001, as approved by Presidential Order n° 78/01 of 8 July 2002; ROTTERDAM International Convention on the establishment of international procedures agreed by states on commercial transactions of agricultural pesticides and other poisonous products, signed in ROTTERDAM on 11 September 1998 and in New York from 12 November 1998 to 10 September 1999 as approved by Presidential Order n° 28/01 of 24 August 2003 approving the membership of Rwanda; BASEL Convention on the Control of Transboundary Movements of Hazardous wastes and their disposal as adopted at BASEL on 22 March 1989, and approved by Presidential Order n° 29/01 of 24 August 2003 approving the membership of Rwanda; MONTREAL International Convention on Substances that Deplete the Ozone Layer, signed in LONDON (1990), COPENHAGEN (1992), MONTREAL (1997), BEIJING (1999), especially in its Article 2 of LONDON amendments, and Article 3 of COPENHAGEN, MONTREAL and BEIJING amendments as approved by Presidential Order n° 30/01 of 24 August 2003 related to the membership of Rwanda; CARTAGENA protocol on Biosafety to the Convention of Biological Biodiversity, signed in NAIROBI from May 15, to 26, 2000 and in NEW YORK from June 5, 2000 to June 4, 2001 as authorised to be ratified by Law n° 38/2003 of 29 December 2003; KYOTO Protocol to the Framework Convention on Climate Change adopted at KYOTO on March 6, 1998 as authorised to be ratified by Law n° 36/ 2003 of 29 December 2003; RAMSAR International Convention of February 2, 1971 on Wetlands of International importance, especially as waterfowl habitats as authorised to be ratified by Law n° 37/2003 of 29 December 2003; BONN Convention opened for signature on June 23, 1979 on conservation of migratory species of wild animals as authorised to be ratified by Law n° 35/2003 of 29 December 2003 Washington Agreement of March 3, 1973 on International Trade in endangered species of Wild Flora and Fauna as authorised to be ratified by Presidential Order n° 211 of 25 June 1980;
Report on Collection of Existing Data
122 (274)
6.4.2 Institutional Framework This section does not deal with the institutional framework per se, as it is sufficiently done so in other sections, notably that on ecology (Section 7) in this report.
6.5 Issues
6.5.1 Broad environmental issues for present Project Land use and development planning should be efficient, ensure equality and be sustainable. To be this it needs to ensure that:
• proposed land use should be economically viable and should be matched to the productive potential of that particular area;
• proposed land use must be without social conflict and must be acceptable by affected communities or other interest groups - land use types with significant social implications and obligations should involve all partners in the planning and decision making process; and,
• sustainable land use meets the needs of the present while conserving for the future - this will require a combination of production today and conservation of the land resource for future production needs.
Minimal impact on environment. Sustainable land utilisation or land use and development planning should consider social and economic development and ecological functions and carrying capacity of land resources. Existing environmental laws, policy instruments and guidelines make provisions for ensuring that any land use should have controlled or minimal negative impacts on land resources, ie environment. Policies provide for the institution of Environment Impact Assessment (EIA) of development projects and Strategic Environment Assessment (SEA) of policies and high level programmes. To ensure sustainable land utilisation the following environment effects and causalities – in addition to loss of ecosystem services contributed by land use and development – should be considered in the National Land Use and Development Master Plan preparation:
• land degradation - proposed land use types that will increase the severity of soil erosion, land slides, irreversible soil structure modification and soil fertility loss;
• water resources decline - proposed land use types that increase siltation and sedimentation of water resources thus affecting the quantity and quality of water;
• forest resources destruction - proposed land use types that lead to the clearance or degradation of forests;
• quality of critical ecosystems and wildlife habitat - proposed land use types that will modify the structure and composition of forests, grasslands and wetlands, ie, critical areas that need to maintain wild plant and animal communities;
• wetland degradation - proposed land use types that support encroachment and irreversible conversion of pristine wetlands; and,
• loss of scenic and recreational value - proposed land use types that destroy the tourism, leisure and recreational utilities of land resources.

Report on Collection of Existing Data
123 (274)
7 Ecology 7.1 Summary Background. This section is based on the main report on collection of existing ecological and associated environmental data in Rwanda, which is the result of a three-week input into the Rwanda Land Use and Development Master Plan project by the present Project Ecologist. The section, as part of the collection of data from sector-specific areas of I interest, like agriculture and forest, is voluminous in comparison with that of other sections in this report. This serves to highlight the importance of ecology per se and as a crosscutting issue. The initial inventory was undertaken, by the Project Ecologist, during a two-week visit to Rwanda14. The report summarises current available information, lists missing data, as well as points out areas where there is currently no available data. It also provides justification for including ecological considerations into the land use and development master planning process, and provides recommendations on the way forward. Information for the present report was gathered from a variety of secondary sources, including national databases and reports, as well as from key biodiversity stakeholders and the Internet. While collecting information for the study it became clear that certain key documents are not yet available. It specifically refers to spatial data for GIS analysis. Biodiversity data is also spread out among a variety of stakeholders and some older reference material quoted in more recent publications has been difficult to find.
Justification to include ecological considerations in the land use planning process. There are scientific, economic, legal, security and moral reasons for including ecological considerations in the land use and development master plan. Functioning ecosystems underpin all life through provision of so called ecosystem services, ie the benefits that people obtain from functioning ecosystems, including food, freshwater, fuel, but also important aspects for human well-being such as climate regulation and disease regulation. Rwanda is not only dependent on its natural resources for ecosystem services, but land, forests, waters and wildlife currently also constitute the country’s main sources of households and national income. Restoration of destroyed habitats is difficult and can be very costly. The cost of erosion and watershed deterioration is even greater. In the long term, inclusion of ecological considerations in the land us planning process is likely to prove cost effective. From a legal perspective Rwanda has signed an ratified a number of international convention, treaties and protocols, and is committed to contribute to the conservation of ecosystems, flora and fauna, and to environmental protection in general. There is also a fairly strong environmental legal framework to take into consideration, which promotes the precautionary principle and the polluter pays principle. From a security perspective it is well known that environmental destruction leads to scarcity and scarcity can trigger conflict which can develop into violence. Thus, environmental security is vital to human security and well-being. Unless ecosystem and biodiversity issues are addressed in the today’s planning exercises, we risk to substantially diminishing the benefits that future generations obtain from ecosystems, which has moral implications.
Ecological and environmental status. This section in the present report provides an overview of Rwanda’s ecological and environmental status (see also Setion 6 on
14 2-13 June 2008

Report on Collection of Existing Data
124 (274)
Environment). Rwanda’s ecological deficit is currently negative at about -0.19. It means that any population or consumption increases and industrial developments that will increase CO2 emissions are going to lead to a greater deficit. It means that any population and/or consumption increases in Rwanda are going to lead to a greater deficit, which in the long term is ecologically unsustainable. Like all countries in the world Rwanda will be subjected to the effects of climate change, which implies increased uncertainty in weather, such as rainfall and changes in frequency and intensity of extreme weather events. This will affect natural and human systems, altering productivity, diversity, and functions of ecosystems and livelihoods. Mitigation against the effects of climate change will require: increased understanding of local natural resources, and ecosystem services; protection of natural buffers, eg forests (see also Section 5 on Forestry); economic incentives for sustainable resource management; and, diversifying and enhancing livelihoods so people are better prepared, able to cope and recover from climate stresses, eg drought and heavy rainfall. Maintaining biological diversity, species and genetic diversity in particular, will also help to cushion the effects of and adapt to climate change.
Rwanda’s biodiversity resources seriously depleted. Over the last two decades Rwanda’s biodiversity resources have been seriously depleted, predominantly through a rapid conversion of its natural ecosystems to agricultural land, including the progressive disappearance of national parks. Between 1958 and 1979, Volcanoes National Park lost 55 per cent of its natural habitat mainly for pyrethrum growing (Kalpers, 2001). Forests declined by 78 per cent between 1990 and 2000, and the country is also experiencing loss of its agro-diversity and wetland biodiversity. Apart from the national parks few natural ecosystems, therefore, remain. The protected area constitute approximately 8 % of the total land area, which is below the recommended 10 %. It is, thus, of key importance not to reduce these habitats any further. This means making sure the boundaries of the national parks are respected. In addition, it is expected that the on-going forest and wetland inventories will identify additional areas - most probably coinciding with the currently unprotected Important Bird Areas (IBAs) - which should not be designated for development, but should instead be protected. All districts are affected by deterioration of biodiversity and ecosystem services, but the two main problem areas are the former provinces of Butare and Kbiungu.
Environmental monitoring. Environmental monitoring is essential in development planning. Apart from in the national parks there is currently little ecological monitoring and therefore difficult to establish trends. In summary, the availability of biodiversity baseline and monitoring data in Rwanda is a follows: Rwanda does not have a national checklist of flora or fauna; the Global Red Data List contains a number of both faunal and flora species under threat in Rwanda - this list, however, needs to be re-examined locally as some of the listed species are not likely to occur in Rwanda according to area specialists. It is not clear if a national Red Data List exists. If it does, it is not public; a list of protected animal species in Rwanda is reported to exist and has been requested from Tourism and National Parks Authority (ORTPN), but has not yet been received; no State of the Environment Report (SOER) has been compiled for Rwanda; Birdlife International, Association for the Conservation of Nature in Rwanda (ANCR) and ORTPN are in the process of compiling an atlas of Important Bird Areas (IBAs) in Rwanda and it is hoped that the spatial data in the atlas will be available for inclusion in the Land Use and

Report on Collection of Existing Data
125 (274)
Development Master Plan analysis -in the meantime the consultant of the present report has used data from the Birdlife International publication Important Bird Areas of Africa from 2001; an inventory of wetlands is underway under the Integrated Management of Critical Ecosystems (IMCE) project - data and maps should be available in September 2008 and should be included in the Land Use and Development Master Plan mapping exercise; a new forest atlas, including GIS information has been compiled but is not yet available - it will be a key source of data for the national Land Use and Development Master Plan; and, land suitability maps, recently prepared by the Ministry of Agriculture, are a key source of information for the Land Use and Development Master Planroject, and for this component.
The threats to biodiversity. The threats to biodiversity in Rwanda may be divided into the following groups: habitat conversion and destruction, ie, deforestation, erosion, unsustainable utilisation of marshes and wetlands, fire, etc; pollution; over harvesting, ie unsustainable harvesting and poaching; climatic change , ie foods and droughts; and, invasive species. Of these, habitat conversion is the most serious threat to biodiversity in Rwanda at present. The main drivers of threat to biodiversity include population pressure and poverty. The limited amount of suitable land for agriculture, coupled with a growing population, means that subsistence farming is not a major viable long-term livelihood option for Rwanda. It is, therefore, essential to create alternative livelihoods options, which are not directly based on access to land. This is again most pressing in the areas bordering the National Parks. This is in line with the objectives of Vision 2020 (MINECOFIN, 2000).
Findings and issues. The following features should be included in the geo-database to allow for future trend analysis and mapping. Inclusion of environmental indicators in the Land Use and Development Master Plan GIS data base, will facilitate monitoring and establishment of trends as well as facilitate reporting on these issues as part of national and international ‘State of the Environment Reporting’ requirements or Environmental Outlook reporting (UNEP – State of the Environment Reporting). Areas of special ecological importance, which should be given special focus in the Master Plan are shown in the author’s Project report on collection of existing data on ecology in Rwanda. Some GIS data still needs to be collected. Lacking data include: Forest Atlas database and shape files (with NUR-GIS) from the Ministry of natural Resources (MINIRENA); land suitability mapping, agro-climatic and agro-ecological zone mapping, and soil mapping database and shape files, ie, interactive land use map and all available GIS mapping done for the Schema d’Amenagement des marais, de protection des Bassins Versants et de la Conservation des Sols: Rapport global definitive phase 1 (GOR, 2002); wetlands and critical ecosystems database and shape files from the from the Integrated Management of Critical Ecosystems Project at Rwanda Environment Management Agency (REMA) - to be followed up with REMA; shape files for official boundaries for National Parks - To be followed up with ORTPN; and, Important Bird Areas in Rwanda – any shape files available – to be followed up with ANCR and REMA.

Report on Collection of Existing Data
126 (274)
7.2 Introduction Priorities, eco-systems prerequisites and threats. In reporting on the existing state of ecology in Rwanda, the following TOR were given the Project Ecologist: ‘prioritise’ interest areas of national and international ecological and biodiversity importance – like forests, wetlands, distribution of endemics and threatened species – sorted by agro-forestry-ecological zones; establish the need for, and propose nature of, protecting buffer areas, wildlife corridors and other landscape characteristics essential for healthy and functioning eco-systems; and, identify potential threats, impacts and appropriate indicators for monitoring the situation and for establishing trends.
Stocktaking. To prioritise interest areas and analyse conservation needs, the first step was to undertake a stocktake of existing information. Most of the initial work, thus, entailed collecting data and interviewing relevant biodiversity authorities. The initial approach was to collect distribution data for the various biological groups to make a biodiversity hotspot analysis to guide biodiversity conservation measures. Due to the lack of distribution data this has not been possible and the approach has been changed to focus on identify important ecosystems.
Summary of existing information. This report summarises current available information, lists outstanding data, as well as highlights the areas where there is currently no available data. It also provides justification for including ecological considerations into the land use planning process and provides recommendations on the way forward.
Delimitations. This data collection phase had not included fieldwork or collection of new data. However, in recent years several biodiversity inventories have taken place, and it is hoped that the information and related GIS data will be made available for use by the National Land Use and Development Plan Project, as this will avoid duplication. As most of the GIS related data is not yet available, it has not been possible to do any mapping at this stage.
7.3 Methodology
7.3.1 Data collection and data standards Sources. Information for this section has been gathered from a variety of sources, including national databases and reports, as well as from key biodiversity stakeholders and the Internet. A key source of information has been the Rwanda Biodiversity Strategy and Action Plan and the Rwandan first country report submitted to the Convention on Biological Diversity (CBD).
National focus within international parameters. Whereas the data collection and analyses in this section are focused at the national level, internationally accepted definitions and standards have been used deliberately where applicable to increase compatibility with international reporting systems.
Red Data List (RDL) Categories and Criteria. The 2007 IUCN Red Data List (RDL) of Threatened Species (IUCN, 2007) (Figure 7.1, below). Any threatened rating implies that a species has a high to extremely high risk of becoming extinct in the wild (for details on the specific criteria, please refer to: http://www.iucnredlist.org/info/categories_criteria2001).
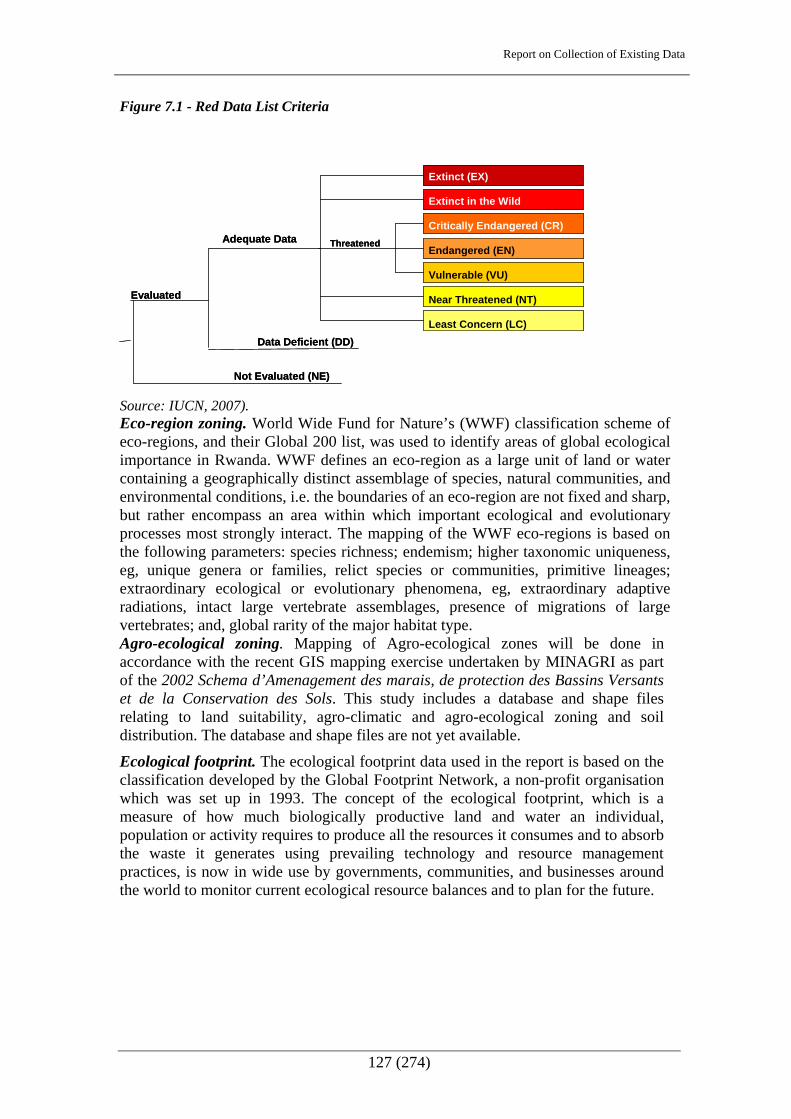
Report on Collection of Existing Data
127 (274)
Figure 7.1 - Red Data List Criteria
Extinct (EX)
Source: IUCN, 2007). Eco-region zoning. World Wide Fund for Nature’s (WWF) classification scheme of eco-regions, and their Global 200 list, was used to identify areas of global ecological importance in Rwanda. WWF defines an eco-region as a large unit of land or water containing a geographically distinct assemblage of species, natural communities, and environmental conditions, i.e. the boundaries of an eco-region are not fixed and sharp, but rather encompass an area within which important ecological and evolutionary processes most strongly interact. The mapping of the WWF eco-regions is based on the following parameters: species richness; endemism; higher taxonomic uniqueness, eg, unique genera or families, relict species or communities, primitive lineages; extraordinary ecological or evolutionary phenomena, eg, extraordinary adaptive radiations, intact large vertebrate assemblages, presence of migrations of large vertebrates; and, global rarity of the major habitat type. Agro-ecological zoning. Mapping of Agro-ecological zones will be done in accordance with the recent GIS mapping exercise undertaken by MINAGRI as part of the 2002 Schema d’Amenagement des marais, de protection des Bassins Versants et de la Conservation des Sols. This study includes a database and shape files relating to land suitability, agro-climatic and agro-ecological zoning and soil distribution. The database and shape files are not yet available.
Ecological footprint. The ecological footprint data used in the report is based on the classification developed by the Global Footprint Network, a non-profit organisation which was set up in 1993. The concept of the ecological footprint, which is a measure of how much biologically productive land and water an individual, population or activity requires to produce all the resources it consumes and to absorb the waste it generates using prevailing technology and resource management practices, is now in wide use by governments, communities, and businesses around the world to monitor current ecological resource balances and to plan for the future.
Extinct in the Wild
Critically Endangered (CR) Endangered (EN)
Vulnerable (VU)
Near Threatened (NT)
Least Concern (LC)
Evaluated
Adequate Data Threatened
Not Evaluated (NE)
Data Deficient (DD)
Extinct (EX)
Extinct in the Wild
Critically Endangered (CR) Endangered (EN)
Vulnerable (VU)
Near Threatened (NT)
Least Concern (LC)
Evaluated
Adequate Data Threatened
Data Deficient (DD)
Not Evaluated (NE)

Report on Collection of Existing Data
128 (274)
7.4 Need for Ecological Consideration in the Planning Process
7.4.1 The importance of biodiversity and functioning ecosystems Billions of years of evolution. ‘Biological diversity’ or ‘biodiversity’ includes diversity within species, between species and of ecosystems (Convention on Biological Diversity, Article 2). The biodiversity we see today is the fruit of billions of years of evolution, shaped by natural processes and, increasingly, by the influence of humans. An ‘ecosystem’ is a natural dynamic unit consisting of all plants, animals and micro-organisms (biotic factors) in an area functioning together with all of the non-living physical (abiotic) factors of the environment (Wikipedia, 2008 - Ecosystem). Functioning ecosystems underpin all life through provision of so called ecosystem services, ie the benefits that people obtain from functioning ecosystems, including food, freshwater, fuel, but also important aspects for human well-being such as climate regulation, disease regulation and cultural values (Figure 7.2, below). ‘Level of biodiversity’ is an indicator of the state of ecosystem functioning and hence its ability to provide ecosystem services. Figure 7.2 - Ecosystem services
Source: Millennium Ecosystem Assessment Final Report, 2005. The Millennium Ecosystem Assessment (MA), released in 2005, reported, that 15 of the 24 ecosystem services assessed were being degraded or used unsustainably (Millennium Ecosystem Assessment). The indirect and direct drivers, which influence ecosystems, are illustrated in Figure 7.3, below.
Rapid conversion of Rwanda’s natural ecosystems. Rwanda has seen a rapid conversion of its natural ecosystems to agricultural land in recent years, mainly due to population increases, and hence a growing demand for food and timber. Today, it

Report on Collection of Existing Data
129 (274)
is only the areas, which are under formal protection, ca 8 % (World Resources Centre, 2003a), which can be called natural ecosystems. Maintaining natural ecosystems while meeting increasing demands for their services will involve significant changes in policies, institutions and practices (Millennium Ecosystem Assessment). However, reversing and restoring degraded ecosystems is more costly in the long term than to maintain them, and unless ecosystem and biodiversity issues are addressed in the today’s planning exercises, we risk to substantially diminish the benefits that future generations obtain from ecosystems. In practice this means that measures need to be put in place to allow the remaining natural ecosystems in Rwanda to carry on functioning.
Figure 7.3 - Ecosystem services and drivers of change
Direct Drivers of ChangeChanges in land useSpecies introduction or removalTechnology adaptation and useExternal inputs (e.g., irrigation)Resource consumptionClimate changeNatural physical and biologicaldrivers (e.g., volcanoes)
Indirect Drivers of ChangeDemographicEconomic (globalization, trade,market and policy framework)Sociopolitical (governance andinstitutional framework)Science and TechnologyCultural and Religious
Human Well-being andPoverty Reduction
Basic material for a good lifeHealthGood Social RelationsSecurityFreedom of choice and action
ECOSYSTEM SERVICESProvisioning (eg food,water, fibre and
fuel)Regulating (eg climate regulation,
water and disease)Cultural (eg spiritual, aesthetic,
recreation and education)Supporting (eg primary production
and soil formation)
LIFE ON EART - BIODIVERSITY
Source: Millennium Ecosystem Assessment, 2008 (adjusted by author).
7.5. Ecological Footprint
7.5.1. Definition
Print vs capacity. The ‘ecological footprint’ is a well-known resource accounting tool. It is a measure of much productive land and sea is needed to feed us and provide all the energy, water and materials we use in our everyday lives. ‘Biocapacity’, on the other hand, measures the capacity of ecosystems to produce useful biological materials and to absorb waste materials generated by humans, using current management schemes and extraction technologies. Together they

Report on Collection of Existing Data
130 (274)
allow us to compare human consumption of natural resources with planet Earth’s ecological capacity to regenerate them. The Ecological Footprint is most commonly expressed in units of global hectares. A global hectare is a hectare that is normalized to have the world average productivity of all biologically productive land and water in a given year.
7.5.2. Ecological deficit in Rwanda
Risk of ecological unsustainability. Based on a population of 8.4 million in 2003, according to the Global Footprint Network, Rwanda’s total ecological footprint is 0.66 global hectares per person, whereas the total bio-capacity is 0.47, resulting in an ecological deficit of -0.1915. It means that there is a risk that any unmitigated population and/or consumption increases in Rwanda will lead to a greater deficit, which in the long term is ecologically unsustainable. It is, therefore, important to ensure that development planning takes into account the need to maintain bio-capacity by maintaining, for example, forest and wetland ecosystems. Box 7.1 - Carbon foot print and carbon credit
Carbon footprint. The carbon footprint is included in the calculation of the ecological footprint (see above), where it is synonymous with demand on carbon dioxide (CO2) area, ie, the bio-capacity required to sequester (through photosynthesis) the CO2 emissions from fossil fuel combustion. In the climate change debate, however, the phrase ‘carbon footprint’ is often taken to mean tonnes of carbon emissions rather than demand on bio-productive area.
Carbon credit. Carbon footprints and carbon credit are closely related. The international carbon credit-trading scheme has recently been created to mitigate global warming through trading carbon emissions with carbon credits. Credits can be exchanged between businesses or bought and sold in international markets at the prevailing market price. Countries with a positive ecological footprint can take advantage of the carbon credit trade by selling carbon credits. Carbon credit can, for example, be created by preserving trees that store carbon dioxide or by preventing the release of green house gases through the use of clean technologies. Plants absorb CO2, the main pollutant blamed for global warming, and use it to convert light into chemical energy. The older the forest, one the one hand, the more CO2 it can absorb. Protection of intact forests is, therefore, a key mechanism for reducing carbon-dioxide emissions. Destruction of forests, on the other hand, releases CO2 into the atmosphere and contributes to the carbon emissions.
Low CO2 in Rwanda. Rwanda’s per capita CO2 emissions are comparatively low, at 0.1 thousand metric tonnes in 1998 and 0.1 thousand metric tonnes in 2006, compared to the African and world averages (World Resources Institute, 2003b:1).
7.6 Climate Change
7.6.1 Universal and African impacts
African continent vulnerable. Today, most of the world’s scientists agree that human activity - mainly greenhouse gas emissions from the burning of fossil fuels for energy - is now causing the Earth’s climate to change. The impacts of climate change are overwhelmingly negative and will affect disadvantaged and vulnerable communities first and hardest. The African continent is highly vulnerable to the impacts of climate change (IISD-ACCESA) with many relying on climate-sensitive
15 The world average is -0.5.
Report on Collection of Existing Data
131 (274)
economic activities such as rain-fed subsistence agriculture. According to the Millennium Ecosystem Assessment16, observed recent impacts of climate changes on ecosystems include: changes in species distributions; changes in population sizes; changes in the timing of reproduction or migration events; and, increase in the frequency of pest and disease outbreaks. Whereas some ecosystem services in some regions may initially be enhanced by projected changes in climate, the harmful impacts are likely to outweigh the benefits in most regions of the world as climate change becomes more severe.
7.6.2 Impact in Rwanda Rainfall uncertainty and extreme weather. It is difficult to predict the exact effects of climate change on Rwanda, but increased uncertainty in weather, such as rainfall and changes in frequency and intensity of extreme weather events are likely. This will affect natural and human systems, altering productivity, diversity, and functions of ecosystems and livelihoods. Mitigation against the effects of climate change will require: increased understanding of local natural resources, and ecosystem services; protection of natural buffers, eg forests; economic incentives for sustainable resource management; and, diversifying and enhancing livelihoods so people are better prepared, able to cope and recover from climate stresses, eg drought and heavy rainfall (Willets, 2007). Maintaining biological diversity, species and genetic diversity in particular, will also help to cushion the effects of and adapt to climate change.
7.7 Legal and Policy Context Full review ensuing. This sub-section provides a brief overview of the legal and policy context in Rwanda with regards to biodiversity and ecological issues. It is based on available documentation. This represents only one part of the legal framework with which the present National Land Use and Development Master Plan Project needs to comply with. A full legal review by a legal specialist is, however, to be done as part of the development of the National Land Use and Development Master Plan. It will revisit also laws and policy relating to ecology.
7.7.1 International commitments Rwanda committed. Rwanda has signed important international conventions, treaties and protocols. By signing and ratifying them, Rwanda is committed to contribute to the conservation of ecosystems, flora and fauna, and to environmental protection in general.
16 The Millennium Ecosystem Assessment is the result of a five year project to assess the consequences of ecosystem change. From 2001-5 it involved more than 1360 experts worldwide. The work provides a scientific basis for action to conserve and sustainable use of ecosystems.
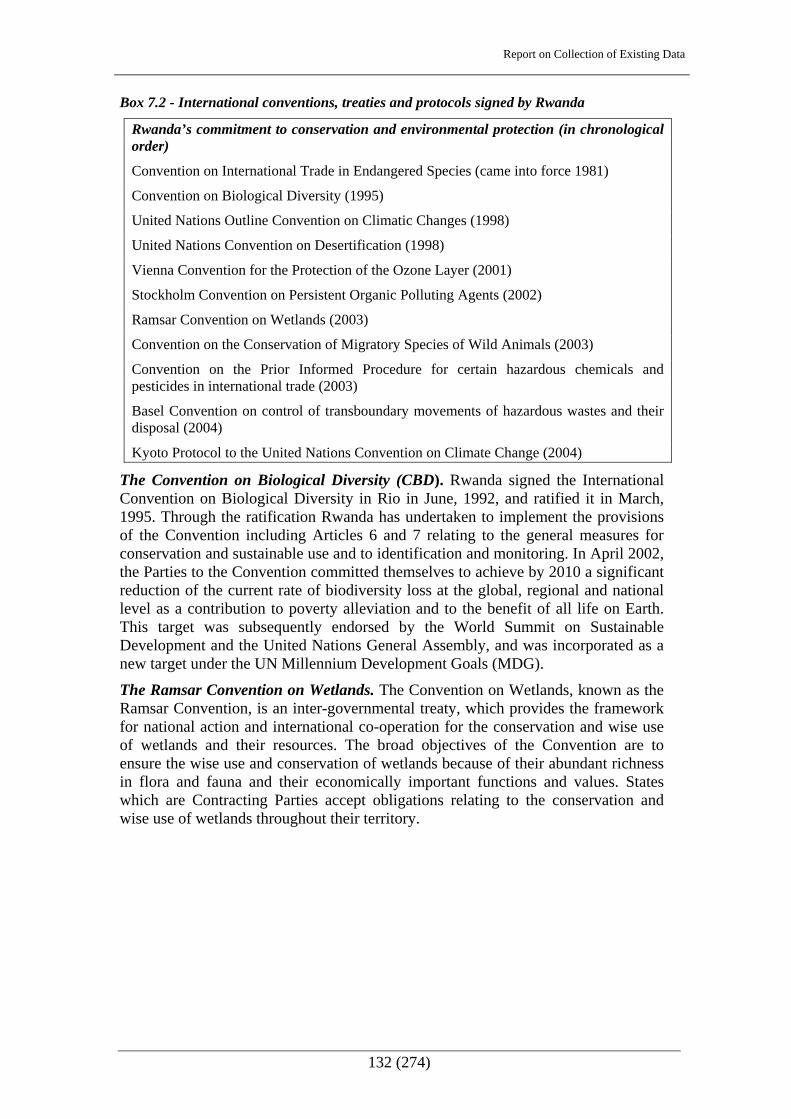
Report on Collection of Existing Data
132 (274)
Box 7.2 - International conventions, treaties and protocols signed by Rwanda
Rwanda’s commitment to conservation and environmental protection (in chronological order)
Convention on International Trade in Endangered Species (came into force 1981)
Convention on Biological Diversity (1995)
United Nations Outline Convention on Climatic Changes (1998)
United Nations Convention on Desertification (1998)
Vienna Convention for the Protection of the Ozone Layer (2001)
Stockholm Convention on Persistent Organic Polluting Agents (2002)
Ramsar Convention on Wetlands (2003)
Convention on the Conservation of Migratory Species of Wild Animals (2003)
Convention on the Prior Informed Procedure for certain hazardous chemicals and pesticides in international trade (2003)
Basel Convention on control of transboundary movements of hazardous wastes and their disposal (2004)
Kyoto Protocol to the United Nations Convention on Climate Change (2004)
The Convention on Biological Diversity (CBD). Rwanda signed the International Convention on Biological Diversity in Rio in June, 1992, and ratified it in March, 1995. Through the ratification Rwanda has undertaken to implement the provisions of the Convention including Articles 6 and 7 relating to the general measures for conservation and sustainable use and to identification and monitoring. In April 2002, the Parties to the Convention committed themselves to achieve by 2010 a significant reduction of the current rate of biodiversity loss at the global, regional and national level as a contribution to poverty alleviation and to the benefit of all life on Earth. This target was subsequently endorsed by the World Summit on Sustainable Development and the United Nations General Assembly, and was incorporated as a new target under the UN Millennium Development Goals (MDG).
The Ramsar Convention on Wetlands. The Convention on Wetlands, known as the Ramsar Convention, is an inter-governmental treaty, which provides the framework for national action and international co-operation for the conservation and wise use of wetlands and their resources. The broad objectives of the Convention are to ensure the wise use and conservation of wetlands because of their abundant richness in flora and fauna and their economically important functions and values. States which are Contracting Parties accept obligations relating to the conservation and wise use of wetlands throughout their territory.

Report on Collection of Existing Data
133 (274)
Box 7.3 - Rwanda Ramsar contracting party
REMA. Rwanda became a contracting party in April 2006, and as such has designated the Rugezi-Bulera-Ruhondo wetland area as a national Ramsar site (site no 1589). Subsequently, a Memorandum of Cooperation was signed in April 2008 between the Ramsar Secretariat and Rwanda Environment Management Authority (REMA) to prepare the inventory and categorisation of the Rwanda wetlands and marshlands. In addition, the two institutions will collaborate on: developing a political and legal framework for the wise use of Rwanda marshlands; strengthening the conservation and integrated management of Rwanda wetlands in general and marshlands in particular; and, raising funds and securing technical assistance for the Rwanda Wetlands Program.
UNESCO Man and Biosphere Programme and World Heritage Site Programme. The Man and the Biosphere Programme (MAB) was launched by UNESCO in the early 1970s, aimed at combining scientific knowledge and governance modalities to: reduce biodiversity loss; improve livelihoods; and, enhance social, economic and cultural conditions for environmental sustainability. The objective is to contribute to achieving the Millennium Development Goals (MDG), in particular MDG 7 on environmental sustainability. Rwanda has got one designated Biosphere Reserve, the Volcanoes Biosphere Reserve. It covers an area of about 15000 ha, and is part of the Volcanoes National Park.
7.7.2 National policies and legal instruments To safeguard also natural heritage. Rwanda has a good, and in parts very up-to-date, legal and policy framework with regards to protection of bio-diversity and related issues. The country has recently embarked on reforming laws concerning environment by drafting an Organic Law on Environment Protection and Management (2005). The law sets out the general legal framework for environment protection and management in Rwanda. The law, on the one hand, gives right to every natural or legal person in Rwanda to live in a healthy and balanced environment, but, on the other hand, obliges them to contribute individually or collectively to safeguard country’s natural, historic and socio-cultural heritage.
Vision 2020. The protection and management of environment are among the pillars of Vision 2020 (Republic of Rwanda, 2000). The objective of the Government is that by 2020, it will have built a nation in which pressure on natural resources, particularly on land, water, biomass and biodiversity, has significantly been reduced, and the process of environmental pollution and degradation has been reversed; a nation in which the management and protection of these resources and environment are more rational and well regulated to preserve and bequeath to future generations the basic wealth necessary for sustainable development.
Biodiversity. The National Biodiversity Strategy and Action Plan was published in 2003. The strategy is built around twelve objectives deduced from five major aims. These are:
• improved conservation of protected areas and wetlands;
• sustainable use of the biodiversity of natural ecosystems and agro- ecosystems;
• rational use of biotechnology;
• development and strengthening of policy, institutional, legal and human resource frameworks; and,

Report on Collection of Existing Data
134 (274)
• equitable sharing of benefits derived from the use of biological resources.
Bill on flora and fauna. The 2007 Bill on Wild Flora and Fauna Protection and Management in Rwanda determines the overall legal framework of the protection and management of the wild flora and fauna of the protected areas in the country. It states that the precaution principle is very important towards avoiding or decreasing harmful consequences the wild flora and fauna. It also advocates the adoption of the ‘polluter pays’ principle.
Organic law on bio-divdersity. The N° 04/2005 Organic Law, determining the modalities of protection, conservation and promotion of environment in Rwanda, aims at:
• conserving the environment, people and their habitats;
• setting up fundamental principles related to protection of environment, any means that may degrade the environment with the intention of promoting the natural resources, to discourage any hazardous and destructive means;
• promoting the social welfare of the population considering equal distribution of the existing wealth;
• considering the durability of the resources with an emphasis especially on equal rights on present and future generations;
• guaranteeing to all Rwandans sustainable development, which does not harm the environment and the social welfare of the population; and,
• setting up strategies of protecting and reducing negative effects on the environment, and replacing the degraded environment.
General law and policy on land. The Rwanda Draft Land Bill, 2004, institutes principles on land legal rights to be followed throughout the country together with land appendages, be they natural or man-made The National Land Policy (2004) is a national land policy that aims to guarantee a safe and stable form of land tenure, and bring about a rational and planned use of land while ensuring sound land management and an efficient land administration. The National Human Settlement Policy (2004) advocates improved urban planning, the restructuring of unplanned residential areas in towns and the regrouping of settlements (imidugudu) in rural areas.
Forests From 1920, Rwanda has been applying a reforestation policy necessitated by the continuous increase of the demand for wood products. This has included the introduction of non-native rapidly growing species such as the Eucalyptus and the Cypress. An updated forestry policy came out in 2004. It targets ecological and economic welfare of the existing woodlands/forests, forestry research, other types of forestry, institutional capacity building - number and quality of the personnel - and the ongoing desertification process in some parts of the country. Moreover, it recognises the importance of linking forestry with rural development by establishing relationship between forestry and actors, ie beneficiaries. Three existing legislative instruments concern forestry (Box 7.4, below).
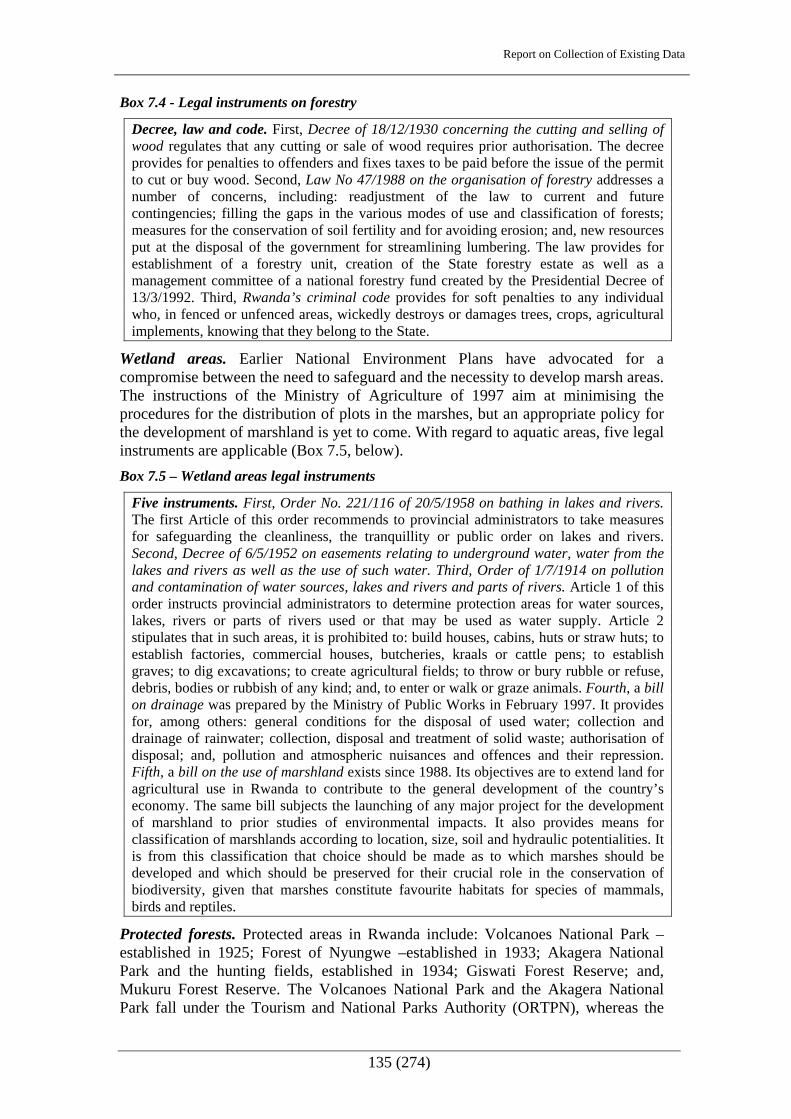
Report on Collection of Existing Data
135 (274)
Box 7.4 - Legal instruments on forestry
Decree, law and code. First, Decree of 18/12/1930 concerning the cutting and selling of wood regulates that any cutting or sale of wood requires prior authorisation. The decree provides for penalties to offenders and fixes taxes to be paid before the issue of the permit to cut or buy wood. Second, Law No 47/1988 on the organisation of forestry addresses a number of concerns, including: readjustment of the law to current and future contingencies; filling the gaps in the various modes of use and classification of forests; measures for the conservation of soil fertility and for avoiding erosion; and, new resources put at the disposal of the government for streamlining lumbering. The law provides for establishment of a forestry unit, creation of the State forestry estate as well as a management committee of a national forestry fund created by the Presidential Decree of 13/3/1992. Third, Rwanda’s criminal code provides for soft penalties to any individual who, in fenced or unfenced areas, wickedly destroys or damages trees, crops, agricultural implements, knowing that they belong to the State.
Wetland areas. Earlier National Environment Plans have advocated for a compromise between the need to safeguard and the necessity to develop marsh areas. The instructions of the Ministry of Agriculture of 1997 aim at minimising the procedures for the distribution of plots in the marshes, but an appropriate policy for the development of marshland is yet to come. With regard to aquatic areas, five legal instruments are applicable (Box 7.5, below). Box 7.5 – Wetland areas legal instruments
Five instruments. First, Order No. 221/116 of 20/5/1958 on bathing in lakes and rivers. The first Article of this order recommends to provincial administrators to take measures for safeguarding the cleanliness, the tranquillity or public order on lakes and rivers. Second, Decree of 6/5/1952 on easements relating to underground water, water from the lakes and rivers as well as the use of such water. Third, Order of 1/7/1914 on pollution and contamination of water sources, lakes and rivers and parts of rivers. Article 1 of this order instructs provincial administrators to determine protection areas for water sources, lakes, rivers or parts of rivers used or that may be used as water supply. Article 2 stipulates that in such areas, it is prohibited to: build houses, cabins, huts or straw huts; to establish factories, commercial houses, butcheries, kraals or cattle pens; to establish graves; to dig excavations; to create agricultural fields; to throw or bury rubble or refuse, debris, bodies or rubbish of any kind; and, to enter or walk or graze animals. Fourth, a bill on drainage was prepared by the Ministry of Public Works in February 1997. It provides for, among others: general conditions for the disposal of used water; collection and drainage of rainwater; collection, disposal and treatment of solid waste; authorisation of disposal; and, pollution and atmospheric nuisances and offences and their repression. Fifth, a bill on the use of marshland exists since 1988. Its objectives are to extend land for agricultural use in Rwanda to contribute to the general development of the country’s economy. The same bill subjects the launching of any major project for the development of marshland to prior studies of environmental impacts. It also provides means for classification of marshlands according to location, size, soil and hydraulic potentialities. It is from this classification that choice should be made as to which marshes should be developed and which should be preserved for their crucial role in the conservation of biodiversity, given that marshes constitute favourite habitats for species of mammals, birds and reptiles.
Protected forests. Protected areas in Rwanda include: Volcanoes National Park – established in 1925; Forest of Nyungwe –established in 1933; Akagera National Park and the hunting fields, established in 1934; Giswati Forest Reserve; and, Mukuru Forest Reserve. The Volcanoes National Park and the Akagera National Park fall under the Tourism and National Parks Authority (ORTPN), whereas the
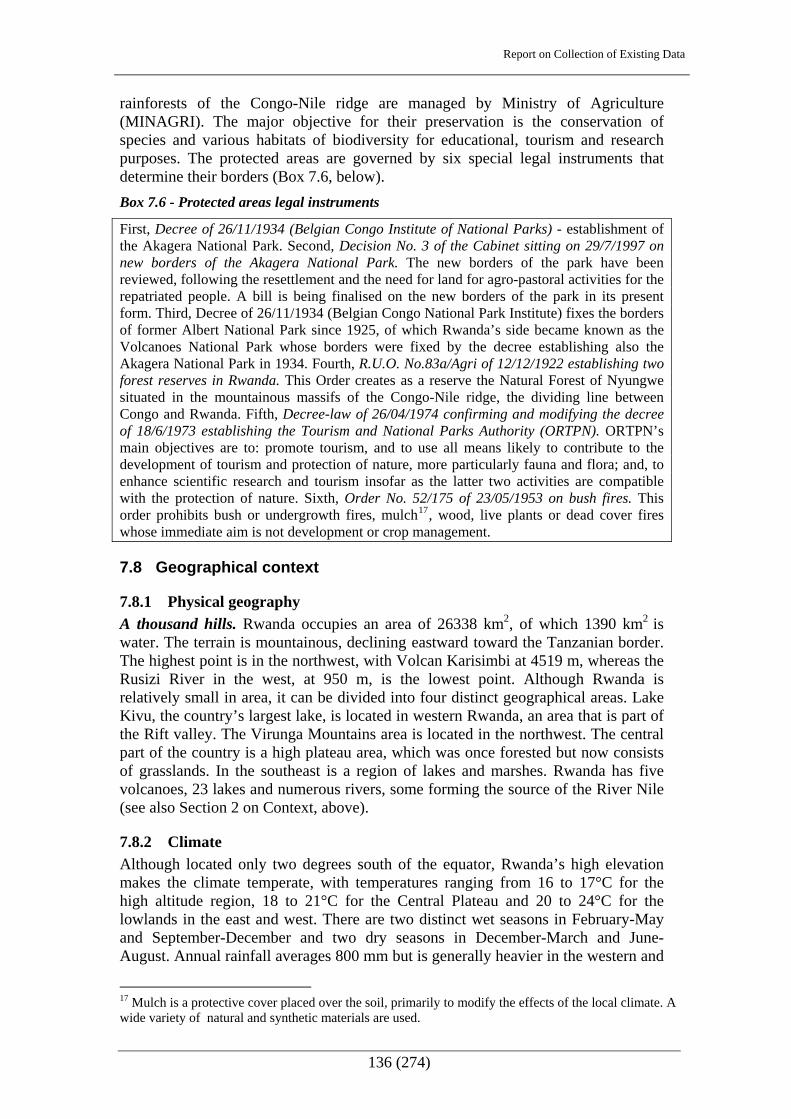
Report on Collection of Existing Data
136 (274)
rainforests of the Congo-Nile ridge are managed by Ministry of Agriculture (MINAGRI). The major objective for their preservation is the conservation of species and various habitats of biodiversity for educational, tourism and research purposes. The protected areas are governed by six special legal instruments that determine their borders (Box 7.6, below). Box 7.6 - Protected areas legal instruments
First, Decree of 26/11/1934 (Belgian Congo Institute of National Parks) - establishment of the Akagera National Park. Second, Decision No. 3 of the Cabinet sitting on 29/7/1997 on new borders of the Akagera National Park. The new borders of the park have been reviewed, following the resettlement and the need for land for agro-pastoral activities for the repatriated people. A bill is being finalised on the new borders of the park in its present form. Third, Decree of 26/11/1934 (Belgian Congo National Park Institute) fixes the borders of former Albert National Park since 1925, of which Rwanda’s side became known as the Volcanoes National Park whose borders were fixed by the decree establishing also the Akagera National Park in 1934. Fourth, R.U.O. No.83a/Agri of 12/12/1922 establishing two forest reserves in Rwanda. This Order creates as a reserve the Natural Forest of Nyungwe situated in the mountainous massifs of the Congo-Nile ridge, the dividing line between Congo and Rwanda. Fifth, Decree-law of 26/04/1974 confirming and modifying the decree of 18/6/1973 establishing the Tourism and National Parks Authority (ORTPN). ORTPN’s main objectives are to: promote tourism, and to use all means likely to contribute to the development of tourism and protection of nature, more particularly fauna and flora; and, to enhance scientific research and tourism insofar as the latter two activities are compatible with the protection of nature. Sixth, Order No. 52/175 of 23/05/1953 on bush fires. This order prohibits bush or undergrowth fires, mulch17, wood, live plants or dead cover fires whose immediate aim is not development or crop management.
7.8 Geographical context
7.8.1 Physical geography A thousand hills. Rwanda occupies an area of 26338 km2, of which 1390 km2 is water. The terrain is mountainous, declining eastward toward the Tanzanian border. The highest point is in the northwest, with Volcan Karisimbi at 4519 m, whereas the Rusizi River in the west, at 950 m, is the lowest point. Although Rwanda is relatively small in area, it can be divided into four distinct geographical areas. Lake Kivu, the country’s largest lake, is located in western Rwanda, an area that is part of the Rift valley. The Virunga Mountains area is located in the northwest. The central part of the country is a high plateau area, which was once forested but now consists of grasslands. In the southeast is a region of lakes and marshes. Rwanda has five volcanoes, 23 lakes and numerous rivers, some forming the source of the River Nile (see also Section 2 on Context, above).
7.8.2 Climate Although located only two degrees south of the equator, Rwanda’s high elevation makes the climate temperate, with temperatures ranging from 16 to 17°C for the high altitude region, 18 to 21°C for the Central Plateau and 20 to 24°C for the lowlands in the east and west. There are two distinct wet seasons in February-May and September-December and two dry seasons in December-March and June-August. Annual rainfall averages 800 mm but is generally heavier in the western and
17 Mulch is a protective cover placed over the soil, primarily to modify the effects of the local climate. A wide variety of natural and synthetic materials are used.
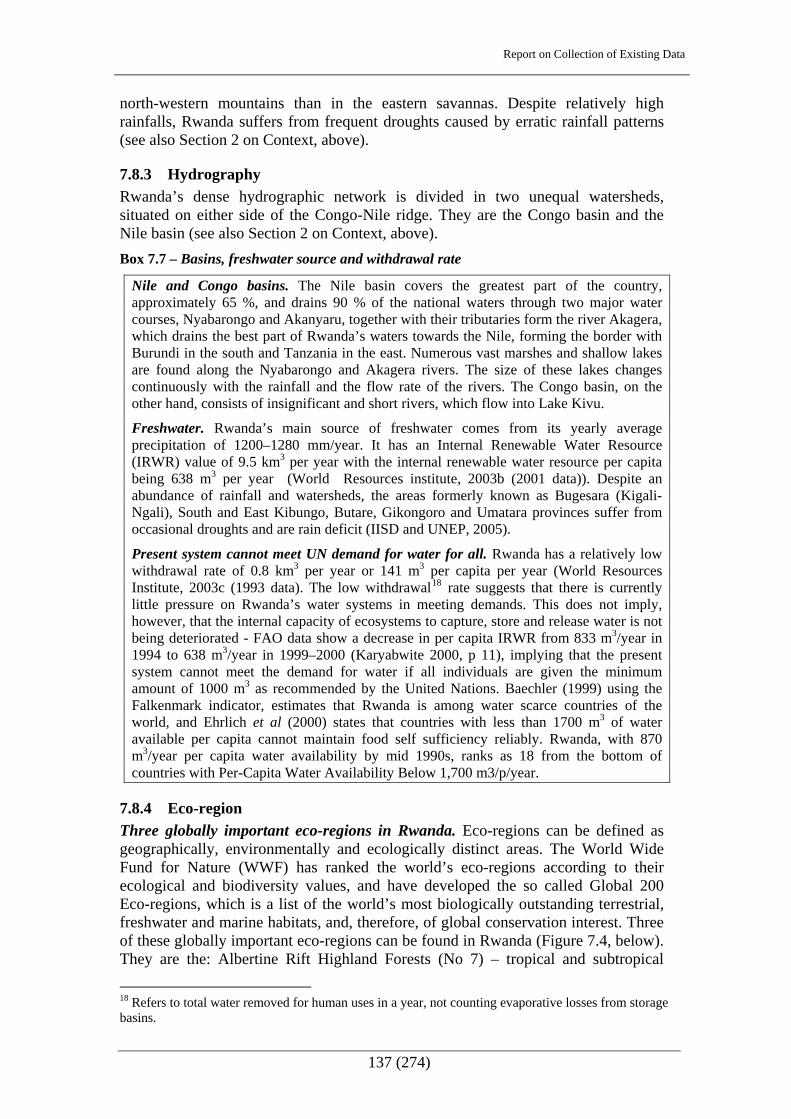
Report on Collection of Existing Data
137 (274)
north-western mountains than in the eastern savannas. Despite relatively high rainfalls, Rwanda suffers from frequent droughts caused by erratic rainfall patterns (see also Section 2 on Context, above).
7.8.3 Hydrography Rwanda’s dense hydrographic network is divided in two unequal watersheds, situated on either side of the Congo-Nile ridge. They are the Congo basin and the Nile basin (see also Section 2 on Context, above). Box 7.7 – Basins, freshwater source and withdrawal rate
Nile and Congo basins. The Nile basin covers the greatest part of the country, approximately 65 %, and drains 90 % of the national waters through two major water courses, Nyabarongo and Akanyaru, together with their tributaries form the river Akagera, which drains the best part of Rwanda’s waters towards the Nile, forming the border with Burundi in the south and Tanzania in the east. Numerous vast marshes and shallow lakes are found along the Nyabarongo and Akagera rivers. The size of these lakes changes continuously with the rainfall and the flow rate of the rivers. The Congo basin, on the other hand, consists of insignificant and short rivers, which flow into Lake Kivu.
Freshwater. Rwanda’s main source of freshwater comes from its yearly average precipitation of 1200–1280 mm/year. It has an Internal Renewable Water Resource (IRWR) value of 9.5 km3 per year with the internal renewable water resource per capita being 638 m3 per year (World Resources institute, 2003b (2001 data)). Despite an abundance of rainfall and watersheds, the areas formerly known as Bugesara (Kigali-Ngali), South and East Kibungo, Butare, Gikongoro and Umatara provinces suffer from occasional droughts and are rain deficit (IISD and UNEP, 2005).
Present system cannot meet UN demand for water for all. Rwanda has a relatively low withdrawal rate of 0.8 km3 per year or 141 m3 per capita per year (World Resources Institute, 2003c (1993 data). The low withdrawal18 rate suggests that there is currently little pressure on Rwanda’s water systems in meeting demands. This does not imply, however, that the internal capacity of ecosystems to capture, store and release water is not being deteriorated - FAO data show a decrease in per capita IRWR from 833 m3/year in 1994 to 638 m3/year in 1999–2000 (Karyabwite 2000, p 11), implying that the present system cannot meet the demand for water if all individuals are given the minimum amount of 1000 m3 as recommended by the United Nations. Baechler (1999) using the Falkenmark indicator, estimates that Rwanda is among water scarce countries of the world, and Ehrlich et al (2000) states that countries with less than 1700 m3 of water available per capita cannot maintain food self sufficiency reliably. Rwanda, with 870 m3/year per capita water availability by mid 1990s, ranks as 18 from the bottom of countries with Per-Capita Water Availability Below 1,700 m3/p/year.
7.8.4 Eco-region Three globally important eco-regions in Rwanda. Eco-regions can be defined as geographically, environmentally and ecologically distinct areas. The World Wide Fund for Nature (WWF) has ranked the world’s eco-regions according to their ecological and biodiversity values, and have developed the so called Global 200 Eco-regions, which is a list of the world’s most biologically outstanding terrestrial, freshwater and marine habitats, and, therefore, of global conservation interest. Three of these globally important eco-regions can be found in Rwanda (Figure 7.4, below). They are the: Albertine Rift Highland Forests (No 7) – tropical and subtropical
18 Refers to total water removed for human uses in a year, not counting evaporative losses from storage basins.

Report on Collection of Existing Data
138 (274)
broadleaf forest; East African Moorlands (No 104) – tropical montane19 grasslands and savannas; and, Rift Valley Lakes (No 165) - lake and closed basin freshwater ecosystems. Figure 7.4- Global 200 Eco-regions in Rwanda
East African moorlands
Albertine Rift highland forest
Rift Valley Lakes
Source: WWF and National Geographic (website)
Box 7.8 - Rift forests, moorlands and rift valley lakes
Albertine Rift High Land Forests. This eco-region measures about 104000 km2 in total, and reaches from the lowland rainforests in the Democratic Republic of Congo eastward towards Lake Tanganyika, and includes the Virunga, Itombwe and Rwenzori mountain ranges. It is one of the most biologically distinctive areas in Africa, with exceptionally large numbers of endemic20 plants and animals. In addition to the many endemic smaller species, the mountain gorilla, one of the most critically threatened large mammals in Africa, is also found in a few places within the eco-region. The region also contains some of the easternmost populations of chimpanzee in Africa. The conservation status of this eco-region is considered by WWF as critical or endangered. The main threats include agriculture, grazing of livestock, hunting and logging. Many of the montane forests have already been cleared, but some sizable blocks of montane forest still occur in areas such as the Virunga, Itombwe and Rwenzori Ranges. In Rwanda this eco-region is represented in the western part of the country and includes Nyungwe National Park, Mukura and Gishwati Forest Reserves and any pockets of forest in between.
19 Pertaining to, growing in, or inhabiting mountainous regions. 20 Native or restricted to a certain country or area
Report on Collection of Existing Data
139 (274)
East African Moorlands. The East African Moorlands are a small eco-region covering only 6000 km2. This Global 200 eco-region is made up of the East African montane moorlands and the Ruwenzori-Virunga montane moorlands eco-regions. It contains the only grassland in Africa that grows high up on mountains, and is one of the few tropical alpine areas in the world. The species here have developed special adaptations to protect against solar radiation and freezing night temperatures. As a result, many plants have thick and woolly leaves. 81 % percent of the plant species in the East African Moorlands are endemic. However, the endemism in the plants is not mirrored in the vertebrates; the number of vertebrate species is small and endemism rates are low. WWF considers the conservation status of the East African moorlands to be relatively Stable/Intact, mainly because many parts are protected in national parks. As pressure on the montane grasslands increases, efforts to protect them must increase too. The largest threat to the moor lands comes from humans - through fires, firewood extraction, over-grazing, and over-browsing21. Tourism has also caused a negative impact in some areas, through litter and severe erosion. Predicted global climate change could also affect species that are specifically adapted to current conditions. In Rwanda the East African Moorlands eco-region is represented in the Volcanoes National Park
Rift Valley Lakes. The Rift Valley Lakes cover an area of more than 300000 km2 along the Great Rift Valley, which extends into the eastern side of Rwanda. The lakes are world-renowned for the diversity of cichlid22 fish species that have evolved in their waters. The lakes are not only important from a biodiversity perspective, but they also play a role in regulating the local climate. WWF has classified the conservation status of the Rift Valley Lakes as critical and endangered. Causes for concern include the introduction of exotic fish and aquatic plant species, pollution, over fishing and deforestation, which causes sedimentation. In Rwanda the Rift Valley Lakes can be found along the eastern border in and around Akagera National Park.
7.8.5 Agro-ecological region Land suitability, agro-climatic, agro-ecological and soil maps have recently been made for the Rwanda under the 2002 MINAGRI project Schema d’Amenagement des marais, de protection des Bassins Versants et de la Conservation des Sols project. A GIS database and shape files are available at MINAGRI. The national Land Use and Development Master Plan Project will need to include the information on the present Project base map and/or thematic maps.
7.8.6 Soils Six groups. Rwandan soils can be divided into six main groups. They are derived from: schistose, sandstone and quartzite formations found in the Congo-Nile Ridge, part of the Central Plateau and on highlands in Byumba; granite and gneissic formations found around Gitarama (Central Plateau) and in the Mutara plains; intrusive basic rocks in the north of Kigali and west of Byumba; alluvial23 and colluvial24 marshes and valleys which comprise mineral soils found in the valleys of the east and the organic soils of the valleys of Akagera, Nyabarongo and Rugezi; recent volcanic materials found at the piedmont of volcanoes; and, old volcanic materials found in the plateau of Cyangugu in the south west of the country (GOR,
21 Feeding on leaves, twigs or other high-growing vegetation 22 Perchlike freshwater fish of the Cichlidae family. Cichlids are popular aquarium species. 23 Made up from deposit of clay, silt, sand and gravel let by flowing steams in a river valley or delta, typically producing fertile soils. 24 Made up from deposits of material that accumulates at the foot of a step slope.

Report on Collection of Existing Data
140 (274)
Ministry of Lands, Resettlement and Environment, 2003:7) (see also Section 3 on Soils, above).
Degraded soils. According to the National Biodiversity Strategy and Action Plan (Republic of Rwanda - Ministry of Lands, Resettlement and Environment, 2003, p7), many of the soils have been degraded due to high rainfall, uneven relief conducive to erosion and over-farming. More than half of the soils in Rwanda are, thus, unsuitable for intensive cropping. The best soils for agricultural purposes are found in parts of the Central Plateau, the volcanic region, Bugarama and part of the Mutara region.
7.9 Biodiversity Inventory Incomplete biological inventories and species data. The planned approach for the present inventory study on ecology was to draw up an inventory of flora and fauna species distribution and by using GIS tools analyse the data including threats and protection to identify biodiversity hotspots in Rwanda. During the study it was realised that there is incomplete biological inventories and species data available, so the biodiversity inventory, instead, is focusing at the ecosystem and habitat level.
7.9.1 Eco-systems in Rwanda Five systems. Five distinct ecosystem areas can be found in Rwanda (Table 7.1, below). Table 7.1– Eco-system areas by type
Eco-system type % of total area Cropland and natural vegetation mosaic 47 Scrubland, savannah and grassland 32 Forest 12 Wetland and water body 8 Sparse vegetation (snow and ice) 1 Urban built up area 0
Source: World Resources Institute, 2003b:1.
7.9.2 Cropland and natural vegetation mosaic Largest eco-system. This type of ecosystem occupies the biggest part of Rwanda, and whereas it may be important for agro-biodiversity and may locally contain species of special interest, it is not of high overall biodiversity value.
7.9.3 Forest Essential ecological role. Forests are key elements in the regulation of the climate and river systems, in the prevention of erosion and reduction of the atmospheric pollution. They play an essential role in global carbon and hydrological cycles. Erosion on agricultural land, for example, is estimated to be 75 times greater than what occurs in natural forested areas (Myers, 1993, in Gurrieri et al, 2003:10). At the watershed level, reduced sedimentation and stream flow regulation help maintain soil quality, limit erosion, stabilise hillsides, modulate seasonal flooding and protect water. Moreover, the forest holds a large number of flora and fauna species. Many people live in and around the forest, and depend directly on it for food, medicines and other basic needs (see also Section 5 on Forestry).
Disappearing forest. Thousands of years ago, most of Rwanda was covered in forest. Today the situation is different and natural forests are still disappearing at an

Report on Collection of Existing Data
141 (274)
alarming rate (Table 7.2, below). The new Forest Atlas for Rwanda is expected to provide updated forest cover information to the Land Use and Development Master Plan project in due course. Table 7.2 - Forest cover and change in forest area in Rwanda
Type Total area cover (ha) Area change 1990-2000 (%) Natural forest 46000 -78% Plantation 261000 +1% Total forest area 307000 -33%
Source: World Resource Institute 2003b:1. Box 7.9 – Natural forests
Mountain and gallery forests. The natural forest in Rwanda includes the mountain forests, and comprise: Nyungwe (89150 ha in 1999); Mukura (1600 ha), which is marginalised and threatened by man’s activities; and, Gishwati whose rate of deforestation is so high that it will soon be extinct; and, Gallery forests. The latter are strips of swampy forests that were extensive in times past. They are all found in the eastern part of the country, mainly in the Akagera river-lake system, and appear to cover a surface area of about 163 ha - to be confirmed by the Forestry Atlas data. Despite the small size of these gallery forests, there are home to an important biodiversity with endemic and rare species. The most important is the Ibanda-Makera forest. Most of the plant species found there are used in traditional medicine, diet and other activities practised by the local population for survival.
7.9.4 Wetlands and water bodies Lakes, rivers and marshes. Wetlands and aquatic lands are generally represented by lakes, rivers and marshes. In Rwanda, wetlands and aquatic lands cover a surface of about 254847 ha - representing 10 % of the national territory of which 5.71 % is for lakes and rivers and 3.9% for marshes. The most important rivers are: Akagera, Nyabarongo, Akanyaru, Ruhwa, Rusizi, Mukungwa, Kagitumba and Muvumba. The biggest marshes are found around these rivers. Most of them are of low altitude, and Kamiranzovu and Rugezi are the only major high altitude marshes. The distribution of wetlands by district and their total areas including cultivated are accounted for in greater detail in the author’s Project report on data collection on ecology. Wetlands and lakes are of general importance for biodiversity. REMA is currently implementing the project ‘Integrated Management of Critical Ecosystems’, which includes an inventory of the wetlands in Rwanda. Information, including GIS data will be available in September 2008. This information should be included in the present Project mapping. With regard to rivers, Rwanda is at the top of the Nile basin accounts for surface areas of the lakes and six biggest marshes in the country, and highlights areas of special interest (Tables 7.3-4, below).
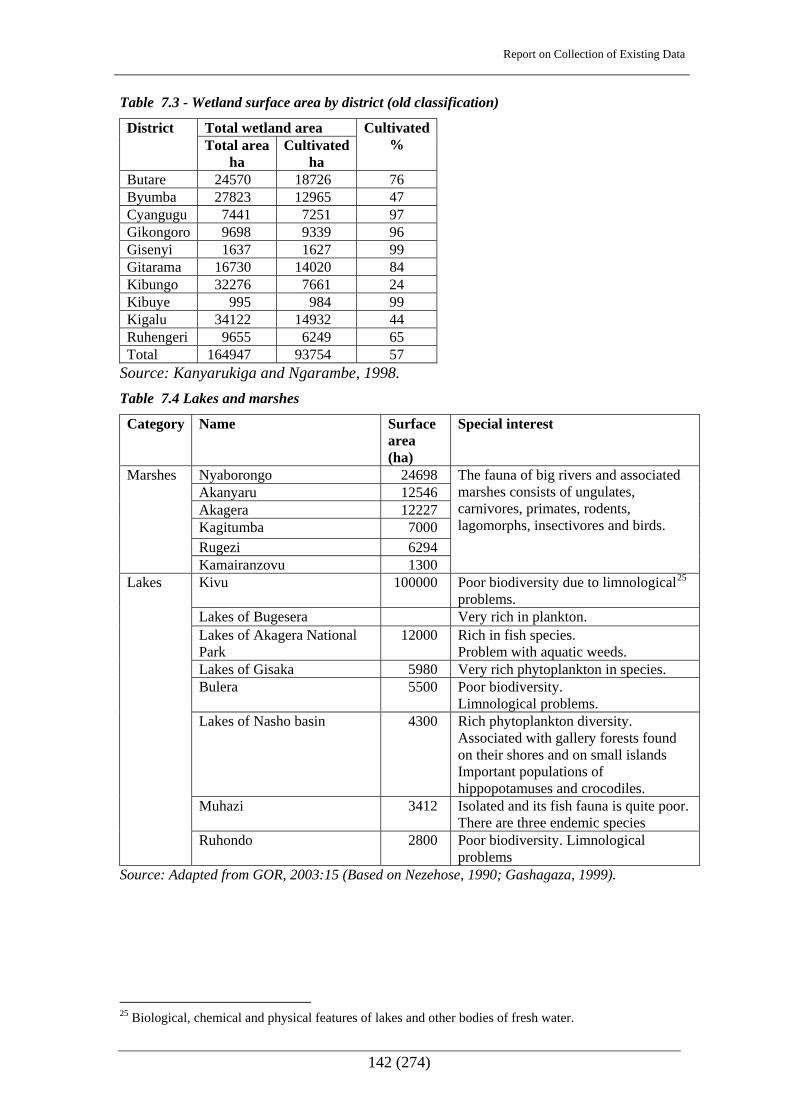
Report on Collection of Existing Data
142 (274)
Table 7.3 - Wetland surface area by district (old classification)
Total wetland area District Total area
ha Cultivated
ha
Cultivated%
Butare 24570 18726 76 Byumba 27823 12965 47 Cyangugu 7441 7251 97 Gikongoro 9698 9339 96 Gisenyi 1637 1627 99 Gitarama 16730 14020 84 Kibungo 32276 7661 24 Kibuye 995 984 99 Kigalu 34122 14932 44 Ruhengeri 9655 6249 65 Total 164947 93754 57
Source: Kanyarukiga and Ngarambe, 1998. Table 7.4 Lakes and marshes
Category Name Surface area (ha)
Special interest
Nyaborongo 24698 Akanyaru 12546 Akagera 12227 Kagitumba 7000 Rugezi 6294
Marshes
Kamairanzovu 1300
The fauna of big rivers and associated marshes consists of ungulates, carnivores, primates, rodents, lagomorphs, insectivores and birds.
Kivu 100000 Poor biodiversity due to limnological25 problems.
Lakes of Bugesera Very rich in plankton. Lakes of Akagera National Park
12000 Rich in fish species. Problem with aquatic weeds.
Lakes of Gisaka 5980 Very rich phytoplankton in species. Bulera 5500 Poor biodiversity.
Limnological problems. Lakes of Nasho basin 4300 Rich phytoplankton diversity.
Associated with gallery forests found on their shores and on small islands Important populations of hippopotamuses and crocodiles.
Muhazi 3412 Isolated and its fish fauna is quite poor. There are three endemic species
Lakes
Ruhondo 2800 Poor biodiversity. Limnological problems
Source: Adapted from GOR, 2003:15 (Based on Nezehose, 1990; Gashagaza, 1999).
25 Biological, chemical and physical features of lakes and other bodies of fresh water.
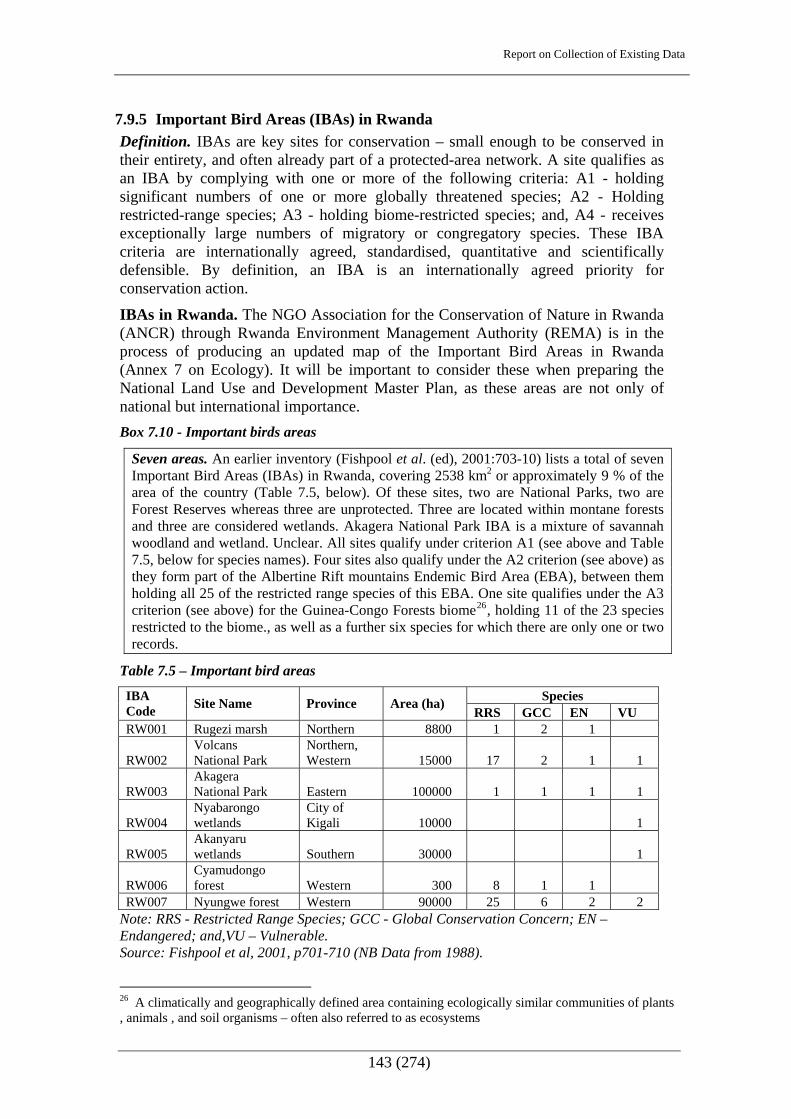
Report on Collection of Existing Data
143 (274)
7.9.5 Important Bird Areas (IBAs) in Rwanda Definition. IBAs are key sites for conservation – small enough to be conserved in their entirety, and often already part of a protected-area network. A site qualifies as an IBA by complying with one or more of the following criteria: A1 - holding significant numbers of one or more globally threatened species; A2 - Holding restricted-range species; A3 - holding biome-restricted species; and, A4 - receives exceptionally large numbers of migratory or congregatory species. These IBA criteria are internationally agreed, standardised, quantitative and scientifically defensible. By definition, an IBA is an internationally agreed priority for conservation action.
IBAs in Rwanda. The NGO Association for the Conservation of Nature in Rwanda (ANCR) through Rwanda Environment Management Authority (REMA) is in the process of producing an updated map of the Important Bird Areas in Rwanda (Annex 7 on Ecology). It will be important to consider these when preparing the National Land Use and Development Master Plan, as these areas are not only of national but international importance. Box 7.10 - Important birds areas
Seven areas. An earlier inventory (Fishpool et al. (ed), 2001:703-10) lists a total of seven Important Bird Areas (IBAs) in Rwanda, covering 2538 km2 or approximately 9 % of the area of the country (Table 7.5, below). Of these sites, two are National Parks, two are Forest Reserves whereas three are unprotected. Three are located within montane forests and three are considered wetlands. Akagera National Park IBA is a mixture of savannah woodland and wetland. Unclear. All sites qualify under criterion A1 (see above and Table 7.5, below for species names). Four sites also qualify under the A2 criterion (see above) as they form part of the Albertine Rift mountains Endemic Bird Area (EBA), between them holding all 25 of the restricted range species of this EBA. One site qualifies under the A3 criterion (see above) for the Guinea-Congo Forests biome26, holding 11 of the 23 species restricted to the biome., as well as a further six species for which there are only one or two records.
Table 7.5 – Important bird areas
Species IBA Code Site Name Province Area (ha)
RRS GCC EN VU RW001 Rugezi marsh Northern 8800 1 2 1
RW002 Volcans National Park
Northern, Western 15000 17 2 1 1
RW003 Akagera National Park Eastern 100000 1 1 1 1
RW004 Nyabarongo wetlands
City of Kigali 10000 1
RW005 Akanyaru wetlands Southern 30000 1
RW006 Cyamudongo forest Western 300 8 1 1
RW007 Nyungwe forest Western 90000 25 6 2 2 Note: RRS - Restricted Range Species; GCC - Global Conservation Concern; EN – Endangered; and,VU – Vulnerable. Source: Fishpool et al, 2001, p701-710 (NB Data from 1988).
26 A climatically and geographically defined area containing ecologically similar communities of plants , animals , and soil organisms – often also referred to as ecosystems

Report on Collection of Existing Data
144 (274)
7.9.6 Red Data Listed (RDL) Species Need to secure local red data list. The International Conservation Union, IUCN, has developed criteria for assessing the conservation status of flora and fauna. According to the latest list (IUCN, 2007) Rwanda has 17 mammals of which two are bat species, ten birds, eight amphibians, ie frog species, nine fish five invertebrate and three plants species on the list, making a total of 52 species in the threatened categories - Vulnerable (VU), Endangered (EN), Critically Endangered (CR ). It should be noted that these are species that are globally threatened (ibid), but it has not been possible to track down a local red data list, ie a list of species, which are locally at risk of disappearing from the wild. Species, which are listed under the threatened categories, are at high to extremely high risk of going extinct in the wild.
Flora. The latest IUCN Red List (2007) of threatened species lists six plant species, five of them trees, as occurring in Rwanda. Three of these are listed as vulnerable at a global level. It has not been possible to source a local Red Data List, but tree species such as Entandophragma excelsum, Faurea saligna, Symphonia globulifera, Hagenia abyssinica, Parinari excelsa, and Podocarpus latifolius are reported as becoming rare following selective felling for sawmill products. Polyscias fulva, Markhamia lutea, Arundinaria mildbraedii have become very rare in the gallery forests of the east, while the bamboo forests at base of the volcanoes are decreasing and Neobutonia macrocalyx, Dombeya goetzenii and Prunus africana have become extinct from the forests in Volcanoes National Park (Republic or Rwanda, 2003:42). Table 7.6 – RDL plant species
No Scientific Name
Common Name(s) Rating Trend Family Type
1 Pouteria altissima
LR/cd ver 2.3 (1994)
? SAPOTACEAE Tree
2 Balthasaria schliebenii*
LR/nt ver 2.3 (1994)
? THEACEAE Tree
3 Milicia excelsa
LR/nt ver 2.3 (1994)
? MORACEAE Tree
4 Ocotea kenyebsis
VU A1cd ver 2.3 (1994)
? LAURACEAE Tree
5 Prunus africana
Red stinkwood
VU A1cd ver 2.3 (1994)
? ROSACEAE Tree
6 Secamone racemosa
VU A2c ver 3.1 (2001)
? ASCLEIPIDACEAE Climber
Note: *Tropical Africa Balthasaria schliebenii is a synonum of Melchiora Schliebenii (Melch.) Kobuski var intermedia; and, ? = trend not known. Source: IUCN, 2007. Fauna. The IUCN Species Survival Commission lists six fauna species occurring in Rwanda as critically endangered, four of which are fish species. Twelve species, including the mountain gorilla and the chimpanzee are endangered and 26 animal species are vulnerable animal species in Rwanda (IUCN, 2007) (Table 7.7, below).

Report on Collection of Existing Data
145 (274)
Table 7.7 - Threatened animal species
Scientific Name Common Name
Red List Status Trend Type
Rhinolophus hilli CR B1ab(iii) ? Bat Barbus ruasae CR B1ab(ii,iii)+2ab(ii,iii) - Fish Chiloglanis ruziziensis CR B1ab(iii)+2ab(iii) ? Fish Varicorhinus platystoma CR
B1ab(i,ii,iii)+2ab(i,ii,iii) - Fish
Varicorhinus randae CR B1ab(ii,iii)+2ab(ii,iii) - Fish
Diceros bicornis Black rhinoceros
CR A2abc + Mam
Apalis argentea Kungwe apalis EN B1ab(i,ii,iii,v) - Bird Ardeola idea Madagascar
pond-heron EN C2a(ii) - Bird
Bradypterus graueri Grauer’s scrub-warbler
EN B2ab(ii,iii,iv,v) - Bird
Barbus acuticeps EN A2bcd - Fish Barbus claudinae EN B1ab(ii,iii)+2ab(ii,iii) ? Fish Haplochromis erythromaculatus
EN B1ab(iii)+2ab(iii) - Fish
Marcusenius victoriae Victoria stonebasher
EN A2bcde - Fish
Leptopelis karissimbensis EN B1ab(iii) - Frog Delanymys brooksi Delany’s
mouse EN B1ab(iii) - Mam
Gorilla veringei Mountain gorilla
EN A2cd ? Mam
Lyacon pictus African wild dog
EN C2a(i) - Mam
Pan troglodytes Chimpanzee EN A4cd - Mam Rhinolophus ruwenzorii Ruwenzori
horseshoe bat VU A4c; B1ab(iii) ? Bat
Balaeniceps rex Shoebill VU C2a(ii) - Bird Chiropeta gracilirostris Papyrus yellow
warbler VU C2a(i) - Bird
Cryptospiza shelleyi Shelley's crimson-wing
VU C2a(i) - Bird
Falco naumanni Lesser kestrel VU A2bce+3bce - Bird Glaucidium albertinum Albertine owlet VU C2a(i) - Bird Torgos tracheliotos Lappet-faced
vulture VU C2a(ii) - Bird
Trigonoceps occipitalis White-headed vulture
VU C2a(ii) - Bird
Synodontis ruandae VU D2 ? Fish Afrixalus orophilus VU B1ab(iii) - Frog Callixalus pictus VU B1ab(iii) - Frog Hyperolius castaneus VU B1ab(iii) - Frog Hyperolius discodactylus VU B1ab(iii) - Frog Phrynobatachus versicolor VU B1ab(iii) - Frog Phrynobatrachus acutirostris
VU B1ab(iii) - Frog
Phryobatrachus bequaerti VU B1ab(iii) - Frog

Report on Collection of Existing Data
146 (274)
Scientific Name Common Name
Red List Status Trend Type
Crocidura lanosa Lemara shrew VU D2 ? Mam Hippopotamus amphibious Common
hippopotamus VU A4cd - Mam
Hybomys lunaris Moon striped mouse
VU D2 0 Mam
Loxodonta africana African elephant
VU A2a ? Mam
Panthera leo African lion VU A2abcd - Mam Pelomys hopkinsi Hopkins's
groove-toothed swamp rat
VU B1ab(iii) ? Mam
Praomys degraaffi VU B1ab(iii) - Mam Profelis aurata African golden
cat VU C2a(i) - Mam
Ruwenzorisorex suncoides Ruwenzori shrew
VU B2ab(iii) ? Mam
Thamnomys kempi Kemp’s thicket rat
VU B1ab(iii) ? Mam
Source: IUCN 2007. Box 7.11 - Nearly threatened, endemic and extinct birds
Nearly threatened birds. In addition to the threatened Rwandan birds (Table 7.7, above), there are a number of nearly threatened bird species including three non-breeding migrants from the Paleartic, ie, Circus macrourus (NT), Gallinago media (NT) and Glareola nordmanni (NT), whereas Ardeola idea (NT) breeds in Madagascar. The breeding species include eight Albertine Rift endemics: Glaucidium albertinum (VU), Indicator pumilio (NT), Malaconotus lagdeni (NT), Zoothera tanganjicae (NT), Kupeornis rufocinctus (NT), Apalis argentea (VU), Bradypterus graueri (VU) and Cryptopiza shelleyi (VU). Of the remainder, two are species of papyrus swamps, ie, Laniariums mufumbiri (NT) and Chloropeta gracilirostris (VU), whereas the others are Balaenicps rex (NT) and Lybius rubrifacies (NT), both of which occur in the savannah-wetlands complex of Akagera. The presence of a further three species in Rwanda, all vulnerable, remains to be confirmed. They are: Phodilus prigoginei, Musicapa lendu and Mectarinia rockefelleri.
Endemic Albertine Rift Endemic birds. There are no birds endemic to Rwanda, but the montane forests and associated habitats hold 25 of the 37 species of Albertine Rift Endemic Bird Area (EBA 106). In addition, L rubrifacies is also a restricted-range species whose distribution defines the dry woodlands west of Lake Victoria Secondary Area (s057).
Now extinct? There are no recent records of a number of species on the Rwandan list, and it is thought some may have become nationally extinct, presumably due to the destruction of their habitat. These include Phyllastrephus scandens, Cossypha cyanocampter, and Camaroptera chloronota from gallery forests north of Akagera National Park, Trachyphonus purpuratus , Stiphrornis erythrothorax and Muscicapa cassini from lower-altitude forest in Nyungwe and Hyliota flavigaster and Anthreptes orientalis from the Rusomo region (Fishpool et al, 2001:703-10).

Report on Collection of Existing Data
147 (274)
7.10 Threats to Ecosystem Services and Biodiversity
7.10.1 General 78 % forest decline 1990-2000. Biodiversity loss in Rwanda is severe. It is mainly due to the progressive disappearance of national parks and large-scale habitat destruction (World Bank 2004 cited in IISD and UNEP, 2005). Between 1958-79, Volcanoes National Park lost 55 per cent of its natural habitat mainly for pyrethrum growing (Kalpers, 2001). Forests declined by 78 per cent between 1990 and 2000, and the country is also experiencing a loss of its agro-diversity and wetland biodiversity (IISD and UNEP, 2005:5). Biodiversity loss is closely linked with the loss of ecosystem services, which in turn is linked to people’s well-being. A study by UNEP and IISD in 2005 - be it on limited data, based on the former provinces structure - found that all provinces except Kigali City were experiencing ecosystem services deterioration to some degree. The provinces with the highest level of ecosystem services stress were Kibungo, Buture, Cyangugu, Gikongoro and Gisenyi (Table 7.8, below). Table 7.8 – Threats to ecosystem service by province
Province Maintenance
of biodiversity
Food production Water supply Energy
resources
Butare X X 0 X Byumba x x 0 0 Cyangugu x x 0 x Gikongoro x x x 0 Gisenyi x x 0 x Gitarama x x 0 0 Kibungo X X X X Kibuye x x 0 0 Kigali-ngali 0 x x 0 Ruhengeri x x 0 0 Umutara 0 x x 0
Note: ‘X’ indicates an ecosystem service or well-being constituent under threat in the particular region; ‘O’ indicates that an ecosystem services or well-being constituent is not under threat; and, bold highlights those areas of immediate priority. Source: IISD and UNEP 2005:2.
7.10.2 Habitat conversion and destruction Habitat conversion. Habitat conversion from natural land to agriculture has been the major cause of loss of natural habitats in Rwanda. It is a difficult problem as there is limited amount of land but a growing demand. In low-lying areas, pressure for agricultural space has led to inappropriate marsh cultivation. In higher elevation areas, deforestation has played a key role in decreasing the ability of watersheds to catch and restore water.
Deforestation. Deforestation and conversion to agricultural land is a main problem, especially in the western parts of Rwanda, where great areas of the natural forest of Gishwati has recently been drastically reduced, adding pressure on the wildlife in the area as their habitat is reduced. Of special concern are the Ape populations in these areas and some of the globally threatened birds which can be found here. The

Report on Collection of Existing Data
148 (274)
western part of Rwanda form part of the Albertine Rift Highland Forest eco-region, which is a globally threatened system with a critical conservation status. Deforestation not only reduces biodiversity, it also adds to the risk of erosion and loss of soil fertility. In higher-elevation and mountainous areas, deforestation has played a key role in decreasing the ability of watersheds to catch and restore water, which could have serious long-term effects.
Mountains. Mountains are known as headwater catchment systems, that is, rivers originate from them. In humid areas up to 60 % and in semi-arid and arid areas up to 95 % of the fresh water in watersheds are captured by mountains (Mountains of the World, 1998). The same characteristics, which enable mountains to provide invaluable services to human and nature make them vulnerable or give rise to vulnerable characteristics. High altitudes, large amounts of rainfall and often steep slopes are the conditions which promote soil erosion. One natural measure that reduces soil erosion rates in these vulnerable areas, however, is vegetation cover, which not only dampen the impact of rainfall onto the soil but their root systems hold the soil together and in place, preventing soil erosion and land slides and reduces evaporation rates evaporation rates by providing shade to the bare earth. Mountain catchments are also important in the role they play as upstream locations. Whatever occurs upstream will have an effect downstream.
Erosion. Rwanda’s relief consists of high mountains, steep-sloped hills and depressions, which together with the climate make it susceptible to physical erosion and in some cases even landslides. Particularly fragile are the ecosystems of mountain regions in the North and in the West. The intensity of land-use in this fertile part of the country has led to all forests outside of the national parks being cleared for cultivation. Whether by wind or by water, erosion ends up by causing a reduction of soil fertility by removing the arable layer and, consequently, it contributes to the extinction of some plant formations and to the loss of the fauna’s habitat; an estimated 11 tons of soil are lost per hectare per year through erosion (Waller, 1996 cited in UNEP, 2004) and some eroded areas are no longer suitable for agriculture. Deforestation, construction, over-grazing and cultivation of steep hills all contributed to erosion. Farming without replenishing nutrients also contributes to degrading of the soils, as does ploughing of steep slopes, especially over 50 %. Ploughing is therefore not recommended on slopes steeper than 50 % and should not be done more than twice a year in other sloping areas.
Development of and unsustainable utilisation of marshes and wetlands. Land reclamation and the development of marshes and depressions cause hydrological imbalances of wet ecosystems, and this affects the fauna and flora of these ecosystems. In low-lying and wetland areas, pressure for agricultural space and inappropriate marsh cultivation has caused stream flow changes, increased water evaporation, and reduced water tables and groundwater recharge (UNEP, 2004). By 1998, about 94000 ha of the total 164947 ha of wetland surface area had been cultivated (Kanyarukiga and Ngarambe, 1998). In the Bugesera Region the Gashora marsh was drained for food emergency assistance in 2000 (FAO, 2001, cited in IISD and UNEP, 2005:15). Wetlands degradation in Rwanda is closely linked to development in urban centres countrywide. Many construction activities being carried out require inputs from wetlands such bricks and sand, a factor that has led to over exploitation of the resource. High demand for brick making coupled with sand mining due to current development construction has led to misuse of wetlands in the country.
Report on Collection of Existing Data
149 (274)
Fire. Bush fires can pose a serious threat to fauna and flora. Periodically, protected and non-protected areas are devastated by deliberate, criminal or accidental fires. The negative effects of these bush fires include: extinction of the micro fauna and micro flora; disturbance and damage to the micro-fauna and micro-flora; disturbance of the hydric regime, which may lead to the depletion of water sources; acceleration of erosion and modification of the physico-chemical composition of the soil; and, atmospheric pollution, which may aggravate the problem of climatic change through the emission of gas with greenhouse effects. Areas that are mostly affected by these fires are: the forest of Nyungwe; the Akagera National Park; and the savannas of the east; and, the valleys of Nyabarongo, Akagera and Akanyaru.
7.10.3 Pollution Pollution does not appear to be a major threat to biodiversity at the moment, as the level of industrialisation is still low. There are, however, exceptions, and wetlands especially near urban areas are being affected by poor sanitation infrastructure, industrial waste and poor waste management.
7.10.4 Over-exploitation Unsustainable harvesting. In Rwanda, overexploitation of biological resources is an important threat to biodiversity. This over-exploitation is sometimes caused by using unsuitable harvesting methods, like fishing with the wrong size nets or continued use of the soil without adding fertilizers or soil amendments. This overexploitation is usually not deliberate but a consequence of socio-economic conditions and sometimes due to poor education and environmental awareness. Short-term economic gains, if not properly regulated, can also motivate over-harvesting of specific species through commercial hunting of selected species and felling of high value timber species such as Entandophragma excelsum, Faurea saligna, Prunus africana and Polyscias fulva.
Poaching and pirating. Protected and wet areas shelter a varied fauna and flora, which are subjected to poaching and bio-pirating for domestic consumption or trade. Poaching, which for a long time has been practised for domestic purposes by the people living in the vicinity, has to day become a business extended beyond nearby communities. In the Akagera National Park this has contributed to drastic reduction of the most targeted animal species such as elephant, Royal antelope, sitatunga27, buffalo, gazelle, wild boar, porcupine and partridge The nature and extent of the problem of bio-pirating, ie, the appropriation of biological material and sometimes related indigenous knowledge, is not well known to day.
7.10.5 Climatic conditions Floods and drought. Flooding can be harmful to biodiversity as it can contribute to erosion leading to siltation of lakes destroying spawning grounds for fish reproduction, asphyxiation28 of plants, physical damage and leaching of chemicals into water systems. With climate change the weather patterns are expected to become more erratic with increased incidents of flooding and drought. Prolonged drought affects biodiversity habitats, and can lead to a drastic reduction of varieties and species. Drought combined with land degradation can contribute to
27 The sitatunga or marshbuck (Tragelaphus spekii) is a swamp-dwelling antelope found through Central Africa. 28 Killing by depriving them of oxygen

Report on Collection of Existing Data
150 (274)
desertification. The eastern part of Rwanda is would be particularly vulnerable to this.
7.10.6 Invasive species Disease causing organisms and pest. Diseases and pests can sometimes cause considerable damage to floral and faunal species and varieties, both wild and cultivate, which can have effects on whole ecosystems. For example, sporadic outbreaks of serious tree pests and diseases can lead to the complete destruction of large areas of natural and/or planted forests which, in turn, can lead to loss or reduction of vital forest ecosystem functions, and considerable economic losses. In developing countries and countries in transition, severe outbreaks are particularly serious as they may compromise national economies and threaten local economic stability and food security (FAO, 2003). Climate change will affect plant pests and diseases in the same way it affects infectious disease agents. In other words, the range of many insects will expand or change, and new combinations of pests and diseases may emerge as natural ecosystems respond to altered temperature and precipitation profiles. Any increase in the frequency or severity of extreme weather events, including droughts, heat waves, windstorms, or floods, could also disrupt the predator-prey relationships that normally keep pest populations in check. Alien and Invasive Species. Alien and Invasive Species (IAS) are one of the global key threats to biodiversity and can be very costly. It is, therefore, essential that their numbers and spread, as well as their impacts on native populations, be monitored and controlled if necessary. Alien plant species are commonly seen in Rwanda, but are generally not considered a major problem at the moment, as most of them occur in and around the cultivated areas, and some are not invasive in nature. For example, Eucalyptus is one of the dominant tree species. The situation is different in the natural areas where alien and native invasive species can affect biodiversity. For example, the liana Sericostachys scandens is reported to have become a problem in Nyungwe National Park, as a result of the reduction of herbivores29, which used to graze it. In the lake system within the Akagera Park in the east of the country the extremely invasive Water Hyacinth (Eichornia crassipes) is now present, and unless controlled in a systematic way could cause tremendous problems. It is believed that in the late 1980’s (Twongo 1996 cited in UNEP, 2004), spreading to about 3 ha per day. As a result the invasion and proliferation of water hyacinth in the Lake had led to reduced oxygen levels and, consequently, to reduced floral and faunal diversity. Exotic fish species, like the Nile Perch (Lates niloticus), which has been deliberately introduced in places, are also a threat to aquatic biodiversity as they will often out-compete indigenous species.
7.10.7 Drivers of ecological threats Population pressure and movements. Rwanda has a population density of around 343 people per km2 (Wikipedia-Rwanda). This is already putting pressure on the land, and any future population increase will result in increased demand of natural resources like land, water, energy and foodstuffs, land clearing for agriculture and grazing, house building, removal of species for traditional medical purposes, etc, ie, further modification and destruction of habitats and deforestation, which, ultimately, may lead to the extinction of some species. Large movements of people, as a result
29 An animal that feeds on plants
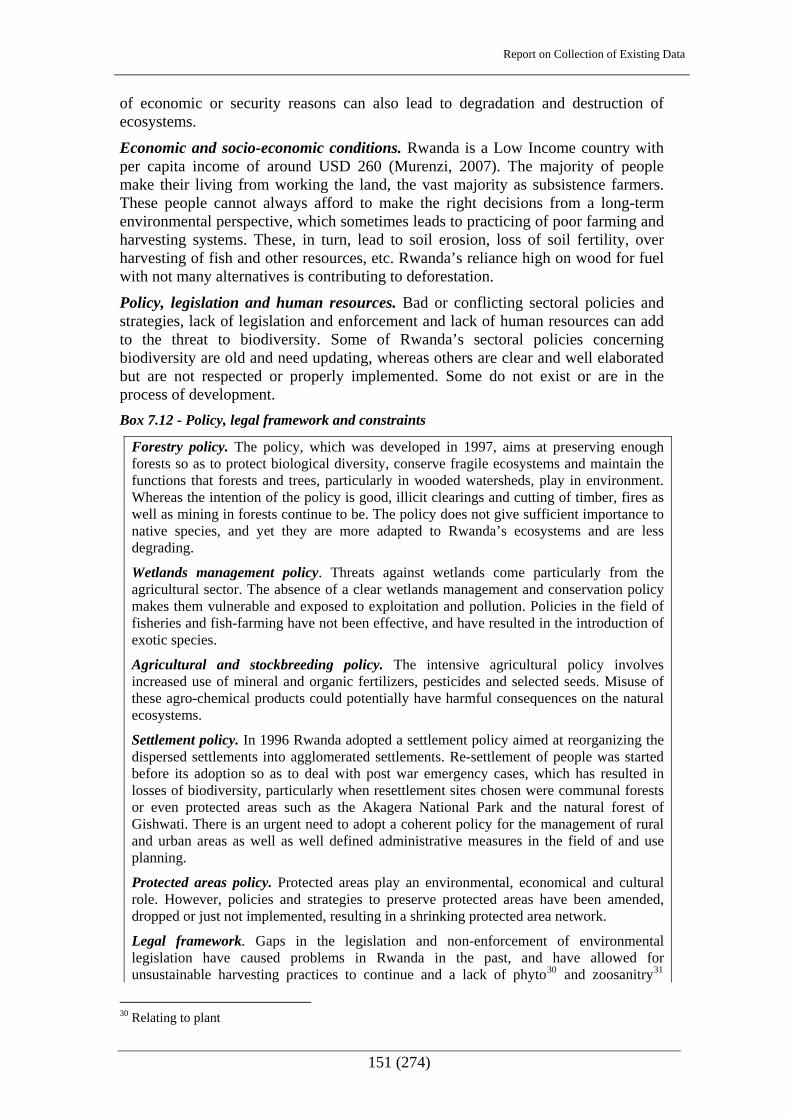
Report on Collection of Existing Data
151 (274)
of economic or security reasons can also lead to degradation and destruction of ecosystems.
Economic and socio-economic conditions. Rwanda is a Low Income country with per capita income of around USD 260 (Murenzi, 2007). The majority of people make their living from working the land, the vast majority as subsistence farmers. These people cannot always afford to make the right decisions from a long-term environmental perspective, which sometimes leads to practicing of poor farming and harvesting systems. These, in turn, lead to soil erosion, loss of soil fertility, over harvesting of fish and other resources, etc. Rwanda’s reliance high on wood for fuel with not many alternatives is contributing to deforestation.
Policy, legislation and human resources. Bad or conflicting sectoral policies and strategies, lack of legislation and enforcement and lack of human resources can add to the threat to biodiversity. Some of Rwanda’s sectoral policies concerning biodiversity are old and need updating, whereas others are clear and well elaborated but are not respected or properly implemented. Some do not exist or are in the process of development. Box 7.12 - Policy, legal framework and constraints
Forestry policy. The policy, which was developed in 1997, aims at preserving enough forests so as to protect biological diversity, conserve fragile ecosystems and maintain the functions that forests and trees, particularly in wooded watersheds, play in environment. Whereas the intention of the policy is good, illicit clearings and cutting of timber, fires as well as mining in forests continue to be. The policy does not give sufficient importance to native species, and yet they are more adapted to Rwanda’s ecosystems and are less degrading.
Wetlands management policy. Threats against wetlands come particularly from the agricultural sector. The absence of a clear wetlands management and conservation policy makes them vulnerable and exposed to exploitation and pollution. Policies in the field of fisheries and fish-farming have not been effective, and have resulted in the introduction of exotic species.
Agricultural and stockbreeding policy. The intensive agricultural policy involves increased use of mineral and organic fertilizers, pesticides and selected seeds. Misuse of these agro-chemical products could potentially have harmful consequences on the natural ecosystems.
Settlement policy. In 1996 Rwanda adopted a settlement policy aimed at reorganizing the dispersed settlements into agglomerated settlements. Re-settlement of people was started before its adoption so as to deal with post war emergency cases, which has resulted in losses of biodiversity, particularly when resettlement sites chosen were communal forests or even protected areas such as the Akagera National Park and the natural forest of Gishwati. There is an urgent need to adopt a coherent policy for the management of rural and urban areas as well as well defined administrative measures in the field of and use planning.
Protected areas policy. Protected areas play an environmental, economical and cultural role. However, policies and strategies to preserve protected areas have been amended, dropped or just not implemented, resulting in a shrinking protected area network.
Legal framework. Gaps in the legislation and non-enforcement of environmental legislation have caused problems in Rwanda in the past, and have allowed for unsustainable harvesting practices to continue and a lack of phyto30 and zoosanitry31
30 Relating to plant
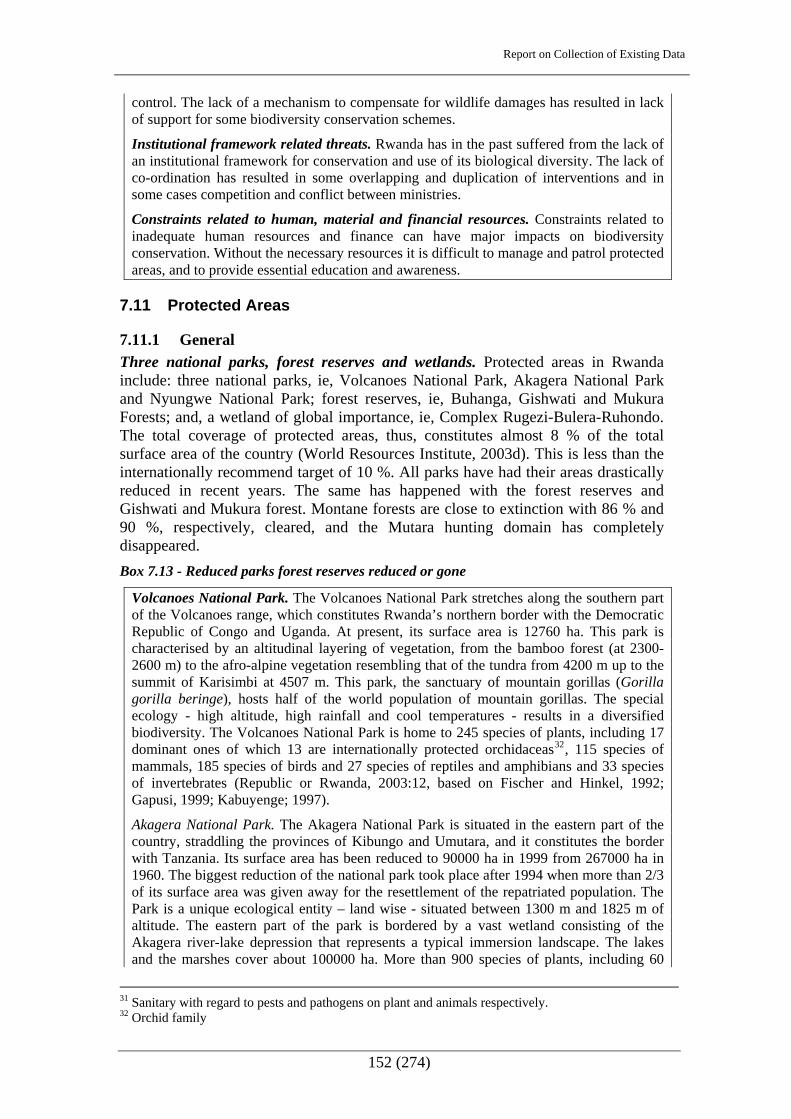
Report on Collection of Existing Data
152 (274)
control. The lack of a mechanism to compensate for wildlife damages has resulted in lack of support for some biodiversity conservation schemes.
Institutional framework related threats. Rwanda has in the past suffered from the lack of an institutional framework for conservation and use of its biological diversity. The lack of co-ordination has resulted in some overlapping and duplication of interventions and in some cases competition and conflict between ministries.
Constraints related to human, material and financial resources. Constraints related to inadequate human resources and finance can have major impacts on biodiversity conservation. Without the necessary resources it is difficult to manage and patrol protected areas, and to provide essential education and awareness.
7.11 Protected Areas
7.11.1 General Three national parks, forest reserves and wetlands. Protected areas in Rwanda include: three national parks, ie, Volcanoes National Park, Akagera National Park and Nyungwe National Park; forest reserves, ie, Buhanga, Gishwati and Mukura Forests; and, a wetland of global importance, ie, Complex Rugezi-Bulera-Ruhondo. The total coverage of protected areas, thus, constitutes almost 8 % of the total surface area of the country (World Resources Institute, 2003d). This is less than the internationally recommend target of 10 %. All parks have had their areas drastically reduced in recent years. The same has happened with the forest reserves and Gishwati and Mukura forest. Montane forests are close to extinction with 86 % and 90 %, respectively, cleared, and the Mutara hunting domain has completely disappeared. Box 7.13 - Reduced parks forest reserves reduced or gone
Volcanoes National Park. The Volcanoes National Park stretches along the southern part of the Volcanoes range, which constitutes Rwanda’s northern border with the Democratic Republic of Congo and Uganda. At present, its surface area is 12760 ha. This park is characterised by an altitudinal layering of vegetation, from the bamboo forest (at 2300-2600 m) to the afro-alpine vegetation resembling that of the tundra from 4200 m up to the summit of Karisimbi at 4507 m. This park, the sanctuary of mountain gorillas (Gorilla gorilla beringe), hosts half of the world population of mountain gorillas. The special ecology - high altitude, high rainfall and cool temperatures - results in a diversified biodiversity. The Volcanoes National Park is home to 245 species of plants, including 17 dominant ones of which 13 are internationally protected orchidaceas32, 115 species of mammals, 185 species of birds and 27 species of reptiles and amphibians and 33 species of invertebrates (Republic or Rwanda, 2003:12, based on Fischer and Hinkel, 1992; Gapusi, 1999; Kabuyenge; 1997).
Akagera National Park. The Akagera National Park is situated in the eastern part of the country, straddling the provinces of Kibungo and Umutara, and it constitutes the border with Tanzania. Its surface area has been reduced to 90000 ha in 1999 from 267000 ha in 1960. The biggest reduction of the national park took place after 1994 when more than 2/3 of its surface area was given away for the resettlement of the repatriated population. The Park is a unique ecological entity – land wise - situated between 1300 m and 1825 m of altitude. The eastern part of the park is bordered by a vast wetland consisting of the Akagera river-lake depression that represents a typical immersion landscape. The lakes and the marshes cover about 100000 ha. More than 900 species of plants, including 60
31 Sanitary with regard to pests and pathogens on plant and animals respectively. 32 Orchid family

Report on Collection of Existing Data
153 (274)
internationally protected orchids can be found in the park. The fauna constitutes the park’s major attraction. It comprises 47 species of big mammals, including elephant, African buffalo, lion and eland, more than 500 species of birds, nine species of amphibians and 23 species of reptiles (Republic or Rwanda, 2003:13).
Nyungwe National Park. Nyungwe Forest is a high-altitude, mountainous rainforest in southern Rwanda established as a forest reserve in 1933. Just recently the Nyungwe forest received National Park status, making it East Africa’s largest protected high-altitude rainforest. It is contiguous with the Kibira National Park in Burundi and combined, these two protected areas form the largest block of forest in east Africa - between 1500 and 2300 m in altitude. It stretches at an altitude ranging between 1600 and 2950 m, and shelters a complex mosaic of types of vegetation. This rich variety of flora is accompanied by an equal variety of fauna, including several species of birds and primates. A high percentage of these species are endemic and are found only in the forests surrounding Albert Rift. There are more than 1200 plant species among which are found at least 50 species of fodder and 133 species of orchids. More that 250 wood species have been identified, including ten tree species which were described for the first time in Rwanda during the 1999 survey (GoR, 2003:11, based on Ewango, 2000) With more than 275 species of birds, 24 of which are endemic to Albert Rift, the forest of Nyungwe ranks among the most important regions of the world for the conservation of birds. Thirteen types of primates have been identified, representing 1/5 of Africa’s primate species among which is the most threatened, namely the monkey with an oval face (Cercopithecus hamlyni) and the golden monkey (Cercopithecus mitiskandti). Nyungwe has also one of the remaining biggest populations of chimpanzees of the east (Pan troglodytes schweinfurtii). The Angola colobus (Colobus ngolensis) is generally found in stable groups of between 300 to 400 individuals. This is a well-known attribute of Nyungwe that is found nowhere else in the world for species of tree monkeys. The natural forest of Nyungwe is one of Rwanda’s water towers - it shelters 60 % of the country’s waters. In addition, the source of the Nile is found in this same forest. Finally, about 39 plant species are threatened with extinction, some of them are rare.
Gishwati and Mukura Forest Reserves. Gishwati and Mukura Forest are located in the western part of Rwanda. The reserves have been heavily affected by human activity for a while. Gishwati, which constituted approximately 280 km2 in the mid-1970s and has been reduced by almost 90 %. A WCS/PCNF survey in 2000 revealed that little of the original forest is remaining in Gishwati and that there are now only a few stands of trees of less than one ha in size. Mukura Forest, which comprised about 20 km2 in the late 1970s, has now been reduced to around eight km2 (Plumptre, 2001). In early 2000, WCS/PCFN organised a survey of both forests to assess the current status of the natural forest, and to determine whether it would be useful to encourage conservation efforts. Findings of the survey were bleak. The remnant forest still contains several Albertine Rift endemic birds of conservation importance, a few chimpanzees (Pan troglodytes) and golden monkeys (Cercopithecus mitis kandti). It is unlikely that these populations will be viable in the long term with such a small area of habitat. Nyungwe and the Volcans National Park are now the only sites where these species are likely to survive for any length of time.
7.11.2. Need for Buffer Areas, Corridors and Protected Areas Threat to viability of wildlife and migrations and ways to prevent decline. The increasing isolation of protected areas poses a serious threat to the long-term viability of many wildlife populations and migrations in Africa. Restricted the movement of wildlife into and out of reserves create sinks, which have effects on the gene pools. A further indirect effect of protected area isolation is restriction of the ability of many plant and animal species to relocate to new geographic areas in response to global climate changes. Recent research (Newmark, 2008) shows that ways to prevent decline in plant and animal populations include a need to: enlarge

Report on Collection of Existing Data
154 (274)
and link protected areas through the removal of fences and the rerouting of highways; protect critical wet-season dispersal zones; establish wildlife corridors among reserves; upgrade the protected area status of many reserves, such as forest reserves, game control areas and open areas to national parks or game reserves, so as to provide additional protection of species and habitats; expand inoculation programmes for live and domestic animals in the human/livestock/domestic animal matrix surrounding reserves; and, reform policies that promote agricultural expansion, human settlement, and commercial poaching in lands adjacent to reserves
Rwanda context of conflicting land uses. In the Rwandan context it will be difficult to increase the protected areas due to the high demand on land for agriculture. The Mukura and Gishwati forests could theoretically be linked with Nyungwe National Park and Volcans National Park. In practice this might not be feasible, and the two forest reserves are now so degraded that protection and creating biodiversity corridors might be meaningless. Apart from Nyungwe Forest, the National Parks currently do not have buffer areas. This makes park management and disease control more difficult, and creates human wildlife conflict situations.
7.12 Indicators Environment and ecology part of planning input. To ensure sustainable development it is important to incorporate environmental and ecological issues and trends into the development and economic planning process. Mapping of ecological features and units and subsequent monitoring of these will help in establishing environmental and ecological trends, and thus sustainability. The Convention on Biological Diversity (CBD) has identified 17 headline indicators from the seven focal areas for assessing progress towards the 2010 CBD targets at a global level (Table 7.9, below) . These indicators will help to measure the wellbeing of the environment and thus, indirectly the wellbeing of the people who live there. Some indicators are still under development. Not all of these indicators are applicable to Rwanda, but many of them are. As they are indicators of sustainable development, and will form part of CBD reporting formats, it will make sense to include the relevant features in thematic map contexts of the ntional Land Use and Development Master Plan. Many biodiversity indicators are ready for immediate use at the global scale, but others require further development and testing. Each headline indicator may be made up of a composite of indicators.
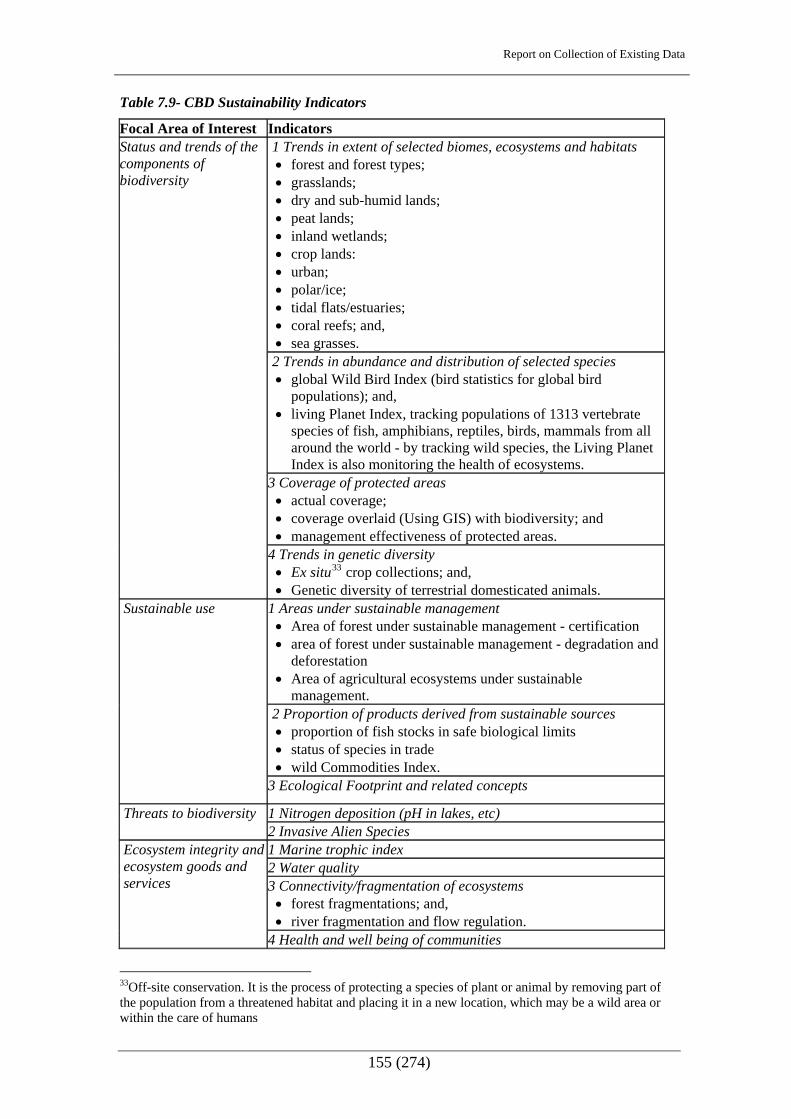
Report on Collection of Existing Data
155 (274)
Table 7.9- CBD Sustainability Indicators
Focal Area of Interest Indicators 1 Trends in extent of selected biomes, ecosystems and habitats • forest and forest types; • grasslands; • dry and sub-humid lands; • peat lands; • inland wetlands; • crop lands: • urban; • polar/ice; • tidal flats/estuaries; • coral reefs; and, • sea grasses.
2 Trends in abundance and distribution of selected species • global Wild Bird Index (bird statistics for global bird
populations); and, • living Planet Index, tracking populations of 1313 vertebrate
species of fish, amphibians, reptiles, birds, mammals from all around the world - by tracking wild species, the Living Planet Index is also monitoring the health of ecosystems.
3 Coverage of protected areas • actual coverage; • coverage overlaid (Using GIS) with biodiversity; and • management effectiveness of protected areas.
Status and trends of the components of biodiversity
4 Trends in genetic diversity • Ex situ33 crop collections; and, • Genetic diversity of terrestrial domesticated animals.
1 Areas under sustainable management • Area of forest under sustainable management - certification • area of forest under sustainable management - degradation and
deforestation • Area of agricultural ecosystems under sustainable
management. 2 Proportion of products derived from sustainable sources • proportion of fish stocks in safe biological limits • status of species in trade • wild Commodities Index.
Sustainable use
3 Ecological Footprint and related concepts
1 Nitrogen deposition (pH in lakes, etc) Threats to biodiversity 2 Invasive Alien Species 1 Marine trophic index 2 Water quality 3 Connectivity/fragmentation of ecosystems • forest fragmentations; and, • river fragmentation and flow regulation.
Ecosystem integrity and ecosystem goods and services
4 Health and well being of communities
33Off-site conservation. It is the process of protecting a species of plant or animal by removing part of the population from a threatened habitat and placing it in a new location, which may be a wild area or within the care of humans
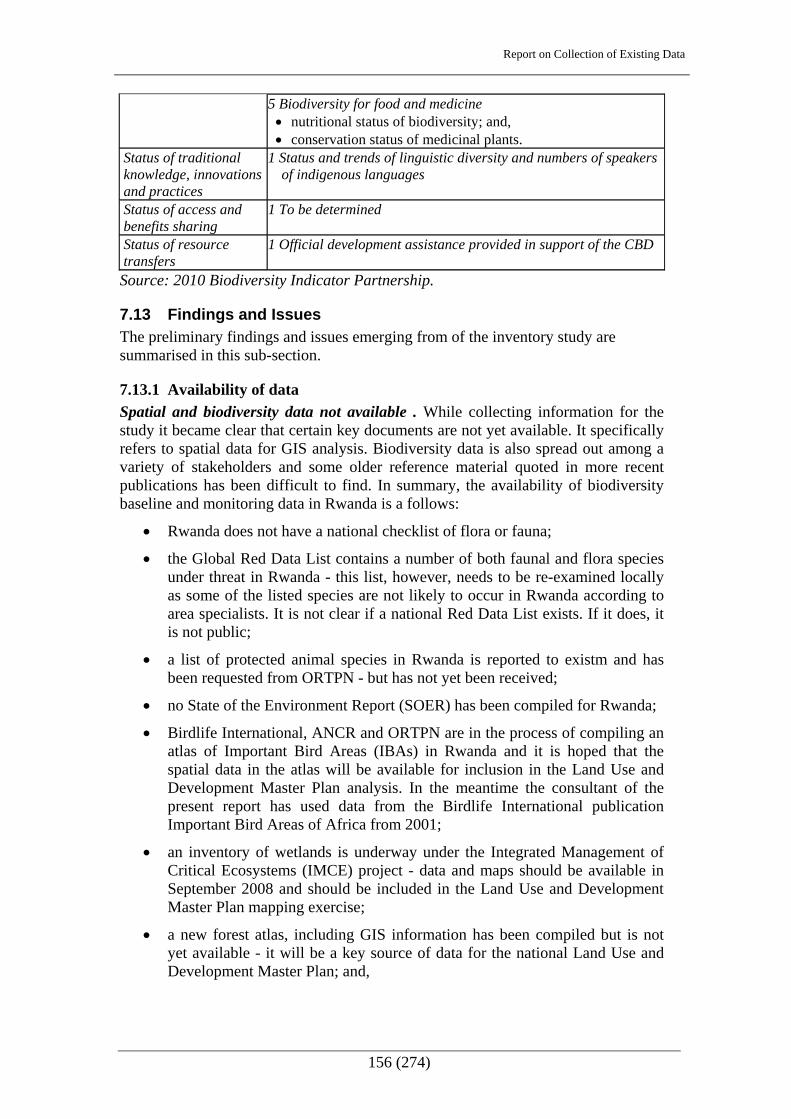
Report on Collection of Existing Data
156 (274)
5 Biodiversity for food and medicine • nutritional status of biodiversity; and, • conservation status of medicinal plants.
Status of traditional knowledge, innovations and practices
1 Status and trends of linguistic diversity and numbers of speakers of indigenous languages
Status of access and benefits sharing
1 To be determined
Status of resource transfers
1 Official development assistance provided in support of the CBD
Source: 2010 Biodiversity Indicator Partnership.
7.13 Findings and Issues The preliminary findings and issues emerging from of the inventory study are summarised in this sub-section.
7.13.1 Availability of data Spatial and biodiversity data not available . While collecting information for the study it became clear that certain key documents are not yet available. It specifically refers to spatial data for GIS analysis. Biodiversity data is also spread out among a variety of stakeholders and some older reference material quoted in more recent publications has been difficult to find. In summary, the availability of biodiversity baseline and monitoring data in Rwanda is a follows:
• Rwanda does not have a national checklist of flora or fauna;
• the Global Red Data List contains a number of both faunal and flora species under threat in Rwanda - this list, however, needs to be re-examined locally as some of the listed species are not likely to occur in Rwanda according to area specialists. It is not clear if a national Red Data List exists. If it does, it is not public;
• a list of protected animal species in Rwanda is reported to existm and has been requested from ORTPN - but has not yet been received;
• no State of the Environment Report (SOER) has been compiled for Rwanda;
• Birdlife International, ANCR and ORTPN are in the process of compiling an atlas of Important Bird Areas (IBAs) in Rwanda and it is hoped that the spatial data in the atlas will be available for inclusion in the Land Use and Development Master Plan analysis. In the meantime the consultant of the present report has used data from the Birdlife International publication Important Bird Areas of Africa from 2001;
• an inventory of wetlands is underway under the Integrated Management of Critical Ecosystems (IMCE) project - data and maps should be available in September 2008 and should be included in the Land Use and Development Master Plan mapping exercise;
• a new forest atlas, including GIS information has been compiled but is not yet available - it will be a key source of data for the national Land Use and Development Master Plan; and,
Report on Collection of Existing Data
157 (274)
7.13.2 Justification to include environmental concerns in Master Plan Environmental justice essential part in avoiding conflict. Functioning ecosystems underpin all life through provision of so called ecosystem services, ie, the benefits that people obtain from functioning ecosystems, such as food, freshwater and climate regulation. Rwanda is not only dependent on its natural resources for ecosystem services, but land, forests, waters and wildlife currently also constitute the country’s main sources of households and national income, providing the basis for farming, fishing, household energy production as well as tourism. Environmental destruction leads to scarcity and scarcity triggers conflict which can develop into violence. Thus, environmental security or justice is vital to human security and well being. Rwandan natural and ecosystem resources seriously depleted. Over the last two decades, however, these resources have been seriously depleted. Rwanda has seen a rapid conversion of its natural ecosystems to agricultural land in recent years, essentially due to population increases and hence a growing demand for food and timber. Few natural ecosystems, therefore, remain. These are mainly in the formally protected areas, Akagera National Park, Nyugwe National Park and Volcans National Park, which constitute approximately 8 % of the total area (World Resources Centre, 2003a). The three parks cover three of the world’s priority conservation eco-regions, including the rapidly disappearing biodiversity rich Albertine Rift Montane Forest. Through the CBD and other environmental conventions, Rwanda has accepted a global responsibility to help maintain its biodiversity.
Ecological deficit. Rwanda’s ecological deficit is currently at -0.19. It means that any population or consumption increases and industrial developments, which will increase CO2 emissions, are going to lead to a greater deficit. Any increase in the deficit is not sustainable in the long term, and reversing and restoring degraded ecosystems is difficult and more costly than to maintain them. Environmental destruction leads to scarcity and scarcity triggers conflict which can develop into violence. Thus, environmental security is vital to human security and well being. It is, therefore, important to ensure that development planning takes into account the need to maintain bio-capacity by maintaining protected areas, forests and wetland ecosystems. There is also a legal basis for including ecological concerns into the planning process, with support for the precautionary principle and the polluter pays principle.

Report on Collection of Existing Data
158 (274)
7.13.3 Areas of special ecological importance Several areas of special ecological importance exist in Rwanda (Table 7.10, below). Table 7.10 -Areas of special ecological importance
Area Justification Akagera, Volcan and Nyungwe National Parks
These are the only three areas which can be said to still contain natural ecosystems. They each represent a globally important eco-region, and are hosts to a number of species of conservation concern.
Wetlands Many of the wetlands correspond with the internationally Important Bird Areas. One wetland area has recently been designated as a Ramsar site (Rugezi-Bulera-Ruhondo – Ramsar site no 1589). The legal status of this area is not yet clear. Wetlands are also important from a hydrological point of view. There is currently a project mapping and classifying the wetlands (IMCE). Its findings will be important to include in the Land Use and Development Master Plan.
Forests These constitute habitats for man plant and animal species and are important as carbon sinks, for erosion control and for watershed management in general. They are also the main source of energy as there are few alternative energy resources in Rwanda. Most of Rwanda’s forest has been drastically reduced in recent years, with loss of biodiversity, erosion, etc, as a result.
The forthcoming Forest Atlas should provide detailed mapping of remaining forests, and the data should be incorporated in the National Land Use and Development Plan.
Habitats for globally threatened species, ie, IBAs and, RDL species
Many of these correspond with the national parks, forest reserves and wetland areas. Of these, only the national parks are formally protected today.
Rwanda has a global responsibility to help conserve these rare birds, animals and plant species.
Steep Slopes Due to the high competition for land, agriculture is currently practised on steep slopes that lead to erosion problems.
Watersheds/Water towers
The loss of forest cover and conversion to other land uses can adversely affect freshwater supplies and compound human disasters resulting from hydro-meteorological extremes. Trees - forest cover- play an important role in water discharge, and in regulating streams and rivers, especially in mountain areas. Appropriate management of forests around watersheds, therefore, is essential for water quality.
Buffer zones and wildlife corridors
If protected areas are too small, this could potentially be fatal for many species due to genetic erosion and limited opportunities to migrate when climatic conditions change. It is, therefore, important to make sure the protected areas are big enough and to link areas through corridors.
Buffer zones around protected areas are essential to reduce human and wildlife conflict.
Source: Author.
7.13.4 Threats to biodiversity Need for check on continued reduction of natural habitat conversion. Habitat conversion is the most important threat to biodiversity in Rwanda at present. Only a small area of natural habitats remains. It is, thus, of key importance not to reduce these habitats any further. This means making sure the boundaries of the national parks are respected. In addition, it is expected that the on-going forest and wetland inventories will identify additional areas - most probably coinciding with the

Report on Collection of Existing Data
159 (274)
currently unprotected IBAs - which should not be designated for development, but should instead be protected. All districts are affected by deterioration of biodiversity and ecosystem services, but the two main problem areas are the former provinces of Butare and Kbiungu.
Alien and invasive species. Alien and invasive species (AIS) are a threat to natural biodiversity, and efforts should be made to limit their distribution. Some alien, exotic, species such as the tree species Eucalyptus has a role to play in Rwanda where there is a high need for fuel wood - few tree species can compete with the Eucalyptus in this respect. There are ecological problems, however, related to the cultivation of Eucalyptus and AIS. In the long-term, it would be advantageous to restrict exotic trees to plantations, and to allocate resources as soon as possible to combat potentially expensive invasive species such as some of the aquatic weeds like the Water Hyacinth (Eichornia crassipes), which is now present within the Akagera lake system. Promotion of indigenous agro-forestry species and agro-forestry in general is recommended. Alien and Invasive Species are not yet a major problem in the country, although the Akagera lakes are potentially at risk from the Water Hyacinth and exotic fish species. Eucalyptus species and other exotic trees are widespread. Whereas they may not be the best trees from a water and soil conservation perspective, they are not invasive and as such not really a threat to biodiversity. It would be preferable, however, if exotic species were to be kept in forest plantations and indigenous trees were to be used wherever possible.
Steep slopes cultivation with erosion. Unsuitable farming methods, such as cultivation of steep slopes, needs to be discouraged as they lead to erosion and soil deterioration. Healthy soils and vegetation in the watershed are also essential to proper watershed functioning
Community involvement. Involvement of communities in the conservation effort is essential. This is especially important in protected area buffer areas. Issues to consider in the Rwandan context include ‘Access and Benefit Sharing’ and compensation for loss due to wildlife conflict. This is specifically a problem areas bordering national parks where wildlife sometimes stray outside of the park boundaries and destroy crops.
Economic diversification. The limited amount of suitable land for agriculture, coupled with a growing population, means that subsistence farming is not a major viable long-term livelihood option for Rwanda. It is, therefore, essential to create alternative livelihoods options, which are not directly based on access to land. This is again most pressing in the areas bordering the National Parks. This is in line with the objectives of Vision 2020 (Republic or Rwanda, 2000).
Protection of forests and wetlands. Based on the results of the new inventories of forests and wetlands, it is recommended to work toward giving formal protected status to the most important forest and wetland areas.
Survey and monitoring. The national Land Use and Development Master Plan and associated geo-database should to be linked to an environmental monitoring system, such as ‘State of the Environment Reporting’, which is yet to be developed in Rwanda. This type of reporting is becoming part of the commitments under various international conventions. In doing this environmental trends and sustainability can be easily and consistently monitored. The results may profitably be used to guide future planning efforts.

Report on Collection of Existing Data
160 (274)
Watershed. Water is a critical issue in Rwanda. The present supply, although within the internal renewable rate, will not be sufficient to meet the demands of intensified agriculture and meet the individual human demand for water as stipulated as basic needs by the United Nations. More focus on watershed management will need to be put in place. This includes conservation and management of wetlands and forests.
Energy supply. The current reliance on fuel-wood for energy - and the way fuel-wood is produced - is not sustainable, given the amount of land available for growing trees and the demand for fuel-wood. Land needs to be set aside for efficient plantations, while alternative energy sources are sourced as well (see also Section 5 on Forestry and Section 9 on Physical Infrastructure regarding energy).
7.14. Recommendations for Present Project Geo-data base. There are from an ecological sustainability viewpoint important features that should be included in a Project geo-data base for future trend analysis and mapping (Table 7.11, below).
Table 7.11 - Features for the National Land Use and Development Master Plan
Feature Data Classes Attributes National Park forest reserves according to GIS and
Remote Sensing Centre (NUR-GIS) and MINIRENA
important bird areas according to forthcoming ACNR/REMA report
important wetland areas according to forthcoming IMCE data (REMA)
areas of special biodiversity importance
Endemic bird areas from Birdlife International
Victoria Basin Forest Savannah mosaic (AT0721) Albertine Rift Montane Forests (AT0101)
eco regions
Ruwenzori Rift Montane Forests (AT1013)
Data from WWF/ UNEP-GRID Geneva
agro-ecological zones (39)
according to GIS mapping done for the Schema d’Amenagement des marais, de protection des Bassins Versants et de la Conservation des Sols (GoR 2002)
agroclimatic zones (10)
according to GIS mapping done for the Schema d’Amenagement des marais, de protection des Bassins Versants et de la Conservation des Sols, (GoR 2002)
wetlands according to IMCE-REMA inventory
forests – divided into natural forest and plantations
according to Forestry Atlas
grasslands croplands grazing land Urban
indicator ecosystems
lakes and rivers topography - 0-20 %

Report on Collection of Existing Data
161 (274)
Feature Data Classes Attributes 20-50% slope >50 % National Parks protected areas Forest Reserves Ramsar sites Man and Biosphere Reserves
designated sites of international biodiversity importance
World Heritage Sites
hydrological data
underground water
Regions administrative boundaries Districts settlements according to national statistics classification tourism establishments
Lodges
active other geographical features
Volcanoes extinct
fishing grounds
MINAGRI data
Red Data Listed species distribution
flora fauna
data not yet available
Source: Author.
Further GIS data. The following data needs to be included in the Master Plan GIS database:
• Forest Atlas database and shape files (with NUR-GIS) from MINIRENA;
• land suitability mapping, agro-climatic and agro-ecological zone mapping, and soil mapping database and shape files (ie, interactive land use map and all available GIS mapping done for the Schema d’Amenagement des marais, de protection des Bassins Versants et de la Conservation des Sols: Rapport global definitive phase 1, GOR, 2002);
• Wetlands and critical ecosystems database and shape files from the from the Integrated Management of Critical Ecosystems Project at REMA - to be followed up with REMA;
• shape files for official boundaries for National Parks - to be followed up with ORTPN); and,
• Important Bird Areas in Rwanda – any shape files available – to be followed up with ANCR and REMA.
Land use and development planning to reconcile conflicting demands. Whereas it is fundamental to include ecological considerations into the land use planning process, given the competition for land in Rwanda there will need to be compromises with other demands. In this context, it is important to recognise that ecosystem degradation can rarely be reversed without actions that address one or more of the following indirect drivers of change: population change - including

Report on Collection of Existing Data
162 (274)
growth and migration; change in economic activity - including economic growth, disparities in wealth and trade patterns; socio-political factors - including factors ranging from the presence of conflict to public participation in decision-making; cultural factors; and, technological change. Habitat restoration is difficult and can be very costly. The cost of erosion and watershed deterioration is even greater. Extinct species are gone forever. The ‘Precautionary Principle’ should, therefore, guide the land use planning process. Address needed in Plan preparation. Ideally the national Land Use and Development Master Plan preparation should include address to what is discussed in paragraphs Box 7.14, below. Box 7.14 - Ecologically important areas
Ecologically important areas. Areas of ecological key importance such as the National Parks, the Important Bird Areas and the important wetland and forest areas need to be clearly marked on the development planning map and not designated for development.
Buffer zones. It is recommended that all National Parks and other protected areas, such as forest reserves, have a buffer zone and if possible a transition zone, as recommended by the UNESCO Biosphere concept (Figure 7.5, below).
Wildlife corridors. Akagera, Nyngwe and Vulcano National Parks are all located along the Rwandan borders. All three parks are linked to various types of conservation areas across the border. Nyungwe National Park forms the largest block of forest in east Africa together with Kibira National Park in Burundi, Volcanoes National Park linking with Virunga National Park in the Democratic Republic of Congo, Mgahinga Gorilla National Park in Uganda, and Akagera linking to game reserves in Tanzania. The three parks represent very different ecosystems and as they are located at different corners of the country there is no justification to create wildlife corridors to link them. Wildlife corridors could theoretically be established to link Gishwati and Mukura forest reserves with Nyungwe and Volcanos National Park, but in practice this is probably not feasible. The delineation of these will require specialist input.
Land Suitability. Land suitability data from Ministry of Agriculture should guide the land use and development planning process. Steep hills and other erosion prone areas should be prevented from ploughing, and should if possible be kept under constant vegetation cover.Important wetland areas should also be demarcated for non-development as the present supply of water will not be sufficient to meet the demands of intensified agriculture and individual water demands in the future.
Forest plantations. Areas should be designated for forest plantations, with new and renewable energy sources should be promoted together with appropriate technologies aimed at reducing the use of fire-wood.
Reforestation. Rehabilitatation and restoration of degraded forest areas, eg, Umutara, Nyungw, Gishwati, and Mukura Forests, would be advantageous, but may not be realistic on a larger scale.
Urban master plans to include sanitation and waste infrastructure. Urban plans, which include planning for industrial use and infrastructure for sanitation and waste management, are essential for the Land Use and Development Master Plan.
Environmental indicators. The inclusion of environmental indicators in the Land Use and Development Master Plan GIS data base, will facilitate monitoring and establishment of trends as well as facilitate reporting on these issues as part of national and international ‘State of the Environment Reporting’ requirements or Environmental Outlook reporting (UNEP – State of the Environment Reporting).

Report on Collection of Existing Data
163 (274)
Figure 7.5 – Conservation zoning
Source: Unesco.
Legal framework. The relevant legal instruments with regards to biodiversity have been reviewed during this consultancy. However, it is not an in depth review and there is a need for a legally trained person to review Rwanda’s legal framework to ensure that planning decisions and recommendations comply with the legal provisions.
Need for extensive consultation. To adequately incorporate ecological concerns into the national Land Use and Development Master Plan will not be easy as many of the ecological planning requirements may appear to clash with people’s perceptions of short to medium term necessities for their livelihoods. To not address the ecological concerns, however, will be costly for future generations. To get ‘buy-in’ for the plan will require extensive consultation with all stakeholders. A list of environmental stakeholders is found in Annex Appendix 3 to the Project report o data collection on ecology.
Next steps for the Project. It is essential that the project obtains the outstanding GIS data, listed above, and that this data is included in the Geo database. Ecological sensitive areas can then start to be included in the mapping and planning process. At a minimum the boundaries of the protected areas should not be reduced. If possible, buffer zone should ideally be established around the protected areas. This will, however, need to be done in a socially acceptable manner, and will require extensive consultation. IBA (the unprotected sites) development and agriculture should be limited Protection of water towers and forests is crucial for long-term water security. To establish the appropriate boundaries of the important watershed forests will require further study and involvement of hydrological expertise. Important forest areas and mountain areas should thus be protected from development, as should the key wetlands. Ideally lakes, rivers and wetlands should also be surrounded by a buffer zone. Measures to limit soil erosion are essential and it is therefore important
Report on Collection of Existing Data
164 (274)
to maintain permanent vegetation cover on steep hills and slopes. It will be important to ensure, also in the context of ecology, that the Land Use and Development Master Plan complies with all laws and regulations, and it, therefore, recommended that the legal framework review takes cognisance of ecological aspects. Deforestation. Deforestation and conversion to agricultural land is a main problem, especially in the western parts of Rwanda, where great areas of natural forest (Gishwati) has recently been drastically reduced, adding pressure on the wildlife in the area as their habitat is reduced. Of special concern are the Ape populations in these areas and some of the globally threatened birds which can be found here. The western part of Rwanda form part of the Albertine Rift Highland Forest eco-region, which is a globally threatened system with a critical conservation status. Deforestation not only reduces biodiversity, it also adds to the risk of erosion and loss of soil fertility. In higher-elevation and mountainous areas, deforestation has played a key role in decreasing the ability of watersheds to catch and restore water, which could have serious long-term effects. Mountains are known as headwater catchment systems, that is, rivers originate from them. In humid areas up to 60% while in semi-arid and arid areas up to 95 % of the fresh water in watersheds are captured by mountains (Mountains of the World, 1998). The same characteristics which enable mountains to provide invaluable services to human and nature make them vulnerable or give rise to vulnerable characteristics. High altitudes, large amounts of rainfall and often steep slopes are the conditions which promote soil erosion. One natural measure that reduces soil erosion rates in these vulnerable areas, however, is vegetation cover, which not only dampen the impact of rainfall onto the soil but their root systems hold the soil together and in place, preventing soil erosion and land slides and reduces evaporation rates evaporation rates by providing shade to the bare earth. Mountain catchments are also important in the role they play as upstream locations. Whatever occurs upstream will have an effect downstream. Erosion. Rwanda’s relief consists of high mountains, steep-sloped hills and depressions, which together with the climate make it susceptible to physical erosion and in some cases even landslides. Particularly fragile are the ecosystems of mountain regions in the North and in the West. The intensity of land-use in this fertile part of the country has led to all forests outside of the national parks being cleared for cultivation. Whether by wind or by water, erosion ends up by causing a reduction of soil fertility by removing the arable layer and, consequently, it contributes to the extinction of some plant formations and to the loss of the fauna’s habitat; an estimated 11 tons of soil are lost per hectare per year through erosion (Waller, 1996 cited in UNEP, 2004) and some eroded areas are no longer suitable for agriculture. Deforestation, construction, over-grazing and cultivation of steep hills all contributed to erosion. Farming without replenishing nutrients also contributes to degrading of the soils, as does ploughing of steep slopes, especially over 50 %. Ploughing is therefore not recommended on slopes steeper than 50 % and should not be done more than twice a year in other sloping areas. The map in Figure 7.1 has been adapted from the MINAGRI agro-ecological mapping project, and shows risk of erosion by agro-ecological zone.

Report on Collection of Existing Data
165 (274)
8 Social Infrastructure 8.1 Summary Background. This section is based on a report which is the result of the year one input into the Rwanda Land Use and Development Master Plan project by the present Project Socio-Economist.
Core nature of socio-economic considerations in the land use planning process. The land use and development master plan process is about promoting Rwanda’s development and this must be first and foremost about development for Rwanda’s people. Therefore, while there are many important sectoral aspects to be considered, the issue of socio-economic well-being is critical to the whole process.
Socio-economic aspects. Socio-economic aspects for consideration in the land use and development master plan process include access to: roads; health and education facilities; water and sanitation; housing – eg, types, quality and in which settlement patterns; and livelihoods.
Structure of this section. This section introduces and contextualises the work carried out under the Socio-Economist input during year one of the project. It provides a summary of the methodology for the two main elements of the input, familiarisation of existing data and fieldwork. Brief comments and recommendations are made about the existing data from a socio-economic methodological view point. Key findings from the fieldwork, implications for National Parks, and recommendations for further studies are then set out. The initial introduction section is the longest, as it focuses on the emerging issues which provide the context and background to the entire inventory work.
8.2 Introduction Review of existing socio-economic data as basis of Socio-Economist project input. In an attempt to provide an inventory of the existing situation in Rwanda regarding socio-economic data, as part of ‘Task 1’ in the Project Technical Proposal, a familiarisation of available data on the existing status of socio-economic aspects in Rwanda has been carried out through review of existing data sources from a wide range of Ministries and Government institutions and through additional fieldwork. This is intended to contribute to an overview of the socio-economic situation in the country, and also to the overall inventory data collection work of the Project in terms of crosscutting socio-economic aspects in other sectors.
Four different elements of input. The Socio-Economist input included establishing the overall socio-economic background and setting for the inventory, focusing on emerging issues from prior work in the Rwandan land sector. A substantive part of the work was the familiarisation and review of existing data. Purpose-designed field visits in the country provided complimentary information and illustrates a set of explicit or implicit socio-economic phenomena. Finally, a major conference organised by the Rwandan Office of Tourism and National Parks (ORTPN) was attended to help in highlighting what may be implications for the National Parks. The latter two elements raised issues for ensuing in-depth

Report on Collection of Existing Data
166 (274)
Project studies and analyses before, or in parallel with, work on the proposing of alternative land use and development plan scenarios.
Context of the socio-economic input. The Ministry of Natural Resources (MINIRENA) is already well informed about a number of socio-economic issues of relevance to land use and management in Rwanda, following the local authority and public field consultations carried out in 2006 under the auspices of the National Land Tenure Reform Programme, (NLTRP). These emerging land use issues set the background to the socio-economic inventory work, guided the socio-economic fieldwork done by the present Project for the inventory report, and in some cases require further investigation and analyses through more in-depth socio-economic and other studies and/or possible issues-based pilot work.
Emerging contextual issues. These emerging issues are: Export crops and change of use restrictions; Rental land use conditions; Land market and land use strategising; Livestock issues; Lakeshore issues and fisheries; Marshlands and small scale clay extraction; Soil erosion; Small scale mineral extraction; Landholding patterns, including fragmentation and consolidation; Land sharing; Informal settlement upgrading; Expropriation and change of use; and Imidugudu and participatory planning. The following sub-sections provide more detail on these issues by way of context and background to ‘Task 1’.
8.2.1 Prior consultations on emerging issues Consultations on emerging issues. The National Land Tenure Reform Programme (NLTRP) carried out extensive field consultations with local authorities and the public during 2006 (see Box 8.1 below). The findings of these field consultations (Results of Preparatory Field Consultations in Four Trial Districts; March – October 2006: MINITERE et al. 2007), which were led by the present Project Socio-Economist, have been drawn on to inform the discussion of emerging land use issues here. Box 8.1 – National Land Tenure Reform Programme 2006 field consultations
As part of the NLTRP, consultations were carried out in 2006 with more than 2500 people in four districts with differing land use characteristics – Gasabo (Kigali City), Musanze (Northern Province), Kirehe (Eastern Province), and Karongi (Western Province). Comprehensive interviews were carried out with all sector Agronomes in these districts, to gather information on local land use patterns and livelihoods, and 229 focus group discussions were carried out with a wide range of land user and sociological groups.
The NLTRP field consultations focused primarily on issues relating to land tenure and the introduction a new land administration and registration system, but data was also generated on the land-related problems and concerns of different groups of people. They included: tea, coffee, pyrethrum and commercial food farmers, livestock farmers, lakeshore and marshland farmers; large landowners; people renting farm land; urban landowners; tenants in residential and commercial properties in formal and informal settlements; refugees (new case and old case); and, people living in planned imidugudu (villages).
8.2.2 Export crops and change of use restrictions Tea, coffee and pyrethrum. Tea, coffee and pyrethrum are the most important Rwandan export crops. Tea farms and factories are found in the Southern, Western and Northern Provinces of Rwanda, for example around Nyungwe

Report on Collection of Existing Data
167 (274)
National Park, on high altitude land in Karongi District and in high altitude valleys along the road from Ruhengeri to Gisenyi. The main land use issue facing Rwanda’s smallholder tea, coffee and pyrethrum farmers concerns change of use restrictions (see Box 8.2, Box 8.3 and Box 8.4, below). Box 8.2 –Tea and change of use
Tea. Some of the smallholder farmers growing thé villageois were given land by the state in the 1970s on paysannat contracts and their rights to the land depend on a certain proportion being kept under tea. In some areas soil conditions have since changed, but the farmers are constrained to plant more suitable (and more profitable) crops (MINITERE et al. 2007, pp.95-96).
Box 8.3 – C offee and change of use
Rwanda’s fastest-growing export crop is coffee and there are a large and increasing number of both smallholder and large scale farmers growing coffee in Rwanda (Perry 2007). Many grow coffee on their own land but some rent-in land, or, less commonly, coffee bushes. Change of use restrictions are an issue for these farmers, as removing their coffee bushes requires official permission from local authorities.
Box 8.4 Pyrethrum and change of use
SOPYRWA farmers. Rwanda’s smallholder pyrethrum farmers are all based on a wide belt of land around the Volcanoes National Park in Musanze District. The majority of these farmers are using land that was given to them by the state in the 1960s on paysannat contracts. 1.8 ha was given to each family on the condition that 40% (72 acres) would be used for growing pyrethrum to supply the then state-owned processing factory. The factory was privatised in 2000, to a company called SOPYRWA, and the tenure status of the farmers using the land has yet to be clarified; the total area affected is 12000 ha, spread among some 16000 families (following subdivision on inheritance, in breach of the paysannat contracts) (MINITERE et al. 2007, p.97).
Planting decisions. The pyrethrum farmers do not have the right to choose which part of their land to plant with pyrethrum each year, as this is determined by factory Agronomes on a yearly basis according to soil suitability; this clearly makes investments in biennial and perennial crops on any of the land very difficult (Ibid).
8.2.3 Rental land use conditions Official restrictions on marshlands and tree plantations. Especially around Kigali, but also in other areas of the country, there are large numbers of farmers growing food crops for local markets. Many rent-in land, including in the marshlands/wetlands, and the rental agreements often stipulate what crops will be grown (see Box 8.5, below). However, commercial farmers, in particular, appear to dislike official instructions/advice on what crops to grow in rented marshlands and restrictions on harvesting from tree plantations.

Report on Collection of Existing Data
168 (274)
Land use conditions attached. In general, within the private land market, land use conditions are frequently attached to rental agreements. Box 8.5 – Renting-in land
Renting-in land is an important element of many farmers’ livelihood strategies in Rwanda – it enables them to gain access to more fertile land, or to land which is suitable for specific crops, or simply to access land for farming when they own none of their own. Some groups of people, such as widows and vulnerable women (those who are not legally married), are particularly reliant on renting-in for access to land. From the other side, those who lack the resources to farm all the land they own, or who live far away, gain income from renting it out and provide a supply of land to those who need and want it – this includes genocide survivors who inherited large holdings that they are physically unable to farm (whether through poverty, ill-health or fear). Churches also commonly rent-out land in Rwanda; in many cases this benefits poorer Church members who are able to rent land at below-market rates, but the Churches too now appear to be moving towards formal rental agreements with specific conditions about what crops will be grown, etc.
Seasonal crops only. In most cases, agricultural tenants are only allowed to plant seasonal crops which will be harvested within the period of the rental agreement, and in some cases landlords specify that maize and beans must be grown to provide stubble for later use by the landlord (as fodder for their livestock). People who rent-in grazing land are often told to erect fences. Some landlords include stipulations about land use in rental agreements in order to prevent mismanagement of their land. For example, the NLTRP found in Karongi District that leases often included requirements to build terraces or plant reeds and grasses to prevent soil erosion (MINITERE et al. 2007, pp.44-45) – this is in line with the Organic Land Law, whose Articles 39 to 53 concern the rental of agricultural land, and these kind of land use conditions to protect against soil erosion appeared to be relatively acceptable to the public.
8.2.4 Land market and land use strategising Opportunities in a thriving land market. There is a thriving land market in Rwanda and in part it may be driven by the desire of purchasers to diversify landholdings and gain access to different types of land, for example to invest in livestock-keeping or acquire more fertile land or land in a different part of the country. Similarly, not all sales are ‘distress sales’ and some people sell land to buy land of a different type or quality. In this way, the land market can be seen as enabling people to undertake their own land use strategising.
Strategic purchases. In Musanze District, the NLTRP heard reports of people buying land to plant trees, which could then be used as collateral for bank loans to develop off-farm livelihood activities.
Sales and building standards. Around Kigali, some people also sell land in urban areas and move to more rural areas because they are unable to develop their land in accordance with Kigali City building standards.
8.2.5 Livestock issues Zero-grazing. The issues that emerged from the NLTRP’s consultations with livestock farmers were almost exclusively related to land use, and especially to the recent introduction of a zero-grazing policy. Livestock-farming has an
Report on Collection of Existing Data
169 (274)
important cultural significance in Rwanda, and livestock are valuable sources of manure, as well as meat and milk.
8.2.6 Lakeshore issues and fisheries 50 m protected zone. Government policy currently restricts farming on land within 50 m of Rwanda’s lakes and 10 m from rivers (Article 86 in Organic Law N° 04/2005 of 08/04/2005 determining the modalities of protection, conservation and promotion of environment in Rwanda: GOR 2005b). The land still belongs to the original landowners and they are being encouraged to plant trees which can be harvested in due course. However, the limited number of lakeshore farmers who were consulted by the NLTRP did not fully understand the policy and felt as though they had lost their land because they are no longer allowed to farm it as before. There also appeared to have been an impact on land prices from the policy change; the land having previously been in great demand because of its fertility (MINITERE et al. 2007, pp.101-102). These issues were taken up under the present Project’s fieldwork but it would appear that further investigation is still required on appropriate participatory and sustainable strategies to manage the land adjoining Rwanda’s lakes and waterways, which will enable environmental protection with minimal negative impact on the livelihoods of affected landowners and land users.
Public rights access water. A further issue of relevance to those with land bordering Rwanda’s lakes, rivers and streams, is the widely respected tradition of public rights of way to enable people and animals to access water. However, this causes some problems in conditions of land scarcity if animals trample on people’s crops or otherwise encroach off footpaths and trespass onto land.
8.2.7 Marshlands and small scale clay extraction Food supply insurance. Marshlands are found throughout Rwanda, although the largest areas are probably to be found in the Eastern Province - with the large numbers of lakes and rivers there - where they have provided a form of food supply insurance in an otherwise relatively more arid region of the country. Throughout the country, valley-bottoms and marshlands contain much of Rwanda’s most fertile land.
Inconsistent protection. Marshlands are classified as private state land in Rwanda, and any use of them for agriculture is meant to be sanctioned and administered by Government. This appears not yet done systematically. Whereas some sectors and districts were found by the NLTRP to be renting-out marshlands themselves, mostly to farming associations, in other places people are continuing to farm small marshland plots themselves as they have long done (MINITERE et al. 2007, pp.100-101).
Ecology and biodiversity vs intensive agriculture for food security and exports. Consideration is needed of how vulnerable groups such as widows and genocide survivors could be given priority access to marshlands. However, the main challenge is to design a sustainable land use management strategy that balances the need to protect valuable wetland resources and biodiversity with the desire to utilise the marshlands for intensive agriculture to improve food security and develop exports. In some cases where marshlands have been closed to farming on environmental grounds – and this has been enforced – such as in the Akagera Marsh in Kirehe District, farmers’ livelihoods have been adversely affected, with

Report on Collection of Existing Data
170 (274)
no alternatives yet put in place to compensate (MINITERE et al. 2007, pp.100-101).
Impact on the livelihoods of the existing land-users. In the case of both marshlands and livestock farmers, there may be ways to intensively, yet sustainably, manage resources of marshlands and grazing lands that enable small scale land users to continue their use, without necessarily tilting policy in favour of large-scale investors – the impact on the livelihoods of the existing land-users needs to considered, at least in the short to medium term until other livelihood options have been developed in accordance with the Vision 2020 strategy.
Vulnerable groups. A vulnerable group to have been more critically affected by land use conditions arising from recent environmental policies relating to the marshlands are the Abasigajwe Inyuma n’Amateka or Abatwa. This group has long suffered historical vulnerability and marginalisation in Rwanda, although this is now recognised and efforts being made to counter it. Among this group is a high incidence of landlessness. 90% of Abatwa are completely landless, and many of those with land have very small plots, barely big enough to support a basic tiny shelter for a family to sleep in (MINITERE et al. 2007, pp.115-116). Restrictions on access to the clay in river valley bottoms and marshlands have had a particularly severe impact on Abatwa communities, who have traditionally depended on pottery production for their livelihoods. This may suggest a need for the rapid development of sustainable land management strategies involving these communities, and further investigation of issues such as the impact on livelihoods of existing environmental policies through further in-depth socio-economic studies under the present Project.
8.2.8 Soil erosion Environmental problem with land dispute consequences. Government is very concerned to limit the damage caused to Rwanda’s land by soil erosion - evidence of this damage is visible in all Rwanda’s rivers and lakes every time it rains. Soil erosion is a major problem in upland farming areas on steep terrain, and gives rise to land disputes between those landowners and farmers who mismanage their land and those down-hill from them who suffer the consequences – e.g. in the marshlands, as just noted in the preceding text. Further socio-economic studies offer scope for investigation of these issues and appropriate management strategies here.
8.2.9 Small scale mineral extraction Impact on livelihoods. Management strategies relating to small-scale mineral extraction may also require further study. An example of such study is the impact on local livelihoods of the closure small-scale gold mining sites around the southern end of Nyungwe Forest, very close the National Park boundary.
8.2.10 Landholding patterns, including fragmentation and consolidation Average parcel small. The land registration trials run by the NLTRP should have provided data on parcel sizes and landholding patterns, albeit in very small areas of the country so far. The NLTRP’s report of the 2006 field consultations contains some indications of average landholdings in Musanze, Karongi, Kirehe and Gasabo districts, and of average numbers of parcels held by households in

Report on Collection of Existing Data
171 (274)
Karongi District. The extract from that report in Box 8.6, below, presents the picture in general terms. Box 8.6 – Average size landholdings
“The most authoritative estimate of current average landholdings for Rwanda as a whole is 0.76 ha (MINAGRI 2004). However, a more differentiated view of land distribution in Rwanda using EICV1 data splits the total population of the country into an urban group and three rural groups. Rural Group 1 comprises 36.5% of all households in the country, all of whom have landholdings of less than 0.3 ha. Their average landholding per household is 0.11 ha, equivalent to 0.02 ha per person, and they cumulatively hold just 5.9 % of all agricultural land in Rwanda. This group includes the 11.5 % of all households who own no land of their own at all – the landless. Rural Group 2 comprises 29.5 % of all households in the country and all households in this group have landholdings of between 0.3 ha and 1 ha. Cumulatively they hold 25.2 % of all agricultural land in Rwanda. Their average landholding per household is 0.58 ha, equivalent to 0.12 ha per person. Rural Group 3 comprises the 24.1 % of all households in the country who all have more than 1 ha of land. Their average landholding per household is 1.94 ha, equivalent to 0.35 ha per person, and between them they hold 68.9% of all agricultural land in Rwanda (Diao and Yu 2006).” (MINITERE et al. 2007, p.30).
Scattered multiple parcels. Multiple parcels are the norm throughout Rwanda, albeit that average parcel sizes vary according to the population density. Parcels are generally bigger in Eastern Province than the north-west, for example. Throughout the country, land parcels are usually scattered, and people often have to walk long distances between their fields. However, the benefit of this comes through enabling people to gain access to land of different types and qualities which can be used for different purposes as part of their livelihood strategies.
Landlessness. Classic landlessness – owning no land at all – appears to be limited in Rwanda, with those who want land usually able to access it through the rental market, as explained above. However, certain groups such as Abatwa and some old case refugees face particular problems of landlessness – many of the latter benefited from the Government’s land sharing and imidugudu policies (on which see below), while others regained at least some of their former land, but there are still some who are waiting to be given land and security concerns hinder good land management on the part of some of those who regained their former land.
Private state land. Dotted throughout the country are large areas of private state owned land, including many areas of forest; this awaits an audit - through the ICF-funded land registration project - to identify suitable areas for investment and to identify those areas, especially in the marshlands, which need to be protected.
Minimum parcel area and fragmentation. Both the Succession Law of 1999 and the Organic Land Law specify a threshold of 1 ha, below which land is not allowed to be partitioned. However, this contradicts traditional Rwandan inheritance practices, whereby all male children received a share – umunani - of the parents’ land. Following the legalisation of gender equality in inheritance under the Succession Law, it is possible that the tendency to fragmentation of landholdings will even increase. Land fragmentation is also an unavoidable result of the implementation of the land sharing policy.
Report on Collection of Existing Data
172 (274)
Land consolidation. Meanwhile, land consolidation is an objective of Government policy and careful consideration is required as to how this can best be encouraged. The desire for more efficient and productive land use and management must be balanced by respect for the carefully balanced farming strategies that multiple and fragmented landholdings currently support, especially in the short to medium term while off-farm livelihood activities are being developed in line with the Vision 2020 strategy. Consolidation of holdings may prevent people from growing a wide variety of crops on different parcels of land of differing levels of soil fertility. It will, therefore, need to be matched by adequate development of rural food markets and other infrastructures - such as transport and storage facilities and improved roads - so as not to have a negative effect on household nutrition and food choice. Consolidation through a gradual increase in association-based farming appeared from the NLTRP field consultations to be a strategy worth pursuing (MINITERE et al. 2007, p.66). This could involve pooling land and farming the same crops on a bigger area of neighbouring parcels – allowing for greater degrees of mechanisation if the terrain is not too steep – or renting-in through associations of specific land types such as marshlands and grazing lands, as already happens.
8.2.11 Land sharing Background. Land sharing took place across Eastern Province following the mass return of new case refugees from Tanzania at the end of 1996 and beginning of 1997. The result is larger average parcel sizes in that part of the country, and clearly marked boundaries. Ten years on, the outcome of land sharing appeared during the NLTRP field consultations to be generally accepted, although legal guidelines and procedures are still needed to govern any future land sharing. After the genocide, the returning old case refugees who had lived in exile for many years since 1959 or had been born in exile settled on the land vacated by the departing new case refugees. Land was then shared when the two groups were both back inside Rwanda and both needed land. Population density had been much lower in Eastern Province than elsewhere in the country - and still is - and much land there had only been opened up to cultivation gradually since the 1960s. In addition, a long strip of land was taken back from the Akagera National Park.
Perception of land availability. One consequence of the relatively low population density in Eastern Province is a widespread perception in other parts of the country that land is still available there. As a result, residents of the Province have expressed concerns about future land sharing and about in-migration putting pressure on the land there. Whereas parcels are generally larger and the topography is less steep - and less prone to run-off induced soil erosion - much of the land is rocky and better suited to grazing than arable farming. The climate is also drier so the land has less agricultural potential than in other parts of the country.
8.2.12 Informal settlement upgrading Background of residential neighbourhood mix. Kigali City contains a broad mix of residential patterns – from informal, spontaneous, settlements to formal, planned, settlements with high value housing. This mix is found in both older settlement areas like Kiyovu and Kimihurura and the new housing areas such as Gacuriro and Nyarutarama. Kigali also contains many mixed areas and some
Report on Collection of Existing Data
173 (274)
places were there was ‘tent’, ‘temporary’ and ‘permanent’ housing development following the genocide.
Mode of upgrading of predominant informal settlements. An informal estimate from Kigali City Council (February 2007) is that 78 % of the City’s population live in informal settlements – not all of which are illegal, but include a range of tenure statuses and infrastructural conditions. Ways of upgrading such existing settlements, be it in Kigali or elsewhere, within a participatory and sustainable spatial planning framework is a key issue for the present Project. Matters to resolve include:
• confusion about the boundaries of private state land in many areas of the City of Kigali – ie protected areas such as marshlands - and individually owned land where residential developments will be allowed;
• no testing to date of methods for combining land tenure reform with participatory physical and infrastructural upgrading in urban areas; and,
• existing building regulations have caused problems for those without means to build to the specified standards – status of recently approved new regulations to be reviewed by present Project regarding their enabling capacity.
8.2.13 Expropriation and change of use Expropriation with compensation. Expropriation has been a big concern of many people in Rwanda, because of the way it has been carried out in the past. The Organic Land Law and the recent Expropriations Law should enable expropriation to be carried out better in the future, as, in particular, it is now clear that compensation must be based on the market-price of the land. Expropriation is necessary as part of the process of settlement development, in Kigali City and other urban and rural settlements. Some work has already been done on a possible strategy for this, which would facilitate private development. It may be based on ‘willing seller and willing buyer’, rather than what may labelled ‘market-led’ evictions within the overall context of a Government supported land use or spatial planning framework (MINITERE et al. 2008; UNDP & UN-HABITAT 2006).
8.2.14 Imidugudu and participatory planning Background. The imidugudu policy originally began to be implemented, and was designed, in response to the post-genocide housing problems in the country and the need to provide security especially in the north-west. The policy was launched in 1996 and legalised through a Ministerial Decree in 1997 (Jones 2000; RISD 1999; Hilhorst Mathijs van Leeuwen, 1999). In some areas imidugudu were created for vulnerable groups such as genocide survivors, but in the north-west and the east, areas affected most by continuing military instability, large-scale refugee movements and land sharing, far greater numbers of people were resettled into imidugudu.
Imidugudu motivation. The concept of focusing rural development on small residential and commercial centres - imidugudu – has, apart from a general Government emphasis (Vision 2020) on development of non-agricultural livelihood activities, a twofold motivation:

Report on Collection of Existing Data
174 (274)
• first, it is intended to free agricultural land from physical obstructions to allow for consolidation of fragmented parcels to permit higher productivity;
• second, it is an attempt to save on physical and social infrastructure costs by densifying settlement development – densification may also provide for economies of scale.
In support of the approach, be it from a different motivation, the NLTRP found that young people who are frequently landless because of the limited availability of land to inherit from their parents nowadays, nevertheless still aspire to own a house-plot in an umudugudu (MINITERE et al. 2007, p.108, but see Box 8.7, below, on some of the concerns also expressed to the NLTRP about imidugudu).
Vulnerable groups with particular needs. Carefully planned imidugudu also offer benefits to vulnerable groups like the disabled, genocide survivors seeking security - especially if located near their farms - and to Abatwa. Help with house construction rather than just provision of serviced sites may be required for such groups of people. Box 8.7 - NLTRP raised imidugudu concerns
Lack of social infrastructure planning. Many imidugudu residents consulted by the NLTRP raised concerns about the lack of planning for social infrastructures in many imidugudu, leading to poor sanitation and hygiene, and the continuing poor quality of many of the houses. At the current time, plots in imidugudu are generally considered of inadequate size by residents (averaging 20vm by 30 m); complaints were voiced about the lack of space to extend a house or build a latrine, and frequent encroachment on neighbour’s plots by livestock. People living in imidugudu usually wanted to have large enough plots to be able to farm some food and keep a few animals on their plot, as part of a mixed livelihood strategy which includes off-farm activities (MINITERE et al. 2007, pp.110-111). This all needs to be considered as part of designing a participatory planning strategy for the extension of imidugudu across the country.
Resulting fragmentation. The land exchange process that has been used to implement imidugudu was further criticised during the NLTRP consultations. This process entailed the existing residents of selected settlement sites exchanging land for a house with an incomer who would then give them a same-sized piece of farm land elsewhere. This has contributed to land fragmentation and the dispersion of total household landholdings across multiple scattered plots, while the incomers also often found themselves far from their fields (Ibid). These problems echo those found in countries such as Tanzania, which underwent systematic Villagisation in 1974. Over time, an efficiently functioning land market will correct for these factors but the lessons from experience elsewhere nonetheless clearly show the desirability of a finding a good approach to the establishment and planning of imidugudu in the first place. Factors such as access to roads and ease of infrastructure provision need to be balanced against an assessment of relative soil fertility in the different parts of a community area, so that the settlement sites are wherever possible not located on the best farm land.
Need for participatory upgrading. At the present time, there are relatively more people living in imidugudu in the north-west of the country and in the Eastern Province. The eastern imidugudu are layout-wise better than those of the north-west. In the latter participatory upgrading and improved planning may be needed.
Comparative study. The present Project offers scope for a comparative study of existing imidugudu requiring improvements and of those which have, for

Report on Collection of Existing Data
175 (274)
instance, been better laid out. Lessons learned may be used in a broader design approach for future imidugudu development, adaptable according to different local contexts of, e.g., terrain and population densities, and one also considering to a greater extent social infrastructure.
Assistance with model plan. Sida, the Swedish International Development Cooperation Agency has agreed with MINIRENA to assist with an urban spatial planning consultancy, which may prepare in participatory modalities a model for physical planning of umudugudu settlements. Such model could be used in carrying out rural settlement densification through umudugudu with local adjustments in recognition of local differences in context.
8.3 Methodology Systematic review of documents for extracting of Project relevant data. Following visits to Ministries and Government Institutions by Rwanda Land Use and Development Master Plan Project colleagues in the first part of 2008, a large number of policy and other official documents were obtained. These provide different levels of statistical data and background information on most of the sectors of interest to the Project. For the purposes of preparing an inventory of this existing data, which serves as the baseline from which future preparation of the national Land Use and Development Master Plan will emerge, a large number of these documents have been systematically reviewed by the project Socio-Economist. Selected, page referenced extracts of the relevant raw data are, thus, found in the main Socio-Economic report. Emphasis is on socio-economic and livelihoods/development issues, but also on aspects of most of the other sectoral issues involved in the Master Plan Project, particularly where these have relevance to socio-economic and livelihoods and development issues.
Purpose-designed field study of land and sustainable livelihoods. During May and June 2008, seven day-long field trips were made by the author of the present report to different parts of Rwanda, representing different types of land use and farming systems and different agro-ecological zones, including ecologically-sensitive areas. The field study was purpose-designed by the Socio-Economist for the present Project to enable first-hand exploration of emerging and identified issues which had emerged though the Socio-Economist’s earlier collection of data both with the NLTRP and through the inventory work on the present Project.
Seven key issues of focus for field study. The seven-fold set of broad issues on which the field study has provided complimentary information concern the following: First, Lake Shores and Fisheries – general issues of sustainable fisheries and access to the shore line, impact of silting, from erosion, affecting fish stocks and local farming, also tree-planting, farming constraints and tourism development around lake shores. Second, Wetlands with Clay, Peat, Sand, Gravel and Rock Extraction – general issues of sustainable extraction of raw materials for house construction, pottery and fuel;. Third, Steep Slopes, Forests and Farming – general issues of sustainable land use including terracing and tree-planting. Fourth, Tea Plantations and Export Agriculture – general issues of sustainable livelihoods and land management, including change of land use and marketing issues on tea farms. Fifth, Imidugudu, Planning and Livelihoods – general issues of participatory planning, especially with reference to how sustainable livelihoods can be developed within ‘artificial’ communities such as refugee resettlement areas. Sixth, National Parks of Akagera, Nyungwe,

Report on Collection of Existing Data
176 (274)
Volcanoes – general issues of community management, tourism development, human-wildlife issues such as animal encroachment and poaching, and livelihoods and poverty issues. Seventh, Gishwati Forest – general issues of forest depletion, cattle-keeping, appropriate land use and land management.
8.4 Assessment of Existing Data and Recommendations Arising Limitations of the data. Extensive official documentary material was obtained and reviewed, yet staff of many Ministries often did not know the full extent of the data they had, and some documents and types of information that the present Project was specifically looking for were not easily found. In some cases, one document was referred to in another document within the same Ministry, yet the document referred to turned out not to exist. Many policy and official documents also poorly reference the sources of the data contained therein, or contain within themselves contradictory figures, making it difficult to assess their reliability.
Need for systematic gathering, recording and updating of data. To an extent, the sorts of data kept in different Ministries and made available to the present Project relied on the particular interests and institutional knowledge-bases of the ministerial staff. The main Socio-Economic report provides some counter to this with its comprehensive bibliographies. However there is a clear need to systematise the data and record it in a GIS that can be a central reference point for all Ministries to store and update key data. Data on hospitals, health centres, and primary and secondary schools is a case in point – this had to be manually calculated by the present project Socio-Economist for every district and sector in Rwanda from an administrative map provided by the Rwanda National Institute of Statistics (NISR), to establish the current baseline situation with regard to socio-economic infrastructure in the health and education sectors.
Lack of solid local level detailed data.. The JICA-MINIAGRI report of Bugesera District was the most comprehensive document obtained and reviewed, and extensive extracts from it appear in the main Socio-Economic report. Similarly in-depth studies for all other districts, if available, would be of tremendous value for both local decentralised planning and for national level coordination and strategic planning. It is possible that such detailed reports have been generated by the many NGOs operating throughout Rwanda. The present Project inventory work focused on official data only, but it would be useful for Ministries and NGOs to share data more systematically so that non-governmental data could be made available to policy-makers and government planners.
Baselines for planning. The MINECOFIN document ‘Long Term Investment Framework’ provides potentially the best set of Vision 2020 baselines (from 2006) for planning purposes, although many other baselines and census-related statistics may be obtained from the EICV2 survey (2005/06). It is necessary now to agree on a set of national indicators and baselines against which the land use planning scenarios can be developed and subsequently implemented and assessed. It is similarly necessary to agree on data fields for inclusion in a national GIS, which districts and Ministries can then take responsibility for keeping up to date. The data on hospitals, health centres, and primary and secondary schools mentioned above should be the absolute minimum data sets included in the GIS from a socio-economic viewpoint. Other data from District Development Plans is less consistent but it is nevertheless possible to create fields for extracted data which districts could then take responsibility for

Report on Collection of Existing Data
177 (274)
updating. A meeting of all district planning officers could be a helpful way for the present Project to establish agreement on the basic socio-economic data to be included in the national land use planning GIS.
8.5 Key Findings of Field Study This section provides a summary of some of the key findings of the field study. The full account of the field study is contained in the main Socio-Economic Report.
Problems arising from intensive use of land and environment. Land in Rwanda is intensively used – very little land is not farmed or grazed on. Ecologically sensitive areas are utilised by local people mainly out of necessity rather than lack of understanding about environmental issues. People may have even been sensitised to excess about the environment, as many interviewed during the field study denied knowledge of any ‘illegal’ activities, even when the proof was directly visible. This creates a problem – people know they should not do something, but they still do it for very rational reasons, but if they do not admit to doing it, then it is hard to identify the people who most need support from possible programmes of livelihood diversification.
Land as insurance and continued dependence on land-related activities. Regarding the importance of farming, every single person interviewed during the field study was farming at least some land, even if it was only around their house – either themselves or their family members or paid labourers. The most common reaction to questions about livelihood diversification away from agriculture was laughter. People could not see how they could survive without farming – even some people who were doing well in other economic activities still saw their land - and the possibility of farming - as a kind of insurance. This seems unlikely to change in Rwanda in the short term.
Livelihood diversification and perceived start-up constraints. The main constraints on livelihood diversification appear to be lack of capital and credit. Banks are there in rural areas, but collateral is needed. A common phrase was ‘If I could get money, I could…’. This manifested in predominantly negative attitudes on people’s parts as regards their own possibilities of improving their lives and livelihoods – some could see possibilities ‘maybe in the very long term’, but no possibilities of short term change. This leads to the conclusion that the development of some kind of mortgage-based credit system should be a priority, as most Rwandans at least own a house.
Duplication and lack of specialisation. A further, universally common, constraint on livelihood diversification appears to be duplication. If one person takes an initiative and succeeds, it seemed quite common for others to think of taking the same initiative rather than doing something different. People also had limited conceptions of alternative economic activities. For example, where there is a group of shops in a centre, they often all sell more or less exactly the same things. There is very little specialisation. This keeps prices down for consumers but it does not enable the local economy to grow beyond a certain basic level. Creative thinking beyond the standard well-known non-agricultural activities – such as shops, beer houses, hairdressing saloons, basket-making, tyre repairs and bicycle transporters– is limited. Suggestions made to several groups of people interviewed during the field study, as to how they could gradually try to expand
Report on Collection of Existing Data
178 (274)
and diversify their activities, were often met with an attitude of ‘that would be nice but…’.
Little starvation but potential vulnerability. With regard to poverty, many people in Rwanda appear to be living from hand to mouth, with local economic activities hardly developed beyond the immediate local community, as has probably been the case for hundreds of years. Yet people are not all showing signs of impoverishment – there is little visible starvation, for example, and most people wear clean clothes and have shoes. However, there are also a great number of people who seem to be managing, but who are nevertheless vulnerable to slip into, or back into, greater poverty, should adverse circumstances or economic shocks come their way. Apart from their land, few people appeared to have much in the way of reserves or insurance. At the same time, even among ‘poor’ people in rural areas, mobile telephone penetration seems to be growing all the time. Such technology has the ability to improve access to markets and knowledge of price information, to encourage more efficient economic development.
8.6 Implications for National Parks Following attendance at ORTPN’s first ever Conservation Conference on 19 June 2008, the following three implications for the present Project in relation to National Parks emerged.
Liaison and co-operation on research and information. First, in approaching the required in-depth socio-economic and agro-ecological studies of areas and communities neighbouring the National Parks, liaison and co-operation with other Rwandan stakeholders will be very important. Some related research is already being or has already been done, and there are a number of key organisations including ORTPN and the World Conservation Society (WCS), as well as some private sector tourism industry organisations, with information and experience that will be of value to the present Project.
Consideration of trans-boundary issues. Second, in making future recommendations in relation to the National Parks, the present Project needs also to give consideration to trans-boundary issues and how any Rwandan land management and land use framework or proposals will affect and be affected by policies in neighbouring countries. This issue will need to be brought to the careful attention of MINIRENA and the National Land Centre (NLC), as they will have to consider how they would like to manage this issue in future alongside other Rwandan stakeholders.
Need for integrated approach. Third, interest in the Volcanoes National Park is massive, and in gorilla conservation, and gorilla tourism is a major revenue source for Rwanda. Nyungwe National Park is possibly ahead on community conservation, but way behind on tourism. In contrast, Akagera National Park seems little researched and underdeveloped both in terms of conservation and tourism. An upshot of this is that – at the present time – interest in tourism and conservation in Rwanda is limited to or at least centred on the gorillas, and much work will be needed to take a more integrated approach to Rwanda’s National Parks and encourage tourism development beyond the gorillas so as to improve livelihoods for more Rwandans.

Report on Collection of Existing Data
179 (274)
8.7 Recommendations for Further Studies In-depth study of national parks next. With the collected and reviewed basic data, it is now meaningful – as of ‘Task 4’ in the Project Technical Proposal – to engage into further socio-economic study, ie in-depth study, of areas bordering Rwanda’s three National Parks. Comprising Volcanoes, Akagera and Nyungwe forests, the study should seek to identify the particularities of the situation on the ground in each place relevant to the formulation of alternative land use and development master plan scenarios. The study methodology should utilise rapid appraisal methods in the field, involving interviews and discussions with local government officials, ORTPN staff and members of local communities. Existing land management practices should be assessed and suggestions made, as required, for sustainable and participatory strategies for more effective land management and conservation in these areas. Lessons and best practice from other countries should also be drawn on, and consideration should be given to the implications from the ORTPN conservation conference set out in the preceding section.
Studies of key land use issues requiring further investigation. Also under ‘Task 4’ in the Project Technical Proposal, more detailed socio-economic studies should now be carried out on a number of other key land use issues - including in sensitive ecological zones - to suggest possible strategies for dealing with them. This will contribute broadly to the development of a sustainable, and evidence-based, land use and development planning and management framework for Rwanda especially in relation to: land adjoining Rwanda’s lakes and waterways, which will enable environmental protection with minimal negative impact on the livelihoods of the affected landowners and land users; sustainable development of the fisheries sector; future development of imidugudu in different areas; improvement and upgrading of existing imidugudu; sustainable development of the small-scale mineral extraction sector - in the case of clay extraction, how can this be married with the sustainable management and development of the marshlands/wetlands, including biodiversity protection; and, areas characterised by very steep slopes.
Groups meriting particular targeting. From the analysis of the various land use-related issues as of the present Project objectives, identified in its Technical Proposal, found at its inception and during subsequent work, including collection of data on the existing situation, it is clear that some groups of land users might merit special targeting in deepened socio-economic studies and possible pilot work, for example:
• fishing communities;
• lakeshore landowners;
• communities adjoining the three National Parks - ‘ordinary farmers’, but also tea farmers around Nyungwe and livestock farmers around Akagera; and,
• farmers on steep slopes.
Pilot study with participation. It is also clear that participatory spatial planning for residential and commercial development, in line with Vision 2020, is a key issue to be addressed by the present Project. One possible pilot study might involve the construction of two model imidugudu (one urban, one rural), to test

Report on Collection of Existing Data
180 (274)
and demonstrate the feasibility of environmentally sustainable and low-cost settlements following principles of participatory spatial planning. This could possibly be incorporated with the Sida assistance on urban planning described above.

Report on Collection of Existing Data
181 (274)
9 Physical Infrastructure 9.1 Introduction This report is commensurate with the requirement by the SWEDESURVEY Project Team of the contribution of a Civil Engineer, in the area of Physical Infrastructure to the Rwanda Land Use and Development Master Plan, currently under preparation by the Team. The project schedule is at the stage of aerial photography and collection of existing data for other relevant sectors. To this respect, the general scope of the terms of reference was to collect information on the prevailing situation, associated with the related data in different domains of Physical infrastructure namely, transport (roads, railways, air, and water transport), energy, water and sanitation, ICT and telecommunication and solid waste. The report therefore organizes and summarizes the data collected, makes references of where to obtain the bulk data that could not be accommodated in the report, and makes a mention in case the sought data related to a particular domain was not available. The report also illustrative images in form of tables, charts, maps, diagrams, and photos just to qualify as necessary some of the information in the text. The information was collected through physical visiting of different relevant organizations, consulting different available documents, physical visit of places, as well as visiting some relevant websites.
9.2 Transport
9.2.1 General Vital development catalyst: Transport Infrastructure is undoubtedly among the most vital catalysts of any country’s socio-economic development. The pace of achievement of economic goals is a direct function of the quantitative and qualitative level of accessibility and mobility of goods and persons within a country, complemented with the operational levels of transport connections to the neighbouring countries and worldwide. Improving transport systems and, thus, accessibility promotes economic development in all respects, through the following:
• facilitation of the accessibility to essential social services like health, education, administration, markets, tourism and culture;
• widening of employment basin for the active population, contributing to poverty reduction;
• alleviation of production costs;
• cheaper access to production facilities like supply of materials, manpower and machineries;
• reduction of transportation time: wider choice to business specialization like supply of perishables;
Report on Collection of Existing Data
182 (274)
• easy accessibility to new inputs or to new technologies, thus diversification and enhancement productivity level;
• enhanced propagation of information, enhanced community development; and,
• facilitation of smooth trading of produces from the different production sectors like agriculture, industries, mining, fisheries and forestry.
Inefficient transportation: In Rwanda, all the efforts endeavoured by Government to improve transport notwithstanding, plenty is still to be desired as regards transportation of products to local trading facilities or for export. A result of an inefficient transportation system is minimisation of revenues, dissuasion of entrepreneurs and investors, and impoverishment of the concerned geographical area.
Landlocked urban areas: Also in urban areas, several zones are still ‘landlocked’ in terms of poor quality of local road network. In consequence, transport cost becomes high against the purchasing power of the population, leading to suppressed individual mobility and weak urban productivity. Mitigation of these problems enhances the improvement of slums and low-income urban zones.
9.2.2 Problems related to transportation Challenging topography: The inefficient transportation system in Rwanda is, on the one hand, an effect of the country’s particular geographic characteristics, and, on the other, the generally poor economic situation. The latter was exacerbated by the past years of war and genocide. The transportation setback in Rwanda is typical of a country under negative effects of threefold ‘land lock’ constraints, ie those concerning the country being landlocked:
• physically in the region;
• regarding rural areas; and,
• socially and economically.
Aggravating factors: These states of being landlocked have been aggravated by: low operational efficiency on the part of the actors in the transport sector; low level of economic development, a combination of the human and property destruction caused by the genocide; low level of harnessing of natural resources; and, absence of an audacious and voluntarism policy in the transport sector that trailed for a considerable time leading to lack of organisation and to poor productivity on the part of the operators of the sector.
Physical state of being landlocked: The geographical features of Rwanda are one of the characteristics that affect the performance of the surface transportation sector. Two major elements are noted: first, enclosure of the country at the sub-regional level; and, second, the relief characteristics of Rwanda. The latter illustrate the implication of spatial distribution in the configuration and performance of a surface transportation network.

Report on Collection of Existing Data
183 (274)
Figure 9.1- Rwanda sub-regionally landlocked
Source: MININFRA, Rapport sur la Politique du Transport, Document Sythése Vol 3, 2005 Nov:3.
In efficient international network for exports and imports: Lack of efficiency of the international transport chain connecting with Rwanda has a direct impact on cost of exports to outlets including ports, subjecting Rwandese products to less competitiveness on the international market. Regarding imports, the high transport cost has an impact on the purchasing cost for Rwandese consumers, and, thus, contributes to high cost of living, constraining the endeavours of poverty reduction.
Added costs: In terms of transport costs, the impact of the existing situation of the international transport chain is triple, i.e.:
• immutable distance implies increase in cost of the operational variables: fuel, tires, lubricants, salary of the drivers, etc;
• transit time increases the fixed costs - vehicle depreciation, insurances, etc; and,
• legal, and in particular illegal, taxes have added up an appreciable supplementary cost aspect.
Physical distance with disadvantage: The physical enclosure of Rwanda in the sub-region has also an impact in terms of competitiveness of Rwandese transportation companies. That the ports serving the country are located abroad in Kenya and Tanzania, results in Rwandese transporters being subjected to competition with transporters of those countries. This situation is aggravated by the necessity to sometimes cross through other countries to access sea ports. This adds to costs and competition.
Dependence: The enclosed situation also constitutes a potential threat in terms of national independence and protection of the strategic interests of Rwanda. The exportation of Rwandese products and the supply to the country of essential goods depends on the organisation of the respective logistic transport chains. In this strategic domain Rwandese transporters are not favoured (Table 9.1 below).

Report on Collection of Existing Data
184 (274)
The more the regional differences in terms of technical norms, such as axial load, disadvantage the Rwandese Transporters, due to the negative impacts in abiding to the associated regulations. Table 9.1 - Distances and times of transit towards ports
Distance (km) Transit duration (days)
Corridor
Road Rail Total Import Export
North (1)
Road 1690 - 1690 8 6
Rail/Road
520 1333 1853 20 16
Central (2)
Road 1380 - 1380 12 12
Rail/Road
480 982 1462 14 12
Notes: (1) via Malaba in Kenya; (2): via Isaka in Tanzania.
Source: MININFRA, 2007.
Internally landlocked. Rwanda, with a high population density, of which 80 % is rural, would seem to require at least a concentrated network of roadways. However, considering the country’s relief, endeavours to this respect are a challenge. The difference in altitude sometimes attains several meters and, taking into account the sub-equatorial climate, the road infrastructure is costly to construct and maintain.
Low density road network and sprawled population: The state of being internally landlocked through constraining topography, is also characterized by a network of tracks, usable by motor transport, that is not sufficiently dense to cater for a rural population so evenly distributed outside dense settlements - most parts of dwelling and working places are, therefore, only accessible on foot or other IMT. Moreover, the situation is pronounced by rare utilisation of animal towed transport in Rwanda, argued due to poor purchasing capacity for tires and other required materials, and to culture and traditional factors – the use of animal towed carts as an intermediary means of transport was never a Rwandese culture.
Land locked urban zones. The following constraints apply to rural and urban transport in Rwanda, and create isolated zones also in towns, particularly in Kigali:
• when roads are in bad condition, motorised transport does not ply them;
• roads in bad condition elevate the running costs of vehicles as well as tariffs applied by transporters, thus, constraining low-income population categories; and,
• high costs associated with petroleum products and vehicle spare parts exacerbate.
Report on Collection of Existing Data
185 (274)
Economically and socially landlocked: It is the less advantaged of the population who, as a rule, live a situation of physical enclosure, in isolated villages or in ‘informal’ urban zones. Little served by public utilities, this majority of the population are constrained by lack of access roads, be they surfaced or not. Within such settings, where there exist transport services, the condition of the road network is associated with very high operation costs, thus prohibitive tariffs. The extreme poverty of the majority of the population, therefore, excludes it from motorised transport - leaving it with the only option of walking on foot often with luggage on their heads. Economic and social enclosures, add up to the physical enclosure, thus, contributing to prevent a majority from leaving impoverishment.
Few local international operators. Apart from its poor state of road infrastructure, the transport sector in Rwanda suffers from lack of participation on the part of its operators. On the international arena, there exist very few true Rwandan transporters in possession of trucks to serve the demand for transportation of heavy loads including those containerised.
MIT, ie by foot. In the local livelihood context, the common option of Intermediary Means of Transport (MIT) means walking on foot, carrying luggage on the head, especially by women, leading to:
• significant time wasted in the supplies and transport of farm produces;
• small or meagre quantities actually transported; and,
• fatigue of the transporters, especially women, who are also the producers.
Elevated costs. For access to markets and urban centres – efficiency of transport is hampered by low capacity of transport units, the speed limited by poor roads, poor roads network and the weak organisation of the trade. Costs are elevated for the above reasons, on one part, and due to lack of competition, on the other.
Lack of targeted regulations. Concerning transportation of persons, as much in towns as in the villages, lack of targeted regulations by the local authorities leads to disorganised transport, characterised by:
• high concentration of service on certain road routes, which are immediately profitable – ie, on bitumen roads and networks in good condition with little competition; and,
• lack of concentration, or non-existence, of service on deteriorated road routes, particularly in rural areas.
9.2.3 Roads as the principal sub-sector Other sub-sectors small: Roads constitute the principal transport sub-sector in Rwanda. It is, thus, mainly by roads that movement of goods and the majority of people happen. Other sub-sectors - including air transportation, lake and water carried - are yet at low levels of operation or development, albeit making some contribution in alleviating the high transportation demand. The general contribution to the Rwanda’s transportation demand by each sub-sector is illustrated below (Table 9.2).
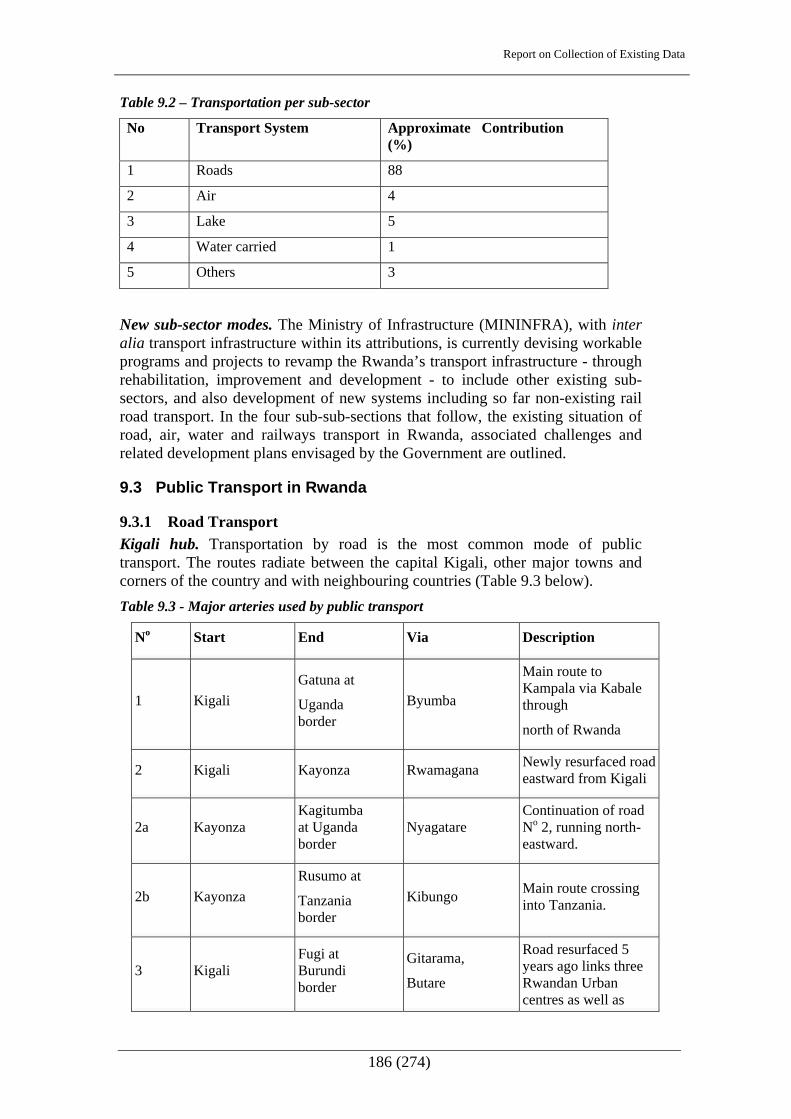
Report on Collection of Existing Data
186 (274)
Table 9.2 – Transportation per sub-sector
No Transport System Approximate Contribution (%)
1 Roads 88
2 Air 4
3 Lake 5
4 Water carried 1
5 Others 3
New sub-sector modes. The Ministry of Infrastructure (MININFRA), with inter alia transport infrastructure within its attributions, is currently devising workable programs and projects to revamp the Rwanda’s transport infrastructure - through rehabilitation, improvement and development - to include other existing sub-sectors, and also development of new systems including so far non-existing rail road transport. In the four sub-sub-sections that follow, the existing situation of road, air, water and railways transport in Rwanda, associated challenges and related development plans envisaged by the Government are outlined.
9.3 Public Transport in Rwanda
9.3.1 Road Transport Kigali hub. Transportation by road is the most common mode of public transport. The routes radiate between the capital Kigali, other major towns and corners of the country and with neighbouring countries (Table 9.3 below). Table 9.3 - Major arteries used by public transport
No Start End Via Description
1 Kigali Gatuna at
Uganda border
Byumba
Main route to Kampala via Kabale through
north of Rwanda
2 Kigali Kayonza Rwamagana Newly resurfaced road eastward from Kigali
2a Kayonza Kagitumba at Uganda border
Nyagatare Continuation of road No 2, running north-eastward.
2b Kayonza Rusumo at
Tanzania border
Kibungo Main route crossing into Tanzania.
3 Kigali Fugi at Burundi border
Gitarama,
Butare
Road resurfaced 5 years ago links three Rwandan Urban centres as well as
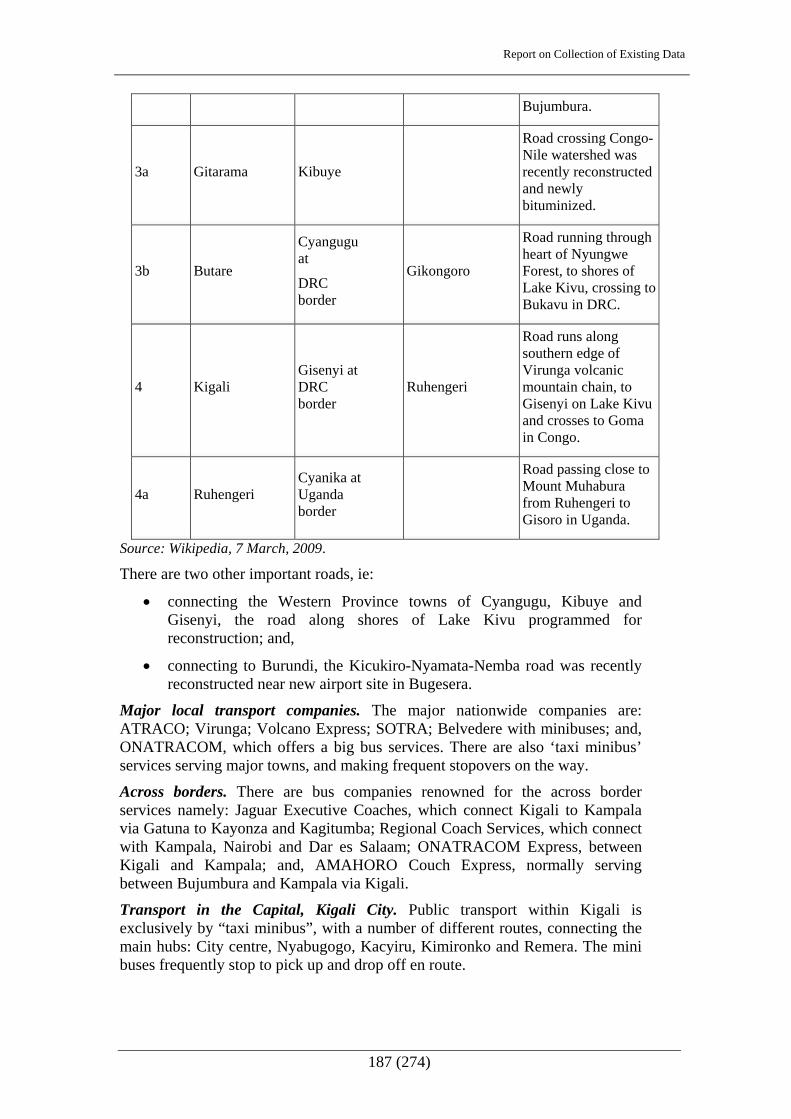
Report on Collection of Existing Data
187 (274)
Bujumbura.
3a Gitarama Kibuye
Road crossing Congo-Nile watershed was recently reconstructed and newly bituminized.
3b Butare
Cyangugu at
DRC border
Gikongoro
Road running through heart of Nyungwe Forest, to shores of Lake Kivu, crossing to Bukavu in DRC.
4 Kigali Gisenyi at DRC border
Ruhengeri
Road runs along southern edge of Virunga volcanic mountain chain, to Gisenyi on Lake Kivu and crosses to Goma in Congo.
4a Ruhengeri Cyanika at Uganda border
Road passing close to Mount Muhabura from Ruhengeri to Gisoro in Uganda.
Source: Wikipedia, 7 March, 2009.
There are two other important roads, ie:
• connecting the Western Province towns of Cyangugu, Kibuye and Gisenyi, the road along shores of Lake Kivu programmed for reconstruction; and,
• connecting to Burundi, the Kicukiro-Nyamata-Nemba road was recently reconstructed near new airport site in Bugesera.
Major local transport companies. The major nationwide companies are: ATRACO; Virunga; Volcano Express; SOTRA; Belvedere with minibuses; and, ONATRACOM, which offers a big bus services. There are also ‘taxi minibus’ services serving major towns, and making frequent stopovers on the way.
Across borders. There are bus companies renowned for the across border services namely: Jaguar Executive Coaches, which connect Kigali to Kampala via Gatuna to Kayonza and Kagitumba; Regional Coach Services, which connect with Kampala, Nairobi and Dar es Salaam; ONATRACOM Express, between Kigali and Kampala; and, AMAHORO Couch Express, normally serving between Bujumbura and Kampala via Kigali.
Transport in the Capital, Kigali City. Public transport within Kigali is exclusively by “taxi minibus”, with a number of different routes, connecting the main hubs: City centre, Nyabugogo, Kacyiru, Kimironko and Remera. The mini buses frequently stop to pick up and drop off en route.

Report on Collection of Existing Data
188 (274)
Figure 9.2 - Taxi-Mini Buses Figure 9.3 - Kigali City, Mount Kigali in background
Source: Wikipedia, 7 March, 2009. Source: Wikipedia, 7 March, 2009.
Other common means of transport in Kigali are the ‘motor cycle taxis’, mainly used by the majority, and the ‘saloon car taxis’ that are only affordable to higher income groups.
9.3.2 Air Transport New airport to be located at Bugesera: Rwanda’s main air gateway is Kigali International Airport, located at Kanombe, approximately 10 km from Kigali City centre. The airport has international flights to Nairobi, Entebbe, Addis Ababa, Bujumbura, Johannesburg and Brussels, and is the main airport for the national carrier Rwanda Air Express. Plans to construct a new airport at Bugesera, 40 km south-east of Kigali, are under way. Figure 9.4 - Kigali International Airport: Figure 9.5 - National Flag Carrier
Source: Wikipedia, 7 March 2009 Source: Internet, 13 March 2009 9.4 Roads 9.4.1 General existing situation and jurisdiction Mainly earth roads. The road network in Rwanda constitutes around 14000 km, of which 5400 km constitute the main road network. According to studies accomplished by MNINFRA in 2005-6, of the main network, only 1075 km are paved. The remaining 4325 km are earth roads. The national and inter-urban main road network is placed under the jurisdiction of the Ministry of Infrastructure (MININFRA). This network connects the provinces among

Report on Collection of Existing Data
189 (274)
themselves and Rwanda to neighbouring countries. The secondary road network is under the responsibility of the districts. Varying custodianship. The tracks within the National Parks belong to MININFRA. ‘Project roads’ are under the responsibility of the project owners, before they are adopted by ultimate clients. Ownership of tracks bordering plots grouped in different areas and categories is adopted by the plot owners who are entrusted to ensure their maintenance.
Lacking of road safety. Whereas - in spite of the relatively high density of road network in Rwanda with about 0.5 km per km2 - motorised transport remains small, the high population density entails intense pedestrian traffic and hand pushed two-wheeled carts traffic on both earth and paved roads, often leading to mixed traffic composition. This mix contributes to a high level of insecurity on the road networks.
One third classified. Among the 14000 km, only 4790 km of the network comprises classified roads as follows:
• National Tarmac Roads - 1075 km;
• National Earth Roads - 1875 km; and,
• District Roads (earth) - 1840 km.
The remaining 9210 km are unclassified roads. Figure 9.6 - General Road Map of Rwanda.
Source: Swedesurvey Project base maps.

Report on Collection of Existing Data
190 (274)
Need for attention. A large part of the network in Rwanda calls for rehabilitation, extensive improvement, scheduled maintenance and development of new roads.
9.4.2 General road inventory On the way from ‘bad’. A comprehensive report on the geographical localisation and condition survey conducted by the Ministry for the classified road network in the year 2006 is available in the MININFRA Transport Coordination Unit. The report indicates that there is still a great deal to be desired as regards the state of roads in the country. A global representative score that may be assigned the roads in Rwanda is ‘bad’. This depicts the inadequacy level of the road conditions. The actual overall situation is likely to be worse as the inventory was only conducted on classified roads, which constitute only around 35 % of the total network. Nevertheless, the situation has improved to an extent over the period from 2006, thanks to a number of road improvement and rehabilitation projects that have been implemented. Many others are on-going. The state of roads and its network are expected to highly improve in the coming years, given several future investments in road improvement programs under consideration as part of the EDPRS.
Useful new survey. BCEOM, a consulting company, providing technical assistance with funding by the EU to MININFRA, is currently carrying on a road condition and inventory survey that is intended to accomplish the following:
• renewed condition survey on the whole road network;
• traffic survey on paved road network; and,
• constitution of a database.
The survey is highly useful as it shall serve in collecting vital data for future planning for maintenance, rehabilitation and other improvement measures of the roads. The study is already completed for the tarmac roads and is on-going for the earth roads.
9.4.3 Problems associated with road infrastructure Transportation not enabling: Rwanda’s road network, thus, faces several problems that suppress its serviceability - a consequence of which is an unsatisfactory transportation service, in a situation where roads being the major transport sub-sector. Main problems associated with road infrastructure are summarised as follows:
• general poor state of existing roads, attributable to lack of maintenance and improvement measures – resulting from enormous financial investments required, that are not adequately attainable by the Government;
• a few good roads in the network are highly overloaded and congested, as there is always an imbalance of traffic distribution in favour of good roads - this negatively affects the life spans of even the good roads, which would otherwise have served longer;
• mix of different modes of transport within the few good roads, especially in urban centres, with vehicles of different kinds, motorcycles, bicycles,
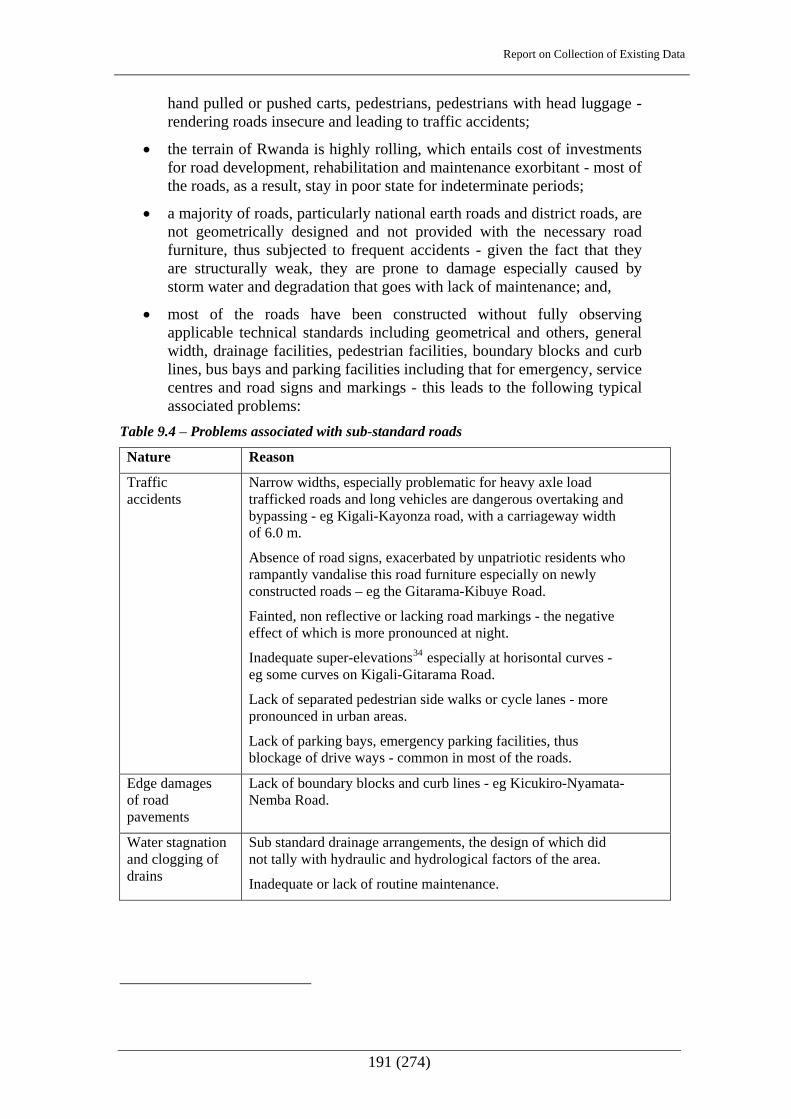
Report on Collection of Existing Data
191 (274)
hand pulled or pushed carts, pedestrians, pedestrians with head luggage - rendering roads insecure and leading to traffic accidents;
• the terrain of Rwanda is highly rolling, which entails cost of investments for road development, rehabilitation and maintenance exorbitant - most of the roads, as a result, stay in poor state for indeterminate periods;
• a majority of roads, particularly national earth roads and district roads, are not geometrically designed and not provided with the necessary road furniture, thus subjected to frequent accidents - given the fact that they are structurally weak, they are prone to damage especially caused by storm water and degradation that goes with lack of maintenance; and,
• most of the roads have been constructed without fully observing applicable technical standards including geometrical and others, general width, drainage facilities, pedestrian facilities, boundary blocks and curb lines, bus bays and parking facilities including that for emergency, service centres and road signs and markings - this leads to the following typical associated problems:
Table 9.4 – Problems associated with sub-standard roads
Nature Reason
Traffic accidents
Narrow widths, especially problematic for heavy axle load trafficked roads and long vehicles are dangerous overtaking and bypassing - eg Kigali-Kayonza road, with a carriageway width of 6.0 m.
Absence of road signs, exacerbated by unpatriotic residents who rampantly vandalise this road furniture especially on newly constructed roads – eg the Gitarama-Kibuye Road.
Fainted, non reflective or lacking road markings - the negative effect of which is more pronounced at night.
Inadequate super-elevations34 especially at horisontal curves - eg some curves on Kigali-Gitarama Road.
Lack of separated pedestrian side walks or cycle lanes - more pronounced in urban areas.
Lack of parking bays, emergency parking facilities, thus blockage of drive ways - common in most of the roads.
Edge damages of road pavements
Lack of boundary blocks and curb lines - eg Kicukiro-Nyamata-Nemba Road.
Water stagnation and clogging of drains
Sub standard drainage arrangements, the design of which did not tally with hydraulic and hydrological factors of the area.
Inadequate or lack of routine maintenance.
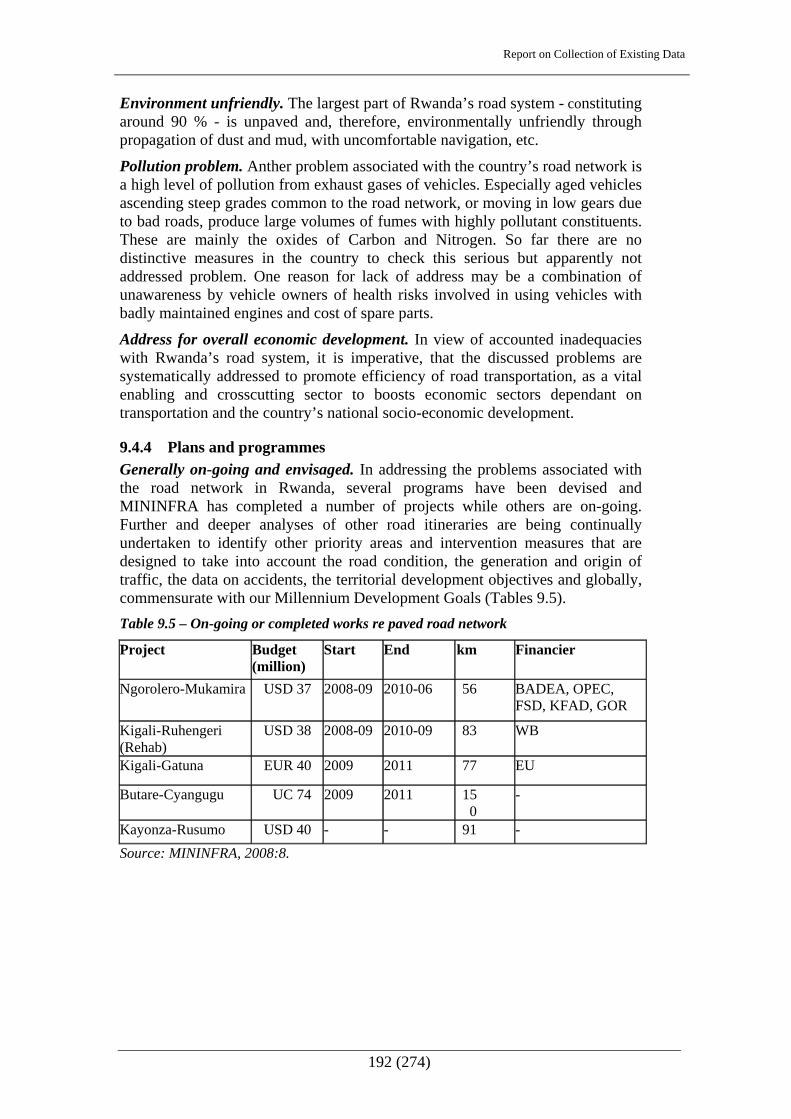
Report on Collection of Existing Data
192 (274)
Environment unfriendly. The largest part of Rwanda’s road system - constituting around 90 % - is unpaved and, therefore, environmentally unfriendly through propagation of dust and mud, with uncomfortable navigation, etc.
Pollution problem. Anther problem associated with the country’s road network is a high level of pollution from exhaust gases of vehicles. Especially aged vehicles ascending steep grades common to the road network, or moving in low gears due to bad roads, produce large volumes of fumes with highly pollutant constituents. These are mainly the oxides of Carbon and Nitrogen. So far there are no distinctive measures in the country to check this serious but apparently not addressed problem. One reason for lack of address may be a combination of unawareness by vehicle owners of health risks involved in using vehicles with badly maintained engines and cost of spare parts.
Address for overall economic development. In view of accounted inadequacies with Rwanda’s road system, it is imperative, that the discussed problems are systematically addressed to promote efficiency of road transportation, as a vital enabling and crosscutting sector to boosts economic sectors dependant on transportation and the country’s national socio-economic development.
9.4.4 Plans and programmes Generally on-going and envisaged. In addressing the problems associated with the road network in Rwanda, several programs have been devised and MININFRA has completed a number of projects while others are on-going. Further and deeper analyses of other road itineraries are being continually undertaken to identify other priority areas and intervention measures that are designed to take into account the road condition, the generation and origin of traffic, the data on accidents, the territorial development objectives and globally, commensurate with our Millennium Development Goals (Tables 9.5). Table 9.5 – On-going or completed works re paved road network
Project Budget (million)
Start End km Financier
Ngorolero-Mukamira USD 37 2008-09 2010-06 56 BADEA, OPEC, FSD, KFAD, GOR
Kigali-Ruhengeri (Rehab)
USD 38 2008-09 2010-09 83 WB
Kigali-Gatuna EUR 40 2009 2011 77 EU
Butare-Cyangugu UC 74 2009 2011 150
-
Kayonza-Rusumo USD 40 - - 91 - Source: MININFRA, 2008:8.

Report on Collection of Existing Data
193 (274)
Table 9.6 - Projects in pipeline re paved road network
Project Budget (million)
Start End km Financier
Ngorolero-Mukamira
USD 37 2008-09 06-2010 56 BADEA, OPEC, FSD, KFAD, GOR
Kigali-Ruhengeri
USD 38 2008-09 09-2010 83 WB
Kigali-Gatuna EUR 40 2009 2011 77 EU Butare-Cyangugu
UC 74 2009 2011 150 -
Kayonza-Rusumo
USD 40 - - 91 -
Source: MININFRA, 2008:9.
Table 9.7 - New Road constructions re paved road network
Project Budget (million) Start End km
Bujumbura-Ruhwa-Ntendezi-Rubavu
350 M USD 2009 2012 285
Nyagatare-Byumba-Base
- - - 130
Kibungo-Nyanza - - - 130 Source: MININFRA, 2008:10.
Table 9.8– On-going maintenance contracts re rural gravel road network
Project Budget (billion)
Start End km
Nyanza-Kibuye 1.95 RWF 12-2007 02-2009 69 Mudasomwa-Gisovu 1.46 RWF 11-2007 11-2008 52.5 Butare-Kibeho-Muse 2.23 RWF 11-2007 01-2009 53
Nyankora-Nasho 1.17 RWF 01-2007 42
Kabarondo-Akagera-Ihema
1.66 RWF 05-2007 05-2008 36
Source: MININFRA, 2008:11. Urban roads, technical studies and bridges. Further detailed survey results - on urban roads projects of different surface finishes, technical studies on gravel roads and other activities including bridges reconstruction, rehabilitation and maintenance – are found below.
Report on Collection of Existing Data
194 (274)
Urban Roads. The following road projects have been recently finished or towards completion:
• Kigali City - Nyarutarama-Kibagabaga-Remera Road – 4 km double surfaced, dressed road, completed in 2007;
• Kinamba-Memorial-FAWE-Nyarutarama and Giporoso-Kabeza-Rubirizi - 14 km bitumen double surface, dressed roads, now completed under PIGU (Projet d’Infrastructres et de Gestion Urbaine);
• extension of stone paved roads - financing with RMF, ADB and Community participation; and,
• 36 km Road rehabilitation project financed by Exim Bank. Other urban entities. Construction and rehabilitation of paved roads.
• Huye, 4 km of new paved roads - PIGU Project; • rehabilitation of paved roads in Butare, Muhanga, Musanze, Rubavu and
Rusizi - pre-financing arrangements negotiated with SNCPC and STRABAG.
Studies re rural gravel road network. The following technical studies are about to start:
• Kazabe-Gashubi – 54 km, National Earth Road; • Byimana-Buhanda-Kitabi - 98 km, National Earth Road; • Cyakabiri-Nyabikenke-Ndusu - 75 km, National Earth Road; • Gashirabwoba-Nyamirundi - 30 km, District Road; • Ngorolero-Vunga-Nyakinama - 45 km, unclassified road; and, • Lake Muhazi Ring-Road - 98 km, District Road.
Other activities on road network. The following maintenance works are prepared:
• routine maintenance for the national 1135 km paved road network: and, • multi-year maintenance contracts on ‘renewal on performance’ basis to be
signed with national contractors. Bridges. The following reconstruction, rehabilitation and maintenance are on-
going or are to be launched: • Gashora II and III Bridges on Cyangugu-Bugarama Road - under
reconstruction; • Rusumo Bridge on Kgali-Kibungo-Rusumo Road - maintenance works
taking place since 2008; and, • Rusizi Bridges on Burundi and DRC borders on Rusizi-Bugarama and
Bugarama Rukwa Roads - rehabilitation study to be launched;
A more detailed investment situation of the projects and programs, current and future, including mega projects planned for large scale regional context destined to lower transportation costs, especially for Rwanda, envisaged within the EDPRS period 2008-12 are elaborated in details in the MININFRA Transport Sector Programme Document (Aug 2008), available in the Transport Sector Coordination Unit of MININFRA. In accordance with the document, value of the total investment is estimated at USD 996000000.

Report on Collection of Existing Data
195 (274)
9.5 Railways 9.5.1 Background Need for rail port connection. Rwanda is a landlocked country far from seaports; the nearest port of Dar-es-Salaam is about 1400 km away. The country’s highly rolling terrain and its state of being landlocked pose a major obstacle in its socio-economic development efforts. The major strategic options for Rwanda in the area of poverty reduction are based on enhanced security, revival of socio-economic activities and opening up of the country by developing its infrastructure, to promote local as well as foreign investors. To this respect, among the solutions being conceived is the railway project to connect Rwanda and its neighbouring countries namely Tanzania, Burundi and later the DRC.
9.5.2 First stage objectives First part of railway connection with Tanzania. The two neighbouring states of East Africa, the United Republic of Tanzania and the Republic of Rwanda share a common border of about 195 km. These two countries nurture socio-economic and cultural ties owing to the permanent intermixing of their peoples. The main objective is to construct the first part of a railway line system for Rwanda between Isaka in Tanzania and Kigali in Rwanda. The rail line envisaged is about 450 km long, of which 175 km will be on the Rwandese territory and the rest on the Tanzanian soil. The project is at the stage of feasibility study, which has just been completed.
Railway study on first part. Specifically, the railway study under MININFRA (Ref: Feasibility Study for the Isaka-Kigali Railway Project, by DB International, 2007) aims at finding an optimal solution to the construction of the Isaka-Kigali railway line on a ‘central corridor’, to especially open up Rwanda to the ports of the east African coast on the Indian Ocean. To this end, areas of high mining, industrial and agricultural production potential of Rwanda would be rail connected with the Kagera and Shinyanga Regions in Tanzania, Burundi and the Eastern Provinces of the Democratic Republic of Congo (DRC).

Report on Collection of Existing Data
196 (274)
Figure 9.7 - Schematic view of the proposed railway alignment
Source: MININFRA, 2007:3 The rail line shall complement transport in the Lakes Kivu and Tanganyika and the New Bugesera Airport shall be an alternative for trucks - eg, between coastal ports to Kigali and Bujumbura - and support to economic activities like agriculture, mining, tourism, industry and general trade along its line.
Later objectives of sub-regional connections. The sector goal of the project is to contribute to the implementation of an efficient and economical community transport program. It is intended to foster regional economic integration and the development.
Isaka
Kigali
Rusumo Falls
Proposed New Line
Bujumbura
BURUNDI
TANZANIA

Report on Collection of Existing Data
197 (274)
Figure 9.8- Schematic presentation of part of the proposed railway towards Kigali and environs, in relation to other transport infrastructure
Source: MININFRA, 2007.
Figure 9.9 - Schematic presentation of part of the proposed railway: Link to Burundi
9.5.3 Future regional connection
EAC Railways master plan. The East African Community (EAC) countries have agreed to prepare and launch the EAC Railways Development Master Plan, which is now at the procurement stage A vast network of new railway lines within East Africa and others linking the region to neighbouring Ethiopia, South
Section of km 400+000 – km 480+000
Lac Sake
Lac Mugesera
Kigali
ProposedAirport
Upper Road Corridor
Section: km 320+000 – km 400+000 Rusomo Falls
Link to Burundi
Lac Rweru
Map 9.5.1.3-Schematic presentation of part of the proposed railway: Link to Burundi
Source: MININFRA, MININFRA, Presentation of the Feasibility Study Report by DB International GmbH Consulting
200 10
Report on Collection of Existing Data
198 (274)
Sudan and the Democratic Republic of Congo are planned in the Master Plan. Consultants have, thus, been commissioned by the EAC Secretariat to study the possibility of constructing 15 new lines under the Master Plan. A new rail line connecting with Isaka and the eventual accomplishment of the full network of the Railway Development Master Plan total connection of Rwanda to the greater region would be realised, thus fully making use of the three transport corridors, as well as connection to other countries outside the EAC, like Ethiopia, Sudan, DRC, etc (Wikipedia, 7 March, 2009).
9.5.4 Isaka Dry Port Two rail corridors. A land locked country with significant remoteness to ports; this constitutes a major handicap in the Rwanda’s efforts towards socio-economic development. For the regional and external exchanges, the country makes use of the ‘Northern Corridor’ that connects Kigali to the port of Mombassa in Kenya, at a distance of about 1800 km, and the ‘Central Corridor’, running from Kigali to the port of Dar es Salaam in Tanzania, at a distance of about 1400 km (Ref. Terms of Reference for updating of the Technical and Feasibility studies for the construction of a Dry Port at Isaka, 2007:1).
Preferred corridor with terminal: To give much more importance to the services of the Tanzania railway network, the Isaka terminal was upgraded to the status of a ‘dry port’ to facilitate rail traffic with destination to or originating from Rwanda, Burundi, the east of the DRC and the east of Uganda. After construction of a modern container terminal in the port of Dar es Salaam, the improvement of some Tanzanian railroads and putting at the disposal of Rwanda of a storage space in Isaka - intended to play the role of a dry port in the future days - the interest of Rwanda to use the latter corridor is more pronounced (Ref. Terms of Reference for updating of the Technical and Feasibility studies for the construction of a Dry Port at Isaka, 2007:1-2). Box 9.1 – Dry port history
Intent. The Government of Rwanda, determined to reduce the transportation costs of goods to this respect acquired a land of 17 ha 50 Ares at Isaka35. The land is intended for the construction of transfer facilities to and from the railroad of goods passing the port of Dar es Salaam originating or destined to Rwanda, Burundi or the East of the democratic Republic of Congo. All efforts by the Government of Rwanda to develop the dry port terminal, including acquiring a grant of EUR 9 million were blocked in 1990 when war broke out in Rwanda. In December 2003 the Government of Rwanda revived the intention to develop the port as one of its priorities to set in motion a policy to cut down transportation costs of goods, and particularly to decrease the cost of the transportation by vehicles by at least 40 %. The dry port terminal, at around 450 km from Kigali, is to be facilitated with container storage areas, covered warehouses, depots for petroleum products, administrative buildings and fire fighting facilities. The Governments of Tanzania and Rwanda are in the process of joining their efforts to facilitate all the initiatives for construction of the port.
Dry port progress. The contract for a dry port feasibility study was signed in July 2008 between MININFRA and Consultants for a study period of seven months. A first progress report was submitted, amended and approved at the end of 2008. A second Progress report was submitted in January 2009, and is still under scrutiny. 35 Plot nº 75724, Isaka, April 6th 1984

Report on Collection of Existing Data
199 (274)
9.6 Air Transport
9.6.1 Overview High transportation costs. Rwanda is the most densely populated countries in Africa and one of the most worldwide. Agriculture has been, and is still is, its strongest sector as over 90 % of the population relies on subsistence agriculture. The country has embarked on a transition towards restructuring the economic sectors based on public sector and market reforms. In pursuit of these objectives, there is remarkable progress with respect to macro-economic stability, increase in food production, rehabilitation of industrial sector, rehabilitation of core infrastructure and in education and public health. The business environment, however, faces constraints because of the lack of human capital and even though remarkable gains have been made in ICT, there are still structural bottlenecks including high transportation and energy costs.
Development of core infrastructure. As a landlocked country, currently with no sufficient energy resources and difficult terrain, Rwanda faces problems in terms of addressing the identified structural bottlenecks. One of the themes underlying Vision 2020 is, thus, the refurbishment and development of the core infrastructure. In parallel with projected population growth and increase in GDP per capita, it is intended to enhance more socio-economic and trade activities including generation of more trips of persons and more import and export volumes of goods and products.
Figure 9.10 - Kigali City in relation to the location of new airport
Source: NININFRA, 2007:7 General situation of air transport in Rwanda. Rwanda air transport is still limited to two International Airports, namely Kigali International Airport and Kamembe Airport, and five aerodromes at Butare Town, Gisenyi, Ruhengeri, Nemba and Gabiro. Additional information concerning these airports and aerodromes is presented below (Table 9.9).

Report on Collection of Existing Data
200 (274)
Table 9.9 - Rwanda Airports and Aerodromes
Town Name ICAO Code
IATA Code Use Customs
Runway Type
Runway (m)
Kigali
Kigali International
Airport HRYR KGL Civ Yes Paved 4800
Butare Butare HRYI BTQ Priv No Paved 930
Gabiro Gabiro HRYO - Priv No Unpaved 800
Gisenyi Gisenyi HRYG GYI Civ No Paved 1070
Kamembe Kamembe HRZA KME Civ No Paved 1630
Nemba Nemba HRYN - Civ No Unpaved 1200
Ruhengeri Ruhengeri HRYU RHG Civ No Unpaved 1600
Source: Google website, Feb. 2009.
9.6.2 Kigali airport Existing Kigali airport. Kigali International Airport (KIA) is Rwanda’s serving principal air carrier airport and a key point of entry for international travellers. It is managed and operated by the Rwanda Airports Authority (RAR). The airport is located approximately 11 kilometres north-east of Kigali City Centre.
New airport. Moves to construct a new international airport are on-going. The planned site for the new airport is in the Bugesera area, around 26 kilometres south-east of the City. It is envisaged that the new airport shall be a full replacement for the existing airport for all scheduled passenger services and for all cargo operations.
Air transport vital role. The airport shall have a vital role in Rwanda’s air transportation network. Air transportation is seen as an important component of restoring Rwandan economic growth, particularly accommodating higher-value exports, business travellers and tourism. Transportation within Rwanda and internationally is still constrained by the country relief and by currently limited, poorly maintained land and water transportation facilities.
Choice of the new airport site. The choice of the site was done after ensuring the feasibility of the following key planning issues: Runway and taxiway layout; obstacle limitation surfaces; site constraints; terminal concept; apron layout; road and rail access; aircraft servicing installations; location of support facilities; security; and, environmental considerations.
Justifications to opt for a new airport: Air transport is currently one of the structural bottlenecks to economic development for Rwanda, as the existing international airport lacks the infrastructure to be fully International Civil Aviation Organization (ICAO) compliant and to provide the space to develop export opportunities through cargo development. The objectives of the Government of Rwanda for the new airports are threefold, to:
• assist the development of international air transport; • enhance Rwanda’s integration into the regional economy; and,

Report on Collection of Existing Data
201 (274)
• make the airport a regional transport hub and part of a proposed export-processing zone.
Justification for new airport. With respect to exports, Rwanda produces premium tea and coffee, the production of which is now being boosted by the introduction of high yield varieties. There is also scope for the non-traditional crops such as fresh cut flowers and fine fruits to be developed and exported through an airport with the appropriate facilities and connections to the desirable international destinations. As the service and other business sectors develop, particularly, banking, insurance and tourism, a boom in the passenger traffic, especially international passengers that the current airport could not be expanded to handle, is envisaged. As exports and business develop, they will need and be enhanced with the new airport. The new facility shall be a springing board to increased exports and regional inter-connectivity to ensure Rwanda’s development as a regional service centre. Box 9.2 – Existing airport limitations
Need for new airport. The location of the existing airport poses several physical restrictions to any further expansion, another compelling reason to look for a convenient site. The airside of the airport is composed of a single runway with a right angle taxiway to the terminal apron that serves all flights. The airside is deficient as it does not meet many of the ICAO standards. The site is severely restricted, and falls off steeply on all sides of the runway. The current apron was expanded during UN relief efforts in the late 1990s and early 2000s. It is small, has no nose-in aircraft parking, and is surrounded by blast fences to prevent jet blast from interfering with terminal operations. The apron area cannot be expanded due to terrain limitations. The site is being encroached upon by urban development, and expansion is not feasible given the current site constraints. Kigali City Centre is also a prohibited airspace - 1 nautical square mile to 11000 f. Above Sea Level (ASL) - and this presents some problems to the design of a missed approach for the current runway, as the city centre is directly in the path of any missed approach. As well owing to the nature of the site, if Kanombe is closed for any reason, there is no other airstrip in the area that could be used to service flights. In terms of air navigation facilities, the existing airport has sub-standard equipment including the control tower, radar that is not suitable for air traffic control purposes, and low intensity runway lights. Given the above analysis of the current airport site, there is need to consider a future international airport serving Kigali that is not developmentally restricted to growth as the economy of the country grows.
Current progress. The preliminary studies were completed in the mid 2008 and approved. Technical design study commenced immediately, and is ongoing. The accomplishment of the study is envisaged by within this 2009. According to the ‘New Airport Master Plan Report’ by a team of Consultants, led by OZ Architecture of US in 2007, the development of the new airport is envisaged in three phases:

Report on Collection of Existing Data
202 (274)
Box 9.3 - Proposed Implementation phasing
First phase: The first phase development is predicted on the current passenger forecasts, which indicate that the airport will grow to approximately 1.3 million passengers by 2025. This phase is, thus, designed to handle up to 1.3 million passengers per year and 180 aircraft movements in the peak hour. To serve this passenger volume only one runway is required along with facilities for the processing of passengers and cargo, and fuel depot to serve the aircrafts. Notwithstanding this, the site is expected to grow rapidly as the current forecast cannot account for the economic impacts anticipated in Rwanda’s Millennium Development Goals. Thus, several evolutionary stages of the airport are envisaged as its growth materializes. Intermediate phase one: The first plan of the intermediate phase is designed to serve up to 21 aircraft movements per hour and a passenger throughput of approximately 2.5 million passengers. It includes completion of the main access road from the “new” Kigali City centre and completion of the site access road to serve the southern area of the site. The completion of this access road is required to allow development of new cargo areas and some light industrial development along the western periphery of the site. Intermediate phase two: The second plan of the intermediary phase considers future development of the site to accommodate increasing growth, estimated at 42 aircraft movements per hour and a passenger throughput of approximately 10-12 million passengers per year. A major expansion of the passenger terminal, addition of a parallel taxiway and expansion of utilities are planned in this phase. Doubling capacity including rail access: The long-term phase of development envisions complete development of the site: Provision of a parallel runway and inter-connecting taxiway system, major expansion of the passenger terminal building, major expansion of utilities and the further development of light industrial and commercial areas, and cargo and aircraft servicing areas. It also sees the completion of the perimeter road system to provide an eastern entry to the site and to allow development to the east of the runway. This development shall allow for the processing of 82 aircraft movements in the peak hour and annual passenger throughput of 50-60 million passengers. During this phase, also development of major accesses to the airport site is planned. This is intended to include roads and a rail system that will provide access for cargo as well as the fuel supply for the airport and passenger transfer from Kigali and other points in the country. Two options of the rail connection are considered (Figure 9.11 below). Depending on the implementation of the main development orientations of Rwanda, which are intended to enhance the rate of socio-economic growth, the capacity demand of the new airport might be appreciably higher than the situation forecast for each phase of the airport development. The new airport has, thus, several evolutionary stages for development, which are purpose-designed for actual growth.

Report on Collection of Existing Data
203 (274)
Figure 9.11 – Major long-term accesses to the new airport site
Source: MININFRA, 2007:52.
9.6.3 Plan to improve other airports and aerodromes Improvement plan for the existing airports and aerodromes exist (RCCA Action Plan, 2008:3-9). Long-term plans are elaborated in details in the ‘Transport Sector Programme’ document, available in the Transport Sector Coordination Unit of MININFRA. These improvements are imperative for the profitable maximisation of this transport sub-sector.
9.7 Water Transport
9.7.1 Akagera River Navigability Study Preparing for multi-modal transport. According to the information obtained from the MININFRA Transport Sector Coordination Unit, plans are underway to conduct a feasibility and engineering study of the navigability of the Akagera River waterway, to permit multi-modal transport, ie rail/water/road, connections. The study is to be funded by the World Bank under the East African Trade and Transport Facilitation Project (EATTFP). The project is at the procurement stage for the studies, which are expected to commence early 2009 with final report availed by August 2009. Positive results of the study shall permit establishment of several multi-modal transport connections.
9.7.2 Construction of seven quays on Lake Kivu Overview: The transport project on Lake Kivu is a new initiative by the Government of Rwanda to develop public transport and tourism. It is an effort to find a solution to a critical transport problem, which has faced the landlocked Western Province for many years due to lack of a road network to link the Rubavu-Karongi-Rusizi zone. It is also an effort to enhance transport connections between Rwandan towns on Lake Kivu and those on the other side of Lake Kivu

Report on Collection of Existing Data
204 (274)
in the Eastern DRC. Another vision is that the project shall in future ensure coherence of the transport multi-modal connections in this zone taking account of the planned railway line from Isaka with a Branch to the DRC. Box 9.4 – Project aspects
Quays, ship building and management . The procurement process is ongoing for the selection of a consultant to conduct the feasibility and engineering study that is intended to accomplish the following main aspects to lead to the execution of the project: identification of sites for seven quays, necessary infrastructure and facilities for the quays and also for ship and boat building and associated detailed design; reassessment of characteristics of Lake Kivu with recommendations for suitable type of ship; preparation of all required design documents, proposal for origin of construction materials and equipment and estimation of cost of investment and execution period; proposal for most adequate project management method; projection of revenues and expenditures and proposal for a project business plan; and, Analysis of risks for this type of project with assessment of its environmental impact and proposal for attenuation measures for any identified problems.
The Government of Rwanda shall construct the quays, whereas building of ships shall be confided to the private sector. The intention is to construct two ships, the capacity in terms of passengers and cargo of which shall be determined by the study.
9.8 Policies and legal framework on transport Towards streamlining. After 1994, the Government envisaged transportation in the country as one of the factors affecting economic development. Different policies laws and regulatory documents have therefore all along been developed to streamline the transport sector.
9.8.1 National Transport Policy Background. The Ministry of Infrastructure, MININFRA, developed a National Transport Policy in 2005-6, a document that was elaborated by a consultant, CIMA International. The objective of the policy was to furnish Government with useful information for:
• adoption of pertinent strategies for development of the transport sector; • implementation of necessary mechanisms and tools for putting in place of
the adopted policy; • co-ordination and monitoring of the sector; and, • mobilisation of necessary resources to accomplish activities in the
implementation action plan.
Policy objectives. The 13 major objectives contained in the National Transport Policy are as follows. First, to define and put in place strategic transport network:
• identify principal production sectors and the flux of transportation of persons and goods; and,
• identify transport modes and most adequate transport lines to be rehabilitated or developed.
Second, develop an efficient transport network the following was considered necessary, to:
• develop and rehabilitate a road network of national interest - internal and international;
• develop and improve the rural road network;

Report on Collection of Existing Data
205 (274)
• develop and improve urban road network; • improve market accessibility and accesses to essential services; • increase capacity of international and national airports; • ensure control of air transport and efficiency of Civil Aviation Office; • evaluate technical and economic feasibility of extension of transport
lines with neighbouring countries like Tanzania; and, • evaluate economic feasibility of extending pipeline originating from
Mombassa to Kampala and finally to Rwanda. Third, ensure complementarities between transport services offered by the public and that offered by private sector to ensure a maximum service for the public interest. Forth, develop a professional and technical expertise so as to strengthen the involvement of the private sector in the transportation of persons and goods. Fifth, develop expertise of Rwandese private enterprises in the domains related to the transport industry - construction, maintenance, design of infrastructure and transport systems. Sixth, develop and put in place intermediary level means of transport especially for the rural areas. Seventh, promote more responsible behaviours in respecting the driving and navigation regulations through:
• introduction of regulatory dissuasive measures; and, • devising and put in place sensitization campaigns that are accessible to
all. Eight, provide safer infrastructure through:
• identification of and correction of problematic areas: • developing infrastructure that advantages a shared environment amongst
users; and, • bringing about required regulatory and legislative modifications. .
Ninth, improve safety of vehicles and transport facilities though: • putting in place permanent programs for inspection and maintenance of
vehicles; and, • harmonising technical norms through consultation with neighbouring
countries. Tenth, clarify duties and responsibilities of different stakeholders in domain through:
• finalising and put in place the institutional framework through consultation with all stakeholders;
• strengthening capacity of human resources; • developing and putting in place, operational support structures to Ministry
Operational Agencies; and, • developing information and communication technologies (ICT) in the
domain of Transport. Eleventh, ensure economical use of energy and reduction of pollution through:
• promotion of use of intermediary transport systems and more performing vehicles in terms of environmental arena; and,
• establishment of regulatory and finable measures against polluting emissions of vehicles.
Twelfth, reduce impact against natural and dwelling environments through: • establishment of measures that focus the attenuation of environmental
impacts of projects; and, • informing and encouraging population to participate in environmental
management in transport sector.

Report on Collection of Existing Data
206 (274)
Thirteenth, develop, in conformity with prevailing policy, a legislative and regulative framework adoptable in present and future contexts through:
• review of existing texts, and updating of them as may be necessary; and, • elaboration of regulatory list underlying transport policy.
Box 9.5 - Inspiration
MDG, Vision 2020 and EDPRS. The National Transport Policy is inspired by Rwanda planning tools, MDG, Vision 2020, EDPRS, National Investment Strategy and Sector Strategy of MININFRA. It is also influenced by aspirations in national and international documents policy documents on good governance and decentralisation, crosscutting issues such as gender equality, environmental protection and management and fight against HIV/AIDS. Moreover it takes cognisance of the action plan of the Sub-Saharan Africa Transport Policy (SSATP). Adopted by the end of 2008, Rwanda’s Transport Sector Policy is available in the relevant Government bodies, eg MININFRA.
9.8.2 Transport Master Plan 25 and 50 year timeframes: The Government of Rwanda, through MININFRA, intends to develop a National Transport Sector Strategic Plan, and to undertake a medium-long term transport Infrastructure Master Plan Study. Formulation and implementation of a National Transport Strategic Master Plan is deemed necessary, to operationalize the National Transport Policy. The strategy is supposed to translate the broad policy aspirations into time bound measurable activities. The study will be carried out in two phases: first, preparation of the National Transport Sector Strategic Plan adapted to the EDPRS objectives; and, second, the carrying out of the Transport Infrastructure Master Plan Study for Rwanda that shall entail transport demand and supply forecasts for a 25 and a 50 year time-frame, respectively, which takes into account the effects of anticipated future economic development and transport growth demand in the Rwanda. The execution of the study is at procurement level in the Ministry of Infrastructure.
9.8.3 Road Agency To execute road transport policy: MININFRA is at an advanced stage in the establishment of a Rwanda Road Agency, a technical execution agency that shall be particularly charged with the implementation of the road transport programmes. It is to play a key role in the execution of the road transport policy in synergy with the other agencies and offices of the sector. It is to be created in conformity with Rwandan laws governing creation of public establishments. The Agency shall operate as a semi-autonomous body under the Ministry of Infrastructure, and shall be bound by a performance contract with the Ministry.
9.8.4 Road Maintenance Strategy The Ministry has also elaborated and approved a document that puts in place a Road Maintenance Strategy (RMSD) whose goals are to:
• provide a policy framework to guide MININFRA Road Agency staff in maintenance programming, planning and execution of appropriate type of maintenance, be it emergency, routine, recurrent or periodic maintenance, or rehabilitation;
• ensure that investments in road infrastructure development are protected and rendered to deliver their maximum benefit; and,

Report on Collection of Existing Data
207 (274)
• allow all stakeholders to understand the investment decisions taken by MININFRA Road Agency.
This strategy will be modified and updated as changing economic and social circumstance dictate. 9.8.5 Road Classification A Draft Presidential Decree relating to regulation of the national road network and determining its reserve and its classification is in place and awaiting enactment. In the draft decree, the classification of the public road network in Rwanda is in principal done in accordance with their destinations and their significances. According to the decree, among about 14 000 km constituting the national network, only 4790 km constitutes classified roads as follows:
• National Tarmac Roads - 1075 km; • National Earth Roads - 1875 km; and, • District Roads (earth) - 1840 km.
The remaining 9210 km are unclassified roads. However the classification process should be dynamic so that the rest of the network is handled in the process.
9.8.6 The National Transport Development Board MININFRA plans to introduce in 2009 a National Transport Development Board, to co-ordinate both sectors and promote dialogue between the private and public sectors. The Board will encompass road, railway, water and air transportation. The establishment of this kind of single window institution is intended to handle better, services given to the public. The merging of government parastatals shall harmonise activities to improve the quality and ensure quick and timely public transport service delivery in the country for assured profitability and innovations.
9.8.7 Other issues envisaged by MININFRA
MININFRA envisage the following regulatory attention: • enforcement of appropriate standards and norms for construction and
maintenance of transport infrastructure; • axle load control started, to be extended to the entire paved network:
overloaded vehicles to be avoided; • weighbridges at border posts – software acquisition in process; • dissuasive regulatory measures - driving regulations being reviewed; • Vehicles Technical Inspection Centre operational; • transport safety policy and action plan to be prepared by 2009; • road safety education and sensitisation campaigns - media campaigns on
road safety issues; and, • transport database establishment – on-going activity.
Report on Collection of Existing Data
208 (274)
9.8.8 New Partnership for African Development (NEPAD)
Africa’s renewal. The New Partnership for Africa’s Development (NEPAD) is a Vision and Strategic Framework for Africa’s Renewal. Its Strategic Framework Document arises from a mandate given to the five initiating Heads of State from Algeria, Egypt, Nigeria, Senegal, and South Africa by the Organisation of African Unity (OAU) to develop an integrated socio-economic development framework for Africa.
The 37th Summit of the OAU in July 2001 formally adopted the strategic framework document. NEPAD is designed to address the current challenges facing the African continent. Issues such as the escalating poverty levels, underdevelopment and the continued marginalisation of Africa needed a new radical intervention, spearheaded by African leaders, to develop a new vision that would guarantee Africa’s renewal. NEPAD, therefore, intervenes in all sectors of socio-economic development. Rwanda is a member of NEPAD, and benefits from the following transport projects:
• Isaka–Kigali Railway line, which is supported by the African Development Bank (ADB) and the Belgian Government;
• two road corridors connected to Rwanda corridors, ie Corridor 1, connecting Mombasa–Malaba–Gatuna–Kigali–Goma in DRC and Corridor 2 connecting Dar es salaam–Rusumo–Kigali–Kanyaru, Burundi. and,
• great lakes railway project.
9.8.9 The Sub-Saharan Africa Transport Policy Program (SSATP)
Rwanda is a member of the Sub Saharan Africa Transport Policy Program (SSATP). SSATP is a unique partnership of: 35 African countries, eight regional economic communities; three African institutions, AU, NEPAD and UNECA; and, national and regional organizations as well as international development partners. All subscribing to the goal of ensuring that transport plays its full part in achieving the developmental objectives of Sub-Saharan Africa, ie, poverty

Report on Collection of Existing Data
209 (274)
reduction, ‘pro-poor’ growth, and regional integration. The Program is currently funded by the European Commission, Denmark, France, Ireland, Norway, Sweden, United Kingdom, the Islamic Development Bank, the African Development Bank and The World Bank. 9.9 Issues related to transportation 9.9.1 Roads Classification with all roads. A larger part of the road network in Rwanda, constituting around 66 % is unclassified. Yet these are among those that enable mobility from the main roads and other classified roads to the disadvantaged majority where vital activities and services are lacking. There are those of high economic and social importance that lead to mining, tourist, agricultural activities, light industries, and to social services. It is, thus, important that road classification is amended to include all roads to facilitate planning for their improvement. To this end, the national Land Use Master Plan may map roads with high economic and social importance in this category. Classification in accordance with the administrative status of roads (Article 6 of the Draft Road Classification Presidential Decree) - National Roads, District Roads, Rural Feeder Roads, Specific Roads and Urban Roads - brings more clarity. Surfacing of earth roads. 92 % of our network constitutes earth roads, most of which are in bad state. An extensive plan to tarmac these roads should be recommended by present project with prioritisation that takes account of roads with highest social and economic value, and those of important connections with sub-regional countries. Inadequate road standards. The geometrical design of most of roads is inadequate, resulting among other sub-standard features lie narrow widths. It is envisaged that, given the Government’s commitment to implement national development strategies, these roads shall no longer be adequate to accommodate the qualitative and quantitative expected growth in traffic in 10-15 years. They are unlikely, therefore, no longer to be commensurate with the pace of projected economic advancement, especially in the context of the East African Federation and the Regional Integration development visions. Highways if environmentally feasible to compliment rail transport. Opening up standard highways in Rwanda should be planned to adopt to all types of traffic load and volume and to the desirable vehicle speeds. It would be highly uneconomical to construct internal highways with ‘culs de sac’ within the country. It is recommendable rather to adopt the philosophy of highways that connect sub-regionally and, in turn, regionally, especially in coherence with the ‘Corridor’ roads. Through economic co-operation with the regional neighbours, it may be economically feasible to realise highways - as a compliment to rail transport - with harmonised structural and geometrical design for routes like Kigali-Kampala-Nairobi-Mombassa, Kigali-Bujumbura, Kigali-Dar es Salaam, Kigali-Goma and Kigali-Bukavu. A proviso for such a vision is that it is compatible with increasingly more stringent environmental requirements to curb greenhouse gases and global warming – a perspective that already makes rail transport increasingly more attractive and economically viable. Government may test the feasibility of concession of highways - provided environment friendly transport may not found for them - through the philosophy of Public Private
Report on Collection of Existing Data
210 (274)
Partnership (PPP). The latter, which works well in other countries, may be studied and adopted. Road Maintenance. Long lasting programs for the improvement and regular maintenance for feeder roads should be recommended by the Master Plan project. The maintenance of such roads should be decentralised responsibilities of the districts, with advisory and control from a technically competent organ like the National Road Agency. Maintenance of all other roads should continue to be assured by MININFRA, the City of Kigali and the Districts, respectively, for the National, City and District roads through partnership with Private Sector.
Urban vehicular, pedestrian and cyclist traffic. As urbanisation is one of the priority development elements of Rwanda, the present project should include proposals of development strategies for an efficient urban road network that is capable to enhance smooth urban mobility, especially for public transport purposes. A larger part of the existing urban road network is concentrated to Kigali City where, although possible, it is difficult and expensive to re-plan and implement better road systems due to the city’s high proportion unplanned and uncontrolled urban sprawl. Boundaries of other townships may be redefined by the Master Plan; and planning and implementation of road infrastructure programs shall be easier due to comparative low urbanisation level. A system of main arteries consisting of ring roads and radial roads should be adopted, as much as the topography shall allow. Vehicular bypasses both within the urban and sub-urban zones needs to be created - in combination with other means like car tolls, tax incentives/disincentives and improved public transport - to control nature and flows of traffic. Strength should be put in the separation of pedestrian, cyclist and vehicular traffic by planning safe pedestrian and cyclist facilities, including pedestrian and cyclist bridges and tunnels, pedestrian side walks and cyclist paths, pedestrian waiting platforms. At bus and taxi terminals, bays with pedestrian shades, etc, need to be provided.
Harmonisation of axial loads. The design and the service axial loads for Rwanda roads are 13 and 8 tonnes, respectively, whereas those for our regional neighbours are 10.2 tonnes and 8 tonnes. There is, thus, need to harmonise the design standards to synchronise the regional monitoring and control of traffic loads and serviceability of the roads.
9.9.2 Intermediary Means of Transport (IMT) As sited in the National Transport Policy Document (MININFRA, 2007:10), the common IMT in Rwanda is on foot and carrying luggage on the head. Mainly in the rural environment where the population is not much gender sensitive, the most affected by this mode of transport are women (Figure 9.12, below).

Report on Collection of Existing Data
211 (274)
Figure 9.12 - Common Intermediary Means of Transport
Source: MININFRA, 2007.
Another common means is the bicycle, which is also a difficult mode as only a limited load is possible given the hilly terrain in Rwanda. In several other African countries, animals of burden, like donkeys, camels and oxen, have proven to be an excellent alternative. A two-donkey or oxen pulled cart, for example, carries up to one to one and a half tones - depending on the terrain and the route roughness - a bicycle may carry up to 100 kg on a horizontal plane. A human head transports 20-50 kg depending on the strength of a person and the distance. In Umutara in the Eastern Province, a program to use oxen pulled carts in transporting agricultural produces and ploughing is in the making. An extensive program to make use animals of burden would make life easier to small-scale farmers in the rural areas to transport their goods - even human beings - along reasonable itinerary distances such as to market and wholesale places, from production to storage places, etc. This would only demand small improvements of some feeder roads and tracks to make them conveniently usable by this particular means of transport.

Report on Collection of Existing Data
212 (274)
Figure 9.13 - Illustrations of use of animals of burden as an IMT
Source: MININFRA, 2007:10.
9.9.3 Railways Safe and efficient. Railway transport is the most economic and safe mode of transport, given its capability of massive transportation of both goods and passengers, less maintenance expenses and less accidents as compared to road transport. A train may be less environmentally pollutant as compared with a number of trucks, for example, of the same haul capacity. Execution of the Rwandan railway project will highly contribute to the long term solution for country’s transportation problems, albeit the magnitude of the entailed initial investment. Several multi-modal transport connection options needs to be available for Rwanda - instead of the current inefficient only road option - to support envisaged necessary economic activities. In the regional context, transport may be highly facilitated along the ‘Central Corridor’. This new rail system and other rail line projects under conception in other EAC countries, especially Tanzania, Kenya and Uganda, included in the EAC Railways Development Master Plan shall be an alternative for trucks. Subsequently, Rwanda expects to significantly reduce high import and export transport cost, which is currently rated at 40 % the value of the import or export goods.

Report on Collection of Existing Data
213 (274)
9.9.4 Airports Short and long term improvement plans. In the New Airport Land Use Plan (MININFRA, 2007:7), it is stated that “Air transport is currently one of the structural bottlenecks to economic development within the country as the existing airport lacks the infrastructure to be fully ICAO compliant and to provide the space to develop export opportunities”. Thus, the development and improvement plan for Rwanda air transport system is imperative in consideration of domestic, regional and international needs. Part of it the implementation of the new International Airport program intended to allow for Rwanda to become the air transport hub of the sub-region. According to the Rwanda Civil Aviation Authority (RCAA) of 14th April 2008, plans are underway for 2008-9 to improve aviation safety, security, passenger facilitation, modernization and beautification for Kigali International Airport (KIA), Kamembe International Airport and Gisenyi Airport, and also capacity building for the RCAA. Parallel facelifts of other aerodromes to complement the above improvements, are meant to enhance other economic sectors especially mining and tourism industries.
9.9.5 Water Transport Economic and social benefits and inter-connectivity with other forms of transport. Strengthening of Lake Kivu transport is planned though a strategy for construction of appropriate quays - in both quantity and quality - and deploying ships of appropriate make capacity and safety. Its realisation is intended to provide economic and social benefits to Rwanda locally and sub-regionally. The current pace of development in tourism and industry amongst local towns situated on the shores of the lake is to be enhanced. Another envisaged benefit is the eventual inter-connections with other transport modes including those in DRC.
9.10 Energy
9.10.1 Background Government from provider to facilitator: The energy sector in Rwanda entered into a phase of reform in 1994. Whereas the role of the Government is to change from provider to that of policy formulator and facilitator, it still remains involved in the implementation of power projects. The objective is, however, to progressively move towards the establishment of a liberalized energy market, and to create a favorable environment for private sector investments in the energy sector. Among the mechanisms put in place to this end, was to set up the Rwanda Utilities Regulatory Agency (RURA) in 2001 as the organ for the regulation of the sector through the issuing of licences and the setting of tariffs. This meant to provide an adequate regulatory and legal framework for the energy sector. Since 2004 efforts have been made towards the elaboration of laws on electricity and gas. Both of them have already been passed by parliament.
Revoked government monopoly. It is in the context of the sub-sector’s restructuring, that the monopoly status of ELECTROGAZ - the main actor in electricity generation, transmission and distribution - was revoked in 199936. Today several independent power producers are involved in the Rwandan energy sector. In 2003, ELECTROGAZ management was entrusted to a private operator, who was meant to improve the enterprise’s technical, commercial and financial
36 Law No18/99 of 30/08/1999.

Report on Collection of Existing Data
214 (274)
situation. The contract was suspended, however, at the end of 2005 when management reverted to Government again. Box 9.6 – Stand-by diesel generators
Rented. In 2004 the electricity sector experienced an unprecedented crisis. This was due to a prolonged lack of investments in the sub-sector, i.e. the over-exploitation of the existing hydroelectric power plants and low rainfall. The crisis resulted in load-shedding37 throughout the country. It compelled Government to acquire and rent diesel generation units, as an emergency solution to attenuate the impact of the energy crisis on the national economy. Today power supply is stable without load shedding.
Main source biomass. Biomass energy is still the main source of energy in Rwanda, accounting for about 90% of the national energy balance. Currently Government is working towards diversifying its energy sources and reducing the use of biomass. This also includes the promotion of renewable energy sources like solar, geothermal and wind energy or biogas and the development of the methane gas resources in Lake Kivu for power generation. 9.10.2 Sub-sector profiles Rwanda has multiple energy resources. Energy projects that are currently focused on include:
• hydro energy; • bio energy; • fossil fuel, ie thermal energy; • natural gas; • solar energy; • aeolian energy; and, • geothermal energy.
9.10.3 Overview Unsustainable over-dependence on Biomass: According to the national energy mix, 90% of energy sources emanates from biomass, whereas 7 % is from hydrocarbons and 3% is principally sourced from electric power. Biomass is in turn sourced from firewood, charcoal or agricultural residues mainly for household cooking purposes. This strong reliance on biomass is predicted to lead to devastation of forest resources and accelerated land degradation if appropriate and sustainable management measures are not employed (Section 7 Ecology). Hydrocarbons in Rwanda are mainly used in the transport sector, and also for the production of electricity through diesel generators. 42 % of the electricity produced in Rwanda is produced by diesel generators (Figure 9.14 below).
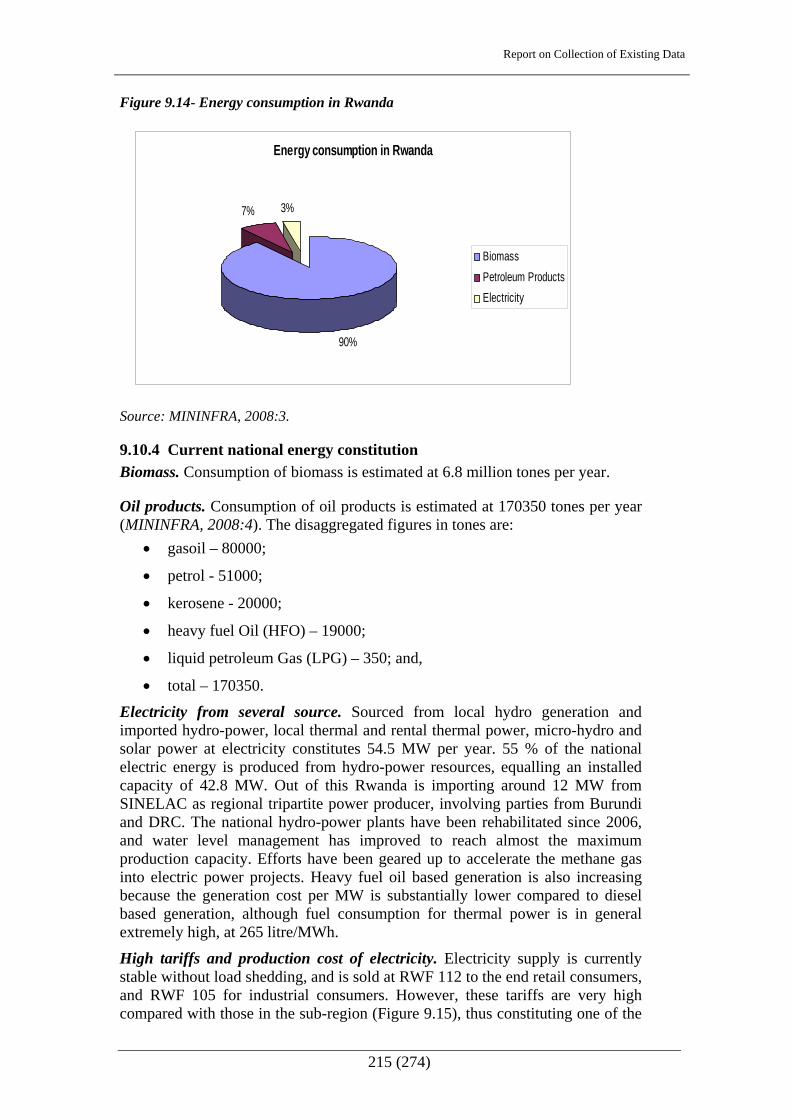
Report on Collection of Existing Data
215 (274)
Figure 9.14- Energy consumption in Rwanda
Energy consumption in Rwanda
90%
7% 3%
BiomassPetroleum ProductsElectricity
Source: MININFRA, 2008:3.
9.10.4 Current national energy constitution Biomass. Consumption of biomass is estimated at 6.8 million tones per year.
Oil products. Consumption of oil products is estimated at 170350 tones per year (MININFRA, 2008:4). The disaggregated figures in tones are:
• gasoil – 80000;
• petrol - 51000;
• kerosene - 20000;
• heavy fuel Oil (HFO) – 19000;
• liquid petroleum Gas (LPG) – 350; and,
• total – 170350.
Electricity from several source. Sourced from local hydro generation and imported hydro-power, local thermal and rental thermal power, micro-hydro and solar power at electricity constitutes 54.5 MW per year. 55 % of the national electric energy is produced from hydro-power resources, equalling an installed capacity of 42.8 MW. Out of this Rwanda is importing around 12 MW from SINELAC as regional tripartite power producer, involving parties from Burundi and DRC. The national hydro-power plants have been rehabilitated since 2006, and water level management has improved to reach almost the maximum production capacity. Efforts have been geared up to accelerate the methane gas into electric power projects. Heavy fuel oil based generation is also increasing because the generation cost per MW is substantially lower compared to diesel based generation, although fuel consumption for thermal power is in general extremely high, at 265 litre/MWh.
High tariffs and production cost of electricity. Electricity supply is currently stable without load shedding, and is sold at RWF 112 to the end retail consumers, and RWF 105 for industrial consumers. However, these tariffs are very high compared with those in the sub-region (Figure 9.15), thus constituting one of the

Report on Collection of Existing Data
216 (274)
hindrances to people accessing electricity. The main cause for high tariffs is the high production cost of electricity in Rwanda, especially thermal, on which the country is still largely dependent, accounting for 45% of the total electricity production. A comparative view of the production cost of electricity by source of energy shows that the production cost of electricity from thermal energy is about two times the cost from other sources (Table 9.10, below).
Small part of population with electricity: By the end of 2007 ELECTROGAZ supplied power to around 92000 customers, constituting 5 % of the population, mostly in urban centers with two thirds in Kigali and less than 1 % in rural areas.
Figure 9.15 - Trend of electricity tariffs in Rwanda
19901991
19921993
19941997
20042005
20062007a
2007b
0
20
40
60
80
100
120
Electricity tariffs 1990-2007
Years
Rw
f
Source: MININFRA, 2008:10. Sub-regionally high costs: Rwanda has one of the highest energy costs in the sub-region (except Uganda: Ref. Table 9.11). A unit cost of electricity generation in Rwanda per KWh (0.22 USD) is at average two and a half times higher than in neighbouring countries - Burundi, Kenya, and Tanzania (from 0.08 to 0.10 USD). Table 9.10 - Production costs of electricity in Rwanda by source
Source of electricity Production cost in USD Cents/KWh
Macro hydro power 3–7
Micro hydro power 7–9
Fossil fuel 25
Methane gas 6–10
Wind Around 9
Waste >10
Geothermal 9–10
Solar panel >10 Source: MININFRA, 2008:10.

Report on Collection of Existing Data
217 (274)
Table 9.11 - Household consumption of electricity in some neighbouring countries
GDP Level Tariffs HH Consumption GDP/cap HH tariff (USD
Cent/kWh) kWh/month
kWh/year Country
PPP Rural Urban Rural Urban Rural Urban Rwanda 899 21.5 21.5 21 102 250 1220 Ethiopia 806 3.3 4.3 77 924 Uganda 939 24.8 24.8 42 110 504 1320 Tanzania 1256 10.1 162 1944 Kenya 1699 4.0 7.6 169 2028 Malawi 785 6.4 3.4 22 250 264 3000 Lesotho 1285 8.0 293 3516 Cambodia 1806 >60 13 150
Note: PPP: Purchasing Power Parity. Source: MININFRA, 2008. Kigali dominates electivity consumption. 70 % of the nationally purchased energy is consumed in Kigali. Specific strategic interventions are currently being developed to increase access to electricity through extension of other national grid and through the establishment of isolated grids from micro-hydro plants and through decentralised energy sources such as solar energy for electrification of remote public institutions and households.
9.10.5 Vision 2020 and EDPRS initiatives Planned increase of electivity. Through Vision 2020 the Government envisages that 35 % of the population will have access to electricity network by 2020, and that by then Rwanda should have found ways to reduce the use of biomass energy down to 50 %. To achieve this, Government has earmarked the energy sector as a priority in EDPRS 2008-12. The objective of the five-year programme is to ensure that the energy sector significantly contributes to the long term socio-economic development and the reduction of poverty in Rwanda. Heavy investment in the energy sector is aimed at providing security in energy supply at a low cost. This is meant to be achieved through:
• increased energy supply capacity from 54.5 MW to 130 MW by 2012, mainly through generation of 50 MW more hydroelectric power and at least 25 MW from methane gas;
• strengthening of the transmission and distribution network by extension from 3300 km to 5000 km of high, medium and low voltage network and ensuring maintenance and sustainability of infrastructure and equipment;
• rise of electricity access rate to 350000 households to be connected by 2012 compared to 97000 households currently, plus connections to industries and public institutions - power to be supplied to all administrative centres and service delivery points, 50% of all schools and all health centres; and,
• revision of electricity tariff downwards by diversifying the local sources of energy, reducing technical and commercial losses of energy through ELECTROGAZ network - from 23 % to 15 % and 12 % to 5 %
Report on Collection of Existing Data
218 (274)
respectively, and popularising energy saving equipment such as improved stoves, energy saving bulbs, solar water heating systems and inverters (800000 energy saving bulbs to be distributed by 2012 to save 30 MW per year).
National Energy Development Agency: Implementation of a legal, facilitating, framework will start with the implementation of new electricity and gas laws. There is a plan for strengthening of the institutional and technical capacity of Rwanda by creating a National Energy Development Agency (NEDA) to implement national policy on energy, strengthening human resource capacity of institutions operating in the sector, and decentralisation of funding, planning, development and management of projects and programmes throughout provinces and districts. The implementation of the framework will entail:
• greater involvement of the private sector and decentralised entities;
• local community participation particularly in infrastructure maintenance;
• promotion of joint regional initiatives in the context of regional integration; and,
• enhancement of capacity and sector co-ordination mechanisms.
9.10.6 Electricity Transmission and distribution
Transmission figures: The electricity transmission network, which is under the mandate of ELECTROGAZ, has a two axis grid: Byumba-Kigali-Cyangugu and Gisenyi-Kigali-Kibungo. It consists of some 285 kilometres of 110 kilovolt lines and 64 kilometres of 70 kilovolt lines. The distribution system consists of both medium voltage, i.e. 30 kilovolt, 15 kilovolt, and 6.6 kilovolt, and low-voltage, ie 380 volt three-phase and 220 volt single phase, networks, with a significant proportion being located in Kigali and much of that is underground. The low voltage connection does not go further than 5 km from the grid in rural areas. Distribution figures: For the distribution network, there are two customer categories in the Rwandan power system – medium voltage (15-30 kV) and low voltage (380/220 V). The consumption was equally split between these two classes of consumers in 2004. 80 % of the low voltage consumers use prepaid meters, which is an advantage for the sector.
State of transmission and distribution in need: The transmission and distribution system is generally in a poor state, with substations in seriously lacking conditions. Distribution lines lack protection. Spare parts are scarce. There is outdated and incomplete information on the whereabouts of underground cables in Kigali that has resulted in frequent accidental damage. All those factors produce a serious deleterious effect on supply quality and reliability. Overall system losses are estimated to be approximately 35 %, with technical losses contributing about 23 % with commercial losses stand at 12 %. This rate of system loss is high by both international and African standards.

Report on Collection of Existing Data
219 (274)
Box 9.7 – Measures to improve transmission and distribution
Project to increase nnetwork coverage: In April 2008, ELECTROGAZ signed a co-operation agreement with the Tunisian power utility STEG to assist Rwanda in intensifying the electricity network at least cost. Tunisia has network coverage of 99, 5 %, whereas Rwanda has 5% as of 2008. This co-operation targets network coverage of 16 % by 2012.
Electricity network master plan to inter-connect across border: Currently, a master plan for the electricity network is being drafted and a National Electrification Prospectus is being developed with a necessary Investment Plan to be finalised by December 2008. The transmission network is to be extended to inter-connect Rwanda with its neighbouring countries. It will allow - through regional projects - the sharing of electricity within the East African Community and the Community of the Great Lakes Region countries.
Means to reduce costs for rural connections: So far, the electricity network is not well developed in rural areas. One of the reasons for high connection costs is that the population is living in a scattered settlement pattern. Short or longer term solutions to needs for rural area electrification may be either solar panels or a system of individual batteries chargeable at a main electricity station. The on-going collecting homesteads in imidugudu settlements should provide for better scale of economy and contribute to reduction of rural electrification costs.
Private sector involvement: Individual household connections and the distribution network are to some extent already outsourced to the private sector in Rwanda. A Number of private investors have also shown interest to power generation projects, mainly through the exploitation of Lake Kivu methane gas reserves. Other potential projects for private investment are in developing wind, geothermal and solar energy and prospecting for fossil fuel.
9.10.7 Summary of distributed electricity in Rwanda In house Hydro-electricity:
• Ntaruka - installed capacity 11.75 MW, available capacity 6 MW;
• Mukungwa - installed capacity 12.50 MW, available capacity 11 MW;
• Gihira - installed capacity 1.8 MW, available capacity 1.8 MW;
• Gisenyi - installed capacity 1.2 MW, available capacity 1.2 MW;
Imported Hydroelectricity.
• Rusizi1 (SNEL) - Installed capacity 3.5 MW, available capacity 3.5 MW;
• Rusizi2 (SNELAC) - Installed capacity 12 MW, available capacity 8 MW.
In house Thermal Electricity.
• Jabana - 7.8 MW.
Rental Thermal Electricity.
• Aggreko 1 (Gikondo) - 10 MW; and,
• Aggreko 2 (Mukungwa) - 5 MW.
Others.
• Nyamyotsi 1 micro hydro power - 75 Kw,

Report on Collection of Existing Data
220 (274)
• Kigali solar - 250 kW.
9.10.8 Potential electric energy principal sources The following are the potential electric energy sources on which the MININFRA Action Plan (2008) shall mainly base on towards the achievement of the EDPRS targets.
• Methane Gas Lake Kivu (350 MW;
• Geothermal Resources (170- 320 MW);
• Nyabarongo Hydro Site (27.5 MW);
• Rukarara (9.5 MW) Hydro site;
• Rusumo (81 MW) Hydro site; and,
• Rusizi III (205 MW) Hydro site. Figure 9.16 – Potential Energy Sources
1
NYABARONGOHYDRO SITE(27.5 MW)
RUKARARA (9.5MW)HYDRO SITE
METHANE GASLAKE KIVU
(350 MW)
Potential of Energy Principal SourcesPotential of Energy Principal Sources
RUSIZI III (205MW)HDYRO SITE
RUSUMO (81 MW)HYDRO SITE
GEOTHERMALRESOURCES
(170- 320 MW)
Source: MININFRA, 2008.
Report on Collection of Existing Data
221 (274)
9.10.9 Micro-hydro electricity Atlas and on-going projects. MININFRA has developed a Micro Hydro Atlas that has identified all potential sites for small hydro power plants. 333 such sites are identified with a capacity between 2-10 KW each. Studies and construction works for some of these sites have been undertaken and are at different stages of implementation. Box 9.8 – Micro-hydro sites and plants
Sites. Eight micro-hydro power plants, financed by GOR - expected to produce 6.35 MW - will be finalised by end 2009. They are (District in brackets): Ruhwa (Rusizi); Nyabahanga (Rutsiro); Nshili I (Nyaruguru); Rugezi (Burera); Mukungwa II (Musanze); Janja (Gakenke); Nyirabuhombo (Nyamasheke); and, Gashashi (Rutsiro).
PPP plants. Five micro-hydro power plants, developed under a Public Private Partnership scheme, partly financed by the Dutch government and with assistance of GTZ, that are intended to produce 1,6 MW in total and to be finalised by mid 2009 -studies underway.
Other plants. Five micro-hydro power plants with a total capacity of 5.15 MW, financed by Belgian technical co-operation are expected to start by end of 2008. Micro-hydro power plants of 600 kW are expected to start operating in 2008 are co-financed by UNIDO: Nyamyotsi I&II at 200 kW, completed and operational); and, Agatobwe at 200 kW, power available in June 2008; and, Mutobo at200 kW, commissioned in June 2008. The European Union is to finance micro-hydro projects with a total capacity of 3 MW with construction to start in 2009.
PPP plants. Five micro-hydro power plants, developed under a Public Private Partnership scheme, partly financed by the Dutch government and with assistance of GTZ, that are intended to produce 1,6 MW in total and to be finalised by mid 2009 -studies underway. Other plants: Works for five micro-hydro power plants with a total capacity of 5.15 MW, financed by Belgian technical co-operation are in the procurement stage. Micro-hydro power plants of 600 kW co-financed by UNIDO started operating in 2008: Nyamyotsi I&II at 200 kW (completed and operational); and, Agatobwe at 200 kW (power was available in June 2008); and, Mutobo at 200 kW (commissioned in June 2008). The European Union is to finance micro-hydro projects with a total capacity of 3 MW; construction scheduled to start in 2009. 9.10.10. Methane gas from Lake Kivu Renewable resource: Lake Kivu has an estimated 55 billion cubic meters of exploitable methane gas reserves usable as a domestic energy resource. The methane gas is dissolved at the bottom of the lake at a depth of 250-350 m. The rate of methane gas reproduction is estimated at 150 to 350 million cubic meters per year, assumed to be through decomposition of organic matter. The methane gas resources are shared between Rwanda and the Democratic Republic of Congo (Figures 9.17).

Report on Collection of Existing Data
222 (274)
Figure 9.17 - View of Lake Kivu
Source: Internet, March 2009. Figure 9.18 - Map of Lake Kivu
Figure 9.19 – Kivu methane gas extraction rig
Source of both immediately above figures: 2008..
Report on Collection of Existing Data
223 (274)
Gas-to-power pilot projects. The gas extraction technology is being tested in two pilot projects of gas extraction and electricity production on Lake Kivu:
a 4.5 MW project financed by Government started gas extraction in May 2008 - 2 MW is already being produced and connected to the National Grid - the plant is being constructed by Israeli, Ludan Overseas, in
Gisenyi; and, a 3.6 MW project is on-going on lake Kivu with financial support of Rwanda Investment Group.
Further concession negotiations on-going. Moreover, Government is now negotiating gas-to-power concessions with three other investors. First, USA based, Contour Global, is negotiating a 100 MW concession that is to be implemented in two phases starting with 20 MW. The concession was signed in September 2008. The project site is in Karongi District. Second, a consortium constituting the Government of Rwanda, Rwanda Investment Group (RIG) and Industrial Promotion Services (IPS) is equally negotiating for a 100 MW concession. Third, a European Investment Consortium, Global Energy Management, is negotiating a 50 MW concession.
In the ‘pipe-line. Other medium and long term projects are under study, i.e. liquid fuel, liquefied gas or fertilisers from methane gas. A share of a 50 MW equivalent of gas has been set aside for this purpose. Evaluation of proposals received by the government is underway. Exploiting methane gas is expected to eventually increase electricity production in Rwanda by 250 MW from 60 MW peak capacities today. Surplus electricity may be exported to our regional neighbours.
9.10.11 Solar energy Solar potential. Close to the equator, Rwanda enjoys a solar potential of 4-6 KWh/m²/day throughout the year. However the prevailing high cost of solar equipment suppresses the development of the sub sector. The solar energy sub-sector is divided into two categories, i.e. photovoltaic (PV) for electricity generation and solar thermal for heating purposes.
Photovoltaic Solar. PV solar panels are made from amorphous, crystalline, silicon. Amorphous panels do not convert as much sunlight into electricity as crystalline panels, but they are cheaper to make. Photovoltaic installations are available in two systems: the stand alone solar panel and the large grid connection system. The solar plant mounted at the peak of Mount Jali with installed capacity of 250 KW is rated the largest PV project in Africa. Power produced by the plant has been connected to the national grid. The solar system is jointly owned by a German utility company, Stadtwerke Mainz and the City of

Report on Collection of Existing Data
224 (274)
Kigali. The Ministry of infrastructure is looking into using solar system solutions for public institutions like schools, health centres and local administration offices in areas far from the electricity grid. Box 9.9 – Costly panels hamper market growth
Potential. Generally the high cost of solar panels has hampered the growth in the PV market. Nevertheless in rural areas, solar energy has great potential for use in government institutions and household electrification. This seems to be the optimum option due to the remoteness from the national grid lines. Currently, more than 90% of the rural population is not connected to the national electricity grid.
9.10.12 Thermal Solar Compulsory for urban construction: Solar water heaters have been introduced in the Rwanda, but on a very limited scale. They would enable the country to save electric energy to heat water. Moreover the return on investment for individual users is recovered only in about 4 year’s time. Government is currently working on a cabinet paper to make solar water heating installations compulsory on all new urban constructions, and has removed import duties on solar energy products as an incentive for investors and consumers. The solar energy sector is open to investors for example in setting up an assembly plants for solar energy panels and related accessories.
Government has envisaged solar projects. Different donors have pledged to donate solar electricity to a number of health centres, hospital and school institutions, especially in remote areas of Rwanda far from the national grid lines (Table 9.12, below). Table 9.12 - Quantitative presentation of institutions earmarked for solar power installation
No Donor Beneficiary Institution
1 AP/Columbia 4 hospitals and 9 health centres
2 Belgian Technical Cooperation
84 health centres - 2 started as pilot projects
3 USAID 34 health centres
4 Global Fund 37 health centres
5 European Commission
100 health centres, 100 schools, 150 sector offices
Source: MININFRA, 2008.
9.10.13 Biomass Fire wood. In Rwanda biomass is an important source of energy for the majority of the population. It represents 90 % of all the energy sources in the country mostly for domestic use for cooking. Consumption of biomass is estimated at 6.8 million tones per year. Wood energy is mostly used in the form of wood or charcoal. Use of other sources like peat or papyrus is still need to be developed.
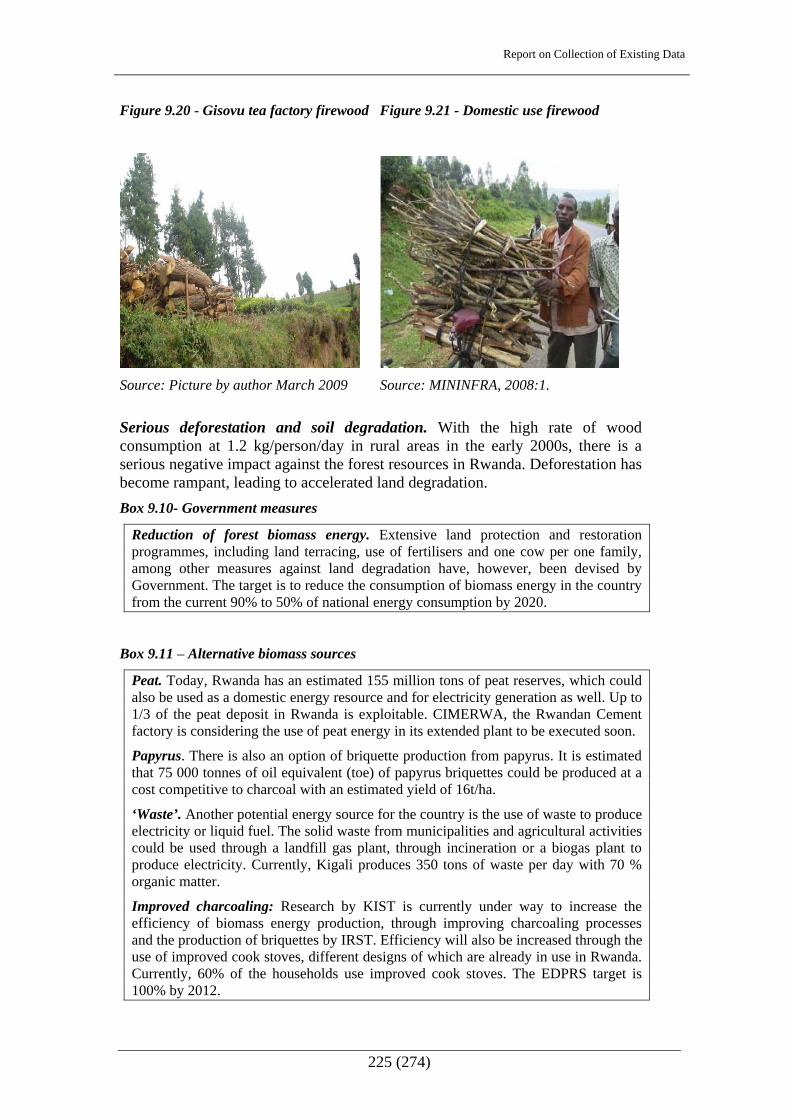
Report on Collection of Existing Data
225 (274)
Figure 9.20 - Gisovu tea factory firewood Figure 9.21 - Domestic use firewood
Source: Picture by author March 2009 Source: MININFRA, 2008:1.
Serious deforestation and soil degradation. With the high rate of wood consumption at 1.2 kg/person/day in rural areas in the early 2000s, there is a serious negative impact against the forest resources in Rwanda. Deforestation has become rampant, leading to accelerated land degradation. Box 9.10- Government measures
Reduction of forest biomass energy. Extensive land protection and restoration programmes, including land terracing, use of fertilisers and one cow per one family, among other measures against land degradation have, however, been devised by Government. The target is to reduce the consumption of biomass energy in the country from the current 90% to 50% of national energy consumption by 2020.
Box 9.11 – Alternative biomass sources
Peat. Today, Rwanda has an estimated 155 million tons of peat reserves, which could also be used as a domestic energy resource and for electricity generation as well. Up to 1/3 of the peat deposit in Rwanda is exploitable. CIMERWA, the Rwandan Cement factory is considering the use of peat energy in its extended plant to be executed soon.
Papyrus. There is also an option of briquette production from papyrus. It is estimated that 75 000 tonnes of oil equivalent (toe) of papyrus briquettes could be produced at a cost competitive to charcoal with an estimated yield of 16t/ha.
‘Waste’. Another potential energy source for the country is the use of waste to produce electricity or liquid fuel. The solid waste from municipalities and agricultural activities could be used through a landfill gas plant, through incineration or a biogas plant to produce electricity. Currently, Kigali produces 350 tons of waste per day with 70 % organic matter.
Improved charcoaling: Research by KIST is currently under way to increase the efficiency of biomass energy production, through improving charcoaling processes and the production of briquettes by IRST. Efficiency will also be increased through the use of improved cook stoves, different designs of which are already in use in Rwanda. Currently, 60% of the households use improved cook stoves. The EDPRS target is 100% by 2012.

Report on Collection of Existing Data
226 (274)
9.10.14 Biogas Programme. A National Domestic Biogas Program is in place, aiming at construction of 15, 000 biogas digesters by 2011, with support from the Netherlands Government through GTZ. The beneficiaries shall be households with at least two cows. Gas for cooking and lighting is to be produced. Two Pilot Projects - both meant to be implemented in the year 2008 - are in place, ie, construction of:
• 100 masonry digesters in Rulindo, Durango, Gasabo and Muhanga districts; and,
• 100 pre cast fiber glass digesters from China in different districts.
MINEDUC in collaboration with MININFRA is also looking into the viability of generating biogas from school toilets to be used for cooking and other purposes. 9.10.15 Wind Energy Wind atlas to establish potential. Since the demand for electricity is growing, it is imperative to diversify power source as much as possible. The Government is thus currently exploring the county’s wind power potential. A wind atlas is being developed. It will measure the wind regime over the period of one year in promising sites and the estimated exploitable wind energy capacity. The project is financed by the Belgian Government. The next steps shall include a pilot operation of setting up two or three wind turbines of 100 kW to 300 kW through funding of the European Commission. Box 9.12 - Untapped African potential
RSA, Egypt, Morocco and Tunisia. A turbine of 300 kW could be sufficient to supply more than 1000 households with electricity. Wind power would be a great solution for remote areas far from the national grid. Wind energy is economically much more viable than solar PV. In Africa only a few countries have so far been able to establish consistent exploitation of wind energy, namely South Africa, Egypt, Morocco and Tunisia, where a total capacity of 1000 MW has been installed to date. 9.10.16 Geo-thermal energy Hot spring. Another possible source of energy in Rwanda is geo-thermal. Rwanda possesses geo-thermal resources in the form of hot springs along the Belt of Lake Kivu - Cyangugu, Kibuye and Gisenyi. Preliminary studies conducted by Chevron in 2006 estimates the country’s geothermal potential to be around 200 MW, ie between 170-320 MW. Box 9.13 – Clean source of energy
No fossil fuel burning. Several attributes make geo-thermal good source of energy. It is clean because it can be extracted without burning fossil fuels, reducing dependence on the energy sourced from the same. It is environmentally friendly because it produces just one sixth of the carbon dioxide that a relatively clean natural gas fueled power plant produces.
Exploration studies on-going. Three sites with underground temperatures averaging to 150 °C in Cyangugu, Kibuye and Gisenyi are estimated to be potentially favorable for a medium to large geothermal power plant. The consultant Ken Gen is currently carrying out more detailed geo-physical and geo-chemical studies for exploitation. Exploratory drilling is expected to commence
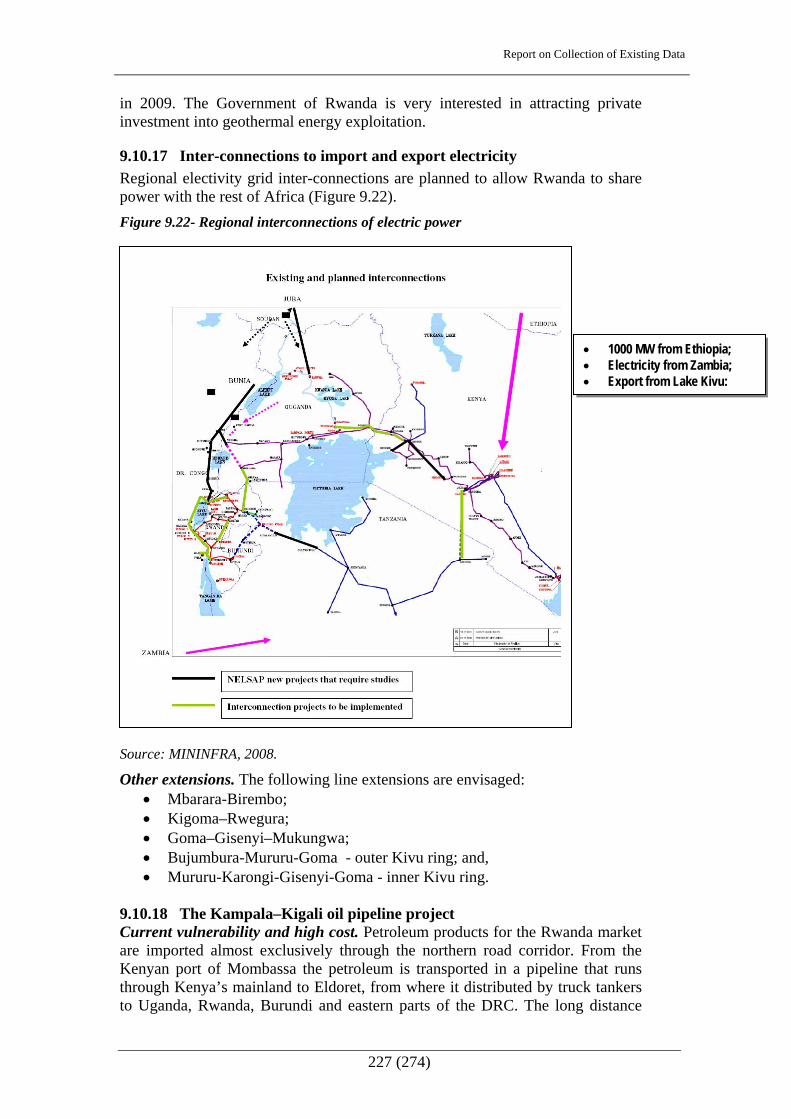
Report on Collection of Existing Data
227 (274)
in 2009. The Government of Rwanda is very interested in attracting private investment into geothermal energy exploitation.
9.10.17 Inter-connections to import and export electricity Regional electivity grid inter-connections are planned to allow Rwanda to share power with the rest of Africa (Figure 9.22). Figure 9.22- Regional interconnections of electric power
Source: MININFRA, 2008.
Other extensions. The following line extensions are envisaged: • Mbarara-Birembo; • Kigoma–Rwegura; • Goma–Gisenyi–Mukungwa; • Bujumbura-Mururu-Goma - outer Kivu ring; and, • Mururu-Karongi-Gisenyi-Goma - inner Kivu ring.
9.10.18 The Kampala–Kigali oil pipeline project Current vulnerability and high cost. Petroleum products for the Rwanda market are imported almost exclusively through the northern road corridor. From the Kenyan port of Mombassa the petroleum is transported in a pipeline that runs through Kenya’s mainland to Eldoret, from where it distributed by truck tankers to Uganda, Rwanda, Burundi and eastern parts of the DRC. The long distance
• 1000 MW from Ethiopia; • Electricity from Zambia; • Export from Lake Kivu:

Report on Collection of Existing Data
228 (274)
from Mombassa increases petroleum product costs, as well as vulnerability and dependence on Kenya. The latter was badly felt during the crisis in the last two months of 2008 when the only route was through Tanzania. Pipeline extension project. To increase supply reliability and minimise transport cost of imported petroleum, the Government of Rwanda has joined Kenya and Uganda in the East African oil pipeline project. Extension of the existing pipeline from Eldoret to Kampala was in March 2008, awarded to Tamoil Africa Holdings Ltd, through a concession contract, on a build-own and operate model. Rwanda is expecting to benefit from further extension of the pipeline from Kampala to Kigali (about 600 km). Discussions to extend the pipeline to Bujumbura are ongoing. Tamoil Africa holdings Ltd shall also soon start a techno-feasibility study on a Kampala-Kigali pipeline. A market survey by Science Applications International Cooperation (SAIC), by financial support from the US Trade Development Agency, confirmed the project’s commercial viability where the cost of current trucking shall be lowered from USD 56.89 to about USD 42.44 per cubic meter, hence easing the oil tariff structure. In the meantime a project to increase the current storage capacity of petroleum products in Rwanda of 175,500 m3 is under implementation. 9.10.19 Prospects for oil exploration in Rwanda Oil in Rift Valley. Rwanda has recently registered an increased interest in oil exploration - especially in the western Rift Valley in the country. The motivation is the recent oil discovery in the northern part of the Rift Valley in Uganda. Possible indications of oil below Lake Kivu. The presence of methane gas dissolved in the deep waters of Kivu, which originates partly from the earth crust, is interpreted by some experts as an indication of probable oil presence below the Lake sediments. A area under preliminary survey is the western part of Rwanda along Lake Kivu, covering 1631 km2 in area. After study of existing literature, the consultant Van Gold embarked on a satellite study of the lake that suggests that there are a number of oil seeps on the surface of Lake Kivu. The indications were positive enough to embark further on an airborne magnetic and gravity survey of the exploration area, which was undertaken in September 2008. 2086 km of airborne survey were recorded, and the data was analysed to indicate the size and nature of the sediment base under and around Lake Kivu. The results of the survey to be availed this early 2009. If all the indications for petroleum potential remain positive, Van Gold in co-operation with other partners will embark on a seismic survey within this 2009. 9.10.20 Bio-fuels Two avenues. There are basically two main bio-fuel avenues, which are currently pursued in other countries:
• ethanol, which can be used as a substitute for petrol or as a means of ‘extending’, imported petrol - it may be derived from sugar or sugar-related by products among other sources; and,
• bio-diesel which is produced from waste oils or from oil-rich crops such as oil palm, jatropha and pongamia.
Cautious approach: For landlocked Rwanda, the possibility of producing bio-fuels is worth exploring. However, the associated costs and benefits would also need to be scrupulously analysed. In countries where there is significant production of bio-fuels, it is normally supported with government subsidies or

Report on Collection of Existing Data
229 (274)
mandated production requirements that artificially enhance price. In a country like Rwanda, which cannot afford such measures - and where population density is relatively high and agricultural land is already intensively cultivated for other essential needs - further research will be needed before bio-fuels can be embraced as a significant element of policy and strategy. At this stage, therefore, the following rather cautious statement has been included in the Government’s Energy Policy Document to capture the national bio-fuels policy: “Encourage careful research to be conducted into the potential of large-scale bio fuel production in Rwanda taking into account not just the direct costs and benefits, but indirect opportunity costs particularly in respect of potential reductions in food crops and import substitution or export cash crops, the implications for use of water resources and the environment, net employment implications and a detailed risk analysis.” (MININFRA, 2008:15). On-going bio-diesel research. The Institute of Scientific and Technological Research (IRST) has been taking the lead on bio-diesel research. The Government should continue to support and encourage both public and private sector entities to conduct research and process development work in the field of bio-fuels. Box 9.14 - Ethical issue?
Question. In many other countries the raw materially used for the bio-fuels are food crops like sugar cane and corn. However, the fuel output is not proportionate with the used crop raw materials in terms of food value. In South America there is an outcry from the population against production of bio-fuels from crops. From 280 kg of maize for example only 50 l of bio diesel are produced. It is claimed that such production is not acceptable as the 280 kg could feed a child for the whole year (Recent Radio Rwanda emission).
9.10.21 Conversion of Methane Gas Promisin. In a bid to reduce dependency on conventional oil imports, new concepts to produce hydrocarbons locally are under discussion by MININFRA in partnership with the private sector. Proposals have been received from a number of investors. One promising endeavour is the conversion of methane gas from Lake Kivu into either liquid petroleum gas (LPG) or even diesel, which could be used to drive ordinary cars or other engines.
9.11 Water and Sanitation
9.11.1 Overview Divided responsibility. The water and sanitation sector has been undergoing reforms to streamline better results oriented practices. The water and sanitation policy document of October 2004 provides more information on water and water supply than on sanitation. Clearly, the sanitation sector is under-documented. The policy proposes a program based strategy for sector activities to provide more resources and results, notably the role of the private sector, citizenry and local government in providing services related to the sector. The management of sanitation sub-sector policy is currently the responsibility of the Ministry of Natural Resources (MINIRENA) and the service development and provision was recently transferred to the Ministry of Infrastructure (MININFRA).

Report on Collection of Existing Data
230 (274)
Newly adopted water and sanitation authority. A national water and sanitation authority, with a mission of distribution of potable water and installation and management of sanitation infrastructure has just been adopted by Government. This authority resulted from a proposal by the national provider of water and electricity to separate water and energy services. Other ministerial, major partners include: MINECOFIN, MINISANTE, MINEDUC, MIGEPROF, MININFRA and MINALOC. Public parastatals of ELECTROGAZ, RBS, REMA and RURA, decentralised entities, NGOs and development partners operate also in development of the water and sanitation sector. Environmental health, however, is under the responsibility of MINISANTE with the implementation framework defined under REMA.
Local government role. Waste water and solid waste management in urban areas is handled by particular local authorities, whereas the overall, supervisory, national role is with MINIRENA.
Conflict to resolve. There is a conflict of responsibility in the implementing structures, and laws have to be harmonised rectify this.
9.11.2 Water supply facilitation Urban areas. The public enterprise ELECTROGAZ is in charge of urban water supply in urban areas, including the capital Kigali and 10 other towns. There are 847 piped rural water systems in Rwanda and 19300 protected springs. Most of the piped water systems are pumped systems, as opposed to gravity systems, since in Rwanda many settlements are at higher altitude than the water sources serving them. Many systems serve a large number of villages: The largest ones serve up to 120000 people living in villages, many kilometers apart. Almost all users are served through water sales points where water is sold or given away for free by the bucket.
Rural areas. Services in rural areas are provided by community-based organizations (about 650 systems), by private operators under contract with district governments (about 140 systems) and privately owned systems (about 60), most of which have been privately owned since 2000. House connections are rare in rural areas. Investments in rural water supply and sanitation increased from USD 3.5 million in 2002 to USD 32 million in 2006. 9.11.3 Sources of water Spring water sources mainly apply in rural areas of Rwanda. Other supplies piped from lake, river or borehole sources (Table 9.13 below).

Report on Collection of Existing Data
231 (274)
Table 9.13 - Piped water sources in Rwanda
Name of the water treatment plant
Year of installation and extension
Installed capacity (m3/day)
Current production (m3/day)
Yanze and Wells 1981-88 30000 26106
Nyabarongo 2003 3500 3000
Karenge 1976-2008 3000-12000 4000
Kadahokwa 1982-2005 4450 1790
Gihira 1987 7400 4024
Mutobo 1987 12500 2162
Gihuma 1987 1930 639
Muhazi 1986-2004 1200 898
Cyunyu 1987 1320 1208
Mpanga 1984-2006 1100 800
Nyamabuye 1988 850 792
Rwasaburo 1986 760 529
Kanyabusage 1986 420 477
Gisuma 1987/2005 576 531
Gihengeri, Gatoki
1997-2000 3900 419
Total production 66166 39845
Source: ELECROGAZ website 8 March 2009.
9.11.4 Expansion and Strategic Plans The following projects are in pipeline to improve the production capacity of water in Rwanda:
• extraction of Nyabarongo underground water estimated at 40000m3/day to insure enough drinking water in Kigali and neighbouring areas;
• extension of Karenge water treatment plant to enhance water production to 40000 cubic meters per day;
• water catchment at Nyabugogo to solve problem of water interruption in Kigali by supporting Kimisigira water treatment plant to achieve water production of 21000 cubic meter per day;
• Cyuga and Gihogwe project to supply drinking water to inhabitants of Gihogwe and Karuruma;
• Byimana Project to supply water to the area of Kicukiro; • Nyarukombe project to supply water to the area of Kicukiro; • Kagara project to suppy water to the area of Remera; • Cyizanye project to supply water to the areas of Nyamirambo; • Binunga Project to supply water to Kibagabaga Hospital;
Report on Collection of Existing Data
232 (274)
• Increasing water supply in Huye town; • Project of water supply in Kabarondo; • Project to increase water production in Nyanza Town; • Upgrading Muhazi water treatment Plant to supply Kabarondo; • Upgrading the network of the lava region; • Rehabilitation of water supply for seven secondary cities that include
Muhanga, Rubavu, Gicumbi, Ngoma, Rwamagana, Karongi and Rusizi; and,
• a water supply project from springs of Ruhengeri to supply enough drinking water to Ruhengeri, Kigali, Bugesera and Runda areas.
9.11.5 Water treatment and distribution International standards in urban areas. ELECROGAZ provides drinking water to Kigali city and all urban centres of Rwanda. The water supplied by ELECROGAZ is treated according to international standards. The total distribution of water covers 79 % residents in Kigali and 62 % of residents in urban areas nationwide. Provision is to increase according to strategic plans. For the piped water, treatment is done in the respective plants for every water source (Table 9.13 above), whereas spring water - especially in the rural areas - treatment is done through normal chlorination. Thre are no data as to what extent international standards are observed.
9.11.6 Rain water harvesting initiatives To ameliorate current harm to springs: Rwanda has abundant rainfall and water resources, totaling five billion cubic meters per year, however, deforestation, erosion and untapped surface runoff affect the productivity of springs, which are the main source of water supply in rural areas. Government has embarked on rain water harvesting as one of the measures to attenuate surface runoff effects and save a significant quantity of piped water. There is therefore already a regulation from institutions down to individuals to capture and conserve rain water from roofs of buildings. No data were available as to the quantitative achievement of this programme.
9.11.7 Toilet ‘waste’ Problem.The forms of toilet ‘waste’ management in Rwanda ranges from public toilets of different kinds to selected area based water borne toilet ’waste’ arrangements connected to individual plot-localised septic tanks or common sewerage management plants. The technology employed, thus, varies from site to site, depending on terrain, age of neighbourhood, level of urbanisation, among others. The concept of providing public toilets, especially in commercial or public areas, is highly under-developed, and posses a hygienic challenge. MINIRENA has adopted fast-track measures to address this situation, and Eco-san systems are being piloted in selected urban areas to provide public toilets.
Kigali City. The capital Kigali, with a population of about one million people during the day, has the highest demand of pubic toilets in the country. However the situation is totally inadequate; there are no or limited public toilets in the city areas, and the City district mayors have this issue high on the agenda, to propose approaches to provide this facility. In October 2008, Nyarugenge district managed to put up a few public toilets in selected areas in this part of the City.
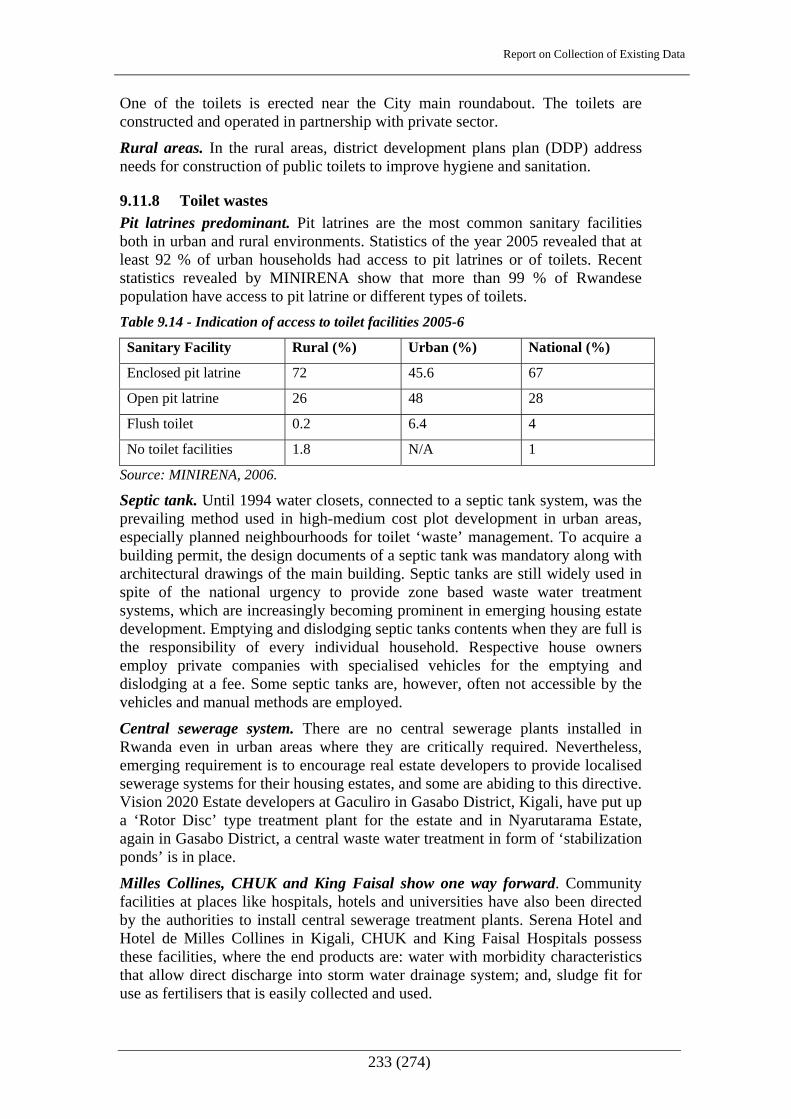
Report on Collection of Existing Data
233 (274)
One of the toilets is erected near the City main roundabout. The toilets are constructed and operated in partnership with private sector.
Rural areas. In the rural areas, district development plans plan (DDP) address needs for construction of public toilets to improve hygiene and sanitation.
9.11.8 Toilet wastes Pit latrines predominant. Pit latrines are the most common sanitary facilities both in urban and rural environments. Statistics of the year 2005 revealed that at least 92 % of urban households had access to pit latrines or of toilets. Recent statistics revealed by MINIRENA show that more than 99 % of Rwandese population have access to pit latrine or different types of toilets. Table 9.14 - Indication of access to toilet facilities 2005-6
Sanitary Facility Rural (%) Urban (%) National (%)
Enclosed pit latrine 72 45.6 67
Open pit latrine 26 48 28
Flush toilet 0.2 6.4 4
No toilet facilities 1.8 N/A 1
Source: MINIRENA, 2006.
Septic tank. Until 1994 water closets, connected to a septic tank system, was the prevailing method used in high-medium cost plot development in urban areas, especially planned neighbourhoods for toilet ‘waste’ management. To acquire a building permit, the design documents of a septic tank was mandatory along with architectural drawings of the main building. Septic tanks are still widely used in spite of the national urgency to provide zone based waste water treatment systems, which are increasingly becoming prominent in emerging housing estate development. Emptying and dislodging septic tanks contents when they are full is the responsibility of every individual household. Respective house owners employ private companies with specialised vehicles for the emptying and dislodging at a fee. Some septic tanks are, however, often not accessible by the vehicles and manual methods are employed.
Central sewerage system. There are no central sewerage plants installed in Rwanda even in urban areas where they are critically required. Nevertheless, emerging requirement is to encourage real estate developers to provide localised sewerage systems for their housing estates, and some are abiding to this directive. Vision 2020 Estate developers at Gaculiro in Gasabo District, Kigali, have put up a ‘Rotor Disc’ type treatment plant for the estate and in Nyarutarama Estate, again in Gasabo District, a central waste water treatment in form of ‘stabilization ponds’ is in place.
Milles Collines, CHUK and King Faisal show one way forward. Community facilities at places like hospitals, hotels and universities have also been directed by the authorities to install central sewerage treatment plants. Serena Hotel and Hotel de Milles Collines in Kigali, CHUK and King Faisal Hospitals possess these facilities, where the end products are: water with morbidity characteristics that allow direct discharge into storm water drainage system; and, sludge fit for use as fertilisers that is easily collected and used.

Report on Collection of Existing Data
234 (274)
9.11.9 Eco-sanitation Unknown entity: Eco-sanitation practices are not yet very much grasped in Rwanda. The system of ecological treatment of human end products of urine and faecal matter, is especially useful in rural areas where neither conventional nor modern ways of waste treatment are common, and where the treatment by products could be directly used a fertiliser.
Valuable products. It has been proven by scientists that urine when separated from faecal materials and diluted with the right proportion of water, results into impeccable fertiliser. Likewise the faecal materials if separated from urine - after separation it does not even smell - dries up quickly and may be safely composted with the right proportion of soil materials or other organic compost makes a fertiliser that is more efficient as compared with commercial ones. If processing of these end products is done correctly, the end products are hygienically safe to use. It does not require water and does not need a pit to be dug. Eco-Sanitation has been very much in use in other countries like China, and is today an alternative in many applications in rural Sweden.
Need for mind set change. For people to accept eco-san approach, it useful for them to first be sensitised about its virtues. is They may then they adopt this cyclic system, which returns the nutrients to the land where they originally came from. It does not pollute the aquifer or drinking water sources, and, thus, prevents diseases resulting from the effects of poor sanitation like diahorea, cholera and dysentery. A mind set change is, however, likely to be necessary for people to accept that human end products are a useful fertilizer resource (present report editor’ note).
9.11.10 Management of human end products in urban areas Lack of awareness of problem: Excreta collection in septic tanks and communal latrines discharged or disposed of – without much attention to where and how, with resulting environmental and health problems - by means of specialised vehicles or manual means. Most of the pit latrines are not lined, which results in serious environmental consequences of seepages from the latrines that ultimately contaminate natural water courses and ground water tables. The effect on health from poor sanitation, polluting the aquifer, is serious, and reduces productivity of people, especially women who tend to look after sick children.
Detriment to environment and health. There is absence of treatment infrastructure at the ‘final’ disposal sites of waste from the septic tanks. The untreated sludge is just pored on dugout open grounds – the practice of reference to Kigali City. This result in detrimental environmental pollution and health hazards to the population through propagation of the waste by storm water, seepage into the ground, flow on the ground, bad odours, breeding ground for disease vectors, etc. In many cases, untreated waste water from overflowing latrines and septic tanks and soak pits is directly discharged in storm water sewers and natural water channels with direct contamination and destruction of the ecosystem in rivers and flood plains. Algae growth observed at outfall points of streams flowing into River Nyabarongo is a testimony to this fact.

Report on Collection of Existing Data
235 (274)
Urgent address needed in urban and rural areas. Urgent measures and legal and legislative framework to address the problem of sanitation management in Rwanda urban centres in is a matter of urgency. For rural areas, there is no available information on methods of liquid waste treatment in rural areas. It is likely, however, that the situation warrants attention there also.
9.11.11 Industrial effluent Lack of information, There has been no data available regarding production, treatment of industrial effluent. However, the danger is that industries in Rwanda may be releasing their waste water in natural water courses and rivers with no prior appropriate treatment. Much more information needs to be sought regarding this matter. 9.12 Solid ‘waste’ 9.12.1 Production Urban area ‘wastes’. The range of solid waste produced in urban areas is much greater as compared to the rural environment due to high concentration of producers and diversification of activities. The constitution of urban solid waste is thus also diversified, principally composed of: a mixture of assorted organic materials, paper, rubber, plastics, fabric, leather, wood, coal ash, glass, metal, ceramics, and, clayey and concrete debris. Additionally hazardous wastes - corrosive, chemically or biologically reactive, or inflammable - are often produced especially in form of industrial wastes. Burning of wastes. For urban areas other than Kigali City, the information available is that localised dumping sites are used, - sometimes with burning of the wastes, be the produced gases toxic or not.
Rural area ‘wastes’. In the rural areas, on the contrary, the solid waste produced is almost wholly composed of organic, ie decomposable, materials. Currently, the household wastes are normally dumped in dug pits, backfilled when full, and, sometimes used as compost. The district development plans are emphasising that each household should have a ‘well managed dumpsite’ by 2012, which is the end of EDPRS period.
9.12.2 Collection and dumping No at sourse sorting. Solid wastes are normally collected in collaboration with the private sector. Contracted vehicle owners make house-to-house collection of domestic wastes at an agreed fee payable by each household. The wastes are dumped in a site, which is already overrun, at Nyanza, at a fee depending on the weight. Although there were some efforts to land fill at the site, the excess wastes still make it a sanitary danger, posing serious risks to human health and the environment, sometimes bursting into serious fires due biogas produced, propagation by wind or storm water and production of leacheate that flows into and contaminates watercourses.

Report on Collection of Existing Data
236 (274)
Figure 9.23 - Overrun Kigali City dumpsite at Nyanza
Note: Land filled part seen in foreground. Excess waste visible in far background. Source: Wikipedia, 7 March, 2009.
Figure 9.24 - Burning due to biogas formation
Note: Slid waste often burst into blazing fire due to bio- gas produced. Source: Wikipedia, 7 March, 2009.
Kigali City is currently investing in studies to propose a landfill site elsewhere that shall meet all engineering and sanitary requirements.
9.12.3 Separating Separation for different reason. More than 75 % of solid waste collected in Kigali City constitutes decomposable organic matter, which could be composted or compressed to make bio-waste fuel briquettes. The rest constitute non-decomposable and non-compressible matter like plastics, metal, glass and ceramics. An unorganised separation is done at the dumpsite, mainly by persons

Report on Collection of Existing Data
237 (274)
looking for pieces of reusable things like metal and plastics. It is not done for the actual purpose of recycling.
Purpose-separation. However, a project is in place, funded by the USAID/Rwanda that separates the organic matter, ie more than 75%, from the rest of the waste, and processes it into bio-waste fuel briquettes. Figure 9.25 – Separation of organic matter, compressing and briquettes
.. Note: Separation of organic matter from rest of the waste, machine compresses organic matter into bio-waste fuel briquettes and finished bio-waste fuel briquettes ready for use, respectively from left to right.
Source (all 3 figures): Wikipedia, 7 March, 2009.
Box 9.15 - Biogas from ‘waste’ could bring change
It is recommended at this juncture that further studies to be conducted by the City Authorities for the design of a new landfill site should ensure addressing inter alia, the biogas that is generated in the land filled waste, by including a component to tap it. This could be an alternative source of energy. Other countries (an example of Belgium) profit a lot much from this area. Job creation. Every process is done by hand except the compression of the waste done by a special machine. The project is run by community based organisations, associations and non-governmental organisations. It has been a good source of job creation, especially for the low income population of the City. The intended goals are to produce and sell of about 17855 tonnes of bio-waste fuel briquettes per year, creating 6360 jobs. The activity would save 95000 m3 of fuel wood, which is about 2.5 % of the current demand. The project is expected to save the City of Kigali 45550 tonnes in waste that has otherwise to be carried to the over-used dumpsite. This would save up to RWF 706 million (USD 1.50 million) in collection, transport and dump site costs. The project is a valuable mitigation to the environmental degradation and reduction of the leacheate contamination of local water supplies.
9.13 Information and communication Technology (ICT)
9.13.1 Overview Transform subsistence economy. As early as 1998 the Government of Rwanda initiated its ICT blueprint dubbed ‘An Integrated Framework for Socio-Economic and ICT Policy and Plan Development and Implementation for Rwanda’. After a series of consultative encounters with stakeholders and the general public, this document was fine-tuned and adopted in 2000. ICT was identified as a tool “…to transform a subsistence economy into an information-rich, knowledge-based one, and accelerate economic growth.”
Report on Collection of Existing Data
238 (274)
Enabling growth. Rwanda can make use of its people’s work capacity combined with new technologies to improve the efficiency at which its available resources are used, thereby achieving rapid growth. ICTs promote growth and development through attracting national and foreign direct investment and global business. Rwanda is implementing its National Information and Communication Infrastructure (NICI) Plan I and II, based on eight major areas that have been identified for strategic action:
• human resource development; • infrastructure; • e-government; • community access; • e-education; • foreign direct investment; • regulatory and legal issues; and, • private sector facilitation.
Producers and consumers of ICT. A major focus of the ICT policy is to develop a critical mass of local producers and consumers of ICT products as a means of fusing it into the core of national economic activities. The policy also seeks to widen access to learning opportunities to a larger segment of society while striking a balance between global competitiveness and locally relevant education and training. The government is also extending its ICT portfolio in a bid to improve the core functions performed by its agencies and local government decision-making processes through facilitation of information management and sharing. Hence the establishments by an Act of the Parliament, in October 2002, of the Rwanda Information Technology Authority (RITA) as the agency charged with the responsibility to articulate, catalyse and facilitate the implementation of national and sectoral ICT programmes outlined in the NICI Policy and Plan. Evidence of rapid growth. Substantial progress has been recorded during the past years in the area of Rwandan ICT, though imperfect and irregular. Although the ICT sub-sector is embryonic and still accounting for a relatively small share of the economy’s output, there is evidence of rapid growth. The Government’s push for ICT development resulted in the connection of 27 government buildings in Kigali to the fiber optic network backbone. The backbone is currently being expanded to other towns.
9.13.2 A Mile Stones in ICT Evolution OECD level. Through its national priorities on ICT, Rwanda already stands at the same level as the OECD states, high above the African average. Recently, the country broke fresh ground with regard to e-government and video conferencing to shorten travel expenses and to improve communication among and with District authorities. Another goal to be achieved in the near future is the introduction of new ICT related technologies such as Voice over IP and high bandwidth connectivity.
9.12.3 National ICT human resources 1000 students to Bangalore. The education sector is the key resource for human capacity building development in ICT. More than one thousand students were sent to Bangalore, in India, and the Kigali Institute of Science and Technology (KIST) was created in 1997 to fill the gap in professional IT Staff. The National

Report on Collection of Existing Data
239 (274)
University of Rwanda (NUR) in Butare has launched a Masters Degree program in ICT, and the first intake graduated in September 2007. Currently, all Higher Learning Institutions in Rwanda are providing a Bachelor Degree in Computer Science. Several vocational schools, which offer certificates in secretarial studies based on basic IT courses are now in place all over the country.
9.13.4 Telecommunication Increased mobile phone penetration. Mobile subscribers as percentage of all telephone subscribers have risen from 68.9 % in 2000 to 90.9 % in 2006. The mobile phone is becoming more and more the most used communication tool. From 2000-6, the number of mobile subscribers grew by more than six times. Both Rwanda Cell and Rwanda Tel are developing Internet wireless technology using GPRS and Wi-Max for the former and CDMA for the later (Tables 9.14, 9.15, 9.16 and 9.17 below).
9.13.5 Various indicators in ICT evolution Table 9.15 - Indicators of ICT infrastructure development
Source. NISR, 2006.
Figure 9.26 - Subscribers of mobile, fixed telephones and internet development
Source: NISR, 2006.

Report on Collection of Existing Data
240 (274)
Table 9.16 - Estimated level of computers usage by staff per sector
Source: NISR, 2006.
Table 9.17 - Estimated level of internet usage by staff per sector
Source: NISR, 2006.
Figure 9.27 - Percentage of educational institution with internet, website and teachers using PC at home
Source: NISR, 2006.
Figure 9.28 - Percentage of health institutions with PC, internet and website

Report on Collection of Existing Data
241 (274)
Source: NISR, 2006.
Figure 9.29 - Percentage of ICT indicators urban vs Rural
Source: NISR, 2006.
Some figures. Extracted from statistics (Figure and tables in the above sub-sub-section), the following may be observed regarding ICT users in Rwanda:
• UN System reports the highest level of ICT intensive usage with 85 % - NGO sector comes in second position with 68 %;
• public sector is performing more than the private sector with an intensive usage rate of 59 % versus 50 %;
• UN System reports the highest level of Internet intensive usage with by 100% - NGO sector comes in second position with 45%, public sector third with 26% and 23% for the private sector;
• private schools and institutions have better access to internet with 38% versus 26% to public sector schools and institutions;
• public schools have a better rate of 18 % regarding web presence versus 13 % for private schools;
• public institutions in health sector have a better penetration rate of PC with 100 % versus 65 % to private sector;
• private sector in health institutions performs better than public sector regarding health sector internet access with a rate of 42 % versus 22 % for the public sector; and,
• urban rate for ICT indications on radio, phones and PC is much higher at 61 %, 14 % and 0.8 %, respectively, than the rural side with respectively 40 %, 0.6 % and 0, 01 % - this gap is due to access facilities like electricity and mobile network coverage with a higher density in urban then in rural.
Report on Collection of Existing Data
242 (274)
Box 9.16 - ICT Specific Projects
Karisimbi Communication Tower Project. The overall objective of the project, which is located at one of the highest mountain summits in Rwanda at Karisimbi, is to enhance electronic communications and broadcasting capabilities in Rwanda and the neighbouring countries. It intends to provide low cost, high-capacity communications capability for both rural and urban areas, and to expand coverage for mobile phones, internet, and TV/FM radio and access to beneficiaries. The project also seeks to provide sky safety and surveillance capability through a Communication Navigation Surveillance - Air Traffic Management (CNS-ATM), already endorsed by the Common Market for Eastern and Southern Africa (COMESA).
Halving of communications costs. Electrification at the summit and preliminary demonstration tests for digital broadcasting (DVB-T and DVB-H) are already accomplished. One major achievement of the project is the lowering of the cost of international bandwidth from about USD 3500 per MB/month to USD 1,500 per MB/month. A number of selected rural schools and hospitals have been connected with DVB-T/H and Broadband Internet services through Karisimbi. Once fully operational, it is expected that the cost of communications in Rwanda will come down on average by a factor of about 50 %. Once the proof-of-concept phase is through, the project intends to offer various e-application services on its network, among them: virtual tourism, e-learning, e-health, e-commerce, e-government, and tracking and surveillance of goods on transit. Emergence of Broadband Fibre Optical and wireless technologies in Rwanda offer Karisimbi a unique opportunity.
Objectives of Karisimbi Project. The main objectives of the Karisimbi Project is to enhance broadcasting capabilities in Rwanda and the region, including digital broadcasting with activities to:
• provide high-capacity, low cost communication capability for both urban and rural areas;
• expand mobile phone coverage and TV/radio receivership (including national TV and FM radio coverage);
• provide a backbone for multi-connections hub for Internet services, including WiMax and cell-phone-based Internet capabilities, eg through CDMA, GPRS/EDGE, etc;
• take advantage of the leap in telecommunication industry;
• promote Sky Safety Vision and Communication Navigation Surveillance - Air Traffic Management; and,
• support various e-applications (eg, virtual tourism, e-learning, e-health, e-commerce, e-government, tracking and surveillance of goods on transit, etc.
9.13.6 The ICT Bus Project Mobile telecentre. The ICT Bus Project - an initiative being implemented by the Rwanda Information Technology Authority (RITA) through the e-Rwanda Project – is to act as a mobile telecentre to help bridge the digital divide affecting the rural populations of Rwanda. It is intended to be a mobile computer lab that will benefit farmers, traders, students, women, youth groups, entrepreneurs and other rural based Rwandans. The project is to be managed by RITA in close

Report on Collection of Existing Data
243 (274)
collaboration with the Private Sector Federation - an umbrella organization that stands for the private sector in Rwanda.
BDS and ICT facilities. By moving from one area to another, where BDS and Telecentres are not available, the ICT Bus is to provide ICT and business development services and solutions similar to what Telecentres and BDS centres provide. The ICT bus will be a mobile telecentre as well as a mobile BDS with ICT facilities. The Project will be of great importance in that the distance to service delivery, digital divide and lack of access to ICT will be highly reduced. It will also enable the provision of training to rural people including school children and teachers and will provide wider access to information and encourage usage of ICT as a tool for innovation, competitiveness, productivity and efficiency of SMEs, farmers and entrepreneurs in rural areas. Figure 9.30 – Interior of ICT bus
Source: NISR, 2006b:20.
Some figures. Extracted from statistics (Figure and Tables in the above sub-sub-section), the following may be observed regarding ICT users in Rwanda:
• UN System reports the highest level of ICT intensive usage with 85 % - NGO sector comes in second position with 68 %;
• public sector is performing more than the private sector with an intensive usage rate of 59 % versus 50 %;
• UN System reports the highest level of Internet intensive usage with by 100% - NGO sector comes in second position with 45%, public sector third with 26% and 23% for the private sector;
• private schools and institutions have better access to internet with 38 % versus 26% to public sector schools and institutions;
• public schools have a better rate of 18 % regarding web presence versus 13 % for private schools;
• public institutions in health sector have a better penetration rate of PC with 100 % versus 65 % to private sector;
• private sector in health institutions performs better than public sector regarding health sector internet access with a rate of 42 % versus 22 % for the public sector;

Report on Collection of Existing Data
244 (274)
• urban rate for ICT indications on radio, phones and PC is much higher at 61 %, 14 % and 0.8 %, respectively, than the rural side with respectively 40 %, 0.6 % and 0, 01 % - this gap is due to access facilities like electricity and mobile network coverage with a higher density in urban then in rural.

Report on Collection of Existing Data
245 (274)
10 Land Use and Development Planning 10.1 Introduction Focus on urbanisation. This section accounts for the current situation of land management in Rwanda, which include land administration and institutional framework together with laws and regulations that govern the use of land. It focuses on urbanisation. It is viewed as population growth in urban areas with their effects, accepting that there would be no sustainable development without sustainable urbanisation. The section also addresses current housing situation with major emphasis on recent government strategy of establishing human settlements that meet criteria of environmental viability through the reorganisation of national space to accommodate appropriate land use systems for agriculture and other economic activities. Also put into consideration is urban and rural infrastructure, which facilitates both social and economic development, and spatial planning, which refers to physical organisation of space through distribution of people and activities.
10.2 Land Use Management
10.2.1 Vision 2020 Organisation of land of vital importance. Land use management is a fundamental tool in development according to Vision 2020. As Rwanda is characterised by acute land shortage, land use and development planning is of vital importance to ensure land use and development planning ensures optimal land utilisation in both urban and rural settings. Currently, the country’s land resources are utilised in an inefficient and unsustainable manner. To address this, appropriate land legislation to provide for security of tenure, among other important land related rights and issues are to be instituted (Vision 2020, 2000:14).
10.2.2 EDPRS Priorities in the area of land management include establishing land institutions, land registration mechanisms and land use planning, through a land use and management master plan. Procedures will be developed and documented to manage existing land folders and the land database that will facilitate the nationwide implementation of land tenure regularisation. Women’s rights to land and other properties will be recognised and strengthened, regardless of their civil status, that is, whether they are single, married, divorced or widowed (MINECOFIN, 2007e:96).

Report on Collection of Existing Data
246 (274)
Table 10.1 - Projected land use planning
Sector 2008 2009 2010 2011 2012 l land use master
plans developed and operational to guide land use management decisions at national level
land use master plans developed and operational to guide land use management decisions at decentralised levels
existing land rights secured through land tenure regularisation for effective land administration and land use management
and adminiLstration simplified to protect land rights and facilitate investments in land
institutional framework established and operationalised
Source: MINECOFIN: 2007.e
10.2.3 Urbanisation Policy Improved land management. Urban land management tools and mechanisms are to be adopted in a programme with the aim of improving and rationalising urban land management through:
• most precise possible assessment of needs in building plots;
• exhaustive inventory of public land reserves;
• systematic census and monitoring of any building plots allocated but not developed within required deadlines and their reallocation; and,
• strictest collection of rent on land and establishment of some penalty tax system in order to incite people to develop their building plots.
This programme will also aim at ensuring the security of land tenure through systematic registration of plots allocated in urban areas. It will also be used as a framework for the development and implementation of simple urban management tools and mechanisms adapted to the needs of urban centres (MININFRA, 2007:16).
10.2.4 Land policy, laws and regulations Land central. Given that the Rwandan economy is primarily agrarian, land has a central position at the highest level of policy in the country. Article 29 of the national constitution reiterates every individual’s right to private property that inviolable, only to be interfered with in the public interest, subject to circumstances and procedures determined by law.
Land policy. Within the framework provided by the constitution a national land policy was developed and promulgated in 2004. The key principles underpinning the national land policy are premised on a conception that:
• land is a common heritage for past, present and future generations;
• all Rwandans enjoy the same land access rights without any discrimination whatsoever;
• land tenure and land administration should guarantee security of landholders with title deeds and should ensure optimum development of land;

Report on Collection of Existing Data
247 (274)
• determination of the real purpose of land and information about land are a pre-requisite to good management and rational use of land, which is the basic element of development and source of life; and,
• protection of existing fragile zones that are of national interest;
Necessary land management in Rwanda needs to entail a purpose-designed, comprehensive, land use planning system, including organisation of human settlement and consolidation of small plots for more economic and productive use of land. A strong and well-defined legal institutional framework is, thus, an absolute pre-requisite for successful implementation of a national land policy.
Legal and administrative instruments in support. To aid operationalising of the national land policy, a number of legal and administrative instruments have been developed among which is the Organic law No.8/2005. This law, entitled Organic law determining the use and management of land in Rwanda, aims to improve security, aid national unity and reconciliation efforts, and facilitate the development of an equitable land market in the country. Prior to the enactment of this organic law, the overwhelming majority of landholders were presumed to hold land under some form of customary system or informally – a small minority having what would constitute a legal interest in their land holdings by virtue of possessing a land title issued under the civil code introduced during the colonial era. In essence, the new organic law will seek to harmonise and unify land tenure systems in the country so that all Rwandans may hold land under the same legal framework. This way written land law will be extended to the hitherto excluded customary and informal land holders. What this new dispensation implies is a need to ensure access to land titles by all landholders and this is planned to be effected through a mandatory nationwide systematic registration of land.
Three forms of land tenure. The Organic land law recognises three forms of land tenure: private or individual land; state land; and, municipalities/town/district land.
Private or individual land. Private or individual land, includes both land acquired through customary channels and that held under written law, ie the civil code. All those with verifiable customary rights to land shall be issued with ‘emphyteutic’ leases once registered, with land under agricultural use receiving over 99 year leases and shorter for other land uses. Land currently held under written law under existing absolute titles will be upheld by the organic land law. Under the law, there will be continued issuance of absolute titles, depending on the nature of developments or set investment criteria. Importantly the law makes it mandatory to register title to land and all title transfers.
Public and private state land. Whereas state land generally refers to land held by the state, two categories are distinguished, ie public state land and private state land. Public land, on the one hand, is land held by the state, but reserved for public purposes and environmental conservation. This land shall have no commercial properties, and can only be made available for other uses by an act of Parliament or Order of the Prime Minister. Private state land, on the other hand, is also owned by the state but the nature of holding is similar to individual land ownership. This land includes any vacant land and land expropriated for public purposes or land bought or received as a gift by the state. Unlike public state land, private state land can be
Report on Collection of Existing Data
248 (274)
leased to private individuals and transferred to absolute title as provided for by the new land law.
District, town and municipal land. District, town and municipal land is in many ways similar to state land, only that it is held by sub-national state organs. Like state land, district/town/municipal land is divided into public and private domains. The public domain includes land reserved for public activities, buildings, infrastructure and collective settlements, whereas any other local authority land falls under the private domain. Box 10.1 – Organic land Law provisions.
Minimum size sub-division to prevent fragmentation. The organic land law makes wide ranging provisions on the administration and management of land in Rwanda, and to get it operational will require several orders and supplementary legislation on aspects such as land consolidation, expropriation, use and management of wetlands and informal settlements. The National Land Reform Project, funded by DfID, has been assisting with drafting some of these. One of the issues the organic land law seeks to address is the rampant fragmentation of land, mainly borne out of increased population and inheritance practices prevalent in Rwanda’s countryside. The law prohibits subdivision of agricultural land parcels to less than a hectare, and subdivision below five hectares requires permission. Generally it is government policy to discourage further fragmentation of land and instead promote consolidation.
Land sharing programme. It is only in the Eastern province where well-to-do individuals hold significantly large chunks of land, most of which are largely underutilised. Spearheaded by the President of Rwanda, there has been a land sharing programme since the beginning of 2008 to try and redistribute the land that was hitherto in the hands of a minority. In principle the programme sought to take away some of the land from those holding more than 25 ha and allocating to the many landless households. Stringent criteria for the exercise were drawn up and the exercise is being led by a specially created taskforce assisted by local government institutions in the areas concerned.
10.2.5 Land administration structures Decentralisation. Like in other sectors, the Government has sought to decentralise land management functions in the land sector to the lowest administrative echelons. The main policy making functions, co-ordination and strategic guidance remains with the Ministry of Natural Resources (MINIRENA) at the national level, whereas delivery of land-related services have been decentralised to the district and lower levels of administration. The Organic Land Law provides for the various land management institutions (Box 10.2, below).

Report on Collection of Existing Data
249 (274)
Box 10.2 – Land management institutions
The ministry with land in its attribution. The ministry with land in its attributions, which is currently the Ministry of Natural Resources (MINIRENA), is responsible for policy matters, exercising its authority through ministerial orders that spell out regulations and procedures in various facets of land management and administration. The ministry will maintain political responsibility over the National Land Centre, providing political accountability to parliament and Cabinet on behalf of the Centre, and channelling the Centre’s budget through the approval process set out by law.
The National Land Commission. The Land Commission at the national level shoulders the primary responsibility for overseeing the implementation of the Organic Land Law and promoting, through consultation and advocacy, the national land policy. The National Land Commission is also responsible for overseeing the National Land Centre, district land commissions and district land bureaus besides promote At sub-national level, land commissions also exist at the district while the Sector and Cell have land committees.
The National Land Centre (NLC). NLC is a newly created institution, not only to act as the technical arm of the ministry in charge of lands, but also oversee service delivery related to spatial planning, survey and land administration. The National Land Centre also has the overall responsibility over land registration across the country. The centre is expected to set standards for land administration in the country, advise and support the district land bureaus, prepare national land use maps and offer guidelines for land use planning across the country. The Centre is headed by a Director General, who is also the Registrar of Land Titles. As Registrar of Land Titles, the Director General of the NLC is deputised by five Deputy Registers, each for the four provinces and the city of Kigali. While the Director General is responsible for the day-to-day administration of the Centre, the National Land Commission is charged with providing strategic stewardship and oversight over the organisation.
The District Land Bureaux. The functions of the National Land Centre are decentralised to the district level through district land bureaux. Provided for by the Organic Land Law and established by Ministerial Order, district land bureaus are at the forefront of delivering land use planning and land administration at the town, municipality and district levels. The district land bureaux is headed by the District Land officer, who acts as the public notary for land by certifying applications for land, maintaining the cadastral index maps and recording all land to be registered on behalf of the Office of Registrar of Land Titles. Like the parent National Land Centre, district land bureaus are under the oversight of District Land Commission. The district land commissions are answerable to the district council on administrative matters and to the national land commission on technical issues. The presidential order putting in place land commissions also makes provision for sector and cell land committees to assist the commissions. These committees will mainly collect information, undertake public sensitisation on policies and laws related to land, witness land transactions in their areas of jurisdiction, and channel public views on spatial development plans and planning applications.

Report on Collection of Existing Data
250 (274)
Figure 10.1 - Diagram of land administration organisation
National Land Commission
NLC Director General and Registrar of Land Titles
10.2 Development Planning
10.3.1 Introduction Competing land uses. Development Planning is a method that makes the implementation of spatial plans, visions and projects the central consideration. It involves the management of the competing uses for space, and the making of places that are valued and have identity. These activities focus on the location and quality of social, economic and environmental change, it is concerned with promoting sustainable forms of development, understanding rapid urbanisation and encouraging innovation in the policy, planning and management responses to the economic, social and environmental development of cities and regions.
Purpose of development planning. The objective of development planning is to allow initiatives by the public, companies, community organisations and authorities to be carried out more often and in a better way. This is achievable by making earlier allowance during planning for the actual implementation of the plans. It also means giving centre stage to the opportunities that exist in an area rather than making rules and procedures the dominant consideration. Development planning is necessary to improve entire areas and ensure that complex projects may be carried out. It plays an important role in spatial plans and projects and, for that reason, it is important for plans and projects to be carried out in a way that respects those values.
10.3.2 Urbanisation Natural phenomenon. Urbanisation, though often viewed as a negative trend, occurs naturally from individual and corporate efforts to reduce expense in commuting and transportation in parallel with improving opportunities for jobs, education, housing, and transportation. Living in urban settlements permits individuals and families to take advantage of the opportunities of proximity, diversity, and marketplace competition, and it attributes to growth of cities.
Deputy Registrar Zonal Office Kigali
Deputy Registrar Zonal Office East
The Deputy Director General (Technical)
Deputy Registrar Zonal Office West
Deputy Registrar Zonal Office South
Deputy Registrar Zonal Office North
Land Management & Planning Unit Land Information, Mapping
and Survey Unit
Finance and Internal Resource
District Land Commission
District Land Bureaux
Sector Land Committee
Cell Land Committees

Report on Collection of Existing Data
251 (274)
Figure 10.2 – Examples of urban morphology
Source: MININFRA Website.
10.3.3 Context Towards middle-income. Vision 2020 is a result of a national consultative process that took place AT Village Urugwiro in 1998-9. There was broad consensus on the necessity for Rwandans to clearly define the future of the country. A major aspiration of Vision 2020 is to transform Rwanda’s economy into that of a middle income country with per capita income of about USD 900 per year, from USD 290 at the time of the consultations. This would require an annual growth rate of at least 7 %, and would require that the current subsistence agriculture economy is transformed to a knowledge-based society – a society with high levels of savings and private investment, thereby reducing its dependence on external aid. Box 10.3 - Population growth
Highest population density in Africa. The Rwandan population was estimated in 2006 at 8.2 million people with the highest population density in Africa at 340 inhabitants/km2 and a high population growth rate at 3.2 % per annum. The population is now estimated at 9.06 million, and expected to double to around 16 million by 2020. This demographic trend is one of the major causes of the depletion of natural resources with resulting poverty and hunger. The demographic dynamic is the result of a number of factors such as the high fertility rate of women and a pro-birth culture.
Pressure on environment. With rapid urbanisation and dramatic growth of population in urban areas, Rwanda is experiencing increased pressures on its natural resources that contribute to the degradation of the environment and lack of housing and other basic services. These problems highlight the need for rational and efficient management of urban and rural resources as well as the restoration of functions that will help these urban areas implement sustainable development strategies to cope with the consequences of rapid population growth.
Note: Mid 2006, the following figure applied: population at 9058392; population density per km2 at 344; under 5-years-olds at 16.3 % of the total population; under-15year-olds at42.1 % of the total population; 15-64-year-olds at 55.2 % of the total population; population of 65-years and over at 2.7 % of the total population. Source: NISR, 2006.
10.3.4 Urban development Accelerating urbanisation. According to Vision 2020, Rwanda is characterised by low but accelerating urbanisation. This has happened in a rapid and un-co-ordinated manner, meaning that social services and employment opportunities are lagging behind. From now until 2010, each town will need to have regularly updated urban master plans and specific land management plans. The country will also need to develop basic infrastructure in urban centres and in other development poles, enabling the decongestion of agricultural zones. The proportion of those living in towns and cities is projected to increase from 12 % to 30%, ie from 5% in 1995. The income

Report on Collection of Existing Data
252 (274)
differential between towns and rural areas should remain within reasonable proportions, due to the decentralization of economic activities to the country (Vision 2020:15-6).
Economy of scale advantage. Urbanisation and the creation of development centres is one way forward to achieve economies of scale through concentration of infrastructures and proximity of services and enterprises. This would allow the mechanisation of agricultural exploitation, the development of processing and services sectors, which can more easily, increase output compared to the primary sector and which reduces the demographic pressure on agricultural employment. The current unplanned space of urban centres in Rwanda is result from absence of a clear and respected urban orientation with no national policy of urban development and housing to guide the development has been in place. All these result in the existence of spontaneous suburbs, of accelerated degradation of the environment and of the deterioration in the living conditions of the urban populations.
10.3.5 EDPRS Urban in-migration. The continued rapid population growth is resulting from an increase in fertility combined with a decline in infant mortality.The ensuing rise in population density has put pressure on the physical environment and induced labour in-migration from rural areas as well as from the countryside to the towns in Rwanda. A recent study found that the parts of the country that are increasing their share of the population are those that previously had a lower population density. Umutara and Kibungo, now in Eastern Province, had the smallest number of people per square kilometre at the time of the national census (2002), and have experienced the greatest increase in population share; conversely, Ruhengeri, now largely in Northern Province, and the city of Kigali had high population density in 2002, but are now seeing a reduction in their share of the overall population (NISR, 2006). There is a correlation between population density and poverty in Rwanda (Figure 10.3, below). Figure 10.3 – Positive association between population density and poverty incidence
Source: MINECOFIN, 2007:9.

Report on Collection of Existing Data
253 (274)
High population growth is, thus, a major challenge facing Rwanda. Slowing down population growth requires innovative measures, including the strengthening of reproductive health services and family planning, and ensuring free access to information, education and contraceptive services. Table 10.2 - Progress towards Vision 2020 targets by Millennium Development Goals
Vision 2020 Targets
Vision 2020 and MDG Indicators
Base line 1990
Base line 2000
Base line 2006 Target
2010 Target 2020
Progress to Vision 2020 Targets
urban population (% of total population)
10 17 20 30 Green
Rwandan population (million)
7.7 9.1 10.0 13.0 Red
population growth rate (%)
2.9 2.6 2.4 2.0 Yellow
MDG Area
urban population (% of total population)
10 17 20 30 Green
Source: MINECOFIN, 2007:30-3.
Table 10.3 – Envisaged projection by EDPRS on infrastructure, habitat and urbanisation
Sector 2008 2009 2010 2011 2012 Infrastructure - habitat and urbanisation
National Policy on urbanization and master plan to support implementation of imidugudu
Continuation of the Adoption of cities master plans and implementation of Imidugudu.
Continuation of adoption of cities master plans and implementation of Imidugudu.
Continuation of adoption of cities master plans and implementation of Imidugudu.
Continuation of adoption of cities master plans and implementation of Imidugudu.
Source: MINECOFIN 2007:147-9.

Report on Collection of Existing Data
254 (274)
Figure 10.4 - EDPRS planning linkages to achieve its objectives
Rwanda
Source: GOR, 2007:5.
Figure 10.5 - Planning and reporting tools for implementing EDPRS
Source: MINECOFIN, 2007.
Individual Imihigo
Staff Appraisals
Annual Action Plan
Report on Implementation of AAP
Central government
Imihigo
Budget Execution Report Joint Sector Reviews, PERs
EDPRS Annual Progress Report
Vision 2020
EDPRS
Sector Strategy/ District
development Plan
Unit Level Work Plans
Individual Work Plans
“Planning Path”
“Reporting Path”
MTEF (incl
Annual Budget)
District Development Plan District Development Plan District SIP District SIP
3 - year Rolling District MTEF 3 - year Rolling District MTEF
“Vision 2020 Umurenge ” Strategy“Vision 2020 Umurenge ” Strategy
3 - year Rolling District MTEF 3 - year Rolling District MTEF
Poverty Eradication Plan Poverty Eradication Plan
Area Based
Sector Strategic PlanSector Strategic Plan
Line Agency StrategyLine Agency Strategy
3-year Rolling MTEF3-year Rolling MTEF
Strategic Issues Paper (SIP)Strategic Issues Paper (SIP)
Strategic Issues Paper (SIP)Strategic Issues Paper (SIP)
3-year Rolling MTEF3-year Rolling MTEF
Function Based
EDPRSEDPRSGovernment Policies Government Policies
Government Agenda Government Agenda
Agenda Based
Vision 2020Rwanda
Vision 2020
Report on Collection of Existing Data
255 (274)
10.4 Urbanisation Policy
10.4.1 Introduction Definition. Urbanisation is defined within the ambit from a Presidential Order upon a proposal by District Councils followed by advice from the Minister in charge of town planning. According urban policy statement requirements, urbanisation means putting in place urbanisation tools - urbanisation and management master plan, local master plans and particular areas’ management plans - availing basic infrastructure for built areas, restructuring under-serviced, informal or spontaneous, parts of settlements. It includes all public interventions meant to enhance and to frame the urbanisation process for the Rwandan people, to structure the urban network both at national and provincial levels, to improve town management and to manage both towns’ and urban areas’ development and field extensions, especially through simple and efficient planning tools. The policy is meant to set Government orientations and priorities in harmony with its goals as found in Vision 2020, the poverty reduction programme and the national investment strategy. Implementing this policy will amount to supporting the said process, coordinating all the activities to be undertaken and caring for their follow up and assessment (MININFRA, 2007).
Integrated process. Urban development as results from any urbanisation process is neither limited to physical infrastructure nor to housing estates. It also hinges on economic, political, social and institutional factors. Urban development requires to avail - also at local level - suitable planning and regulatory tools, to build capacity and to mobilise both for public and private sector involvement the required financial means and resources to plan and to improve urban and rural settlements - this towards improving people’s living conditions including those of the less advantaged majority. It is also indicated that directed, planned and controlled urbanisation should be considered as an opportunity and a driving force for development - each town is to be given a specific objective, eg tourism, industry and culture), and its architectural designs will take such objectives into account (ibid:3-4).
10.4.2 Population evolution Five fold increase in seven decades. In slightly more than 70 years, Rwanda’s population has increased more than five times, from 1595500 in 1934, to 9344399 persons in 2007. Today the urbanisation index is 18.7 %, ie, roughly 1747403 people against 9344399 for the whole country. Following the 1978 and 1991 censuses, urban population increased on average by 5.5 % per year. The urban demographic mass is concentrated to Kigali City with some 800000 persons. This spontaneous or uncontrolled urbanisation has led to a twofold process of increased density and degradation of areas found near urban centres and of dispersed peri-urban habitat - all which bring about expensive outreach service and infrastructure (MININFRA, 2007).
10.4.3 Urban Population Distribution High urbanisation rate of capital. Kigali City has mostly contributed to increasing the urban population with 236000 people in 1991 and 800000 in 2007, ie at an annual average growth rate of 9 %. This has resulted in an urban population concentration in the capital of 44 % of the whole of Rwanda’s urban population. This situation tends to confirm the urban ‘monocephalism’ phenomenon, and underlines the imbalance existing between Kigali and other urban centres in the country (MININFRA, 2007).

Report on Collection of Existing Data
256 (274)
Secondary centres in competition with favoured capital. These secondary urban centres, to date, can not avail any solid base for service and/or employment for their populations, due to inadequate public and private investments. The demographic imbalance between the capital and other urban centres is compounded with the economic and service activities imbalance. This has concentrated these activities mostly in Kigali with more than 70 % of industrial activities, more than 50 % of wholesale trade, 70 % of bank deposits etc. This will consequently require putting in place incentives so as to attract investors to secondary centres, which after being revitalised may reduce people’s fleeing to the city. (ibid:5-6).
10.4.4 Regional and International Context On the one hand, Rwanda’s current urbanisation ranks among the lowest worldwide and even in Africa. Worldwide, the average rate is 50 % with 84 % in North America, 75 % in Latin America and Caribbean Islands and 37% in Africa and Asia. On the other hand, the annual urban growth of 9 % per year is far higher than the average, in Africa at 4 %. Africa (MININFRA, 2007:8).
Capacitating institutionally and financially. The policy on urban planning puts special emphasis on planning and servicing of plots to ensure sustainable urban development. Building institutional and financial capacities for local communities allows them to fulfil their duty in urban planning and development.
10.5 Major challenges
10.5.1 Lack of plots and basic infrastructure Land and housing supply by the formal economic sector has so far only slightly, and with limited means, met the needs of the great majority of city dwellers, mainly for lack of adequacy between demand and supply.
Low density development for the elite. Kigali and the minor towns have given no priority to the development of housing areas for its majority population category, ie low-income earners. Programmes carried out or planned to date are mainly oriented towards middle-income and high-income categories. Large agricultural areas located within urban perimeters were, thus, assigned to middle and high cost, low density, single-family housing development. This is only partially occupied. The urgent needs, however, relate to low-income housing development, which has been given no priority or attention. As a result, only informal settlement is the housing development deficit countered
10.5.2 Lack of basic urban data Problem for all settlements and overview. All towns and urban centres in Rwanda lack basic data to help in decision making, notably on: statement of public land property, registered plots, statement of the land and real property market, needs for building plots for housing and economic activities, housing needs, needs for restructuring and infrastructure for settlement areas, projected estimated cost for expropriation, etc. There is also lack of spatial basic data on urban and rural settlements, ie, their: functions and activities and economic potential; location in national and regional space and hierarchical structuring role; inter- and intra- networking; relations environment; and, general exchange flows.

Report on Collection of Existing Data
257 (274)
10.5.3 Inappropriate urbanisation and construction norms and standards Unattainable planning and building norms. The only type of housing currently, formally, recognised in Rwanda is planned housing both in urban and rural areas, as opposed to spontaneous or scattered housing. The National Housing Policy (2004) recalls that in urban areas, existence of a development plan is a prerequisite for any form of development. Further, housing development is subject to a whole set of urban planning and construction norms corresponding to imported standards by which the majority of households must abide. Given their limited contribution capacity, more particularly due to lack of long term credit and within a context whereby the majority of the working people are employed in the informal sector - in 1999-2000, it accounted for 79.80 % of jobs in various sectors of the economy in the City of Kigali – the majority cannot abide. For affected families, this situation, thus, results impossibility to get access to planned programmes and to have their plot registered due to the constraint put on them to develop it in accordance with established norms. Therefore, the only option for them is to settle in undeveloped and under-serviced informal areas.
10.5.4 Low percentage of registered land tenure New facilitating law. In all towns of the country, the percentage of households with registered plots of land is still low. In towns where the majority of households live below poverty line, going through established formalities to access plots is not an easy task. New legislation, however, provides for systematic registration of all land properties.
10.5.5 Lack of financial resources for people with expropriated land Allowances not meeting new costs. As towns lack the resources required to provide new sites with adequate utility services in urban extension areas, relocation of households displaced as part of restructuring operations of ‘irregular areas’ is not currently or only partially conducted in Kigali and other towns. In cases where sites are identified to host newly people from expropriated land, the size of plots, the fees related to their concession, the amount of rent and the norms and deadlines imposed for their development are, however, far higher than the ‘allowances’ given to displaced households. In this context, the only resort for these households is to seek refuge through informal or irregular channels, either in urban area or in neighbouring rural areas.
10.5.6 Lack of appropriate planning and urban management tools Two towns with development plans. So far, only two towns in formal sense have an Urban Development Master Plan. Kibuye’ plan was implemented in 2003 and Cyangugu’s was updated in 2005. Kigali City and Rwamagana master plans are being updated. Other towns do not have updated documents necessary for urban development and management options. Other local and private town development plans and urbanisation plans are inexistent. Lack of planning documents is a challenge that should be addressed to safeguard efficient development of urban space in face of rapid urbanisation. Developing and updating urban development master plans for all urban centres is a another challenge, given the time needed to prepare them and to get them approved.

Report on Collection of Existing Data
258 (274)
10.6 Basic principles
10.6.1 Balanced and sustainable development Commitment. Government is committed to support balanced and sustainable development for human settlement both in rural and town areas, which are economically accessible and socially integrated. The rights of each individual would, thus, be recognised, in particular the rights of women, children, the disabled, people living in poverty and those belonging to vulnerable and socially disadvantaged groups.
10.6.2 Urbanisation process Urbanisation process and urban development should be done as part of a sustainable development approach allowing to address people’s needs while contributing to their social and economic development, and also restricting negative impacts on environment. This process will also involve, as a result, environmental aspects. Urban development will rely on rational land management.
10.6.4 Development planning Urbanisation is regarded as a driving force for economic development. Urbanisation process and urban development should not be imposed but rather controlled, planned, oriented with the development of processing sectors and services. Urbanisation further contributes to increasing food demand in urban centres as basic conditions for development and intended modernisation of Rwandan agriculture because they are determining factors in poverty reduction (MININFRA, 2007:13-4).
10.6.5 Policy vision, objective and strategies In the prospect of realising Vision 2020, 30 % of the whole Rwandan population will be living in well-planned towns equipped with basic facilities necessary for sustainable development. The overall objective of the urbanization and urban development policy is to improve the living conditions of urban dwellers through mastered and controlled development of urban centres. The following strategies are to be adopted to achieve harmonious and balanced urbanisation of Rwanda:
• promotion of economic and social development of secondary urban centres to enable them to accommodate an ever increasing number of people who usually leave the rural area in big numbers to settle in Kigali;
• preparation of building plots meeting people’s requirements and of which prices are affordable to different categories of beneficiaries, including people with low and very low income;
• restructuring and equipping makeshift areas;
• systematic registration of all immovable assets to secularise occupations and land tenure in spontaneous suburbs; and,
• to support, through sensitization and training, the institutional capacity building process of various actors involved in urban planning and management and of local communities in particular (MININFRA, 2007:16).

Report on Collection of Existing Data
259 (274)
10.7 Housing
10.7.1 Introduction National human settlement policy. The 1994 genocide was a striking event in the history of Rwanda, which had considerable impact on human settlement. The aftermath challenges in terms of housing were great; there was need to house a big number of returnees, both in urban and rural areas. The problem of resettling a big number of families, the scarcity of land linked with structural poverty of households led the Government to adopt, in December 1996, a national human settlement policy which focuses on regrouping settlements (imidugudu) in the rural area with a view of encouraging the development of rural centres. It also deals with the restructuring of unplanned residential areas in urban areas in order to improve the urban living conditions of the population.
Vision 2020 on settlement. According to vision 2020, Rwanda will pursue a harmonious policy of grouped settlements based on economic activity. Rural settlements, organised into active development centres, will be equipped with basic infrastructure and services. This system of settlement will serve as an entry point into the development of non-agricultural income generating activities. Land will be reorganised and consolidated so as to create adequate space for modern and viable farming. Whereas Vision 2020 does not per se address residential land use in context of grouped settlements, EDPRS makes reference to residential zones.
10.7.2 EDPRS Integrated settlement plans. According to EDPRS, it is envisaged that 70 % of the population will be living in rural grouped settlements (Imidugudu) by 2020 and that the remaining 30 % will reside in urban areas. The strategy habitat sub-sector contains a strategy for restructuring the country’s settlement patterns, consistent with the contemplated rural and urban land use and environment protection schemes. This entails the development of ‘master’ plans for new urban residential zones and Imidugudu settlement sites. Such plans may also – to depict their character – are often referred to as integrated or comprehensive development plans.
Residential development as part of overall plans. The use of planning tools for restructuring the Rwanda’s rural and urban settlement pattern will play a pivotal role (MINECOFIN, 2007:62). Master plans for the rural grouped imidugudu settlements and urban and rural residential and associated zones will need to be developed as part of overall settlement schemes. The zones will need to planned, surveyed and demarcated into residential, commercial, civic and community, industrial, other and mixed land use plots, and provided with relevant infrastructural services. The process will also involve address to upgrading of under-serviced, unplanned, settlement areas. In this regard partnerships between government and the private sector will be of essence.
In the area of habitat and public assets management, emphasis is to be put on the planning and development of improved rural and urban human settlements consistent with the contemplated sustainable land use and environment protection schemes. Eighteen city master plans are to be prepared, 5700 imidugudu sites prepared and constructed and 10000 hectares of land provide - all with services for housing. Seven districts with the worst living conditions are to be revisited for their inhabitants to be better housed with basic services. Government institutions are intended to be
Report on Collection of Existing Data
260 (274)
provided with adequate back-up, in line with the need for delivering quick and high quality services (MINECOFIN, 2007).
10.7.3 National Human Settlement Policy Recognition of right to housing. The Government of Rwanda recognises the fundamental right to housing for every citizen as specified in international instruments to which Rwanda subscribes, including the Istanbul Declaration and the Programme for Human Settlements (1996), the Millennium Development Goals (2002), the World Summit on Sustainable Development (2002). To this end, it is to provide the population with access to ‘decent’ housing and to protect and improve the conditions of housing and residential areas. In its efforts to ensure decent housing to all Rwandans, and to make human settlements more secure, salubrious, viable, equitable, sustainable and productive, Government is guided by the following principles, congruous with major national policies, United Nations’ Charter and the objectives of the United Nations’ Commission for Human Settlements.
Recognition of need to address to human settlement conditions. Access by everybody to basic goods, infrastructure and services and to collective amenities is a determining element for the quality of life in settlement sites both in urban and rural areas. In particular, the expansion and development of unplanned residential areas should be checked and restructured. In Rwanda, the development of human settlement should enhance economic development, employment and social progress. Thus, the improvement of the conditions of human settlement has been recognised as an essential component in the National Programme for Poverty Reduction. MININFRA, 2004:10)
High housing demand and informal settlement. Basing upon measured or estimated urban growth rates, annual housing requirements in Rwanda are estimated at 8500-10000 units and at 15000 units, housing requirements for the whole country’s towns out of Kigali. In 2002-3, it was estimated that both formal public and private channels for availing land and accommodation satisfied the demand at only 10 %, mainly for upper and middle income categories. This situation has not improved since. Majority households have no other choice, but to use informal channels for land occupation in unplanned and un-serviced areas. Box 10.4 – Rapid urban population growth
Huge housing needs. Figures released from the general population and human settlement census (August 2002) show that the resident urban population increased rapidly from 391194 in 1991 to 1362312 inhabitants in 2002, representing an increase from 5.5 % to 16.7 % of the total population of Rwanda. This demographic explosion has created huge housing needs. The absence of reliable and accurate statistics makes housing needs estimates difficult. Annual housing needs are estimated at 25000 housing units. The city of Kigali alone, in the context of its current growth, needs 10000 housing units on average each year on top of its existing real estate meet the needs of the current natural population growth. Though indicative, these figures give an idea of the extent of the needs.
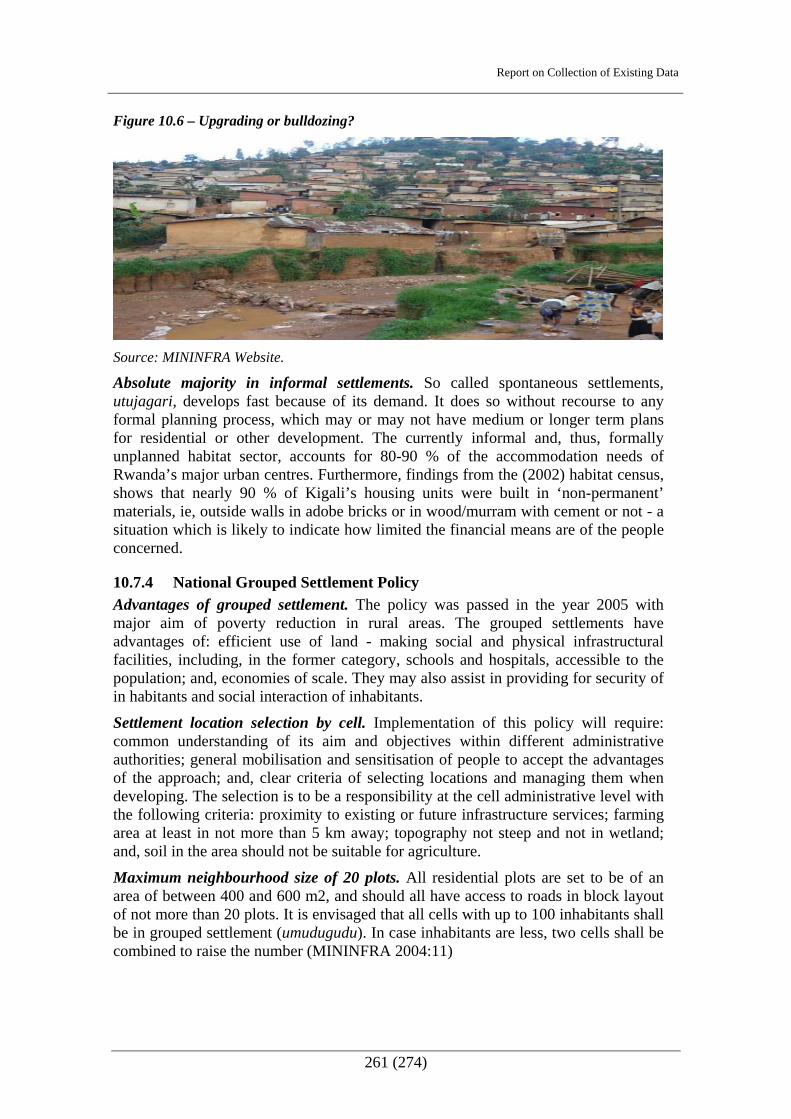
Report on Collection of Existing Data
261 (274)
Figure 10.6 – Upgrading or bulldozing?
Source: MININFRA Website.
Absolute majority in informal settlements. So called spontaneous settlements, utujagari, develops fast because of its demand. It does so without recourse to any formal planning process, which may or may not have medium or longer term plans for residential or other development. The currently informal and, thus, formally unplanned habitat sector, accounts for 80-90 % of the accommodation needs of Rwanda’s major urban centres. Furthermore, findings from the (2002) habitat census, shows that nearly 90 % of Kigali’s housing units were built in ‘non-permanent’ materials, ie, outside walls in adobe bricks or in wood/murram with cement or not - a situation which is likely to indicate how limited the financial means are of the people concerned.
10.7.4 National Grouped Settlement Policy Advantages of grouped settlement. The policy was passed in the year 2005 with major aim of poverty reduction in rural areas. The grouped settlements have advantages of: efficient use of land - making social and physical infrastructural facilities, including, in the former category, schools and hospitals, accessible to the population; and, economies of scale. They may also assist in providing for security of in habitants and social interaction of inhabitants.
Settlement location selection by cell. Implementation of this policy will require: common understanding of its aim and objectives within different administrative authorities; general mobilisation and sensitisation of people to accept the advantages of the approach; and, clear criteria of selecting locations and managing them when developing. The selection is to be a responsibility at the cell administrative level with the following criteria: proximity to existing or future infrastructure services; farming area at least in not more than 5 km away; topography not steep and not in wetland; and, soil in the area should not be suitable for agriculture.
Maximum neighbourhood size of 20 plots. All residential plots are set to be of an area of between 400 and 600 m2, and should all have access to roads in block layout of not more than 20 plots. It is envisaged that all cells with up to 100 inhabitants shall be in grouped settlement (umudugudu). In case inhabitants are less, two cells shall be combined to raise the number (MININFRA 2004:11)

Report on Collection of Existing Data
262 (274)
Figure 10.7 – Exising umugududu neighbourhood
Source: MININFRA Website.
Figure 10.8 – Layout of unugududu
Source: GOR, 2007.
10.7.5 Urban and rural infrastructure
EDPRS on roads and energy. As envisaged in EDPRS, much needs to be done to improve rural roads and energy to support growth. This is corroborated by the Ubudehe survey, where the quality of roads and their road network were identified as a top infrastructure priority. It is indicated that the proportion of roads in good condition has only risen from 4.7 % to 6.4% and from 1.7 % to 5 %, respectively, implying that large sections of the population face transportation obstacles to access markets and more generally integrate into the national economy. The share of public expenditure for infrastructure is lower than in neighbouring countries. Moreover, energy remains very expensive in Rwanda, accounting for an average of 14 % of all non-food expenditure. The proportion is, not surprisingly, higher for poorer households. The high cost of energy results in almost 80 % of the value of fuel being obtained from biomass sources, such as firewood.
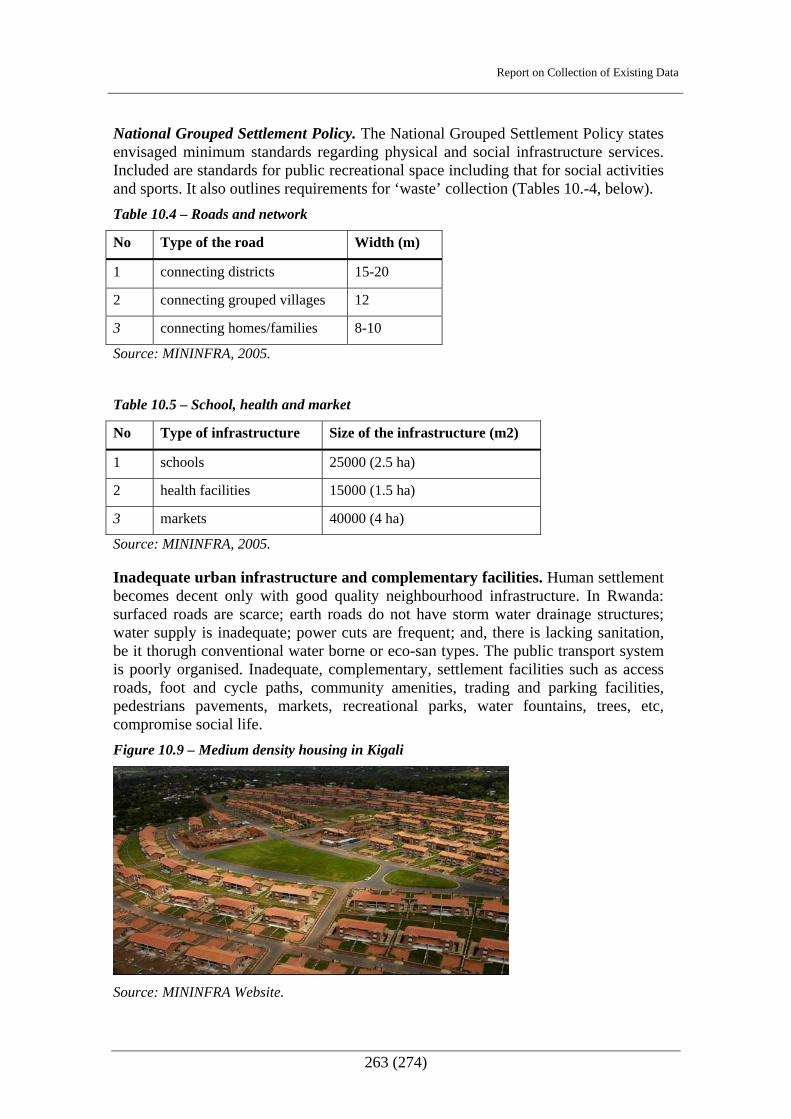
Report on Collection of Existing Data
263 (274)
National Grouped Settlement Policy. The National Grouped Settlement Policy states envisaged minimum standards regarding physical and social infrastructure services. Included are standards for public recreational space including that for social activities and sports. It also outlines requirements for ‘waste’ collection (Tables 10.-4, below). Table 10.4 – Roads and network
No Type of the road Width (m)
1 connecting districts 15-20
2 connecting grouped villages 12
3 connecting homes/families 8-10
Source: MININFRA, 2005.
Table 10.5 – School, health and market
No Type of infrastructure Size of the infrastructure (m2)
1 schools 25000 (2.5 ha)
2 health facilities 15000 (1.5 ha)
3 markets 40000 (4 ha)
Source: MININFRA, 2005.
Inadequate urban infrastructure and complementary facilities. Human settlement becomes decent only with good quality neighbourhood infrastructure. In Rwanda: surfaced roads are scarce; earth roads do not have storm water drainage structures; water supply is inadequate; power cuts are frequent; and, there is lacking sanitation, be it thorugh conventional water borne or eco-san types. The public transport system is poorly organised. Inadequate, complementary, settlement facilities such as access roads, foot and cycle paths, community amenities, trading and parking facilities, pedestrians pavements, markets, recreational parks, water fountains, trees, etc, compromise social life. Figure 10.9 – Medium density housing in Kigali
Source: MININFRA Website.

Report on Collection of Existing Data
264 (274)
Taskforce. According to the Minister of Local Government at a news conference, January 2009, his ministry and other line ministries had formed a taskforce to ensure the implementation of the policy in the shortest possible time. The Minister revealed that since the adoption of the policy in1996, only 22 % of the population had been resettled in Imidugudu, whereas the target was to have at least 70 % in these settlements by the year 2020 with the remaining 30 % of population expected to reside in cities.
In spite efforts. Despite the huge efforts put in the development of infrastructural facilities and the provision of basic services – ie, roads, water, electricity, schools, hospitals, banks, telephones and other socio-economic amenities - rural households, on the whole, are still far apart from one another. In the Imidugudu villages, which were established to ameliorate this situation, there are also differences in terms of access to infrastructure and social services for the people who live there. The distance between houses and water supply points is still hindering.

Report on Collection of Existing Data
265 (274)
References MINAGRI. 2002. Carte Pédologique du Rwanda (CPR), Planchette 8 - Ruhengeri,
2002 Oct. Ministry of Agriculture and Animal Resources. Kigali. 2010 Biodiversity Indicators Partnership (supported by the CBD Decision VIII/15).
Indicators. <http://www.twentyten.net/Indicators/tabid/75/language/en-GB/Default.aspx>. Retrieved July 2008.
MINALOC. 2007. District Development Plans (DDP). Ministry of Local Government, Information and Social Affairs. Kigali.
Baechler, G. 1999. Violence through environmental discrimination: Causes, Rwanda Arena and Conflict Model. Kluwer Academic Publishers (Now Springer). Boston, Mass, USA.
CGIAR. 2008. Lessons from Kampala: Will urban farming make a difference? Alliance Collective Action News of the CGIAR Centres. Updates from Agricultural Research in Africa, Issue No 3, Oct. 2008. CGIAR. Kampala.
CGIS-NUR and ISAR. 2007. National forest mapping and inventory. Convention on Biological Diversity. Text of the Convention on Biological Diversity.
<http://www.cbd.int/convention/convention.shtml>. Retrieved July 2008. CSD. 1998. Mountains of the World: Water Towers for the 21st Century. The
Commission on Sustainable Development (CSD) and its 1998 Spring Session on Strategic approaches to Freshwater Management, 1998. Berne: Mountain Agenda. <http://www.cde.unibe.ch/CDE/pdf/Mountains1998.pdf> Retrieved September 2008.
De Zeeuw, Henk. 2000. Growing Cities, Growing Food, Urban Agriculture on the Policy Agenda. Deutsche Stiftung für international Entwicklung (DSE).
DHS, 1992. The Rwanda Demographic and Health Survey 1992. Office National de la Population, Rwanda, and Macro International Inc. Calverton, Maryland.
DHS, 2000. The Rwanda Demographic and Health Survey 2000. Office National de la Population, Rwanda, and Macro International, Inc. Calverton, Maryland.
Ehrlich, AH, Gleick and Conca, K. 2000. Resources and environmental degradation as sources of conflict. Background Paper for Working Group 5: 50th Pugwash Conference On Science and World Affairs, Queens College, Cambridge, UK, 3-8 August 2000. <http://www.pugwash.org/reports/pac/pac256/WG5draft.htm>. Retrieved July 2008.
EICV. 2007. Poverty Analysis for Rwanda’s Economic Development and Poverty Reduction Strategy (Final 2007 May).
Evans. A et al. 2006. Independent Evaluation of Rwanda’s Poverty Reduction Strategy 2002-2005. Final Report. ODI/IDS.
Ewango, CEN. 2001. “Flore et Végétation de la Forêt naturelle de Nyungwe, Rwanda (Flora and Vegetation of the Natural Forest of Nyungwe, Rwanda)”. Syst Geogr Pl 71 (2) (Special Issue): 1009-1015. In: E Robbrecht, J Degreef and I Friis (eds). Plant systematics and phytogeography for the understanding of African biodiversity: proceedings of the XVIth AETFAT Congress, held at the National Botanic Garden, Belgium, August 28 - September 2, 2000.
Report on Collection of Existing Data
266 (274)
FAO. 2001. FAO emergency projects in Rwanda. Relief Web latest updates (April 6, 2001). http://www.reliefweb.int/rw/rwb.nsf/AllDocsByUNID/6635216273806bcec1256a260034265e Land Degradation and Desertification, 2002. Not possible to re-retrieve.
FAO. 2003. Global Information on Outbreaks And Impact Of Major Forest Insect Pests And Diseases. Unedited Paper prepared by Allard, GB, Fortuna S, Su See, L, Novotny, J, Baldini, A and Courtinho, T. Submitted to the XII World Forestry Conference, 2003, Quebec City, Canada. <http://www.fao.org/DOCREP/ARTICLE/WFC/XII/1019-B3.HTM> Retrieved July 2008.
FAO. Forestry Department. 2003. Country profiles: Rwanda. www.fao.org/forestry/site/23747/en/rwa
Fischer, E and Hinkel, H. 1992. Natur Ruandas - La Nature du Rwanda: Einführung in die Flora und Fauna Ruandas. Materialien zur Partnerschaft Rheinland-Pfalz-Ruanda. Eberhard Fischer, Harald Hinkel. Mainz, 1992. ISBN 3-920615-15-8.
Fishpool, ID and Evans MI eds. 2001. Important Bird Areas in Africa and associated islands: Priority sites for conservation. Pisces Publications and BirdLife International (Birdlife Conservation Series No.1) Newbury and Cambridge.
Gapusi, RJ. 1999. Identification et analyse des options stratégiques pour la conservation de la biodiversité de la forêt de Nyungwe. Ministère de l’Agriculture, de l’Environnem et du Développement Rural. Kigali.
Global Footprint Network. <http://www.footprintnetwork.org> Retrieved July 2008. GOR. 2002. Schema d’Amenagement des marais, de protection des Bassins Versants et
de la Conservation des Sols: Rapport global definitive phase 1. MINAGRI. Kigali. GOR. 2007. Vision 2020 Umurenge – An Integrated Local Development Program to
Accelerate Poverty Eradication, Rural Growth, and Social Protection. EDPRS Flagship Program Document, August 2007. MINALOC and MINECOFIN. Kigali.
GOR. 2000. Rwanda Vision 2020. Ministry of Finance and Economic Planning. Republic of Rwanda. Kigali.
GOR. 2004. Sectorial Policy on Water and Sanitation October. Ministry of Lands, Environment, Forests, Water and Mines. Republic of Rwanda. Kigali.
GOR. 2004. National Land Policy. Ministry of Lands, Environment, Forests, Water and Mines. Republic of Rwanda. Kigali.
GOR. 2004. Republic of Rwanda: integrated management of critical ecosystems. Initial project information document (PID). Ministry of Lands, Human Resettlement and Environmental Protection. Republic of Rwanda. Kigali.
GOR. 2005. Health Sector Strategic Plan 2005-2009.. Republic of Rwanda. Kigali. GOR. 2005. Organic Law, N° 04/2005 of 08/04/2005, determining the modalities of
protection, conservation and promotion of environment in Rwanda. Republic of Rwanda. Kigali.
GOR. 2006. Law, N° 16/2006 of 03/04/2006, determining the organisation, functioning and responsibilities of Rwanda Environment Management Authority. Republic of Rwanda. Kigali.
GOR. 2007. Economic Development and Poverty Reduction Strategy, 2008-2012. Ministry of Finance and Economic Planning. Republic of Rwanda. Kigali.

Report on Collection of Existing Data
267 (274)
GOR. Ministry of Energy, Water and Natural Resources and World Bank. 2000. Project appraisal document on a proposed credit in the amount…to the Rwandese Republic for a rural water supply and sanitation project, May 10, 2000. Republic of Rwanda. Kigali.
GOR. 2002. Poverty Reduction Strategy Paper. Ministry of Finance and Economic Planning Republic of Rwanda. Kigali.
GOR. Ministry of Lands, Resettlement and Environment. 2003. National strategy and action plan for the conservation of biodiversity in Rwanda. Republic of Rwanda. Kigali. http://www.biodiv.org/doc/world/rw/rw-nbsap-01-en.pdf
Gurrieri, J Chaveas, M and Gritzner, J. 2005. USAID Forest Service Technical Assistance Trip Virunga – Bwindi Region: Republic of Rwanda, Republic of Uganda, Democratic Republic of Congo. In Support to the International Gorilla Conservation Programme in Analyzing the Region’s Watersheds for Water Supplies to Local Communities. Mission Dates: March 4-21, 2005. USAID Forest Service. http://carpe.umd.edu/resources/Documents/rpt_usdafsip_virunga_h2o_trip_3_2005.pdf
Habiyambere,T. 2008. Post Conflict Environmental Assessment, Forestry Sector. Kigali.
Hausmann R, Rodrik, D and Velasco, A. 2004. Growth Diagnostics – Determining the right policies for growth. Initiative for Policy Dialogue. Columbia University.
http://earthtrends.wri.org/pdf_library/country_profiles/wat_cou_646.pdf http://earthtrends.wri.org/pdf_library/country_profiles/wat_cou_646.pdf http://www.cleanlake.com/rwanda_biological control_program.htm http://www.cleanlake.com/rwanda_biological control_program.htm IISD-ACCESA. Adaptation to Climate Change in Eastern and Southern Africa
(ACCESA). < http://www.iisd.org/climate/vulnerability/adaptation.asp> Retrieved in July 2008.
IMF. 2007. Memorandum of Economic and Financial Policies. International Monetary Fund. Washington. DC.
ISAR and Delepierre, 1974. Note technique 13. Butare. IUCN 2007. 2007 IUCN Red List of Threatened Species
<http://www.iucnredlist.org/info/categories_criteria200> Retrieved July 2008. (This website has now changed and searches are done through http://www.iucnredlist.org).
JO. 2002. Arrêté du Premier Ministre n° 72/3 du 14/10/2002) portant la mise en place d’un Service National de Protection des Forêts. Office of the Prime Minister. Kigali.
JO. 2004. Arrêté ministériel n° 352/11.02 du 17/04/2004 portant modalités d’octroi de contrats de gestion de boisements étatiques. Office of the Prime Minister. Kigali.
JO. 2005. Loi organique n° 04/2005 du 08/04/2005 portant modalités de protéger, sauvegarder et promouvoir l’environnement au Rwanda. Office of the Prime Minister. Kigali.
JO. 203. Arrête Présidentiel n° 10/02 du 15/02/2003 portant mise en place du comité de gestion du Fonds forestier national. Office of the Prime Minister. Kigali.
JO. 1989. Loi n° 47/1988 du 5/12/1988 portant organisation du régime forestier au Rwanda. Ofice of the Prime Minister. Kigali.

Report on Collection of Existing Data
268 (274)
Kabuyenge, JP. 1997. Analyse de la biodiversité des aires protégées du Rwanda et identification des principales cause de sa perte - Contribution à l’Etude Nationale sur la Biodiversité, Stratégie Nationale et Plan d’action pour la Biodiversité. République Rwandaise. Minagri.
Kalpers J. 2001. Volcanoes under Siege: Impact of a Decade of Armed Conflict in the Virungas. Biodiversity Support Program. World Wildlife Fund, Inc, Washington, DC.
Kanyamibwa, S. 1998. “Impact of war on conservation: Rwandan environment and wildlife in agony.” In Biodiversity and Conservation. Vol 7, 1998:1399-1406.
Kanyarukiga, SG and Ngarambe, V. 1998. Wetland Characterization and Classification for Sustainable Agricultural Development. FAO Document Repository.
Kanyarukiga, SG and Ngarambe, V. 1998. Rwanda country paper: Agricultural characterization and the classification of wetlands of eastern and southern Africa. <http://www.fao.org/docrep/003/x6611e/x6611e00.HTM> Retrieved July 2008.
Karyabwite RD. 2000. Water sharing in the Nile River Valley. Project GNV011: Using GIS/Remote sensing for the sustainable use of natural resources. UNEP/DEWA/GRID. Geneva. <http://www.grid.unep.ch/activities/sustainable/nile/nilereport.pdf > Retrieved September 2008.
MIFOTRA. 2005. Five Year National Action Plan for Promoting Youth Employment (NAPPYE). Ministry of Public Service, Skills Development, Vocational Training and Labour. Kigali.
Millennium Ecosystem Assessment. Final Report. 2005. <http://www.millenniumassessment.org>
Millennium Ecosystem Assessment. Current State and Trends Assessment. Ecosystems and Human Well-being: Current State and Trends, Volume 1. <http://www.millenniumassessment.org/documents/document.766.aspx.pdf.>Retrieved July 2008.
Millennium Ecosystems Assessment. 2003.Chapter 1, MA conceptual framework. <http://www.millenniumassessment.org/documents/document.765.aspx.pdf. > Retrieved July 2008. Also available as Ecosystems and Human Well-being: A Framework for Assessment. Island Press, 2003:1–25.
Min de l’Agriculture de l’Elevage et des Forèts. 2002. Schema Directeur et d’Amenagement des Marais, de Protection des Bassins Versants et de la Conservation des sols, Rapport global definitive 1ère phase, Rap. de synthèse, Aug 2002. Republic of Rwanda. Kigali.
Ministry of Lands, Resettlement and Environment. 2003. National Strategy and Action Plan for the Conservation of Biodiversity in Rwanda. Republic of Rwanda. Kigali.
MINAGRI. 1987. Plan forestier national décennal 1987-1997. Direction des Forêts. Republic of Rwanda. Kigali.
MINAGRI. 1998. Stratégie et Plan d’Action pour la Sécurité Alimentaire, Republic of Rwanda. Kigali.
MINAGRI. 2002. Schéma Directeur d’Aménagement des Marais, de protection des Bassins Versants et de la Conservation des Sols. Rapport global définitive 1ère phase. Rapport de synthèse. Prepared by Groupement HYDROPLAN Ingenieur GmbH-SHER Ingénieurs-Conseils sa. Republic of Rwanda. Kigali.
MINAGRI. 2004. National Agricultural Policy. Mar 2004. (HC, EV). Republic of Rwanda. Kigali.
Report on Collection of Existing Data
269 (274)
MINAGRI. 2004. Politique Nationale des Forêts. Direction des Forêts, République Rwandaise. Ministry of Agriculture and Animal Resources. Kigali.
MINAGRI. 2004. Strategic Plan for Agricultural Transformation in Rwanda (PSTA), Main document. Oct 2004. (HC, EV draft). Republic of Rwanda. Kigali.
MINAGRI. 2003. Soil Maps of Rwanda. Republic of Rwanda. Kigali. MINALOC. 2007. Vision 2020 Umurenge Program (VUP) - An integrated local
development program to accelerate poverty eradication, rural growth and social protection. Aug 2007. (HC). Republic of Rwanda. Kigali.
MINALOC. 2004. Decentralization Policy. Republic of Rwanda. Kigali. MINALOC. 2008. Community Development Policy. Republic of Rwanda. Kigali. MINECOFIN. 2000. Rwanda Vision 2020. Republic of Rwanda. Kigali.MINECOFIN.
2000. Vision 2020. Republic of Rwanda. Kigali. INECOFIN. 2002. Poverty Reduction Strategy Paper. Republic of Rwanda. Kigali. MINECOFIN. 2003. 3rd General Census of Population and Housing of Rwanda –
August 2002 - Final Results: statistical tables. Republic of Rwanda. Kigali. MINECOFIN. 2006. Rwanda’ Poverty Reduction Strategy Evaluation Report. Republic
of Rwanda. Kigali. MINECOFIN. 2006. Economic Development and Poverty Reduction Strategy (EDPRS).
Republic of Rwanda. Kigali. MINECOFIN. 2007. EDPRS Poverty Analysis of Ubudehe. Republic of Rwanda.
Kigali. MINECOFIN. 2007. EICV Poverty Analysis for Rwanda’s Economic Development and
Poverty Reduction Strategy. Republic of Rwanda. Kigali. MINECOFIN. 2007. National Guide for Planning, Budgeting and Policy Review.
Republic of Rwanda. Kigali.MINECOFIN. 2007d. Rwanda Financial Sector Development Program, Draft Report (First Initiative). Republic of Rwanda. Kigali.
MINECOFIN. 2007. The Economic Development and Poverty Reduction Strategy 2008-2012. Republic of Rwanda. Kigali..
MININFRA and MARGE. 2008. Biomass Energy Strategy. MININFRA. 2004. Energy Policy for Rwanda. Ministry of Infrastructure. Kigali. MININFRA. 2004. Strategies Sectorielles du Ministere des Infrastructures, Secteur
Energie. Rapport Final. (Energy Policy for Rwanda) Republic of Rwanda. Kigali. MININFRA. 2007. National Urbanization Policy. Republic of Rwanda. Kigali. MININFRA. 2008. Energy Sector Unit Presentation PP. Republic of Rwanda. Kigali. MINIRENA. 2004. Forest Policy. Republic of Rwanda. Kigali. MINIRENA. 2004. National Land Policy. Republic of Rwanda. Kigali. Ministry of Energy, Water and Natural Resources and World Bank. 2000. Project
appraisal document on a proposed credit in the amount to the Rwandese Republic for a rural water supply and sanitation project, May 10, 2000. Republic of Rwanda. Kigali.
Ministry of Lands, Resettlement and Environment. 2003. National strategy and action plan for the conservation of biodiversity in Rwanda. Republic of Rwanda. http://www.biodiv.org/doc/world/rw/rw-nbsap-01-en.pdf
MINITERE, 2004. Politique Nationale des Forets. Republic of Rwanda. Kigali. MINITERE. 2008. Plan d’Action National de Lutte contre la Désertification au
Rwanda (PAN-LCD). Experco des Grands Lacs. Republic of Rwanda. Kigali. MOH. 2005. Health Sector Strategic Plan 2005-2009. Republic of Rwanda.
Kigali.Kigali.
Report on Collection of Existing Data
270 (274)
Moorhouse, T, M, P. Agaba, and T. J. McNabb. 2000. Recent Efforts in Biological Control of Water Hyacinth in the Kagera River Headwaters of Rwanda.
Moorhouse, TM, P Agaba, and TJ McNabb. 2000. Recent Efforts in Biological Control of Water Hyacinth in the Kagera River Headwaters of Rwanda.
Mpyisi, E. 2002. Estimation of Area and Production of Root and Tuber Crops in Rwanda. December 2002.
Mpyisi, Edson. 2002. Estimation of Area and Production of Root and Tuber Crops in Rwanda,
Murenzi, R. 2007. Poverty Alleviation and Economic Growth in Rwanda through S and T. Development Outreach. World Bank Institute <http://www1.worldbank.org/devoutreach/january07/article.asp?id=397 >Retrieved January 2009.
Myers, N. 1984. Gaia: An Atlas of Planet Management. Anchor Press/Doubleday and Company, Inc. Garden City, NY.
National Poverty Reduction Programme. 2002. 160 p. Ndayamaje, JD. 2005. Agroforestry for Wood Energy Production in Rwanda. Paper
presented at a workshop. IRST-ISAR. Kigali. Newmark. WD. 2008. In Front Ecol Environ 2008.Vol 6(6):321–8,
doi:10.1890/070003. Ecological Society of America. Newtimes. 2008. Post Conflict State of Environment. Study to be presented in March,
2009. NISR. 2005. Demographic and Hewalth Survey. Ministry of Finance and Economic
Planning. Kigali. NISR. 2006. Preliminary Poverty Update Report, Integrated Living Conditions Survey
2005/6. Ministry of Finance and Economic Planning. Kigali. NISR. 2006 Rwanda Demographic and Health Survey 2005. Ministry of Finance and
Economic Planning. Kigali NISR. 2007. Rwanda Agricultural Survey 2006. Jun 2007. Ministry of Finance and
Economic Planning. Kigali. NISR. 2008. Rwanda Development Indicators 2006 National Institute of Statistics
Rwanda. Kigali. NISR and World Food Programme. 2006. Comprehensive Food Security and
Vulnerability Analysis (CFSVA). National Institute of Statistics Rwanda. Kigali. Odada, EO et al. 2004. Global International Water Assessment, Regional Assessment
47. East African Rift Valley Lakes. University of Kalmar/UNEP, 2004, Series title: GIWA regional assessment. University of Kalmar. Kalmar.
Olson, DM, Dinerstein, E, Wikramanyake and ED, Burgess. 2001.In Terrestrial Ecoregions of the World: A New Map of Life on Earth. BioScience, November 2001. Vol 51 No 11:933-8.
Oxford Policy Management Group et al. 2007. Agricultural Production and Productivity in Rwanda – Draft June 2007. Oxford.
Plumptre AJ, Masozera and M, Fashing. 2002. Biodiversity Surveys of the Nyungwe Forest Reserve In SW Rwanda. WCS Working Papers No 18, May 2002. Available for download from < http://www.wcs.org/science/ >
Plumptre, AJ, Masozera, M and Vedder A. 2001. The Impact of Civil War on the Conservation of Protected Areas in Rwanda. Biodiversity Support Program. Washington, DC. http://www.worldwildlife.org/bsp/publications/africa/145/Rwanda-English.htm
Report on Collection of Existing Data
271 (274)
Sanyu Consultants Inc, Nippon Koei Co Ltd. The study on sustainable rural and agricultural development in Bugesera District, E Prov, Progress Report 1. Sep 2006.
UNdata. 2009. <http://data.un.org/CountryProfile.aspx?crName=Rwanda> Retrieved January 2009.
UNCTAD. 2006. Investment Policy Review Rwanda. New York and Geneva. UNEP. 2004. Odada, EO, Olago, D and Kulindwa, KAA. Global International Waters
Assessment. Regional Assessment 47. East African Rift Valley Lakes. University of Kalmar, Kalmar.
UNEP. 2009. State of the Environment Reporting. Rwanda country profile. <http://countryprofiles.unep.org/profiles/RW/profile/state-of-the-environment/soe-reporting-framework> Retrieved January 2009
UNESCO–MAB. 2008. “Man and Biosphere” Programme FAQs. <http://www.gov.mb.ca/conservation/wno/status-report/fa-8.19.pdf >Retrieved July 2008.
Verdoodt, A and E van Ranst. 2003. A Large-Scale Land Suitability Classification for Rwanda. Ghent University. Ghent.
Wikipedia-Ecosystem. <http://en.wikipedia.org/wiki/Ecosystem> Retrieved July 2008. Wikipedia-Rwanda < http://en.wikipedia.org/wiki/Rwanda > Retrieved July 2008. Willets, L. 2007. Presentation of Case Study – Adapting to Climate Change and
Payments for Ecosystem Services: Rwanda. Duke University. Slide No 10 <http://www.iisd.org/pdf/2007/adapting_payments_ecosystem.pdf > Retrieved July 2008.
Wong, C, Roy M and Duraiappah AK. 2005. Connecting Poverty and Ecosystem Services: Focus on Rwanda. IISD and UNEP. ISSD Publication Centre.
World Bank. 2004. Environmental Assessment and Social Management Analysis. World Bank. Washington, DC. Cited in IISD and UNEP, 2005.
World Bank. 2004. Environmental Assessment and Social Management Analysis. Washington, DC.
World Bank. 2006. Agriicultural Policy Note – Promoting Pro-Poor Growtyh in Rwanda: Challenges and Opportunities. Washington, DC.
World Bank. 2007. Rwanda Country Economic Memorandum. Washington, DC. World Food Program et al. 2006. Rwanda Comprehensive Food Security and
Vulnerability Analysis (CFSVA) – Vulnerability Analysis and Mapping (VAM). 2006 World Resources Institute. (2003). Earthtrends: Country Profile – Water Resources and
Freshwater Ecosystems: Rwanda. <http://earthtrends.wri.org/pdf_library/country_profiles/wat_cou_646.pdf>. Retrieved July 2008.
World Resources Institute. 2003. Earthtrends country profiles - Forests, Grasslands and Drylands, Rwanda. <http://earthtrends.wri.org/pdf_library/country_profiles/for_cou_646.pdf (July 2008).
World Resources Institute. 2003. Earthtrends: Country Profile - Biodiversity and Protected Areas, Rwanda <http://earthtrends.wri.org/pdf_library/country_profiles/bio_cou_646.pdf > Retrieved July 2008.
World Resources Institute. 2003. Earthtrends: Country Profile: Forests, Grasslands and Drylands: Rwanda. http://earthtrends.wri.org/pdf_library/country_profiles/For_cou_646.pdf
Report on Collection of Existing Data
272 (274)
World Resources Institute. 2003b. Earthtrends: Country Profile – Water Resources and Freshwater Ecosystems: Rwanda. 2003.
World Resources Institute. 2003. Earthtrends: Country Profile – Water Resources and Freshwater Ecosystems: Rwanda. 2003.
World Resources Institute. 2003 – Earthtrends country profiles – Climate and Atmosphere – Rwanda. <http://earthtrends.wri.org/pdf_library/country_profiles/cli_cou_646.pdf > Retrieved July 2008.
World Resources Institute. 2003. Earthtrends: Country Profile: Biodiversity and Protected Areas:Rwanda. 2003.
World Resources Institute. 2003. Earthtrends: Country Profile: Biodiversity and Protected Areas - Rwanda.
WWF and National Geographic <http://www.nationalgeographic.com/wildworld/global.html?detail=undefined&size=undefined&id=0&cMinx=-180&cMaxx=180&cMiny=-90&cMaxy=90 > Retrieved July 2008.

Report on Collection of Existing Data
273 (274)
Appendix 1 See separate volume.