exit ticket packet - deer valley unified school district · lesson 8 7 { í name date lesson 8:...
TRANSCRIPT

10 9 8 7 6 5 4 3 2 1
Eureka Math™
Grade , Module 1
Student _BContains Sprint and Fluency, Exit Ticket,
and Assessment Materials
Published by the non-pro2t Great Minds.
Copyright © 2015 Great Minds. All rights reserved. No part of this work may be reproduced or used in any
form or by any means — graphic, electronic, or mechanical, including photocopying or information storage and
retrieval systems — without written permission from the copyright holder. “Great Minds” and “Eureka Math” are
registered trademarks of Great Minds.
Printed in the U.S.A.
This book may be purchased from the publisher at eureka-math.org
A Story of ®

Exit Ticket Packet

Lesson 1: An Experience in Relationships as Measuring Rate
7 Lesson 1
Name ___________________________________________________ Date____________________
Lesson 1: An Experience in Relationships as Measuring Rate
Exit Ticket
Watch the video clip of Tillman the English bulldog, the Guinness World Record holder for Fastest Dog on a Skateboard.
1. At the conclusion of the video, your classmate takes out his or her calculator and says, “Wow that was amazing!
That means the dog went about 5 meters in 1 second!” Is your classmate correct, and how do you know?
2. After seeing this video, another dog owner trained his dog, Lightning, to try to break Tillman’s skateboarding record.
Lightning’s fastest recorded time was on a 75-meter stretch where it took him 15.5 seconds. Based on these data,
did Lightning break Tillman’s record for fastest dog on a skateboard? Explain how you know.
A STORY OF RATIOS
This work is derived from Eureka Math ™ and licensed by Great Minds. ©2015 Great Minds. eureka- math.org
G7-M1-ETP-1.3.0-05.2015
1

7 Lesson 2
Lesson 2: Proportional Relationships
Name ___________________________________________________ Date____________________
Lesson 2: Proportional Relationships
Exit Ticket
Ms. Albero decided to make juice to serve along with the pizza at the Student Government party. The directions said to
mix 2 scoops of powdered drink mix with a half gallon of water to make each pitcher of juice. One of Ms. Albero’s
students said she will mix 8 scoops with 2 gallons of water to make 4 pitchers. How can you use the concept of
proportional relationships to decide whether the student is correct?
A STORY OF RATIOS
This work is derived from Eureka Math ™ and licensed by Great Minds. ©2015 Great Minds. eureka- math.org
G7-M1-ETP-1.3.0-05.2015
2

7 Lesson 3
Lesson 3: Identifying Proportional and Non-Proportional Relationships in Tables
Name ___________________________________________________ Date____________________
Lesson 3: Identifying Proportional and Non-Proportional
Relationships in Tables
Exit Ticket
The table below shows the price, in dollars, for the number of roses indicated.
Number of Roses 3 6 9 12 15
Price (Dollars) 9 18 27 36 45
1. Is the price proportional to the number of roses? How do you know?
2. Find the cost of purchasing 30 roses.
A STORY OF RATIOS
This work is derived from Eureka Math ™ and licensed by Great Minds. ©2015 Great Minds. eureka- math.org
G7-M1-ETP-1.3.0-05.2015
3

Lesson 4: Identifying Proportional and Non-Proportional Relationships in Tables
7 Lesson 4
Name Date
Lesson 4: Identifying Proportional and Non-Proportional
Relationships in Tables
Exit Ticket
The table below shows the relationship between the side lengths of a regular octagon and its perimeter.
Side Lengths,
(inches)
Perimeter,
(inches)
1 8
2 16
3 24
4 32
9
12
Complete the table.
If Gabby wants to make a regular octagon with a side length of 20 inches using wire, how much wire does she need?
Justify your reasoning with an explanation of whether perimeter is proportional to the side length.
A STORY OF RATIOS
This work is derived from Eureka Math ™ and licensed by Great Minds. ©2015 Great Minds. eureka- math.org
G7-M1-ETP-1.3.0-05.2015
4

Lesson 5: Identifying Proportional and Non-Proportional Relationships in Graphs
7 Lesson 5
Name ___________________________________________________ Date____________________
Lesson 5: Identifying Proportional and Non-Proportional
Relationships in Graphs
Exit Ticket
1. The following table gives the number of people picking strawberries in a field and the corresponding number of
hours that those people worked picking strawberries. Graph the ordered pairs from the table. Does the graph
represent two quantities that are proportional to each other? Explain why or why not.
2. Use the given values to complete the table. Create quantities proportional to each other and graph them.
1 3
7 1
4 2
4 2
0
1
2
3
4
5
6
7
8
9
10
0 1 2 3 4 5 6 7 8 9 10
0
1
2
3
4
5
6
7
8
9
10
0 1 2 3 4 5 6 7 8 9 10
A STORY OF RATIOS
This work is derived from Eureka Math ™ and licensed by Great Minds. ©2015 Great Minds. eureka- math.org
G7-M1-ETP-1.3.0-05.2015
5
Lesson 5: Identifying Proportional and Non-Proportional Relationships in Graphs
7 Lesson 5
3.
a. What are the differences between the graphs in Problems 1 and 2?
b. What are the similarities in the graphs in Problems 1 and 2?
c. What makes one graph represent quantities that are proportional to each other and one graph not represent
quantities that are proportional to each other in Problems 1 and 2?
A STORY OF RATIOS
This work is derived from Eureka Math ™ and licensed by Great Minds. ©2015 Great Minds. eureka- math.org
G7-M1-ETP-1.3.0-05.2015
6

Lesson 6: Identifying Proportional and Non-Proportional Relationships in Graphs
7 Lesson 6
Name ___________________________________________________ Date____________________
Lesson 6: Identifying Proportional and Non-Proportional
Relationships in Graphs
Exit Ticket
1. Which graphs in the gallery walk represented proportional relationships, and which did not? List the group number.
Proportional Relationship Non-Proportional Relationship
2. What are the characteristics of the graphs that represent proportional relationships?
3. For the graphs representing proportional relationships, what does (0, 0) mean in the context of the given situation?
A STORY OF RATIOS
This work is derived from Eureka Math ™ and licensed by Great Minds. ©2015 Great Minds. eureka- math.org
G7-M1-ETP-1.3.0-05.2015
7

7 Lesson 7
Lesson 7: Unit Rate as the Constant of Proportionality
Name ___________________________________________________ Date____________________
Lesson 7: Unit Rate as the Constant of Proportionality
Exit Ticket
Susan and John are buying cold drinks for a neighborhood picnic. Each person is expected to drink one can of soda.
Susan says that if you multiply the unit price for a can of soda by the number of people attending the picnic, you will be
able to determine the total cost of the soda. John says that if you divide the cost of a 12-pack of soda by the number of
sodas, you will determine the total cost of the sodas. Who is right, and why?
A STORY OF RATIOS
This work is derived from Eureka Math ™ and licensed by Great Minds. ©2015 Great Minds. eureka- math.org
G7-M1-ETP-1.3.0-05.2015
8
Lesson 8: Representing Proportional Relationships with Equations
7 Lesson 8
Name Date
Lesson 8: Representing Proportional Relationships with
Equations
Exit Ticket
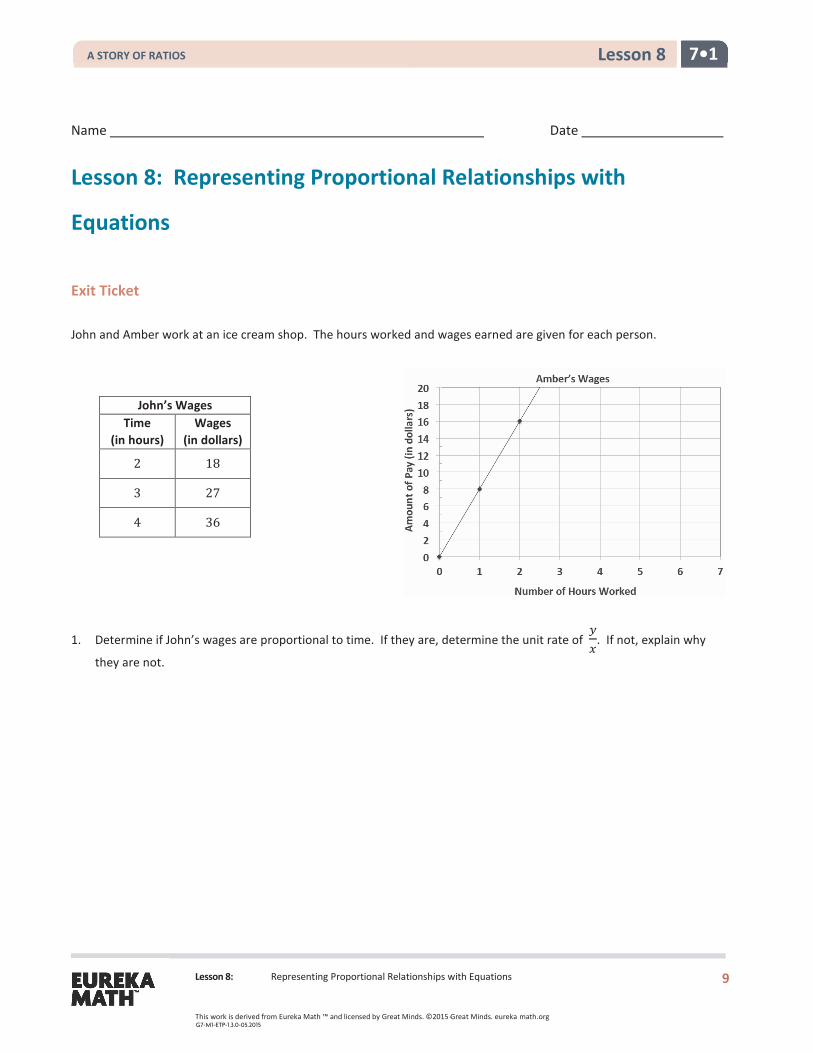
John and Amber work at an ice cream shop. The hours worked and wages earned are given for each person.
1. Determine if John’s wages are proportional to time. If they are, determine the unit rate of . If not, explain why
they are not.
John’s ages
Time
(in hours)
ages
(in dollars)
2 18
3 27
4 36
A STORY OF RATIOS
This work is derived from Eureka Math ™ and licensed by Great Minds. ©2015 Great Minds. eureka- math.org
G7-M1-ETP-1.3.0-05.2015
9

Lesson 8: Representing Proportional Relationships with Equations
7 Lesson 8
2. Determine if Amber’s wages are proportional to time. If they are, determine the unit rate of . If not, explain why
they are not.
3. Write an equation for both John and Amber that models the relationship between their wage and the time they
worked. Identify the constant of proportionality for each. Explain what it means in the context of the situation.
4. How much would each worker make after working 10 hours? Who will earn more money?
5. How long will it take each worker to earn $50?
A STORY OF RATIOS
This work is derived from Eureka Math ™ and licensed by Great Minds. ©2015 Great Minds. eureka- math.org
G7-M1-ETP-1.3.0-05.2015
10

7 Lesson 9
Lesson 9: Representing Proportional Relationships with Equations
Name Date
Lesson 9: Representing Proportional Relationships with
Equations
Exit Ticket
Oscar and Maria each wrote an equation that they felt represented the proportional relationship between distance in
kilometers and distance in miles. One entry in the table paired 152 km with 95 miles. If represents the number of
kilometers and represents the number of miles, who wrote the correct equation that would relate kilometers to
miles? Explain why.
Oscar wrote the equation = 1.6 , and he said that the unit rate .
represents kilometers per mile.
Maria wrote the equation = 0.625 as her equation, and she said that 0.625 represents kilometers per mile.
A STORY OF RATIOS
This work is derived from Eureka Math ™ and licensed by Great Minds. ©2015 Great Minds. eureka- math.org
G7-M1-ETP-1.3.0-05.2015
11
: Interpreting Graphs of Proportional Relationships
7
Name ___________________________________________________ Date____________________
Exit Ticket
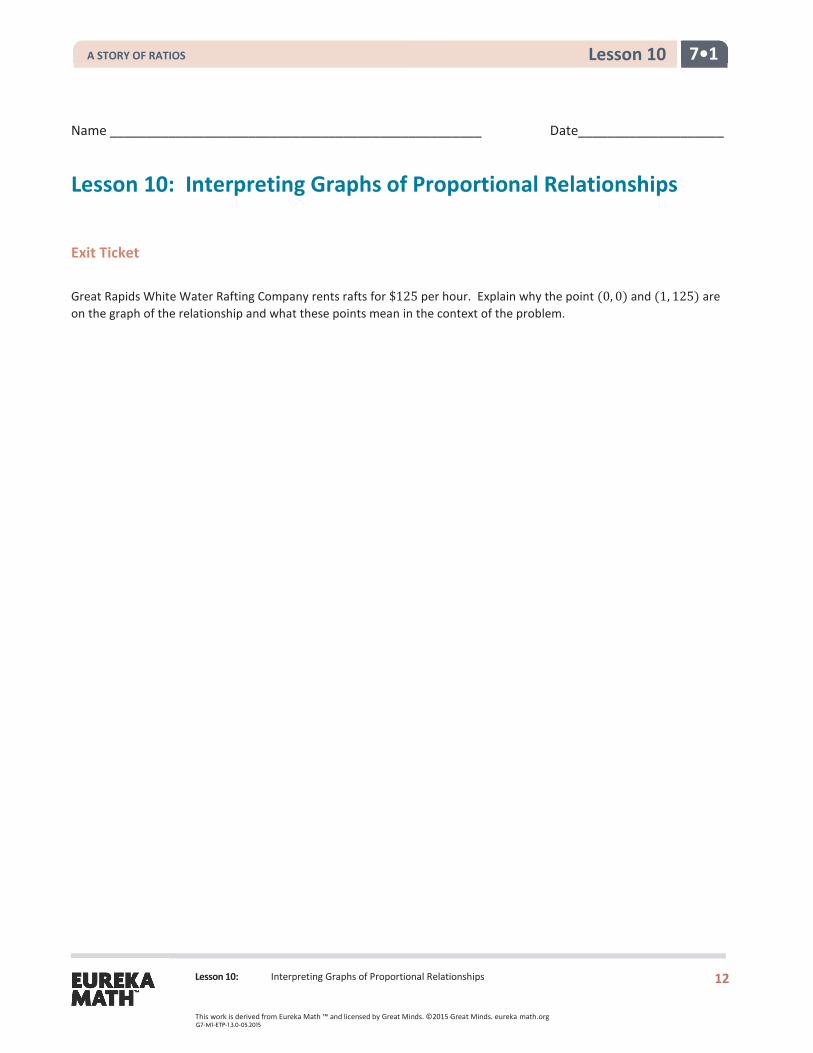
Great Rapids White Water Rafting Company rents rafts for $125 per hour. Explain why the point (0, 0) and (1, 125) are
on the graph of the relationship and what these points mean in the context of the problem.
A STORY OF RATIOS
This work is derived from Eureka Math ™ and licensed by Great Minds. ©2015 Great Minds. eureka- math.org
G7-M1-ETP-1.3.0-05.2015
12

Lesson 11: Ratios of Fractions and Their Unit Rates
7 Lesson 11
Name ___________________________________________________ Date____________________
Lesson 11: Ratios of Fractions and Their Unit Rates
Exit Ticket
Which is the better buy? Show your work and explain your reasoning.
313
lb. of turkey for $10.50 21
2 lb. of turkey for $6.25
A STORY OF RATIOS
This work is derived from Eureka Math ™ and licensed by Great Minds. ©2015 Great Minds. eureka- math.org
G7-M1-ETP-1.3.0-05.2015
13

7
: Ratios of Fractions and Their Unit Rates
Name ___________________________________________________ Date____________________
Exit Ticket
If 334
lb. of candy cost $20.25, how much would 1 lb. of candy cost?
A STORY OF RATIOS
This work is derived from Eureka Math ™ and licensed by Great Minds. ©2015 Great Minds. eureka- math.org
G7-M1-ETP-1.3.0-05.2015
14

7 Lesson 13
Lesson 13: Finding Equivalent Ratios Given the Total Quantity
Name ___________________________________________________ Date____________________
Lesson 13: Finding Equivalent Ratios Given the Total Quantity
Exit Ticket
The table below shows the combination of a dry prepackaged mix and water to make concrete. The mix says for every 1
gallon of water stir 60 pounds of dry mix. We know that 1 gallon of water is equal to 8 pounds of water. Using the
information provided in the table, complete the remaining parts of the table.
Dry Mix (pounds) Water (pounds) Total (pounds)
8
75 10
141
6
41
2
A STORY OF RATIOS
This work is derived from Eureka Math ™ and licensed by Great Minds. ©2015 Great Minds. eureka- math.org
G7-M1-ETP-1.3.0-05.2015
15

7
: Multi-Step Ratio Problems
Name ___________________________________________________ Date____________________
-Step Ratio Problems
Exit Ticket
1. A bicycle shop advertised all mountain bikes priced at a discount.
a. What is the amount of the discount if the bicycle originally costs $327?
b. What is the discount price of the bicycle?
c. Explain how you found your solution to part (b).
2. A hand-held digital music player was marked down by of the original price.
a. If the sales price is $128.00, what is the original price?
b. If the item was marked up by before it was placed on the sales floor, what was the price that the store paid
for the digital player?
c. What is the difference between the discount price and the price that the store paid for the digital player?
A STORY OF RATIOS
This work is derived from Eureka Math ™ and licensed by Great Minds. ©2015 Great Minds. eureka- math.org
G7-M1-ETP-1.3.0-05.2015
16

7 Lesson 15
Lesson 15: Equations of Graphs of Proportional Relationships Involving Fractions
Name ___________________________________________________ Date____________________
Lesson 15: Equations of Graphs of Proportional Relationships
Involving Fractions
Exit Ticket
Using the graph and its title:
1. Describe the relationship that the graph depicts.
2. Identify two points on the line, and explain what they
mean in the context of the problem.
3. What is the unit rate?
4. What point represents the unit rate?
A STORY OF RATIOS
This work is derived from Eureka Math ™ and licensed by Great Minds. ©2015 Great Minds. eureka- math.org
G7-M1-ETP-1.3.0-05.2015
17

7 Lesson 16
Lesson 16: Relating Scale Drawings to Ratios and Rates
Name ___________________________________________________ Date____________________
Lesson 16: Relating Scale Drawings to Ratios and Rates
Exit Ticket
Use the following figure on the graph for Problems 1 and 2.
1.
a. If the original lengths are multiplied by 2, what are the new coordinates?
b. Use the table to organize lengths (the vertical and horizontal legs).
Width Height
Actual Picture (in units)
New Picture (in units)
c. Is the new picture a reduction or an enlargement?
d. What is the constant of proportionality?
A STORY OF RATIOS
This work is derived from Eureka Math ™ and licensed by Great Minds. ©2015 Great Minds. eureka- math.org
G7-M1-ETP-1.3.0-05.2015
18

7 Lesson 16
Lesson 16: Relating Scale Drawings to Ratios and Rates
2.
a. If the original lengths are multiplied by , what are the new coordinates?
b. Use the table to organize lengths (the vertical and horizontal legs).
Width Height
Actual Picture (in units)
New Picture (in units)
c. Is the new picture a reduction or an enlargement?
d. What is the constant of proportionality?
A STORY OF RATIOS
This work is derived from Eureka Math ™ and licensed by Great Minds. ©2015 Great Minds. eureka- math.org
G7-M1-ETP-1.3.0-05.2015
19

: The Unit Rate as the Scale Factor
7
Name ___________________________________________________ Date____________________
Unit Rate as the Scale Factor
Exit Ticket
A rectangular pool in your friend’s yard is 150 ft. × 400 ft. Create a scale drawing with a scale factor of . Use a table
or an equation to show how you computed the scale drawing lengths.
A STORY OF RATIOS
This work is derived from Eureka Math ™ and licensed by Great Minds. ©2015 Great Minds. eureka- math.org
G7-M1-ETP-1.3.0-05.2015
20

7
: Computing Actual Lengths from a Scale Drawing
Name ___________________________________________________ Date____________________
rom a Scale Drawing
Exit Ticket
A drawing of a surfboard in a catalog shows its length as 8 inches. Find the actual length of the surfboard if inch
length on the drawing corresponds to foot of actual length.
A STORY OF RATIOS
This work is derived from Eureka Math ™ and licensed by Great Minds. ©2015 Great Minds. eureka- math.org
G7-M1-ETP-1.3.0-05.2015
21
: Computing Actual Areas from a Scale Drawing
7
Name ___________________________________________________ Date____________________
Exit Ticket
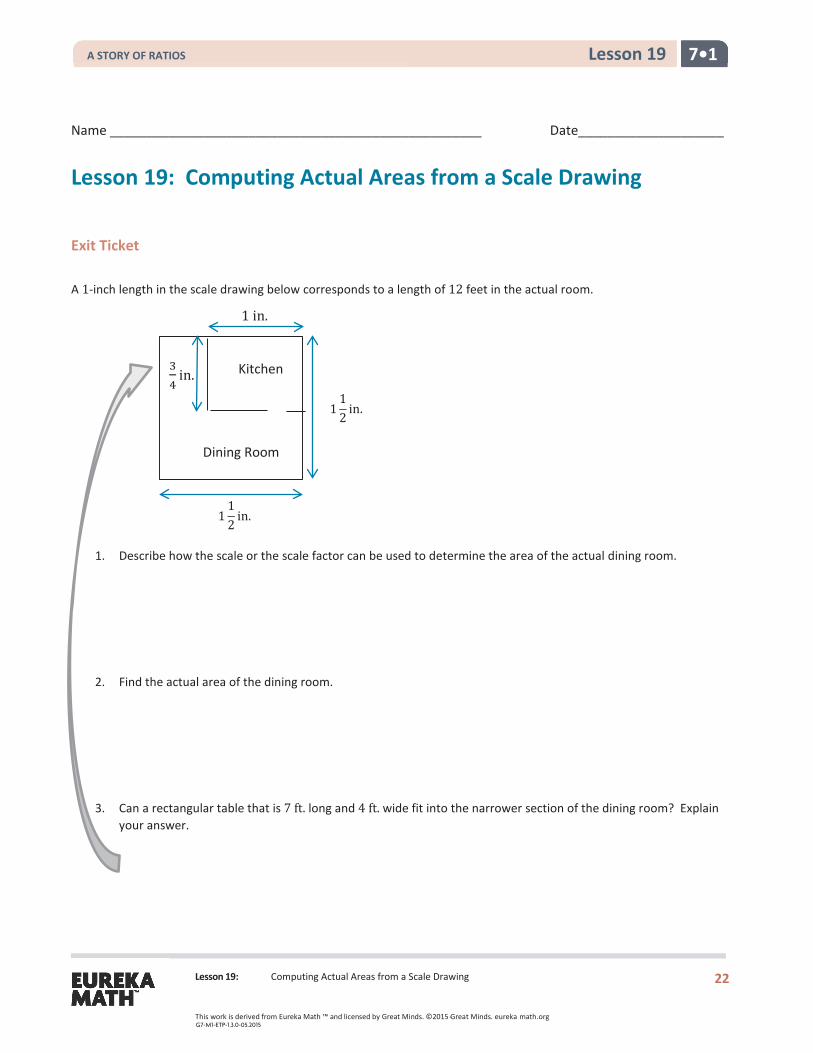
A 1-inch length in the scale drawing below corresponds to a length of 12 feet in the actual room.
1. Describe how the scale or the scale factor can be used to determine the area of the actual dining room.
2. Find the actual area of the dining room.
3. Can a rectangular table that is 7 ft. long and 4 ft. wide fit into the narrower section of the dining room? Explain
your answer.
11
2in.
Dining Room
Kitchen
11
2in.
in.
1 in.
A STORY OF RATIOS
This work is derived from Eureka Math ™ and licensed by Great Minds. ©2015 Great Minds. eureka- math.org
G7-M1-ETP-1.3.0-05.2015
22

Lesson 20: An Exercise in Creating a Scale Drawing
7 Lesson 20
Name ___________________________________________________ Date____________________
Lesson 20: An Exercise in Creating a Scale Drawing
Exit Ticket
1. Your sister has just moved into a loft-style apartment in Manhattan and has asked you to be her designer. Indicate
the placement of the following objects on the floorplan using the appropriate scale: queen-size bed
(60 in. by 80 in.), sofa (36 in. by 64 in.), and dining table (48 in. by 48 in.) In the following scale drawing,
1 cm represents 2 ft. Each square on the grid is 1 cm².
2. Choose one object and explain the procedure to find the scale lengths.
A STORY OF RATIOS
This work is derived from Eureka Math ™ and licensed by Great Minds. ©2015 Great Minds. eureka- math.org
G7-M1-ETP-1.3.0-05.2015
23

Lesson 22: An Exercise in Changing Scales
7 Lesson 22
Name ___________________________________________________ Date____________________
Lesson 22: An Exercise in Changing Scales
Exit Ticket
The school is building a new wheelchair ramp for one of the remodeled bathrooms. The original drawing was created by
the contractor, but the principal drew another scale drawing to see the size of the ramp relative to the walkways
surrounding it. Find the missing values on the table.
Original Scale Drawing Principal’s Scale Drawing
New Scale Factor of 2 to the actual ramp:
. .
Actual Ramp Original Scale Drawing Principal’s Scale Drawing
Actual Ramp 1
Original Scale Drawing 1 4
Principal’s Scale Drawing
A STORY OF RATIOS
This work is derived from Eureka Math ™ and licensed by Great Minds. ©2015 Great Minds. eureka- math.org
G7-M1-ETP-1.3.0-05.2015
24