existing traffic and parking conditions and …
TRANSCRIPT
EXISTING TRAFFIC AND PARKING CONDITIONS
AND IMPLICATIONS FOR
TRANSPORTATION ALTERNATIVES:
LITTLE BIGHORN BATTLEFIELD NATIONAL MONUMENT
FINAL REPORT
Prepared by: Jonathan Upchurch, P.E., P.T.O.E. November 16, 2010
i
Acknowledgments The author gratefully appreciates the assistance of the National Park Service staff at Little Bighorn Battlefield National Monument who helped to make this study a success. The following staff are acknowledged in particular: Kate Hammond, Superintendent; Michael Stops, Chief Ranger; Joseph Vallie, Lead Visitor Use Assistant; and Marvin Dawes, Division of Interpretation. The author also thanks the following National Park Service staff at the Denver Service Center, Intermountain Region, and Cooperative Ecosystems Study Unit: Debra Frye, Jayne Schaeffer, Jennifer Staroska, Cam Hugie, and Anne Trinkle Jones. The staff of Sanderson-Stewart, a transportation engineering consulting firm in Billings, Montana are also thanked for their role in deploying automated traffic counting machines to collect traffic volume data. Dr. Christopher Upchurch assisted in the analysis of pulse data from the traffic counting machines to determine the numbers of oversize vehicles.
Photo on page 33 by Bob Glover. All other photos are by Jonathan Upchurch.
ii
Executive Summary This study evaluated existing traffic and parking conditions at Little Bighorn Battlefield National Monument. In addition, the study evaluated possible transportation alternatives in the context of those findings. The concept of a “Design Day” is presented. Design Day refers to the level of daily visitation for which a system or facility is designed. Frequently, the fifth to tenth highest day of the year is selected on the basis that it is uneconomical to construct facilities large enough to handle the highest day of visitation. For Little Bighorn, the 2010 Design Day was selected to correspond to 660 vehicles entering the Monument which lies between the fifth and tenth highest days in both 2009 and 2010. On the 2010 Design Day there is almost as much parking space available as there is parking demand. Under existing conditions there is a shortage of parking space for oversize vehicles on the Design Day, but by implementing minor improvements and parking management, parking could be better distributed among parking spaces for regular size and oversize vehicles. This would reduce the shortage. In 2010 the highest day of visitation - the June 25th anniversary date - had 50 percent more vehicles enter the Monument than the Design Day. For this date and other predictable high visitation days, the Monument could develop a “special event” strategy. Parking management could include bus transportation via school bus from an off-site location to the Visitor Center area to handle some (not necessarily all) of the visitors. The Monument could also offer bus service for the Tour Road. About 50 to 55 percent of visitor vehicles drive on the Tour Road. An additional 6 to 7 percent of visitors take the concession-operated guided bus tours on the Tour Road. Oversize vehicles – vehicles more than 20 feet long that would not fit in a regular parking space - account for 19 to 25 percent of the vehicles entering the Monument. Eleven percent of vehicles on the Tour Road are oversize. Considering existing traffic and parking conditions, possible transportation alternatives were evaluated. Visitation is very seasonal and current traffic and congestion problems occur only during several weeks of the summer. It appears that if some type of shuttle bus system were implemented, it would be needed only from mid-June through the third week in August, a period of about 10 weeks.
iii
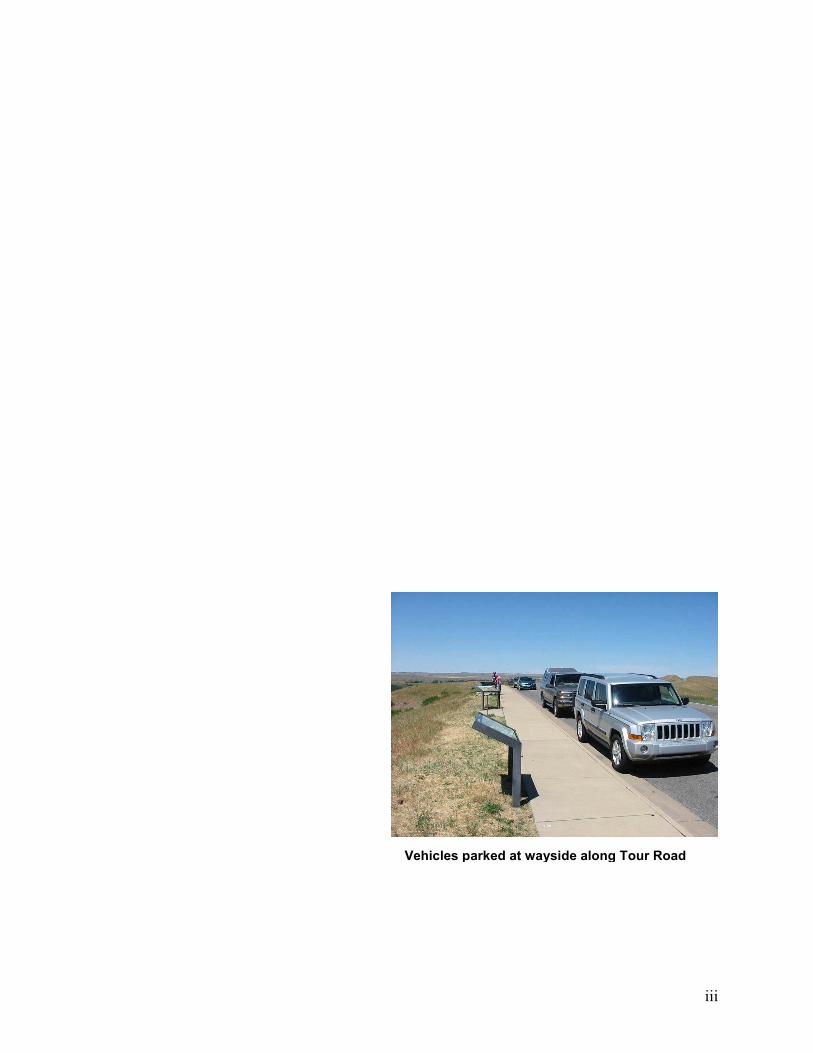
Vehicles parked at wayside along Tour Road
iv
TABLE OF CONTENTS Page Project Background 1 Description of Issues 1
Location, Operations and Transportation Infrastructure 2
Context of This Study 6
Season 6
Variation in Visitation During the Summer Season 6
2010 Visitation Compared to Past History 7
Uncertainty in Levels of Future Visitation – Strategy to Plan in the Face of
Uncertainty 9
Variation in Visitation During the Summer Season 9
2009 and 2010 9
Concept of “Design Day” 14
Existing Conditions 16
Traffic Counts 16
Arrival and Departure Pattern 17
Accumulation of Vehicles 18
Parking Occupancy 20
Tour Road Conditions 23
Tour Road Usage 26
Oversize Vehicles 27
Ridership on Existing Tour Service 29
Entrance Station Congestion 30
Comparison of Findings: 1998 Traffic Safety Study and 2010 Study 30
v
Page Short-Term Improvements 32
Strategies for Days with Visitation Higher than the Design Day 32
What Do Existing Conditions Mean for Possible Transportation Alternatives 33
Alternative A Expand Existing Parking Lots & Widen Road 34
Alternative B Off-site Oversize Vehicle Parking & Shuttle 35
Alternative C Oversize Vehicle Demand Management (No Build) 37
Alternative D Restrict or Close Battlefield Road 38
Alternative E One-way Road (From GMP) 39
Alternative F - Close Tour Road to all Visitor Vehicles 40
Alternative G - Require Trailers to be Parked outside of Entrance 41
Alternative H – Visitor Center Expansion 41
Length of Season for Shuttle System 41
Summary Regarding Alternatives 42
References 42 APPENDIX A: PUBLIC USE COUNTING AND REPORTING INSTRUCTIONS 44 APPENDIX B: LIBI Entrance Station Counts – 2009 and 2010 46
APPENDIX C: PERCENTAGE OF VISITORS TAKING THE CONCESSION-OPERATED GUIDED BUS TOUR 48
APPENDIX D: July 26, 2010 report entitled RECOMMENDATIONS ON PARKING ISSUES AT LITTLE BIGHORN BATTLEFIELD NATIONAL MONUMENT
1
Project Background In 1998 a Traffic Safety Study [Reference 1] was completed for Little Bighorn Battlefield National Monument. Levels of visitation, traffic volume, and parking demand have changed during the past 12 years and the National Monument is now experiencing several traffic congestion, parking congestion, highway capacity, and related issues. It is anticipated that a major study to evaluate these problems and to evaluate the feasibility of an alternative transportation system will be conducted in 2011. To be well prepared for that study, and to provide support for that evaluation, current information is needed on traffic demand, parking demand, parking duration, and other measures of transportation use. This project, conducted during the summer of 2010, collected traffic data and provides analysis of existing traffic and parking demand. This report also makes recommendations for short-term improvements and evaluates possible transportation alternatives. The scope of this study did not include a comprehensive evaluation of safety issues associated with parking, transit, or Tour Road use.
Description of Issues Further elaboration of the issues facing Little Bighorn Battlefield National Monument will provide the reader with a stronger understanding of traffic and parking challenges.
The Monument’s recent transportation issues date back to the 1980’s. The 1986 General Management Plan (GMP) highlighted the grossly inadequate parking capacity at the Monument, particularly for oversize vehicles, and suggested a transit system in conjunction with a relocated visitor center. For a variety of political reasons, the visitor center has never been relocated, and in the meantime the parking situation has gotten worse with increasing numbers of oversize vehicles and no adequate parking for them. The road is also narrow for oversize vehicles and has other structural issues as well. The parking lots and Tour Road both traverse through a cultural landscape and sensitive resources. In 1998 a traffic safety study was done, which suggested a closer look at the viability of transit, but the closer look was never completed. Understanding the financial and logistical challenges of a transit system, Superintendent Cook and Monument staff worked with the Denver Service Center to develop a Federal Highway Administration (FHWA) project to expand the parking lot and widen the Tour Road, and also to address some fundamental structural issues with the Tour Road. That project is, at this time, on indefinite hold. Concerns remain among Monument staff , Superintendent Hammond, some stakeholders, and some National Park Service regional staff about whether there is any other viable option to address the safety and parking issues without increasing the footprint on the landscape. The parking problem is primarily a seasonal one, with lack of adequate oversize vehicle parking occurring during the Monument’s high summer season, and during peak times of the day, roughly mid-morning to mid-afternoon.
2
The structural problems of the Tour Road and safety for passing vehicles occur at all times of the year. It is estimated that over half of vehicles that enter the Monument drive the Tour Road. Ultimately, the question is how to provide visitors access to the Monument, in a safe, non-stressful way that impacts the Monument resources as little as possible, and all in an economically responsible matter.
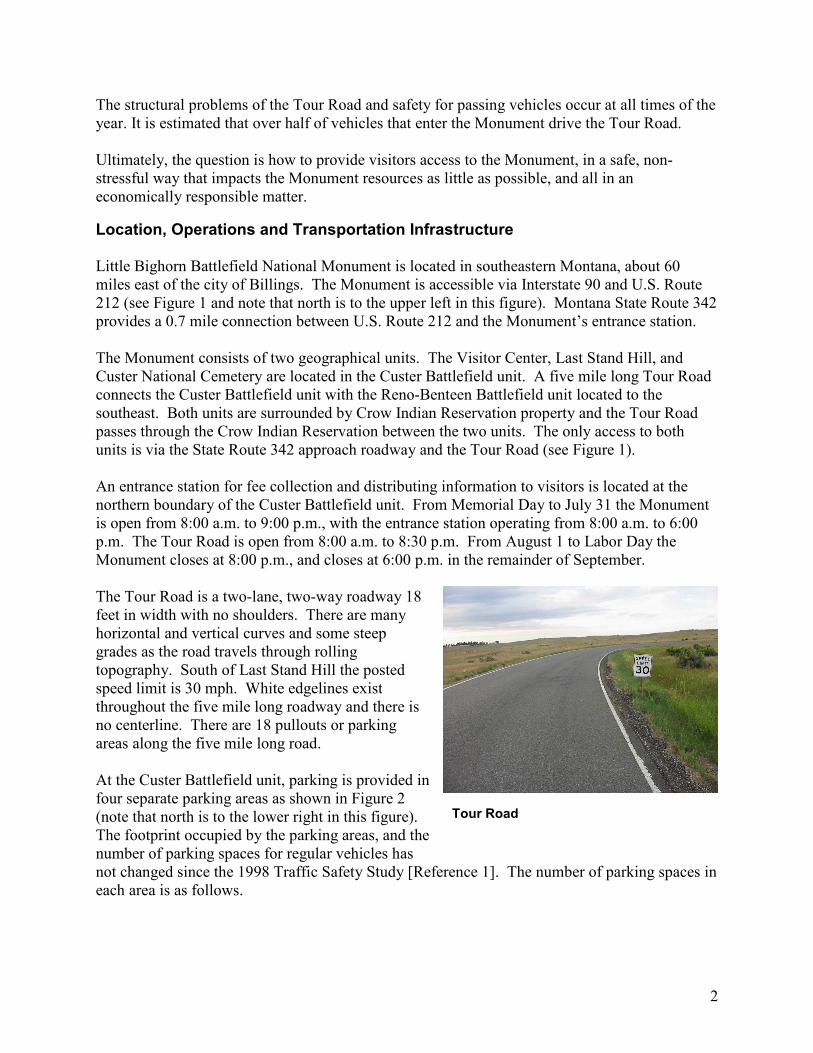
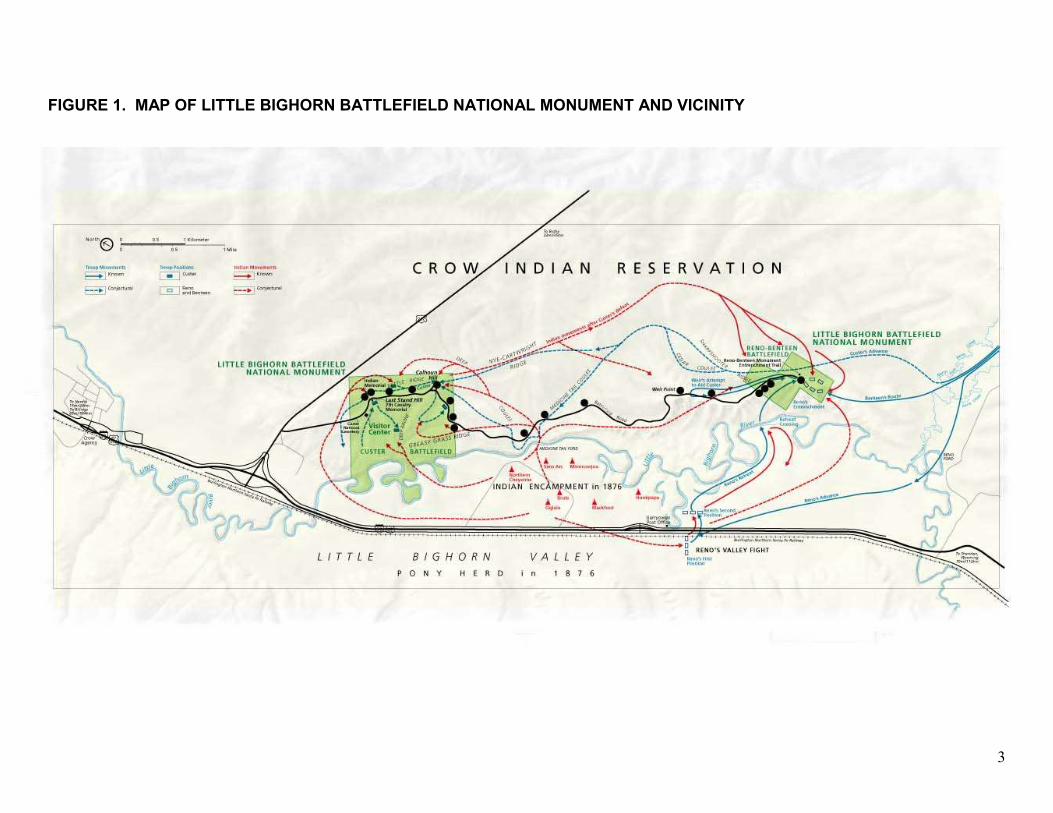
Location, Operations and Transportation Infrastructure Little Bighorn Battlefield National Monument is located in southeastern Montana, about 60 miles east of the city of Billings. The Monument is accessible via Interstate 90 and U.S. Route 212 (see Figure 1 and note that north is to the upper left in this figure). Montana State Route 342 provides a 0.7 mile connection between U.S. Route 212 and the Monument’s entrance station. The Monument consists of two geographical units. The Visitor Center, Last Stand Hill, and Custer National Cemetery are located in the Custer Battlefield unit. A five mile long Tour Road connects the Custer Battlefield unit with the Reno-Benteen Battlefield unit located to the southeast. Both units are surrounded by Crow Indian Reservation property and the Tour Road passes through the Crow Indian Reservation between the two units. The only access to both units is via the State Route 342 approach roadway and the Tour Road (see Figure 1). An entrance station for fee collection and distributing information to visitors is located at the northern boundary of the Custer Battlefield unit. From Memorial Day to July 31 the Monument is open from 8:00 a.m. to 9:00 p.m., with the entrance station operating from 8:00 a.m. to 6:00 p.m. The Tour Road is open from 8:00 a.m. to 8:30 p.m. From August 1 to Labor Day the Monument closes at 8:00 p.m., and closes at 6:00 p.m. in the remainder of September. The Tour Road is a two-lane, two-way roadway 18 feet in width with no shoulders. There are many horizontal and vertical curves and some steep grades as the road travels through rolling topography. South of Last Stand Hill the posted speed limit is 30 mph. White edgelines exist throughout the five mile long roadway and there is no centerline. There are 18 pullouts or parking areas along the five mile long road. At the Custer Battlefield unit, parking is provided in four separate parking areas as shown in Figure 2 (note that north is to the lower right in this figure). The footprint occupied by the parking areas, and the number of parking spaces for regular vehicles has not changed since the 1998 Traffic Safety Study [Reference 1]. The number of parking spaces in each area is as follows.
Tour Road
3
FIGURE 1. MAP OF LITTLE BIGHORN BATTLEFIELD NATIONAL MONUMENT AND VICINITY
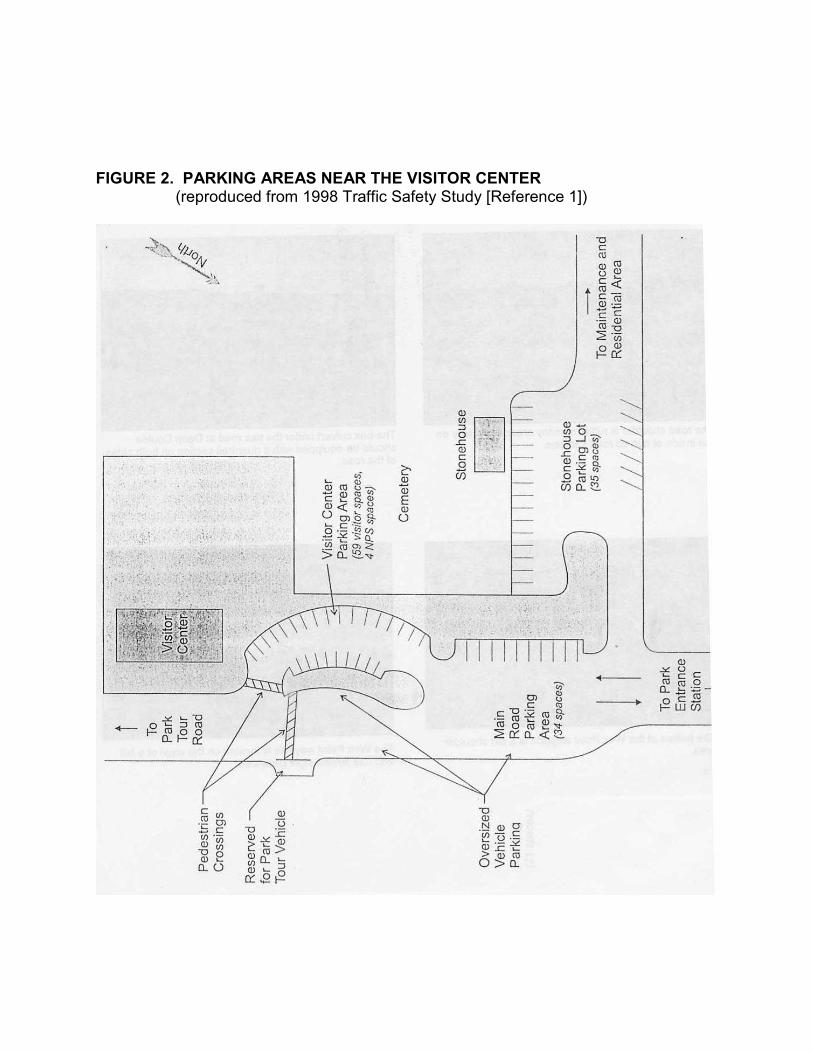
FIGURE 2. PARKING AREAS NEAR THE VISITOR CENTER (reproduced from 1998 Traffic Safety Study [Reference 1])
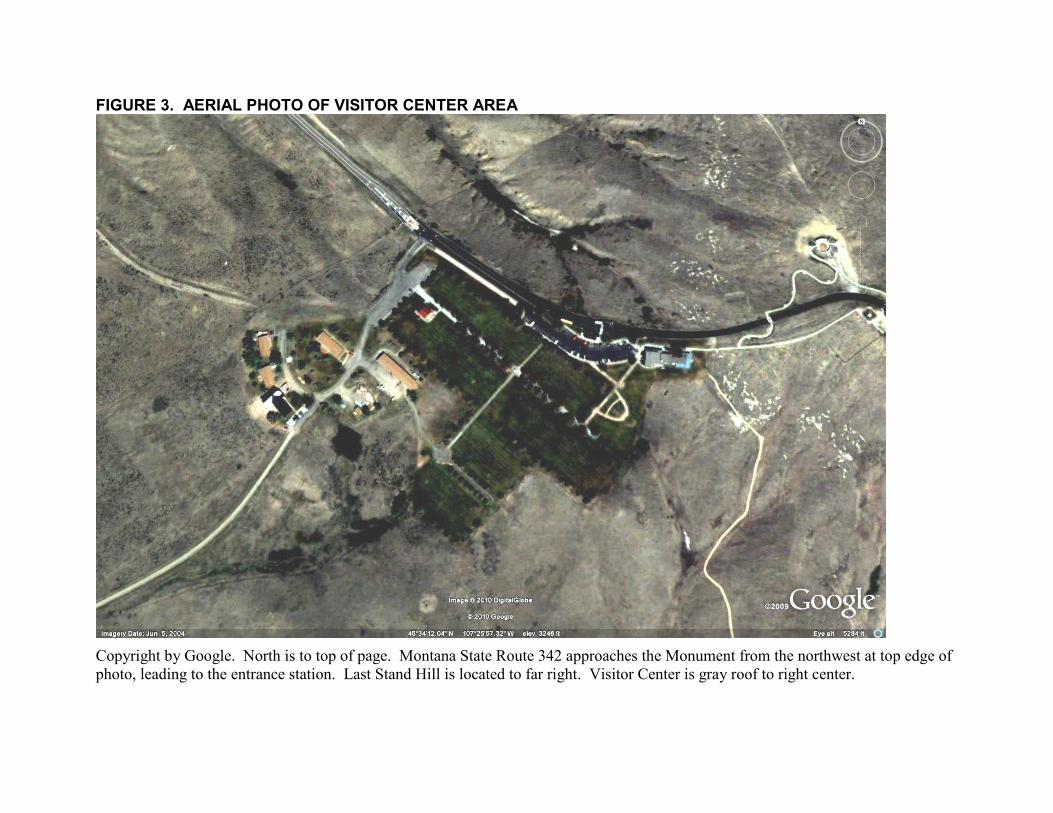
FIGURE 3. AERIAL PHOTO OF VISITOR CENTER AREA
Copyright by Google. North is to top of page. Montana State Route 342 approaches the Monument from the northwest at top edge of photo, leading to the entrance station. Last Stand Hill is located to far right. Visitor Center is gray roof to right center.
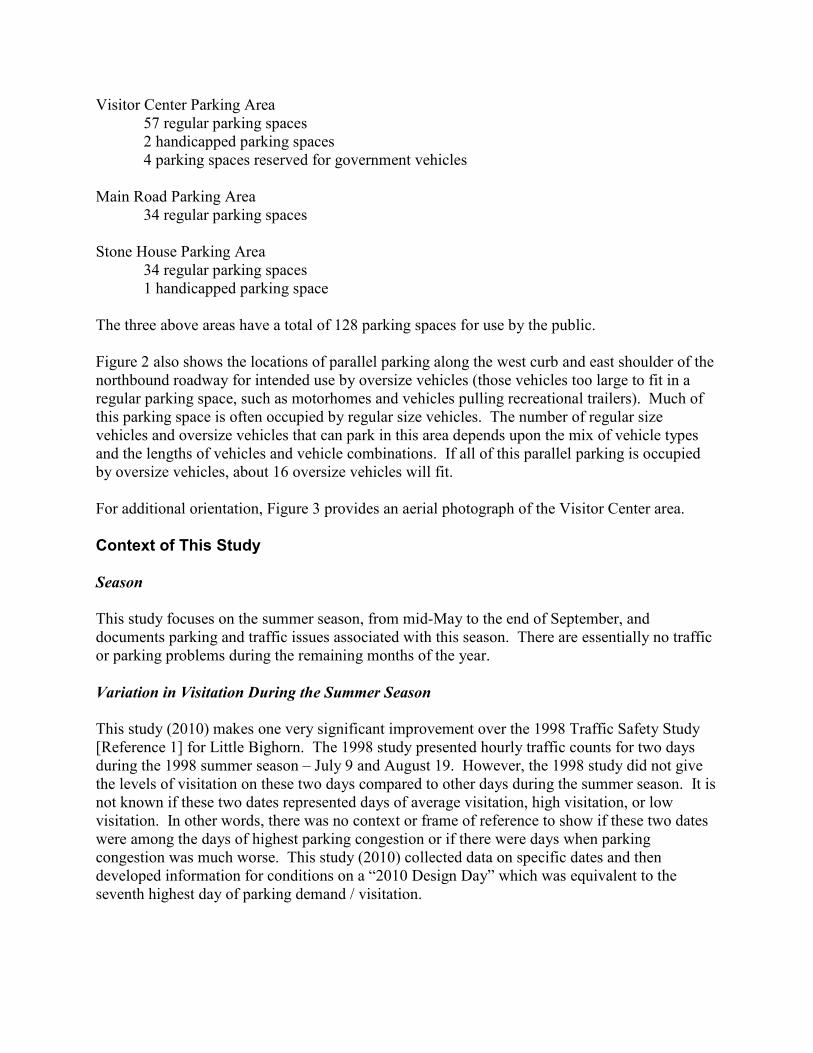
Visitor Center Parking Area 57 regular parking spaces 2 handicapped parking spaces 4 parking spaces reserved for government vehicles
Main Road Parking Area
34 regular parking spaces Stone House Parking Area
34 regular parking spaces 1 handicapped parking space
The three above areas have a total of 128 parking spaces for use by the public. Figure 2 also shows the locations of parallel parking along the west curb and east shoulder of the northbound roadway for intended use by oversize vehicles (those vehicles too large to fit in a regular parking space, such as motorhomes and vehicles pulling recreational trailers). Much of this parking space is often occupied by regular size vehicles. The number of regular size vehicles and oversize vehicles that can park in this area depends upon the mix of vehicle types and the lengths of vehicles and vehicle combinations. If all of this parallel parking is occupied by oversize vehicles, about 16 oversize vehicles will fit. For additional orientation, Figure 3 provides an aerial photograph of the Visitor Center area.
Context of This Study
Season
This study focuses on the summer season, from mid-May to the end of September, and documents parking and traffic issues associated with this season. There are essentially no traffic or parking problems during the remaining months of the year.
Variation in Visitation During the Summer Season
This study (2010) makes one very significant improvement over the 1998 Traffic Safety Study [Reference 1] for Little Bighorn. The 1998 study presented hourly traffic counts for two days during the 1998 summer season – July 9 and August 19. However, the 1998 study did not give the levels of visitation on these two days compared to other days during the summer season. It is not known if these two dates represented days of average visitation, high visitation, or low visitation. In other words, there was no context or frame of reference to show if these two dates were among the days of highest parking congestion or if there were days when parking congestion was much worse. This study (2010) collected data on specific dates and then developed information for conditions on a “2010 Design Day” which was equivalent to the seventh highest day of parking demand / visitation.
7
2010 Visitation Compared to Past History
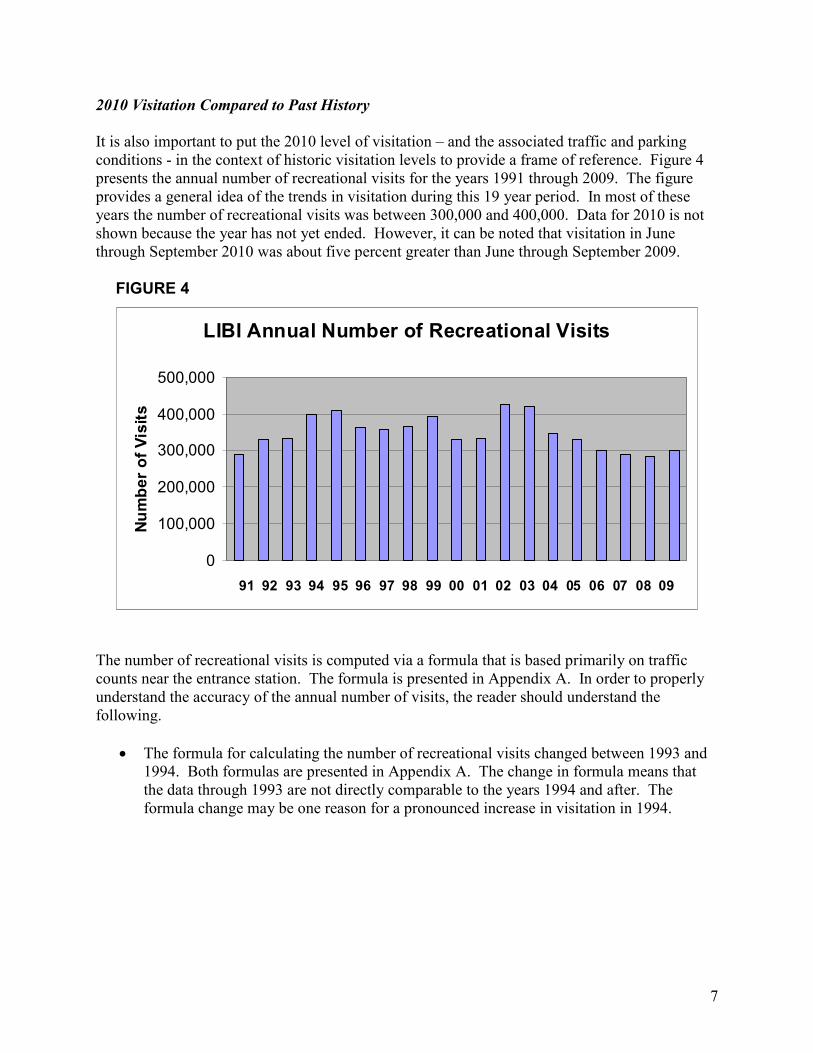
It is also important to put the 2010 level of visitation – and the associated traffic and parking conditions - in the context of historic visitation levels to provide a frame of reference. Figure 4 presents the annual number of recreational visits for the years 1991 through 2009. The figure provides a general idea of the trends in visitation during this 19 year period. In most of these years the number of recreational visits was between 300,000 and 400,000. Data for 2010 is not shown because the year has not yet ended. However, it can be noted that visitation in June through September 2010 was about five percent greater than June through September 2009.
FIGURE 4
The number of recreational visits is computed via a formula that is based primarily on traffic counts near the entrance station. The formula is presented in Appendix A. In order to properly understand the accuracy of the annual number of visits, the reader should understand the following.
• The formula for calculating the number of recreational visits changed between 1993 and 1994. Both formulas are presented in Appendix A. The change in formula means that the data through 1993 are not directly comparable to the years 1994 and after. The formula change may be one reason for a pronounced increase in visitation in 1994.
LIBI Annual Number of Recreational Visits
0
100,000
200,000
300,000
400,000
500,000
91 92 93 94 95 96 97 98 99 00 01 02 03 04 05 06 07 08 09
Number of Visits
8
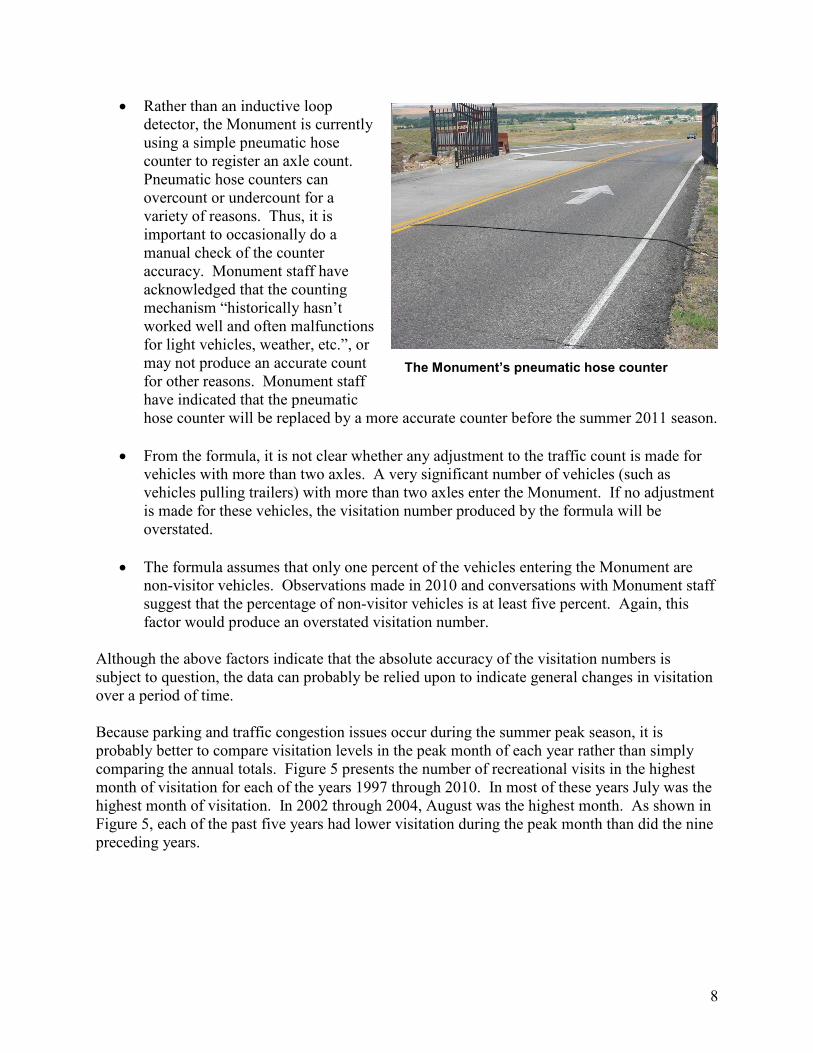
• Rather than an inductive loop detector, the Monument is currently using a simple pneumatic hose counter to register an axle count. Pneumatic hose counters can overcount or undercount for a variety of reasons. Thus, it is important to occasionally do a manual check of the counter accuracy. Monument staff have acknowledged that the counting mechanism “historically hasn’t worked well and often malfunctions for light vehicles, weather, etc.”, or may not produce an accurate count for other reasons. Monument staff have indicated that the pneumatic hose counter will be replaced by a more accurate counter before the summer 2011 season.
• From the formula, it is not clear whether any adjustment to the traffic count is made for vehicles with more than two axles. A very significant number of vehicles (such as vehicles pulling trailers) with more than two axles enter the Monument. If no adjustment is made for these vehicles, the visitation number produced by the formula will be overstated.
• The formula assumes that only one percent of the vehicles entering the Monument are non-visitor vehicles. Observations made in 2010 and conversations with Monument staff suggest that the percentage of non-visitor vehicles is at least five percent. Again, this factor would produce an overstated visitation number.
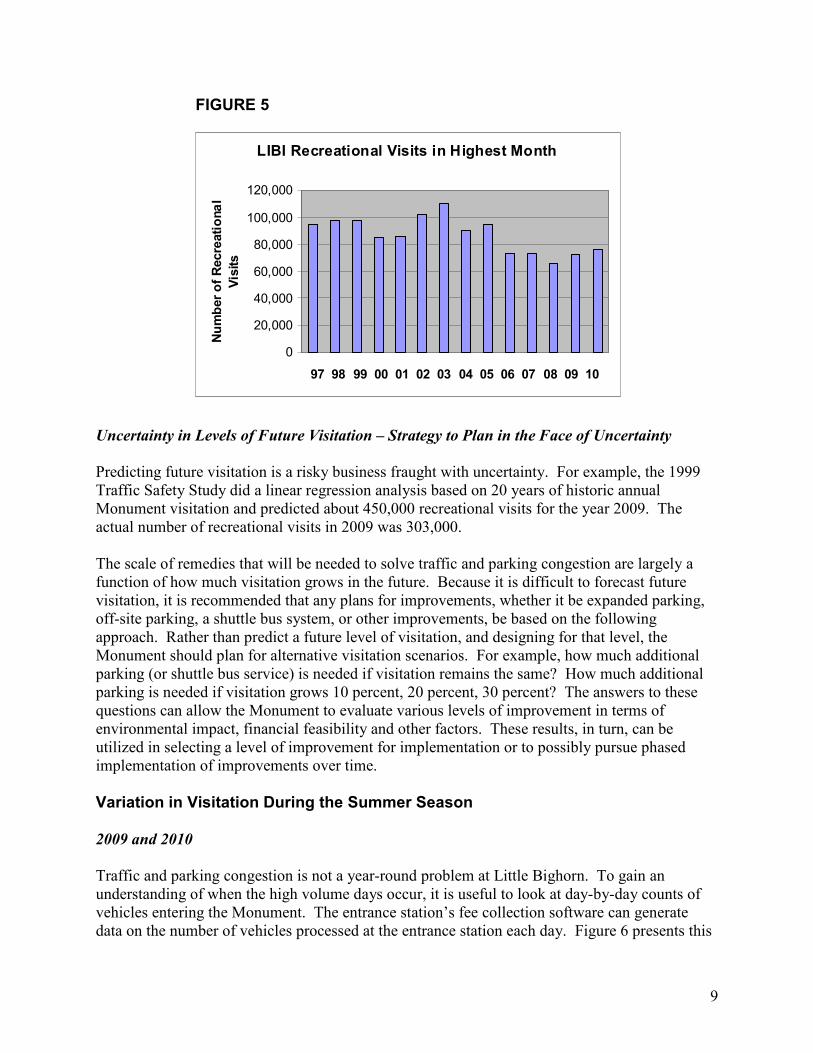
Although the above factors indicate that the absolute accuracy of the visitation numbers is subject to question, the data can probably be relied upon to indicate general changes in visitation over a period of time. Because parking and traffic congestion issues occur during the summer peak season, it is probably better to compare visitation levels in the peak month of each year rather than simply comparing the annual totals. Figure 5 presents the number of recreational visits in the highest month of visitation for each of the years 1997 through 2010. In most of these years July was the highest month of visitation. In 2002 through 2004, August was the highest month. As shown in Figure 5, each of the past five years had lower visitation during the peak month than did the nine preceding years.
The Monument’s pneumatic hose counter
9
FIGURE 5
Uncertainty in Levels of Future Visitation – Strategy to Plan in the Face of Uncertainty
Predicting future visitation is a risky business fraught with uncertainty. For example, the 1999 Traffic Safety Study did a linear regression analysis based on 20 years of historic annual Monument visitation and predicted about 450,000 recreational visits for the year 2009. The actual number of recreational visits in 2009 was 303,000. The scale of remedies that will be needed to solve traffic and parking congestion are largely a function of how much visitation grows in the future. Because it is difficult to forecast future visitation, it is recommended that any plans for improvements, whether it be expanded parking, off-site parking, a shuttle bus system, or other improvements, be based on the following approach. Rather than predict a future level of visitation, and designing for that level, the Monument should plan for alternative visitation scenarios. For example, how much additional parking (or shuttle bus service) is needed if visitation remains the same? How much additional parking is needed if visitation grows 10 percent, 20 percent, 30 percent? The answers to these questions can allow the Monument to evaluate various levels of improvement in terms of environmental impact, financial feasibility and other factors. These results, in turn, can be utilized in selecting a level of improvement for implementation or to possibly pursue phased implementation of improvements over time.
Variation in Visitation During the Summer Season 2009 and 2010
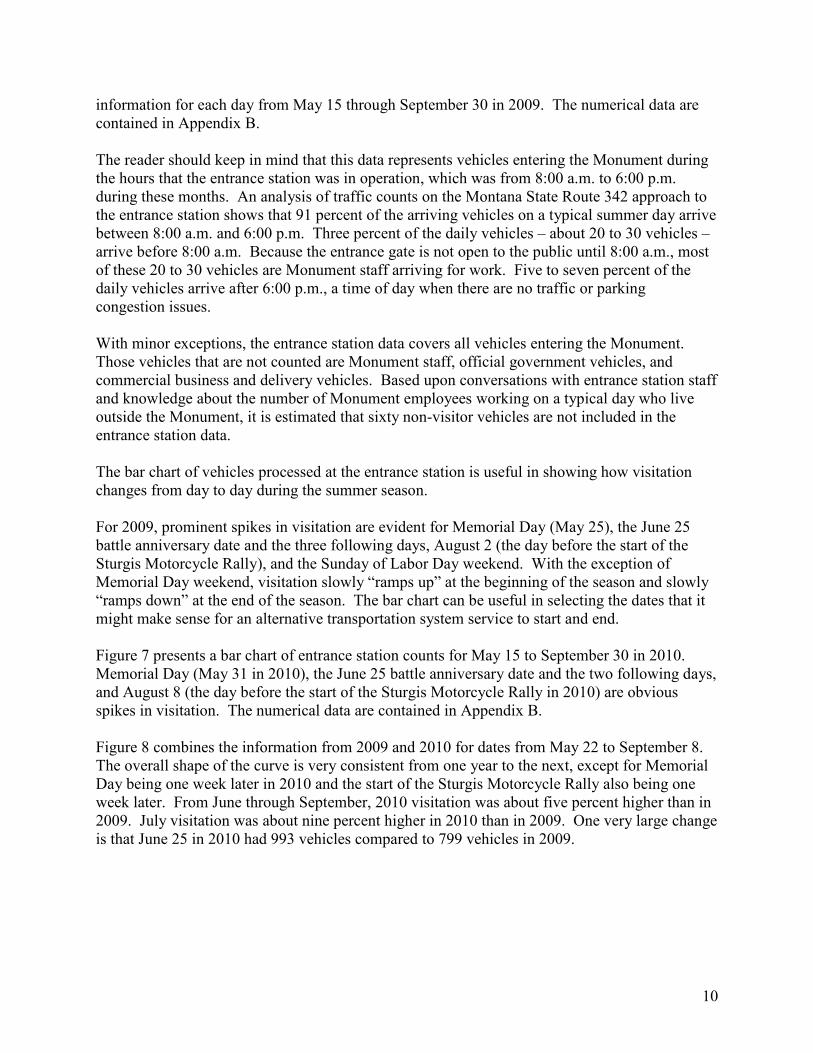
Traffic and parking congestion is not a year-round problem at Little Bighorn. To gain an understanding of when the high volume days occur, it is useful to look at day-by-day counts of vehicles entering the Monument. The entrance station’s fee collection software can generate data on the number of vehicles processed at the entrance station each day. Figure 6 presents this
LIBI Recreational Visits in Highest Month
0
20,000
40,000
60,000
80,000
100,000
120,000
97 98 99 00 01 02 03 04 05 06 07 08 09 10
Number of Recreational
Visits
10
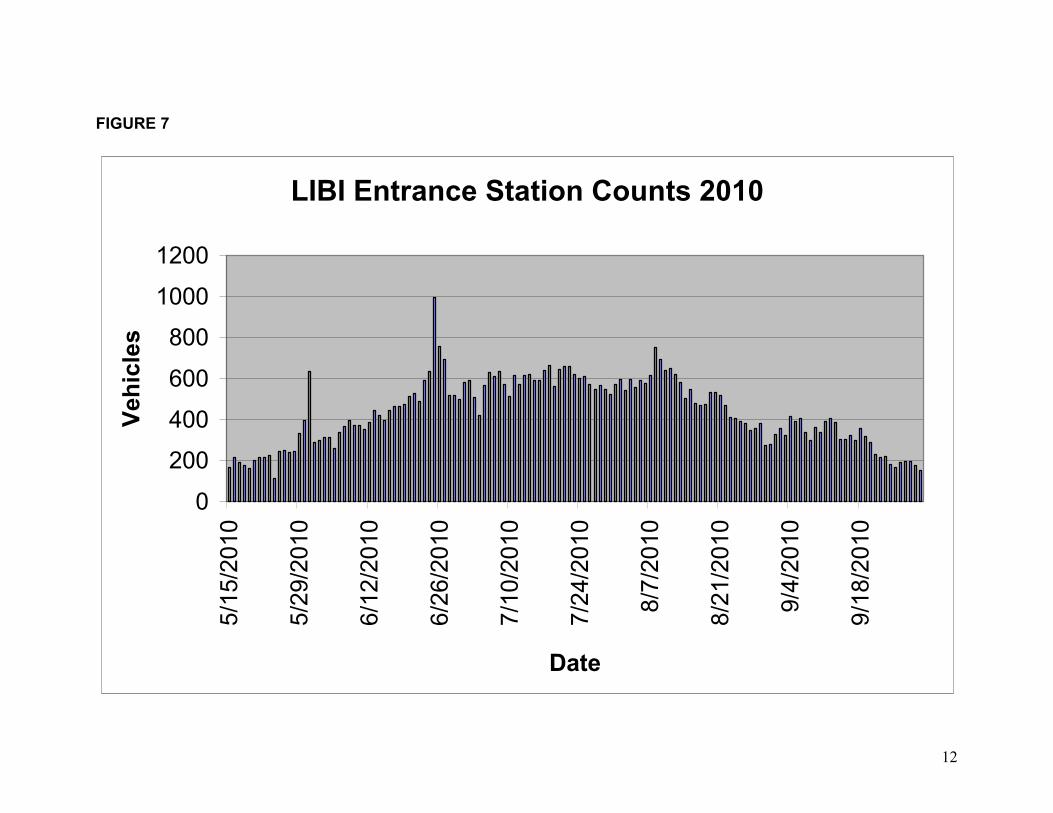
information for each day from May 15 through September 30 in 2009. The numerical data are contained in Appendix B. The reader should keep in mind that this data represents vehicles entering the Monument during the hours that the entrance station was in operation, which was from 8:00 a.m. to 6:00 p.m. during these months. An analysis of traffic counts on the Montana State Route 342 approach to the entrance station shows that 91 percent of the arriving vehicles on a typical summer day arrive between 8:00 a.m. and 6:00 p.m. Three percent of the daily vehicles – about 20 to 30 vehicles – arrive before 8:00 a.m. Because the entrance gate is not open to the public until 8:00 a.m., most of these 20 to 30 vehicles are Monument staff arriving for work. Five to seven percent of the daily vehicles arrive after 6:00 p.m., a time of day when there are no traffic or parking congestion issues. With minor exceptions, the entrance station data covers all vehicles entering the Monument. Those vehicles that are not counted are Monument staff, official government vehicles, and commercial business and delivery vehicles. Based upon conversations with entrance station staff and knowledge about the number of Monument employees working on a typical day who live outside the Monument, it is estimated that sixty non-visitor vehicles are not included in the entrance station data. The bar chart of vehicles processed at the entrance station is useful in showing how visitation changes from day to day during the summer season. For 2009, prominent spikes in visitation are evident for Memorial Day (May 25), the June 25 battle anniversary date and the three following days, August 2 (the day before the start of the Sturgis Motorcycle Rally), and the Sunday of Labor Day weekend. With the exception of Memorial Day weekend, visitation slowly “ramps up” at the beginning of the season and slowly “ramps down” at the end of the season. The bar chart can be useful in selecting the dates that it might make sense for an alternative transportation system service to start and end. Figure 7 presents a bar chart of entrance station counts for May 15 to September 30 in 2010. Memorial Day (May 31 in 2010), the June 25 battle anniversary date and the two following days, and August 8 (the day before the start of the Sturgis Motorcycle Rally in 2010) are obvious spikes in visitation. The numerical data are contained in Appendix B. Figure 8 combines the information from 2009 and 2010 for dates from May 22 to September 8. The overall shape of the curve is very consistent from one year to the next, except for Memorial Day being one week later in 2010 and the start of the Sturgis Motorcycle Rally also being one week later. From June through September, 2010 visitation was about five percent higher than in 2009. July visitation was about nine percent higher in 2010 than in 2009. One very large change is that June 25 in 2010 had 993 vehicles compared to 799 vehicles in 2009.
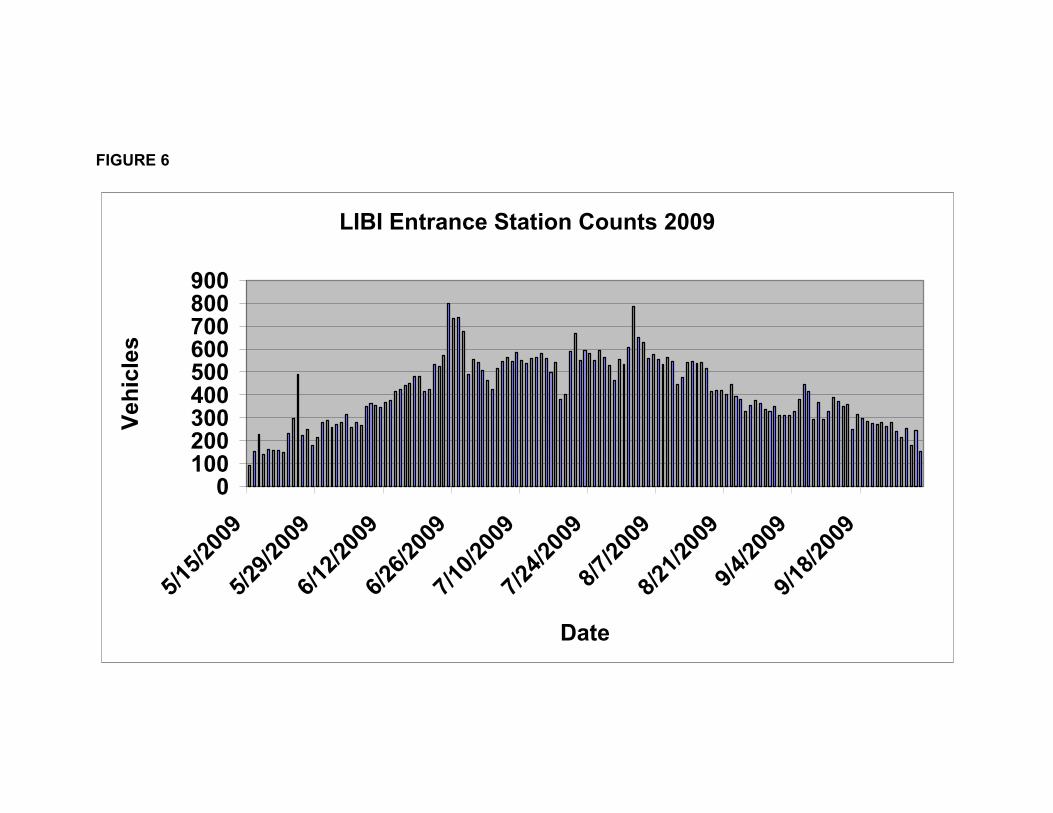
FIGURE 6
LIBI Entrance Station Counts 2009
0100200300400500600700800900
5/15
/200
95/29
/200
96/12
/200
96/26
/200
97/10
/200
97/24
/200
98/7/20
098/21
/200
99/4/20
099/18
/200
9
Date
Vehicles
12
FIGURE 7
LIBI Entrance Station Counts 2010
0
200
400
600
800
1000
12005/15/2010
5/29/2010
6/12/2010
6/26/2010
7/10/2010
7/24/2010
8/7/2010
8/21/2010
9/4/2010
9/18/2010
Date
Vehicles

FIGURE 8
Compare 2009 and 2010 Vehicles Entering
0
200
400
600
800
1000
1200
5/22
/200
95/
29/2
009
6/5/
2009
6/12
/200
96/
19/2
009
6/26
/200
97/
3/20
097/
10/2
009
7/17
/200
97/
24/2
009
7/31
/200
98/
7/20
098/
14/2
009
8/21
/200
98/
28/2
009
9/4/
2009
Date
Numbers of Vehicles
2009 2010
Concept of “Design Day”
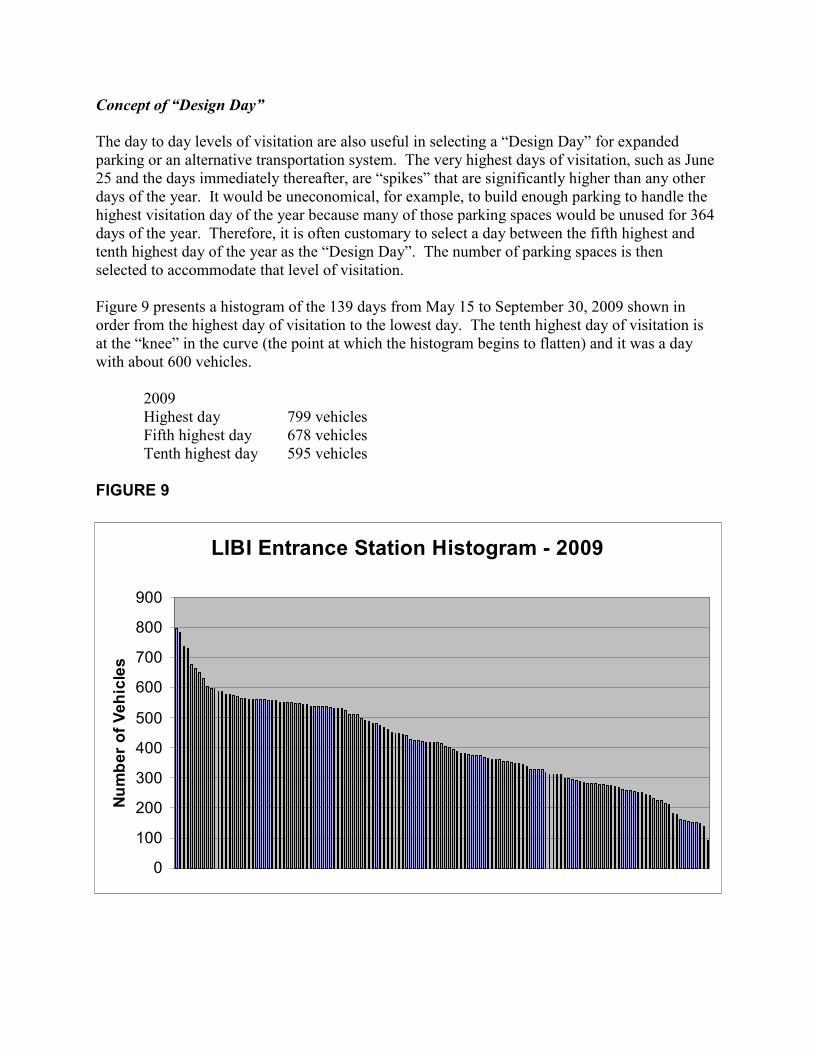
The day to day levels of visitation are also useful in selecting a “Design Day” for expanded parking or an alternative transportation system. The very highest days of visitation, such as June 25 and the days immediately thereafter, are “spikes” that are significantly higher than any other days of the year. It would be uneconomical, for example, to build enough parking to handle the highest visitation day of the year because many of those parking spaces would be unused for 364 days of the year. Therefore, it is often customary to select a day between the fifth highest and tenth highest day of the year as the “Design Day”. The number of parking spaces is then selected to accommodate that level of visitation. Figure 9 presents a histogram of the 139 days from May 15 to September 30, 2009 shown in order from the highest day of visitation to the lowest day. The tenth highest day of visitation is at the “knee” in the curve (the point at which the histogram begins to flatten) and it was a day with about 600 vehicles.
2009 Highest day 799 vehicles Fifth highest day 678 vehicles Tenth highest day 595 vehicles
FIGURE 9
LIBI Entrance Station Histogram - 2009
0
100
200
300
400
500
600
700
800
900
Number of Vehicles
15
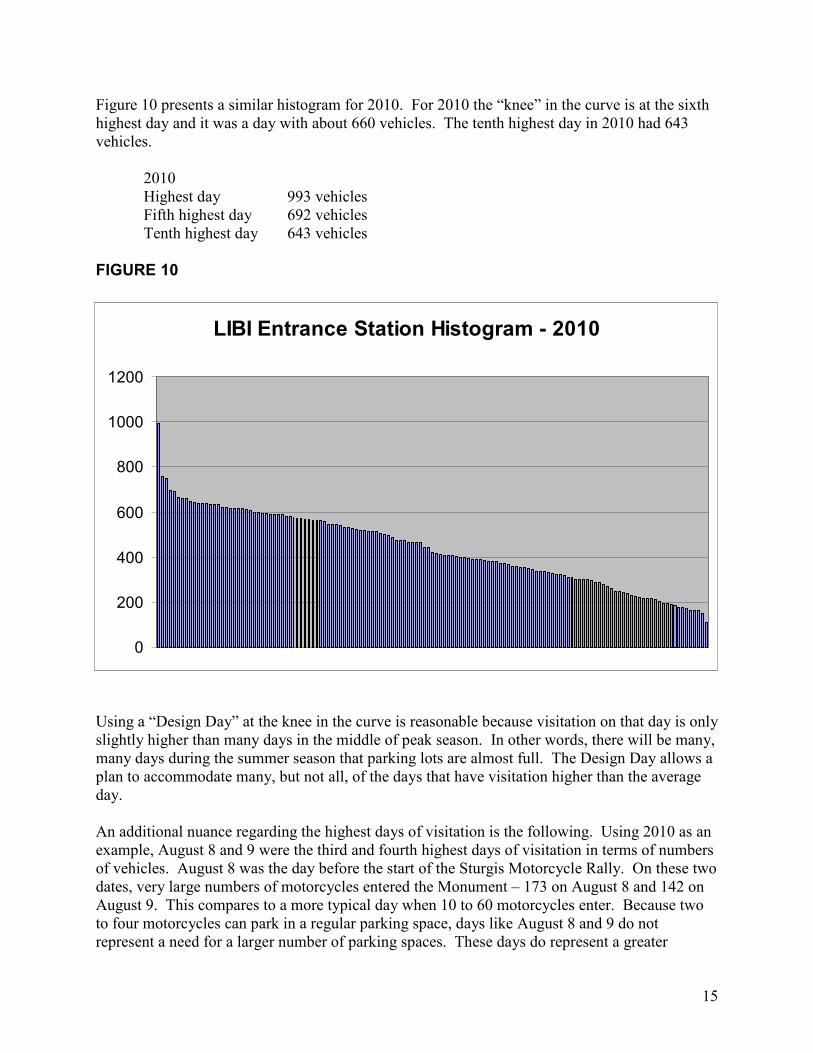
Figure 10 presents a similar histogram for 2010. For 2010 the “knee” in the curve is at the sixth highest day and it was a day with about 660 vehicles. The tenth highest day in 2010 had 643 vehicles.
2010 Highest day 993 vehicles Fifth highest day 692 vehicles Tenth highest day 643 vehicles
FIGURE 10
Using a “Design Day” at the knee in the curve is reasonable because visitation on that day is only slightly higher than many days in the middle of peak season. In other words, there will be many, many days during the summer season that parking lots are almost full. The Design Day allows a plan to accommodate many, but not all, of the days that have visitation higher than the average day. An additional nuance regarding the highest days of visitation is the following. Using 2010 as an example, August 8 and 9 were the third and fourth highest days of visitation in terms of numbers of vehicles. August 8 was the day before the start of the Sturgis Motorcycle Rally. On these two dates, very large numbers of motorcycles entered the Monument – 173 on August 8 and 142 on August 9. This compares to a more typical day when 10 to 60 motorcycles enter. Because two to four motorcycles can park in a regular parking space, days like August 8 and 9 do not represent a need for a larger number of parking spaces. These days do represent a greater
LIBI Entrance Station Histogram - 2010
0
200
400
600
800
1000
1200
16
number of vehicles in the Monument that are circulating on the roadway system and may contribute to traffic congestion. For purposes of discussion in the remainder of this report, the term “2010 Design Day” will be used and, when used, it is intended to represent a day when 660 vehicles arrive at the Monument during the hours from 8:00 a.m. to 6:00 p.m. The level of 660 vehicles represents the knee in the histogram and was the seventh highest day in 2010. By fortuitous coincidence, the two dates for on-site data collection, July 21 and 22, were dates that 660 and 658 vehicles entered the Monument between 8:00 a.m. and 6:00 p.m. Thus, those dates represented a “Design Day” and the parking occupancy counts and other observations made on those two dates showed the conditions associated with a “2010 Design Day”.
Existing Conditions This portion of the report presents information on existing traffic and parking conditions based upon information collected during the summer of 2010.
Traffic Counts
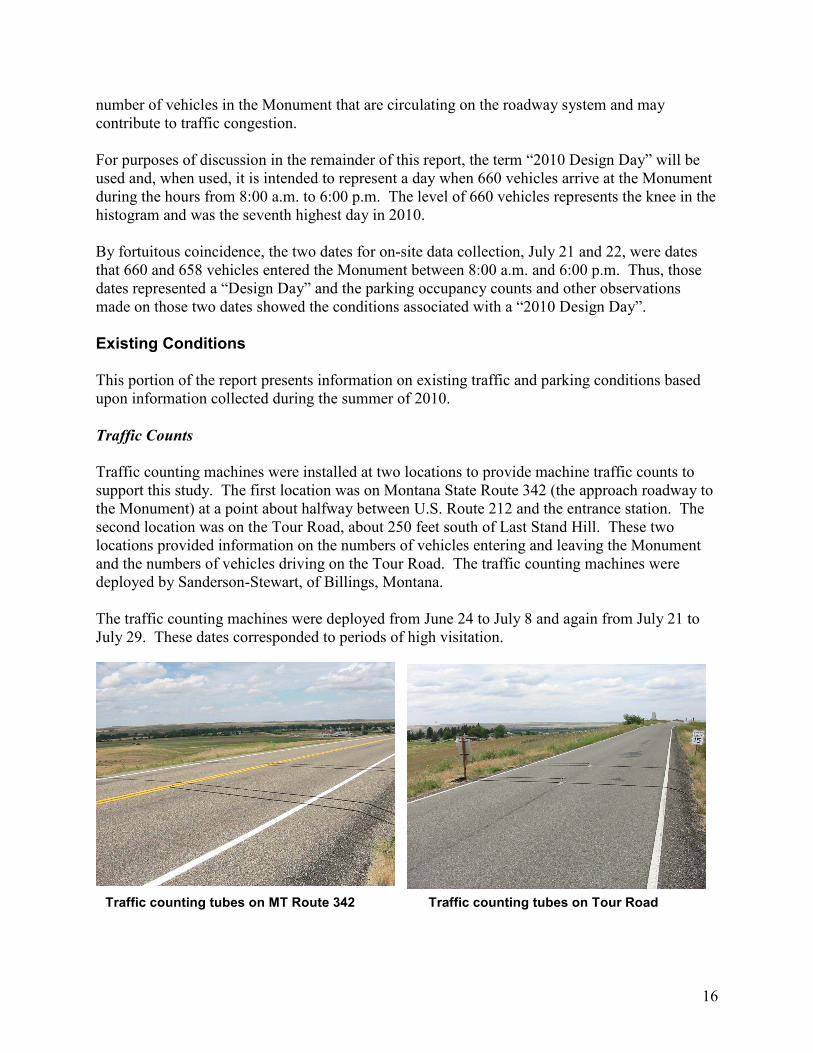
Traffic counting machines were installed at two locations to provide machine traffic counts to support this study. The first location was on Montana State Route 342 (the approach roadway to the Monument) at a point about halfway between U.S. Route 212 and the entrance station. The second location was on the Tour Road, about 250 feet south of Last Stand Hill. These two locations provided information on the numbers of vehicles entering and leaving the Monument and the numbers of vehicles driving on the Tour Road. The traffic counting machines were deployed by Sanderson-Stewart, of Billings, Montana. The traffic counting machines were deployed from June 24 to July 8 and again from July 21 to July 29. These dates corresponded to periods of high visitation.
Traffic counting tubes on MT Route 342 Traffic counting tubes on Tour Road
17
Directional counts were made to obtain separate counts for inbound and outbound traffic. Traffic counts were provided by 15 minute period. Pulse data (road tube actuations by each axle, with a time stamp) were generated that allowed information on oversize vehicles to be acquired. The above data were reviewed by the author for quality control and analyzed to provide the information presented in the remainder of this report. Although there were some technical issues with the traffic counting machines, enough good data was obtained during the 21 days the machines were deployed to fully support the scope of this study.
Arrival and Departure Pattern
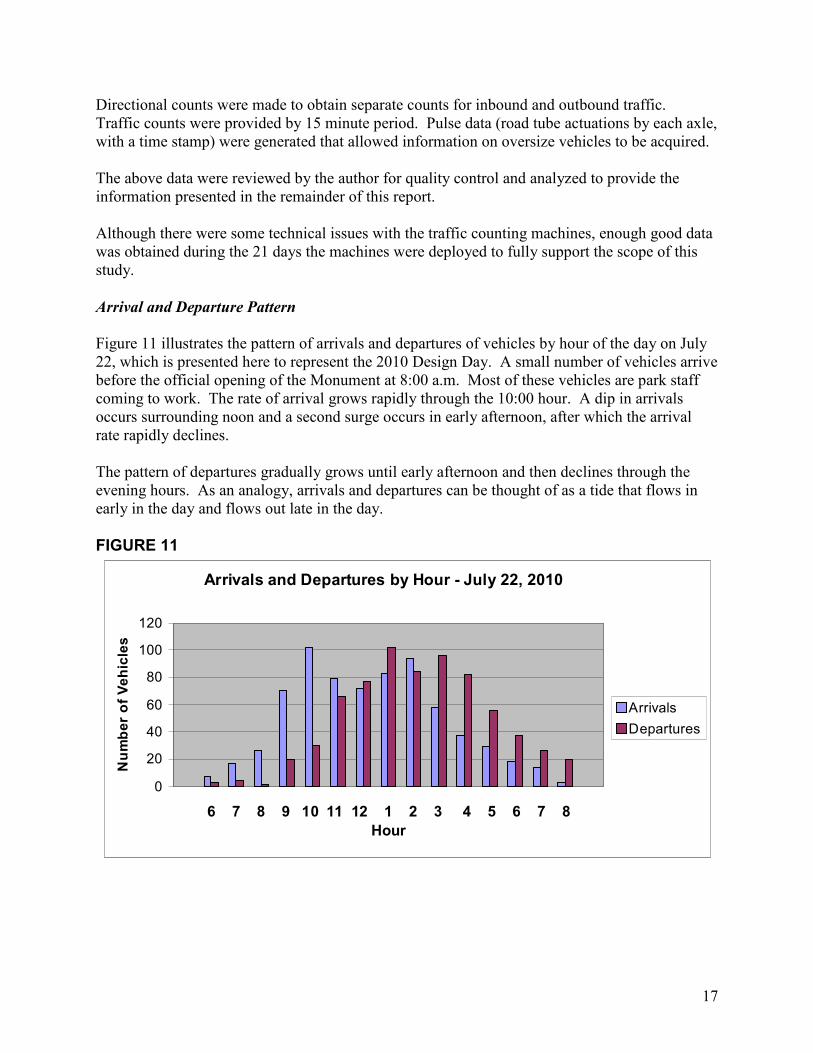
Figure 11 illustrates the pattern of arrivals and departures of vehicles by hour of the day on July 22, which is presented here to represent the 2010 Design Day. A small number of vehicles arrive before the official opening of the Monument at 8:00 a.m. Most of these vehicles are park staff coming to work. The rate of arrival grows rapidly through the 10:00 hour. A dip in arrivals occurs surrounding noon and a second surge occurs in early afternoon, after which the arrival rate rapidly declines. The pattern of departures gradually grows until early afternoon and then declines through the evening hours. As an analogy, arrivals and departures can be thought of as a tide that flows in early in the day and flows out late in the day.
FIGURE 11
Arrivals and Departures by Hour - July 22, 2010
0
20
40
60
80
100
120
6 7 8 9 10 11 12 1 2 3 4 5 6 7 8
Hour
Number of Vehicles
Arrivals
Departures
18
Accumulation of Vehicles
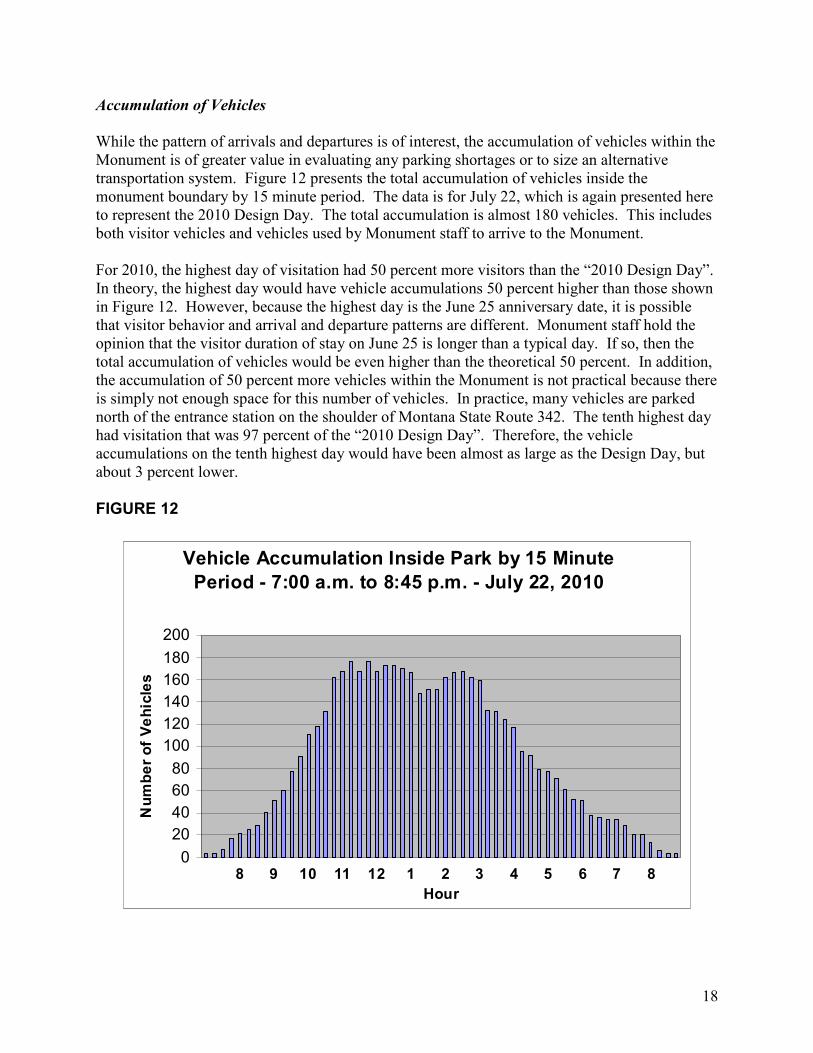
While the pattern of arrivals and departures is of interest, the accumulation of vehicles within the Monument is of greater value in evaluating any parking shortages or to size an alternative transportation system. Figure 12 presents the total accumulation of vehicles inside the monument boundary by 15 minute period. The data is for July 22, which is again presented here to represent the 2010 Design Day. The total accumulation is almost 180 vehicles. This includes both visitor vehicles and vehicles used by Monument staff to arrive to the Monument. For 2010, the highest day of visitation had 50 percent more visitors than the “2010 Design Day”. In theory, the highest day would have vehicle accumulations 50 percent higher than those shown in Figure 12. However, because the highest day is the June 25 anniversary date, it is possible that visitor behavior and arrival and departure patterns are different. Monument staff hold the opinion that the visitor duration of stay on June 25 is longer than a typical day. If so, then the total accumulation of vehicles would be even higher than the theoretical 50 percent. In addition, the accumulation of 50 percent more vehicles within the Monument is not practical because there is simply not enough space for this number of vehicles. In practice, many vehicles are parked north of the entrance station on the shoulder of Montana State Route 342. The tenth highest day had visitation that was 97 percent of the “2010 Design Day”. Therefore, the vehicle accumulations on the tenth highest day would have been almost as large as the Design Day, but about 3 percent lower.
FIGURE 12
Vehicle Accumulation Inside Park by 15 Minute
Period - 7:00 a.m. to 8:45 p.m. - July 22, 2010
0
20
40
60
80
100
120
140
160
180
200
8 9 10 11 12 1 2 3 4 5 6 7 8
Hour
Number of Vehicles
19
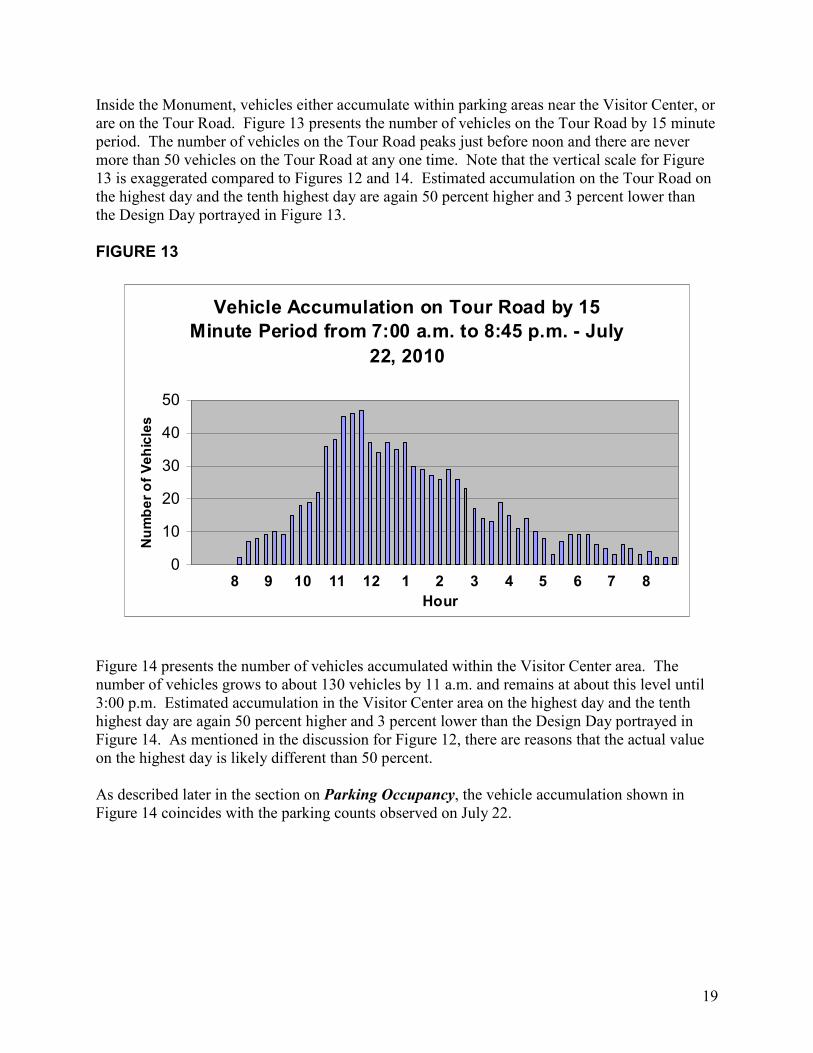
Inside the Monument, vehicles either accumulate within parking areas near the Visitor Center, or are on the Tour Road. Figure 13 presents the number of vehicles on the Tour Road by 15 minute period. The number of vehicles on the Tour Road peaks just before noon and there are never more than 50 vehicles on the Tour Road at any one time. Note that the vertical scale for Figure 13 is exaggerated compared to Figures 12 and 14. Estimated accumulation on the Tour Road on the highest day and the tenth highest day are again 50 percent higher and 3 percent lower than the Design Day portrayed in Figure 13.
FIGURE 13
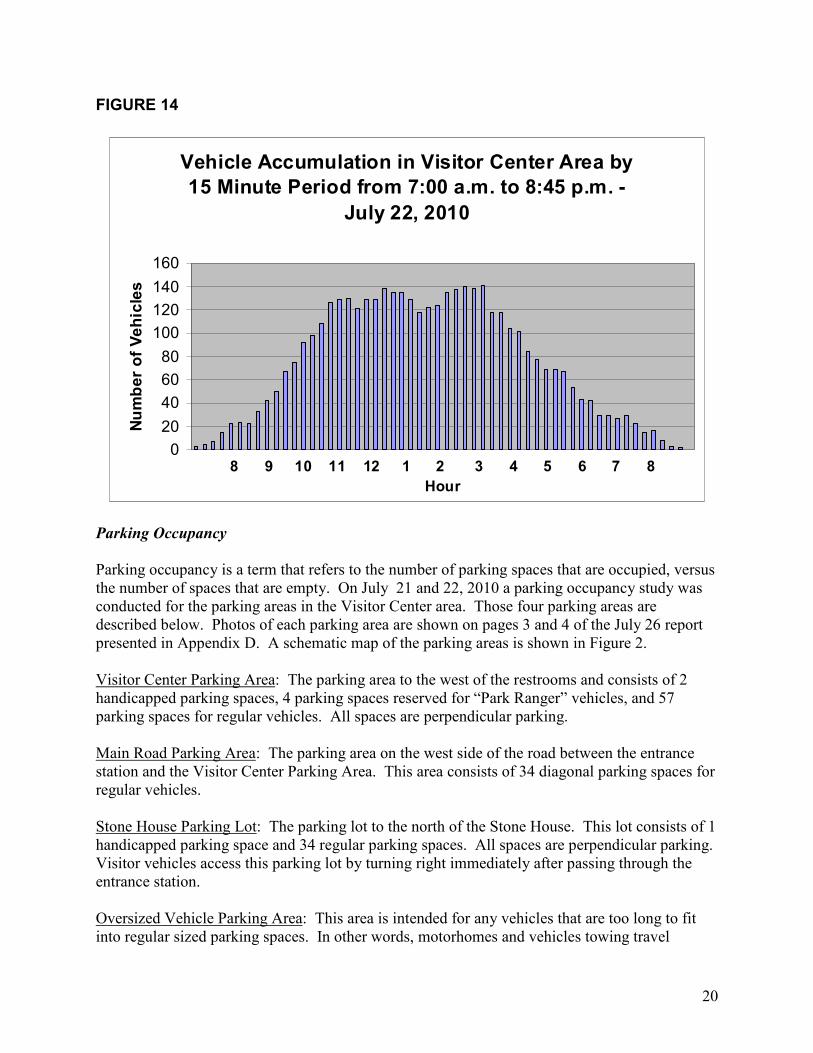
Figure 14 presents the number of vehicles accumulated within the Visitor Center area. The number of vehicles grows to about 130 vehicles by 11 a.m. and remains at about this level until 3:00 p.m. Estimated accumulation in the Visitor Center area on the highest day and the tenth highest day are again 50 percent higher and 3 percent lower than the Design Day portrayed in Figure 14. As mentioned in the discussion for Figure 12, there are reasons that the actual value on the highest day is likely different than 50 percent. As described later in the section on Parking Occupancy, the vehicle accumulation shown in Figure 14 coincides with the parking counts observed on July 22.
Vehicle Accumulation on Tour Road by 15
Minute Period from 7:00 a.m. to 8:45 p.m. - July
22, 2010
0
10
20
30
40
50
8 9 10 11 12 1 2 3 4 5 6 7 8
Hour
Number of Vehicles
20
FIGURE 14
Parking Occupancy
Parking occupancy is a term that refers to the number of parking spaces that are occupied, versus the number of spaces that are empty. On July 21 and 22, 2010 a parking occupancy study was conducted for the parking areas in the Visitor Center area. Those four parking areas are described below. Photos of each parking area are shown on pages 3 and 4 of the July 26 report presented in Appendix D. A schematic map of the parking areas is shown in Figure 2. Visitor Center Parking Area: The parking area to the west of the restrooms and consists of 2 handicapped parking spaces, 4 parking spaces reserved for “Park Ranger” vehicles, and 57 parking spaces for regular vehicles. All spaces are perpendicular parking. Main Road Parking Area: The parking area on the west side of the road between the entrance station and the Visitor Center Parking Area. This area consists of 34 diagonal parking spaces for regular vehicles. Stone House Parking Lot: The parking lot to the north of the Stone House. This lot consists of 1 handicapped parking space and 34 regular parking spaces. All spaces are perpendicular parking. Visitor vehicles access this parking lot by turning right immediately after passing through the entrance station. Oversized Vehicle Parking Area: This area is intended for any vehicles that are too long to fit into regular sized parking spaces. In other words, motorhomes and vehicles towing travel
Vehicle Accumulation in Visitor Center Area by
15 Minute Period from 7:00 a.m. to 8:45 p.m. -
July 22, 2010
0
20
40
60
80
100
120
140
160
8 9 10 11 12 1 2 3 4 5 6 7 8
Hour
Number of Vehicles
21
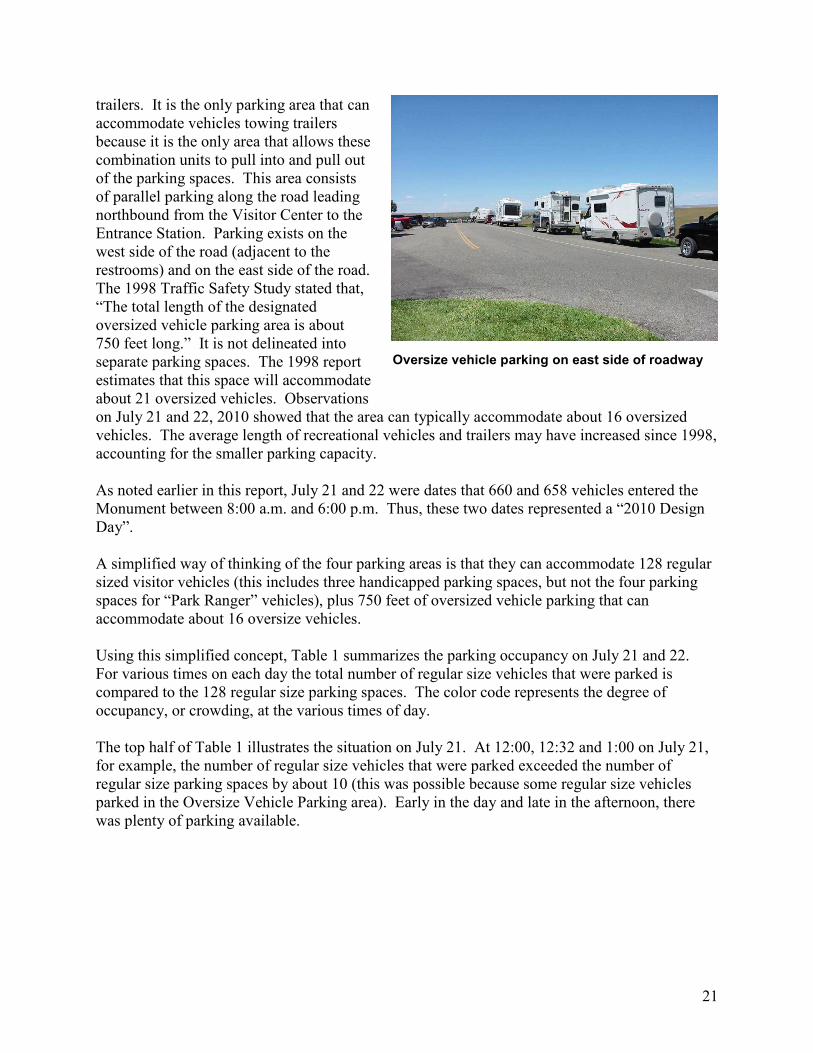
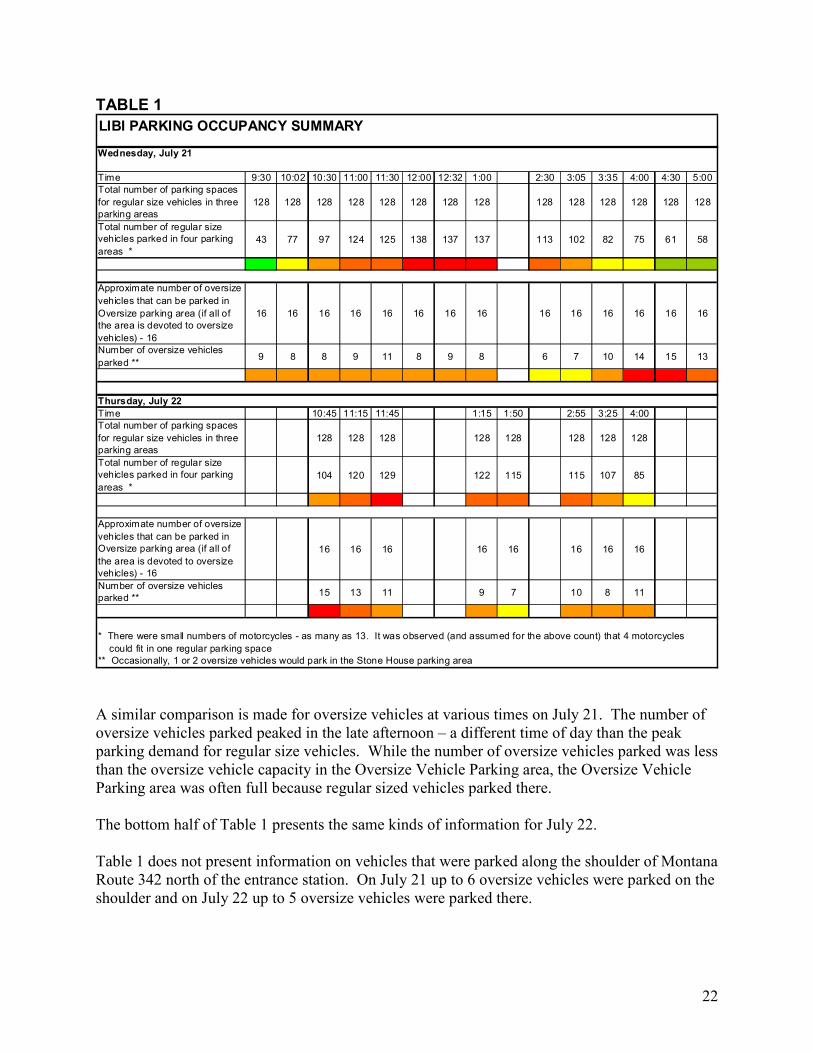
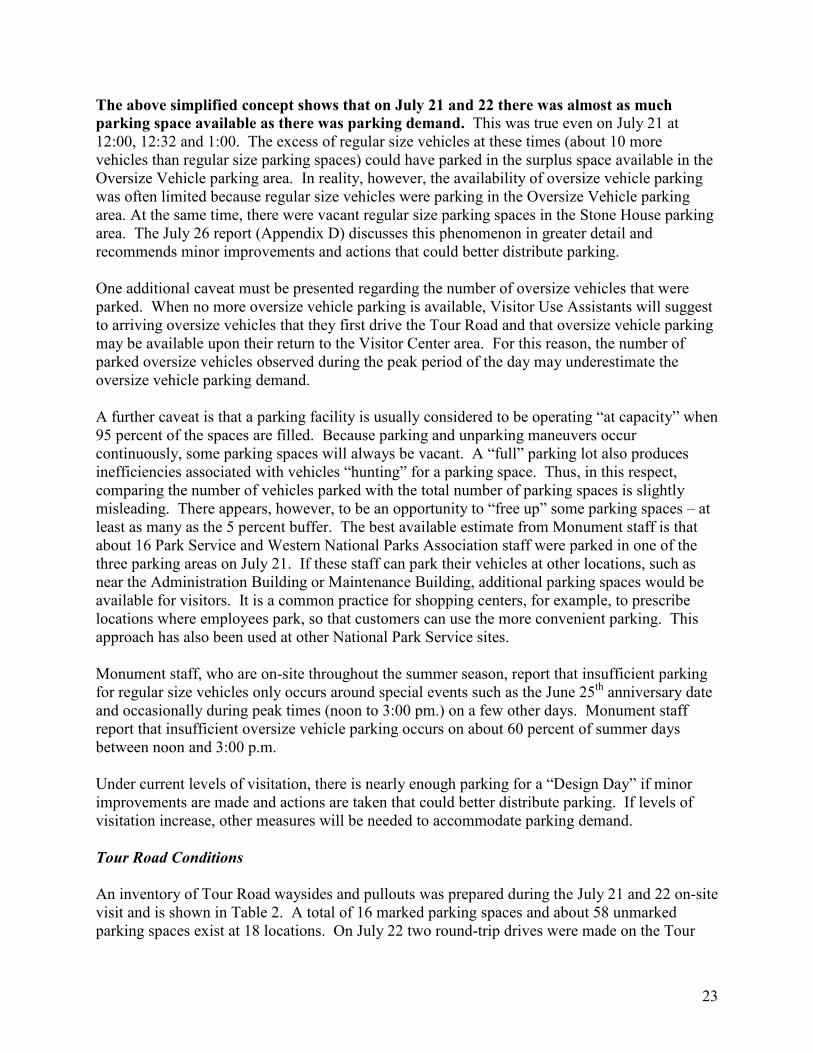
trailers. It is the only parking area that can accommodate vehicles towing trailers because it is the only area that allows these combination units to pull into and pull out of the parking spaces. This area consists of parallel parking along the road leading northbound from the Visitor Center to the Entrance Station. Parking exists on the west side of the road (adjacent to the restrooms) and on the east side of the road. The 1998 Traffic Safety Study stated that, “The total length of the designated oversized vehicle parking area is about 750 feet long.” It is not delineated into separate parking spaces. The 1998 report estimates that this space will accommodate about 21 oversized vehicles. Observations on July 21 and 22, 2010 showed that the area can typically accommodate about 16 oversized vehicles. The average length of recreational vehicles and trailers may have increased since 1998, accounting for the smaller parking capacity. As noted earlier in this report, July 21 and 22 were dates that 660 and 658 vehicles entered the Monument between 8:00 a.m. and 6:00 p.m. Thus, these two dates represented a “2010 Design Day”. A simplified way of thinking of the four parking areas is that they can accommodate 128 regular sized visitor vehicles (this includes three handicapped parking spaces, but not the four parking spaces for “Park Ranger” vehicles), plus 750 feet of oversized vehicle parking that can accommodate about 16 oversize vehicles. Using this simplified concept, Table 1 summarizes the parking occupancy on July 21 and 22. For various times on each day the total number of regular size vehicles that were parked is compared to the 128 regular size parking spaces. The color code represents the degree of occupancy, or crowding, at the various times of day. The top half of Table 1 illustrates the situation on July 21. At 12:00, 12:32 and 1:00 on July 21, for example, the number of regular size vehicles that were parked exceeded the number of regular size parking spaces by about 10 (this was possible because some regular size vehicles parked in the Oversize Vehicle Parking area). Early in the day and late in the afternoon, there was plenty of parking available.
Oversize vehicle parking on east side of roadway
22
TABLE 1
A similar comparison is made for oversize vehicles at various times on July 21. The number of oversize vehicles parked peaked in the late afternoon – a different time of day than the peak parking demand for regular size vehicles. While the number of oversize vehicles parked was less than the oversize vehicle capacity in the Oversize Vehicle Parking area, the Oversize Vehicle Parking area was often full because regular sized vehicles parked there. The bottom half of Table 1 presents the same kinds of information for July 22. Table 1 does not present information on vehicles that were parked along the shoulder of Montana Route 342 north of the entrance station. On July 21 up to 6 oversize vehicles were parked on the shoulder and on July 22 up to 5 oversize vehicles were parked there.
LIBI PARKING OCCUPANCY SUMMARY
Wednesday, July 21
Time 9:30 10:02 10:30 11:00 11:30 12:00 12:32 1:00 2:30 3:05 3:35 4:00 4:30 5:00
Total number of parking spaces
for regular size vehicles in three
parking areas
128 128 128 128 128 128 128 128 128 128 128 128 128 128
Total number of regular size
vehicles parked in four parking
areas *
43 77 97 124 125 138 137 137 113 102 82 75 61 58
Approximate number of oversize
vehicles that can be parked in
Oversize parking area (if all of
the area is devoted to oversize
vehicles) - 16
16 16 16 16 16 16 16 16 16 16 16 16 16 16
Number of oversize vehicles
parked **9 8 8 9 11 8 9 8 6 7 10 14 15 13
Thursday, July 22
Time 10:45 11:15 11:45 1:15 1:50 2:55 3:25 4:00
Total number of parking spaces
for regular size vehicles in three
parking areas
128 128 128 128 128 128 128 128
Total number of regular size
vehicles parked in four parking
areas *
104 120 129 122 115 115 107 85
Approximate number of oversize
vehicles that can be parked in
Oversize parking area (if all of
the area is devoted to oversize
vehicles) - 16
16 16 16 16 16 16 16 16
Number of oversize vehicles
parked **15 13 11 9 7 10 8 11
* There were small numbers of motorcycles - as many as 13. It was observed (and assumed for the above count) that 4 motorcycles
could fit in one regular parking space
** Occasionally, 1 or 2 oversize vehicles would park in the Stone House parking area
23
The above simplified concept shows that on July 21 and 22 there was almost as much
parking space available as there was parking demand. This was true even on July 21 at 12:00, 12:32 and 1:00. The excess of regular size vehicles at these times (about 10 more vehicles than regular size parking spaces) could have parked in the surplus space available in the Oversize Vehicle parking area. In reality, however, the availability of oversize vehicle parking was often limited because regular size vehicles were parking in the Oversize Vehicle parking area. At the same time, there were vacant regular size parking spaces in the Stone House parking area. The July 26 report (Appendix D) discusses this phenomenon in greater detail and recommends minor improvements and actions that could better distribute parking. One additional caveat must be presented regarding the number of oversize vehicles that were parked. When no more oversize vehicle parking is available, Visitor Use Assistants will suggest to arriving oversize vehicles that they first drive the Tour Road and that oversize vehicle parking may be available upon their return to the Visitor Center area. For this reason, the number of parked oversize vehicles observed during the peak period of the day may underestimate the oversize vehicle parking demand. A further caveat is that a parking facility is usually considered to be operating “at capacity” when 95 percent of the spaces are filled. Because parking and unparking maneuvers occur continuously, some parking spaces will always be vacant. A “full” parking lot also produces inefficiencies associated with vehicles “hunting” for a parking space. Thus, in this respect, comparing the number of vehicles parked with the total number of parking spaces is slightly misleading. There appears, however, to be an opportunity to “free up” some parking spaces – at least as many as the 5 percent buffer. The best available estimate from Monument staff is that about 16 Park Service and Western National Parks Association staff were parked in one of the three parking areas on July 21. If these staff can park their vehicles at other locations, such as near the Administration Building or Maintenance Building, additional parking spaces would be available for visitors. It is a common practice for shopping centers, for example, to prescribe locations where employees park, so that customers can use the more convenient parking. This approach has also been used at other National Park Service sites. Monument staff, who are on-site throughout the summer season, report that insufficient parking for regular size vehicles only occurs around special events such as the June 25th anniversary date and occasionally during peak times (noon to 3:00 pm.) on a few other days. Monument staff report that insufficient oversize vehicle parking occurs on about 60 percent of summer days between noon and 3:00 p.m. Under current levels of visitation, there is nearly enough parking for a “Design Day” if minor improvements are made and actions are taken that could better distribute parking. If levels of visitation increase, other measures will be needed to accommodate parking demand.
Tour Road Conditions
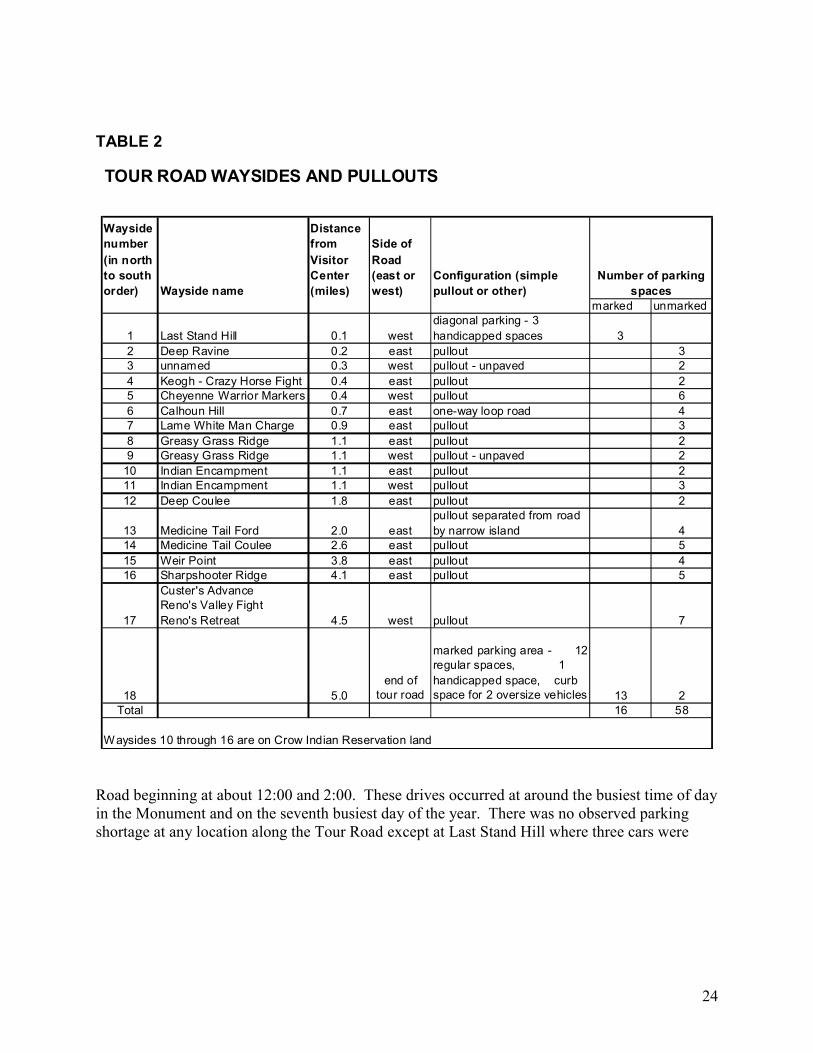
An inventory of Tour Road waysides and pullouts was prepared during the July 21 and 22 on-site visit and is shown in Table 2. A total of 16 marked parking spaces and about 58 unmarked parking spaces exist at 18 locations. On July 22 two round-trip drives were made on the Tour
24
TABLE 2
Road beginning at about 12:00 and 2:00. These drives occurred at around the busiest time of day in the Monument and on the seventh busiest day of the year. There was no observed parking shortage at any location along the Tour Road except at Last Stand Hill where three cars were
TOUR ROAD WAYSIDES AND PULLOUTS
Wayside
number
(in north
to south
order) Wayside name
Distance
from
Visitor
Center
(miles)
Side of
Road
(east or
west)
Configuration (simple
pullout or other)
marked unmarked
1 Last Stand Hill 0.1 west
diagonal parking - 3
handicapped spaces 3
2 Deep Ravine 0.2 east pullout 3
3 unnamed 0.3 west pullout - unpaved 2
4 Keogh - Crazy Horse Fight 0.4 east pullout 2
5 Cheyenne Warrior Markers 0.4 west pullout 6
6 Calhoun Hill 0.7 east one-way loop road 4
7 Lame White Man Charge 0.9 east pullout 3
8 Greasy Grass Ridge 1.1 east pullout 2
9 Greasy Grass Ridge 1.1 west pullout - unpaved 2
10 Indian Encampment 1.1 east pullout 2
11 Indian Encampment 1.1 west pullout 3
12 Deep Coulee 1.8 east pullout 2
13 Medicine Tail Ford 2.0 east
pullout separated from road
by narrow island 4
14 Medicine Tail Coulee 2.6 east pullout 5
15 Weir Point 3.8 east pullout 4
16 Sharpshooter Ridge 4.1 east pullout 5
17
Custer's Advance
Reno's Valley Fight
Reno's Retreat 4.5 west pullout 7
18 5.0
end of
tour road
marked parking area - 12
regular spaces, 1
handicapped space, curb
space for 2 oversize vehicles 13 2
Total 16 58
Waysides 10 through 16 are on Crow Indian Reservation land
Number of parking
spaces
25
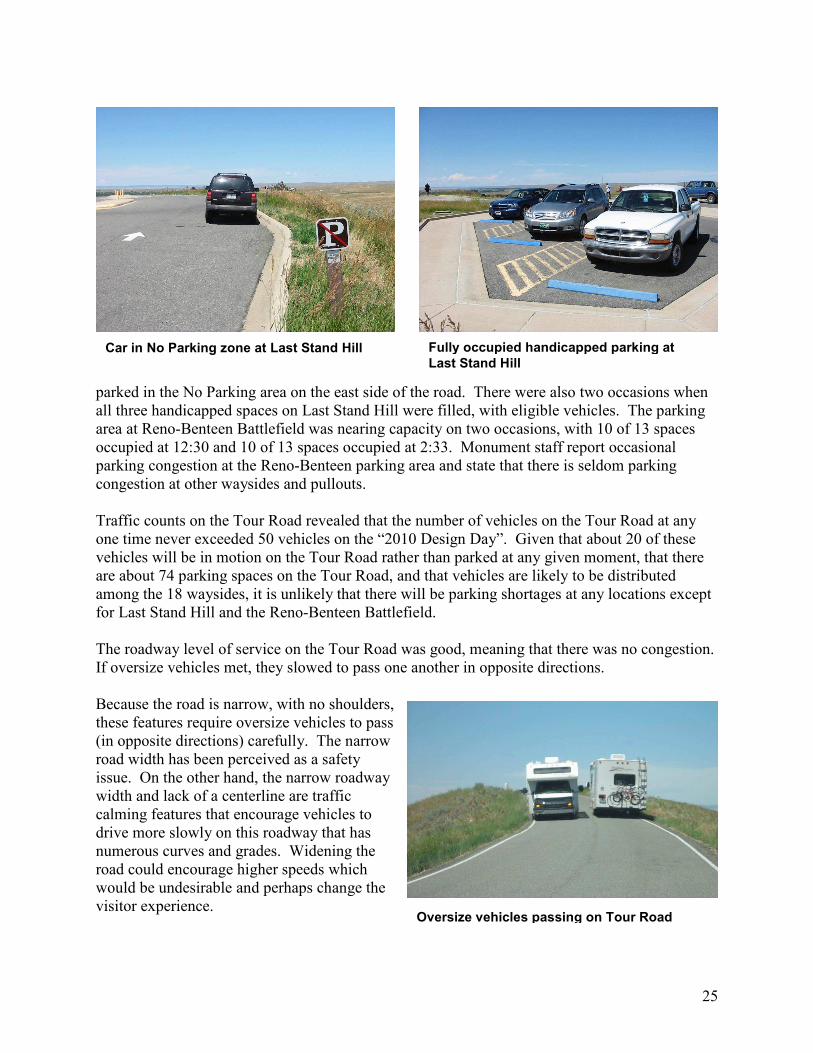
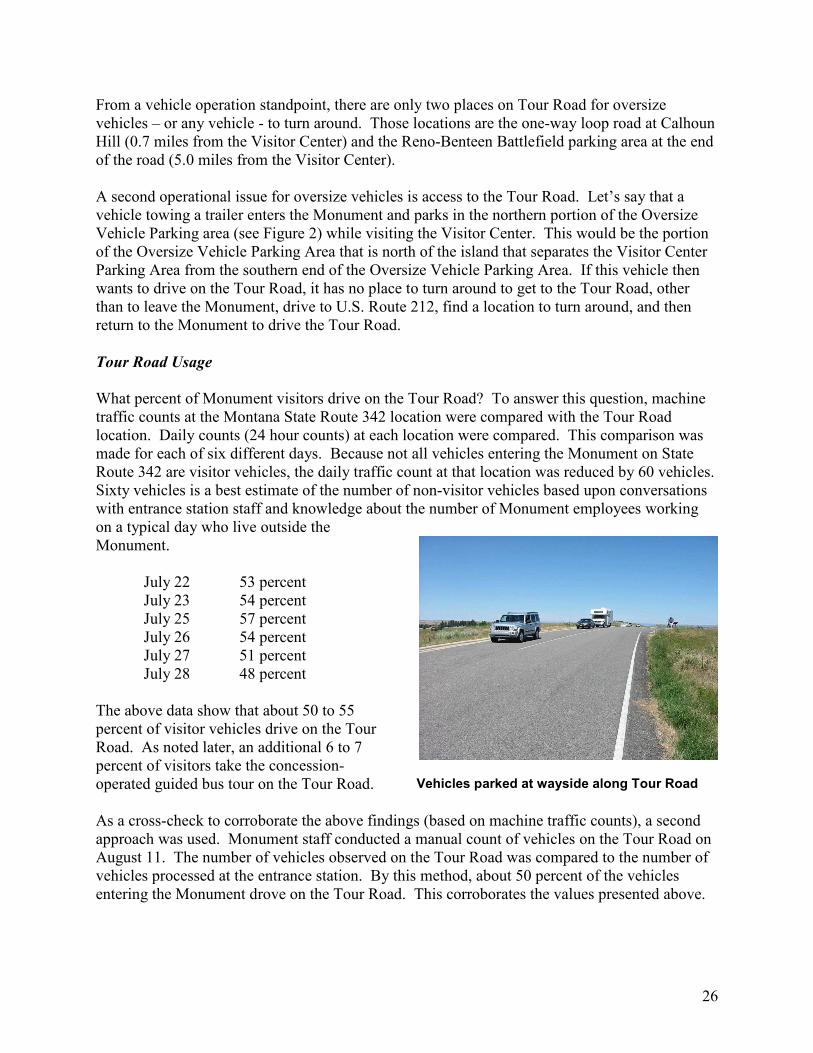
parked in the No Parking area on the east side of the road. There were also two occasions when all three handicapped spaces on Last Stand Hill were filled, with eligible vehicles. The parking area at Reno-Benteen Battlefield was nearing capacity on two occasions, with 10 of 13 spaces occupied at 12:30 and 10 of 13 spaces occupied at 2:33. Monument staff report occasional parking congestion at the Reno-Benteen parking area and state that there is seldom parking congestion at other waysides and pullouts. Traffic counts on the Tour Road revealed that the number of vehicles on the Tour Road at any one time never exceeded 50 vehicles on the “2010 Design Day”. Given that about 20 of these vehicles will be in motion on the Tour Road rather than parked at any given moment, that there are about 74 parking spaces on the Tour Road, and that vehicles are likely to be distributed among the 18 waysides, it is unlikely that there will be parking shortages at any locations except for Last Stand Hill and the Reno-Benteen Battlefield. The roadway level of service on the Tour Road was good, meaning that there was no congestion. If oversize vehicles met, they slowed to pass one another in opposite directions. Because the road is narrow, with no shoulders, these features require oversize vehicles to pass (in opposite directions) carefully. The narrow road width has been perceived as a safety issue. On the other hand, the narrow roadway width and lack of a centerline are traffic calming features that encourage vehicles to drive more slowly on this roadway that has numerous curves and grades. Widening the road could encourage higher speeds which would be undesirable and perhaps change the visitor experience.
Car in No Parking zone at Last Stand Hill Fully occupied handicapped parking at
Last Stand Hill
Oversize vehicles passing on Tour Road
26
From a vehicle operation standpoint, there are only two places on Tour Road for oversize vehicles – or any vehicle - to turn around. Those locations are the one-way loop road at Calhoun Hill (0.7 miles from the Visitor Center) and the Reno-Benteen Battlefield parking area at the end of the road (5.0 miles from the Visitor Center). A second operational issue for oversize vehicles is access to the Tour Road. Let’s say that a vehicle towing a trailer enters the Monument and parks in the northern portion of the Oversize Vehicle Parking area (see Figure 2) while visiting the Visitor Center. This would be the portion of the Oversize Vehicle Parking Area that is north of the island that separates the Visitor Center Parking Area from the southern end of the Oversize Vehicle Parking Area. If this vehicle then wants to drive on the Tour Road, it has no place to turn around to get to the Tour Road, other than to leave the Monument, drive to U.S. Route 212, find a location to turn around, and then return to the Monument to drive the Tour Road.
Tour Road Usage
What percent of Monument visitors drive on the Tour Road? To answer this question, machine traffic counts at the Montana State Route 342 location were compared with the Tour Road location. Daily counts (24 hour counts) at each location were compared. This comparison was made for each of six different days. Because not all vehicles entering the Monument on State Route 342 are visitor vehicles, the daily traffic count at that location was reduced by 60 vehicles. Sixty vehicles is a best estimate of the number of non-visitor vehicles based upon conversations with entrance station staff and knowledge about the number of Monument employees working on a typical day who live outside the Monument.
July 22 53 percent July 23 54 percent July 25 57 percent July 26 54 percent July 27 51 percent July 28 48 percent
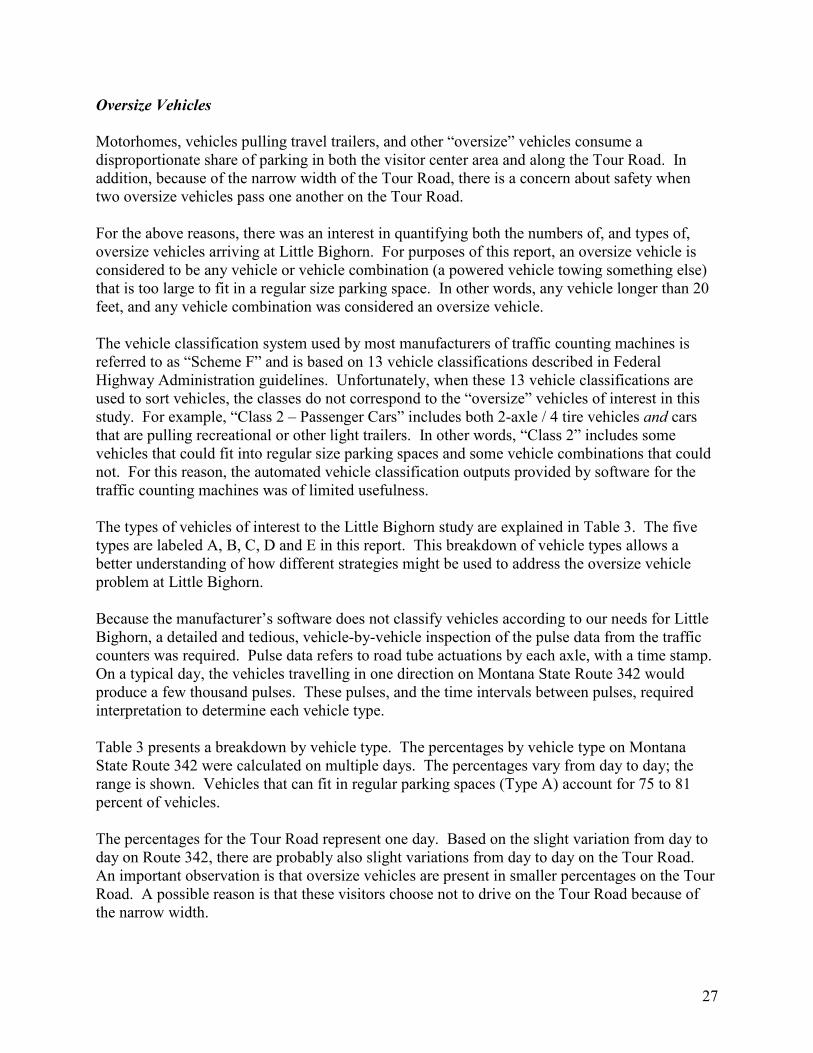
The above data show that about 50 to 55 percent of visitor vehicles drive on the Tour Road. As noted later, an additional 6 to 7 percent of visitors take the concession-operated guided bus tour on the Tour Road. As a cross-check to corroborate the above findings (based on machine traffic counts), a second approach was used. Monument staff conducted a manual count of vehicles on the Tour Road on August 11. The number of vehicles observed on the Tour Road was compared to the number of vehicles processed at the entrance station. By this method, about 50 percent of the vehicles entering the Monument drove on the Tour Road. This corroborates the values presented above.
Vehicles parked at wayside along Tour Road
27
Oversize Vehicles
Motorhomes, vehicles pulling travel trailers, and other “oversize” vehicles consume a disproportionate share of parking in both the visitor center area and along the Tour Road. In addition, because of the narrow width of the Tour Road, there is a concern about safety when two oversize vehicles pass one another on the Tour Road. For the above reasons, there was an interest in quantifying both the numbers of, and types of, oversize vehicles arriving at Little Bighorn. For purposes of this report, an oversize vehicle is considered to be any vehicle or vehicle combination (a powered vehicle towing something else) that is too large to fit in a regular size parking space. In other words, any vehicle longer than 20 feet, and any vehicle combination was considered an oversize vehicle. The vehicle classification system used by most manufacturers of traffic counting machines is referred to as “Scheme F” and is based on 13 vehicle classifications described in Federal Highway Administration guidelines. Unfortunately, when these 13 vehicle classifications are used to sort vehicles, the classes do not correspond to the “oversize” vehicles of interest in this study. For example, “Class 2 – Passenger Cars” includes both 2-axle / 4 tire vehicles and cars that are pulling recreational or other light trailers. In other words, “Class 2” includes some vehicles that could fit into regular size parking spaces and some vehicle combinations that could not. For this reason, the automated vehicle classification outputs provided by software for the traffic counting machines was of limited usefulness. The types of vehicles of interest to the Little Bighorn study are explained in Table 3. The five types are labeled A, B, C, D and E in this report. This breakdown of vehicle types allows a better understanding of how different strategies might be used to address the oversize vehicle problem at Little Bighorn. Because the manufacturer’s software does not classify vehicles according to our needs for Little Bighorn, a detailed and tedious, vehicle-by-vehicle inspection of the pulse data from the traffic counters was required. Pulse data refers to road tube actuations by each axle, with a time stamp. On a typical day, the vehicles travelling in one direction on Montana State Route 342 would produce a few thousand pulses. These pulses, and the time intervals between pulses, required interpretation to determine each vehicle type. Table 3 presents a breakdown by vehicle type. The percentages by vehicle type on Montana State Route 342 were calculated on multiple days. The percentages vary from day to day; the range is shown. Vehicles that can fit in regular parking spaces (Type A) account for 75 to 81 percent of vehicles. The percentages for the Tour Road represent one day. Based on the slight variation from day to day on Route 342, there are probably also slight variations from day to day on the Tour Road. An important observation is that oversize vehicles are present in smaller percentages on the Tour Road. A possible reason is that these visitors choose not to drive on the Tour Road because of the narrow width.
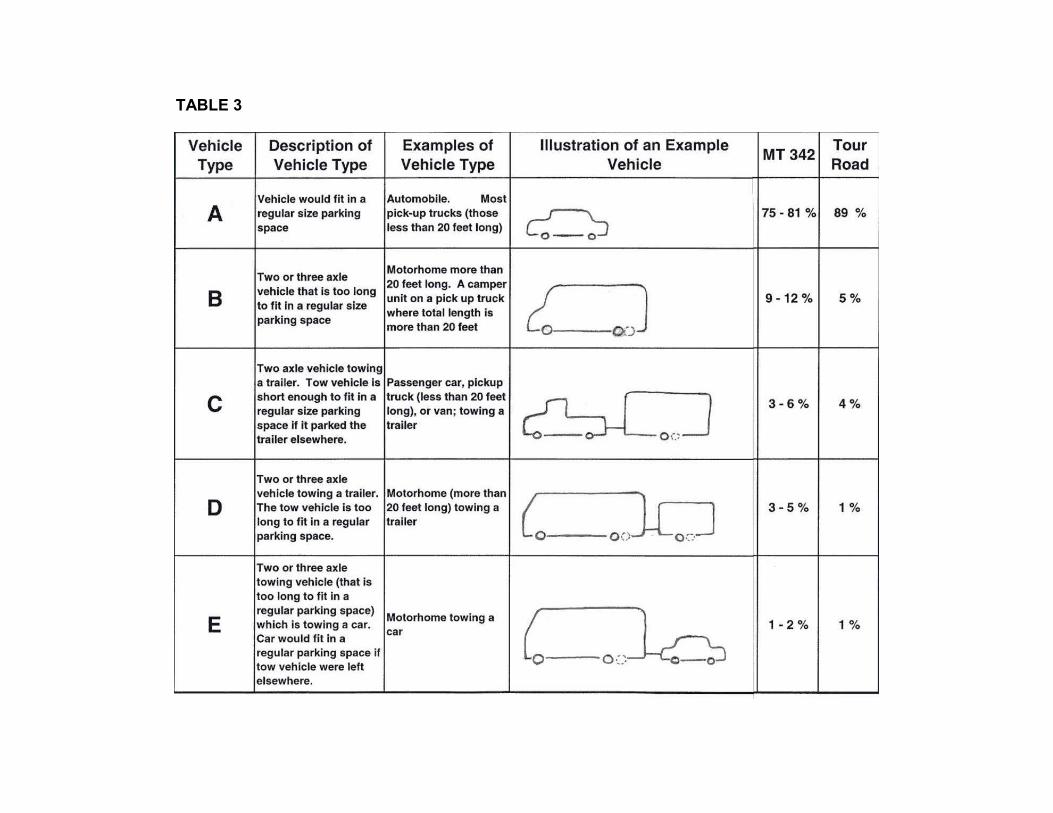
TABLE 3
Multiple cross-checks were conducted to assure that the percentage of oversize vehicles calculated from the pulse data were reasonable. On July 22 and 23 and on August 11 entrance station staff made manual tallies of oversize vehicles (all types combined) entering the Monument. These oversize vehicle counts were compared to the total number of vehicles entering the Monument. On August 11 Monument staff also did a manual tally of all five vehicle types on the Tour Road. These tallies corroborated the percentages of oversize vehicles calculated from the pulse data.
Ridership on Existing Tour Service
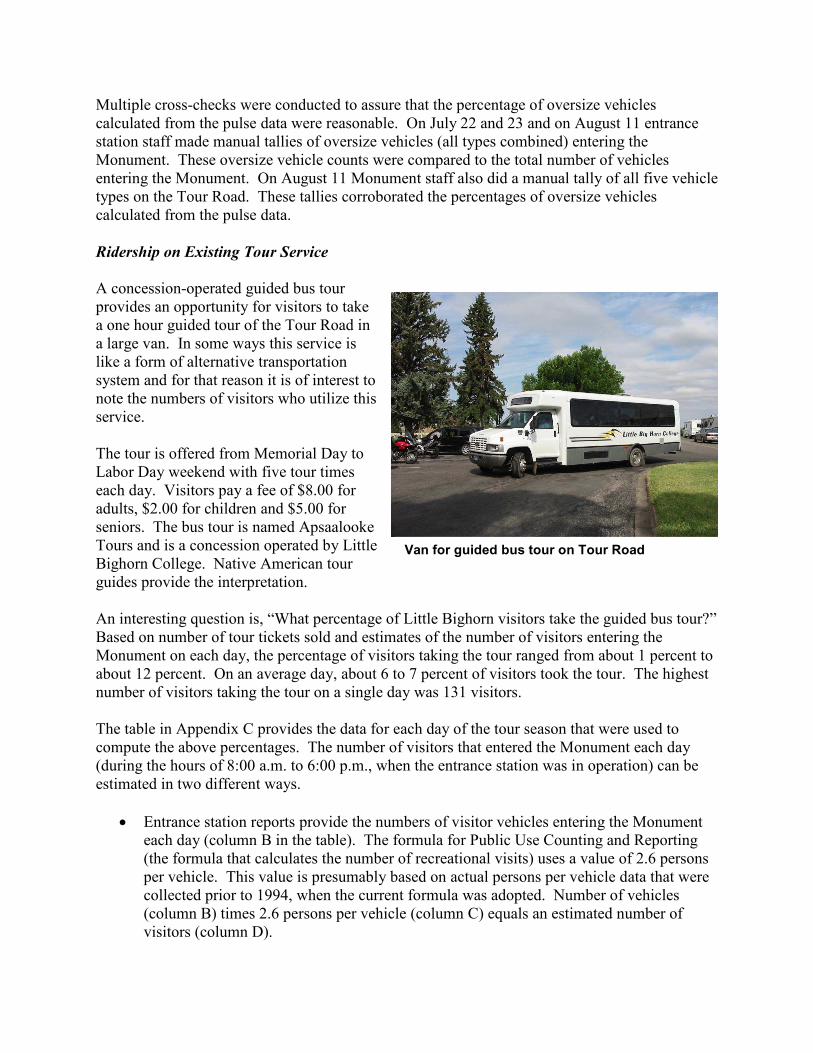
A concession-operated guided bus tour provides an opportunity for visitors to take a one hour guided tour of the Tour Road in a large van. In some ways this service is like a form of alternative transportation system and for that reason it is of interest to note the numbers of visitors who utilize this service. The tour is offered from Memorial Day to Labor Day weekend with five tour times each day. Visitors pay a fee of $8.00 for adults, $2.00 for children and $5.00 for seniors. The bus tour is named Apsaalooke Tours and is a concession operated by Little Bighorn College. Native American tour guides provide the interpretation. An interesting question is, “What percentage of Little Bighorn visitors take the guided bus tour?” Based on number of tour tickets sold and estimates of the number of visitors entering the Monument on each day, the percentage of visitors taking the tour ranged from about 1 percent to about 12 percent. On an average day, about 6 to 7 percent of visitors took the tour. The highest number of visitors taking the tour on a single day was 131 visitors. The table in Appendix C provides the data for each day of the tour season that were used to compute the above percentages. The number of visitors that entered the Monument each day (during the hours of 8:00 a.m. to 6:00 p.m., when the entrance station was in operation) can be estimated in two different ways.
• Entrance station reports provide the numbers of visitor vehicles entering the Monument each day (column B in the table). The formula for Public Use Counting and Reporting (the formula that calculates the number of recreational visits) uses a value of 2.6 persons per vehicle. This value is presumably based on actual persons per vehicle data that were collected prior to 1994, when the current formula was adopted. Number of vehicles (column B) times 2.6 persons per vehicle (column C) equals an estimated number of visitors (column D).
Van for guided bus tour on Tour Road
30
• Entrance station reports also provide a total number of passengers entering the Monument each day (column E). These counts are based on observations by the Visitor Use Assistant at the entrance station and the passenger count for each vehicle is a keystroke into the “cash register”.
As shown in the Appendix C table, the estimated number of visitors using the 2.6 persons per vehicle factor (column D) is, for most days, higher than the “passenger count” (column E). The 2.6 persons per vehicle factor may be out of date. On the other hand, the passenger count may be a casual observation by the Visitor Use Assistant that is not always accurate. Column F in the Appendix C table shows the number tour tickets sold. Column G shows the percentage of visitors who took the tour based on the estimated number of visitors in Column D (based on 2.6 persons per vehicle). Column H shows the percentage of visitors who took the tour based on number of passengers entering the Monument (column E). For most days, the 2.6 persons per vehicle method yields a slightly smaller percentage. The percentages are only as accurate as the accuracy of the estimates of number of visitors. The important point is that these computations show that a relatively small number of visitors – about 6 to 7 percent of visitors on an average day – are taking the guided bus tour. A four year history shows that the number of tour tickets sold has been declining from year to year, as shown below.
2007 10,739 tickets sold 2008 9,276 2009 8,095 2010 7,151
Entrance Station Congestion
During the site visit on July 21 and 22 there were no long queues observed at the entrance station, even though these were the sixth and seventh highest days of visitation of the year. The Monument’s Lead Visitor Use Assistant reported that there are occasionally queues of 15 to 20 vehicles. These events occur when only one of the two lanes is open (when one staff person is on lunch or a break) or are random events when there are several consecutive vehicles with longer transaction times.
Comparison of Findings: 1998 Traffic Safety Study and 2010 Study One of the purposes of the 2010 data collection effort is to compare 2010 conditions with those of 1998, the year that the 1998 Traffic Safety Study [Reference 1] was conducted. The following is a list of pertinent comparisons.
31
• The number of parking spaces in the Visitor Center parking area, Main Road parking area, and Stone House parking area have not changed since 1998.
• The length of curb space designated for oversize vehicle parking has not changed since 1998.
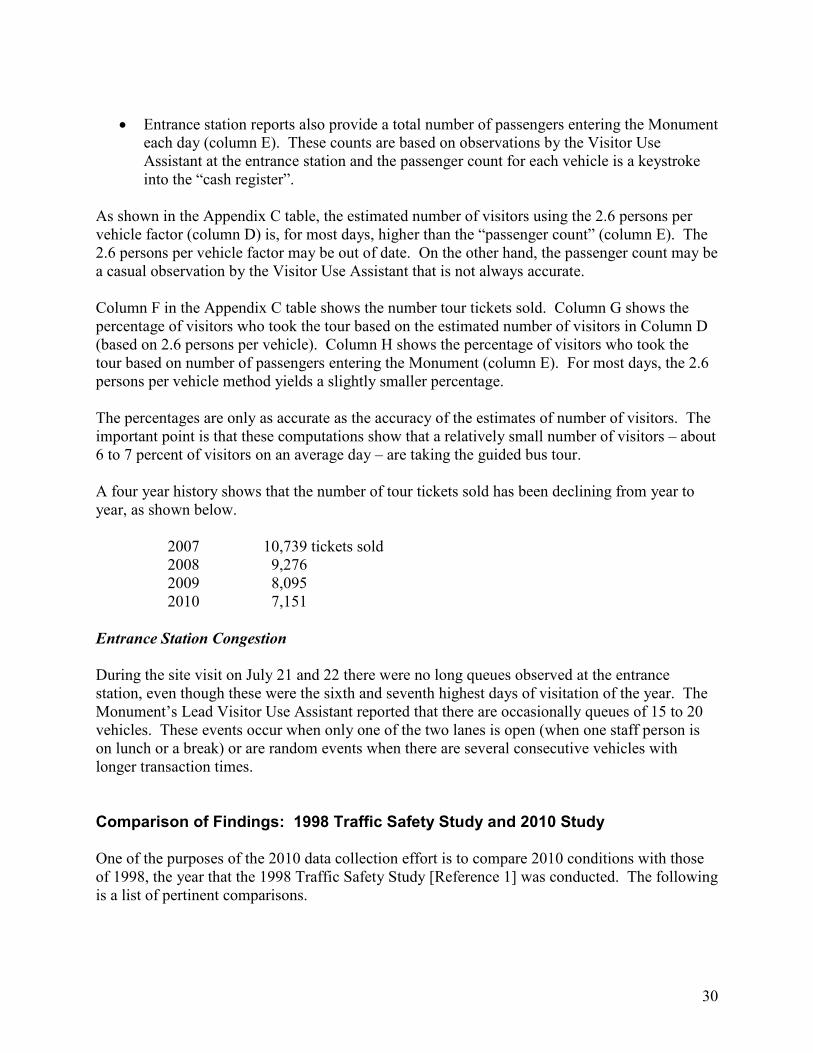
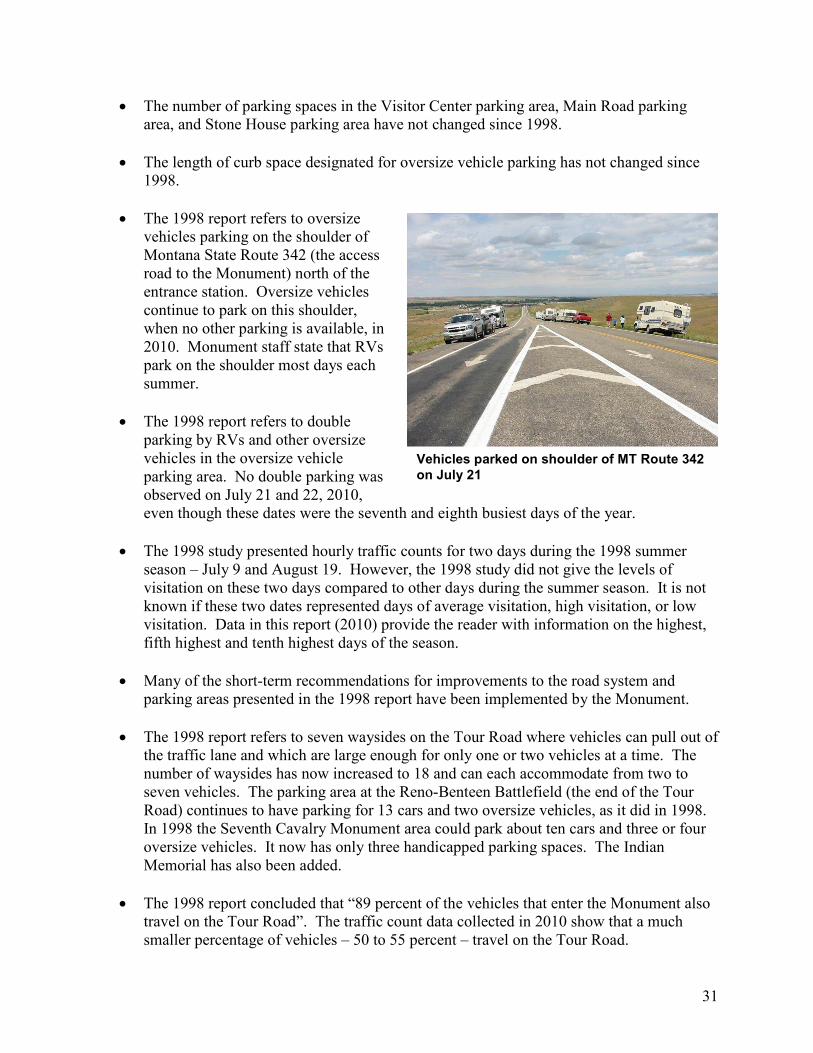
• The 1998 report refers to oversize vehicles parking on the shoulder of Montana State Route 342 (the access road to the Monument) north of the entrance station. Oversize vehicles continue to park on this shoulder, when no other parking is available, in 2010. Monument staff state that RVs park on the shoulder most days each summer.
• The 1998 report refers to double parking by RVs and other oversize vehicles in the oversize vehicle parking area. No double parking was observed on July 21 and 22, 2010, even though these dates were the seventh and eighth busiest days of the year.
• The 1998 study presented hourly traffic counts for two days during the 1998 summer season – July 9 and August 19. However, the 1998 study did not give the levels of visitation on these two days compared to other days during the summer season. It is not known if these two dates represented days of average visitation, high visitation, or low visitation. Data in this report (2010) provide the reader with information on the highest, fifth highest and tenth highest days of the season.
• Many of the short-term recommendations for improvements to the road system and parking areas presented in the 1998 report have been implemented by the Monument.
• The 1998 report refers to seven waysides on the Tour Road where vehicles can pull out of the traffic lane and which are large enough for only one or two vehicles at a time. The number of waysides has now increased to 18 and can each accommodate from two to seven vehicles. The parking area at the Reno-Benteen Battlefield (the end of the Tour Road) continues to have parking for 13 cars and two oversize vehicles, as it did in 1998. In 1998 the Seventh Cavalry Monument area could park about ten cars and three or four oversize vehicles. It now has only three handicapped parking spaces. The Indian Memorial has also been added.
• The 1998 report concluded that “89 percent of the vehicles that enter the Monument also travel on the Tour Road”. The traffic count data collected in 2010 show that a much smaller percentage of vehicles – 50 to 55 percent – travel on the Tour Road.
Vehicles parked on shoulder of MT Route 342
on July 21
32
• The 1998 report observed vehicle classification using two methods. Through use of machine traffic counts (the first method) on Montana State Route 342, the study concluded that 67 percent of vehicles entering the Monument were regular size vehicles and 31 percent were some form of oversize vehicle. In a spot classification count (the second method) the vehicle mix was 78 percent cars, four percent motorcycles and 17 percent oversize vehicles. The great difference in percentage of oversize vehicles might be the result of the classification system used by the traffic counting machines. In comparison to the 1998 study results above, this 2010 study found 75 to 81 percent regular size vehicles and 19 to 25 percent oversize vehicles. Some long-term Monument staff believe that the number and percent of oversize vehicles has increased over the years.
Short-Term Improvements There are a variety of short-term measures that the Monument can take to improve traffic and parking conditions. It was noted earlier in the section on Parking Occupancy, that under current levels of visitation, there is nearly enough parking for a “Design Day” if minor improvements are made and actions are taken that could better distribute parking. The July 26 report (Appendix D) recommends minor improvements and actions that could better distribute parking, as well as presenting other short-term recommendations. Those recommendations include: directing visitors to available parking when processed at the entrance station; improved existing signing, and additional signing. One additional short-term measure was mentioned earlier in the section on Parking Occupancy. That is the suggestion to have employees park their vehicles at locations other than the visitor parking areas.
Strategies for Days with Visitation Higher than the Design Day
In this report’s earlier discussion on the concept of the “Design Day”, it was explained that it is uneconomical to, for example, build enough parking to accommodate the highest day of visitation. Fortunately, for Little Bighorn Battlefield, the dates on which visitation exceeds the “Design Day” appear to be predictable. In 2009 the top five days of visitation were June 25 and the three days immediately thereafter, and the day prior to the Sturgis Motorcycle Rally. In 2010 the top five days of visitation were June 25 and the two days immediately thereafter, the day prior to the beginning of the Sturgis Motorcycle Rally and the starting day of the Sturgis Motorcycle Rally. Because these dates are predictable, the Monument can pre-plan strategies for handling large numbers of visitors on those days. For those days of the season when visitation exceeds the “Design Day”, the Monument should consider special strategies to accommodate the levels of visitation and parking demand. As noted earlier in this report, the high vehicle count associated with the Sturgis Motorcycle Rally includes very large numbers of motorcycles, which can park with as many as four motorcycles to one regular parking space. Thus, the dates associated with the Motorcycle Rally probably do not exceed a Design Day in terms of parking.
33
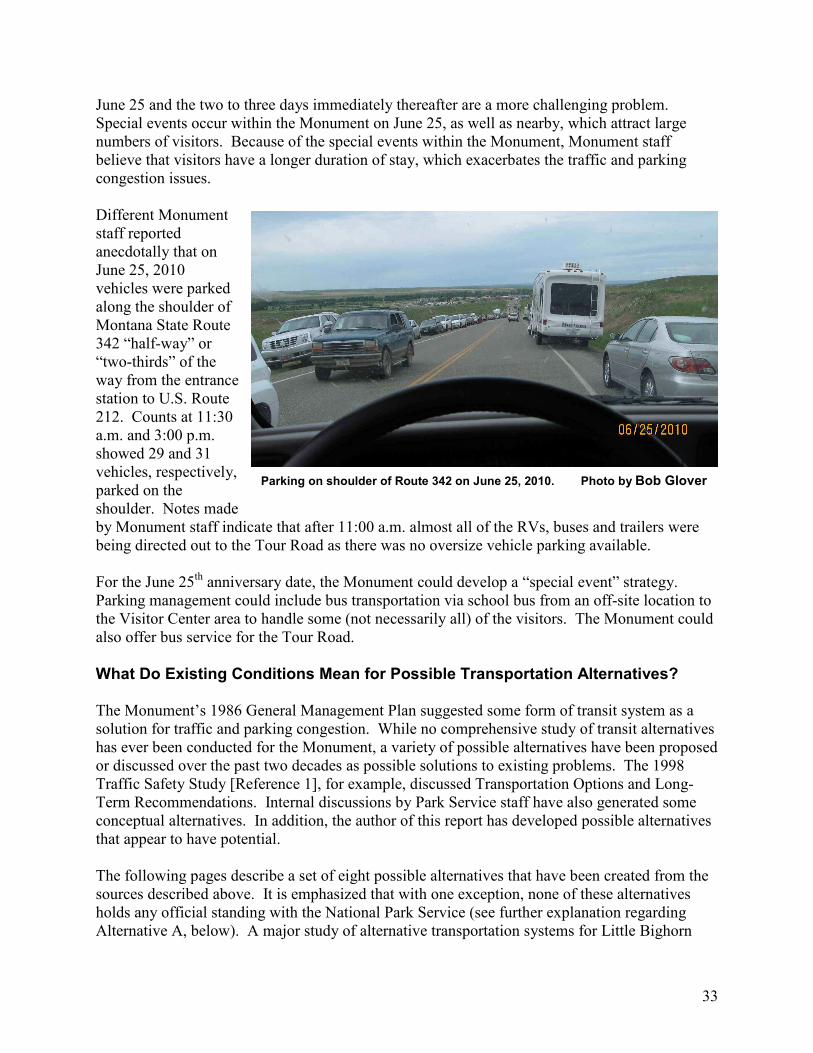
June 25 and the two to three days immediately thereafter are a more challenging problem. Special events occur within the Monument on June 25, as well as nearby, which attract large numbers of visitors. Because of the special events within the Monument, Monument staff believe that visitors have a longer duration of stay, which exacerbates the traffic and parking congestion issues. Different Monument staff reported anecdotally that on June 25, 2010 vehicles were parked along the shoulder of Montana State Route 342 “half-way” or “two-thirds” of the way from the entrance station to U.S. Route 212. Counts at 11:30 a.m. and 3:00 p.m. showed 29 and 31 vehicles, respectively, parked on the shoulder. Notes made by Monument staff indicate that after 11:00 a.m. almost all of the RVs, buses and trailers were being directed out to the Tour Road as there was no oversize vehicle parking available. For the June 25th anniversary date, the Monument could develop a “special event” strategy. Parking management could include bus transportation via school bus from an off-site location to the Visitor Center area to handle some (not necessarily all) of the visitors. The Monument could also offer bus service for the Tour Road.
What Do Existing Conditions Mean for Possible Transportation Alternatives?
The Monument’s 1986 General Management Plan suggested some form of transit system as a solution for traffic and parking congestion. While no comprehensive study of transit alternatives has ever been conducted for the Monument, a variety of possible alternatives have been proposed or discussed over the past two decades as possible solutions to existing problems. The 1998 Traffic Safety Study [Reference 1], for example, discussed Transportation Options and Long-Term Recommendations. Internal discussions by Park Service staff have also generated some conceptual alternatives. In addition, the author of this report has developed possible alternatives that appear to have potential. The following pages describe a set of eight possible alternatives that have been created from the sources described above. It is emphasized that with one exception, none of these alternatives holds any official standing with the National Park Service (see further explanation regarding Alternative A, below). A major study of alternative transportation systems for Little Bighorn
Parking on shoulder of Route 342 on June 25, 2010. Photo by Bob Glover
34
Battlefield National Monument is likely to be conducted by the National Park Service in 2011. That study will develop formal alternatives and that study will seek public and stakeholder input. The purpose of presenting the possible alternatives on the following pages is to evaluate them in the context of the findings of existing traffic and parking conditions. The possible transportation alternatives are labeled A through H. For each alternative, a summary description is presented. That description is indented and in a smaller, different font. Each description is then followed by a discussion of this report’s findings and what those findings mean for the alternative. The discussion identifies the consequences associated with an alternative in terms of the level of shuttle system service required, parking demand associated with an alternative, and other effects. Those discussions of consequences are based on visitation equal to the 2010 Design Day.
Alternative A - Expand Existing Parking Lots & Widen Road
Alternative A is to implement a parking and Tour Road improvement project that was designed by the Federal Highway Administration. At this point in time, this project is on indefinite hold while the Monument considers other possible ways to solve traffic and parking problems. In this alternative, oversize vehicles would continue to park in the Monument and drive the Tour Road. The Tour Road would be widened to 24 feet in order to accommodate oversize vehicles passing each other safely, and to correct structural deficiencies in the road. Parking at both the Visitor Center and the Reno-Benteen Battlefield would be modified and expanded to accommodate more oversize vehicles, better traffic flow including bus pullouts, and motorcycle parking.
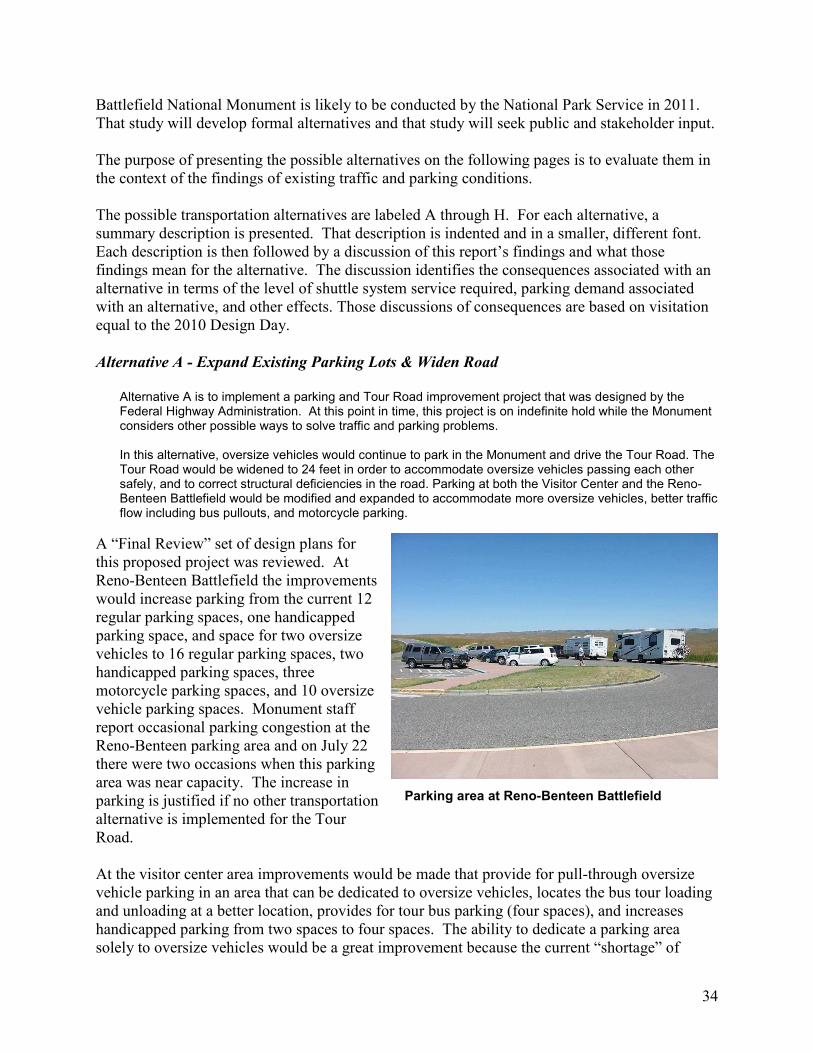
A “Final Review” set of design plans for this proposed project was reviewed. At Reno-Benteen Battlefield the improvements would increase parking from the current 12 regular parking spaces, one handicapped parking space, and space for two oversize vehicles to 16 regular parking spaces, two handicapped parking spaces, three motorcycle parking spaces, and 10 oversize vehicle parking spaces. Monument staff report occasional parking congestion at the Reno-Benteen parking area and on July 22 there were two occasions when this parking area was near capacity. The increase in parking is justified if no other transportation alternative is implemented for the Tour Road. At the visitor center area improvements would be made that provide for pull-through oversize vehicle parking in an area that can be dedicated to oversize vehicles, locates the bus tour loading and unloading at a better location, provides for tour bus parking (four spaces), and increases handicapped parking from two spaces to four spaces. The ability to dedicate a parking area solely to oversize vehicles would be a great improvement because the current “shortage” of
Parking area at Reno-Benteen Battlefield
35
oversize vehicle parking is largely due to oversize vehicle spaces being occupied by regular size vehicles. The overall change in number of parking spaces in the visitor center area includes increasing the number of handicapped parking spaces from two to four, reducing the number of regular parking spaces by four, and a net increase in oversize vehicle parking. Currently, about 16 oversize vehicles can fit in the parallel parking areas intended for oversize vehicles. The proposed improvement would remove much of the existing parallel parking to create four tour bus parking spaces and to build the pull-through oversize vehicle parking area. With the proposed improvement, a total of about 22 oversize vehicles could be accommodated. On July 21 and 22 the largest number of parked oversize vehicles observed was 17 (including oversize vehicles parked north of the entrance station). In the earlier section on Parking Occupancy it was pointed out that on July 21 and 22 there was almost as much parking space available as there was parking demand. July 21 and 22 were equivalent to a 2010 Design Day. The overall change in number of parking spaces under the proposed construction project is a slight decrease in regular parking spaces and a small increase in oversize vehicle parking (about six spaces). With completion of this project, the amount of parking available would be about equal to the demand on a 2010 Design Day. The conclusion is that the proposed construction project would improve parking operations and would accommodate parking demand equal to a 2010 Design Day, but would not provide any excess parking capacity that would allow for future growth in visitation.
Alternative B - Off-site Oversize Vehicle Parking & Shuttle
Alternative B is to provide off-site parking for oversize vehicles, and implement shuttle bus and tour service. This alternative could be accomplished by an agreement with an adjacent landowner to park vehicles off-site. In the short term, potentially an agreement could be reached for parking at the existing commercial facilities on U.S. Route 212. For the restaurant and surrounding businesses, this provides a greater opportunity to attract potential customers. In order to makes this alternative feasible, both a shuttle system from parking to the visitor center and a tour on the Tour Road are required. The shuttle and tour could be separate or combined. Potential ways of providing the shuttle bus and tour service are by concessioner or by expanding the existing concession operated tour contract to include the shuttle. If the Monument were to provide the shuttle, and the concessionaire to provide the tour, schedules would need to be coordinated, and ways of funding the Monument shuttle considered: free to the public, increase entry fee, or charge a fee for the shuttle. In the long term, parking might be accommodated at a future Montana Department of Transportation Rest Area, future Crow Nation Casino, or on the Custer Battlefield Preservation Committee, Inc. parcel. In any case, Intelligent Transportation System information signs on I-90 are key components of the alternative in order to give visitors parking information early and avoid confusion and frustration. The off-site parking could be either voluntary or mandatory. If the off-site parking is voluntary, advantages
to the visitor include easy in / easy out access to I-90, but shuttle fees may discourage use. The existing parking lots within the Monument would not be expanded
The above description states that off-site parking could be either voluntary or mandatory. If levels of voluntary use are high enough, this alternative would relieve parking congestion on the
36
“Design Day”. If off-site parking was mandatory, it is obvious from the existing parking occupancy data that enough parking currently exists for regular size vehicles. If off-site parking was mandatory, how many visitors per day would shuttle systems need to accommodate? This question applies separately to service between off-site oversize vehicle parking and the visitor center, and to service on the Tour Road for passengers of oversize vehicles. First, consider the service from the off-site parking area. Nineteen to 25 percent of vehicles arriving at Little Bighorn Battlefield are oversize. To provide an estimate that has a high probability of meeting demand, the high end of this range will be used. On the 2010 Design Day, 660 vehicles entered the Monument during the hours of 8:00 a.m. to 6:00 p.m. For convenience, this analysis will presume that any shuttle system will operate during these same hours and that oversize vehicles that arrive before 8:00 a.m. or after 6:00 p.m. may enter the Monument. 660 vehicles x 25 percent = 165 oversize vehicles arrive on the Design Day For this analysis it is presumed that the average vehicle occupancy is 2.6 persons per vehicle. Appendix C shows that on most summer days in 2010 the use of the 2.6 persons per vehicle factor yielded a number of visitors that was higher than the actual passenger count. But, again, to be conservative in the analysis and provide a high probability of meeting demand, the 2.6 value will be used. 165 oversize vehicles x 2.6 passengers per vehicle = 429 visitors per day arriving in
oversize vehicles The number of shuttle vehicles that would be needed to serve 429 visitors per day is a function of the arrival rate of these visitors at the peak time of day, the frequency of service that is desired between the off-site parking location and the visitor center, the round-trip travel time between the off-site parking and the visitor center, and the passenger capacity of each shuttle vehicle. Figure 11 shows a peak vehicle arrival rate of about 100 vehicles per hour, 25 of which would be oversize vehicles. These 25 oversize vehicles would have 25 x 2.6 = 65 passengers. If no delays are encountered at the entrance station, a shuttle vehicle could make a round-trip between off-site parking and the visitor center every ten minutes. At this frequency, a 12 to 18 passenger shuttle vehicle could carry 72 to 108 passengers per hour in each direction. Thus, a single vehicle could provide the needed capacity of 65 passengers per hour. This single vehicle would serve throughout the day. Because oversize vehicles would not enter the Monument, existing parking areas would be adequate to handle parking demand on a 2010 Design Day, but would be unlikely to handle parking demand on the highest day of the year. Second, consider service on the Tour Road. An assumption must be made about the numbers of visitors that would use this service. Looking at all visitors, about 50 to 55 percent of visitor vehicles drive on the Tour Road (see earlier section on Tour Road Usage) and an additional 6 to 7 percent of visitors take the guided bus tour on the Tour Road (see earlier section on Ridership
37
on Existing Tour Service). It is also known that oversize vehicles choose to drive on the Tour Road at a lesser rate than regular size vehicles. Would visitor behavior change with shuttle system service on the Tour Road? Would more oversize vehicle passengers choose to tour the Tour Road if they could use a shuttle service rather than drive their oversize vehicle? Would a shuttle service on the Tour Road be limited only to those visitors who arrived in an oversize vehicle (and parked remotely) or would a shuttle service on the Tour Road be available to any visitor? Would there be a fee for the Tour Road shuttle? Would there be interpretation on-board the shuttle? Will visitor interest in the Tour Road remain about the same (about half of all visitors go on the Tour Road)? The answers to each of these questions would have an influence on ridership. For purposes of illustration, this analysis will assume that each of the 65 passengers per hour arriving in oversize vehicles would use Tour Road shuttle system. If a different assumption is desired, the result can be factored up or down to correspond to those assumptions (see below). A Tour Road shuttle vehicle could make one round-trip per hour based on assumptions of an average speed of 20 miles per hour for the 10 mile round-trip and 25 minutes of stops for interpretation. Because the round-trip travel time is six times as long as the 10 minute off-site parking route, six times as many shuttle vehicles would be required (assuming the same size of vehicle). Six shuttle vehicles would be required and this would allow 10 minute headways. If only half of the oversize vehicle passengers use the shuttle service, then only three vehicles would be required and 20 minute headways would be provided. If all visitors are allowed access to the shuttle service, then vehicle requirements would increase by a factor of four. To serve the day of highest visitation, vehicle requirements would increase by 50 percent. The scale of a Tour Road shuttle system can be better appreciated if it is put in context. The basic assumption above is that all arriving oversize vehicle passengers will use the Tour Road shuttle system. This is equal to 429 passengers per day. In comparison, on the highest ridership day in 2010 the guided bus tour had 131 passengers.
Alternative C - Oversize Vehicle Demand Management (No Build)
Alternative C provides a no build / low cost option for oversize vehicle demand management. This alternative asks visitors in oversize vehicles to drive the Tour Road before stopping at the visitor center if parking is full – which is how the Monument currently operates. Visitors then have the chance of finding a space when they get back to the visitor center. Chances of finding a parking space and visitor experience can be improved in the following ways: 1. Employ Intelligent Transportation System signs to assist visitor entry experience. Sign parking for 60 minutes (or less) to encourage turnover 2. Hire seasonal meter / greeter(s) to explain how things work 3. Offer free audio tour to visitors who cannot park to enter the visitor center
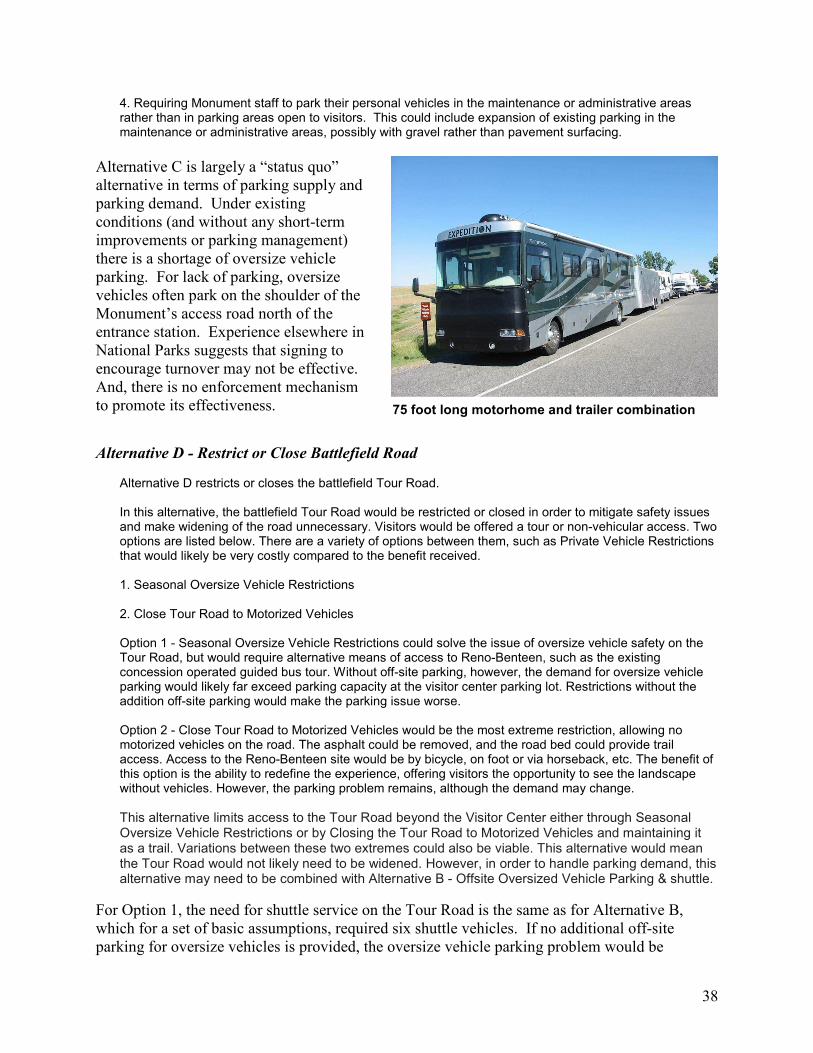
38
4. Requiring Monument staff to park their personal vehicles in the maintenance or administrative areas rather than in parking areas open to visitors. This could include expansion of existing parking in the maintenance or administrative areas, possibly with gravel rather than pavement surfacing.
Alternative C is largely a “status quo” alternative in terms of parking supply and parking demand. Under existing conditions (and without any short-term improvements or parking management) there is a shortage of oversize vehicle parking. For lack of parking, oversize vehicles often park on the shoulder of the Monument’s access road north of the entrance station. Experience elsewhere in National Parks suggests that signing to encourage turnover may not be effective. And, there is no enforcement mechanism to promote its effectiveness.
Alternative D - Restrict or Close Battlefield Road
Alternative D restricts or closes the battlefield Tour Road. In this alternative, the battlefield Tour Road would be restricted or closed in order to mitigate safety issues and make widening of the road unnecessary. Visitors would be offered a tour or non-vehicular access. Two options are listed below. There are a variety of options between them, such as Private Vehicle Restrictions that would likely be very costly compared to the benefit received. 1. Seasonal Oversize Vehicle Restrictions 2. Close Tour Road to Motorized Vehicles Option 1 - Seasonal Oversize Vehicle Restrictions could solve the issue of oversize vehicle safety on the Tour Road, but would require alternative means of access to Reno-Benteen, such as the existing concession operated guided bus tour. Without off-site parking, however, the demand for oversize vehicle parking would likely far exceed parking capacity at the visitor center parking lot. Restrictions without the addition off-site parking would make the parking issue worse. Option 2 - Close Tour Road to Motorized Vehicles would be the most extreme restriction, allowing no motorized vehicles on the road. The asphalt could be removed, and the road bed could provide trail access. Access to the Reno-Benteen site would be by bicycle, on foot or via horseback, etc. The benefit of this option is the ability to redefine the experience, offering visitors the opportunity to see the landscape without vehicles. However, the parking problem remains, although the demand may change.
This alternative limits access to the Tour Road beyond the Visitor Center either through Seasonal Oversize Vehicle Restrictions or by Closing the Tour Road to Motorized Vehicles and maintaining it as a trail. Variations between these two extremes could also be viable. This alternative would mean the Tour Road would not likely need to be widened. However, in order to handle parking demand, this alternative may need to be combined with Alternative B - Offsite Oversized Vehicle Parking & shuttle.
For Option 1, the need for shuttle service on the Tour Road is the same as for Alternative B, which for a set of basic assumptions, required six shuttle vehicles. If no additional off-site parking for oversize vehicles is provided, the oversize vehicle parking problem would be
75 foot long motorhome and trailer combination
39
exacerbated. The increased demand for oversize vehicle parking can be estimated, as follows. First, Figure 13 shows that vehicle accumulation on the Tour Road peaks at almost 50 vehicles. It is also known (see earlier section on Oversize Vehicles) that 11 percent of vehicles on the Tour Road are oversize vehicles. Thus, as many as about five oversize vehicles may be on the Tour Road at one time. If, instead of driving on the Tour Road, the oversize vehicle passengers choose to take a shuttle system tour, those oversize vehicles will be in a parking area near the visitor center. The actual increase in parking demand will likely be more than five oversize vehicles because a shuttle system tour will likely take longer than a self-driven tour. The effects of Option 2 are more difficult to evaluate. On the one hand, it is likely that many fewer visitors will choose to experience the reconstituted Tour Road because walking, bicycling, or horseback riding will be very time consuming. On the other hand, those visitors who do take advantage of the new trail will likely spend much longer in walking, bicycling or horseback riding than driving. Considering both of these factors, an increase in parking demand is possible. Option 2 suggests that bicycles would be allowed to use the closed Tour Road. Grades on the Tour Road are steep at many locations. Grades exceed four percent at 16 locations, including 11 locations with grades exceeding five percent and three locations exceeding seven percent. These grades would not provide for an enjoyable bicycle ride for most people. Removal of the pavement and replacement with a gravel surface would further increase the power and effort required for uphill travel.
Alternative E - One-way Road (From GMP)
Alternative E carries out one of the options from the Monument’s General Management Plan. The visitor center is relocated near Reno-Benteen (1986 GMP), or at Garryowen (1995 GMP update) and the Tour Road becomes a one-way road that allows visitors to experience the site in chronological sequence of the battle (from south to north). From the GMP: “Adequate parking space would be provided for oversize vehicles in the new visitor orientation/administration facility parking area. These vehicles would not be permitted beyond the parking area; however, occupants of these vehicles could take the guided bus tour through the national monument or take a shuttle or trail to Last Stand Hill.
The amount of shuttle system service needed for Alternative E is probably the same as for the Tour Road shuttle system in Alternative B. The number of oversize vehicle passengers is the same. The duration of a shuttle round-trip probably is about the same. The shuttle vehicle would travel on the one-way Tour Road and then return to the new visitor center via U.S. Route 212 and Interstate 90. Thus, for the same basic assumptions about ridership level as in Alternative B, six shuttle vehicles would be required. Although Little Bighorn Battlefield has focused on the five transportation alternatives (A through E) described above, there may be other alternatives for which it is worthwhile to analyze and understand the potential effects. Three additional alternatives are presented below and for convenience are listed as F through H.
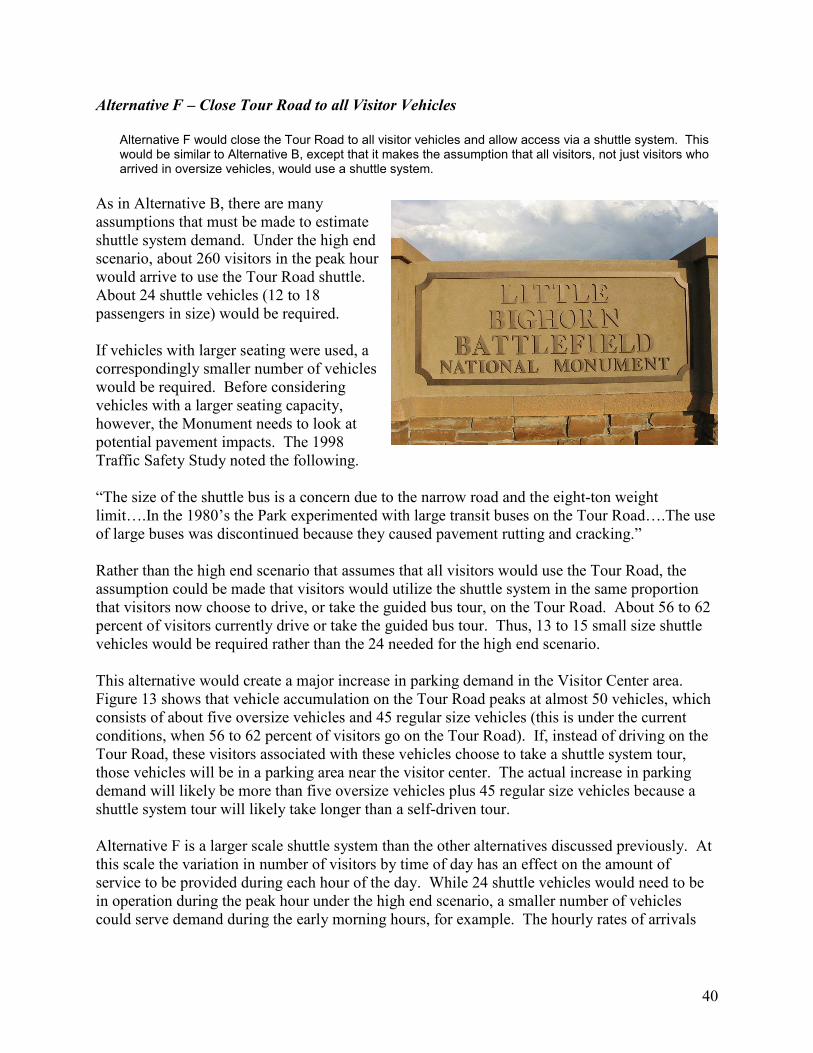
40
Alternative F – Close Tour Road to all Visitor Vehicles
Alternative F would close the Tour Road to all visitor vehicles and allow access via a shuttle system. This would be similar to Alternative B, except that it makes the assumption that all visitors, not just visitors who arrived in oversize vehicles, would use a shuttle system.
As in Alternative B, there are many assumptions that must be made to estimate shuttle system demand. Under the high end scenario, about 260 visitors in the peak hour would arrive to use the Tour Road shuttle. About 24 shuttle vehicles (12 to 18 passengers in size) would be required. If vehicles with larger seating were used, a correspondingly smaller number of vehicles would be required. Before considering vehicles with a larger seating capacity, however, the Monument needs to look at potential pavement impacts. The 1998 Traffic Safety Study noted the following. “The size of the shuttle bus is a concern due to the narrow road and the eight-ton weight limit….In the 1980’s the Park experimented with large transit buses on the Tour Road….The use of large buses was discontinued because they caused pavement rutting and cracking.” Rather than the high end scenario that assumes that all visitors would use the Tour Road, the assumption could be made that visitors would utilize the shuttle system in the same proportion that visitors now choose to drive, or take the guided bus tour, on the Tour Road. About 56 to 62 percent of visitors currently drive or take the guided bus tour. Thus, 13 to 15 small size shuttle vehicles would be required rather than the 24 needed for the high end scenario. This alternative would create a major increase in parking demand in the Visitor Center area. Figure 13 shows that vehicle accumulation on the Tour Road peaks at almost 50 vehicles, which consists of about five oversize vehicles and 45 regular size vehicles (this is under the current conditions, when 56 to 62 percent of visitors go on the Tour Road). If, instead of driving on the Tour Road, these visitors associated with these vehicles choose to take a shuttle system tour, those vehicles will be in a parking area near the visitor center. The actual increase in parking demand will likely be more than five oversize vehicles plus 45 regular size vehicles because a shuttle system tour will likely take longer than a self-driven tour. Alternative F is a larger scale shuttle system than the other alternatives discussed previously. At this scale the variation in number of visitors by time of day has an effect on the amount of service to be provided during each hour of the day. While 24 shuttle vehicles would need to be in operation during the peak hour under the high end scenario, a smaller number of vehicles could serve demand during the early morning hours, for example. The hourly rates of arrivals
41
and departures presented in Figure 11 can be used to determine the amount of service required during each hour of the day.
Alternative G – Require Trailers to be Parked outside of Entrance
Alternative G would require trailers to be parked outside the entrance to the Monument.
Mesa Verde National Park and Devil’s Tower National Monument are examples of two park units that require trailers to be parked near the park entrance. A similar strategy could be employed at Little Bighorn that would require trailers to be parked at an off-site location. In addition, motorhomes towing a vehicle (such as a passenger car) could be required to park at the off-site location and use the vehicle to drive into the Monument. These two combinations correspond to Vehicle Types C and E in Table 3. Vehicle Types C and E account for about one-fourth of all oversize vehicles. Thus, requiring these trailers and motorhomes to remain outside the Monument would result in a slight reduction in oversize vehicle parking demand inside the Monument. This alternative does have the advantage of reducing oversized vehicle parking demand without requiring a shuttle system to move visitors. This alternative also has the challenge of communicating to the operators of Vehicle Types C and E that they are required to park off-site, and communicating this information before these vehicles turn onto Montana State Route 342.
Alternative H – Visitor Center Expansion
Alternative H is a proposal to expand the visitor center at its current location.
Although not a transportation alternative in itself, a proposal to expand the Monument visitor center at its current location does have transportation impacts. An expanded visitor center would provide additional opportunities for visitors to learn about the Monument’s history through expanded exhibits, interactive media, etc. This, in turn, would likely lead to an increased average length of stay, which would have the effect of increasing parking demand.
Length of Season for Shuttle System
Alternatives B, D, E and F each include a shuttle system. Clearly, these systems are not needed year-round. For much of the year the visitation levels are low enough that parking congestion is not an issue. During what weeks of the year, then, would these systems be needed to avoid parking congestion in the visitor center area? For Alternative G, a similar question could be asked. During what weeks of the year should trailers be required to be parked outside the entrance? The answer to these questions does vary by alternative, but the following general observation can be made. Figure 7 shows that, with the exception of Memorial Day, all of the days that have a visitation of 440 vehicles or more fall between mid-June and the third week in August. Days with fewer than 440 vehicles are days that have only two-thirds (or fewer) vehicles than on the
42
2010 Design Day. Dates with less than 440 vehicles are clearly dates that there would be no parking congestion. Based on this, it appears that if the objective is to relieve parking congestion, a shuttle system is needed only from mid-June through the third week in August, a period of about 10 weeks. There is no phenomenon of higher visitation on weekends. Rather, visitation is fairly consistent on all days during this period with the exception of the June 25th anniversary date and the few days thereafter, and the start of the Sturgis Motorcycle Rally. There are no predictable days when visitation is significantly less than 440 vehicles. Therefore, a shuttle system is envisioned to operate every day during this 10 week period.
Summary Regarding Alternatives
A variety of transportation alternatives to address existing traffic and parking issues is available to Little Bighorn Battlefield. Each alternative has advantages and disadvantages, associated capital and operating costs, and other impacts. As part of a major study of alternative transportation systems for Little Bighorn Battlefield National Monument be conducted in 2011, the Monument should consider alternatives – including alternatives similar to those described above - as well as available funding, and select the most appropriate system to serve visitors.
References [1] Traffic Safety Study: Little Bighorn Battlefield National Monument, October, 1998, prepared by Robert Peccia & Associates. [2] Recommendations on Parking Issues at Little Bighorn Battlefield National Monument, prepared by Jonathan Upchurch, July 26, 2010. (reproduced in Appendix D)

43
APPENDICES
44
APPENDIX A LITTLE BIGHORN BATTLEFIELD NATIONAL MONUMENT PUBLIC USE COUNTING AND REPORTING INSTRUCTIONS
(In effect from 1994 to present) From National Park Service Public Use Statistics website http://www.nature.nps.gov/stats/
Following are detailed instructions for collecting and reporting data to be entered on Form 10-157, Revised, Monthly Public Use Report by Little Bighorn Battlefield National Monument. These instructions are effective the date of issuance and will continue in effect unless changed by amendment or by memorandum from the Socio-Economic Studies Division to the superintendent approving a requested change. Each item below describes the procedures to be followed in collecting public use data and summarizing the various elements of those data for entry on the corresponding line on the 10-157, Monthly Public Use Report. Recreation Visits 1. An inductive loop traffic counter is located across the entrance lane to the park. The traffic count is multiplied by 0.99 to reduce for the number of non-recreation vehicles. The reduced vehicle count is multiplied by the persons per vehicle multiplier of 2.6. 2. If the traffic counter is inoperative in the winter months, total recreation visits is the number of visitors entering the visitor center. January 28, 1994
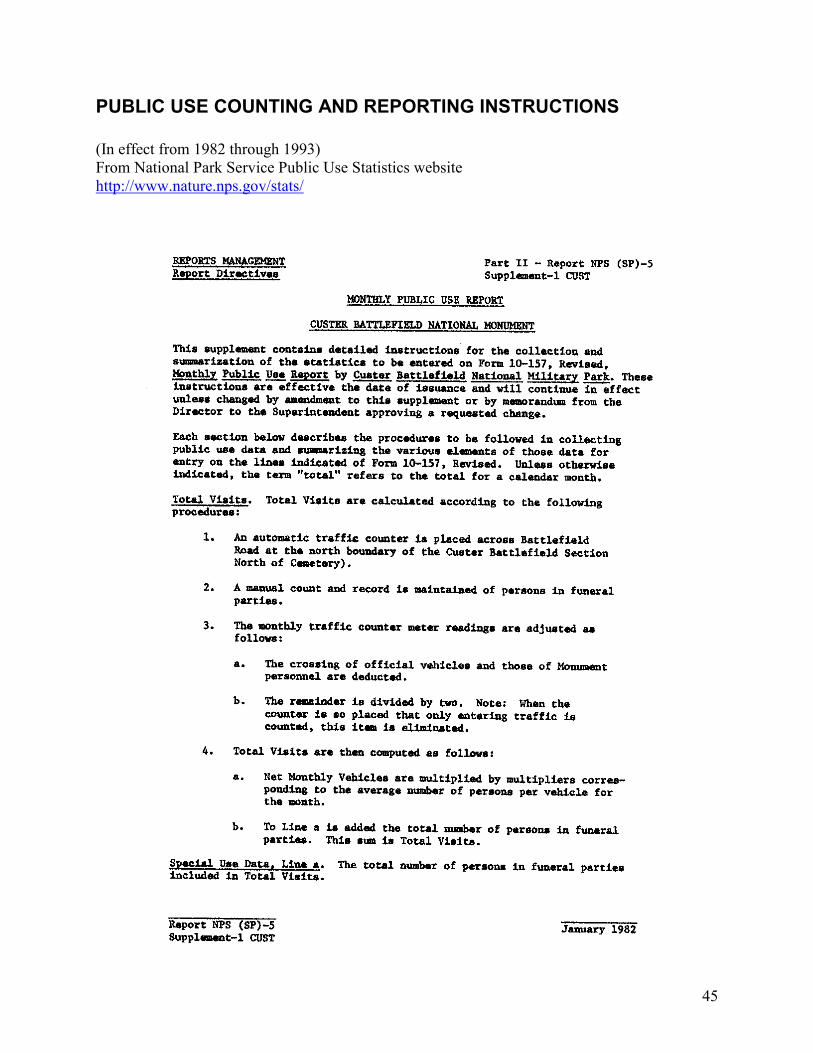
45
PUBLIC USE COUNTING AND REPORTING INSTRUCTIONS
(In effect from 1982 through 1993) From National Park Service Public Use Statistics website http://www.nature.nps.gov/stats/
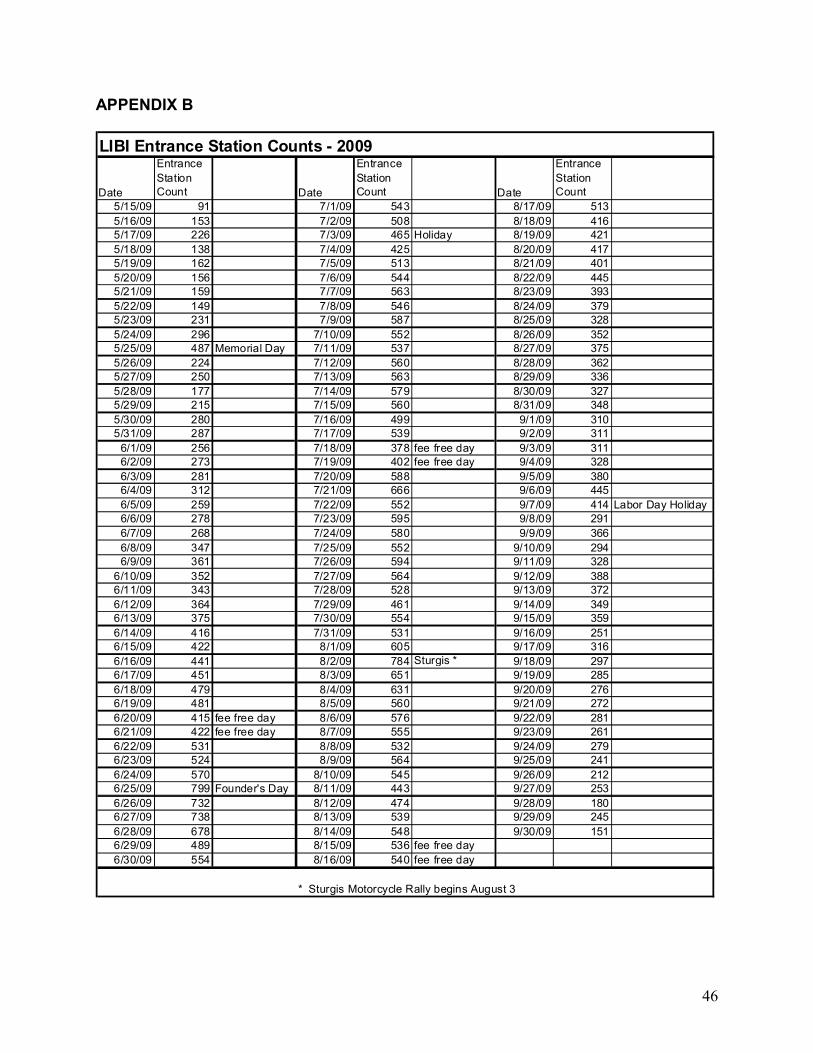
46
APPENDIX B
LIBI Entrance Station Counts - 2009
Date
Entrance
Station
Count Date
Entrance
Station
Count Date
Entrance
Station
Count
5/15/09 91 7/1/09 543 8/17/09 513
5/16/09 153 7/2/09 508 8/18/09 416
5/17/09 226 7/3/09 465 Holiday 8/19/09 421
5/18/09 138 7/4/09 425 8/20/09 417
5/19/09 162 7/5/09 513 8/21/09 401
5/20/09 156 7/6/09 544 8/22/09 445
5/21/09 159 7/7/09 563 8/23/09 393
5/22/09 149 7/8/09 546 8/24/09 379
5/23/09 231 7/9/09 587 8/25/09 328
5/24/09 296 7/10/09 552 8/26/09 352
5/25/09 487 Memorial Day 7/11/09 537 8/27/09 375
5/26/09 224 7/12/09 560 8/28/09 362
5/27/09 250 7/13/09 563 8/29/09 336
5/28/09 177 7/14/09 579 8/30/09 327
5/29/09 215 7/15/09 560 8/31/09 348
5/30/09 280 7/16/09 499 9/1/09 310
5/31/09 287 7/17/09 539 9/2/09 311
6/1/09 256 7/18/09 378 fee free day 9/3/09 311
6/2/09 273 7/19/09 402 fee free day 9/4/09 328
6/3/09 281 7/20/09 588 9/5/09 380
6/4/09 312 7/21/09 666 9/6/09 445
6/5/09 259 7/22/09 552 9/7/09 414 Labor Day Holiday
6/6/09 278 7/23/09 595 9/8/09 291
6/7/09 268 7/24/09 580 9/9/09 366
6/8/09 347 7/25/09 552 9/10/09 294
6/9/09 361 7/26/09 594 9/11/09 328
6/10/09 352 7/27/09 564 9/12/09 388
6/11/09 343 7/28/09 528 9/13/09 372
6/12/09 364 7/29/09 461 9/14/09 349
6/13/09 375 7/30/09 554 9/15/09 359
6/14/09 416 7/31/09 531 9/16/09 251
6/15/09 422 8/1/09 605 9/17/09 316
6/16/09 441 8/2/09 784 Sturgis * 9/18/09 297
6/17/09 451 8/3/09 651 9/19/09 285
6/18/09 479 8/4/09 631 9/20/09 276
6/19/09 481 8/5/09 560 9/21/09 272
6/20/09 415 fee free day 8/6/09 576 9/22/09 281
6/21/09 422 fee free day 8/7/09 555 9/23/09 261
6/22/09 531 8/8/09 532 9/24/09 279
6/23/09 524 8/9/09 564 9/25/09 241
6/24/09 570 8/10/09 545 9/26/09 212
6/25/09 799 Founder's Day 8/11/09 443 9/27/09 253
6/26/09 732 8/12/09 474 9/28/09 180
6/27/09 738 8/13/09 539 9/29/09 245
6/28/09 678 8/14/09 548 9/30/09 151
6/29/09 489 8/15/09 536 fee free day
6/30/09 554 8/16/09 540 fee free day
* Sturgis Motorcycle Rally begins August 3
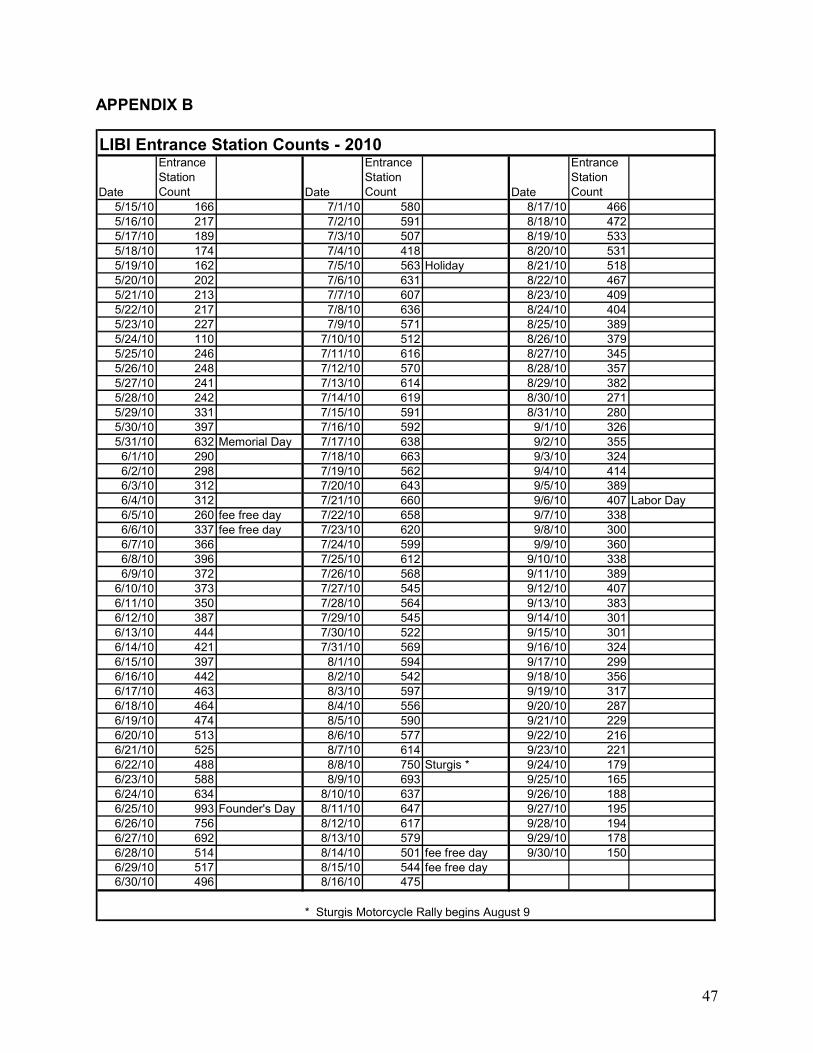
47
APPENDIX B
LIBI Entrance Station Counts - 2010
Date
Entrance
Station
Count Date
Entrance
Station
Count Date
Entrance
Station
Count
5/15/10 166 7/1/10 580 8/17/10 466
5/16/10 217 7/2/10 591 8/18/10 472
5/17/10 189 7/3/10 507 8/19/10 533
5/18/10 174 7/4/10 418 8/20/10 531
5/19/10 162 7/5/10 563 Holiday 8/21/10 518
5/20/10 202 7/6/10 631 8/22/10 467
5/21/10 213 7/7/10 607 8/23/10 409
5/22/10 217 7/8/10 636 8/24/10 404
5/23/10 227 7/9/10 571 8/25/10 389
5/24/10 110 7/10/10 512 8/26/10 379
5/25/10 246 7/11/10 616 8/27/10 345
5/26/10 248 7/12/10 570 8/28/10 357
5/27/10 241 7/13/10 614 8/29/10 382
5/28/10 242 7/14/10 619 8/30/10 271
5/29/10 331 7/15/10 591 8/31/10 280
5/30/10 397 7/16/10 592 9/1/10 326
5/31/10 632 Memorial Day 7/17/10 638 9/2/10 355
6/1/10 290 7/18/10 663 9/3/10 324
6/2/10 298 7/19/10 562 9/4/10 414
6/3/10 312 7/20/10 643 9/5/10 389
6/4/10 312 7/21/10 660 9/6/10 407 Labor Day
6/5/10 260 fee free day 7/22/10 658 9/7/10 338
6/6/10 337 fee free day 7/23/10 620 9/8/10 300
6/7/10 366 7/24/10 599 9/9/10 360
6/8/10 396 7/25/10 612 9/10/10 338
6/9/10 372 7/26/10 568 9/11/10 389
6/10/10 373 7/27/10 545 9/12/10 407
6/11/10 350 7/28/10 564 9/13/10 383
6/12/10 387 7/29/10 545 9/14/10 301
6/13/10 444 7/30/10 522 9/15/10 301
6/14/10 421 7/31/10 569 9/16/10 324
6/15/10 397 8/1/10 594 9/17/10 299
6/16/10 442 8/2/10 542 9/18/10 356
6/17/10 463 8/3/10 597 9/19/10 317
6/18/10 464 8/4/10 556 9/20/10 287
6/19/10 474 8/5/10 590 9/21/10 229
6/20/10 513 8/6/10 577 9/22/10 216
6/21/10 525 8/7/10 614 9/23/10 221
6/22/10 488 8/8/10 750 Sturgis * 9/24/10 179
6/23/10 588 8/9/10 693 9/25/10 165
6/24/10 634 8/10/10 637 9/26/10 188
6/25/10 993 Founder's Day 8/11/10 647 9/27/10 195
6/26/10 756 8/12/10 617 9/28/10 194
6/27/10 692 8/13/10 579 9/29/10 178
6/28/10 514 8/14/10 501 fee free day 9/30/10 150
6/29/10 517 8/15/10 544 fee free day
6/30/10 496 8/16/10 475
* Sturgis Motorcycle Rally begins August 9
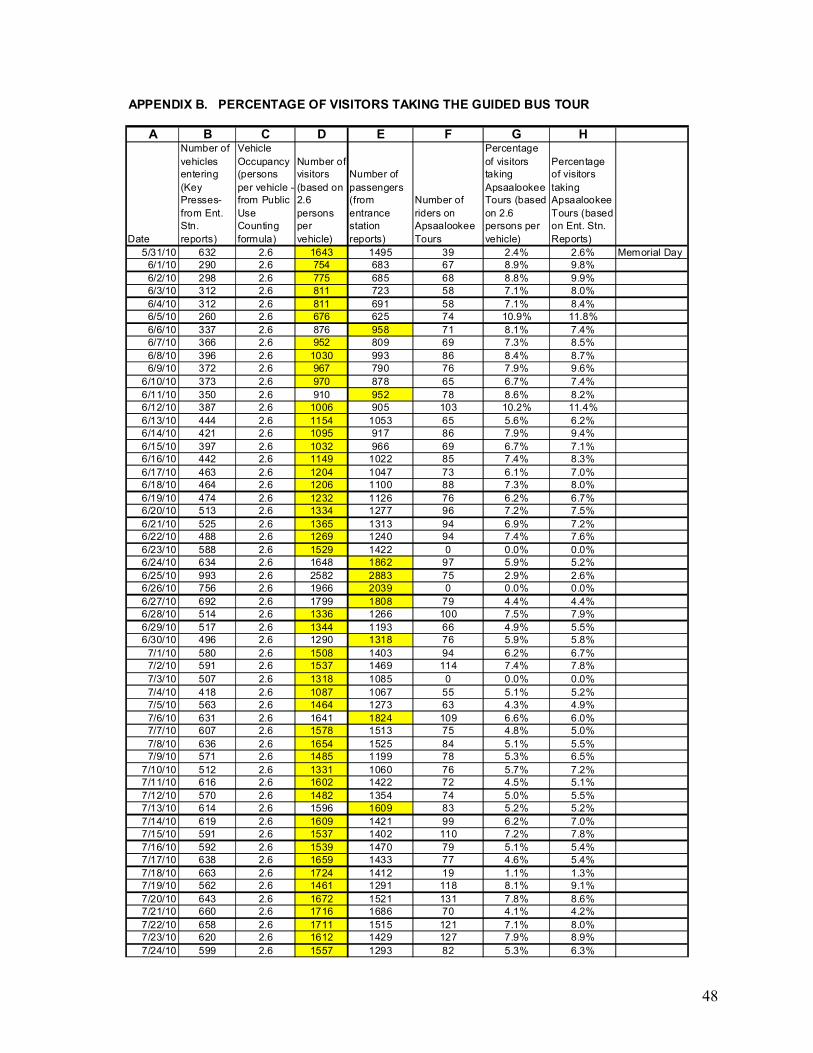
48
APPENDIX B. PERCENTAGE OF VISITORS TAKING THE GUIDED BUS TOUR
A B C D E F G H
Date
Number of
vehicles
entering
(Key
Presses-
from Ent.
Stn.
reports)
Vehicle
Occupancy
(persons
per vehicle -
from Public
Use
Counting
formula)
Number of
visitors
(based on
2.6
persons
per
vehicle)
Number of
passengers
(from
entrance
station
reports)
Number of
riders on
Apsaalookee
Tours
Percentage
of visitors
taking
Apsaalookee
Tours (based
on 2.6
persons per
vehicle)
Percentage
of visitors
taking
Apsaalookee
Tours (based
on Ent. Stn.
Reports)
5/31/10 632 2.6 1643 1495 39 2.4% 2.6% Memorial Day
6/1/10 290 2.6 754 683 67 8.9% 9.8%
6/2/10 298 2.6 775 685 68 8.8% 9.9%
6/3/10 312 2.6 811 723 58 7.1% 8.0%
6/4/10 312 2.6 811 691 58 7.1% 8.4%
6/5/10 260 2.6 676 625 74 10.9% 11.8%
6/6/10 337 2.6 876 958 71 8.1% 7.4%
6/7/10 366 2.6 952 809 69 7.3% 8.5%
6/8/10 396 2.6 1030 993 86 8.4% 8.7%
6/9/10 372 2.6 967 790 76 7.9% 9.6%
6/10/10 373 2.6 970 878 65 6.7% 7.4%
6/11/10 350 2.6 910 952 78 8.6% 8.2%
6/12/10 387 2.6 1006 905 103 10.2% 11.4%
6/13/10 444 2.6 1154 1053 65 5.6% 6.2%
6/14/10 421 2.6 1095 917 86 7.9% 9.4%
6/15/10 397 2.6 1032 966 69 6.7% 7.1%
6/16/10 442 2.6 1149 1022 85 7.4% 8.3%
6/17/10 463 2.6 1204 1047 73 6.1% 7.0%
6/18/10 464 2.6 1206 1100 88 7.3% 8.0%
6/19/10 474 2.6 1232 1126 76 6.2% 6.7%
6/20/10 513 2.6 1334 1277 96 7.2% 7.5%
6/21/10 525 2.6 1365 1313 94 6.9% 7.2%
6/22/10 488 2.6 1269 1240 94 7.4% 7.6%
6/23/10 588 2.6 1529 1422 0 0.0% 0.0%
6/24/10 634 2.6 1648 1862 97 5.9% 5.2%
6/25/10 993 2.6 2582 2883 75 2.9% 2.6%
6/26/10 756 2.6 1966 2039 0 0.0% 0.0%
6/27/10 692 2.6 1799 1808 79 4.4% 4.4%
6/28/10 514 2.6 1336 1266 100 7.5% 7.9%
6/29/10 517 2.6 1344 1193 66 4.9% 5.5%
6/30/10 496 2.6 1290 1318 76 5.9% 5.8%
7/1/10 580 2.6 1508 1403 94 6.2% 6.7%
7/2/10 591 2.6 1537 1469 114 7.4% 7.8%
7/3/10 507 2.6 1318 1085 0 0.0% 0.0%
7/4/10 418 2.6 1087 1067 55 5.1% 5.2%
7/5/10 563 2.6 1464 1273 63 4.3% 4.9%
7/6/10 631 2.6 1641 1824 109 6.6% 6.0%
7/7/10 607 2.6 1578 1513 75 4.8% 5.0%
7/8/10 636 2.6 1654 1525 84 5.1% 5.5%
7/9/10 571 2.6 1485 1199 78 5.3% 6.5%
7/10/10 512 2.6 1331 1060 76 5.7% 7.2%
7/11/10 616 2.6 1602 1422 72 4.5% 5.1%
7/12/10 570 2.6 1482 1354 74 5.0% 5.5%
7/13/10 614 2.6 1596 1609 83 5.2% 5.2%
7/14/10 619 2.6 1609 1421 99 6.2% 7.0%
7/15/10 591 2.6 1537 1402 110 7.2% 7.8%
7/16/10 592 2.6 1539 1470 79 5.1% 5.4%
7/17/10 638 2.6 1659 1433 77 4.6% 5.4%
7/18/10 663 2.6 1724 1412 19 1.1% 1.3%
7/19/10 562 2.6 1461 1291 118 8.1% 9.1%
7/20/10 643 2.6 1672 1521 131 7.8% 8.6%
7/21/10 660 2.6 1716 1686 70 4.1% 4.2%
7/22/10 658 2.6 1711 1515 121 7.1% 8.0%
7/23/10 620 2.6 1612 1429 127 7.9% 8.9%
7/24/10 599 2.6 1557 1293 82 5.3% 6.3%
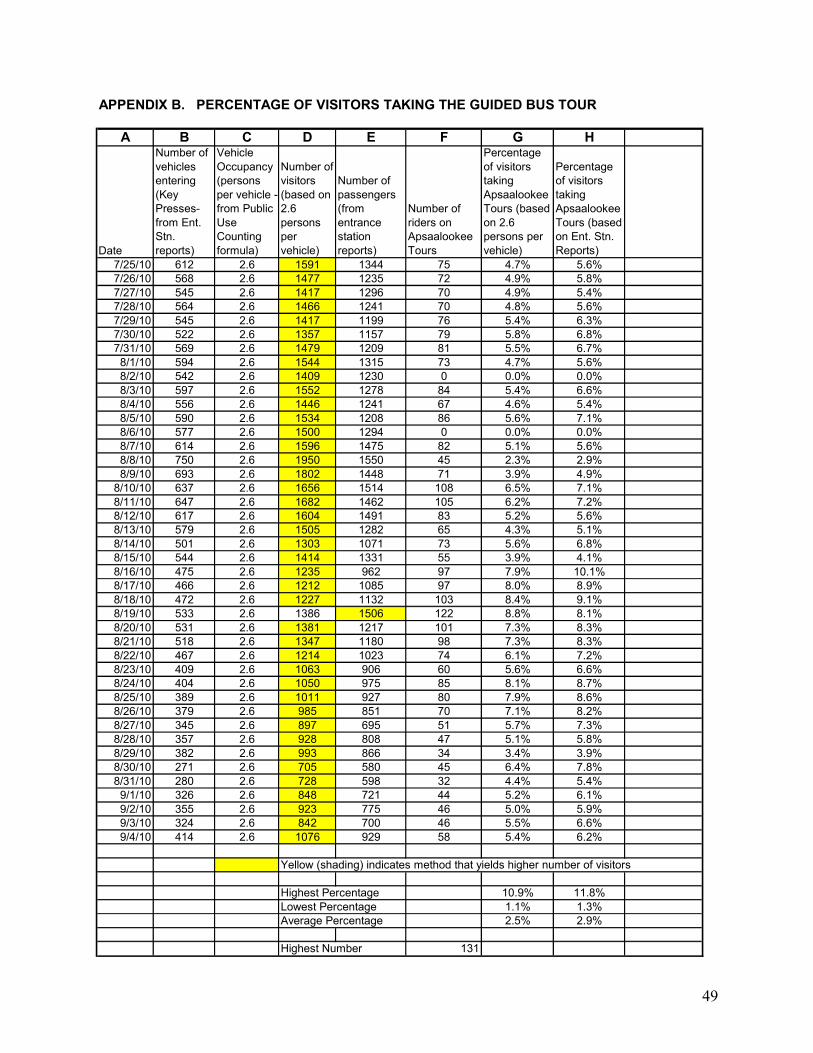
49
APPENDIX B. PERCENTAGE OF VISITORS TAKING THE GUIDED BUS TOUR
A B C D E F G H
Date
Number of
vehicles
entering
(Key
Presses-
from Ent.
Stn.
reports)
Vehicle
Occupancy
(persons
per vehicle -
from Public
Use
Counting
formula)
Number of
visitors
(based on
2.6
persons
per
vehicle)
Number of
passengers
(from
entrance
station
reports)
Number of
riders on
Apsaalookee
Tours
Percentage
of visitors
taking
Apsaalookee
Tours (based
on 2.6
persons per
vehicle)
Percentage
of visitors
taking
Apsaalookee
Tours (based
on Ent. Stn.
Reports)
7/25/10 612 2.6 1591 1344 75 4.7% 5.6%
7/26/10 568 2.6 1477 1235 72 4.9% 5.8%
7/27/10 545 2.6 1417 1296 70 4.9% 5.4%
7/28/10 564 2.6 1466 1241 70 4.8% 5.6%
7/29/10 545 2.6 1417 1199 76 5.4% 6.3%
7/30/10 522 2.6 1357 1157 79 5.8% 6.8%
7/31/10 569 2.6 1479 1209 81 5.5% 6.7%
8/1/10 594 2.6 1544 1315 73 4.7% 5.6%
8/2/10 542 2.6 1409 1230 0 0.0% 0.0%
8/3/10 597 2.6 1552 1278 84 5.4% 6.6%
8/4/10 556 2.6 1446 1241 67 4.6% 5.4%
8/5/10 590 2.6 1534 1208 86 5.6% 7.1%
8/6/10 577 2.6 1500 1294 0 0.0% 0.0%
8/7/10 614 2.6 1596 1475 82 5.1% 5.6%
8/8/10 750 2.6 1950 1550 45 2.3% 2.9%
8/9/10 693 2.6 1802 1448 71 3.9% 4.9%
8/10/10 637 2.6 1656 1514 108 6.5% 7.1%
8/11/10 647 2.6 1682 1462 105 6.2% 7.2%
8/12/10 617 2.6 1604 1491 83 5.2% 5.6%
8/13/10 579 2.6 1505 1282 65 4.3% 5.1%
8/14/10 501 2.6 1303 1071 73 5.6% 6.8%
8/15/10 544 2.6 1414 1331 55 3.9% 4.1%
8/16/10 475 2.6 1235 962 97 7.9% 10.1%
8/17/10 466 2.6 1212 1085 97 8.0% 8.9%
8/18/10 472 2.6 1227 1132 103 8.4% 9.1%
8/19/10 533 2.6 1386 1506 122 8.8% 8.1%
8/20/10 531 2.6 1381 1217 101 7.3% 8.3%
8/21/10 518 2.6 1347 1180 98 7.3% 8.3%
8/22/10 467 2.6 1214 1023 74 6.1% 7.2%
8/23/10 409 2.6 1063 906 60 5.6% 6.6%
8/24/10 404 2.6 1050 975 85 8.1% 8.7%
8/25/10 389 2.6 1011 927 80 7.9% 8.6%
8/26/10 379 2.6 985 851 70 7.1% 8.2%
8/27/10 345 2.6 897 695 51 5.7% 7.3%
8/28/10 357 2.6 928 808 47 5.1% 5.8%
8/29/10 382 2.6 993 866 34 3.4% 3.9%
8/30/10 271 2.6 705 580 45 6.4% 7.8%
8/31/10 280 2.6 728 598 32 4.4% 5.4%
9/1/10 326 2.6 848 721 44 5.2% 6.1%
9/2/10 355 2.6 923 775 46 5.0% 5.9%
9/3/10 324 2.6 842 700 46 5.5% 6.6%
9/4/10 414 2.6 1076 929 58 5.4% 6.2%
Yellow (shading) indicates method that yields higher number of visitors
Highest Percentage 10.9% 11.8%
Lowest Percentage 1.1% 1.3%
Average Percentage 2.5% 2.9%
Highest Number 131
1
APPENDIX D RECOMMENDATIONS ON PARKING ISSUES AT LITTLE BIGHORN BATTLEFIELD NATIONAL MONUMENT Prepared by: Jonathan Upchurch, P.E., P.T.O.E. July 26, 2010 This report presents recommendations to remedy parking issues at Little Bighorn Battlefield quickly and at low cost. Four parking areas will be referred to in this document, using the same names that were used in the 1998 Traffic Safety Study for Little Bighorn Battlefield National Monument [1]. The four parking areas are shown on “Figure 3”, reproduced from the 1998 study (next page). Those four parking areas are as follows. Visitor Center Parking Area: The parking area to the west of the restrooms and consists of 2 handicapped parking spaces, 4 parking spaces reserved for “Park Ranger” vehicles, and 57 parking spaces for regular vehicles. All spaces are perpendicular parking.
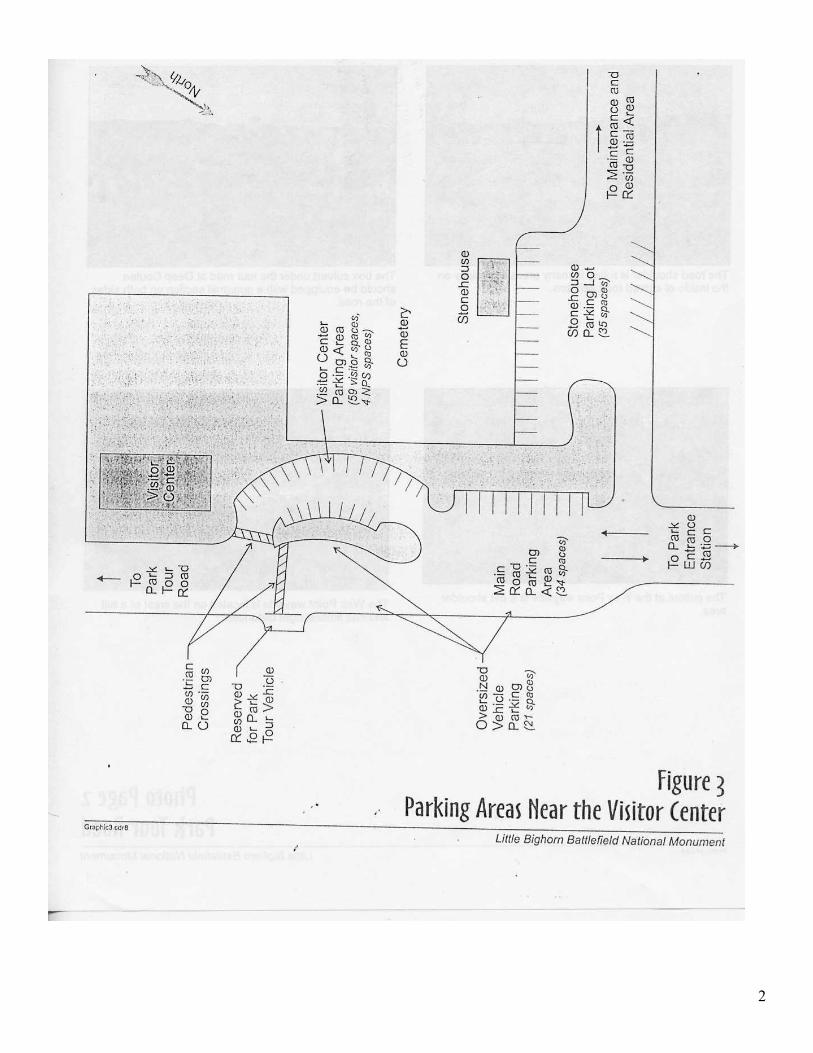
2
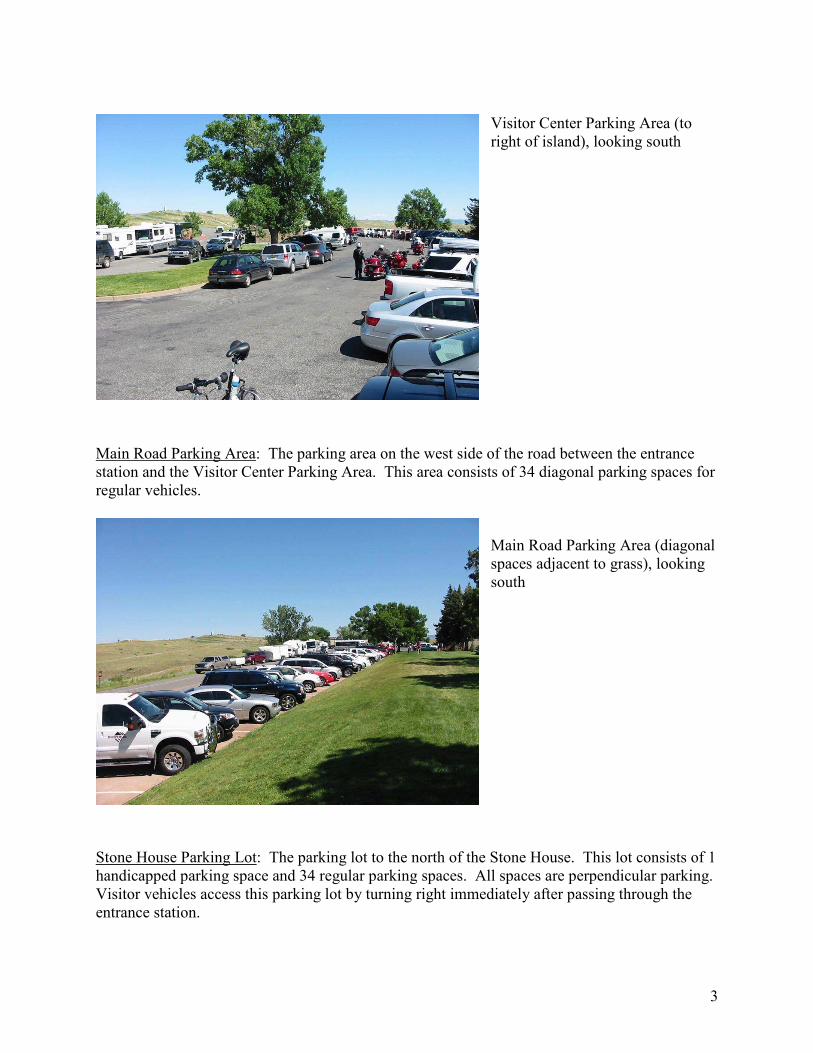
3
Visitor Center Parking Area (to right of island), looking south
Main Road Parking Area: The parking area on the west side of the road between the entrance station and the Visitor Center Parking Area. This area consists of 34 diagonal parking spaces for regular vehicles.
Main Road Parking Area (diagonal spaces adjacent to grass), looking south
Stone House Parking Lot: The parking lot to the north of the Stone House. This lot consists of 1 handicapped parking space and 34 regular parking spaces. All spaces are perpendicular parking. Visitor vehicles access this parking lot by turning right immediately after passing through the entrance station.
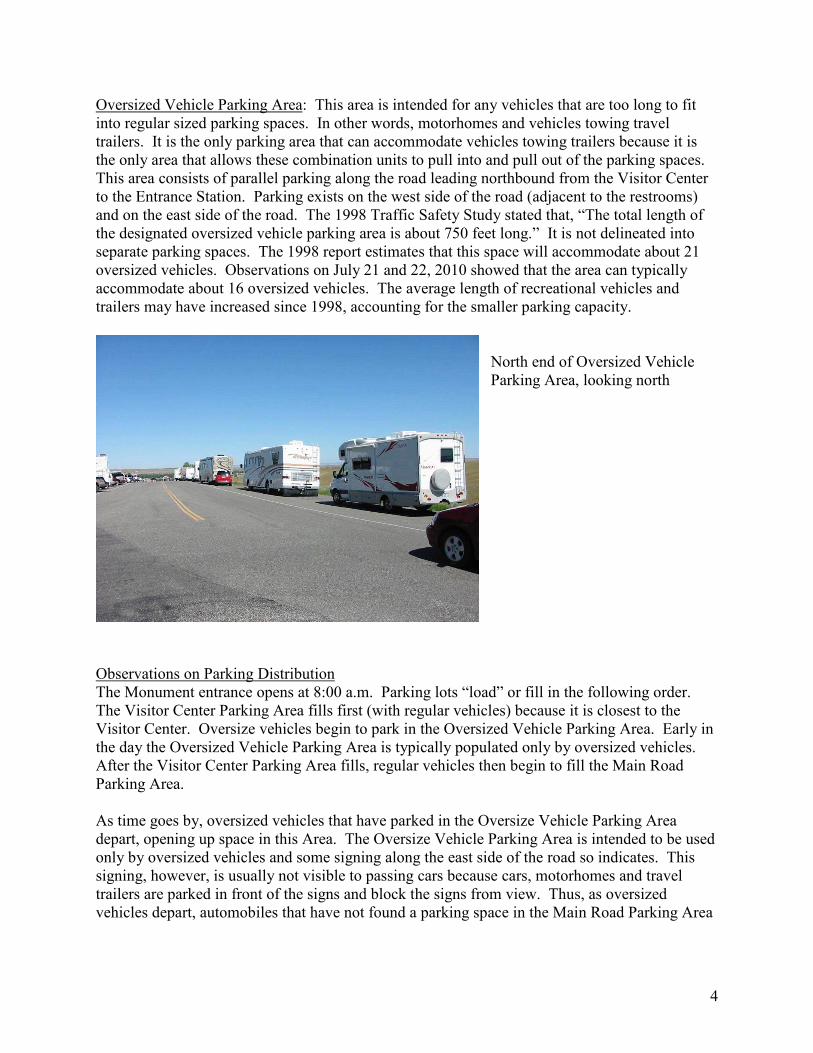
4
Oversized Vehicle Parking Area: This area is intended for any vehicles that are too long to fit into regular sized parking spaces. In other words, motorhomes and vehicles towing travel trailers. It is the only parking area that can accommodate vehicles towing trailers because it is the only area that allows these combination units to pull into and pull out of the parking spaces. This area consists of parallel parking along the road leading northbound from the Visitor Center to the Entrance Station. Parking exists on the west side of the road (adjacent to the restrooms) and on the east side of the road. The 1998 Traffic Safety Study stated that, “The total length of the designated oversized vehicle parking area is about 750 feet long.” It is not delineated into separate parking spaces. The 1998 report estimates that this space will accommodate about 21 oversized vehicles. Observations on July 21 and 22, 2010 showed that the area can typically accommodate about 16 oversized vehicles. The average length of recreational vehicles and trailers may have increased since 1998, accounting for the smaller parking capacity.
North end of Oversized Vehicle Parking Area, looking north
Observations on Parking Distribution The Monument entrance opens at 8:00 a.m. Parking lots “load” or fill in the following order. The Visitor Center Parking Area fills first (with regular vehicles) because it is closest to the Visitor Center. Oversize vehicles begin to park in the Oversized Vehicle Parking Area. Early in the day the Oversized Vehicle Parking Area is typically populated only by oversized vehicles. After the Visitor Center Parking Area fills, regular vehicles then begin to fill the Main Road Parking Area. As time goes by, oversized vehicles that have parked in the Oversize Vehicle Parking Area depart, opening up space in this Area. The Oversize Vehicle Parking Area is intended to be used only by oversized vehicles and some signing along the east side of the road so indicates. This signing, however, is usually not visible to passing cars because cars, motorhomes and travel trailers are parked in front of the signs and block the signs from view. Thus, as oversized vehicles depart, automobiles that have not found a parking space in the Main Road Parking Area
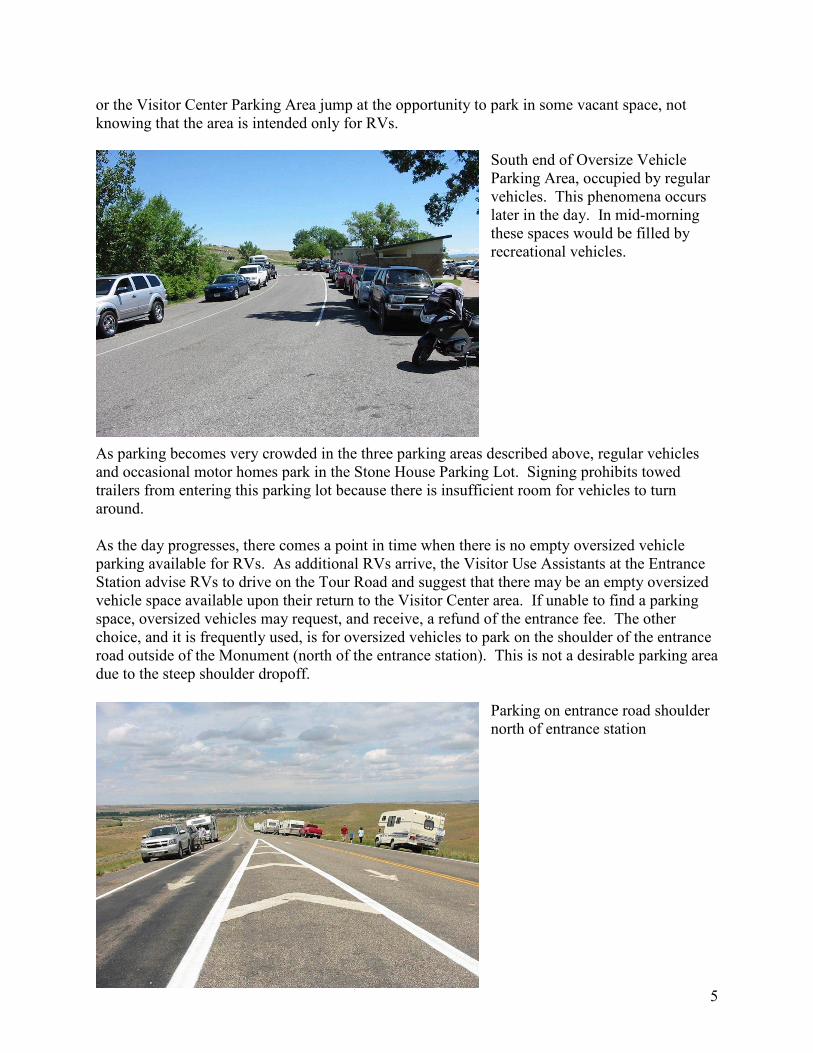
5
or the Visitor Center Parking Area jump at the opportunity to park in some vacant space, not knowing that the area is intended only for RVs.
South end of Oversize Vehicle Parking Area, occupied by regular vehicles. This phenomena occurs later in the day. In mid-morning these spaces would be filled by recreational vehicles.
As parking becomes very crowded in the three parking areas described above, regular vehicles and occasional motor homes park in the Stone House Parking Lot. Signing prohibits towed trailers from entering this parking lot because there is insufficient room for vehicles to turn around. As the day progresses, there comes a point in time when there is no empty oversized vehicle parking available for RVs. As additional RVs arrive, the Visitor Use Assistants at the Entrance Station advise RVs to drive on the Tour Road and suggest that there may be an empty oversized vehicle space available upon their return to the Visitor Center area. If unable to find a parking space, oversized vehicles may request, and receive, a refund of the entrance fee. The other choice, and it is frequently used, is for oversized vehicles to park on the shoulder of the entrance road outside of the Monument (north of the entrance station). This is not a desirable parking area due to the steep shoulder dropoff.
Parking on entrance road shoulder north of entrance station
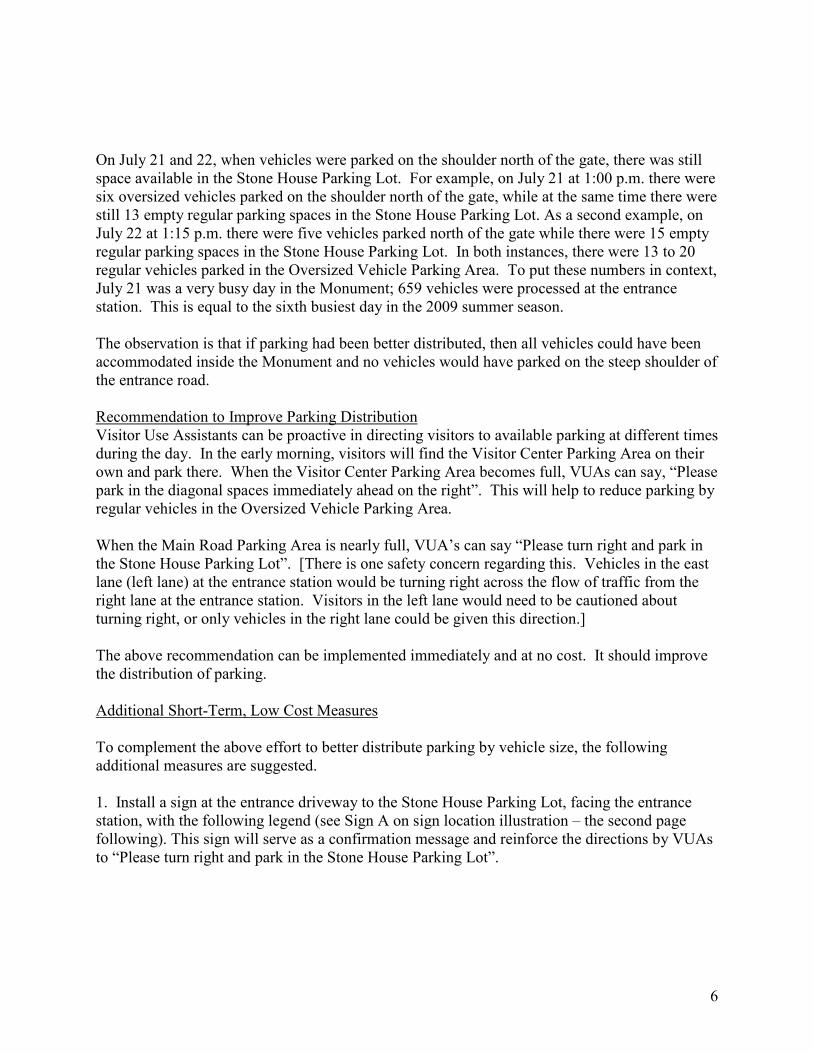
6
On July 21 and 22, when vehicles were parked on the shoulder north of the gate, there was still space available in the Stone House Parking Lot. For example, on July 21 at 1:00 p.m. there were six oversized vehicles parked on the shoulder north of the gate, while at the same time there were still 13 empty regular parking spaces in the Stone House Parking Lot. As a second example, on July 22 at 1:15 p.m. there were five vehicles parked north of the gate while there were 15 empty regular parking spaces in the Stone House Parking Lot. In both instances, there were 13 to 20 regular vehicles parked in the Oversized Vehicle Parking Area. To put these numbers in context, July 21 was a very busy day in the Monument; 659 vehicles were processed at the entrance station. This is equal to the sixth busiest day in the 2009 summer season. The observation is that if parking had been better distributed, then all vehicles could have been accommodated inside the Monument and no vehicles would have parked on the steep shoulder of the entrance road. Recommendation to Improve Parking Distribution Visitor Use Assistants can be proactive in directing visitors to available parking at different times during the day. In the early morning, visitors will find the Visitor Center Parking Area on their own and park there. When the Visitor Center Parking Area becomes full, VUAs can say, “Please park in the diagonal spaces immediately ahead on the right”. This will help to reduce parking by regular vehicles in the Oversized Vehicle Parking Area. When the Main Road Parking Area is nearly full, VUA’s can say “Please turn right and park in the Stone House Parking Lot”. [There is one safety concern regarding this. Vehicles in the east lane (left lane) at the entrance station would be turning right across the flow of traffic from the right lane at the entrance station. Visitors in the left lane would need to be cautioned about turning right, or only vehicles in the right lane could be given this direction.] The above recommendation can be implemented immediately and at no cost. It should improve the distribution of parking. Additional Short-Term, Low Cost Measures To complement the above effort to better distribute parking by vehicle size, the following additional measures are suggested. 1. Install a sign at the entrance driveway to the Stone House Parking Lot, facing the entrance station, with the following legend (see Sign A on sign location illustration – the second page following). This sign will serve as a confirmation message and reinforce the directions by VUAs to “Please turn right and park in the Stone House Parking Lot”.
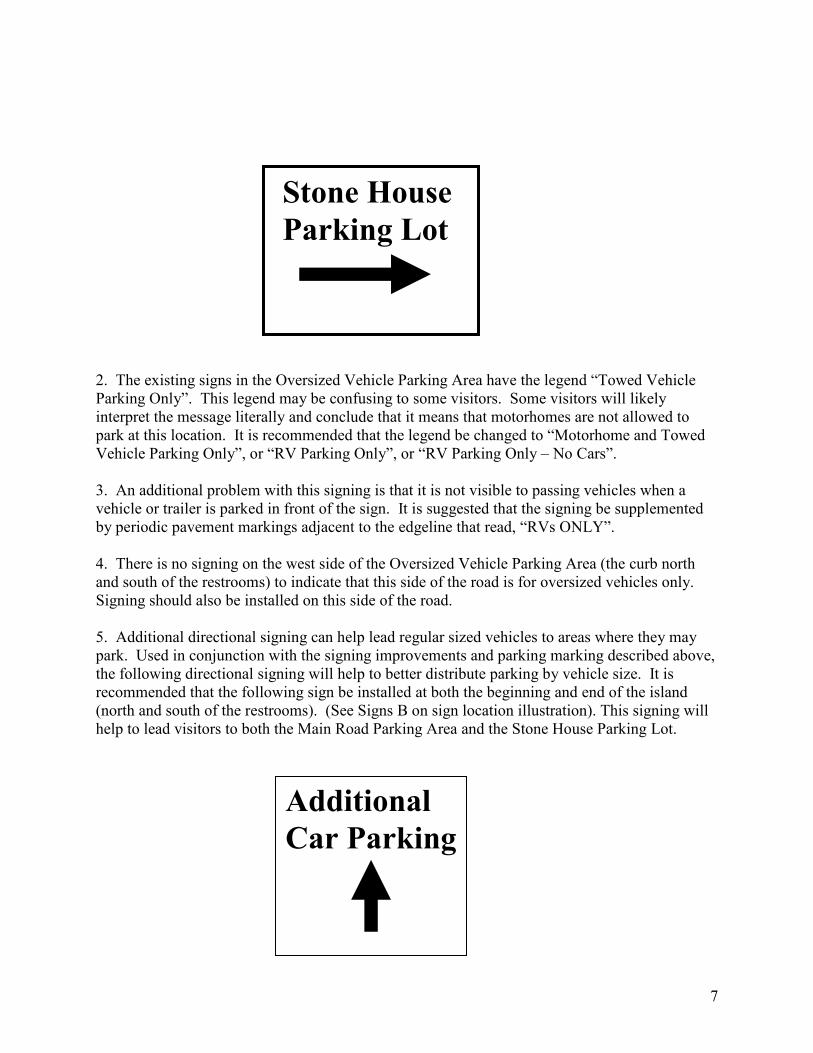
7
2. The existing signs in the Oversized Vehicle Parking Area have the legend “Towed Vehicle Parking Only”. This legend may be confusing to some visitors. Some visitors will likely interpret the message literally and conclude that it means that motorhomes are not allowed to park at this location. It is recommended that the legend be changed to “Motorhome and Towed Vehicle Parking Only”, or “RV Parking Only”, or “RV Parking Only – No Cars”. 3. An additional problem with this signing is that it is not visible to passing vehicles when a vehicle or trailer is parked in front of the sign. It is suggested that the signing be supplemented by periodic pavement markings adjacent to the edgeline that read, “RVs ONLY”. 4. There is no signing on the west side of the Oversized Vehicle Parking Area (the curb north and south of the restrooms) to indicate that this side of the road is for oversized vehicles only. Signing should also be installed on this side of the road. 5. Additional directional signing can help lead regular sized vehicles to areas where they may park. Used in conjunction with the signing improvements and parking marking described above, the following directional signing will help to better distribute parking by vehicle size. It is recommended that the following sign be installed at both the beginning and end of the island (north and south of the restrooms). (See Signs B on sign location illustration). This signing will help to lead visitors to both the Main Road Parking Area and the Stone House Parking Lot.
Stone House
Parking Lot
Additional
Car Parking
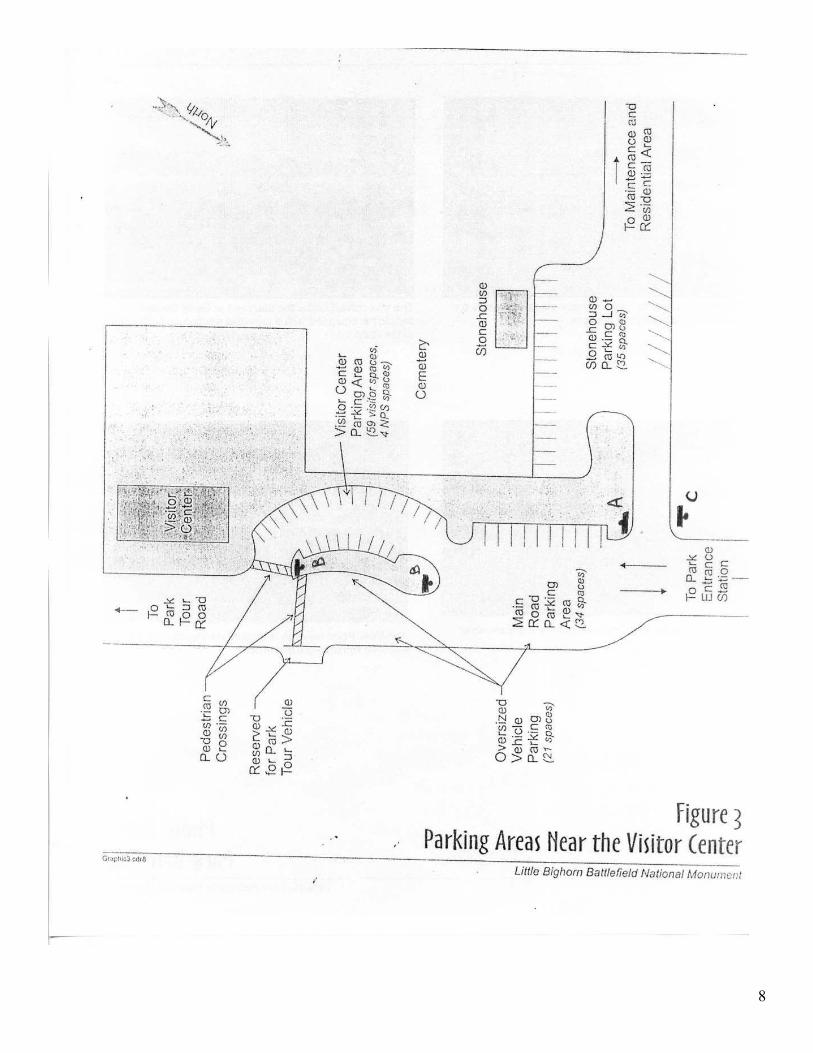
8
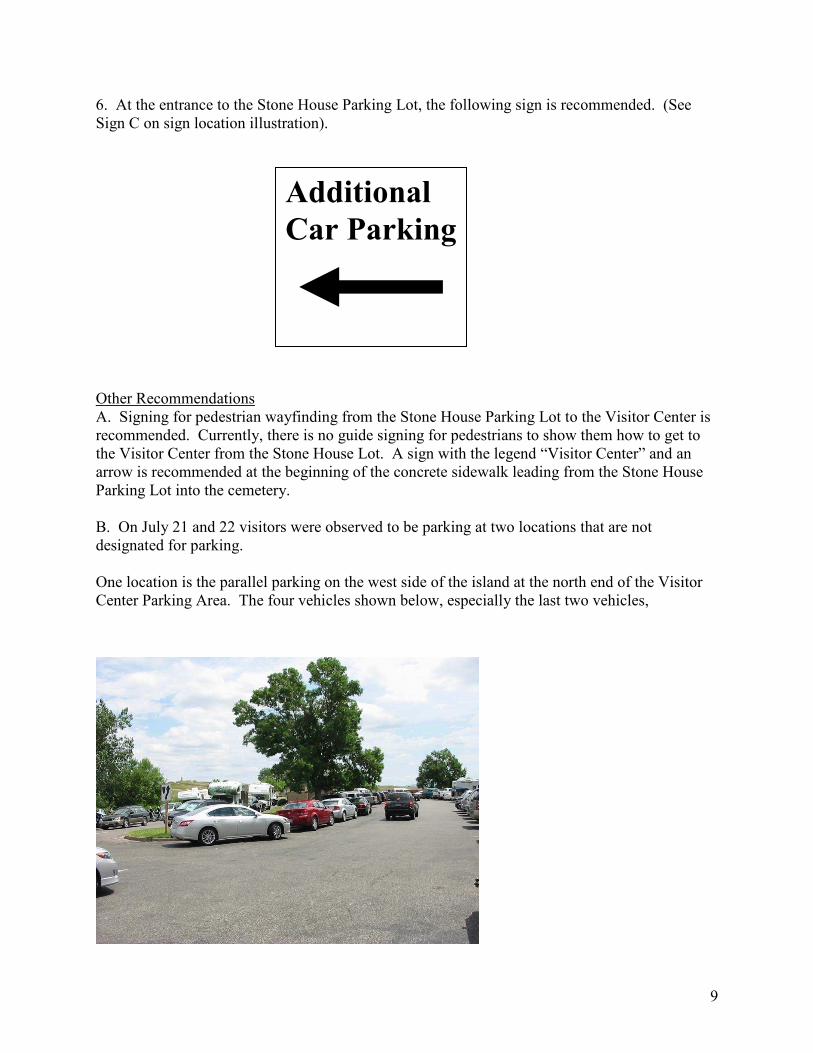
9
6. At the entrance to the Stone House Parking Lot, the following sign is recommended. (See Sign C on sign location illustration). Other Recommendations A. Signing for pedestrian wayfinding from the Stone House Parking Lot to the Visitor Center is recommended. Currently, there is no guide signing for pedestrians to show them how to get to the Visitor Center from the Stone House Lot. A sign with the legend “Visitor Center” and an arrow is recommended at the beginning of the concrete sidewalk leading from the Stone House Parking Lot into the cemetery. B. On July 21 and 22 visitors were observed to be parking at two locations that are not designated for parking. One location is the parallel parking on the west side of the island at the north end of the Visitor Center Parking Area. The four vehicles shown below, especially the last two vehicles,
Additional
Car Parking
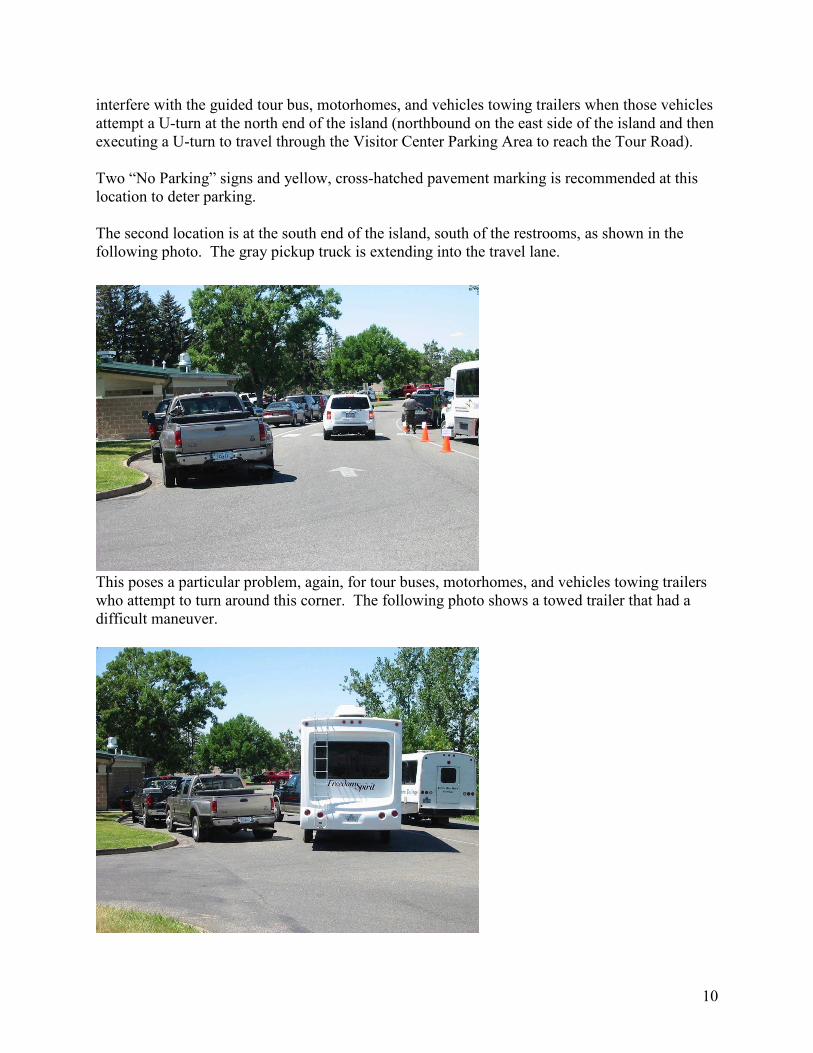
10
interfere with the guided tour bus, motorhomes, and vehicles towing trailers when those vehicles attempt a U-turn at the north end of the island (northbound on the east side of the island and then executing a U-turn to travel through the Visitor Center Parking Area to reach the Tour Road). Two “No Parking” signs and yellow, cross-hatched pavement marking is recommended at this location to deter parking. The second location is at the south end of the island, south of the restrooms, as shown in the following photo. The gray pickup truck is extending into the travel lane.
This poses a particular problem, again, for tour buses, motorhomes, and vehicles towing trailers who attempt to turn around this corner. The following photo shows a towed trailer that had a difficult maneuver.
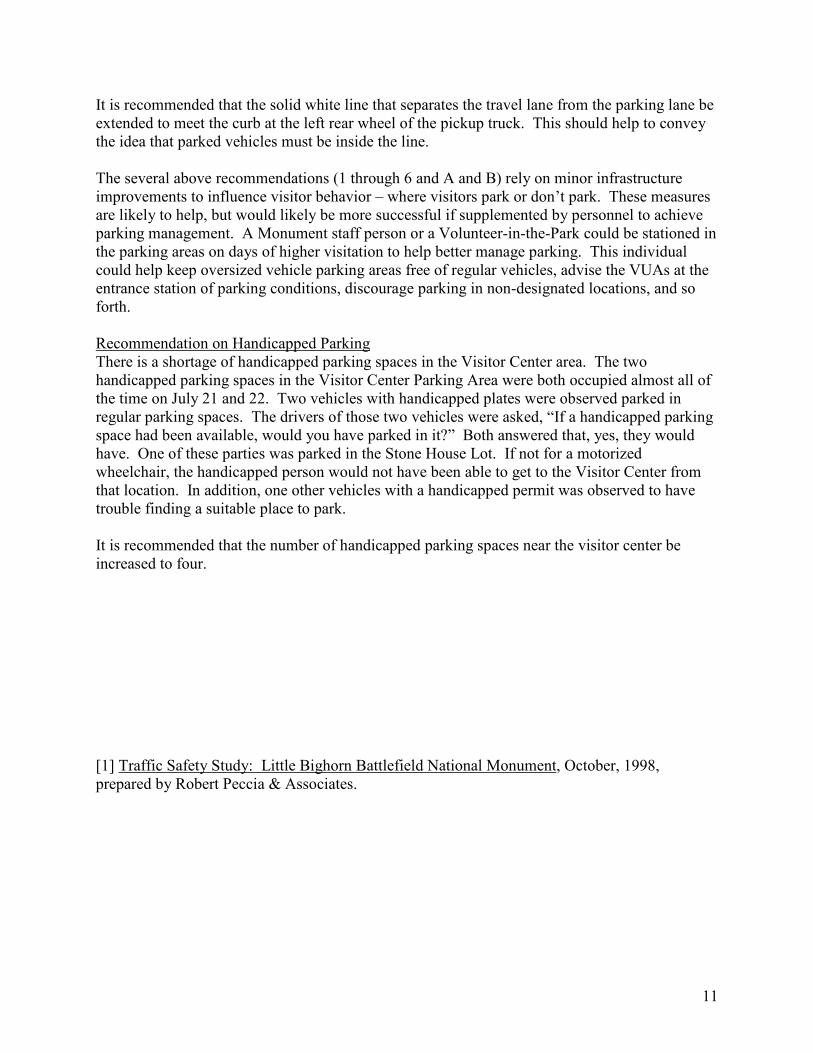
11
It is recommended that the solid white line that separates the travel lane from the parking lane be extended to meet the curb at the left rear wheel of the pickup truck. This should help to convey the idea that parked vehicles must be inside the line. The several above recommendations (1 through 6 and A and B) rely on minor infrastructure improvements to influence visitor behavior – where visitors park or don’t park. These measures are likely to help, but would likely be more successful if supplemented by personnel to achieve parking management. A Monument staff person or a Volunteer-in-the-Park could be stationed in the parking areas on days of higher visitation to help better manage parking. This individual could help keep oversized vehicle parking areas free of regular vehicles, advise the VUAs at the entrance station of parking conditions, discourage parking in non-designated locations, and so forth. Recommendation on Handicapped Parking There is a shortage of handicapped parking spaces in the Visitor Center area. The two handicapped parking spaces in the Visitor Center Parking Area were both occupied almost all of the time on July 21 and 22. Two vehicles with handicapped plates were observed parked in regular parking spaces. The drivers of those two vehicles were asked, “If a handicapped parking space had been available, would you have parked in it?” Both answered that, yes, they would have. One of these parties was parked in the Stone House Lot. If not for a motorized wheelchair, the handicapped person would not have been able to get to the Visitor Center from that location. In addition, one other vehicles with a handicapped permit was observed to have trouble finding a suitable place to park. It is recommended that the number of handicapped parking spaces near the visitor center be increased to four. [1] Traffic Safety Study: Little Bighorn Battlefield National Monument, October, 1998, prepared by Robert Peccia & Associates.