existing setting - city of oakland
TRANSCRIPT
West Oakland Specific Plan – Draft EIR Page 4.10-1
4.10 Transportation & Circulation
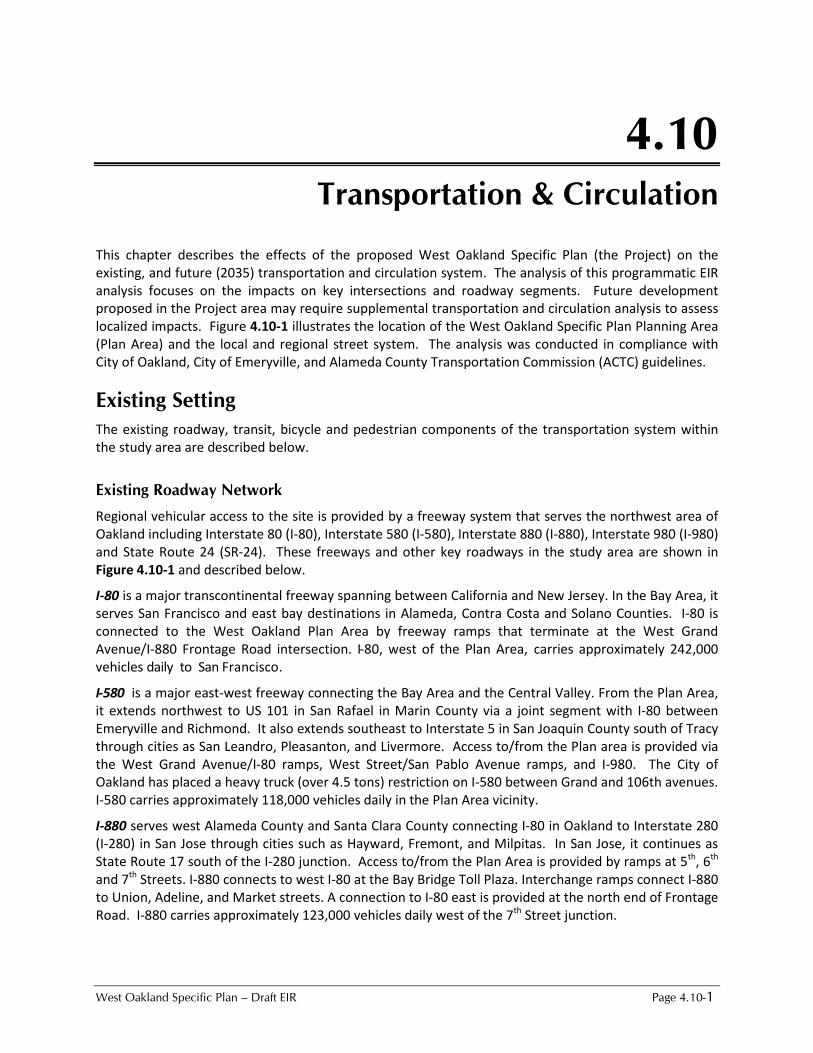
This chapter describes the effects of the proposed West Oakland Specific Plan (the Project) on the existing, and future (2035) transportation and circulation system. The analysis of this programmatic EIR analysis focuses on the impacts on key intersections and roadway segments. Future development proposed in the Project area may require supplemental transportation and circulation analysis to assess localized impacts. Figure 4.10-1 illustrates the location of the West Oakland Specific Plan Planning Area (Plan Area) and the local and regional street system. The analysis was conducted in compliance with City of Oakland, City of Emeryville, and Alameda County Transportation Commission (ACTC) guidelines.
Existing Setting The existing roadway, transit, bicycle and pedestrian components of the transportation system within the study area are described below.
Existing Roadway Network
Regional vehicular access to the site is provided by a freeway system that serves the northwest area of Oakland including Interstate 80 (I-80), Interstate 580 (I-580), Interstate 880 (I-880), Interstate 980 (I-980) and State Route 24 (SR-24). These freeways and other key roadways in the study area are shown in Figure 4.10-1 and described below.
I-80 is a major transcontinental freeway spanning between California and New Jersey. In the Bay Area, it serves San Francisco and east bay destinations in Alameda, Contra Costa and Solano Counties. I-80 is connected to the West Oakland Plan Area by freeway ramps that terminate at the West Grand Avenue/I-880 Frontage Road intersection. I-80, west of the Plan Area, carries approximately 242,000 vehicles daily to San Francisco.
I-580 is a major east-west freeway connecting the Bay Area and the Central Valley. From the Plan Area, it extends northwest to US 101 in San Rafael in Marin County via a joint segment with I-80 between Emeryville and Richmond. It also extends southeast to Interstate 5 in San Joaquin County south of Tracy through cities as San Leandro, Pleasanton, and Livermore. Access to/from the Plan area is provided via the West Grand Avenue/I-80 ramps, West Street/San Pablo Avenue ramps, and I-980. The City of Oakland has placed a heavy truck (over 4.5 tons) restriction on I-580 between Grand and 106th avenues. I-580 carries approximately 118,000 vehicles daily in the Plan Area vicinity.
I-880 serves west Alameda County and Santa Clara County connecting I-80 in Oakland to Interstate 280 (I-280) in San Jose through cities such as Hayward, Fremont, and Milpitas. In San Jose, it continues as State Route 17 south of the I-280 junction. Access to/from the Plan Area is provided by ramps at 5th, 6th and 7th Streets. I-880 connects to west I-80 at the Bay Bridge Toll Plaza. Interchange ramps connect I-880 to Union, Adeline, and Market streets. A connection to I-80 east is provided at the north end of Frontage Road. I-880 carries approximately 123,000 vehicles daily west of the 7th Street junction.
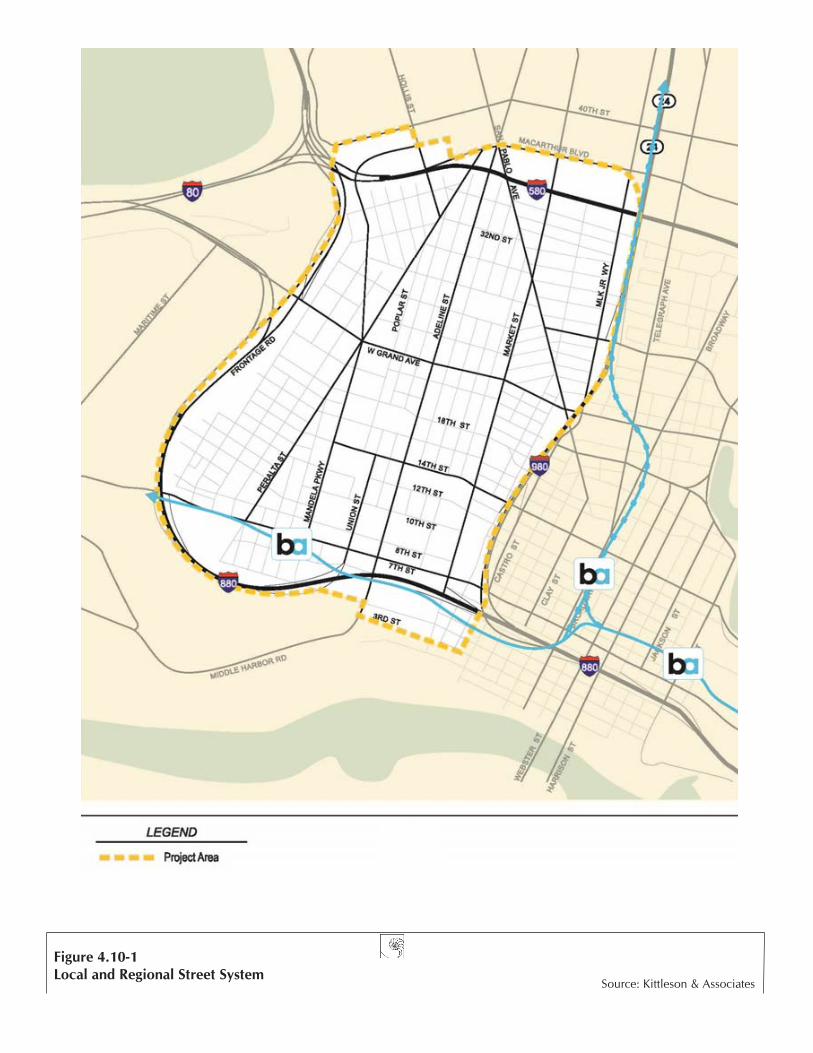
Figure 4.10-1Local and Regional Street System
Source: Kittleson & Associates
CHAPTER 4.11: TRANSPORTATION, CIRCULATION AND PARKING
PAGE 4.11-6 WEST OAKLAND SPECIFIC PLAN – DRAFT EIR
28th Streets as Neighborhood Routes. The Master Plan provides the following descriptions about these types of routes:
Chapter 4.10: Transportation, Circulation and Parking
West Oakland Specific Plan – Draft EIR Page 4.10-3
I-980 runs between I-580 and I-880 to the immediate east of the Plan Area. North of I-580, it continues as State Route 24 to Contra Costa County via Caldecott Tunnel. I-980 carries approximately 113,000 vehicles daily just south of I-580.
SR-24 is an eight-lane freeway that connects the East Bay area with central and east Contra Costa County. SR-24 extends from -I980 to I-680 through the Caldecott tunnel and carries approximately 150,000 vehicles daily just west of the Caldecott Tunnel.
7th Street is a four-lane east-west roadway between Parkview Park to the west and Fallon Street in downtown Oakland to the east. East of Fallon Street, it continues as 8th Street. 7th Street operates in a one-way eastbound direction east of Martin Luther King Jr Way and serves local and cross-town traffic for Plan Area traffic. It also provides freeway access to I-880 south.
West Grand Avenue provides access to I-80 to/from the Plan Area. It spans between the I-80 junction/ Maritime Street and Broadway in downtown Oakland, where it continues as Grand Avenue eastward. West Grand Avenue has two travel lanes on each direction with the exception of the segment between Mandela Parkway and Market Street, which has three lanes per direction.
Frontage Road extends between West Grand Avenue and 7th Street along I-880 and serves as the western boundary of the Plan Area. The four-lane, north-south roadway provides access from the Plan area to/from I-80 and I-880.
Mandela Parkway spans between 3rd Street and Hollis Street providing access to Emeryville to the north. It has two travel lanes on each direction between 7th Street and Hollis Street and one lane per direction south of 7th Street. Between 8th and 32nd Streets, a landscaped linear park serves as a wide median island along Mandela Parkway.
Adeline Avenue extends from Shattuck Avenue in Berkeley south through the middle of the Plan area to continue as Middle Harbor Road south of 3rd Street. In the Plan Area, it has two travel lanes per direction.
Market Street is a north-south roadway that spans between Alcatraz Avenue in Berkeley and just south of 1st Street in the Port of Oakland. Landscaped median is provided south of 19th Street and painted median is provided along most of the segment north of Mead Avenue.
Existing Transit Service
Transit service in the Plan Area is provided by Alameda-Contra Costa Transit District (AC Transit) and Bay Area Rapid Transit (BART). These services are described in this section.
AC Transit
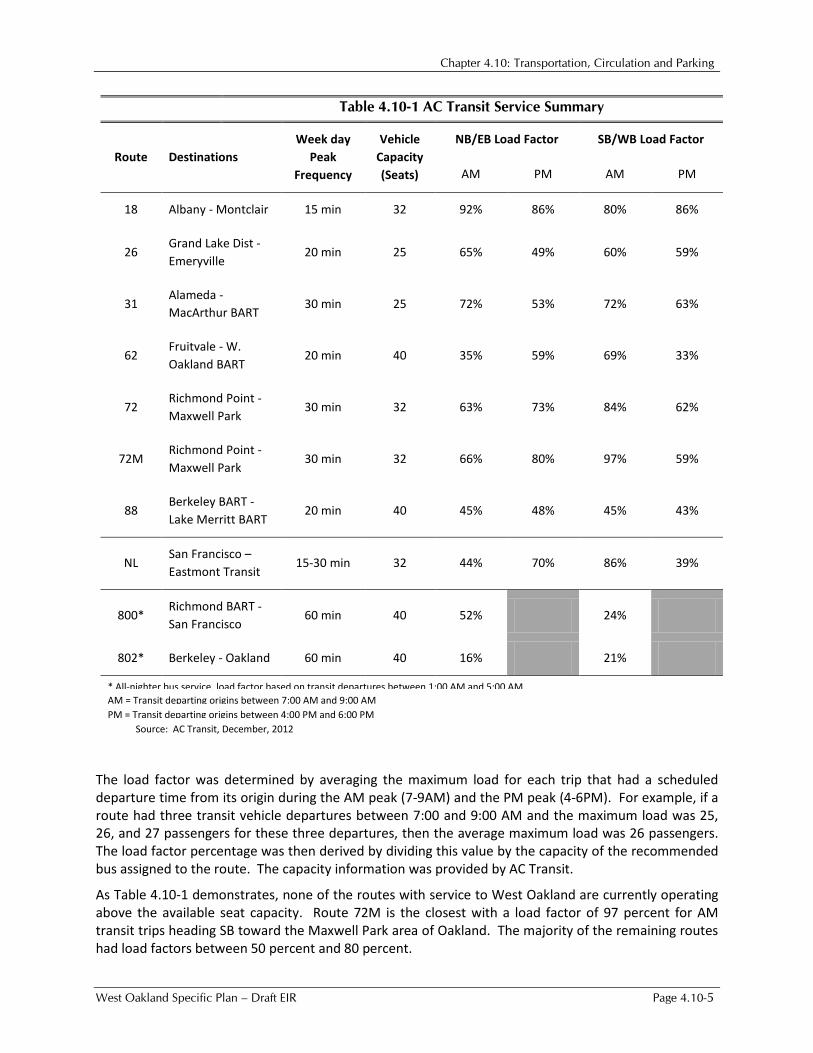
AC Transit provides an extensive network of fixed route bus services in Alameda and Contra Costa counties. It also offers Transbay service to destinations in San Francisco, San Mateo and north Santa Clara counties. For the West Oakland area, AC Transit service is comprised of ten transit routes. Seven of these routes are local bus routes, one is an express service to San Francisco, and the final two routes are All-Nighters that operate between about 12:00 AM and 6:00 AM. Figure 4.10-2 illustrates the AC Transit routes in the Plan Area and Table 4.10-1 shows the details of each of these routes including their destinations, capacity, and load factor in both directions during both the AM and PM peak period.
Figure 4.10-2Existing AC Transit Routes
Source: Kittleson & Associates
1
SUPP
ORT
ING
TH
E PL
AN
8
8-26 • PUBLIC DRAFT REVIEW - JANUARY 2014
Fig. 8.2.2: Existing AC Transit Route Map
Bay Bridge
NL
NL31
31
26
26
31
26
26 800 6288
88
18
802
7272M
72R
8000
0X
SSB
W26 31 62
800
B E NX NX1 NX2NX3
NXC
P V
314
314
NX4
West Oakland Station
19th Street Station
12th Street Station
MacArthur Station
Downtown Oakland
Emeryville
Former OaklandArmy Base
Port of Oakland
Mar
ket S
treet
San Pablo Avenue
Mar
tin Lu
ther
Kin
g Jr.
Way
West Grand Avenue
28th Street
32nd Street
14th Street
7th Street
Hollis Street
Adel
ine
Stre
et
Man
dela
Par
kway
Pine S
t
Pera
lta St
reet
Legend
Planning AreaBART
AC TransitCommute-Hour ServiceDaytimeDay & Evening
Dashed Route (lower service)All NighterOther Operating HoursTransbay Service
00 0000
XX X0000
3rd Street
Bay Bridge/Interstate 80
Interstate 880
Interstate 580
Interstate 880
Inte
rsta
te 9
80400020001000
FEET N
16th Street Station
MainPost Office
Chapter 4.10: Transportation, Circulation and Parking
West Oakland Specific Plan – Draft EIR Page 4.10-5
Table 4.10-1 AC Transit Service Summary
Route Destinations Week day
Peak Frequency
Vehicle Capacity (Seats)
NB/EB Load Factor SB/WB Load Factor
AM PM AM PM
18 Albany - Montclair 15 min 32 92% 86% 80% 86%
26 Grand Lake Dist - Emeryville
20 min 25 65% 49% 60% 59%
31 Alameda - MacArthur BART
30 min 25 72% 53% 72% 63%
62 Fruitvale - W. Oakland BART
20 min 40 35% 59% 69% 33%
72 Richmond Point - Maxwell Park
30 min 32 63% 73% 84% 62%
72M Richmond Point - Maxwell Park
30 min 32 66% 80% 97% 59%
88 Berkeley BART - Lake Merritt BART
20 min 40 45% 48% 45% 43%
NL San Francisco – Eastmont Transit
15-30 min 32 44% 70% 86% 39%
800* Richmond BART - San Francisco
60 min 40 52% 24%
802* Berkeley - Oakland 60 min 40 16% 21%
* All-nighter bus service, load factor based on transit departures between 1:00 AM and 5:00 AM AM = Transit departing origins between 7:00 AM and 9:00 AM PM = Transit departing origins between 4:00 PM and 6:00 PM Source: AC Transit, December, 2012
The load factor was determined by averaging the maximum load for each trip that had a scheduled departure time from its origin during the AM peak (7-9AM) and the PM peak (4-6PM). For example, if a route had three transit vehicle departures between 7:00 and 9:00 AM and the maximum load was 25, 26, and 27 passengers for these three departures, then the average maximum load was 26 passengers. The load factor percentage was then derived by dividing this value by the capacity of the recommended bus assigned to the route. The capacity information was provided by AC Transit.
As Table 4.10-1 demonstrates, none of the routes with service to West Oakland are currently operating above the available seat capacity. Route 72M is the closest with a load factor of 97 percent for AM transit trips heading SB toward the Maxwell Park area of Oakland. The majority of the remaining routes had load factors between 50 percent and 80 percent.
Chapter 4.10: Transportation, Circulation and Parking
Page 4.10-6 West Oakland Specific Plan – Draft EIR
BART
BART provides the West Oakland area with direct rail transit link to San Francisco and San Mateo counties and the metropolitan areas of Alameda and Contra Costa counties from West Oakland BART station located at the intersection of Mandela Parkway and 7th Street. Weekday service is provided from 4:00 AM to 1:00 AM, while Saturday and Sunday service is provided from 6:00 AM to 1:00 AM, and 8:00 AM to 1:00 AM, respectively. Trains have a typical headway of 15 minutes on weekdays and 20 minutes on Saturday and Sundays.
Existing Pedestrian Network
The City of Oakland’s Pedestrian Master Plan, adopted in 2002 as a part of the Land Use & Transportation Element of the Oakland General Plan, designates Mandela Parkway, Market Street, and 7th, 8th and 14th Streets in the Plan Area as City Routes, Adeline Avenue and West Street as District Routes, and Wood Street, Campbell Street and 14th (between Wood Street and Campbell Street), 18th, and 28th Streets as Neighborhood Routes. The Master Plan provides the following descriptions about these types of routes:
“City routes designate streets that are destinations in themselves – places to live, work, shop, socialize and travel. They provide the most direct connections between walking and transit and connect multiple districts in the City.”
“District routes have a more local function as the location of schools, community centers, and smaller scale shopping. They are often located within a single district and help to define the character of that district.”
“Neighborhood routes are local streets that connect schools, parks, recreational centers, and libraries. They are places for people to meet and they provide the basis for neighborhood life. They are used for walking to school, walking for exercise, and safe walking at night.”
Existing Bicycle Network
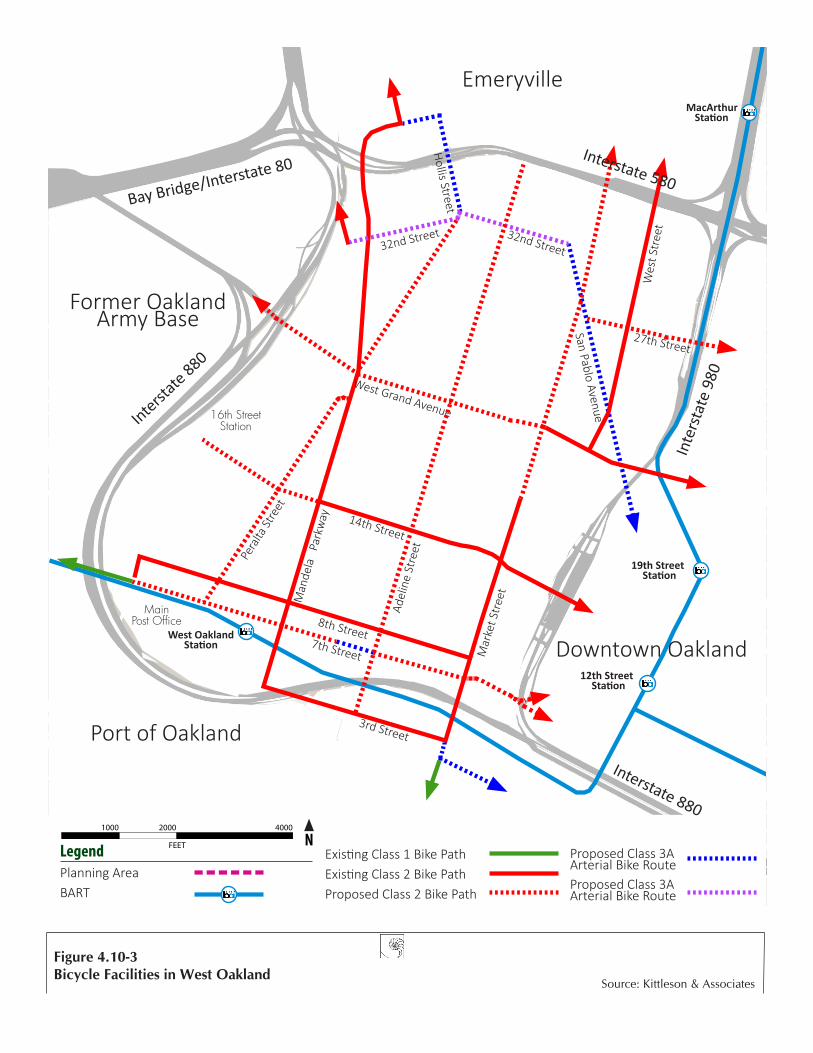
The City of Oakland adopted a Bicycle Master Plan in 2007 as a part of the Land Use & Transportation Element of the Oakland General Plan. The Plan set forth an implementation program to improve bicycle connectivity and facilities in Oakland. Since its adoption, the City has installed 18.5 miles of new bikeways (through 2011) and has upgraded another 18.7 miles of facilities. In the Project vicinity, bike lanes (Class 2) are provided on Mandela Parkway, Market Street, 3rd Street, 8th Street, and the portion of 14th Street west of Mandela Parkway. A bike path (Class 1) was installed on 7th Street east of Wood Street. Additional facilities are proposed in West Oakland as shown in Figure 4.10-3.
WEST OAKLAND SPECIFIC PLAN
SUPP
ORT
ING
TH
E PL
AN
8Fig. 8.1.3: Existing & Proposed Bikeway Network
Bay Bridge
West Oakland Station
19th Street Station
12th Street Station
MacArthur Station
Emeryville
Former OaklandArmy Base
LegendPlanning Area BART
Existing Class 1 Bike Path Existing Class 2 Bike Path Proposed Class 2 Bike Path
Port of Oakland
Downtown OaklandMar
ket S
tree
t
San Pablo Avenue
West Grand Avenue
32nd Street
14th Street
7th Street
Hollis Street
Adel
ine
Stre
et
Man
dela
Pa
rkw
ay
Pera
lta St
reet
27th Street
8th StreetW
est S
tree
t
32nd Street
Proposed Class 3A Arterial Bike Route
Proposed Class 3A Arterial Bike Route
3rd Street
Bay Bridge/Interstate 80
Interstate 880
Interstate 580
Interstate 880
Inte
rsta
te 9
80
400020001000
FEET N
16th Street Station
MainPost Office
Figure 4.10-3Bicycle Facilities in West Oakland
Source: Kittleson & Associates
Chapter 4.10: Transportation, Circulation and Parking
Page 4.10-8 West Oakland Specific Plan – Draft EIR
The Master Plan provides the following descriptions about three types of bikeways:
“Bicycle Paths (Class 1) provide for bicycle travel on a paved right-of-way that is completely separated from the street.”
“Bicycle Lanes (Class 2) are striped lanes on streets, designated with specific signage and stencils, for the use of bicyclists.”
“Bicycle Routes (Class 3) designate preferred streets for bicycle travel using lanes shared with motor vehicles.” Arterial Bicycle Routes (Class 3A), Bicycle Boulevards (Class 3B) and Neighborhood Connectors are variations of standard bicycle routes that address issues commonly associated with bicycle routes in Oakland.
Study Locations
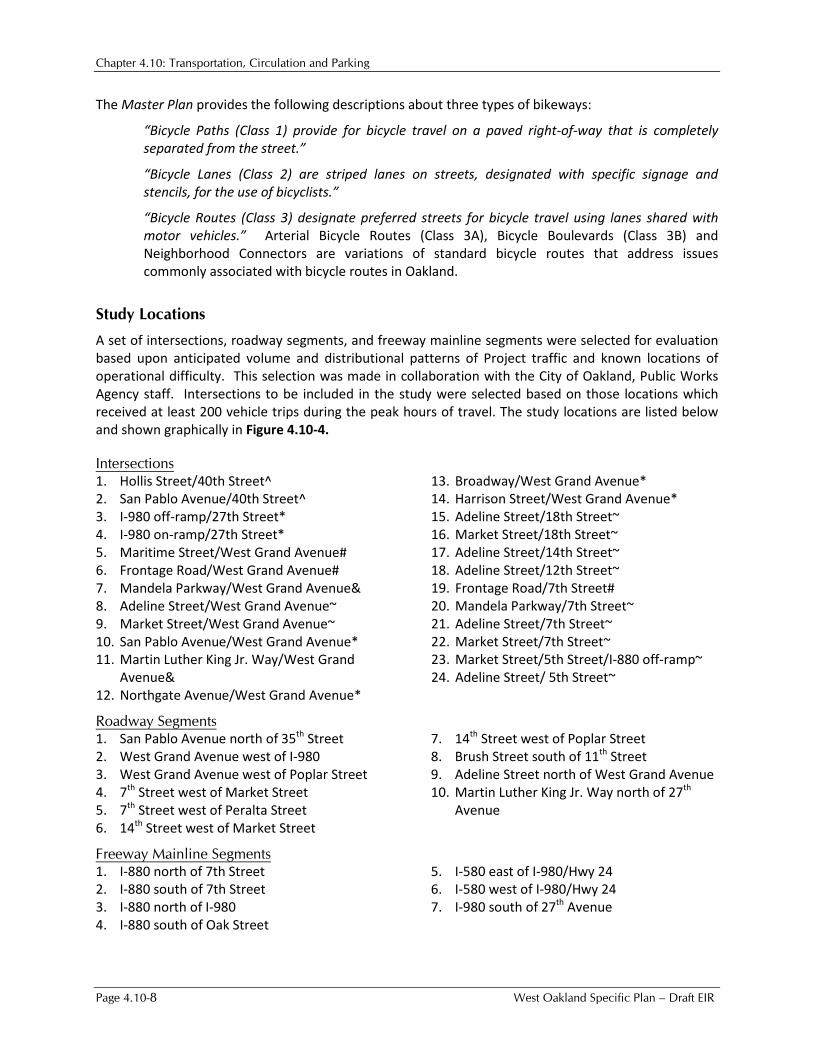
A set of intersections, roadway segments, and freeway mainline segments were selected for evaluation based upon anticipated volume and distributional patterns of Project traffic and known locations of operational difficulty. This selection was made in collaboration with the City of Oakland, Public Works Agency staff. Intersections to be included in the study were selected based on those locations which received at least 200 vehicle trips during the peak hours of travel. The study locations are listed below and shown graphically in Figure 4.10-4.
Intersections 1. Hollis Street/40th Street^ 2. San Pablo Avenue/40th Street^ 3. I-980 off-ramp/27th Street* 4. I-980 on-ramp/27th Street* 5. Maritime Street/West Grand Avenue# 6. Frontage Road/West Grand Avenue# 7. Mandela Parkway/West Grand Avenue& 8. Adeline Street/West Grand Avenue~ 9. Market Street/West Grand Avenue~ 10. San Pablo Avenue/West Grand Avenue* 11. Martin Luther King Jr. Way/West Grand
Avenue& 12. Northgate Avenue/West Grand Avenue*
13. Broadway/West Grand Avenue* 14. Harrison Street/West Grand Avenue* 15. Adeline Street/18th Street~ 16. Market Street/18th Street~ 17. Adeline Street/14th Street~ 18. Adeline Street/12th Street~ 19. Frontage Road/7th Street# 20. Mandela Parkway/7th Street~ 21. Adeline Street/7th Street~ 22. Market Street/7th Street~ 23. Market Street/5th Street/I-880 off-ramp~ 24. Adeline Street/ 5th Street~
Roadway Segments 1. San Pablo Avenue north of 35th Street 2. West Grand Avenue west of I-980 3. West Grand Avenue west of Poplar Street 4. 7th Street west of Market Street 5. 7th Street west of Peralta Street 6. 14th Street west of Market Street
7. 14th Street west of Poplar Street 8. Brush Street south of 11th Street 9. Adeline Street north of West Grand Avenue 10. Martin Luther King Jr. Way north of 27th
Avenue
Freeway Mainline Segments 1. I-880 north of 7th Street 2. I-880 south of 7th Street 3. I-880 north of I-980 4. I-880 south of Oak Street
5. I-580 east of I-980/Hwy 24 6. I-580 west of I-980/Hwy 24 7. I-980 south of 27th Avenue
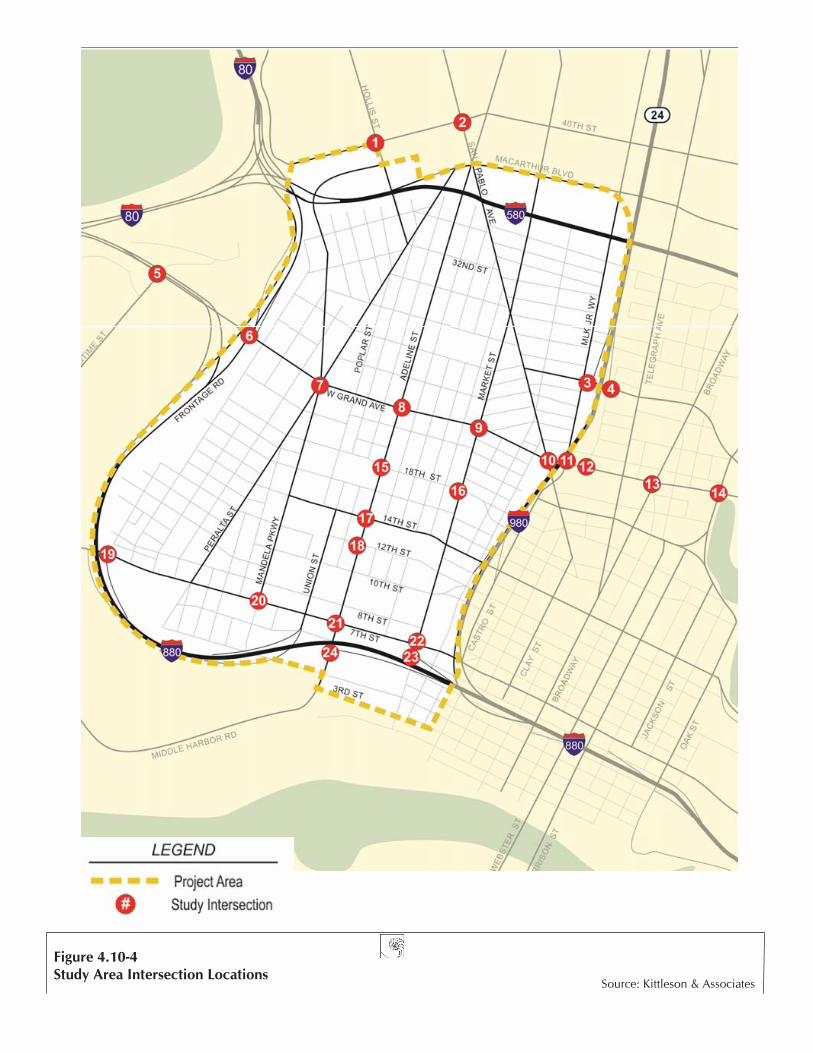
Figure 4.10-4Study Area Intersection Locations
Source: Kittleson & Associates
CHAPTER 4.11: TRANSPORTATION, CIRCULATION AND PARKING
PAGE 4.11-10 WEST OAKLAND SPECIFIC PLAN – DRAFT EIR
Figure 4.11-6 Intersection Peak Hour Volumes – Existing Conditions

Chapter 4.10: Transportation, Circulation and Parking
West Oakland Specific Plan – Draft EIR Page 4.10-10
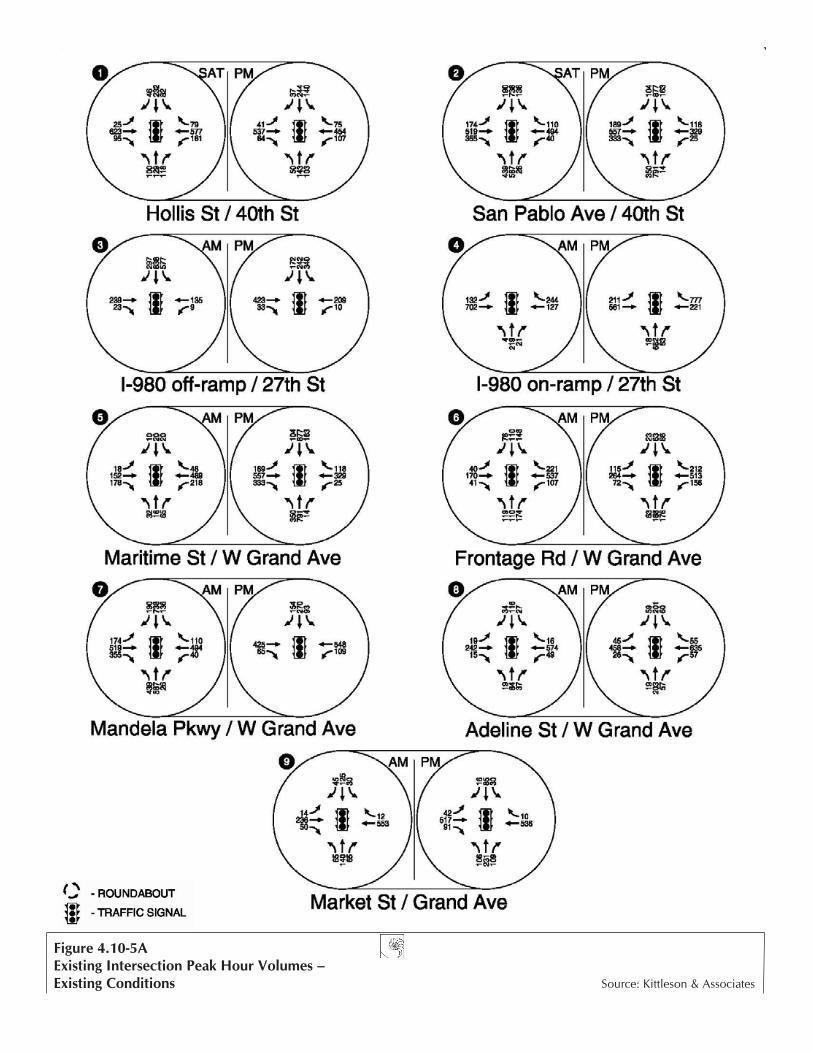
Existing Traffic Volumes
Recent peak hour vehicle turning movement volumes, dated between 2008 and 2011, were compiled from a number of sources for the study intersections. Where available, pedestrian and bicycle volumes were also obtained. The data were collected during weekday morning (AM) and afternoon (PM) peak periods with the exception of the two intersections located Emeryville where, instead of AM peak hour data, Saturday (SAT) peak period data were obtained as required for analysis by the City of Emeryville. New vehicle and bicycle turning movement and pedestrian counts were collected during AM (7 am to 9 am) and PM (4 pm to 6 pm) peak periods in November 2012 at locations where recent data are not available. The sources of the counts are denoted by various symbols in the intersection list above:
“*” 2008 counts compiled from Emerald View Draft Environmental Impact Report
“#” 2011 counts compiled from Oakland Army Base Draft Environmental Impact Report
“&” 2011 counts compiled from Peralta/Martin Luther King Jr Streetscape Master Plan
“~” New 2012 counts
“^” 2010 counts obtained from City of Emeryville website
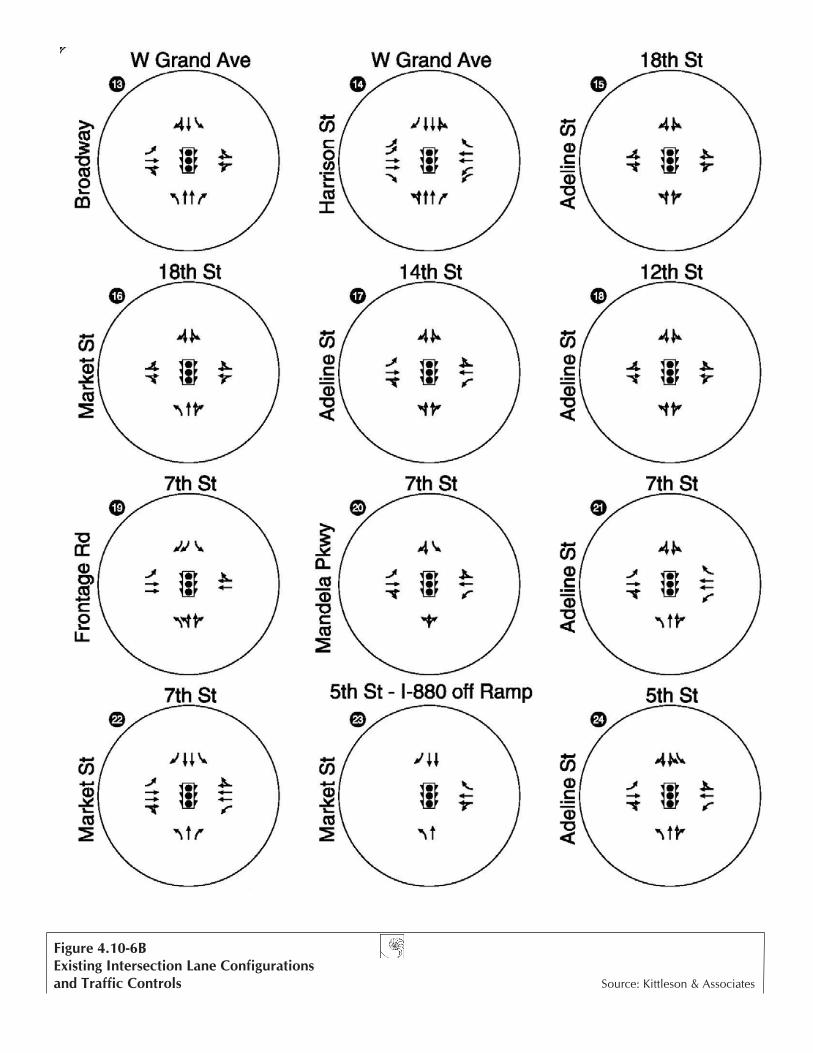
Figure 4.10-5A, B and C shows the intersection vehicle turning movement volumes, and Figure 4.10-6A and B shows the intersection lane configurations and traffic controls. Appendix 4.10-A provides the detailed traffic count data sheets for new counts collected in 2012.
Roadway segment volumes were primarily derived from intersection turning movement volumes of adjacent intersections. A 24-hour machine count was conducted on Adeline Street south of 32nd Street to supplement intersection data. The freeway segment volumes were obtained during November and December 2012 using Caltrans’ Performance Measurement System (PeMS). The roadway and freeway segment volumes at the study locations are shown with the level of service summaries in the respective sections below.
Analysis Methodologies and Level of Service Standards
“Levels of service” describe the operating conditions experienced by motorists. Level of service is a qualitative measure of the effect of a number of factors, including speed and travel time, traffic interruptions, freedom to maneuver, driving comfort and convenience. Levels of service are designated "A" through "F" from best to worst, which cover the entire range of traffic operations that might occur. Level of Service (LOS) "A" through "E" generally represents traffic volumes at less than roadway capacity, while LOS "F" represents over capacity and/or forced flow conditions.
Signalized Intersections
Signalized intersection analyses were conducted using the operational methodology outlined in the Highway Capacity Manual (Transportation Research Board, Washington, D.C., 2000, Chapters 10 and 16). It was conducted using the Synchro analysis software tool as required by the City. The HCM procedure calculates an average stopped delay per vehicle at a signalized intersection, and assigns a level of service designation based upon the delay. Delay is a complex measure and is dependent upon a number of variables, including the number of vehicles in the traffic stream. It is also dependent on the quality of signal progression, the signal cycle length, and the “green” ratio for each approach or lane group. Table 4.10-2 provides descriptions of the level of service and the corresponding ranges of delays for signalized intersections.
CHAPTER 4.11: TRANSPORTATION, CIRCULATION AND PARKING
WEST OAKLAND SPECIFIC PLAN – DRAFT EIR PAGE 4.11-11
Figure 4.10-5AExisting Intersection Peak Hour Volumes – Existing Conditions Source: Kittleson & Associates

Figure 4.10-5BExisting Intersection Peak Hour Volumes – Existing Conditions Source: Kittleson & Associates
CHAPTER 4.11: TRANSPORTATION, CIRCULATION AND PARKING
PAGE 4.11-12 WEST OAKLAND SPECIFIC PLAN – DRAFT EIR

CHAPTER 4.11: TRANSPORTATION, CIRCULATION AND PARKING
WEST OAKLAND SPECIFIC PLAN – DRAFT EIR PAGE 4.11-13
Figure 4.10-5CExisting Intersection Peak Hour Volumes – Existing Conditions Source: Kittleson & Associates

CHAPTER 4.11: TRANSPORTATION, CIRCULATION AND PARKING
PAGE 4.11-14 WEST OAKLAND SPECIFIC PLAN – DRAFT EIR
Figure 4.11-7 Intersection Lane Geometries & Traffic Controls – Existing Conditions
Figure 4.10-6AExisting Intersection Lane Configurations and Traffic Controls Source: Kittleson & Associates
CHAPTER 4.11: TRANSPORTATION, CIRCULATION AND PARKING
WEST OAKLAND SPECIFIC PLAN – DRAFT EIR PAGE 4.11-15
Figure 4.10-6BExisting Intersection Lane Configurations and Traffic Controls Source: Kittleson & Associates
Chapter 4.10: Transportation, Circulation and Parking
West Oakland Specific Plan – Draft EIR Page 4.10-16
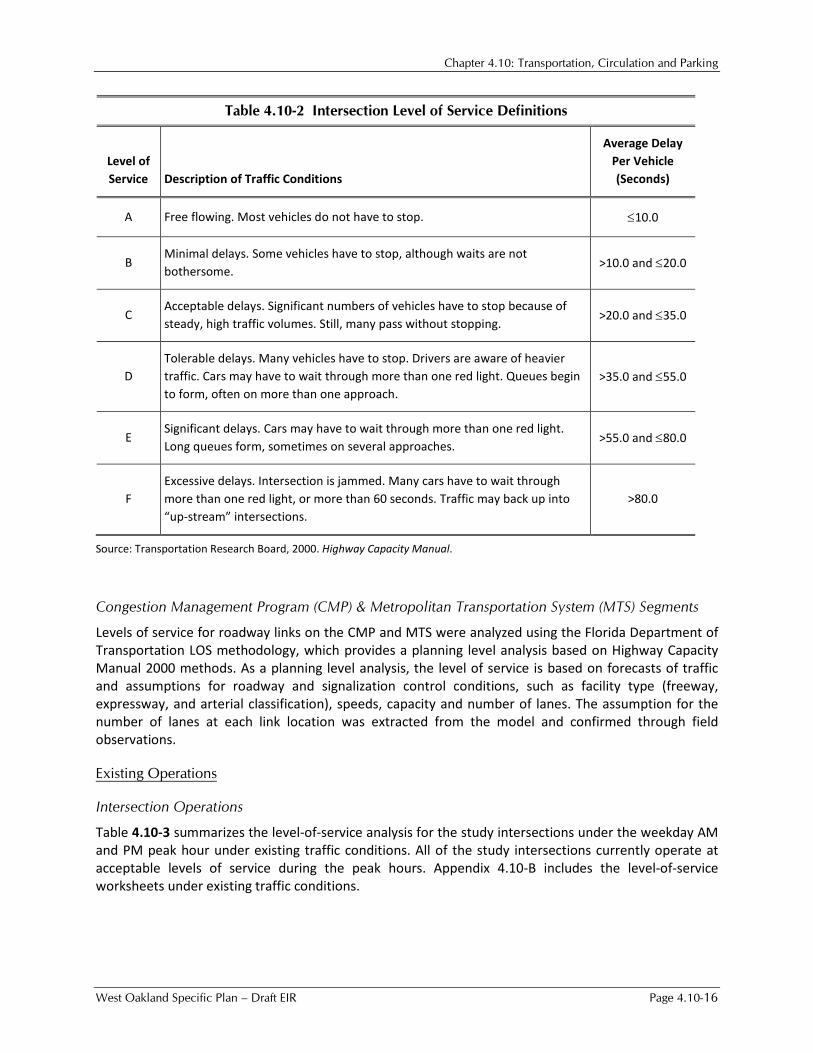
Table 4.10-2 Intersection Level of Service Definitions
Level of Service Description of Traffic Conditions
Average Delay Per Vehicle (Seconds)
A Free flowing. Most vehicles do not have to stop. ≤10.0
B Minimal delays. Some vehicles have to stop, although waits are not bothersome.
>10.0 and ≤20.0
C Acceptable delays. Significant numbers of vehicles have to stop because of steady, high traffic volumes. Still, many pass without stopping.
>20.0 and ≤35.0
D Tolerable delays. Many vehicles have to stop. Drivers are aware of heavier traffic. Cars may have to wait through more than one red light. Queues begin to form, often on more than one approach.
>35.0 and ≤55.0
E Significant delays. Cars may have to wait through more than one red light. Long queues form, sometimes on several approaches.
>55.0 and ≤80.0
F Excessive delays. Intersection is jammed. Many cars have to wait through more than one red light, or more than 60 seconds. Traffic may back up into “up-stream” intersections.
>80.0
Source: Transportation Research Board, 2000. Highway Capacity Manual.
Congestion Management Program (CMP) & Metropolitan Transportation System (MTS) Segments
Levels of service for roadway links on the CMP and MTS were analyzed using the Florida Department of Transportation LOS methodology, which provides a planning level analysis based on Highway Capacity Manual 2000 methods. As a planning level analysis, the level of service is based on forecasts of traffic and assumptions for roadway and signalization control conditions, such as facility type (freeway, expressway, and arterial classification), speeds, capacity and number of lanes. The assumption for the number of lanes at each link location was extracted from the model and confirmed through field observations.
Existing Operations
Intersection Operations
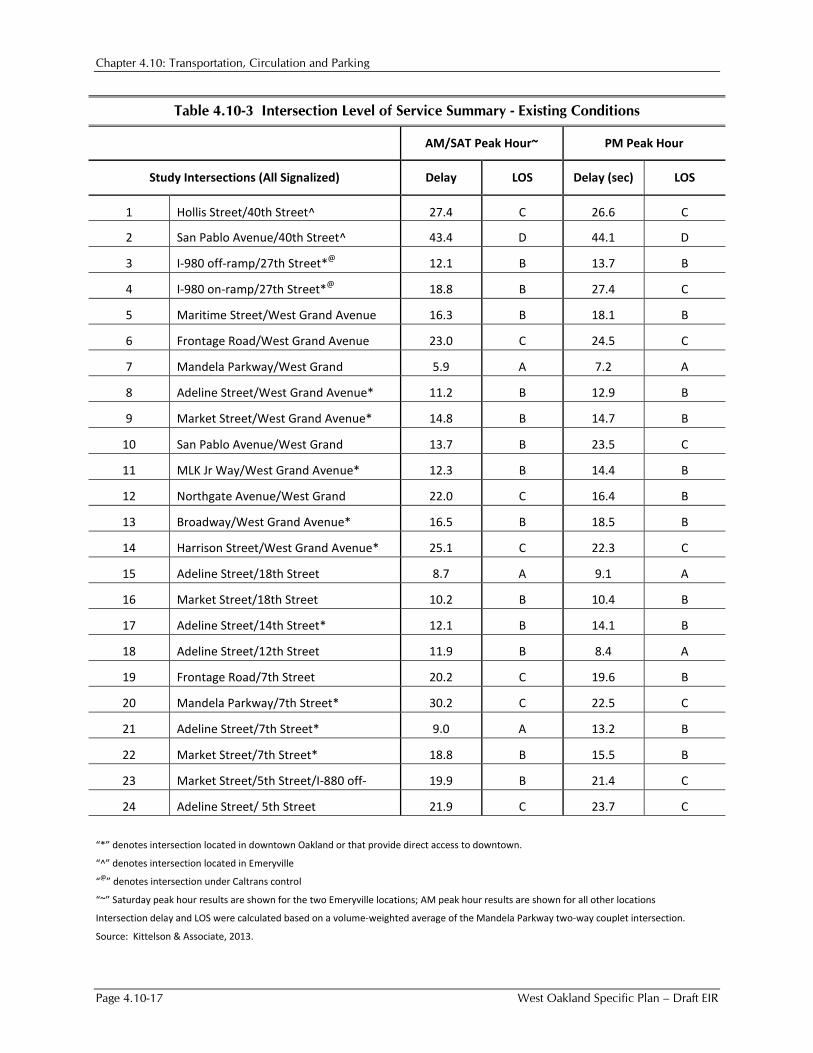
Table 4.10-3 summarizes the level-of-service analysis for the study intersections under the weekday AM and PM peak hour under existing traffic conditions. All of the study intersections currently operate at acceptable levels of service during the peak hours. Appendix 4.10-B includes the level-of-service worksheets under existing traffic conditions.
Chapter 4.10: Transportation, Circulation and Parking
Page 4.10-17 West Oakland Specific Plan – Draft EIR
Table 4.10-3 Intersection Level of Service Summary - Existing Conditions
AM/SAT Peak Hour~ PM Peak Hour
Study Intersections (All Signalized) Delay LOS Delay (sec) LOS
1 Hollis Street/40th Street^ 27.4 C 26.6 C
2 San Pablo Avenue/40th Street^ 43.4 D 44.1 D
3 I-980 off-ramp/27th Street*@ 12.1 B 13.7 B
4 I-980 on-ramp/27th Street*@ 18.8 B 27.4 C
5 Maritime Street/West Grand Avenue 16.3 B 18.1 B
6 Frontage Road/West Grand Avenue 23.0 C 24.5 C
7 Mandela Parkway/West Grand
5.9 A 7.2 A
8 Adeline Street/West Grand Avenue* 11.2 B 12.9 B
9 Market Street/West Grand Avenue* 14.8 B 14.7 B
10 San Pablo Avenue/West Grand
13.7 B 23.5 C
11 MLK Jr Way/West Grand Avenue* 12.3 B 14.4 B
12 Northgate Avenue/West Grand
22.0 C 16.4 B
13 Broadway/West Grand Avenue* 16.5 B 18.5 B
14 Harrison Street/West Grand Avenue* 25.1 C 22.3 C
15 Adeline Street/18th Street 8.7 A 9.1 A
16 Market Street/18th Street 10.2 B 10.4 B
17 Adeline Street/14th Street* 12.1 B 14.1 B
18 Adeline Street/12th Street 11.9 B 8.4 A
19 Frontage Road/7th Street 20.2 C 19.6 B
20 Mandela Parkway/7th Street* 30.2 C 22.5 C
21 Adeline Street/7th Street* 9.0 A 13.2 B
22 Market Street/7th Street* 18.8 B 15.5 B
23 Market Street/5th Street/I-880 off-
19.9 B 21.4 C
24 Adeline Street/ 5th Street 21.9 C 23.7 C
“*” denotes intersection located in downtown Oakland or that provide direct access to downtown.
“^” denotes intersection located in Emeryville
“@” denotes intersection under Caltrans control
“~” Saturday peak hour results are shown for the two Emeryville locations; AM peak hour results are shown for all other locations
Intersection delay and LOS were calculated based on a volume-weighted average of the Mandela Parkway two-way couplet intersection.
Source: Kittelson & Associate, 2013.
Chapter 4.10: Transportation, Circulation and Parking
West Oakland Specific Plan – Draft EIR Page 4.10-18
Alameda County Transportation Commission Segment Operations
Existing condition monitoring conducted by the Alameda County Transportation Commission (Alameda CTC) for the 2012 Level of Service Monitoring Report on the Congestion Management Program Roadway Network (January 2013) has revealed a number of freeway segments on the CMP network that operated at LOS F during the PM peak hour including the following segments in the study area:
• I-580 eastbound between I-80 and I-980
• I-80 eastbound between Toll Plaza and I-580 southbound merge
• I-880 northbound between I-880/I-80 split and I-880/I-80 merge
I-580 eastbound between I-80 and I-980 segment is exempt from LOS standard as it already operated at LOS F during the data collection effort in 1991 when the monitoring program initiated. No roadway segment in the study operated at LOS F level.
Regulatory Setting
State and Regional Policies and Regulations
The California Department of Transportation (Caltrans) has jurisdiction over state highways in the Planning Area. Caltrans constructs and maintains all state highways, and sets design standards that are often copied by local government. The Metropolitan Transportation Commission (MTC) is the state-designated metropolitan planning organization for the nine-county San Francisco Bay Area; it has authority for regional planning, distributing and administering federal and state funds for all modes of transportation, and assuring that projects are consistent with the Regional Transportation Plan. California Public Utilities Commission (CPUC) has regulatory oversight authority over a number of design and operational aspects of railroads and at-grade highway crossings in the state.
Caltrans Authority of the State Highway System
Caltrans is the authority for building, maintaining, and operating the State Highway system in California. Their goal is to allow for the safe and efficient use of the state transportation system for all users. Caltrans has set standards for the operational goals of its facilities as it pertains to intersection level of service and freeway level of service. These standards are set forth in the Caltrans Guide for the Preparation of Traffic Impact Studies1. This document establishes procedures to uniformly review the operational standards of Caltrans maintained facilities in terms of measures of effectiveness. The Caltrans facilities located within the West Oakland Specific Plan include I-80, I-580, I-880 and I-980, and the associated freeway on-ramps and off-ramps connecting to the City of Oakland street network. Caltrans maintains a target level of service of LOS C for state facilities.
Statewide Transportation Improvement Plan (STIP)
The Statewide Transportation Improvement Plan is a capital improvement program that plans transportation projects related to state facilities in California for the next five years. The program is updated every two years with new construction projects as more funding is provided. The California Transportation Commission approves the fund estimate and then Caltrans and regional planning
1 Guide for the Preparation of Traffic Impact Studies, Caltrans, December 2002.
Chapter 4.10: Transportation, Circulation and Parking
Page 4.10-19 West Oakland Specific Plan – Draft EIR
agencies submit plans for transportation improvement projects. If the projects are programmed in the STIP, then relevant agencies can begin the implementation process.
California’s Complete Streets Law
The Complete Streets Law was signed in as Assembly Bill 1358 and requires that cities include the needs of all users, including bicyclists and pedestrians, when updating local general plans. Caltrans specifically adopted Deputy Directive 64, which addresses the needs of people of all ages and abilities concerning transportation planning. It also recognizes that transportation improvement projects are opportunities to improve safety, access, and mobility for motorists, bicyclists, pedestrians, and transit users. The Complete Streets Implementation Action Plan2 provides an overview of the program.
Regional Transportation Plan (RTP)
MTC has recently updated its Regional Transportation Plan in 2009. The recently adopted plan called Transportation 2035 Plan for the San Francisco Bay Area3 specifies how future transportation spending will occur in the next 25 years. The new plan focuses on providing equal transportation opportunities to all users. One of the major goals of the plan is to provide incentives to cities and counties who promote growth adjacent to transit in urban communities in the Bay Area. Another main goal was to reduce greenhouse gas emissions as it relates to transportation.
Transit-Oriented Development and Complete Streets Policies
MTC adopted Resolution 3434 in July 2005, which discusses its policy on transit-oriented development (TOD) for regional transit expansion projects. The goal of the policy is to improve the cost-benefits of transit expansions by ensuring those transportation agencies, local jurisdictions, and the public work together. The plan will specify corridor-level thresholds to determine minimum residential and commercial development adjacent to transit stations. The plan will also address key issues within TOD’s, such as land use changes, access improvements, circulation improvements, and multi-modal design features.
MTC adopted Resolution 3765 in 2006 which states that future projects consider bicycle and pedestrian needs. Associated with this is a Routine Accommodation checklist, which developers must complete at the beginning stages of the project to ensure that all transportation modes have been accommodated for.
Local Policies and Regulations
The Alameda County Transportation Commission (Alameda CTC) coordinates transportation planning efforts throughout Alameda County and programs local, regional, state and federal funding for project implementation. It develops Countywide Transportation Plan (CTP), a long-range policy document that guides transportation funding decisions. The Alameda CTC also acts as the Congestion Management Agency for Alameda County which is legislatively required to develop a Congestion Management Program. The City of Oakland is the primary local agency for determining the future success of the West Oakland community. The City has a General Plan that outlines the goals for future sustainable growth and the City of Oakland Municipal codes enforce the rules and regulations.
2 Complete Streets Implementation Action Plan, Caltrans, February 2010. 3 Transportation 2035 Plan for the San Francisco Bay Area, MTC, April 2009.
Chapter 4.10: Transportation, Circulation and Parking
West Oakland Specific Plan – Draft EIR Page 4.10-20
Alameda County Congestion Management Program
The Alameda County Congestion Management Program (CMP) specifically lays out the strategies to implement the Countywide Transportation Plan. The CMP4 is updated every two years and sets guidelines on level of service standards, analysis of land uses on the transportation network, managing the transportation demand, and developing a seven-year Capital Improvement Program (CIP). The program also develops a travel demand model to assess the future impacts in the Cumulative year.
City of Oakland General Plan
The City of Oakland General Plan looks to address transportation needs as it relates to the expected growth in Oakland in the near future, the travel demand for the high proportion of non-auto population in Oakland, and the effective coordination of transportation related agencies in planning the Oakland network. The Land Use and Transportation Element of the City of Oakland General Plan5, which also incorporate the City’s Bicycle Master Plan and Pedestrian Master Plan, contains objectives and policies that the West Oakland Specific Plan practices. Objectives and policies that the Plan promotes include:
• Objective T2 – Provide mixed use, transit-oriented development that encourages public transit use and increases pedestrian and bicycle trips at major transportation nodes. The West Oakland BART Station is specifically mentioned for potential development to include retail, housing and community services depending on the vision of the community.
• Objective T3 – Provide a hierarchical network of roads that reflects desired land use patterns and strives for acceptable levels of service at intersections. In addition, a certain level of traffic congestions may be desirable in some locations to slow traffic and promote a more bicycle and pedestrian-oriented environment.
• Objective T4 – Increase use of alternative modes of transportation.
• Objective T6 – Make streets safe, pedestrian accessible, and attractive.
• Objective T7 – Reduce air pollutants caused by vehicles.
City of Oakland Bicycle Master Plan
The City of Oakland Bicycle Master Plan6 discusses goals and objectives related to the West Oakland Specific Plan. These include:
Goal 1 – Infrastructure: Develop the physical accommodations, including a network of bikeways and support facilities, to provide for safe and convenient access by bicycle.
• BMP Policy 1A – Bikeway Network: Develop and improve Oakland’s bikeway network.
− BMP Policy 1B – Routine accommodation: Address bicycle safety and access in the design and maintenance of all streets.
− BMP Policy 1C – Safe Routes to Transit: Improve bicycle access to transit, bicycle parking at transit facilities, and bicycle access on transit vehicles.
4 Congestion Management Plan 2011, Alameda CTC, December 2011. 5 Land Use and Transportation Element, City of Oakland, 1998. 6 City of Oakland Bicycle Master Plan, City of Oakland, December 2007.
Chapter 4.10: Transportation, Circulation and Parking
Page 4.10-21 West Oakland Specific Plan – Draft EIR
• Goal 3 – Coordination: Provide a policy framework and implementation plan for the routine accommodation of bicyclists in Oakland’s projects and programs.
City of Oakland Pedestrian Master Plan
The City of Oakland Pedestrian Master Plan7 discusses goals and objectives related to the West Oakland Specific Plan. These include:
• Goal 1 – Pedestrian Safety: Create a street environment that strives to ensure pedestrian safety.
− PMP Policy 1.1 Crossing Safety: Improve pedestrian crossings in areas of high pedestrian activity where safety is an issue.
− PMP Policy 1.2 Traffic Signals: Use traffic signals and their associated features to improve pedestrian safety at dangerous intersections.
• Goal 2 – Pedestrian Access: Develop an environment throughout the City – prioritizing routes to school and transit – that enables pedestrians to travel safely and freely.
− PMP Policy 2.1 Route Network: Create and maintain a pedestrian route network that provides direct connections between activity centers.
− PMP Policy 2.3 Safe Routes to Transit: Implement pedestrian improvements along major AC Transit lines and at BART stations to strengthen connections to transit.
City of Oakland Complete Streets Policy
The City of Oakland Complete Street Policy establishes principles and implementation guidelines to provide safe and convenient pedestrian, bicycle and public transportation travel options in order to protect all road users, reduce environmental impacts, promote healthy living, and advance the well-being of Oakland citizens. The accommodation of all users is a routine component of new construction, reconstruction, retrofit, and maintenance projects subject to exception approved by the Public Works Director.
City of Oakland Municipal Code
The City of Oakland Municipal Code states all the rules and regulation in Title 10 – Vehicles and Traffic. Provisions related to traffic control devices, speed limits, parking, and vision obscurement at intersections are stated in this section. Further, Title 12.02 – Complete Street Design Standards establishes the City’s intent to implement complete streets serving all users and modes.
Standard Conditions of Approval and Uniformly Applied Development Standards
The City of Oakland’s Standard Conditions of Approval (SCA) are applicable to all development projects within the City regardless of a project’s environmental determination, pursuant in part to CEQA Guidelines Section 15183. The City’s SCA serve to avoid or substantially reduce potentially significant impacts. If the City approves the Project, the following SCA would be adopted as requirements of the Project to help reduce impacts.
SCA TRANS-1: Parking and Transportation Demand Management (For construction: Prior to issuance of first permit related to construction (e.g. demolition, grading, etc.). For operation: Prior to
7 City of Oakland Pedestrian Master Plan, City of Oakland, November 2002.

Chapter 4.10: Transportation, Circulation and Parking
West Oakland Specific Plan – Draft EIR Page 4.10-22
issuance of a final building permit. Individual project applicants shall pay for and submit for review and approval by the City a Transportation Demand Management (TDM) plan containing strategies to:
a. Reduce the amount of traffic generated by new development and the expansion of existing development, pursuant to the City’s police power and necessary in order to protect the public health, safety and welfare.
b. Ensure that expected increases in traffic resulting from growth in employment and housing opportunities in the City of Oakland will be adequately mitigated.
c. Reduce drive-alone commute trips during peak traffic periods by using a combination of services, incentives, and facilities.
d. Promote more efficient use of existing transportation facilities and ensure that new developments are designed in ways to maximize the potential for alternative transportation usage.
e. Establish an ongoing monitoring and enforcement program to ensure that the desired alternative mode use percentages are achieved.
Individual project applicants shall implement the approved TDM plan. The TDM plan shall include strategies to increase pedestrian, bicycle, transit, and carpool/vanpool use. All four modes of travel shall be considered, and parking management and parking reduction strategies should be included. Actions to consider include the following:
a. Inclusion of additional long term and short term bicycle parking that meets the design standards set forth in chapter five of the Bicycle Master Plan, and Bicycle Parking Ordinance, and shower and locker facilities in commercial developments that exceed the requirement.
b. Construction of and/or access to bikeways per the Bicycle Master Plan; construction of priority bikeways, onsite signage and bike lane striping.
c. Installation of safety elements per the Pedestrian Master Plan (such as cross walk striping, curb ramps, countdown signals, bulb outs, etc.) to encourage convenient and safe crossing at arterials.
d. Installation of amenities such as lighting, street trees, trash receptacles per the Pedestrian Master Plan and any applicable streetscape plan.
e. Construction and development of transit stops/shelters, pedestrian access, way finding signage, and lighting around transit stops per transit agency plans or negotiated improvements.
f. Direct onsite sales of transit passes purchased and sold at a bulk group rate (through programs such as AC Transit Easy Pass or a similar program through another transit agency).
g. Employees or residents can be provided with a subsidy, determined by individual project applicants and subject to review by the City, if the employees or residents use transit or commute by other alternative modes.
h. Provision of ongoing contribution to AC Transit service to the area between the development and nearest mass transit station. If that is not available, an ongoing contribution to an existing area shuttle service between the development and nearest mass transit station. The last option is establishment of a new shuttle service between the development and nearest mass transit station may be developed. The contribution required for the service (any option) will be based on the cost of the last option.
i. Guaranteed ride home program for employees, either through 511.org or through separate program.
j. Pre-tax commuter benefits (commuter checks) for employees.
k. Free designated parking spaces for on-site car-sharing program (such as City Car Share, Zip Car, etc.) and/or car-share membership for employees or tenants.
Chapter 4.10: Transportation, Circulation and Parking
Page 4.10-23 West Oakland Specific Plan – Draft EIR
l. On-site carpooling and/or vanpool program that includes preferential (discounted or free) parking for carpools and vanpools.
m. Distribution of information concerning alternative transportation options.
n. Parking spaces sold/leased separately for residential units. Charge employees for parking, or provide a cash incentive or transit pass alternative to a free parking space in commercial properties.
o. Parking management strategies; including attendant/valet parking and shared parking spaces.
p. Requiring tenants to provide opportunities and the ability to work off-site.
q. Allow employees or residents to adjust their work schedule in order to complete the basic work requirement of five eight-hour workdays by adjusting their schedule to reduce vehicle trips to the worksite.
r. Provide or require tenants to provide employees with staggered work hours involving a shift in the set work hours of all employees at the workplace or flexible work hours involving individually determined work hours.
Individual project applicants shall submit an annual compliance report for review and approval by the City. This report will be reviewed either by City staff (or a peer review consultant, chosen by the City and paid for by individual project applicants). If timely reports are not submitted, the reports indicate a failure to achieve the stated policy goals, or the required alternative mode split is still not achieved, staff will work with individual project applicants to find ways to meet their commitments and achieve trip reduction goals. If the issues cannot be resolved, the matter may be referred to the Planning Commission for resolution. Individual project applicants shall be required, as a condition of approval, to reimburse the City for costs incurred in maintaining and enforcing the trip reduction program for the approved Plan.
SCA TRANS-2: Construction Traffic and Parking (Prior to the issuance of a demolition, grading or building permit). Individual project applicants and construction contractor shall meet with appropriate City of Oakland agencies to determine traffic management strategies to reduce, to the maximum extent feasible, traffic congestion and the effects of parking demand by construction workers during construction of the Plan and other nearby projects that could be simultaneously under construction. Individual project applicants shall develop a construction management plan. The plan shall be submitted to EBMUD and Caltrans for their review and comment ten (10) business days before submittal to the City. Individual project applicants shall consider in good faith such comments and revise the plan as appropriate. The revised plan shall be submitted for review and approval by the Planning and Zoning Division, the Building Services Division, and the Transportation Services Division. The plan shall include at least the following items and requirements:
a. A set of comprehensive traffic control measures, including scheduling of major truck trips and deliveries to avoid peak traffic hours, detour signs if required, lane closure procedures, signs, cones for drivers, and designated construction access routes.
b. Notification procedures for adjacent project sponsors and public safety personnel regarding when major deliveries, detours, and lane closures will occur.
c. Location of construction staging areas for materials, equipment, and vehicles at an approved location.
d. A process for responding to, and tracking, complaints pertaining to construction activity, including identification of an onsite complaint manager. The manager shall determine the cause of the complaints and shall take prompt action to correct the problem. Planning and Zoning shall be informed who the Manager is prior to the issuance of the first permit issued by Building Services.
e. Provision for accommodation of pedestrian flow.
Chapter 4.10: Transportation, Circulation and Parking
West Oakland Specific Plan – Draft EIR Page 4.10-24
f. Provision for parking management and spaces for all construction workers to ensure that construction workers do not park in on-street spaces.
g. Any damage to the street caused by heavy equipment, or as a result of this construction, shall be repaired, at the applicant's expense, within one week of the occurrence of the damage (or excessive wear), unless further damage/excessive wear may continue; in such case, repair shall occur prior to issuance of a final inspection of the building permit. All damage that is a threat to public health or safety shall be repaired immediately. The street shall be restored to its condition prior to the new construction as established by the City Building Inspector and/or photo documentation, at the applicant's expense, before the issuance of a Certificate of Occupancy.
h. Any heavy equipment brought to the construction site shall be transported by truck, where feasible.
i. No materials or equipment shall be stored on the traveled roadway at any time.
j. Prior to construction, a portable toilet facility and a debris box shall be installed on the site, and properly maintained through project completion.
k. All equipment shall be equipped with mufflers.
l. Prior to the end of each work day during construction, the contractor or contractors shall pick up and properly dispose of all litter resulting from or related to the project, whether located on the property, within the public rights-of-way, or properties of adjacent or nearby neighbors.
Project Transportation Characteristics
Project Roadway Modifications
The Project includes a number of roadway modifications that entail lane reductions, roundabout and bike lane installations as shown in Figure 4.10-7. The travel lanes on several roadways are proposed to be reduced. West Grand Avenue is proposed to be reduced from the existing six travel lanes to four travel lanes between Market Street and Mandela Parkway.

Figure 4.10-7Specific Plan, Proposed Roadway Improvements
Source: Kittleson & Associates
WEST OAKLAND SPECIFIC PLAN
SUPP
ORT
ING
TH
E PL
AN
8
Bay Bridge
Fig. 8.1.5: Road Diets, Roundabouts, and Streetscape Improvements
West Oakland Station
19th Street Station
12th Street Station
MacArthur Station
Planning Area BART
Legend
Former OaklandArmy Base San Pablo Avenue
Mar
tin L
uthe
r Kin
g Jr.
Way
28th Street
32nd Street
14th Street
Pera
lta St
reet
Hollis StreetAd
elin
e St
reet
Pine S
t
Downtown Oakland
Road Diet (From Six Lanes to Four Lanes)Road Diet (From Four Lanes to Two Lanes)
West Grand Avenue
Mar
ket S
tree
t
12th Street
14th Street7th Street
Adel
ine
Stre
et
18th Street
Man
dela
Par
kway
Emeryville
Port of Oakland3rd Street
Roundabout(Proposed for future study)
Bay Bridge/Interstate 80
Interstate 880
Interstate 580
Interstate 880
Inte
rstat
e 98
0
400020001000
FEET N
16th Street Station
MainPost Office
Recommended Future Streetscape ImprovementsStreetscape Improvements In Progress
Chapter 4.10: Transportation, Circulation and Parking
West Oakland Specific Plan – Draft EIR Page 4.10-26
In addition, the following roadways would be modified from the existing four travel lanes to two travel lanes with center turn lane:
• Adeline Street between 3rd Avenue and 36th Avenue
• 12th Street between Market Street and Mandela Parkway
• 14th Street between Market Street and Mandela Parkway
• 18th Street between Market Street and Mandela Parkway
Roundabouts would be installed at the following intersections:
• Adeline Street at 12th, 14th and 18th Streets
• Peralta Street at 18th and 28th Streets
Bicycle lanes would be installed along the following roadways:
• West Grand Avenue west of Market Street
• Adeline Street between I-580 and 3rd Street
The Project also includes improvements identified in the following plan documents:
• Martin Luther King Jr. Way Streetscape Master Plan
• Peralta Street Streetscape Master Plan
• 7th Street Concept and Urban Design Plan
The Project also includes improvements identified in the following plan documents:
• Martin Luther King Jr. Way Streetscape Master Plan
• Peralta Street Streetscape Master Plan
• 7th Street Concept and Urban Design Plan
Traffic Forecasts
Travel forecasts were prepared using the current version (June 2011) of the Alameda CTC Countywide Travel Demand Model (the Model) which is consistent with Association of Bay Area Governments’ (ABAG) Projections 2009, the latest MTC Regional Transportation Plan, and the latest Alameda Countywide Plan. Specifically, future model networks include the fourth bore of the Caldecott Tunnel as well as a number of future projects such as:
1. Oakland Army Base Project
2. Lake Merritt Station Area Plan Project
3. Broadway-Valdez District Specific Plan Project
4. Planned road narrowing projects
5. AC Transit BRT along Telegraph Avenue/Broadway/International Boulevard /E.14th Street
6. E. 18th Street improvements
7. 12th Street Reconstruction
8. Lakeside Drive/Green Street-Lakeside Drive/Harrison Street/20th Street
Chapter 4.10: Transportation, Circulation and Parking
Page 4.10-27 West Oakland Specific Plan – Draft EIR
9. Measure DD Project for 12th Street/10th Street/ 7th Street
The Model’s trip generation process computes person trips based on households and population as well as employment. Trips are distributed based on the standard gravity type model and are then split into walk, bike, and auto and transit modes prior to assigning them onto the highway and transit networks.
The model inputs were reviewed against the Project description in the study area for accuracy by comparing them to traffic counts and roadway configurations from recent aerial pictures. Based on a review of the proposed Project, the Model was modified to include additional network details to better represent the roadways in the Plan Area. Modifications to the Model included the addition of 12th Street between Union Street and Market Street and refinements to centroid connectors for TAZ 178 to reflect more accurate loading of traffic in the Plan Area. Minor coding corrections were made to the model speed inputs along Mandela Parkway, Adeline Avenue and Union Street. For the Existing plus Project and Year 2035 plus Project scenarios, modifications were made to reflect road diets along West Grand Avenue, 12th Street, 14th Street, 18th Street and Adeline Street. Model data sets were developed for all analysis scenarios, including:
• Existing No Project • Existing plus Project • Year 2035 Cumulative No Project • Year 2035 Cumulative plus Project
The trip assignment results were extracted for the study intersections and reviewed for growth and accuracy. The Model trip assignment constraining procedure was applied to develop the forecast for future No Project and Future plus Project conditions in order to develop a realistic background traffic forecasts for the future years. For the Future No Project scenario, the increment of the model volumes between Future No Project and Existing No Project runs was added to the counts to develop adjusted Future No Project volumes. For the Future plus Project scenario, the increment of the select zone assignments between Future plus Project and Future No Project conditions was added to the Future No Project volumes. For the Existing plus Project scenario, the increment of the select zone assignments between the Existing plus project and Existing no project runs was added to the counts to develop Existing plus Project volumes. Lastly, the intersection volumes were then manually adjusted using industry standard incremental adjustment with furness balancing technique to minimize the base year model error against counts. The adjustment technique was developed for the Transportation Research Board’s NCHRP 255 report titled Highway Traffic Data for Urbanized Area Project Planning and Design (1982).
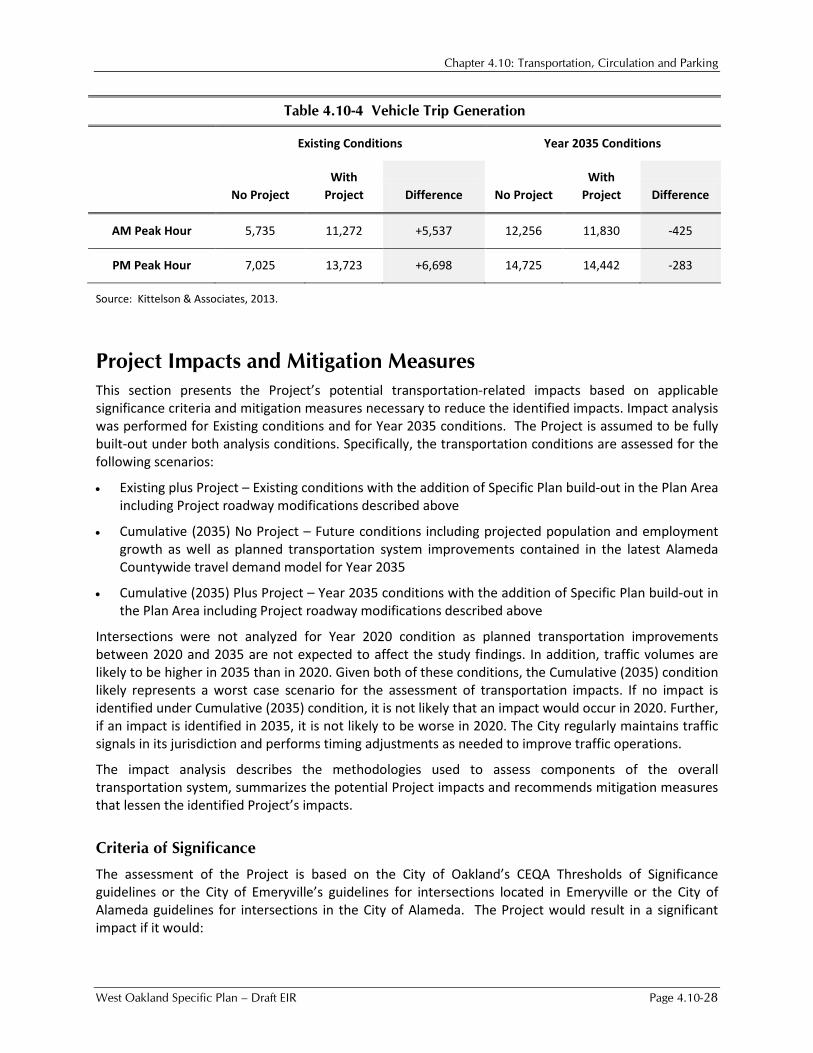
A summary of AM and PM peak hour trips generated in the Plan Area from the model forecasts are presented in Table 4.10-4. It indicates that while the Project would result in a net growth of vehicle trips under Existing Conditions; it would result in a decrease in vehicle trips as compared to projected growth without the Project during both peak hours under Future Conditions.
Chapter 4.10: Transportation, Circulation and Parking
West Oakland Specific Plan – Draft EIR Page 4.10-28
Table 4.10-4 Vehicle Trip Generation
Existing Conditions Year 2035 Conditions
No Project With
Project Difference No Project With
Project Difference
AM Peak Hour 5,735 11,272 +5,537 12,256 11,830 -425
PM Peak Hour 7,025 13,723 +6,698 14,725 14,442 -283
Source: Kittelson & Associates, 2013.
Project Impacts and Mitigation Measures This section presents the Project’s potential transportation-related impacts based on applicable significance criteria and mitigation measures necessary to reduce the identified impacts. Impact analysis was performed for Existing conditions and for Year 2035 conditions. The Project is assumed to be fully built-out under both analysis conditions. Specifically, the transportation conditions are assessed for the following scenarios:
• Existing plus Project – Existing conditions with the addition of Specific Plan build-out in the Plan Area including Project roadway modifications described above
• Cumulative (2035) No Project – Future conditions including projected population and employment growth as well as planned transportation system improvements contained in the latest Alameda Countywide travel demand model for Year 2035
• Cumulative (2035) Plus Project – Year 2035 conditions with the addition of Specific Plan build-out in the Plan Area including Project roadway modifications described above
Intersections were not analyzed for Year 2020 condition as planned transportation improvements between 2020 and 2035 are not expected to affect the study findings. In addition, traffic volumes are likely to be higher in 2035 than in 2020. Given both of these conditions, the Cumulative (2035) condition likely represents a worst case scenario for the assessment of transportation impacts. If no impact is identified under Cumulative (2035) condition, it is not likely that an impact would occur in 2020. Further, if an impact is identified in 2035, it is not likely to be worse in 2020. The City regularly maintains traffic signals in its jurisdiction and performs timing adjustments as needed to improve traffic operations.
The impact analysis describes the methodologies used to assess components of the overall transportation system, summarizes the potential Project impacts and recommends mitigation measures that lessen the identified Project’s impacts.
Criteria of Significance
The assessment of the Project is based on the City of Oakland’s CEQA Thresholds of Significance guidelines or the City of Emeryville’s guidelines for intersections located in Emeryville or the City of Alameda guidelines for intersections in the City of Alameda. The Project would result in a significant impact if it would:
Chapter 4.10: Transportation, Circulation and Parking
Page 4.10-29 West Oakland Specific Plan – Draft EIR
Project Impacts
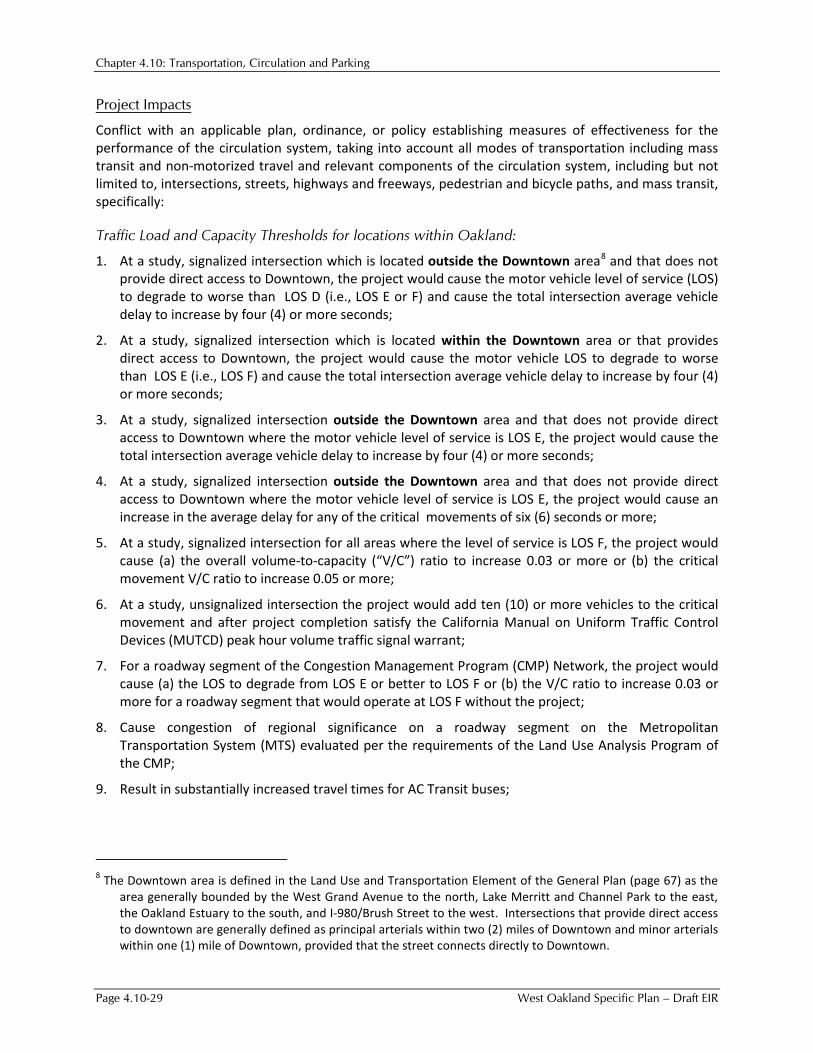
Conflict with an applicable plan, ordinance, or policy establishing measures of effectiveness for the performance of the circulation system, taking into account all modes of transportation including mass transit and non-motorized travel and relevant components of the circulation system, including but not limited to, intersections, streets, highways and freeways, pedestrian and bicycle paths, and mass transit, specifically:
Traffic Load and Capacity Thresholds for locations within Oakland:
1. At a study, signalized intersection which is located outside the Downtown area8 and that does not provide direct access to Downtown, the project would cause the motor vehicle level of service (LOS) to degrade to worse than LOS D (i.e., LOS E or F) and cause the total intersection average vehicle delay to increase by four (4) or more seconds;
2. At a study, signalized intersection which is located within the Downtown area or that provides direct access to Downtown, the project would cause the motor vehicle LOS to degrade to worse than LOS E (i.e., LOS F) and cause the total intersection average vehicle delay to increase by four (4) or more seconds;
3. At a study, signalized intersection outside the Downtown area and that does not provide direct access to Downtown where the motor vehicle level of service is LOS E, the project would cause the total intersection average vehicle delay to increase by four (4) or more seconds;
4. At a study, signalized intersection outside the Downtown area and that does not provide direct access to Downtown where the motor vehicle level of service is LOS E, the project would cause an increase in the average delay for any of the critical movements of six (6) seconds or more;
5. At a study, signalized intersection for all areas where the level of service is LOS F, the project would cause (a) the overall volume-to-capacity (“V/C”) ratio to increase 0.03 or more or (b) the critical movement V/C ratio to increase 0.05 or more;
6. At a study, unsignalized intersection the project would add ten (10) or more vehicles to the critical movement and after project completion satisfy the California Manual on Uniform Traffic Control Devices (MUTCD) peak hour volume traffic signal warrant;
7. For a roadway segment of the Congestion Management Program (CMP) Network, the project would cause (a) the LOS to degrade from LOS E or better to LOS F or (b) the V/C ratio to increase 0.03 or more for a roadway segment that would operate at LOS F without the project;
8. Cause congestion of regional significance on a roadway segment on the Metropolitan Transportation System (MTS) evaluated per the requirements of the Land Use Analysis Program of the CMP;
9. Result in substantially increased travel times for AC Transit buses;
8 The Downtown area is defined in the Land Use and Transportation Element of the General Plan (page 67) as the
area generally bounded by the West Grand Avenue to the north, Lake Merritt and Channel Park to the east, the Oakland Estuary to the south, and I-980/Brush Street to the west. Intersections that provide direct access to downtown are generally defined as principal arterials within two (2) miles of Downtown and minor arterials within one (1) mile of Downtown, provided that the street connects directly to Downtown.
Chapter 4.10: Transportation, Circulation and Parking
West Oakland Specific Plan – Draft EIR Page 4.10-30
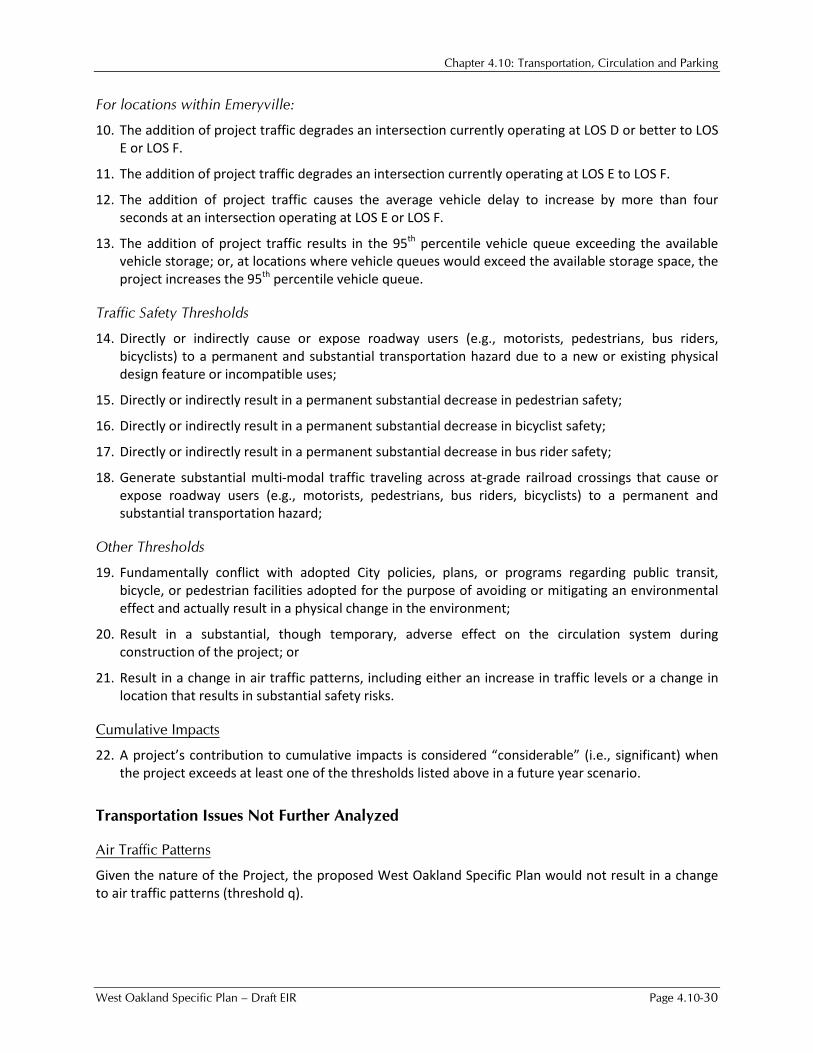
For locations within Emeryville:
10. The addition of project traffic degrades an intersection currently operating at LOS D or better to LOS E or LOS F.
11. The addition of project traffic degrades an intersection currently operating at LOS E to LOS F.
12. The addition of project traffic causes the average vehicle delay to increase by more than four seconds at an intersection operating at LOS E or LOS F.
13. The addition of project traffic results in the 95th percentile vehicle queue exceeding the available vehicle storage; or, at locations where vehicle queues would exceed the available storage space, the project increases the 95th percentile vehicle queue.
Traffic Safety Thresholds
14. Directly or indirectly cause or expose roadway users (e.g., motorists, pedestrians, bus riders, bicyclists) to a permanent and substantial transportation hazard due to a new or existing physical design feature or incompatible uses;
15. Directly or indirectly result in a permanent substantial decrease in pedestrian safety;
16. Directly or indirectly result in a permanent substantial decrease in bicyclist safety;
17. Directly or indirectly result in a permanent substantial decrease in bus rider safety;
18. Generate substantial multi-modal traffic traveling across at-grade railroad crossings that cause or expose roadway users (e.g., motorists, pedestrians, bus riders, bicyclists) to a permanent and substantial transportation hazard;
Other Thresholds
19. Fundamentally conflict with adopted City policies, plans, or programs regarding public transit, bicycle, or pedestrian facilities adopted for the purpose of avoiding or mitigating an environmental effect and actually result in a physical change in the environment;
20. Result in a substantial, though temporary, adverse effect on the circulation system during construction of the project; or
21. Result in a change in air traffic patterns, including either an increase in traffic levels or a change in location that results in substantial safety risks.
Cumulative Impacts
22. A project’s contribution to cumulative impacts is considered “considerable” (i.e., significant) when the project exceeds at least one of the thresholds listed above in a future year scenario.
Transportation Issues Not Further Analyzed
Air Traffic Patterns
Given the nature of the Project, the proposed West Oakland Specific Plan would not result in a change to air traffic patterns (threshold q).

Chapter 4.10: Transportation, Circulation and Parking
Page 4.10-31 West Oakland Specific Plan – Draft EIR
Intersections within the City of Alameda
The Project will generate trips to and from the City of Alameda that will predominantly use the Webster Street and Posey Tubes, and that will pass through the intersections at Constitution Way/Marina Village Parkway and Webster Street/Atlantic Avenue. Because these intersections are closest to the Webster and Posey Tubes and would experience the highest number of Project trips from the Plan Area, they are indicators of potential Project impacts on City of Alameda intersections.
Existing plus Project
A recent analysis of these two Alameda intersections was conducted as part of the City of Oakland’s Lake Merritt Station Area Plan Draft EIR (November 2013). The Lake Merritt project, at full buildout, was projected to add 192 trips entering and leaving the City of Alameda via the Tubes in the AM peak period, and 286 trips entering and leaving the City of Alameda during the PM peak period. Based on these Lake Merritt project traffic volumes, the Lake Merritt Draft EIR found that both the Constitution Way/Marina Village Parkway and the Webster Street/Atlantic Avenue intersections would continue to operate at levels that would not exceed the City of Alameda’s threshold of LOS D, and that Lake Merritt project-generated traffic would not result in a significant impact at these locations.
According to the trip distribution patterns for the West Oakland Specific Plan, traffic generated by the West Oakland Plan is projected to add 175 trips entering and leaving the City of Alameda via the Tubes in the AM peak period, and 185 trips entering and leaving the City of Alameda during the PM peak period. Since these traffic volumes are lower during both peak periods than the volumes associated with the Lake Merritt project, and since the Lake Merritt Station Area Plan Draft EIR concluded that its traffic would not result in a significant impact at either the Constitution Way/Marina Village Parkway or the Webster Street/Atlantic Avenue intersections, it is reasonable to conclude that the lower volume of traffic generated by the West Oakland Specific Plan would have an even less significant impact at these intersections. No further analysis of these intersections is considered necessary.
Cumulative Conditions
As described above under Traffic Forecasts, implementation of the West Oakland Specific Plan would result in a slight decrease in total vehicle trips generated from the Plan Area as compared to projected growth within the Plan Area as included in the most current version (June 2011) of the Alameda CTC Countywide Travel Demand Model. Because the Project’s contribution of cumulative traffic growth would be less under the Cumulative plus Project scenario than under the Cumulative without Project scenario during both peak hours under Future Conditions, the Project would not result in any significant cumulative traffic increase at distant locations (such as within the City of Alameda), and would not result in any greater cumulative traffic impacts than under the Cumulative without Project scenario.
Traffic Load and Capacity
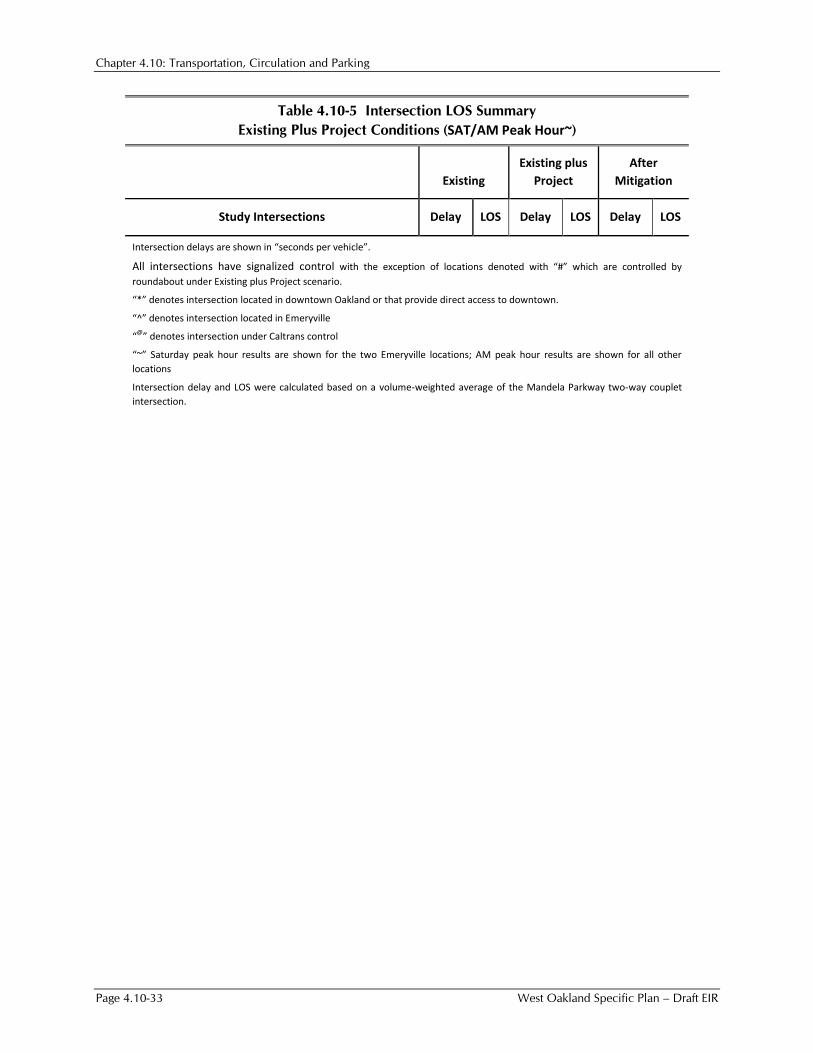
Existing Plus Project Intersection Operations Intersection operations were analyzed under Existing plus Project scenario to determine the effect of the full Project in the context of existing roadway network and land use in the surrounding area. The intersection volumes for the Existing plus Project scenario are provided in Appendix 4.10-C. The intersection operations at the study intersections are summarized in Table 4.10-5 and Table 4.10-6.

Chapter 4.10: Transportation, Circulation and Parking
West Oakland Specific Plan – Draft EIR Page 4.10-32
Table 4.10-5 Intersection LOS Summary Existing Plus Project Conditions (SAT/AM Peak Hour~)
Existing
Existing plus Project
After Mitigation
Study Intersections Delay LOS Delay LOS Delay LOS
1 Hollis Street/40th Street^ 27.4 C 30.3 C 30.3 C
2 San Pablo Avenue/40th Street^ 43.4 D 52.2 D 46.1 D
3 I-980 off-ramp/27th Street*@ 11.8 B 13.3 B 13.3 B
4 I-980 on-ramp/27th Street*@ 18.3 B 18.8 B 18.8 B
5 Maritime Street/West Grand Avenue 15.7 B 16.4 B 16.4 B
6 Frontage Road/West Grand Avenue 21.6 C 36.1 D 36.1 D
7 Mandela Parkway/West Grand Avenue* 5.7 A 12.1 B 12.1 B
8 Adeline Street/West Grand Avenue* 11.1 B 12.7 B 12.7 B
9 Market Street/West Grand Avenue* 14.5 B 20.3 C 20.3 C
10 San Pablo Avenue/West Grand Avenue* 13.7 B 13.3 B 13.3 B
11 MLK Jr Way/West Grand Avenue* 12.3 B 10.8 B 10.8 B
12 Northgate Avenue/West Grand Avenue* 22.4 C 24.7 C 24.7 C
13 Broadway/West Grand Avenue* 16.2 B 16.1 B 16.1 B
14 Harrison Street/West Grand Avenue* 25.3 C 25.0 C 25.0 C
15 Adeline Street/18th Street# 8.6 A 6.4 A 6.9 A
16 Market Street/18th Street 10.1 B 17.4 B 17.4 B
17 Adeline Street/14th Street#* 12.1 B 6.1 A 6.6 A
18 Adeline Street/12th Street# 11.8 B 4.5 A 4.7 A
19 Frontage Road/7th Street 19.2 B 24.1 C 24.1 C
20 Mandela Parkway/7th Street* 28.7 C 22.4 C 22.4 C
21 Adeline Street/7th Street* 8.8 A 9.0 A 9.0 A
22 Market Street/7th Street* 19.1 B 18.5 B 18.5 B
23 Market Street/5th Street/I-880 off-ramp@ 20.0 B 19.9 B 19.9 B
24 Adeline Street/ 5th Street 21.3 C 27.5 C 27.5 C
Chapter 4.10: Transportation, Circulation and Parking
Page 4.10-33 West Oakland Specific Plan – Draft EIR
Table 4.10-5 Intersection LOS Summary Existing Plus Project Conditions (SAT/AM Peak Hour~)
Existing
Existing plus Project
After Mitigation
Study Intersections Delay LOS Delay LOS Delay LOS
Intersection delays are shown in “seconds per vehicle”.
All intersections have signalized control with the exception of locations denoted with “#” which are controlled by roundabout under Existing plus Project scenario.
“*” denotes intersection located in downtown Oakland or that provide direct access to downtown.
“^” denotes intersection located in Emeryville
“@” denotes intersection under Caltrans control
“~” Saturday peak hour results are shown for the two Emeryville locations; AM peak hour results are shown for all other locations
Intersection delay and LOS were calculated based on a volume-weighted average of the Mandela Parkway two-way couplet intersection.

Chapter 4.10: Transportation, Circulation and Parking
West Oakland Specific Plan – Draft EIR Page 4.10-34
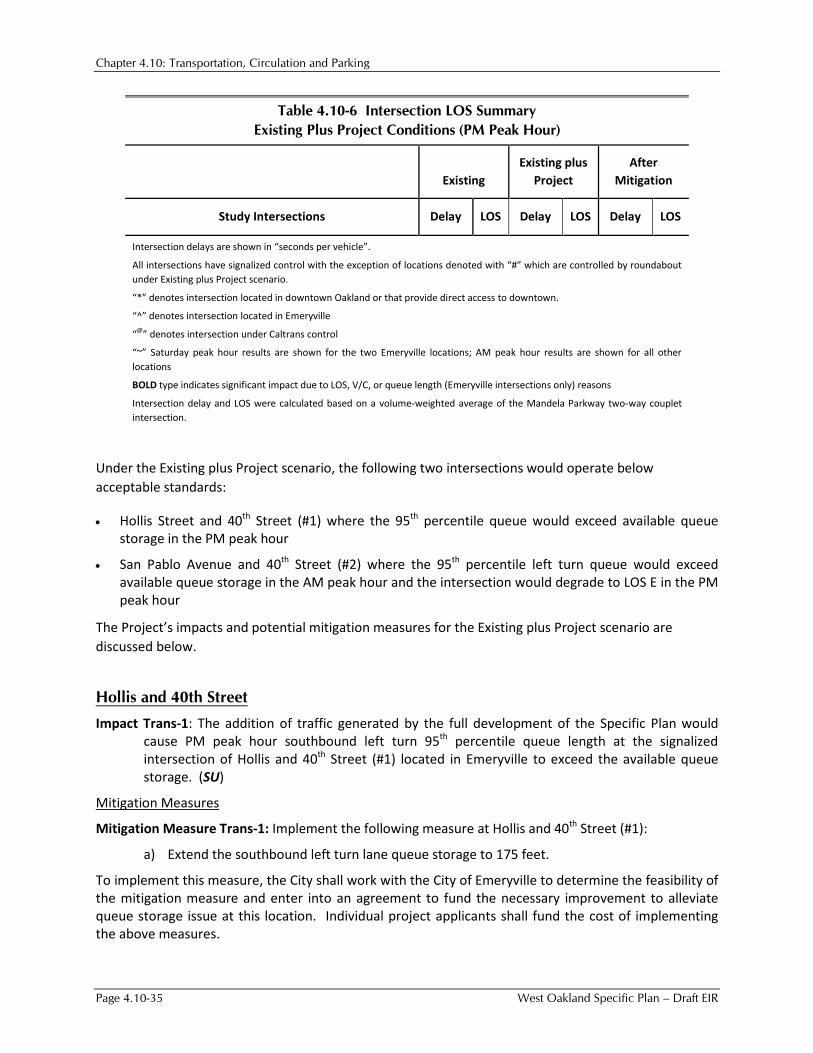
Table 4.10-6 Intersection LOS Summary Existing Plus Project Conditions (PM Peak Hour)
Existing
Existing plus Project
After Mitigation
Study Intersections Delay LOS Delay LOS Delay LOS
1 Hollis Street/40th Street^ 26.6 C 27.1 C 27.1 C
2 San Pablo Avenue/40th Street^ 44.1 D 59.1 E 51.0 D
3 I-980 off-ramp/27th Street*@ 13.5 B 16.1 B 16.1 B
4 I-980 on-ramp/27th Street*@ 25.0 C 57.8 E 57.8 E
5 Maritime Street/West Grand Avenue 16.7 B 18.9 B 18.9 B
6 Frontage Road/West Grand Avenue 22.5 C 32.6 C 32.6 C
7 Mandela Parkway/West Grand Avenue* 6.9 A 38.8 D 38.8 D
8 Adeline Street/West Grand Avenue* 12.6 B 14.4 B 14.4 B
9 Market Street/West Grand Avenue* 14.4 B 27.1 C 27.1 C
10 San Pablo Avenue/West Grand Avenue* 21.1 C 64.7 E 64.7 E
11 MLK Jr Way/West Grand Avenue* 14.2 B 14.9 B 14.9 B
12 Northgate Avenue/West Grand Avenue* 16.1 B 21.6 C 21.6 C
13 Broadway/West Grand Avenue* 19.0 B 18.9 B 18.9 B
14 Harrison Street/West Grand Avenue* 22.8 C 23.8 C 23.8 C
15 Adeline Street/18th Street# 9.0 A 7.6 A 8.5 A
16 Market Street/18th Street 10.3 B 14.8 B 14.8 B
17 Adeline Street/14th Street#* 13.9 B 7.0 A 7.8 A
18 Adeline Street/12th Street# 8.4 A 4.4 A 4.6 A
19 Frontage Road/7th Street 18.9 B 24.0 C 24.0 C
20 Mandela Parkway/7th Street* 24.9 C 21.7 C 21.7 C
21 Adeline Street/7th Street* 12.7 B 16.3 B 16.3 B
22 Market Street/7th Street* 15.2 B 18.2 B 18.2 B
23 Market Street/5th Street/I-880 off-ramp@ 21.4 C 21.7 C 21.7 C
24 Adeline Street/ 5th Street 22.5 C 47.6 D 47.6 D
Chapter 4.10: Transportation, Circulation and Parking
Page 4.10-35 West Oakland Specific Plan – Draft EIR
Table 4.10-6 Intersection LOS Summary Existing Plus Project Conditions (PM Peak Hour)
Existing
Existing plus Project
After Mitigation
Study Intersections Delay LOS Delay LOS Delay LOS
Intersection delays are shown in “seconds per vehicle”.
All intersections have signalized control with the exception of locations denoted with “#” which are controlled by roundabout under Existing plus Project scenario.
“*” denotes intersection located in downtown Oakland or that provide direct access to downtown.
“^” denotes intersection located in Emeryville
“@” denotes intersection under Caltrans control
“~” Saturday peak hour results are shown for the two Emeryville locations; AM peak hour results are shown for all other locations
BOLD type indicates significant impact due to LOS, V/C, or queue length (Emeryville intersections only) reasons
Intersection delay and LOS were calculated based on a volume-weighted average of the Mandela Parkway two-way couplet intersection.
Under the Existing plus Project scenario, the following two intersections would operate below acceptable standards:
• Hollis Street and 40th Street (#1) where the 95th percentile queue would exceed available queue storage in the PM peak hour
• San Pablo Avenue and 40th Street (#2) where the 95th percentile left turn queue would exceed available queue storage in the AM peak hour and the intersection would degrade to LOS E in the PM peak hour
The Project’s impacts and potential mitigation measures for the Existing plus Project scenario are discussed below.
Hollis and 40th Street
Impact Trans-1: The addition of traffic generated by the full development of the Specific Plan would cause PM peak hour southbound left turn 95th percentile queue length at the signalized intersection of Hollis and 40th Street (#1) located in Emeryville to exceed the available queue storage. (SU)
Mitigation Measures
Mitigation Measure Trans-1: Implement the following measure at Hollis and 40th Street (#1):
a) Extend the southbound left turn lane queue storage to 175 feet.
To implement this measure, the City shall work with the City of Emeryville to determine the feasibility of the mitigation measure and enter into an agreement to fund the necessary improvement to alleviate queue storage issue at this location. Individual project applicants shall fund the cost of implementing the above measures.
Chapter 4.10: Transportation, Circulation and Parking
West Oakland Specific Plan – Draft EIR Page 4.10-36
Resulting Level of Significance
Upon implementation, the southbound left turn queue would be contained within the queue storage and the impact would be reduced to a level of less than significant. No secondary significant impacts would result from implementation of this measure. However, because the intersection is under City of Emeryville’s jurisdiction, the timing and implementation of the improvement are not under the City of Oakland’s control. Therefore, the improvement cannot be assured to be completed and the Project impact is conservatively deemed significant and unavoidable.
San Pablo Avenue and 40th Street
Impact Trans-2: The addition of traffic generated by the full development of the Specific Plan would cause PM peak hour traffic operations at the signalized intersection of San Pablo Avenue and 40th Street (#2) located in Emeryville to degrade from LOS D to LOS E under Existing plus Project conditions. Additionally, the eastbound left and northbound left turn 95th percentile queue length would exceed the available queue storage in the AM peak hour. (SU)
Mitigation Measures
Mitigation Measure Trans-2: Implement the following measure at San Pablo Avenue and 40th Street intersection (#2):
a) Add an additional eastbound left turn lane
b) Optimize signal timing parameters (i.e., adjust the allocation of green time for each intersection approach)
To implement this measure, the City shall work with the City of Emeryville to determine the feasibility of the mitigation measure and enter into an agreement to fund the necessary improvement to alleviate congestion at this location. Individual project applicants shall fund the cost of implementing the above measures.
Resulting Level of Significance
Upon implementation, the intersection would improve to LOS D during the PM peak hour and the 95th percentile queue length of both the eastbound left turn and northbound left turn movements would remain unchanged from No Project conditions. The impact would be reduced to a level of less than significant. No secondary significant impacts would result from implementation of this measure. However, because the intersection is under City of Emeryville’s jurisdiction, the timing and implementation of the improvement are not under the City of Oakland’s control. Therefore, the improvement cannot be assured to be completed and the Project impact is conservatively deemed significant and unavoidable.
Year 2035 Cumulative Intersection Impacts
Intersection operations were analyzed under Year 2035 conditions to determine the effect of the Project in combination with the projected growth in the surrounding community using the methodology described above. The description of future baseline (No Project) and With Project conditions is presented below.
The 2035 No Project intersection turning movement forecasts were developed using methodology described in the Traffic Forecast section of this chapter. The intersection turning movement volumes for
Chapter 4.10: Transportation, Circulation and Parking
Page 4.10-37 West Oakland Specific Plan – Draft EIR
the 2035 Cumulative No Project and Cumulative plus Project scenarios are provided in 4.10-C. The intersection operations at the study intersections are summarized in Table 4.10-7 and Table 4.10-8.
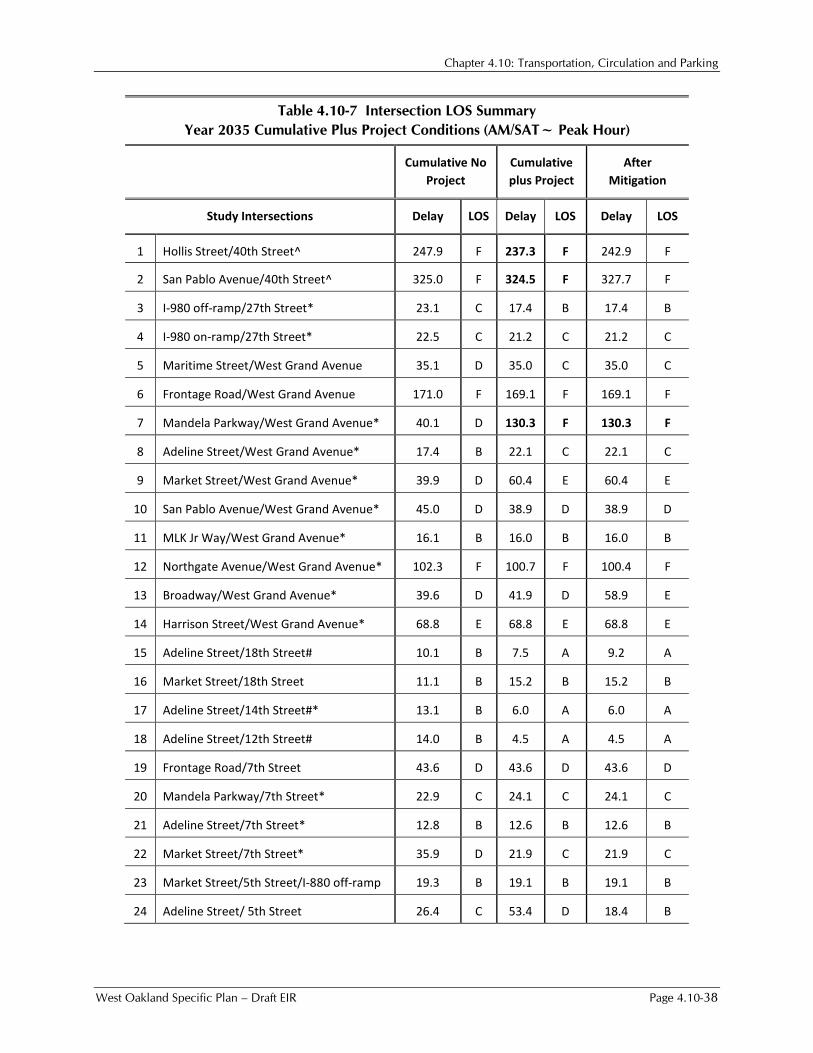
Chapter 4.10: Transportation, Circulation and Parking
West Oakland Specific Plan – Draft EIR Page 4.10-38
Table 4.10-7 Intersection LOS Summary Year 2035 Cumulative Plus Project Conditions (AM/SAT~ Peak Hour)
Cumulative No
Project Cumulative plus Project
After Mitigation
Study Intersections Delay LOS Delay LOS Delay LOS
1 Hollis Street/40th Street^ 247.9 F 237.3 F 242.9 F
2 San Pablo Avenue/40th Street^ 325.0 F 324.5 F 327.7 F
3 I-980 off-ramp/27th Street* 23.1 C 17.4 B 17.4 B
4 I-980 on-ramp/27th Street* 22.5 C 21.2 C 21.2 C
5 Maritime Street/West Grand Avenue 35.1 D 35.0 C 35.0 C
6 Frontage Road/West Grand Avenue 171.0 F 169.1 F 169.1 F
7 Mandela Parkway/West Grand Avenue* 40.1 D 130.3 F 130.3 F
8 Adeline Street/West Grand Avenue* 17.4 B 22.1 C 22.1 C
9 Market Street/West Grand Avenue* 39.9 D 60.4 E 60.4 E
10 San Pablo Avenue/West Grand Avenue* 45.0 D 38.9 D 38.9 D
11 MLK Jr Way/West Grand Avenue* 16.1 B 16.0 B 16.0 B
12 Northgate Avenue/West Grand Avenue* 102.3 F 100.7 F 100.4 F
13 Broadway/West Grand Avenue* 39.6 D 41.9 D 58.9 E
14 Harrison Street/West Grand Avenue* 68.8 E 68.8 E 68.8 E
15 Adeline Street/18th Street# 10.1 B 7.5 A 9.2 A
16 Market Street/18th Street 11.1 B 15.2 B 15.2 B
17 Adeline Street/14th Street#* 13.1 B 6.0 A 6.0 A
18 Adeline Street/12th Street# 14.0 B 4.5 A 4.5 A
19 Frontage Road/7th Street 43.6 D 43.6 D 43.6 D
20 Mandela Parkway/7th Street* 22.9 C 24.1 C 24.1 C
21 Adeline Street/7th Street* 12.8 B 12.6 B 12.6 B
22 Market Street/7th Street* 35.9 D 21.9 C 21.9 C
23 Market Street/5th Street/I-880 off-ramp 19.3 B 19.1 B 19.1 B
24 Adeline Street/ 5th Street 26.4 C 53.4 D 18.4 B

Chapter 4.10: Transportation, Circulation and Parking
Page 4.10-39 West Oakland Specific Plan – Draft EIR
Table 4.10-7 Intersection LOS Summary Year 2035 Cumulative Plus Project Conditions (AM/SAT~ Peak Hour)
Cumulative No
Project Cumulative plus Project
After Mitigation
Study Intersections Delay LOS Delay LOS Delay LOS
Intersection delays are shown in “seconds per vehicle”.
All intersections have signalized control with the exception of locations denoted with “#” which are controlled by roundabout under Existing plus Project scenario.
“*” denotes intersection located in downtown Oakland or that provide direct access to downtown.
“^” denotes intersection located in Emeryville
“@” denotes intersection under Caltrans control
“~” Saturday peak hour results are shown for the two Emeryville locations; AM peak hour results are shown for all other locations
Intersection delay and LOS were calculated based on a volume-weighted average of the Mandela Parkway two-way couplet intersection.
BOLD type indicates significant impact due to LOS, V/C, or queue length (Emeryville intersections only) reasons.
Source: Kittelson & Associate, 2013.
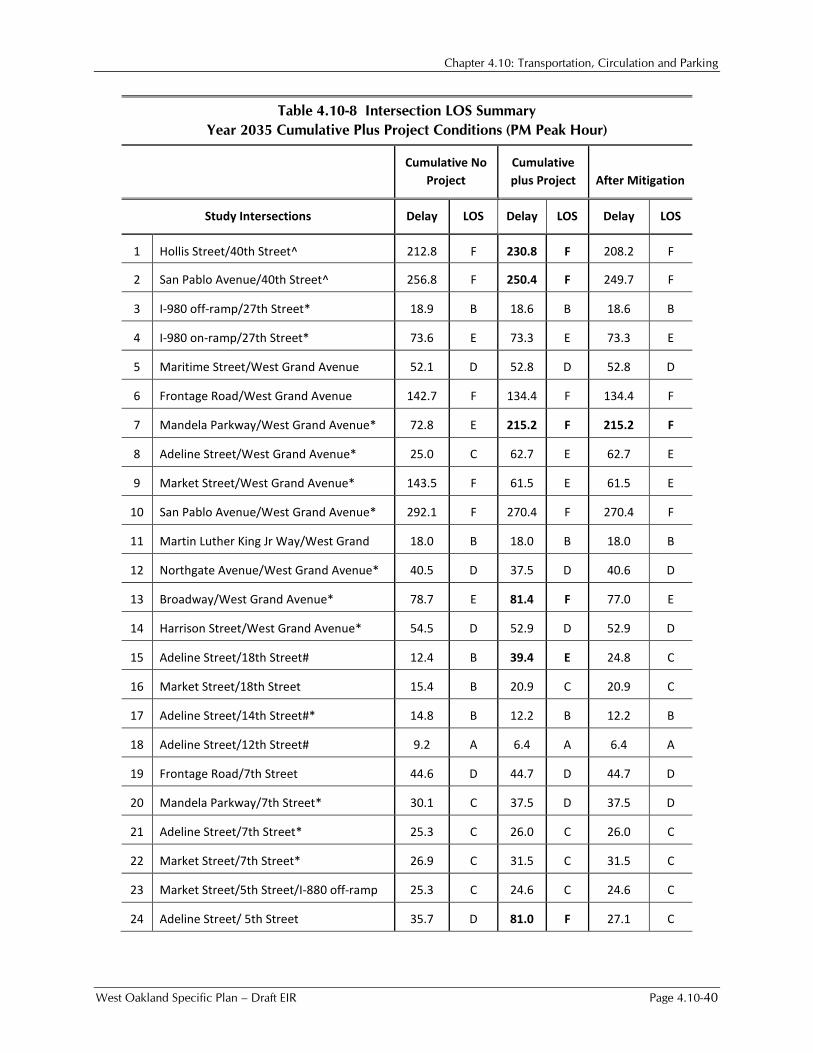
Chapter 4.10: Transportation, Circulation and Parking
West Oakland Specific Plan – Draft EIR Page 4.10-40
Table 4.10-8 Intersection LOS Summary Year 2035 Cumulative Plus Project Conditions (PM Peak Hour)
Cumulative No
Project Cumulative plus Project After Mitigation
Study Intersections Delay LOS Delay LOS Delay LOS
1 Hollis Street/40th Street^ 212.8 F 230.8 F 208.2 F
2 San Pablo Avenue/40th Street^ 256.8 F 250.4 F 249.7 F
3 I-980 off-ramp/27th Street* 18.9 B 18.6 B 18.6 B
4 I-980 on-ramp/27th Street* 73.6 E 73.3 E 73.3 E
5 Maritime Street/West Grand Avenue 52.1 D 52.8 D 52.8 D
6 Frontage Road/West Grand Avenue 142.7 F 134.4 F 134.4 F
7 Mandela Parkway/West Grand Avenue* 72.8 E 215.2 F 215.2 F
8 Adeline Street/West Grand Avenue* 25.0 C 62.7 E 62.7 E
9 Market Street/West Grand Avenue* 143.5 F 61.5 E 61.5 E
10 San Pablo Avenue/West Grand Avenue* 292.1 F 270.4 F 270.4 F
11 Martin Luther King Jr Way/West Grand
18.0 B 18.0 B 18.0 B
12 Northgate Avenue/West Grand Avenue* 40.5 D 37.5 D 40.6 D
13 Broadway/West Grand Avenue* 78.7 E 81.4 F 77.0 E
14 Harrison Street/West Grand Avenue* 54.5 D 52.9 D 52.9 D
15 Adeline Street/18th Street# 12.4 B 39.4 E 24.8 C
16 Market Street/18th Street 15.4 B 20.9 C 20.9 C
17 Adeline Street/14th Street#* 14.8 B 12.2 B 12.2 B
18 Adeline Street/12th Street# 9.2 A 6.4 A 6.4 A
19 Frontage Road/7th Street 44.6 D 44.7 D 44.7 D
20 Mandela Parkway/7th Street* 30.1 C 37.5 D 37.5 D
21 Adeline Street/7th Street* 25.3 C 26.0 C 26.0 C
22 Market Street/7th Street* 26.9 C 31.5 C 31.5 C
23 Market Street/5th Street/I-880 off-ramp 25.3 C 24.6 C 24.6 C
24 Adeline Street/ 5th Street 35.7 D 81.0 F 27.1 C
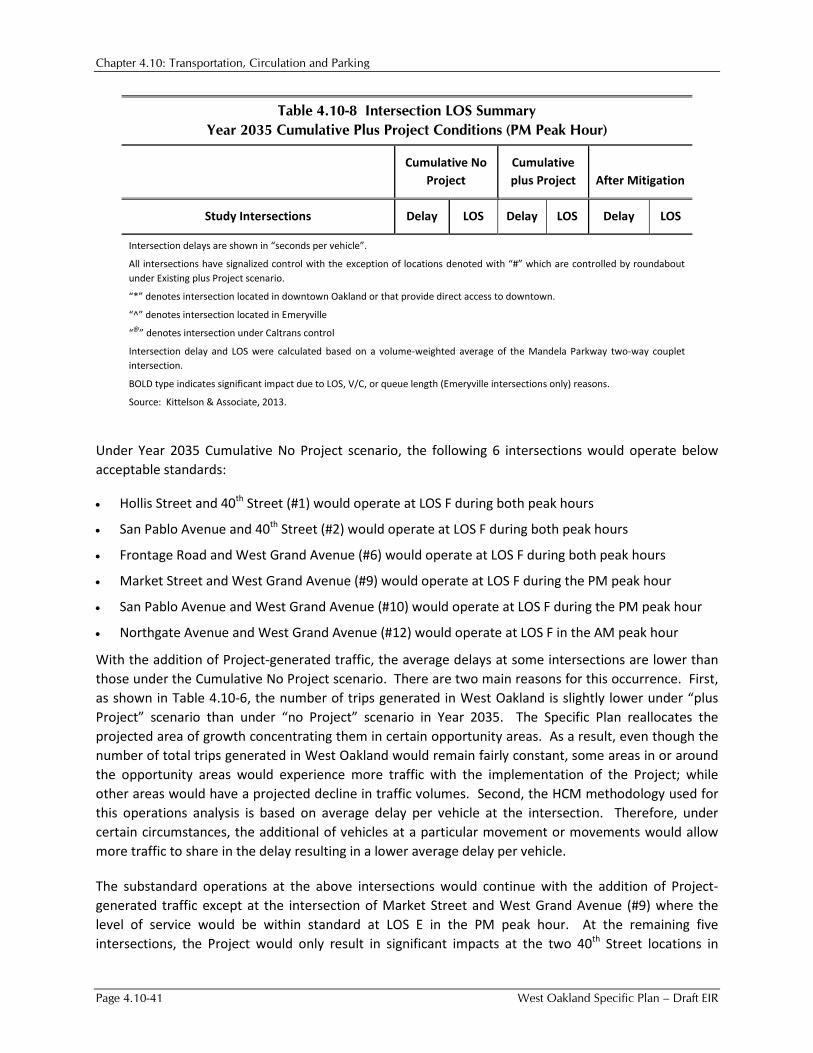
Chapter 4.10: Transportation, Circulation and Parking
Page 4.10-41 West Oakland Specific Plan – Draft EIR
Table 4.10-8 Intersection LOS Summary Year 2035 Cumulative Plus Project Conditions (PM Peak Hour)
Cumulative No
Project Cumulative plus Project After Mitigation
Study Intersections Delay LOS Delay LOS Delay LOS
Intersection delays are shown in “seconds per vehicle”.
All intersections have signalized control with the exception of locations denoted with “#” which are controlled by roundabout under Existing plus Project scenario.
“*” denotes intersection located in downtown Oakland or that provide direct access to downtown.
“^” denotes intersection located in Emeryville
“@” denotes intersection under Caltrans control
Intersection delay and LOS were calculated based on a volume-weighted average of the Mandela Parkway two-way couplet intersection.
BOLD type indicates significant impact due to LOS, V/C, or queue length (Emeryville intersections only) reasons.
Source: Kittelson & Associate, 2013.
Under Year 2035 Cumulative No Project scenario, the following 6 intersections would operate below acceptable standards:
• Hollis Street and 40th Street (#1) would operate at LOS F during both peak hours
• San Pablo Avenue and 40th Street (#2) would operate at LOS F during both peak hours
• Frontage Road and West Grand Avenue (#6) would operate at LOS F during both peak hours
• Market Street and West Grand Avenue (#9) would operate at LOS F during the PM peak hour
• San Pablo Avenue and West Grand Avenue (#10) would operate at LOS F during the PM peak hour
• Northgate Avenue and West Grand Avenue (#12) would operate at LOS F in the AM peak hour
With the addition of Project-generated traffic, the average delays at some intersections are lower than those under the Cumulative No Project scenario. There are two main reasons for this occurrence. First, as shown in Table 4.10-6, the number of trips generated in West Oakland is slightly lower under “plus Project” scenario than under “no Project” scenario in Year 2035. The Specific Plan reallocates the projected area of growth concentrating them in certain opportunity areas. As a result, even though the number of total trips generated in West Oakland would remain fairly constant, some areas in or around the opportunity areas would experience more traffic with the implementation of the Project; while other areas would have a projected decline in traffic volumes. Second, the HCM methodology used for this operations analysis is based on average delay per vehicle at the intersection. Therefore, under certain circumstances, the additional of vehicles at a particular movement or movements would allow more traffic to share in the delay resulting in a lower average delay per vehicle.
The substandard operations at the above intersections would continue with the addition of Project-generated traffic except at the intersection of Market Street and West Grand Avenue (#9) where the level of service would be within standard at LOS E in the PM peak hour. At the remaining five intersections, the Project would only result in significant impacts at the two 40th Street locations in

Chapter 4.10: Transportation, Circulation and Parking
West Oakland Specific Plan – Draft EIR Page 4.10-42
Emeryville (#1 and #2). The Project would not cause the overall volume-to-capacity (v/c) ratio to increase 0.03 or more, or the critical movement v/c ratio to increase 0.05 or more at the West Grand Avenue intersections of Frontage Road (#6), San Pablo Avenue (#10), and Northgate Avenue (#12). Therefore, the Project’s impacts at these intersections are not considered to be significant.
Besides the two Emeryville intersections discussed above, the Specific Plan would cause the operations at the following four intersections to deteriorate to unacceptable levels for vehicle traffic in 2035 thereby resulting in significant impacts:
• Mandela Parkway and West Grand Avenue (#7) would degrade from LOS D to LOS F in the AM peak hour and from LOS E to LOS F in the PM peak hour
• Broadway and West Grand Avenue (#13) would degrade from LOS E to LOS F during the PM peak hour
• Adeline Street and 18th Street (#15) would degrade from LOS B to LOS E during the PM peak hour
• Adeline Street and 5th Street (#24) would degrade from LOS D to LOS F during the PM peak hour
The Project’s impacts and potential mitigation measures for Year 2035 Cumulative with Project scenario are discussed below.
Hollis Street and 40th Street
Impact Trans-3: The addition of traffic generated by the full development of the Specific Plan would contribute to LOS F operations at the signalized intersection of Hollis Street and 40th Street (#1) located in Emeryville and would increase the average delay by more than four seconds. (SU)
Mitigation Measures
Mitigation Measure Trans-3: Implement the following measure at Hollis Street and 40th Street intersection (#1):
a) Extend the westbound left turn queue storage to 425 feet
b) Extend the southbound queue storage to 175 feet
c) Optimize signal timing parameters (i.e., adjust the allocation of green time for each intersection approach)
It is projected that this impact would occur and the mitigation be needed by 2016. To implement this measure, the City shall work with the City of Emeryville to determine the feasibility of the mitigation measure and enter into an agreement to fund the necessary improvement to alleviate congestion at this location. The funding would be collected from the developers of properties in the West Oakland Specific Plan area and would be used to implement mitigation measures to improve intersection operations.
Resulting Level of Significance
Upon implementation, the intersection would continue to operate at LOS F during both peak periods. However, the operations would improve to better than Cumulative No Project condition and the impact would be reduced to a level of less than significant. However, because the intersection is under City of Emeryville’s jurisdiction, the timing and implementation of the improvement are not under the City of

Chapter 4.10: Transportation, Circulation and Parking
Page 4.10-43 West Oakland Specific Plan – Draft EIR
Oakland’s control. Therefore, the improvement cannot be assured to be completed and the Project impact is conservatively deemed significant and unavoidable.
San Pablo Avenue and 40th Street
Impact Trans-4: The addition of traffic generated by the full development of the Specific Plan would contribute to an increase in the eastbound left turn 95th percentile queue in the both peak hours that would exceed the available queue storage at the signalized intersection of San Pablo Avenue and 40th Street (#2) located in Emeryville. (SU)
Mitigation Measures
Mitigation Measure Trans-4: Implement the following measure at San Pablo Avenue and 40th Street intersection (#2):
a) Optimize signal timing parameters (i.e., adjust the allocation of green time for each intersection approach)
It is projected that the impact would occur and the mitigation be needed by buildout of the Specific Plan. To implement this measure, the City shall work with the City of Emeryville to determine the feasibility of the mitigation measure and enter into an agreement to fund the necessary improvement to alleviate congestion at this location. The funding would be collected from the developers of properties in the West Oakland Specific Plan area and would be used to implement mitigation measures to improve intersection operations.
Resulting Level of Significance
Upon implementation, the intersection would continue to operate at LOS F during both peak periods. However, the eastbound left turn 95th percentile queue would not be longer than the Cumulative No Project condition and the impact would be reduced to a level of less than significant. However, because the intersection is under City of Emeryville’s jurisdiction, the timing and implementation of the improvement are not under the City of Oakland’s control. Therefore, the improvement cannot be assured to be completed and the Project impact is conservatively deemed significant and unavoidable.
Mandela Parkway and West Grand Avenue
Impact Trans-5: The addition of traffic generated by the full development of the Specific Plan would degrade the operation from LOS D to LOS F in the AM peak hour and from LOS E to LOS F in the PM peak hour at the signalized intersection of (#7) located outside the Downtown Area and would increase the volume-to-capacity ratio beyond the threshold of significance. (SU)
Mitigation Measures
No feasible mitigation measure is identified.
Resulting Level of Significance
The following improvements would be needed to improve the operation to LOS C in the AM peak hour and LOS D in the PM peak hour, but are in conflict with the City’s plans and policies for roadways in the area:
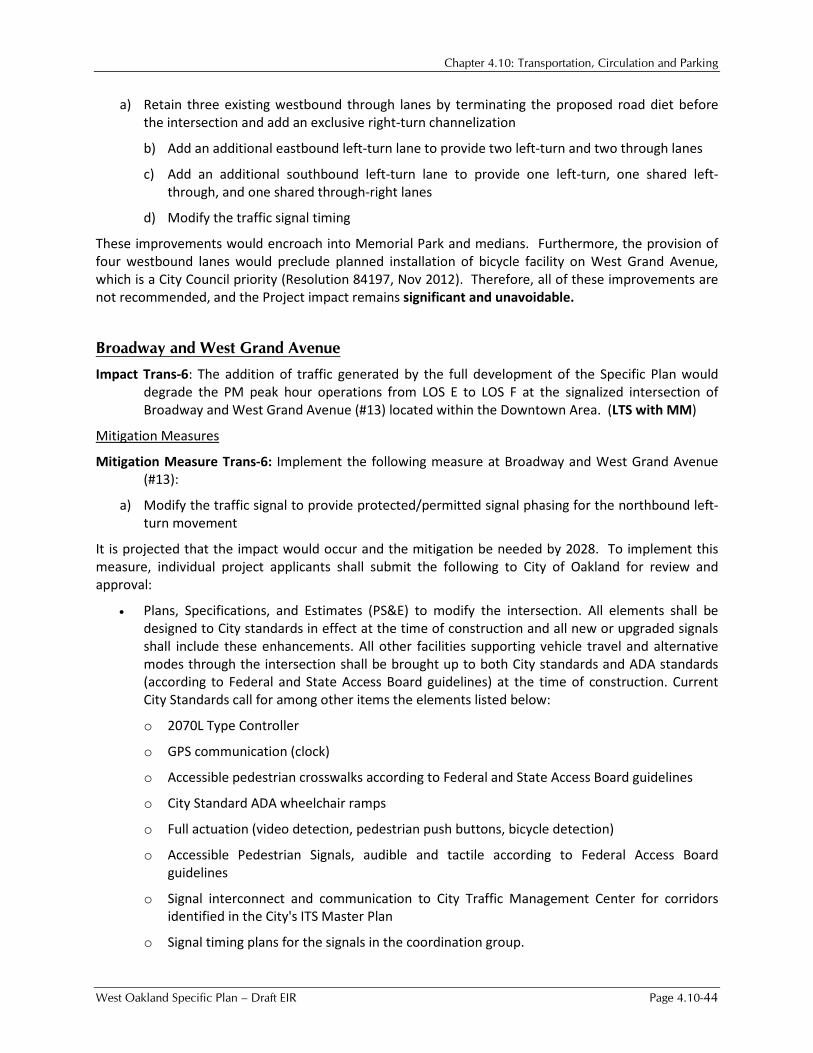
Chapter 4.10: Transportation, Circulation and Parking
West Oakland Specific Plan – Draft EIR Page 4.10-44
a) Retain three existing westbound through lanes by terminating the proposed road diet before the intersection and add an exclusive right-turn channelization
b) Add an additional eastbound left-turn lane to provide two left-turn and two through lanes
c) Add an additional southbound left-turn lane to provide one left-turn, one shared left-through, and one shared through-right lanes
d) Modify the traffic signal timing
These improvements would encroach into Memorial Park and medians. Furthermore, the provision of four westbound lanes would preclude planned installation of bicycle facility on West Grand Avenue, which is a City Council priority (Resolution 84197, Nov 2012). Therefore, all of these improvements are not recommended, and the Project impact remains significant and unavoidable.
Broadway and West Grand Avenue
Impact Trans-6: The addition of traffic generated by the full development of the Specific Plan would degrade the PM peak hour operations from LOS E to LOS F at the signalized intersection of Broadway and West Grand Avenue (#13) located within the Downtown Area. (LTS with MM)
Mitigation Measures
Mitigation Measure Trans-6: Implement the following measure at Broadway and West Grand Avenue (#13):
a) Modify the traffic signal to provide protected/permitted signal phasing for the northbound left-turn movement
It is projected that the impact would occur and the mitigation be needed by 2028. To implement this measure, individual project applicants shall submit the following to City of Oakland for review and approval:
• Plans, Specifications, and Estimates (PS&E) to modify the intersection. All elements shall be designed to City standards in effect at the time of construction and all new or upgraded signals shall include these enhancements. All other facilities supporting vehicle travel and alternative modes through the intersection shall be brought up to both City standards and ADA standards (according to Federal and State Access Board guidelines) at the time of construction. Current City Standards call for among other items the elements listed below:
o 2070L Type Controller
o GPS communication (clock)
o Accessible pedestrian crosswalks according to Federal and State Access Board guidelines
o City Standard ADA wheelchair ramps
o Full actuation (video detection, pedestrian push buttons, bicycle detection)
o Accessible Pedestrian Signals, audible and tactile according to Federal Access Board guidelines
o Signal interconnect and communication to City Traffic Management Center for corridors identified in the City's ITS Master Plan
o Signal timing plans for the signals in the coordination group.
Chapter 4.10: Transportation, Circulation and Parking
Page 4.10-45 West Oakland Specific Plan – Draft EIR
Individual project applicants shall fund the cost of preparing and implementing the above measures. However, if the City adopts a transportation fee program prior to implementation of this mitigation measure, individual project applicants shall have the option to pay the applicable fee in lieu of implementing this mitigation measure and payment of the fee shall mitigate this impact to less than significant.
Resulting Level of Significance
Upon implementation, the intersection would continue to operate at LOS E during the PM peak hour and the impact would be reduced to a level of less than significant. No secondary significant impacts would result from implementation of this measure.
Adeline Street and 18th Street
Impact Trans-7: The addition of traffic generated by the full development of the Specific Plan would degrade PM peak hour operation from LOS B to LOS E at the intersection of Adeline Street and 18th Street (#15) located outside the Downtown Area. (LTS with MM)
Mitigation Measures
Mitigation Measure Trans-7: Implement the following measures at the Adeline Street and 18th Street (#15) intersection:
a) Retain the existing traffic signal control at the intersection and upgrade it to an actuated signal rather than converting to a single-lane roundabout as proposed as a part of the Project
It is projected that the impact would occur and the mitigation be needed by 2031. To implement this measure, individual project applicants shall submit the following to City of Oakland for review and approval:
• Plans, Specifications, and Estimates (PS&E) to modify the intersection. All elements shall be designed to City standards in effect at the time of construction and all new or upgraded signals shall include these enhancements. All other facilities supporting vehicle travel and alternative modes through the intersection shall be brought up to both City standards and ADA standards (according to Federal and State Access Board guidelines) at the time of construction. Current City Standards call for among other items the elements listed below:
o 2070L Type Controller
o GPS communication (clock)
o Accessible pedestrian crosswalks according to Federal and State Access Board guidelines
o City Standard ADA wheelchair ramps
o Full actuation (video detection, pedestrian push buttons, bicycle detection)
o Accessible Pedestrian Signals, audible and tactile according to Federal Access Board guidelines
o Signal interconnect and communication to City Traffic Management Center for corridors identified in the City's ITS Master Plan
o Signal timing plans for the signals in the coordination group.
Chapter 4.10: Transportation, Circulation and Parking
West Oakland Specific Plan – Draft EIR Page 4.10-46
Individual project applicants shall fund the cost of preparing and implementing the above measures. However, if the City adopts a transportation fee program prior to implementation of this mitigation measure, individual project applicants shall have the option to pay the applicable fee in lieu of implementing this mitigation measure and payment of the fee shall mitigate this impact to less than significant.
Resulting Level of Significance
Upon implementation, the intersection would improve to LOS C during the PM peak hour and the impact would be reduced to a level of less than significant. No secondary significant impacts would result from implementation of this measure.
Adeline Street and 5th Street
Impact Trans-8: The addition of traffic generated by the full development of the Specific Plan would degrade the PM peak hour operation from LOS D to LOS F at the signalized intersection of Adeline Street and 5th Street (#24) located outside the Downtown Area. (LTS with MM)
Mitigation Measures
Mitigation Measure Trans-8: Implement the following measure at Adeline Street and 5th Street (#24):
a) Modify the traffic signal to remove split phasing and provide protected-permitted left turn phasing for the northbound and southbound left-turn movements
It is projected that the impact would occur and the mitigation be needed upon buildout of the Specific Plan.
City of Oakland for review and approval:
• Plans, Specifications, and Estimates (PS&E) to modify the intersection. All elements shall be designed to City standards in effect at the time of construction and all new or upgraded signals shall include these enhancements. All other facilities supporting vehicle travel and alternative modes through the intersection shall be brought up to both City standards and ADA standards (according to Federal and State Access Board guidelines) at the time of construction. Current City Standards call for among other items the elements listed below:
o 2070L Type Controller
o GPS communication (clock)
o Accessible pedestrian crosswalks according to Federal and State Access Board guidelines
o City Standard ADA wheelchair ramps
o Full actuation (video detection, pedestrian push buttons, bicycle detection)
o Accessible Pedestrian Signals, audible and tactile according to Federal Access Board guidelines
o Signal interconnect and communication to City Traffic Management Center for corridors identified in the City's ITS Master Plan
o Signal timing plans for the signals in the coordination group.
Chapter 4.10: Transportation, Circulation and Parking
Page 4.10-47 West Oakland Specific Plan – Draft EIR
Individual project applicants shall fund the cost of preparing and implementing the above measures. However, if the City adopts a transportation fee program prior to implementation of this mitigation measure, individual project applicants shall have the option to pay the applicable fee in lieu of implementing this mitigation measure and payment of the fee shall mitigate this impact to less than significant.
Resulting Level of Significance
Upon implementation, the intersection would improve the operations to LOS C during PM peak hour and the impact would be reduced to a level of less than significant. No secondary significant impacts would result from implementation of this measure.
Congestion Management Program (CMP) Network
Impact Trans-9: For a roadway segment of the Congestion Management Program (CMP) Network, the Specific Plan would not cause (a) the LOS to degrade from LOS E or better to LOS F or (b) the V/C ratio to increase 0.03 or more for a roadway segment that would operate at LOS F without the Project. (LTS)
Since the Specific Plan has the potential to generate more than 100 peak hour trips, the impacts of the plan on the regional transportation system were assessed using the Alameda County Transportation Commission Countywide Travel Demand Model for year 2020 and 2035 conditions. The impact analysis for roadways includes all MTS roadways and CMP-designated roadways in the Plan Area. This is consistent with the guidelines of the 2011 Congestion Management Program.
The traffic forecasts were based on the current version of the Countywide Model, which uses Association of Bay Area Government’s (ABAG) Projections 2009 socio-economic forecasts. The Specific Plan’s proposed land use changes were assumed to occur gradually and proportionally with the full impact of the Project to occur by 2035. The resulting socio-economic data for the Specific Plan area was added into the model for the 2020 and 2035 forecasts for all traffic analysis zones within the Plan Area.
For the CMP analysis, traffic estimates were calculated for the Specific Plan using the model and then compared against 2020 and 2035 no-project volumes. The model was used to calculate trip generation, trip distribution, mode choice, and trip assignment of project trips from/to the study area. The results were summarized for roadway systems and potential impacts were identified. Roadway impacts were evaluated at the locations identified by Alameda CTC staff in their comment letter to the Notice of Preparation.
The traffic baseline forecasts for 2020 & 2035 were extracted for the PM peak hour at the required CMP and MTS highway segments from the Countywide Travel Model. The PM peak hour was evaluated in compliance with Alameda CTC CMP requirements. The PM peak hour volumes, volume-to-capacity ratios and level of service for Year 2020 baseline and with Project conditions are presented in Table 4.10-9 and Table 4.10-10. The results for Year 2035 baseline and with Project conditions are presented in Table 4.10-11 and Table 4.10-12.
Under Year 2020 conditions, all studied roadways would operate at LOS E or better with the exception of San Pablo Avenue north of 35th Street, which would operate at LOS F on both directions under both baseline and with Project scenarios. However, the v/c ratios would remain the same between the two scenarios at 1.14 and 1.16 on the northbound and southbound directions, respectively. Therefore, the Project impact is less-than-significant under Year 2020 conditions.
Chapter 4.10: Transportation, Circulation and Parking
West Oakland Specific Plan – Draft EIR Page 4.10-48
Under Year 2035 conditions, two studied segments would operate at LOS F under both baseline and with Project scenarios. The I-880 segment south of Oak Street has a v/c ratio of 1.01 on the northbound direction under both scenarios and the San Pablo Avenue north of 35th Street segment is projected to have v/c ratios of 1.13 and 1.16 on the northbound and southbound directions, respectively, under both scenarios. Since the v/c ratios remain unchanged, the Project impact is less-than-significant under Year 2035 conditions.
Mitigation Measures
None required.
Travel Times for AC Transit
Impact Trans-10: The Specific Plan would increase travel times for AC Transit buses along West Grand Avenue. (LTS)
The City of Oakland has a general threshold for transit travel time, but no numerical threshold for “substantially increased travel times.” This is due to the nature of transit, as discussed in the following points:
• Bus service, in general, is extremely transitory, and can change quite frequently, as is the case with AC Transit’s bus network. Existing routes may be eliminated, or new routes may be put in service by the time the Broadway Valdez Development Program is built out.
• Similar to parking, transit service is not part of the physical environment, and can change over time in response to external factors. In fact, AC Transit has generally reduced its bus service over the past few years in response to budget issues.
• Unlike the situation for intersections or roadway facilities, there are no well-established methodologies for characterizing the operations of transit service in relation to travel times. For intersections, clear distinctions are made between intersections that operate at acceptable conditions (e.g., LOS D or better) and those that operate at unacceptable conditions (e.g., LOS E or LOS F), and separate impact thresholds are provided. For bus service, however, there is no well-established LOS equivalent for characterizing transit service in relation to travel times.
A quantitative analysis was performed to determine how the Specific Plan would affect transit travel times for three bus routes serving selected major arterial streets in West Oakland under Existing plus Project conditions. The three AC Transit routes are:
• Route NL runs along West Grand Avenue and operates with headways as low as 19 minutes during the weekday peak periods
• Route 26 runs along Adeline Street and operates with headways as low as 20 minutes during weekday peak periods
• Route 62 which operates with headways as low as 20 minutes during weekday peak periods and runs along 7th Street
Table 4.10-13 shows peak-hour travel times on the corridors that these buses operate. Existing average travel speeds range from about 16 miles per hours along Adeline Street between West Grand Avenue and 7th Street in the AM peak hour to about 22 miles per hour along West Grand Avenue between I-880 Frontage and Market Street in the AM peak hour. With the addition of the Project, the average travel speeds range from about 14 miles per hour along 7th Street between Mandela Parkway and Market

Chapter 4.10: Transportation, Circulation and Parking
Page 4.10-49 West Oakland Specific Plan – Draft EIR
Street in the PM peak hour to about 18 miles per hour along Adeline Street between West Grand Avenue and 7th Street in the PM peak hour and along 7th Street between Market Street and Mandela Parkway in the AM peak hour.

Chapter 4.10: Transportation, Circulation and Parking
West Oakland Specific Plan – Draft EIR Page 4.10-50
Table 4.10-9 CMP/MTS Segment Evaluation Year 2020 – PM Peak Hour – No Project Scenario
NB/EB SB/WB Facility
Type Segment Volume Capacity V/C Lanes LOS Volume Capacity V/C Lanes LOS
Interstate/State Highways
I-880 - north of 7th St 3,950 6,200 0.64 3 C 4,299 6,200 0.69 3 C FWY
I-880 - south of 7th St 4,691 6,200 0.76 3 D 4,813 6,200 0.78 3 D FWY
I-880 - north of I-980 4,468 6,200 0.72 3 C 4,074 6,200 0.66 3 C FWY
I-880 - south of Oak St 7,561 8,400 0.90 4 E 7,947 10,580 0.75 5 D FWY
I-580 - east of I-980 7,611 10,580 0.72 5 C 8,699 10,580 0.82 5 D FWY
I-580 - west of I-980 7,059 10,580 0.67 5 C 8,442 10,580 0.80 5 D FWY
I-980 - south of 27th Ave 6,164 10,580 0.58 5 C 4,276 10,580 0.40 5 B FWY
Arterials
San Pablo Ave - north of 35th St 2,035 1,780 1.14 2 F 2,062 1,780 1.16 2 F Class 2
West Grand Ave - west of I-980 1,381 2,670 0.52 3 C 653 2,670 0.24 3 C Class 2
West Grand Ave - west of Poplar St 1,973 2,670 0.74 3 C 1,099 2,670 0.41 3 C Class 2
7th St - West of Market St 1,312 2,670 0.49 3 C 872 2,670 0.33 3 C Class 2
7th St - West of Peralta St 568 1,780 0.32 2 C 304 1,780 0.17 2 C Class 2
14th St - West of Market St 8 1,780 0.00 2 B 113 1,780 0.06 2 B Class 2
14th St - West of Poplar St 9 1,780 0.01 2 B 10 1,780 0.01 2 B Class 2
Brush St - south of 11th St 987 2,670 0.37 3 C Class 2
Adeline St - north of West Grand Av 4 1,780 0.00 2 B 12 1,780 0.01 2 B Class 2
MLK Jr Way- north of 27th Ave 61 1,780 0.03 2 B 40 1,780 0.02 2 B Class 2 Source: Kittelson & Associates
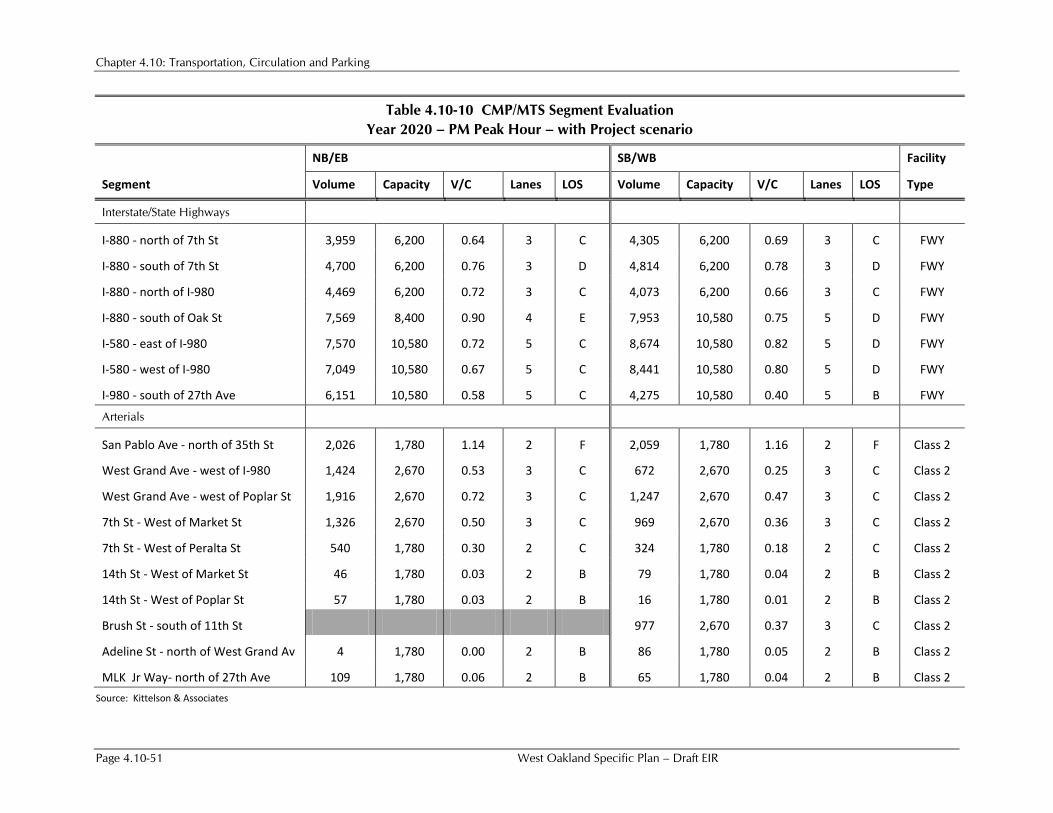
Chapter 4.10: Transportation, Circulation and Parking
Page 4.10-51 West Oakland Specific Plan – Draft EIR
Table 4.10-10 CMP/MTS Segment Evaluation Year 2020 – PM Peak Hour – with Project scenario
NB/EB SB/WB Facility
Segment Volume Capacity V/C Lanes LOS Volume Capacity V/C Lanes LOS Type
Interstate/State Highways
I-880 - north of 7th St 3,959 6,200 0.64 3 C 4,305 6,200 0.69 3 C FWY
I-880 - south of 7th St 4,700 6,200 0.76 3 D 4,814 6,200 0.78 3 D FWY
I-880 - north of I-980 4,469 6,200 0.72 3 C 4,073 6,200 0.66 3 C FWY
I-880 - south of Oak St 7,569 8,400 0.90 4 E 7,953 10,580 0.75 5 D FWY
I-580 - east of I-980 7,570 10,580 0.72 5 C 8,674 10,580 0.82 5 D FWY
I-580 - west of I-980 7,049 10,580 0.67 5 C 8,441 10,580 0.80 5 D FWY
I-980 - south of 27th Ave 6,151 10,580 0.58 5 C 4,275 10,580 0.40 5 B FWY
Arterials
San Pablo Ave - north of 35th St 2,026 1,780 1.14 2 F 2,059 1,780 1.16 2 F Class 2
West Grand Ave - west of I-980 1,424 2,670 0.53 3 C 672 2,670 0.25 3 C Class 2
West Grand Ave - west of Poplar St 1,916 2,670 0.72 3 C 1,247 2,670 0.47 3 C Class 2
7th St - West of Market St 1,326 2,670 0.50 3 C 969 2,670 0.36 3 C Class 2
7th St - West of Peralta St 540 1,780 0.30 2 C 324 1,780 0.18 2 C Class 2
14th St - West of Market St 46 1,780 0.03 2 B 79 1,780 0.04 2 B Class 2
14th St - West of Poplar St 57 1,780 0.03 2 B 16 1,780 0.01 2 B Class 2
Brush St - south of 11th St 977 2,670 0.37 3 C Class 2
Adeline St - north of West Grand Av 4 1,780 0.00 2 B 86 1,780 0.05 2 B Class 2
MLK Jr Way- north of 27th Ave 109 1,780 0.06 2 B 65 1,780 0.04 2 B Class 2 Source: Kittelson & Associates

Chapter 4.10: Transportation, Circulation and Parking
West Oakland Specific Plan – Draft EIR Page 4.10-52
Table 4.10-11 CMP/MTS Segment Evaluation Year 2035 – PM Peak Hour – No Project scenario
NB/EB SB/WB Facility
Segment Volume Capacity V/C Lanes LOS Volume Capacity V/C Lanes LOS Type
Interstate/State Highways
I-880 - north of 7th St 4,276 6,200 0.69 3 C 4,749 6,200 0.77 3 D FWY
I-880 - south of 7th St 5,394 6,200 0.87 3 D 5,457 6,200 0.88 3 D FWY
I-880 - north of I-980 4,676 6,200 0.75 3 D 4,093 6,200 0.66 3 C FWY
I-880 - south of Oak St 8,494 8,400 1.01 4 F 8,845 10,580 0.84 5 D FWY
I-580 - east of I-980 8,230 10,580 0.78 5 D 9,017 10,580 0.85 5 D FWY
I-580 - west of I-980 8,342 10,580 0.79 5 D 9,093 10,580 0.86 5 D FWY
I-980 - south of 27th Ave 6,296 10,580 0.60 5 C 4,702 10,580 0.44 5 B FWY
Arterials
San Pablo Ave - north of 35th St
2,020 1,780 1.13 2 F 2,062 1,780 1.16 2 F Class 2
West Grand Ave - west of I-980
2,565 2,670 0.96 3 E 1,203 2,670 0.45 3 C Class 2
West Grand Ave - west of Poplar St
2,903 2,670 1.09 3 F 2,025 2,670 0.76 3 C Class 2
7th St - West of Market St 2,056 2,670 0.77 3 C 2,002 2,670 0.75 3 C Class 2
7th St - West of Peralta St 1,478 1,780 0.83 2 D 879 1,780 0.49 2 C Class 2
14th St - West of Market St 50 1,780 0.03 2 B 119 1,780 0.07 2 B Class 2
14th St - West of Poplar St 23 1,780 0.01 2 B 24 1,780 0.01 2 B Class 2
Brush St - south of 11th St 1,040 2,670 0.39 3 C Class 2

Chapter 4.10: Transportation, Circulation and Parking
Page 4.10-53 West Oakland Specific Plan – Draft EIR
Table 4.10-11 CMP/MTS Segment Evaluation Year 2035 – PM Peak Hour – No Project scenario
NB/EB SB/WB Facility
Segment Volume Capacity V/C Lanes LOS Volume Capacity V/C Lanes LOS Type
Adeline St - north of West Grand Av
49 1,780 0.03 2 B 130 1,780 0.07 2 B Class 2
MLK Jr Way- north of 27th Ave
109 1,780 0.06 2 B 101 1,780 0.06 2 B Class 2
Source: Kittelson & Associates
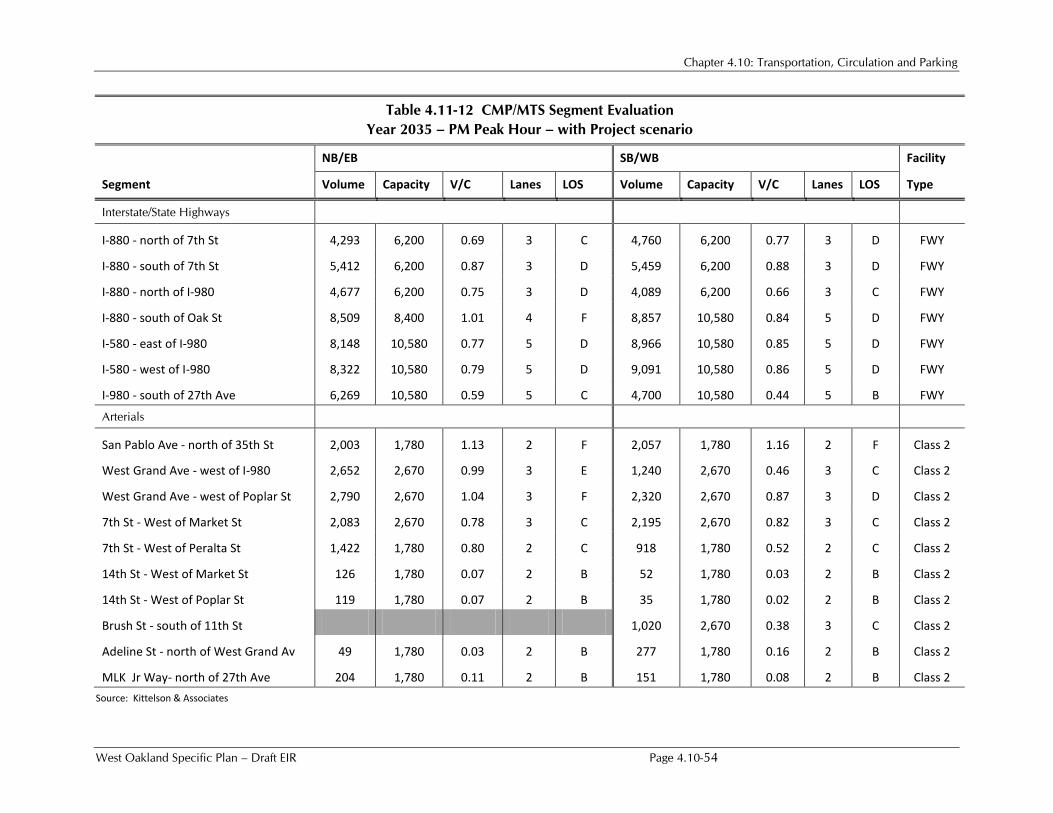
Chapter 4.10: Transportation, Circulation and Parking
West Oakland Specific Plan – Draft EIR Page 4.10-54
Table 4.11-12 CMP/MTS Segment Evaluation Year 2035 – PM Peak Hour – with Project scenario
NB/EB SB/WB Facility
Segment Volume Capacity V/C Lanes LOS Volume Capacity V/C Lanes LOS Type
Interstate/State Highways
I-880 - north of 7th St 4,293 6,200 0.69 3 C 4,760 6,200 0.77 3 D FWY
I-880 - south of 7th St 5,412 6,200 0.87 3 D 5,459 6,200 0.88 3 D FWY
I-880 - north of I-980 4,677 6,200 0.75 3 D 4,089 6,200 0.66 3 C FWY
I-880 - south of Oak St 8,509 8,400 1.01 4 F 8,857 10,580 0.84 5 D FWY
I-580 - east of I-980 8,148 10,580 0.77 5 D 8,966 10,580 0.85 5 D FWY
I-580 - west of I-980 8,322 10,580 0.79 5 D 9,091 10,580 0.86 5 D FWY
I-980 - south of 27th Ave 6,269 10,580 0.59 5 C 4,700 10,580 0.44 5 B FWY
Arterials
San Pablo Ave - north of 35th St 2,003 1,780 1.13 2 F 2,057 1,780 1.16 2 F Class 2
West Grand Ave - west of I-980 2,652 2,670 0.99 3 E 1,240 2,670 0.46 3 C Class 2
West Grand Ave - west of Poplar St 2,790 2,670 1.04 3 F 2,320 2,670 0.87 3 D Class 2
7th St - West of Market St 2,083 2,670 0.78 3 C 2,195 2,670 0.82 3 C Class 2
7th St - West of Peralta St 1,422 1,780 0.80 2 C 918 1,780 0.52 2 C Class 2
14th St - West of Market St 126 1,780 0.07 2 B 52 1,780 0.03 2 B Class 2
14th St - West of Poplar St 119 1,780 0.07 2 B 35 1,780 0.02 2 B Class 2
Brush St - south of 11th St 1,020 2,670 0.38 3 C Class 2
Adeline St - north of West Grand Av 49 1,780 0.03 2 B 277 1,780 0.16 2 B Class 2
MLK Jr Way- north of 27th Ave 204 1,780 0.11 2 B 151 1,780 0.08 2 B Class 2 Source: Kittelson & Associates

Chapter 4.10: Transportation, Circulation and Parking
West Oakland Specific Plan – Draft EIR Page 4.10-55
Table 4.10- 13 Travel Times Along AC Transit Corridors
Bus Direction Distance Peak Hour
Existing Existing Plus Project Travel Time (sec)
Average Speed (mph)
Travel Time (sec)
Average Speed (mph)
NL
To Eastmont Transit Center
0.91
AM 150.2 21.8 185.7 17.6
(Along Grand Avenue from I-880 Frontage to Market Street)
PM 153.4 21.4 262.6 12.5
To San Francisco AM 151.0 21.7 189.1 17.3
(Along Grand Avenue from Market Street to I-880 Frontage)
PM 156.5 20.9 201.5 16.3
26
To Grand Lake District
0.84
AM 193.1 15.7 170.1 17.8
(Along Adeline Street from Grand Avenue to 7th Street)
PM 184.7 16.4 166.7 18.1
Emeryville Public Market AM 167.3 18.1 172.3 17.6
(Along Adeline Street from 7th Street to Grand Avenue)
PM 167.9 18.0 174.9 17.3
62
To Fruitvale BART
0.61
AM 124.2 17.7 128.8 17.0
(Along 7th Street from Mandela Parkway to Market Street)
PM 136.1 16.1 156.7 14.0
To West Oakland BART AM 124.5 17.6 121.4 18.1
(Along 7th Street from Market Street to Mandela Parkway)
PM 121.9 18.0 136.9 16.0
1. Note: Corridor travel times were calculated using intersection delay and free-flow segment speeds from Synchro 8.0.
2. Source: Kittelson & Associates, 2013.
The Specific Plan would result in improved travel time along Adeline Street in the northbound direction during both peak periods and along 7th Street in the southbound direction during the AM peak hour. Travel time would increase along other corridors and time periods in varying levels. For example, the travel time along 7th Street would increase by just over 4.5 seconds in the eastbound direction during AM peak hour and by 15 seconds in the westbound direction during the PM peak hour. In combination with increased traffic under Specific Plan buildout, the proposed lane reduction along West Grand Avenue consistent with Oakland’s complete streets policy would result in delay along West Grand Avenue, particularly at the West Grand Avenue intersections of I-880 Frontage Road and Market Street, which would increase travel times for Route NL, the only AC Transit route along this segment of the West Grand Avenue corridor. Travel speed decreases along West Grand Avenue by almost nine mph in the eastbound direction for the PM peak hour which correspond to an increase of 1 minute 50 seconds in travel time. This represents an almost 42 percent decrease in the travel speed and 71 percent increase in travel time in this segment of West Grand Avenue for Route NL. During the other time
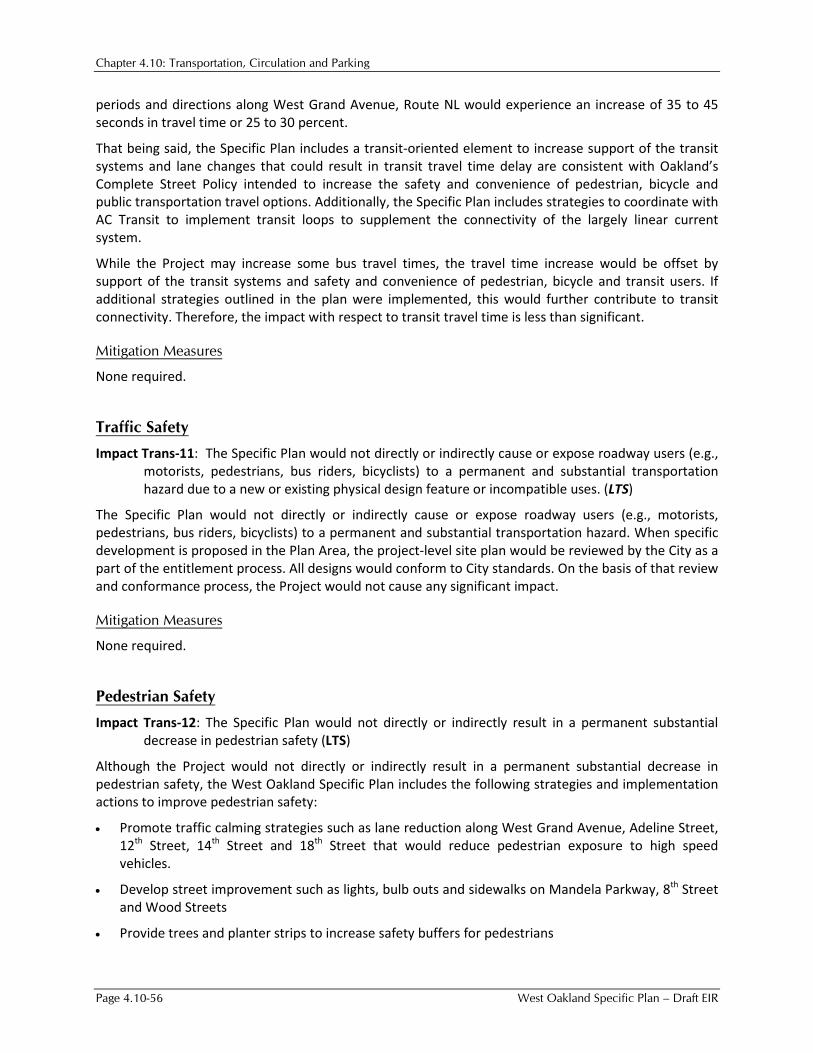
Chapter 4.10: Transportation, Circulation and Parking
Page 4.10-56 West Oakland Specific Plan – Draft EIR
periods and directions along West Grand Avenue, Route NL would experience an increase of 35 to 45 seconds in travel time or 25 to 30 percent.
That being said, the Specific Plan includes a transit-oriented element to increase support of the transit systems and lane changes that could result in transit travel time delay are consistent with Oakland’s Complete Street Policy intended to increase the safety and convenience of pedestrian, bicycle and public transportation travel options. Additionally, the Specific Plan includes strategies to coordinate with AC Transit to implement transit loops to supplement the connectivity of the largely linear current system.
While the Project may increase some bus travel times, the travel time increase would be offset by support of the transit systems and safety and convenience of pedestrian, bicycle and transit users. If additional strategies outlined in the plan were implemented, this would further contribute to transit connectivity. Therefore, the impact with respect to transit travel time is less than significant.
Mitigation Measures
None required.
Traffic Safety
Impact Trans-11: The Specific Plan would not directly or indirectly cause or expose roadway users (e.g., motorists, pedestrians, bus riders, bicyclists) to a permanent and substantial transportation hazard due to a new or existing physical design feature or incompatible uses. (LTS)
The Specific Plan would not directly or indirectly cause or expose roadway users (e.g., motorists, pedestrians, bus riders, bicyclists) to a permanent and substantial transportation hazard. When specific development is proposed in the Plan Area, the project-level site plan would be reviewed by the City as a part of the entitlement process. All designs would conform to City standards. On the basis of that review and conformance process, the Project would not cause any significant impact.
Mitigation Measures
None required.
Pedestrian Safety
Impact Trans-12: The Specific Plan would not directly or indirectly result in a permanent substantial decrease in pedestrian safety (LTS)
Although the Project would not directly or indirectly result in a permanent substantial decrease in pedestrian safety, the West Oakland Specific Plan includes the following strategies and implementation actions to improve pedestrian safety:
• Promote traffic calming strategies such as lane reduction along West Grand Avenue, Adeline Street, 12th Street, 14th Street and 18th Street that would reduce pedestrian exposure to high speed vehicles.
• Develop street improvement such as lights, bulb outs and sidewalks on Mandela Parkway, 8th Street and Wood Streets
• Provide trees and planter strips to increase safety buffers for pedestrians
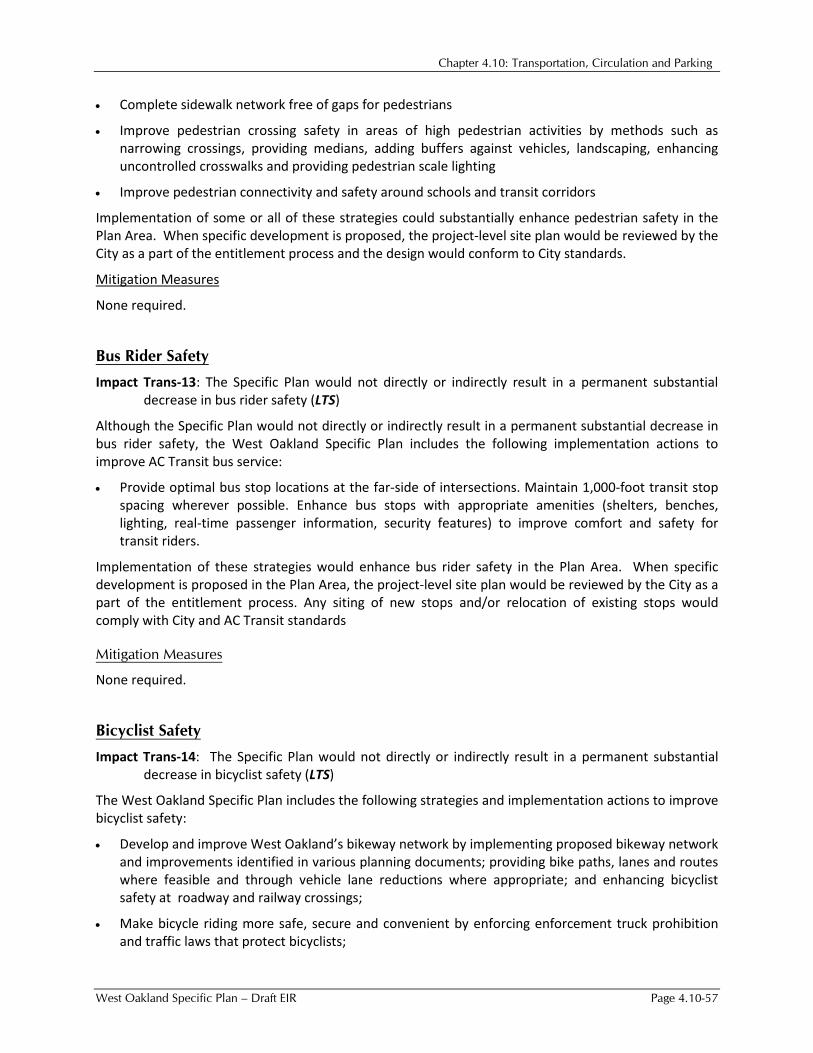
Chapter 4.10: Transportation, Circulation and Parking
West Oakland Specific Plan – Draft EIR Page 4.10-57
• Complete sidewalk network free of gaps for pedestrians
• Improve pedestrian crossing safety in areas of high pedestrian activities by methods such as narrowing crossings, providing medians, adding buffers against vehicles, landscaping, enhancing uncontrolled crosswalks and providing pedestrian scale lighting
• Improve pedestrian connectivity and safety around schools and transit corridors
Implementation of some or all of these strategies could substantially enhance pedestrian safety in the Plan Area. When specific development is proposed, the project-level site plan would be reviewed by the City as a part of the entitlement process and the design would conform to City standards.
Mitigation Measures
None required.
Bus Rider Safety
Impact Trans-13: The Specific Plan would not directly or indirectly result in a permanent substantial decrease in bus rider safety (LTS)
Although the Specific Plan would not directly or indirectly result in a permanent substantial decrease in bus rider safety, the West Oakland Specific Plan includes the following implementation actions to improve AC Transit bus service:
• Provide optimal bus stop locations at the far-side of intersections. Maintain 1,000-foot transit stop spacing wherever possible. Enhance bus stops with appropriate amenities (shelters, benches, lighting, real-time passenger information, security features) to improve comfort and safety for transit riders.
Implementation of these strategies would enhance bus rider safety in the Plan Area. When specific development is proposed in the Plan Area, the project-level site plan would be reviewed by the City as a part of the entitlement process. Any siting of new stops and/or relocation of existing stops would comply with City and AC Transit standards
Mitigation Measures
None required.
Bicyclist Safety
Impact Trans-14: The Specific Plan would not directly or indirectly result in a permanent substantial decrease in bicyclist safety (LTS)
The West Oakland Specific Plan includes the following strategies and implementation actions to improve bicyclist safety:
• Develop and improve West Oakland’s bikeway network by implementing proposed bikeway network and improvements identified in various planning documents; providing bike paths, lanes and routes where feasible and through vehicle lane reductions where appropriate; and enhancing bicyclist safety at roadway and railway crossings;
• Make bicycle riding more safe, secure and convenient by enforcing enforcement truck prohibition and traffic laws that protect bicyclists;

Chapter 4.10: Transportation, Circulation and Parking
Page 4.10-58 West Oakland Specific Plan – Draft EIR
• Require development to provide adequate and secure bicycle parking, according or in excess of City Ordinance and standards;
Expand programs such as “expanding Cycles of Change” (a non-profit program which provides safety lessons to low-income students) into West Oakland to increase safety training opportunities. Implementation of these strategies would substantially enhance bicyclist safety in the Plan Area. When specific development is proposed in the Plan Area, the project-level site plan would be reviewed by the City as a part of the entitlement process. All designs would conform to City standards. On the basis of that review and conformance process, the Project would not cause any significant impact.
Mitigation Measures
None required.
Conflicts with City Policies
Impact Trans-15: The Specific Plan would not fundamentally conflict with adopted City policies, plans, or programs regarding public transit, bicycle, or pedestrian facilities adopted for the purpose of avoiding or mitigating an environmental effect and actually result in a physical change in the environment. (LTS)
The Specific Plan and the associated mitigation measures are consistent with adopted City policies, plans and programs supporting public transit, bicycle, or pedestrian and would not result in a significant impact.
The Specific Plan would promote the City’s General Plan objectives and policies by facilitating a “complete streets” network to support targeted growth in the Plan Area and to strengthen the West Oakland neighborhood. The Specific Plan would enhance the pedestrian experience by supporting streetscape improvement plans, encouraging completion of the sidewalk network and crossing safety, and encouraging pedestrian connections between activities centers. The Specific Plan also encourages development of West Oakland’s bikeway network and provision of bicycle parking and storage at key locations. The Specific Plan aims to improve AC Transit bus service by working with AC Transit to enhance transit connections with streetcar, light rail, buses or shuttles between West Oakland BART station and Emeryville along Mandela Parkway and 3rd Street and development transit-oriented development that would help achieving the objective of the City’s Public Transit and Other Alternatives to Single-Occupant Vehicles Policy (aka Transit First Policy) (1996) of shifting trips from private vehicles to public transit.
Mitigation Measures
None Required.
Construction Period Effects
Impact Trans-16: The Specific Plan would result in a substantial, though temporary adverse effect on the circulation system during construction. (LTS, with SCAs)
The Specific Plan will be implemented over a long period of time in multiple phases. New development under the Specific Plan would require the construction of both new buildings as well as supporting transportation infrastructure such as new paving and infrastructure replacement, sidewalk, median, and curb ramp improvements, lane and crosswalk striping/re-striping, road diets reduction, bike lanes, and a
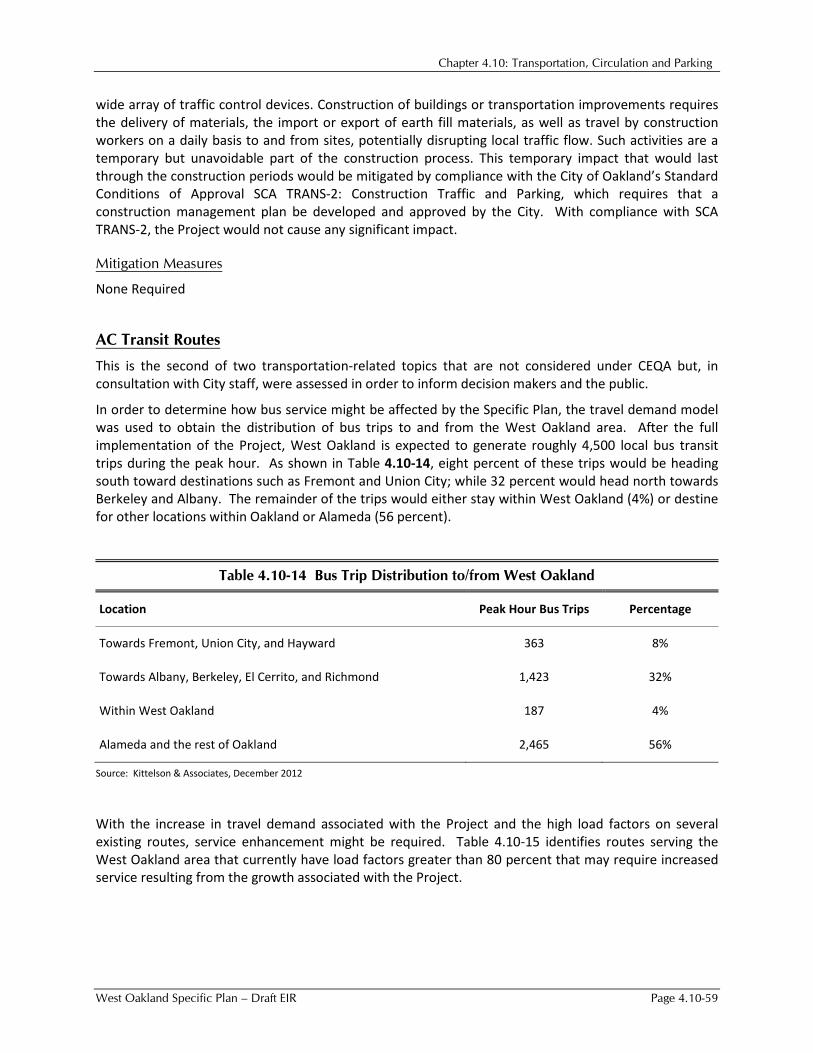
Chapter 4.10: Transportation, Circulation and Parking
West Oakland Specific Plan – Draft EIR Page 4.10-59
wide array of traffic control devices. Construction of buildings or transportation improvements requires the delivery of materials, the import or export of earth fill materials, as well as travel by construction workers on a daily basis to and from sites, potentially disrupting local traffic flow. Such activities are a temporary but unavoidable part of the construction process. This temporary impact that would last through the construction periods would be mitigated by compliance with the City of Oakland’s Standard Conditions of Approval SCA TRANS-2: Construction Traffic and Parking, which requires that a construction management plan be developed and approved by the City. With compliance with SCA TRANS-2, the Project would not cause any significant impact.
Mitigation Measures
None Required
AC Transit Routes
This is the second of two transportation-related topics that are not considered under CEQA but, in consultation with City staff, were assessed in order to inform decision makers and the public.
In order to determine how bus service might be affected by the Specific Plan, the travel demand model was used to obtain the distribution of bus trips to and from the West Oakland area. After the full implementation of the Project, West Oakland is expected to generate roughly 4,500 local bus transit trips during the peak hour. As shown in Table 4.10-14, eight percent of these trips would be heading south toward destinations such as Fremont and Union City; while 32 percent would head north towards Berkeley and Albany. The remainder of the trips would either stay within West Oakland (4%) or destine for other locations within Oakland or Alameda (56 percent).
Table 4.10-14 Bus Trip Distribution to/from West Oakland
Location Peak Hour Bus Trips Percentage
Towards Fremont, Union City, and Hayward 363 8%
Towards Albany, Berkeley, El Cerrito, and Richmond 1,423 32%
Within West Oakland 187 4%
Alameda and the rest of Oakland 2,465 56%
Source: Kittelson & Associates, December 2012
With the increase in travel demand associated with the Project and the high load factors on several existing routes, service enhancement might be required. Table 4.10-15 identifies routes serving the West Oakland area that currently have load factors greater than 80 percent that may require increased service resulting from the growth associated with the Project.
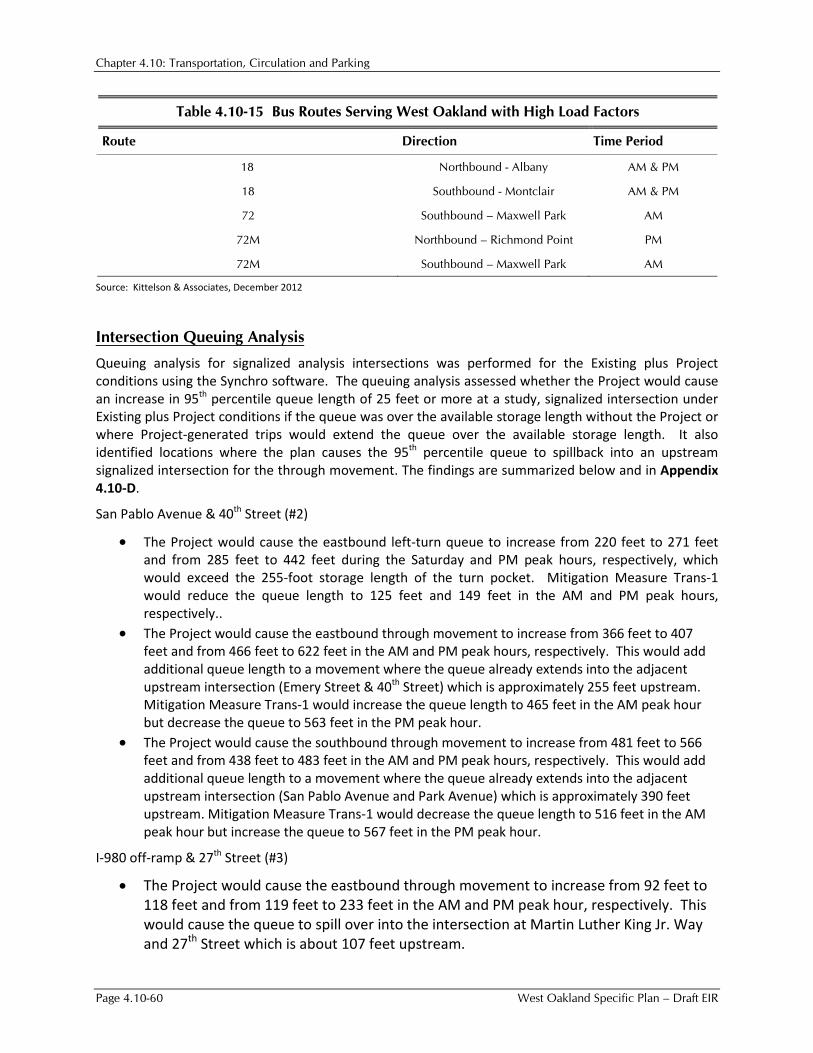
Chapter 4.10: Transportation, Circulation and Parking
Page 4.10-60 West Oakland Specific Plan – Draft EIR
Table 4.10-15 Bus Routes Serving West Oakland with High Load Factors
Route Direction Time Period
18 Northbound - Albany AM & PM
18 Southbound - Montclair AM & PM
72 Southbound – Maxwell Park AM
72M Northbound – Richmond Point PM
72M Southbound – Maxwell Park AM
Source: Kittelson & Associates, December 2012
Intersection Queuing Analysis
Queuing analysis for signalized analysis intersections was performed for the Existing plus Project conditions using the Synchro software. The queuing analysis assessed whether the Project would cause an increase in 95th percentile queue length of 25 feet or more at a study, signalized intersection under Existing plus Project conditions if the queue was over the available storage length without the Project or where Project-generated trips would extend the queue over the available storage length. It also identified locations where the plan causes the 95th percentile queue to spillback into an upstream signalized intersection for the through movement. The findings are summarized below and in Appendix 4.10-D.
San Pablo Avenue & 40th Street (#2)
• The Project would cause the eastbound left-turn queue to increase from 220 feet to 271 feet and from 285 feet to 442 feet during the Saturday and PM peak hours, respectively, which would exceed the 255-foot storage length of the turn pocket. Mitigation Measure Trans-1 would reduce the queue length to 125 feet and 149 feet in the AM and PM peak hours, respectively..
• The Project would cause the eastbound through movement to increase from 366 feet to 407 feet and from 466 feet to 622 feet in the AM and PM peak hours, respectively. This would add additional queue length to a movement where the queue already extends into the adjacent upstream intersection (Emery Street & 40th Street) which is approximately 255 feet upstream. Mitigation Measure Trans-1 would increase the queue length to 465 feet in the AM peak hour but decrease the queue to 563 feet in the PM peak hour.
• The Project would cause the southbound through movement to increase from 481 feet to 566 feet and from 438 feet to 483 feet in the AM and PM peak hours, respectively. This would add additional queue length to a movement where the queue already extends into the adjacent upstream intersection (San Pablo Avenue and Park Avenue) which is approximately 390 feet upstream. Mitigation Measure Trans-1 would decrease the queue length to 516 feet in the AM peak hour but increase the queue to 567 feet in the PM peak hour.
I-980 off-ramp & 27th Street (#3)
• The Project would cause the eastbound through movement to increase from 92 feet to 118 feet and from 119 feet to 233 feet in the AM and PM peak hour, respectively. This would cause the queue to spill over into the intersection at Martin Luther King Jr. Way and 27th Street which is about 107 feet upstream.

Chapter 4.10: Transportation, Circulation and Parking
West Oakland Specific Plan – Draft EIR Page 4.10-61
I-980 on-ramp & 27th Street (#4)
• The Project would cause the eastbound left-turn queue to increase from 226 feet to 487 feet during the PM peak hour, which would exceed the 150-foot storage length of the turn pocket.
• The Project would cause the westbound right-turn queue to increase from 228 feet to 284 feet in the PM peak hour which would exceed the 265-foot storage length.
Market Street & West Grand Avenue (#9)
• The Project would cause the northbound left-turn queue to increase from 65 feet to 322 feet and from 95 to 239 in the AM and PM peak hours, respectively, and to exceed the 104-foot storage length of the turn pocket.
San Pablo Avenue & West Grand Avenue (#10)
• The Project would cause the northbound left-turn queue to increase from 284 feet to 319 feet in the PM peak hour, which exceed the 80-foot storage length of the turn pocket.
Martin Luther King Jr. Way & West Grand Avenue (#11)
• The Project would cause the northbound right-turn queue to increase from 59 feet to 157 feet in the PM peak hour, which exceeds the 50-foot storage length of the turn pocket.
Northgate Avenue & West Grand Avenue (#12)
• The Project would cause the eastbound left-turn queue to increase from 171 feet to 597 feet in the PM peak hour, which exceed the 205-foot storage length of the turn pocket.
Broadway & West Grand Avenue (#13)
• The Project would cause the northbound left-turn queue to increase from 160 feet to 207 feet in the PM peak hour, which exceed the 150-foot storage length of the turn pocket.
Frontage Road & 7th Street (#19)
• The Project would cause the southbound left-turn queue to increase from 88 feet to 233 feet and from 85 feet to 287 feet during the AM and PM peak hours, respectively, and to exceed the 175-foot storage length of the turn pocket.
Market Street & 7th Street (#22)
• The Project would cause the northbound left-turn queue to increase from 79 feet to 282 feet and from 82 feet to 253 feet during the AM and PM peak hours, respectively. This would result in the queue extending into the upstream intersection of Market Street and 5th Street which is approximately 160 feet upstream.
Adeline Street & 5h Street (#24)
• The Project would cause the southbound left-turn queue to increase from 80 feet to 194 feet in the AM peak hour and from 74 feet to 183 feet in the PM peak hour exceeding the 150-foot storage length of the turn pocket.