exhibit w - cwrmbssettlement.comcwrmbssettlement.com/docs/148 - credit suisse analyst note...
TRANSCRIPT

Exhibit W
FILED: NEW YORK COUNTY CLERK 08/26/2016 04:13 PM INDEX NO. 150973/2016
NYSCEF DOC. NO. 148 RECEIVED NYSCEF: 08/26/2016

ANALYST CERTIFICATIONS AND IMPORTANT DISCLOSURES ARE IN THE DISCLOSURE APPENDIX. FOR OTHER IMPORTANT DISCLOSURES, PLEASE REFER TO https://firesearchdisclosure.credit-suisse.com.
ABX and RMBS November Performance Update
Non-Agency RMBS Performance Highlights • Subprime CDRs declined 10% from 10.4% to 9.4% due to a combination of the
foreclosure moratorium in October and a 5% decline in day count. Most notable were the deals issued by GMAC-RFC, CW and Merrill Lynch – First Franklin shelves. CDR for CW shelf declined 26% from 8.6% to 6.4% CDR this month, Merrill Lynch CDR declined 40% from 10.7% to 6.4% and GMAC CDRs declined 17% from 10% to 8.2% this month. CDRs in fixed rate Alt-A and Prime sectors increased moderately but for Option ARMs, it declined in line with day-counts.
• Subsequent recoveries and repurchases continue to generate attention this month. Last month, we observed significant repurchase and make-whole payment activity for three deals (CWALT 2007-OA10, CWALT 2005-62 and FFMLT 2006-FF10. Both the Countrywide deals are wrapped by FSA). Both CW deals had large make-whole payments and repurchases this month as well. However, while principal leaked out to mezzanine classes last month for CWALT 2007-OA10, this month the subsequent recovery amount was not large enough to build OC to its target level, preventing principal from leaking out to the subs.
• Fixed Prime voluntary speeds continued to rise (by about 2 CPR this month to an average of 20 CPR) given the historically low interest rate environment. Notably seasoned fixed rate paper increased further to between 24 and 29 CPR this month – an average 10% increase from last month. However, Prime ARM speeds came in flat this month. Alt-A voluntary prepayment speeds were down for the month. Subprime and Option ARM voluntary speeds remain in the 1-2 VCPR range.
• Early delinquencies continued to rise by between 10-20 bps for most asset classes in November.
• Subprime severities increased 5% this month to 83% -the volatility in subprime severities is primarily driven by deals with lower CDRs. Prime and Alt-A severities were slightly higher this month while Option ARM severities declined.
ABX Performance Highlights • CDRs were mixed for the month. Later vintage ABX indices (07-1 and 07-2)
observed steep declines of 9% (from 12.2% to 11.2%) and 20% (from 11.4% to 9.1% this month), respectively. As a result of slower liquidations, we observed four deals that built up OC this month. We expect this built-up OC to be depleted again in the next few months as liquidations gain pace.
• Severities were higher this month for ABX, increasing by as much as five points for the 07-1 Index. As in prior months, several deals printed very high severities due to principal modifications (e.g., SABR 2006-H2 printed 114% severity). BSHE 06-H10 printed over 95% severity this month due largely to a high number of charged-off low loan balance loans.
• Early delinquency trends were mixed in ABX, with 07-2 continuing to post a 10 bps increase this month.
• Voluntary speeds were slightly higher from absolute low levels and continue to remain at the 1-2 VCPR range.
• Modification volume decreased for 06-1, 07-1 and 07-2, but was up for 06-2.
29 November 2010Fixed Income Research
http://www.credit-suisse.com/researchandanalytics
Contributors
Chandrajit BhattacharyaDirector
+1 212 325 [email protected]
Aashish MarfatiaVice President
+1 212 325 [email protected]
Thomas SuehrAssociate
+1 212 325 [email protected]

29 November 2010
ABX and RMBS November Performance Update 2
Table of contents ABX: Glance at Monthly Change in Key Performance Measurements 3
30-59 Delinquency Trend 4
Foreclosure and REO Trend 4
60+ Delinquency Trend (including bankruptcy, foreclosure, and REO) 4
Loan Modifications 5
ABX OC Shortfalls and Net Losses 6
Non-Agency Performance Snapshot 11
Prime (Fixed): Short-Term Performance Trends 12
Prime (Fixed): Long-Term Performance Trends 13
Prime (ARM): Short-Term Performance Trends 14
Prime (ARM): Long-Term Performance Trends 15
Alt-A (Fixed): Short-Term Performance Trends 16
Alt-A (Fixed): Long-Term Performance Trends 17
Alt-A (ARM): Short-Term Performance Trends 18
ALT-A (ARM): Long-Term Performance Trends 19
Option ARM: Short-Term Performance Trends 20
Option ARM: Long-Term Performance Trends 21
Subprime: Short-Term Performance Trends 22
Subprime: Long-Term Performance Trends 23

29 November 2010
ABX and RMBS November Performance Update 3
ABX: Glance at Monthly Change in Key Performance Measurements
Exhibit 1: 30-59 DPD were mostly flat this month Exhibit 2: 60+ were slightly higher
4.3 4.5 4.3 4.44.6 4.5 4.4 4.54.6 4.5 4.44.6
2
3
4
5
6
ABX 06-1 ABX 06-2 ABX 07-1 ABX 07-2
09/01/10 10/01/10 11/01/10
39.643.5
48.445.6
48.345.5
40.143.8
45.743.639.5
48.4
30
40
50
60
ABX 06-1 ABX 06-2 ABX 07-1 ABX 07-2
09/01/10 10/01/10 11/01/10
Source: Credit Suisse and remittance reports Source: Credit Suisse and remittance reports
Exhibit 3: VCPRs higher in November Exhibit 4: CDRs for later vintages were significantly
lower this month
1.3 1.2 1.11.4
1.71.4
1.3 1.2
1.7 1.51.3
1.6
0
1
2
3
ABX 06-1 ABX 06-2 ABX 07-1 ABX 07-2
09/01/10 10/01/10 11/01/10
11.0 11.0
13.2 12.710.8 11.4
9.211.2
9.1
12.29.3
11.1
5
10
15
20
ABX 06-1 ABX 06-2 ABX 07-1 ABX 07-2
09/01/10 10/01/10 11/01/10
Source: Credit Suisse and remittance reports Source: Credit Suisse and remittance reports
Exhibit 5: Severity were higher in November
Exhibit 6: Cumulative Losses Rise At Slower Pace
63.0
76.171.1 71.9
76.7 75.674.0
79.6 81.677.4
83.3
77.2
50
60
70
80
90
ABX 06-1 ABX 06-2 ABX 07-1 ABX 07-2
09/01/10 10/01/10 11/01/10
18.420.8
12.2
17.318.8
21.219.2
21.5
17.1
12.0
17.5
12.3
5
10
15
20
25
ABX 06-1 ABX 06-2 ABX 07-1 ABX 07-2
09/01/10 10/01/10 11/01/10
Source: Credit Suisse and remittance reports Source: Credit Suisse and remittance reports

29 November 2010
ABX and RMBS November Performance Update 4
30-59 Delinquency Trend
Exhibit 7: 30-59 DPD Trend Between 06-1 and 07-1 Exhibit 8: 30-59 DPD Trend Between 06-2 and 07-2
30-59 DQby Deal AgeLast Data Point is November10
0
2
4
6
8
10
3 7 11 15 19 23 27 31 35 39 43 47 51 55 59
Average deal age
% o
f Cur
rent
Bal
ance
ABX 06-1ABX 07-1
30-59 DQby Deal AgeLast Data Point is November-10
0
2
4
6
8
10
3 7 11 15 19 23 27 31 35 39 43 47 51 55Average deal age
% o
f Cur
rent
Bal
ance
ABX 06-2ABX 07-2
Source: Credit Suisse and remittance reports Source: Credit Suisse and remittance reports
Foreclosure and REO Trend Exhibit 9: Foreclosure % Across All Indices Exhibit 10: REO % Across All Indices
Foreclosure by Deal AgeLast Data Point is November-10
0
48
12
1620
24
28
32
3 7 11 15 19 23 27 31 35 39 43 47 51 55 59Average deal age
% o
f Cur
rent
Bal
ance
ABX 06-1ABX 06-2ABX 07-1ABX 07-2
REO by Deal AgeLast Data Point is November-10
0
3
6
9
12
15
18
3 7 11 15 19 23 27 31 35 39 43 47 51 55 59Average deal age
% o
f Cur
rent
Bal
ance
ABX 06-1ABX 06-2ABX 07-1ABX 07-2
Source: Credit Suisse and remittance reports Source: Credit Suisse and remittance reports
60+ Delinquency Trend (including bankruptcy, foreclosure, and REO)
Exhibit 11: 60+ DPD as % of Current Balance Exhibit 12: 60+ DPD as % of Original Balance
60+ DLQ (inc F/R/B) by Deal AgeLast Data Point is November-10
0
10
20
30
40
50
60
70
3 7 11 15 19 23 27 31 35 39 43 47 51 55 59Average deal age
% o
f Cur
rent
Bal
ance
ABX 06-1ABX 06-2ABX 07-1ABX 07-2
60+ DLQ (inc F/R/B) by Deal AgeLast Data Point is November-10
0
10
20
30
40
3 7 11 15 19 23 27 31 35 39 43 47 51 55 59
Average deal age
% o
f orig
inal
Bal
ance
ABX 06-1ABX 06-2ABX 07-1ABX 07-2
Source: Credit Suisse and remittance reports Source: Credit Suisse and remittance reports

29 November 2010
ABX and RMBS November Performance Update 5
Loan Modifications
Exhibit 13: Loan Mods in Current Month and Over Life for ABX 06-1 and 06-2
IntexTicker Trustee Name ServicerWALA in
November '10Mods in
November '10Mods in
October '10Cum. Loan
Mods% of Orig.
Loan Count IntexTicker Trustee Name ServicerWALA in
November '10Mods in
November '10Mods in
October '10Cum. Loan
Mods% of Orig.
Loan Countace05he7 Wells Fargo Bank Wells/Countrywide 62 15 25 753 8.4% ace06nc1 Wells Fargo Bank Saxon 62 8 11 664 9.6%amq05r11 Deutsche Bank Ameriquest 60 47 57 771 7.6% ars06w01 Deutsche Bank Ameriquest 60 61 14 970 9.3%ars05w02 Deutsche Bank Ameriquest 63 51 79 1156 7.7% bshe06h3 La Salle, IL Wells/EMC 59 3 450 11.3%bsh05h11 La Salle, IL EMC 64 3 13 703 14.7% cmlt06n1 Wells Fargo Bank Carrington 60 30 23 2611 38.3%cwhe05b5 The Bank of New YorkCountrywide 64 cwhe0608 The Bank of New York Countrywide 54 57ffm05f12 La Salle, IL First Franklin 61 0 20 147 1.6% ffml06f4 Deutsche Bank First Franklin 58gsa05he4 Deutsche Bank Chase 66 6 11 gsa06he3 Wells Fargo Bank SPS/Litton 58 52 2429 23.1%heat0508 U.S. Bank N.A. Wells/SPS 63 19 26 1071 13.4% heat0604 U.S. Bank N.A. SPS/Wells/Chase 59 26 18 1326 13.7%jpma05o1 The Bank of New YorkOption One 67 28 17 411 5.0% jpa06fr1 The Bank of New York Chase 60 5 26 176 3.6%lbml05w2 Deutsche Bank WAMU 66 12 10 lbml0601 Deutsche Bank WAMU 59 32mabs05n2 U.S. Bank N.A. Ocwen 62 mab06nc1 Wells Fargo Bank Wells 60 8 20 561 11.7%mlhe05a1 Deutsche Bank Wilshire 66 6 12 mlhe06h1 Wells Fargo Bank Wilshire 62 0 33 767 15.9%msab05h5 Wells Fargo Bank Countrywide/HomEq/Chase 65 4 5 411 4.6% msab06h2 Wells Fargo Bank Chase/Wells/HomEq 59 29 20 984 7.8%ncc05004 Deutsche Bank Carrington 64 28 29 1641 16.2% msab06w2 Wells Fargo Bank Wells 55 50 16 2329 18.1%rfc05ef4 U.S. Bank N.A. Homecomings 63 4 1 389 8.8% rfc06ks3 U.S. Bank N.A. Homecomings 58 208 11 900 12.3%rfc05k11 U.S. Bank N.A. Homecomings 62 1 2 863 9.4% rfc06nc2 U.S. Bank N.A. Homecomings 59 92 1 485 12.7%sabr05h1 Wells Fargo Bank Countrywide/HomEq 64 2 6 218 3.8% sabr06o1 Wells Fargo Bank Option One 64 32 189 952 13.7%sail05h3 U.S. Bank N.A. HomEq/Option One 66 14 13 0.0% sail0604 Wells Fargo Bank Option One/Wells/Ocwen 56 33 7 2044 16.3%sas05wf4 Wells Fargo Bank Wells 63 29 0 1062 7.7% sas06wf2 Wells Fargo Bank Wells 56 32 28 1753 16.7%svhe0504 Deutsche Bank Chase/Countywide/FirstFranklin 64 3 4 svhe06o5 Deutsche Bank Option One 55 127 78 1112 7.0%Index 64 272 330 9596 7.8% Index 58 796 584 20513 14.2%
ABX 06-1 ABX 06-2
Source: Credit Suisse and remittance reports
Exhibit 14: Loan Mods in Current Month and Over Life for ABX 07-1 and 07-2
IntexTicker Trustee Name ServicerWALA in
November '10Mods in
November '10Mods in
October '10Cum. Loan
Mods% of Orig.
Loan Count IntexTicker Trustee Name ServicerWALA in
November '10Mods in
November '10Mods in
October '10Cum. Loan
Mods% of Orig.
Loan Countabf06op2 Wells Fargo Bank Option One 51 25 9 1092 21.6% ace07he4 Wells Fargo Bank Ocwen/GMAC 46 3 6 771 16.2%ace06nc3 Wells Fargo Bank Countrywide 50 11 43 928 11.3% bsh07he3 La Salle, IL EMC 46 8 1170 26.3%bsh06h10 La Salle, IL EMC 49 8 1660 31.7% ctm07am2 Wells Fargo Bank GMAC/Ocwen/Countrywide 48 98 77 3394 32.7%cbs06cb6 U.S. Bank N.A. Litton 56 28 30 823 19.8% cwh07001 The Bank of New York Countrywide 46cmlt06n4 Wells Fargo Bank Carrington 52 112 4060 54.3% ffm07ff1 La Salle, IL First Franklin 47 19 53 367 3.7%ctm06wf3 Citidirect Wells 51 gsa07nc1 Wells Fargo Bank Litton 47 56 1689 18.0%cwhe0618 The Bank of New YorkCountrywide 52 47 heat0702 U.S. Bank N.A. SPS 47 26 35 2186 33.5%ffm06f13 Deutsche Bank First Franklin 52 30 21 674 6.0% hsa07nc1 Wells Fargo Bank Countrywide/Wells 46 23 33 1068 23.2%frhe0603 Deutsche Bank Wells 51 0 0 345 5.0% jpa07ch3 Deutsche Bank Chase 49 18 25gsa06he5 Wells Fargo Bank SPS/Goldman/Litton 53 47 25 1256 18.9% mlff0702 La Salle, IL First Franklin 44 20 63 493 4.9%heat0607 U.S. Bank N.A. SPS/Wells 52 16 5 1186 21.4% mlh07ml1 Deutsche Bank Wilshire 48 33 41jpa06ch2 The Bank of New YorkChase 53 20 0 503 4.9% msab07n3 Wells Fargo Bank Saxon/Countrywide 46 43 114 1330 19.6%lbml0606 Deutsche Bank WAMU 53 10 32 nfhe0702 Deutsche Bank NovaStar 42 81 65mab06nc3 Wells Fargo Bank HomEq 50 6 59 544 9.9% nmhe0702 Wells Fargo Bank Ocwen/Equity One 50 30 41 2059 40.1%mlhe06h5 La Salle, IL Wilshire/Indymac 53 2 173 221 3.1% oohe0705 Wells Fargo Bank Option One 44 78 75 2513 37.0%msab06h6 Deutsche Bank Countrywide/Wells 53 0 79 27 0.3% rfc07ks2 U.S. Bank N.A. Homecomings 48 41 1 1283 21.8%rfc06ks9 U.S. Bank N.A. Homecomings 50 235 28 1242 17.6% sabr07b4 Deutsche Bank HomEq 46 19sabr06h2 Wells Fargo Bank HomEq 54 14 0 547 9.8% sas07bc1 Wells Fargo Bank Chase/Option One/Aurora 48 18 0 1152 22.7%sas06bc4 Wells Fargo Bank Option One/Countrywide/Aurora 50 23 0 1221 16.1% svh07op1 Wells Fargo Bank Option One 44 58 137 4131 38.2%svhe06e1 Deutsche Bank Saxon 52 34 93 wamu07h2 Citidirect WAMU 45Index 52 613 652 16329 15.7% Index 46 616 822 23606 24.1%
ABX 07-1 ABX 07-2
Source: Credit Suisse and remittance reports

29 November 2010
ABX and RMBS November Performance Update 6
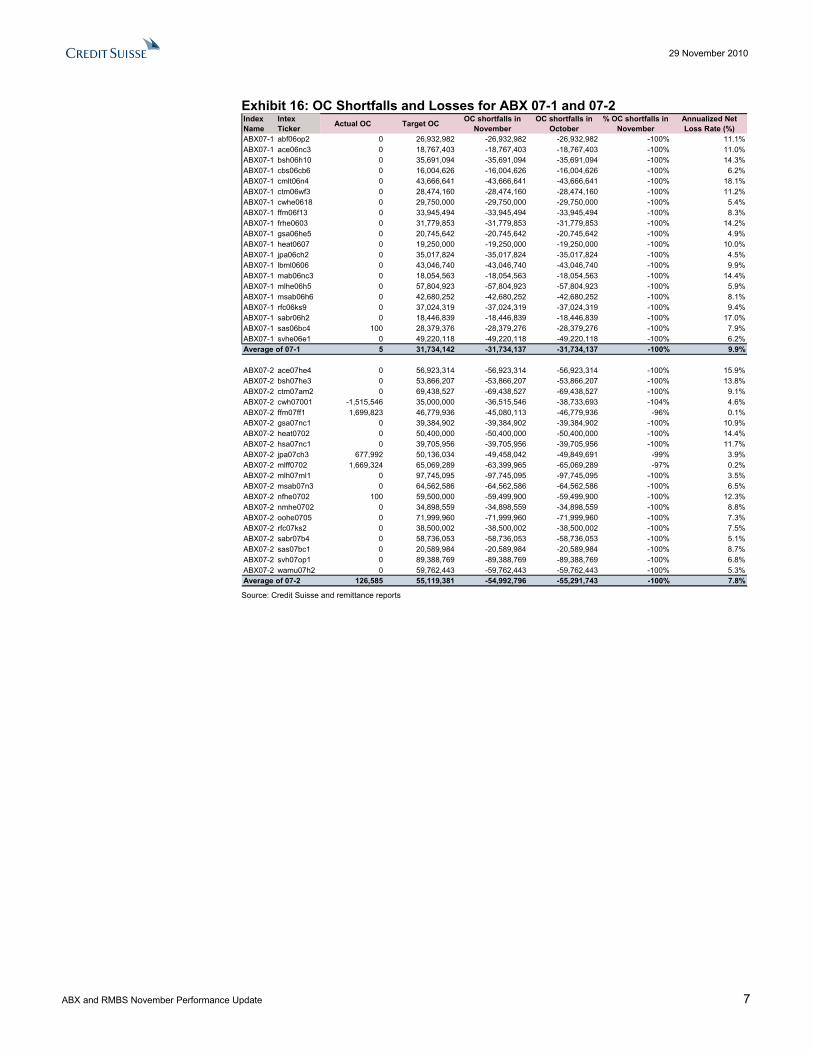
ABX OC Shortfalls and Net Losses The average deficiency ratios for each index were 99%, 95%, 100%, and 100%, respectively.
Exhibit 15: OC Shortfalls and Losses for ABX 06-1 and 06-2 Index Name
Intex Ticker Actual OC Target OC OC shortfalls in
NovemberOC shortfalls in
October% OC shortfalls in
NovemberAnnualized Net Loss Rate (%)
ABX06-1 ace05he7 0 60,219,984 -60,219,984 -60,219,984 -100% 10.2%ABX06-1 amq05r11 0 36,604,847 -36,604,847 -36,604,847 -100% 6.7%ABX06-1 ars05w02 0 38,500,127 -38,500,127 -38,500,127 -100% 6.6%ABX06-1 bsh05h11 0 24,680,355 -24,680,355 -24,642,104 -100% 13.2%ABX06-1 cwhe05b5 2,234,289 28,500,000 -26,265,711 -25,878,439 -92% 5.5%ABX06-1 ffm05f12 819,204 90,397,251 -89,578,047 -90,397,251 -99% 1.6%ABX06-1 gsa05he4 0 52,019,656 -52,019,656 -52,019,656 -100% 5.2%ABX06-1 heat0508 0 16,500,001 -16,500,001 -16,500,001 -100% 9.2%ABX06-1 jpma05o1 957,161 21,820,015 -20,862,854 -20,630,925 -96% 4.4%ABX06-1 lbml05w2 0 22,045,733 -22,045,733 -22,045,733 -100% 6.9%ABX06-1 mabs05n2 0 16,257,480 -16,257,480 -16,257,480 -100% 18.4%ABX06-1 mlhe05a1 0 45,993,639 -45,993,639 -45,993,639 -100% 4.3%ABX06-1 msab05h5 0 58,745,145 -58,745,145 -58,745,145 -100% 3.4%ABX06-1 ncc05004 0 74,888,279 -74,888,279 -74,888,279 -100% 4.6%ABX06-1 rfc05ef4 0 25,291,690 -25,291,690 -25,291,690 -100% 9.2%ABX06-1 rfc05k11 3,292 40,710,006 -40,706,714 -40,710,006 -100% 6.5%ABX06-1 sabr05h1 0 47,885,379 -47,885,379 -47,885,379 -100% 15.4%ABX06-1 sail05h3 0 11,853,347 -11,853,347 -11,853,347 -100% 5.9%ABX06-1 sas05wf4 0 27,469,522 -27,469,522 -27,469,522 -100% 3.6%ABX06-1 svhe0504 0 32,229,500 -32,229,500 -32,229,500 -100% 8.7%Average of 06-1 200,697 38,630,598 -38,429,900 -38,438,153 -99% 7.5%
ABX06-2 ace06nc1 0 43,700,769 -43,700,769 -43,643,608 -100% 10.1%ABX06-2 ars06w01 0 65,975,075 -65,975,075 -65,975,075 -100% 15.5%ABX06-2 bshe06h3 0 24,596,379 -24,596,379 -24,596,379 -100% 8.7%ABX06-2 cmlt06n1 37,247,795 69,170,484 -31,922,689 -22,933,004 -46% 19.6%ABX06-2 cwhe0608 0 34,000,000 -34,000,000 -34,000,000 -100% 4.9%ABX06-2 ffml06f4 1,618,782 32,783,560 -31,164,778 -32,783,560 -95% 0.0%ABX06-2 gsa06he3 0 46,292,302 -46,292,302 -46,292,302 -100% 12.9%ABX06-2 heat0604 0 15,200,000 -15,200,000 -15,200,000 -100% 14.4%ABX06-2 jpa06fr1 0 37,437,634 -37,437,634 -37,437,634 -100% 4.8%ABX06-2 lbml0601 0 57,499,722 -57,499,722 -57,499,722 -100% 9.6%ABX06-2 mab06nc1 0 26,082,309 -26,082,309 -26,082,309 -100% 11.2%ABX06-2 mlhe06h1 539,315 42,582,247 -42,042,932 -41,904,811 -99% 3.3%ABX06-2 msab06h2 0 79,339,737 -79,339,737 -79,339,737 -100% 11.8%ABX06-2 msab06w2 0 71,582,145 -71,582,145 -71,582,145 -100% 17.0%ABX06-2 rfc06ks3 0 24,150,000 -24,150,000 -24,150,000 -100% 9.4%ABX06-2 rfc06nc2 0 14,820,026 -14,820,026 -14,820,026 -100% 11.7%ABX06-2 sabr06o1 19,646,362 42,199,983 -22,553,620 -22,776,461 -53% 2.9%ABX06-2 sail0604 100 12,232,264 -12,232,164 -12,232,164 -100% 8.9%ABX06-2 sas06wf2 100 30,531,814 -30,531,714 -30,531,714 -100% 16.6%ABX06-2 svhe06o5 0 38,749,997 -38,749,997 -38,749,997 -100% 5.0%Average of 06-2 2,952,623 40,446,322 -37,493,700 -37,126,532 -95% 9.9%
Source: Credit Suisse and remittance reports
29 November 2010
ABX and RMBS November Performance Update 7
Exhibit 16: OC Shortfalls and Losses for ABX 07-1 and 07-2 Index Name
Intex Ticker Actual OC Target OC OC shortfalls in
NovemberOC shortfalls in
October% OC shortfalls in
NovemberAnnualized Net Loss Rate (%)
ABX07-1 abf06op2 0 26,932,982 -26,932,982 -26,932,982 -100% 11.1%ABX07-1 ace06nc3 0 18,767,403 -18,767,403 -18,767,403 -100% 11.0%ABX07-1 bsh06h10 0 35,691,094 -35,691,094 -35,691,094 -100% 14.3%ABX07-1 cbs06cb6 0 16,004,626 -16,004,626 -16,004,626 -100% 6.2%ABX07-1 cmlt06n4 0 43,666,641 -43,666,641 -43,666,641 -100% 18.1%ABX07-1 ctm06wf3 0 28,474,160 -28,474,160 -28,474,160 -100% 11.2%ABX07-1 cwhe0618 0 29,750,000 -29,750,000 -29,750,000 -100% 5.4%ABX07-1 ffm06f13 0 33,945,494 -33,945,494 -33,945,494 -100% 8.3%ABX07-1 frhe0603 0 31,779,853 -31,779,853 -31,779,853 -100% 14.2%ABX07-1 gsa06he5 0 20,745,642 -20,745,642 -20,745,642 -100% 4.9%ABX07-1 heat0607 0 19,250,000 -19,250,000 -19,250,000 -100% 10.0%ABX07-1 jpa06ch2 0 35,017,824 -35,017,824 -35,017,824 -100% 4.5%ABX07-1 lbml0606 0 43,046,740 -43,046,740 -43,046,740 -100% 9.9%ABX07-1 mab06nc3 0 18,054,563 -18,054,563 -18,054,563 -100% 14.4%ABX07-1 mlhe06h5 0 57,804,923 -57,804,923 -57,804,923 -100% 5.9%ABX07-1 msab06h6 0 42,680,252 -42,680,252 -42,680,252 -100% 8.1%ABX07-1 rfc06ks9 0 37,024,319 -37,024,319 -37,024,319 -100% 9.4%ABX07-1 sabr06h2 0 18,446,839 -18,446,839 -18,446,839 -100% 17.0%ABX07-1 sas06bc4 100 28,379,376 -28,379,276 -28,379,276 -100% 7.9%ABX07-1 svhe06e1 0 49,220,118 -49,220,118 -49,220,118 -100% 6.2%Average of 07-1 5 31,734,142 -31,734,137 -31,734,137 -100% 9.9%
ABX07-2 ace07he4 0 56,923,314 -56,923,314 -56,923,314 -100% 15.9%ABX07-2 bsh07he3 0 53,866,207 -53,866,207 -53,866,207 -100% 13.8%ABX07-2 ctm07am2 0 69,438,527 -69,438,527 -69,438,527 -100% 9.1%ABX07-2 cwh07001 -1,515,546 35,000,000 -36,515,546 -38,733,693 -104% 4.6%ABX07-2 ffm07ff1 1,699,823 46,779,936 -45,080,113 -46,779,936 -96% 0.1%ABX07-2 gsa07nc1 0 39,384,902 -39,384,902 -39,384,902 -100% 10.9%ABX07-2 heat0702 0 50,400,000 -50,400,000 -50,400,000 -100% 14.4%ABX07-2 hsa07nc1 0 39,705,956 -39,705,956 -39,705,956 -100% 11.7%ABX07-2 jpa07ch3 677,992 50,136,034 -49,458,042 -49,849,691 -99% 3.9%ABX07-2 mlff0702 1,669,324 65,069,289 -63,399,965 -65,069,289 -97% 0.2%ABX07-2 mlh07ml1 0 97,745,095 -97,745,095 -97,745,095 -100% 3.5%ABX07-2 msab07n3 0 64,562,586 -64,562,586 -64,562,586 -100% 6.5%ABX07-2 nfhe0702 100 59,500,000 -59,499,900 -59,499,900 -100% 12.3%ABX07-2 nmhe0702 0 34,898,559 -34,898,559 -34,898,559 -100% 8.8%ABX07-2 oohe0705 0 71,999,960 -71,999,960 -71,999,960 -100% 7.3%ABX07-2 rfc07ks2 0 38,500,002 -38,500,002 -38,500,002 -100% 7.5%ABX07-2 sabr07b4 0 58,736,053 -58,736,053 -58,736,053 -100% 5.1%ABX07-2 sas07bc1 0 20,589,984 -20,589,984 -20,589,984 -100% 8.7%ABX07-2 svh07op1 0 89,388,769 -89,388,769 -89,388,769 -100% 6.8%ABX07-2 wamu07h2 0 59,762,443 -59,762,443 -59,762,443 -100% 5.3%Average of 07-2 126,585 55,119,381 -54,992,796 -55,291,743 -100% 7.8%
Source: Credit Suisse and remittance reports

29 November 2010
ABX and RMBS November Performance Update 8
Exhibit 17: ABX Credit Enhancement and Factor in Current Month
ABX Index RatingAverage of Credit Support In Nov 10
Average of Factor in Nov 10
ABX06-1 Pen AAA 61.2 0.14AAA 64.2 0.76Aa2 29.3 0.95A2 9.3 0.76Baa2 1.3 0.37Baa3 0.5 0.26
ABX06-2 Pen AAA 36.9 0.66AAA 34.3 0.98Aa2 11.6 0.87A2 2.7 0.35Baa2 1.0 0.10Baa3 0.7 0.10
ABX07-1 Pen AAA 22.6 1.00AAA 20.3 1.00Aa2 5.5 0.72A2 1.4 0.21Baa2 0.3 0.10Baa3 0.1 0.08
ABX07-2 Pen AAA 16.4 1.00AAA 15.1 1.00Aa2 4.4 0.69A2 1.2 0.18Baa2 0.2 0.11Baa3 0.0 0.10
Source: Credit Suisse

29 Novem
ber 2010
AB
X and R
MB
S Novem
ber Perform
ance Update
9
Exhibit 18: ABX 06-1 Details
Index Name Intex Ticker Issuer Name Deal Age Loan Age 30-59 Dlq
60+ Dlq (w/ Fcl/BK/REO) BK FCL REO Ending Balance
(USD) Factor Net Loss Rate Vol CPR CDR Severity Cum
Loss30-59 Dlq
60+ Dlq (w/ Fcl/BK/REO) BK FCL REO Ending Balance
(USD) Factor Net Loss Rate Vol CPR CDR Severity Cum
Loss
ABX06-1 ace05he7 Deutsche Bank 60 62 3.9% 50.1% 6.1% 21.9% 6.1% 355,334,251 0.20 10.2% 0.6% 12.7% 74.5% 19.3% 3.4% 49.7% 5.6% 22.7% 6.0% 359,383,913 0.20 11.9% 0.5% 14.9% 72.3% 19.2%ABX06-1 amq05r11 Ameriquest Retail 59 60 3.8% 25.9% 4.4% 12.5% 2.7% 572,059,399 0.31 6.7% 3.6% 7.5% 86.8% 7.9% 3.6% 26.1% 4.2% 12.9% 2.6% 577,774,163 0.32 8.3% 2.6% 10.3% 76.9% 7.7%ABX06-1 ars05w02 Ameriquest Wholesale 62 63 4.3% 32.0% 3.7% 17.4% 2.8% 679,528,359 0.25 6.6% 1.6% 7.9% 79.7% 13.3% 5.3% 31.9% 3.9% 18.0% 2.5% 685,865,741 0.25 5.8% 1.8% 7.0% 80.0% 13.2%ABX06-1 bsh05h11 Bear Stearns 60 64 5.0% 42.9% 3.0% 9.5% 1.7% 181,676,541 0.28 13.2% 1.2% 13.2% 93.4% 12.1% 5.0% 42.3% 3.0% 9.9% 2.1% 184,204,805 0.29 4.5% 5.0% 7.5% 55.5% 11.8%ABX06-1 cwhe05b5 Countrywide 59 64 3.7% 53.5% 3.4% 16.5% 1.6% 265,381,135 0.28 5.5% 2.3% 5.7% 94.1% 6.8% 4.2% 51.9% 4.1% 14.9% 1.8% 267,519,377 0.28 3.2% 3.9% 4.1% 75.6% 6.7%ABX06-1 ffm05f12 First Franklin 59 61 5.7% 37.6% 5.5% 15.0% 3.4% 531,798,905 0.27 1.6% 1.6% 2.1% 72.8% 15.2% 4.9% 35.9% 4.9% 14.5% 3.3% 533,946,214 0.27 9.8% 1.8% 13.9% 66.1% 15.2%ABX06-1 gsa05he4 Goldman Sachs 63 66 3.2% 36.3% 4.9% 21.3% 2.8% 297,394,111 0.20 5.2% 4.0% 8.3% 59.4% 11.8% 2.4% 35.9% 4.6% 21.6% 2.8% 300,600,128 0.21 7.0% 1.0% 9.1% 73.8% 11.7%ABX06-1 heat0508 Credit Suisse Conduit 61 63 5.4% 35.1% 4.6% 14.3% 6.1% 303,241,187 0.20 9.2% 2.9% 12.1% 72.1% 15.2% 4.8% 35.3% 4.3% 14.4% 6.3% 307,656,809 0.21 4.9% 0.1% 6.8% 69.2% 15.0%ABX06-1 jpma05o1 Option One 64 67 4.1% 31.4% 3.8% 16.2% 1.7% 265,916,225 0.18 4.4% 2.9% 6.1% 70.9% 6.2% 5.4% 31.1% 4.2% 15.8% 1.7% 268,148,796 0.18 2.7% 4.7% 4.6% 57.7% 6.2%ABX06-1 lbml05w2 Long Beach 63 66 6.3% 47.1% 4.3% 14.8% 3.8% 464,169,756 0.17 6.9% 2.0% 7.1% 93.2% 11.9% 6.8% 45.9% 4.0% 12.0% 3.9% 468,024,465 0.17 7.2% 2.0% 10.0% 68.2% 11.8%ABX06-1 mabs05n2 New Century 60 62 6.6% 38.5% 6.8% 16.1% 9.3% 190,698,999 0.21 18.4% -0.7% 23.8% 68.5% 19.9% 5.4% 39.1% 6.1% 15.7% 10.3% 195,154,894 0.22 10.0% -0.8% 14.9% 62.5% 19.6%ABX06-1 mlhe05a1 Ameriquest Wholesale 62 66 3.3% 58.6% 4.9% 20.2% 4.2% 217,569,061 0.20 4.3% 0.4% 7.2% 57.5% 9.7% 2.6% 58.6% 5.2% 18.9% 4.3% 219,032,441 0.20 6.0% 1.0% 8.4% 68.5% 9.6%ABX06-1 msab05h5 Morgan Stanley 61 65 4.2% 48.6% 7.4% 17.6% 2.9% 269,555,477 0.18 3.4% 0.9% 4.9% 67.1% 11.7% 5.0% 47.6% 7.0% 17.8% 2.7% 271,119,838 0.18 10.0% 1.9% 10.8% 87.1% 11.7%ABX06-1 ncc05004 New Century 63 64 3.9% 39.0% 3.4% 12.3% 10.1% 539,510,338 0.26 4.6% 0.4% 7.4% 59.7% 8.7% 4.0% 38.4% 3.5% 12.0% 10.1% 543,369,877 0.26 6.5% 1.2% 10.2% 61.1% 8.6%ABX06-1 rfc05ef4 Equifirst 62 63 5.0% 29.1% 2.6% 18.3% 1.9% 162,343,948 0.22 9.2% 2.6% 8.8% 80.3% 12.6% 6.0% 29.5% 2.4% 17.6% 1.9% 164,123,054 0.22 8.1% 0.5% 8.6% 71.4% 12.4%ABX06-1 rfc05k11 RASC (RFC) 60 62 5.7% 28.0% 3.0% 16.4% 2.0% 348,867,374 0.25 6.5% 3.1% 6.3% 72.1% 15.1% 6.2% 27.8% 2.8% 15.9% 1.9% 351,858,046 0.25 8.9% 2.1% 9.1% 75.0% 15.0%ABX06-1 sabr05h1 Barclays 60 64 3.2% 59.5% 8.7% 24.2% 13.5% 202,545,284 0.16 15.4% 1.0% 19.5% 69.9% 17.6% 2.7% 59.5% 8.6% 25.0% 13.8% 206,614,271 0.17 7.4% 1.4% 9.5% 73.8% 17.4%ABX06-1 sail05h3 Lehman 63 66 4.9% 41.9% 4.5% 17.9% 6.2% 411,441,822 0.17 5.9% 0.9% 8.3% 68.2% 11.4% 5.4% 41.0% 4.5% 18.1% 6.0% 415,215,874 0.18 7.7% -0.8% 11.8% 61.8% 11.3%ABX06-1 sas05wf4 Wells Fargo 60 63 4.1% 26.5% 4.0% 9.7% 4.0% 492,699,497 0.25 3.6% 2.2% 6.1% 57.6% 6.0% 3.3% 26.6% 3.9% 10.7% 3.7% 496,627,676 0.25 5.5% 0.9% 7.7% 68.5% 6.0%ABX06-1 svhe0504 Soundview 60 65 5.7% 40.9% 5.8% 17.0% 2.1% 239,852,760 0.27 8.7% 0.3% 10.0% 82.5% 13.9% 4.8% 36.8% 5.7% 13.0% 2.4% 242,425,599 0.27 6.4% 2.7% 6.4% 96.8% 13.7%
61 64 4.6% 40.1% 4.7% 16.5% 4.4% 349,579,221 0.23 7.5% 1.7% 9.2% 74.0% 12.3% 4.6% 39.5% 4.6% 16.1% 4.5% 352,933,299 0.23 7.1% 1.7% 9.3% 71.1% 12.2%
October 2010November 2010
Average Source: Credit Suisse and remittance reports
Exhibit 19: ABX 06-2 Details
Index Name Intex Ticker Issuer Name Deal Age Loan Age 30-59 Dlq
60+ Dlq (w/ Fcl/BK/REO) BK FCL REO Ending Balance
(USD) Factor Net Loss Rate Vol CPR CDR Severity Cum
Loss30-59 Dlq
60+ Dlq (w/ Fcl/BK/REO) BK FCL REO Ending Balance
(USD) Factor Net Loss Rate Vol CPR CDR Severity Cum
Loss
ABX06-2 ace06nc1 New Century 58 62 4.1% 35.8% 3.1% 19.8% 3.1% 342,141,668 0.26 10.1% 2.2% 11.9% 79.1% 17.0% 4.1% 35.6% 3.3% 21.6% 2.3% 346,768,845 0.26 4.3% 3.6% 6.1% 68.3% 16.8%ABX06-2 ars06w01 Ameriquest Wholesale 58 60 4.8% 40.6% 3.7% 22.5% 3.8% 550,885,598 0.24 15.5% 0.8% 16.9% 84.4% 20.9% 5.4% 40.6% 0.0% 0.0% 0.0% 560,116,841 0.25 13.5% 0.7% 14.4% 87.9% 20.6%ABX06-2 bshe06h3 Bear Stearns 56 59 4.8% 51.0% 4.0% 18.6% 5.7% 211,963,756 0.27 8.7% 0.0% 9.0% 92.2% 17.1% 3.8% 50.6% 3.9% 20.4% 4.9% 213,758,051 0.27 15.3% 1.1% 17.0% 82.5% 16.9%ABX06-2 cmlt06n1 New Century 57 60 3.2% 48.5% 3.2% 10.6% 22.3% 650,853,521 0.45 19.6% 1.8% 20.2% 85.9% 7.0% 3.3% 48.6% 3.2% 10.3% 23.0% 664,067,760 0.46 14.0% 1.1% 18.3% 68.7% 6.3%ABX06-2 cwhe0608 Countrywide 53 54 3.6% 60.3% 3.2% 17.3% 2.5% 994,944,004 0.50 4.9% 0.3% 5.3% 91.0% 12.4% 3.8% 59.1% 3.5% 16.1% 2.7% 1,000,213,000 0.50 6.2% 1.6% 7.6% 78.7% 12.1%ABX06-2 ffml06f4 First Franklin 56 58 5.6% 42.6% 4.7% 17.4% 3.7% 431,632,438 0.28 0.0% 1.1% 0.0% #DIV/0! 18.0% 5.0% 40.0% 4.0% 17.7% 3.5% 432,103,384 0.28 9.1% 2.4% 12.1% 70.9% 18.0%ABX06-2 gsa06he3 Goldman Sachs 54 58 4.7% 44.6% 6.0% 17.2% 6.4% 456,394,439 0.29 12.9% 1.5% 12.5% 95.7% 22.3% 4.9% 45.4% 5.5% 17.3% 6.3% 462,004,423 0.29 10.9% 3.2% 11.6% 87.9% 22.0%ABX06-2 heat0604 Credit Suisse Conduit 55 59 4.7% 40.8% 4.5% 19.8% 5.7% 444,048,666 0.28 14.4% 1.8% 17.2% 76.6% 16.5% 5.2% 40.7% 4.1% 20.5% 5.9% 451,653,555 0.28 8.9% 0.7% 11.1% 76.4% 16.2%ABX06-2 jpa06fr1 Fremont 58 60 4.9% 50.7% 4.2% 28.2% 3.0% 271,577,030 0.27 4.8% 0.5% 5.9% 79.0% 16.7% 4.9% 49.1% 3.9% 28.5% 2.8% 273,744,595 0.27 6.5% 0.0% 8.0% 78.2% 16.6%ABX06-2 lbml0601 Long Beach 57 59 4.1% 51.9% 3.7% 16.5% 5.1% 631,965,253 0.25 9.6% 1.3% 11.0% 82.7% 22.3% 4.7% 51.1% 3.7% 13.7% 5.3% 639,390,118 0.26 8.9% 0.7% 12.2% 69.0% 22.1%ABX06-2 mab06nc1 New Century 57 60 4.2% 42.3% 4.9% 18.3% 5.9% 250,276,921 0.27 11.2% 3.2% 15.2% 67.7% 16.7% 3.3% 43.0% 5.1% 19.4% 6.3% 254,463,538 0.28 12.5% 1.3% 14.2% 81.3% 16.5%ABX06-2 mlhe06h1 Merrill Lynch 58 62 3.0% 54.7% 4.5% 18.5% 2.1% 214,825,224 0.27 3.3% 3.2% 4.7% 67.4% 18.4% 3.5% 53.2% 4.1% 17.9% 2.2% 216,508,273 0.28 1.2% 0.8% 1.3% 89.7% 18.3%ABX06-2 msab06h2 Morgan Stanley 55 59 4.4% 46.4% 4.7% 20.5% 7.7% 575,490,853 0.25 11.8% 0.5% 13.4% 81.5% 22.4% 4.3% 47.0% 4.4% 20.4% 7.7% 582,411,551 0.26 11.3% 2.3% 12.8% 81.6% 22.2%ABX06-2 msab06w2 WMC 53 55 3.5% 50.4% 3.7% 22.9% 8.8% 742,168,148 0.29 17.0% 1.1% 18.1% 83.8% 29.6% 3.5% 50.5% 3.6% 23.5% 9.0% 754,791,979 0.29 12.7% 0.1% 16.1% 70.9% 29.2%ABX06-2 rfc06ks3 RASC (RFC) 56 58 5.1% 32.3% 3.5% 20.0% 2.4% 311,163,871 0.27 9.4% 1.4% 9.7% 67.0% 18.8% 5.6% 32.6% 3.3% 19.6% 2.3% 314,411,208 0.27 12.2% 1.4% 10.7% 89.9% 18.5%ABX06-2 rfc06nc2 New Century 57 59 5.7% 35.1% 2.6% 25.0% 2.8% 222,317,975 0.29 11.7% 4.2% 12.0% 76.5% 18.8% 5.7% 35.3% 2.4% 24.5% 2.9% 225,558,059 0.30 9.1% 3.0% 9.1% 75.6% 18.6%ABX06-2 sabr06o1 Option One 58 64 3.8% 31.4% 4.0% 15.3% 3.5% 309,159,166 0.25 2.9% 0.4% 3.9% 71.8% 5.9% 4.5% 31.4% 3.7% 15.3% 3.2% 310,523,292 0.25 -0.8% 2.6% 2.7% -29.9% 5.9%ABX06-2 sail0604 Lehman 53 56 4.7% 46.8% 3.4% 18.1% 8.5% 769,589,922 0.31 8.9% 1.0% 11.6% 71.0% 20.4% 4.6% 46.7% 3.6% 18.8% 8.3% 778,318,681 0.32 5.0% 0.2% 7.3% 64.9% 20.1%ABX06-2 sas06wf2 Wells Fargo 53 56 5.2% 32.1% 3.6% 13.9% 5.5% 431,480,984 0.33 16.6% 3.7% 17.5% 85.3% 14.1% 5.0% 32.8% 3.5% 14.4% 5.8% 439,923,445 0.34 9.1% 1.4% 10.3% 83.0% 13.6%ABX06-2 svhe06o5 Option One 53 55 5.3% 38.7% 4.3% 19.4% 3.2% 1,112,261,540 0.36 5.0% 1.0% 6.4% 74.5% 15.5% 5.4% 38.5% 4.2% 18.5% 3.2% 1,121,048,754 0.36 8.2% 0.6% 12.3% 63.3% 15.3%
56 58 4.5% 43.8% 4.0% 19.0% 5.6% 496,257,049 0.30 9.9% 1.5% 11.1% #DIV/0! 17.5% 4.5% 43.6% 3.7% 17.9% 5.4% 502,088,968 0.30 8.9% 1.4% 10.8% 71.9% 17.3%
October 2010November 2010
Average Source: Credit Suisse and remittance reports

29 Novem
ber 2010
AB
X and R
MB
S Novem
ber Perform
ance Update
10
Exhibit 20: ABX 07-1 Details
Index Name Intex Ticker Issuer Name Deal Age Loan Age 30-59 Dlq
60+ Dlq (w/ Fcl/BK/REO) BK FCL REO Ending Balance
(USD) Factor Net Loss Rate Vol CPR CDR Severity Cum
Loss30-59 Dlq
60+ Dlq (w/ Fcl/BK/REO) BK FCL REO Ending Balance
(USD) Factor Net Loss Rate Vol CPR CDR Severity Cum
Loss
ABX07-1 abf06op2 Option One 50 51 5.1% 47.8% 4.6% 27.8% 4.2% 450,248,405 0.41 11.1% 1.5% 14.3% 71.3% 16.8% 5.4% 47.7% 5.0% 27.6% 5.1% 456,843,357 0.42 11.8% 2.2% 15.6% 68.0% 16.4%ABX07-1 ace06nc3 New Century 48 50 3.1% 66.7% 4.8% 24.6% 3.0% 799,579,726 0.53 11.0% 0.9% 13.3% 76.4% 16.7% 3.0% 66.2% 4.6% 24.5% 3.3% 809,693,916 0.54 5.9% 0.5% 7.9% 71.6% 16.2%ABX07-1 bsh06h10 Bear Stearns 47 49 4.6% 51.4% 3.1% 18.3% 2.7% 444,446,243 0.39 14.3% 0.0% 14.0% 95.5% 13.2% 4.5% 52.0% 2.9% 17.3% 2.8% 450,482,258 0.39 11.2% 0.0% 11.3% 94.1% 12.7%ABX07-1 cbs06cb6 C-Bass 52 56 5.2% 44.7% 2.8% 18.3% 4.7% 292,952,114 0.38 6.2% 3.6% 6.9% 87.7% 18.4% 5.8% 45.9% 2.8% 18.1% 4.9% 295,416,879 0.38 12.4% 1.6% 13.6% 84.9% 18.2%ABX07-1 cmlt06n4 New Century 50 52 4.1% 49.0% 3.2% 13.3% 18.9% 970,975,420 0.60 18.1% 0.9% 19.3% 83.6% 8.7% 3.9% 49.1% 3.1% 13.3% 20.2% 988,774,868 0.61 22.5% 0.8% 23.3% 84.2% 7.8%ABX07-1 ctm06wf3 Wells Fargo 49 51 4.1% 34.7% 3.8% 13.4% 5.0% 626,169,851 0.38 11.2% 2.2% 15.0% 69.4% 13.8% 4.8% 35.1% 3.8% 13.6% 5.5% 636,115,690 0.39 8.9% 0.7% 13.6% 61.1% 13.4%ABX07-1 cwhe0618 Countrywide 50 52 4.3% 62.9% 2.5% 20.2% 2.7% 936,207,400 0.55 5.4% 0.7% 6.7% 78.4% 11.9% 4.3% 61.7% 2.8% 18.7% 2.8% 942,561,738 0.55 6.3% 0.9% 7.4% 81.6% 11.6%ABX07-1 ffm06f13 First Franklin 50 52 6.1% 43.0% 4.7% 18.0% 6.1% 853,467,051 0.40 8.3% 2.6% 11.0% 71.7% 19.7% 5.6% 41.5% 3.9% 18.3% 5.8% 863,552,228 0.41 10.3% 2.3% 13.0% 74.2% 19.4%ABX07-1 frhe0603 Fremont 50 51 4.5% 52.7% 0.0% 0.0% 0.0% 584,176,333 0.36 14.2% 0.0% 15.6% 84.5% 23.7% 3.7% 53.2% 3.4% 26.4% 8.4% 592,206,576 0.36 14.5% 0.9% 15.8% 84.8% 23.2%ABX07-1 gsa06he5 Goldman Sachs 51 53 4.8% 40.8% 4.9% 16.5% 4.8% 386,393,750 0.37 4.9% 1.7% 6.2% 75.7% 21.0% 3.9% 42.3% 4.7% 16.3% 4.9% 389,075,511 0.38 11.7% 0.9% 13.2% 81.2% 20.9%ABX07-1 heat0607 Credit Suisse Conduit 50 52 4.2% 46.2% 4.3% 20.1% 7.5% 356,991,708 0.32 10.0% 2.3% 12.4% 76.0% 27.8% 4.2% 46.3% 4.1% 20.7% 6.4% 362,149,631 0.33 17.3% 1.3% 19.3% 81.0% 27.5%ABX07-1 jpa06ch2 Chase 48 53 4.9% 42.5% 3.2% 24.6% 2.5% 848,644,113 0.42 4.5% 0.6% 5.4% 80.9% 10.9% 4.5% 41.7% 3.2% 24.1% 2.5% 853,994,257 0.42 4.5% 2.7% 6.5% 66.8% 10.7%ABX07-1 lbml0606 Long Beach 52 53 5.4% 53.8% 3.7% 17.6% 3.4% 584,707,577 0.35 9.9% 0.8% 11.5% 81.4% 26.9% 5.7% 53.0% 3.4% 14.8% 3.5% 591,142,272 0.35 9.3% 2.0% 12.3% 71.3% 26.6%ABX07-1 mab06nc3 New Century 47 50 4.7% 41.1% 4.7% 15.6% 5.3% 412,504,462 0.40 14.4% 1.6% 14.8% 89.5% 25.1% 5.6% 39.2% 4.7% 15.2% 4.4% 418,873,310 0.41 5.3% 1.1% 6.1% 82.9% 24.6%ABX07-1 mlhe06h5 Merrill Lynch 50 53 3.8% 59.4% 5.4% 24.2% 3.0% 569,859,141 0.41 5.9% 0.0% 7.9% 72.3% 22.8% 3.2% 60.1% 5.3% 23.8% 3.2% 573,463,684 0.42 8.6% 0.9% 9.7% 83.9% 22.6%ABX07-1 msab06h6 Morgan Stanley 50 53 2.7% 70.0% 4.2% 26.9% 2.9% 685,447,958 0.47 8.1% 0.5% 8.1% 96.2% 19.8% 3.2% 69.3% 4.7% 25.4% 3.3% 690,653,893 0.47 8.0% 1.2% 9.8% 78.1% 19.4%ABX07-1 rfc06ks9 RASC (RFC) 49 50 4.9% 35.1% 3.1% 23.1% 3.1% 528,489,831 0.43 9.4% 0.7% 8.7% 77.5% 23.7% 4.5% 36.3% 3.3% 23.6% 3.0% 532,761,133 0.43 14.4% 0.5% 15.3% 74.4% 23.4%ABX07-1 sabr06h2 Barclays 50 54 4.4% 41.2% 4.0% 19.1% 4.8% 340,274,814 0.33 17.0% 1.5% 13.7% 113.9% 24.3% 5.4% 39.7% 4.2% 17.4% 4.3% 345,431,695 0.34 4.3% 2.4% 6.0% 68.9% 23.8%ABX07-1 sas06bc4 Lehman 48 50 3.7% 49.9% 3.5% 22.1% 6.7% 708,161,956 0.45 7.9% 1.9% 11.2% 66.0% 19.7% 3.2% 49.9% 3.3% 22.1% 6.7% 716,607,984 0.45 7.1% 0.8% 10.7% 62.1% 19.4%ABX07-1 svhe06e1 Equifirst 50 52 3.9% 35.4% 5.5% 16.4% 4.9% 685,282,794 0.40 6.2% 1.9% 7.1% 84.3% 18.3% 4.2% 36.0% 5.3% 17.4% 4.7% 690,494,485 0.40 11.2% 1.8% 13.5% 78.1% 18.1%
50 52 4.4% 48.4% 3.8% 19.0% 4.8% 603,249,032 0.42 9.9% 1.3% 11.2% 81.6% 19.2% 4.4% 48.3% 3.9% 19.9% 5.3% 610,014,768 0.42 10.3% 1.3% 12.2% 76.7% 18.8%Average
November 2010 October 2010
Source: Credit Suisse and remittance reports
Exhibit 21: ABX 07-2 Details
Index Name Intex Ticker Issuer Name Deal Age Loan Age 30-59 Dlq
60+ Dlq (w/ Fcl/BK/REO) BK FCL REO Ending Balance
(USD) Factor Net Loss Rate Vol CPR CDR Severity Cum
Loss30-59 Dlq
60+ Dlq (w/ Fcl/BK/REO) BK FCL REO Ending Balance
(USD) Factor Net Loss Rate Vol CPR CDR Severity Cum
Loss
ABX07-2 ace07he4 Deutsche Bank 42 45 4.0% 59.5% 7.8% 26.1% 20.8% 367,594,945 0.35 15.9% 2.1% 21.4% 65.1% 37.7% 4.4% 59.4% 7.3% 27.6% 20.3% 376,011,469 0.35 21.9% 3.6% 27.0% 68.5% 37.3%ABX07-2 bsh07he3 Bear Stearns 43 45 5.0% 50.2% 3.4% 14.7% 1.8% 575,368,867 0.59 13.8% 0.3% 14.3% 90.2% 19.3% 4.4% 50.2% 3.2% 13.5% 1.7% 583,021,679 0.60 11.6% 0.5% 11.2% 97.9% 18.6%ABX07-2 ctm07am2 Ameriquest Wholesale 44 48 4.6% 42.3% 3.3% 21.2% 6.6% 1,199,887,027 0.54 9.1% 0.4% 8.9% 97.2% 22.3% 4.7% 42.8% 3.1% 21.3% 6.5% 1,209,713,741 0.55 10.3% 1.4% 11.9% 81.0% 21.9%ABX07-2 cwh07001 Countrywide 45 45 3.4% 64.0% 2.7% 18.9% 3.1% 1,377,075,482 0.69 4.6% 0.3% 5.9% 76.7% 10.3% 3.3% 63.1% 2.7% 17.7% 3.2% 1,384,634,767 0.69 6.7% 1.0% 8.6% 74.0% 9.9%ABX07-2 ffm07ff1 First Franklin 45 46 5.2% 44.6% 4.4% 16.0% 4.3% 976,362,272 0.48 0.1% 4.2% 0.3% 34.7% 18.8% 5.7% 41.2% 3.5% 16.5% 4.1% 980,409,495 0.48 8.8% 0.4% 11.7% 71.2% 18.8%ABX07-2 gsa07nc1 New Century 44 46 5.3% 48.2% 4.2% 20.4% 5.7% 808,702,379 0.44 10.9% 2.4% 9.3% 111.0% 27.6% 4.9% 49.2% 4.5% 20.2% 6.0% 818,031,797 0.45 12.0% 1.3% 13.4% 82.6% 27.2%ABX07-2 heat0702 Credit Suisse Conduit 44 48 4.8% 40.2% 3.3% 17.3% 5.8% 485,853,560 0.40 14.4% 0.7% 17.0% 77.8% 30.7% 4.8% 40.6% 2.9% 17.7% 5.7% 494,453,883 0.41 16.2% 0.6% 18.5% 79.7% 30.2%ABX07-2 hsa07nc1 HSBC 41 45 3.5% 56.3% 4.1% 25.3% 6.8% 565,445,626 0.55 11.7% 1.3% 14.3% 75.0% 21.2% 3.6% 56.7% 4.2% 25.2% 7.4% 573,197,817 0.56 7.1% 0.8% 9.2% 73.5% 20.7%ABX07-2 jpa07ch3 JP Morgan 42 48 3.4% 38.0% 2.9% 23.6% 2.4% 698,455,083 0.59 3.9% 4.7% 4.7% 81.7% 12.0% 2.9% 37.4% 3.1% 23.4% 2.2% 704,053,703 0.60 6.2% 2.1% 7.1% 85.3% 11.9%ABX07-2 mlff0702 First Franklin 42 43 5.2% 50.3% 3.6% 19.6% 5.2% 1,056,947,416 0.53 0.2% 1.3% 0.3% 59.3% 18.7% 5.7% 46.6% 2.9% 19.6% 5.0% 1,058,871,879 0.53 9.2% 2.1% 12.5% 69.7% 18.7%ABX07-2 mlh07ml1 Merrill Lynch 43 48 2.3% 65.0% 4.8% 25.8% 2.4% 786,878,772 0.56 3.5% 0.3% 5.2% 64.9% 22.0% 2.5% 65.1% 4.6% 25.6% 2.5% 790,536,504 0.57 2.8% 0.5% 3.9% 69.9% 21.8%ABX07-2 msab07n3 New Century 41 45 3.9% 42.0% 3.7% 21.2% 6.2% 707,292,613 0.54 6.5% 1.6% 6.6% 96.0% 22.6% 3.1% 43.2% 3.3% 22.6% 5.8% 711,636,867 0.55 12.1% 1.3% 12.4% 90.8% 22.3%ABX07-2 nfhe0702 NovaStar 41 42 4.3% 39.4% 3.6% 19.9% 6.2% 837,929,763 0.60 12.3% 2.4% 13.6% 84.6% 16.4% 3.5% 40.9% 3.7% 21.4% 6.1% 848,675,652 0.61 14.0% 0.9% 14.6% 89.6% 15.8%ABX07-2 nmhe0702 Nomura 45 49 5.0% 35.6% 4.7% 14.8% 8.7% 421,546,475 0.45 8.8% 1.2% 10.8% 77.2% 25.3% 5.1% 35.7% 4.6% 15.4% 9.3% 426,101,741 0.46 7.2% 0.0% 11.8% 56.6% 24.9%ABX07-2 oohe0705 Option One 43 44 5.7% 37.8% 3.6% 20.8% 3.5% 831,533,893 0.55 7.3% 0.9% 9.3% 75.4% 19.1% 5.5% 39.1% 3.2% 21.4% 3.5% 841,537,846 0.56 8.6% 1.1% 11.2% 72.7% 18.8%ABX07-2 rfc07ks2 RASC (RFC) 44 47 4.7% 34.0% 3.7% 20.9% 3.4% 484,632,882 0.48 7.5% 0.8% 6.9% 76.4% 24.2% 4.6% 34.1% 3.4% 20.5% 3.6% 487,991,381 0.49 10.8% 1.7% 11.8% 67.1% 23.9%ABX07-2 sabr07b4 New Century 41 45 7.0% 40.1% 4.6% 16.2% 4.1% 487,779,660 0.49 5.1% 2.0% 5.7% 86.8% 25.8% 6.3% 38.7% 4.7% 14.9% 3.6% 490,959,284 0.49 4.0% 0.7% 6.0% 64.4% 25.6%ABX07-2 sas07bc1 Lehman 45 47 5.2% 41.9% 3.4% 10.5% 3.4% 664,909,894 0.55 8.7% 1.9% 10.8% 75.8% 17.0% 5.2% 40.8% 3.4% 11.8% 3.4% 672,534,816 0.56 6.5% 0.4% 7.9% 78.1% 16.6%ABX07-2 svh07op1 Option One 43 44 6.1% 36.3% 2.8% 18.9% 2.2% 1,428,123,638 0.62 6.8% 1.1% 8.5% 77.0% 17.2% 5.3% 36.9% 2.8% 19.0% 2.5% 1,438,440,347 0.00 6.1% 1.6% 8.6% 67.0% 16.8%ABX07-2 wamu07h2 Long Beach 42 44 4.2% 49.0% 2.9% 16.0% 3.5% 857,896,619 0.54 5.3% 1.5% 7.8% 65.2% 22.6% 3.9% 48.6% 3.0% 12.9% 3.7% 864,904,625 0.54 6.4% 1.7% 8.5% 73.0% 22.4%
43 46 4.6% 45.7% 3.9% 19.4% 5.3% 781,010,843 0.53 7.8% 1.6% 9.1% 77.4% 21.5% 4.5% 45.5% 3.7% 19.4% 5.3% 787,785,965 0.50 9.4% 1.2% 11.4% 75.6% 21.2%Average
November 2010 October 2010
Source: Credit Suisse and remittance reports

29 November 2010
ABX and RMBS November Performance Update 11
Non-Agency Performance Snapshot
Exhibit 22: Prime Fixed VCPR CDR Severity 30-59 DQ 60+ 2005 H2 24.4 1.4 43.3 1.8 8.7
2006 H1 18.9 2.7 46.2 2.3 13.3
2006 H2 21.6 3.3 48.3 2.4 13.5
2007 H1 20.1 3.5 49.6 2.4 14.8
Source: Credit Suisse
Exhibit 23: Prime ARM VCPR CDR Severity 30-59 DQ 60+
2005 H2 13.0 3.3 40.94 2.0 14.2
2006 H1 11.3 5.8 46.45 2.3 17.2
2006 H2 12.9 7.5 46.97 2.8 21.0
2007 H1 13.3 5.4 44.58 2.6 18.6
Source: Credit Suisse
Exhibit 24: ALT-A Fixed VCPR CDR Severity 30-59 DQ 60+
2005 H2 9.4 3.9 52.08 3.6 19.1
2006 H1 6.6 7.0 61.05 4.1 28.2
2006 H2 5.5 8.3 61.13 4.5 31.8
2007 H1 6.5 7.5 59.25 3.9 29.5
Source: Credit Suisse
Exhibit 25: ATL-A ARM VCPR CDR Severity 30-59 DQ 60+
2005 H2 3.8 7.1 53.94 3.2 26.6
2006 H1 2.8 10.2 61.00 3.8 36.6
2006 H2 4.2 10.7 61.66 3.6 37.9
2007 H1 4.7 12.1 55.88 3.7 40.5
Source: Credit Suisse
Exhibit 26: Option ARM VCPR CDR Severity 30-59 DQ 60+
2005 H2 1.5 8.5 57.15 4.8 47.3
2006 H1 1.3 10.2 62.31 4.0 50.8
2006 H2 1.7 11.7 60.56 3.8 46.3
2007 H1 2.0 12.2 58.59 4.2 45.1
Source: Credit Suisse
Exhibit 27: Subprime VCPR CDR Severity 30-59 DQ 60+
2005 H2 1.7 8.1 81.99 4.6 41.3
2006 H1 1.3 9.8 82.42 4.5 46.2
2006 H2 1.4 10.8 84.91 4.6 47.9
2007 H1 1.6 9.0 81.82 4.8 46.8
Source: Credit Suisse
29 November 2010
ABX and RMBS November Performance Update 12
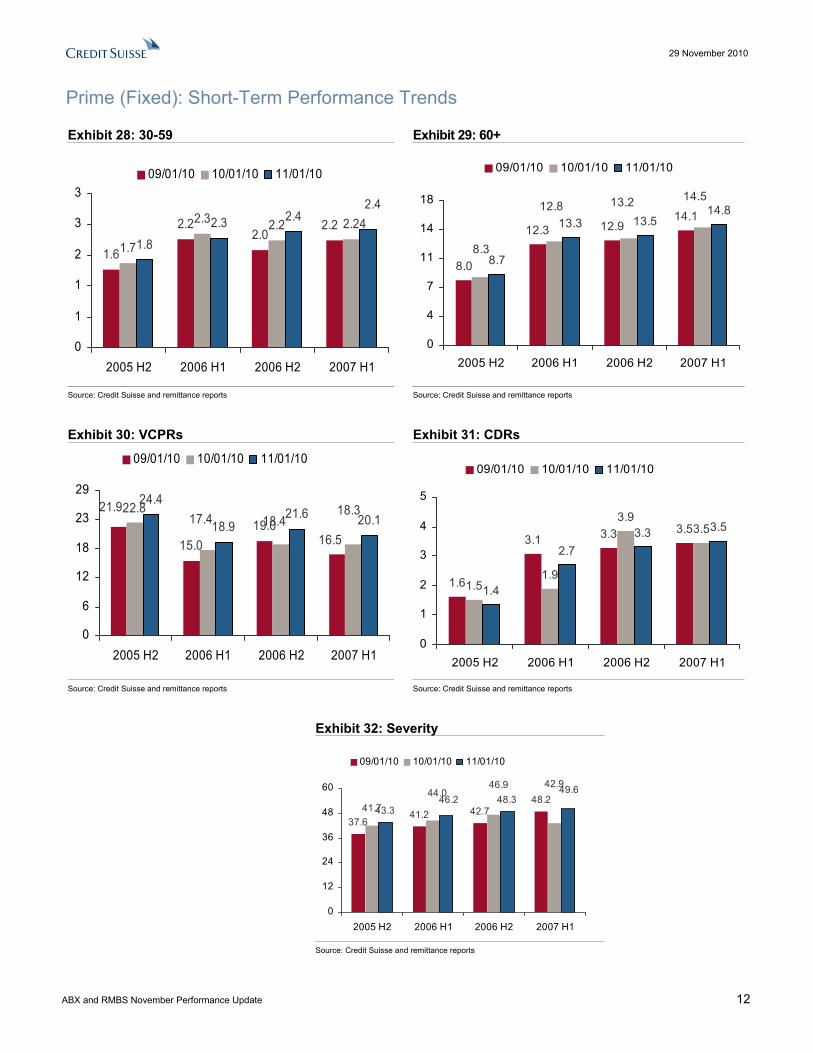
Prime (Fixed): Short-Term Performance Trends
Exhibit 28: 30-59 Exhibit 29: 60+
1.6
2.22.0
1.7
2.3 2.21.8
2.3 2.42.2 2.24
2.4
0
1
1
2
3
3
2005 H2 2006 H1 2006 H2 2007 H1
09/01/10 10/01/10 11/01/10
8.0
12.3 12.914.1
8.7
13.3 13.514.8
14.513.212.8
8.3
0
4
7
11
14
18
2005 H2 2006 H1 2006 H2 2007 H1
09/01/10 10/01/10 11/01/10
Source: Credit Suisse and remittance reports Source: Credit Suisse and remittance reports
Exhibit 30: VCPRs Exhibit 31: CDRs
15.019.0
24.4
18.921.6 20.1
16.5
21.9 18.317.4
22.818.4
0
6
12
18
23
29
2005 H2 2006 H1 2006 H2 2007 H1
09/01/10 10/01/10 11/01/10
1.6
3.1 3.3 3.5
1.51.9
3.93.5
1.4
2.73.3 3.5
0
1
2
3
4
5
2005 H2 2006 H1 2006 H2 2007 H1
09/01/10 10/01/10 11/01/10
Source: Credit Suisse and remittance reports Source: Credit Suisse and remittance reports
Exhibit 32: Severity
37.641.2 42.7
48.243.3
48.341.7
42.946.944.0 49.6
46.2
0
12
24
36
48
60
2005 H2 2006 H1 2006 H2 2007 H1
09/01/10 10/01/10 11/01/10
Source: Credit Suisse and remittance reports

29 November 2010
ABX and RMBS November Performance Update 13
Prime (Fixed): Long-Term Performance Trends
Exhibit 33: 30-59 Delinquency Exhibit 34: 60+ Delinquency
30-59 DQby Deal AgeLast Data Point is November-10
0.00.40.81.21.51.92.32.73.13.53.8
3 6 9 1215182124273033363942454851545760
% o
f Cur
rent
Bal
ance
2005 H22006 H12006 H22007 H1
60+ DLQ (inc F/R/B) by Deal AgeLast Data Point is November-10
024579
1112141618
3 6 9 1215182124273033363942454851545760
60+,
% o
f Cur
rent
Bal
ance
2005 H22006 H12006 H22007 H1
Source: Credit Suisse and remittance reports Source: Credit Suisse and remittance reports
Exhibit 35: VCPR Exhibit 36: CDR
VCPR by Deal AgeLast Data Point is November-10
0369
12151820232629
3 6 9 12 15 18 21 24 27 30 33 36 39 42 45 48 51 54 57 60
Average deal age
% V
CPR
2005 H22006 H12006 H22007 H1
CDR Last Data Point is November-10
-0.50.00.51.01.52.02.53.13.64.14.65.1
3 6 9 1215 1821 242730 333639 424548 5154 5760
Average deal age
2005 H22006 H12006 H22007 H1
Source: Credit Suisse and remittance reports Source: Credit Suisse and remittance reports

29 November 2010
ABX and RMBS November Performance Update 14
Prime (ARM): Short-Term Performance Trends
Exhibit 37: 30-59 Delinquency Exhibit 38: 60+ Delinquency
2.02.2
2.4 2.5
2.02.3
2.8 2.62.42.62.1
2.0
0
1
1
2
3
4
2005 H2 2006 H1 2006 H2 2007 H1
09/01/10 10/01/10 11/01/10
13.716.7
20.718.0
14.217.2
21.018.6
18.321.0
17.1
13.9
0
5
10
15
20
25
2005 H2 2006 H1 2006 H2 2007 H1
09/01/10 10/01/10 11/01/10
Source: Credit Suisse and remittance reports Source: Credit Suisse and remittance reports
Exhibit 39: VCPR Exhibit 40: CDR
12.9 12.313.0 13.313.613.413.1
13.1
11.6
13.6
12.911.3
0
3
7
10
13
16
2005 H2 2006 H1 2006 H2 2007 H1
09/01/10 10/01/10 11/01/10
3.7
5.8
8.0
5.5
3.85.0
6.55.9
3.3
5.8
7.5
5.4
0
2
4
6
8
10
2005 H2 2006 H1 2006 H2 2007 H1
09/01/10 10/01/10 11/01/10
Source: Credit Suisse and remittance reports Source: Credit Suisse and remittance reports
Exhibit 41: Severity
40.5
48.440.9
46.440.4 40.9
44.9 43.639.9 44.147.0 44.6
0
12
23
35
46
58
2005 H2 2006 H1 2006 H2 2007 H1
09/01/10 10/01/10 11/01/10
Source: Credit Suisse and remittance reports

29 November 2010
ABX and RMBS November Performance Update 15
Prime (ARM): Long-Term Performance Trends
Exhibit 42: 30-59 Delinquency Exhibit 43: 60+ Delinquency
30-59 DQby Deal AgeLast Data Point is November-10
0.00.40.81.21.62.02.42.73.13.53.9
3 6 9 1215182124273033363942454851545760
% o
f Cur
rent
Bal
ance
2005 H22006 H12006 H22007 H1
60+ DLQ (inc F/R/B) by Deal AgeLast Data Point is November-10
0358
10131518202325
3 6 9 1215182124273033363942454851545760
60+,
% o
f Cur
rent
Bal
ance
2005 H22006 H12006 H22007 H1
Source: Credit Suisse and remittance reports Source: Credit Suisse and remittance reports
Exhibit 44: VCPR Exhibit 45: CDR
VCPR by Deal AgeLast Data Point is November-10
037
1013162023263033
3 6 9 1215182124273033363942454851545760
% V
CP
R
2005 H22006 H12006 H22007 H1
CDR by Deal AgeLast Data Point is November-10
0.01.01.92.93.94.95.86.87.88.89.7
3 6 9 1215182124273033363942454851545760
2005 H22006 H12006 H22007 H1
Source: Credit Suisse and remittance reports Source: Credit Suisse and remittance reports

29 November 2010
ABX and RMBS November Performance Update 16
Alt-A (Fixed): Short-Term Performance Trends
Exhibit 46: 30-59 Exhibit 47: 60+
3.33.9 4.1 3.8
3.44.0 4.1 3.93.6
4.14.5
3.9
0
1
2
4
5
6
2005 H2 2006 H1 2006 H2 2007 H1
09/01/10 10/01/10 11/01/10
18.5
27.631.5
29.1
19.1
28.231.8
29.529.3
31.627.8
18.9
0
8
15
23
31
38
2005 H2 2006 H1 2006 H2 2007 H1
09/01/10 10/01/10 11/01/10
Source: Credit Suisse and remittance reports Source: Credit Suisse and remittance reports
Exhibit 48: VCPR Exhibit 49: CDR
8.1
5.5 5.56.5
8.7
6.55.3
6.0
9.4
6.65.5
6.5
0
2
4
7
9
11
2005 H2 2006 H1 2006 H2 2007 H1
09/01/10 10/01/10 11/01/10
4.3
7.3
9.28.0
4.0
6.2
8.0
6.5
3.9
7.08.3
7.5
0
2
4
7
9
11
2005 H2 2006 H1 2006 H2 2007 H1
09/01/10 10/01/10 11/01/10
Source: Credit Suisse and remittance reports Source: Credit Suisse and remittance reports
Exhibit 50: Severity
56.8 56.961.5 58.3
52.161.1 59.3
59.060.062.7
54.7 61.0
0
15
30
45
60
75
2005 H2 2006 H1 2006 H2 2007 H1
09/01/10 10/01/10 11/01/10
Source: Credit Suisse and remittance reports

29 November 2010
ABX and RMBS November Performance Update 17
Alt-A (Fixed): Long-Term Performance Trends
Exhibit 51: 30-59 Exhibit 52: 60+
30-59 DQby Deal AgeLast Data Point is November-10
0.00.61.31.92.53.23.84.45.15.76.3
3 6 9 1215182124273033363942454851545760
% o
f Cur
rent
Bal
ance
2005 H22006 H12006 H22007 H1
60+ DLQ (inc F/R/B) by Deal AgeLast Data Point is November-10
048
1216202428323640
3 6 9 1215182124273033363942454851545760
60+,
% o
f Cur
rent
Bal
ance
2005 H22006 H12006 H22007 H1
Source: Credit Suisse and remittance reports Source: Credit Suisse and remittance reports
Exhibit 53: VCPR Exhibit 54: CDR
VCPR by Deal AgeLast Data Point is November-10
02579
111416182023
3 6 9 1215182124273033363942454851545760
% V
CP
R
2005 H22006 H12006 H22007 H1
CDR Last Data Point is November-10
0.01.32.63.95.26.57.89.1
10.311.612.9
3 6 9 1215182124273033363942454851545760
2005 H22006 H12006 H22007 H1
Source: Credit Suisse and remittance reports Source: Credit Suisse and remittance reports
Exhibit 55: Severity
SeverityLast Data Point is November-10
08
152330384553606875
3 6 9 1215182124273033363942454851545760
2005 H22006 H12006 H22007 H1
Source: Credit Suisse and remittance reports

29 November 2010
ABX and RMBS November Performance Update 18
Alt-A (ARM): Short-Term Performance Trends
Exhibit 56: 30-59 Exhibit 57: 60+
3.03.5 3.4 3.5
2.93.6 3.8
4.1
3.23.8 3.6 3.7
0
1
2
3
4
5
2005 H2 2006 H1 2006 H2 2007 H1
09/01/10 10/01/10 11/01/10
26.5
36.3 37.9 40.4
26.6
36.6 37.940.5
40.337.936.4
26.4
0
10
19
29
39
49
2005 H2 2006 H1 2006 H2 2007 H1
09/01/10 10/01/10 11/01/10
Source: Credit Suisse and remittance reports Source: Credit Suisse and remittance reports
Exhibit 58: VCPR Exhibit 59: CDR
4.9
4.0 4.2 3.94.6
4.13.8
4.33.8
2.8
4.24.7
0
1
3
4
5
6
2005 H2 2006 H1 2006 H2 2007 H1
09/01/10 10/01/10 11/01/10
8.5
11.7 12.3
7.1
10.2 10.712.1
13.912.111.99.8
8.1
0
3
7
10
13
17
2005 H2 2006 H1 2006 H2 2007 H1
09/01/10 10/01/10 11/01/10
Source: Credit Suisse and remittance reports Source: Credit Suisse and remittance reports
Exhibit 60: Severity
53.7 57.4 59.9 59.261.0 61.755.9
57.157.358.855.7
53.9
0
15
30
44
59
74
2005 H2 2006 H1 2006 H2 2007 H1
09/01/10 10/01/10 11/01/10
Source: Credit Suisse and remittance reports

29 November 2010
ABX and RMBS November Performance Update 19
ALT-A (ARM): Long-Term Performance Trends
Exhibit 61: 30-59 Exhibit 62: 60+
30-59 DQby Deal AgeLast Data Point is November-10
0.00.61.31.92.53.23.84.45.05.76.3
3 6 9 1215182124273033363942454851545760
% o
f Cur
rent
Bal
ance
2005 H22006 H12006 H22007 H1
60+ DLQ (inc F/R/B) by Deal AgeLast Data Point is November-10
05
111622273238434854
3 6 9 1215182124273033363942454851545760
60+,
% o
f Cur
rent
Bal
ance 2005 H2
2006 H12006 H22007 H1
Source: Credit Suisse and remittance reports Source: Credit Suisse and remittance reports
Exhibit 63: VCPR Exhibit 64: CDR
VCPR by Deal AgeLast Data Point is November-10
0358
11141619222527
3 6 9 1215182124273033363942454851545760
% V
CP
R
2005 H22006 H12006 H22007 H1
CDR Last Data Point is November-10
0.02.04.16.18.2
10.212.314.316.318.420.4
3 6 9 1215182124273033363942454851545760
2005 H22006 H12006 H22007 H1
Source: Credit Suisse and remittance reports Source: Credit Suisse and remittance reports
Exhibit 65: Severity
SeverityLast Data Point is November-10
0
1020
30
40
5060
70
3 6 9 1215182124273033363942454851545760
2005 H22006 H12006 H22007 H1
Source: Credit Suisse and remittance reports

29 November 2010
ABX and RMBS November Performance Update 20
Option ARM: Short-Term Performance Trends
Exhibit 66: 30-59 Exhibit 67: 60+
4.3 4.03.6
4.34.53.9 3.9 4.1
4.84.0 3.8
4.2
0
1
2
4
5
6
2005 H2 2006 H1 2006 H2 2007 H1
09/01/10 10/01/10 11/01/10
46.350.1
46.4 44.347.3
50.846.3 45.1
46.0 44.850.5
46.7
0
12
24
37
49
61
2005 H2 2006 H1 2006 H2 2007 H1
09/01/10 10/01/10 11/01/10
Source: Credit Suisse and remittance reports Source: Credit Suisse and remittance reports
Exhibit 68: VCPR Exhibit 69: CDR
1.5
1.01.3
2.11.9
0.9 0.9
2.8
1.5 1.31.7
2.0
0
1
1
2
3
4
2005 H2 2006 H1 2006 H2 2007 H1
09/01/10 10/01/10 11/01/10
10.612.0
13.312.0
8.510.2
11.7 12.210.49.2
11.113.0
0
3
6
10
13
16
2005 H2 2006 H1 2006 H2 2007 H1
09/01/10 10/01/10 11/01/10
Source: Credit Suisse and remittance reports Source: Credit Suisse and remittance reports
Exhibit 70: Severity
56.460.1 60.5 61.1
57.1 60.6
61.561.357.355.8
58.662.3
0
15
30
45
60
75
2005 H2 2006 H1 2006 H2 2007 H1
09/01/10 10/01/10 11/01/10
Source: Credit Suisse and remittance reports

29 November 2010
ABX and RMBS November Performance Update 21
Option ARM: Long-Term Performance Trends
Exhibit 71: 30-59 Exhibit 72: 60+
30-59 DQby Deal AgeLast Data Point is November-10
0.00.81.72.53.44.25.15.96.77.68.4
3 6 9 1215182124273033363942454851545760
% o
f Cur
rent
Bal
ance
2005 H22006 H12006 H22007 H1
60+ DLQ (inc F/R/B) by Deal AgeLast Data Point is November-10
06
131926323945515864
3 6 9 1215182124273033363942454851545760
60+,
% o
f Cur
rent
Bal
ance
2005 H22006 H12006 H22007 H1
Source: Credit Suisse and remittance reports Source: Credit Suisse and remittance reports
Exhibit 73: VCPR Exhibit 74: CDR
VCPR by Deal AgeLast Data Point is November-10
05
101621263137424752
3 6 9 1215182124273033363942454851545760
% V
CP
R 2005 H22006 H12006 H22007 H1
CDR Last Data Point is November-10
0.02.04.16.18.2
10.212.214.316.318.320.4
3 6 9 1215182124273033363942454851545760
2005 H22006 H12006 H22007 H1
Source: Credit Suisse and remittance reports Source: Credit Suisse and remittance reports
Exhibit 75: Severity
SeverityLast Data Point is November-10
08
152330384553616876
3 6 9 1215182124273033363942454851545760
2005 H22006 H12006 H22007 H1
Source: Credit Suisse and remittance reports

29 November 2010
ABX and RMBS November Performance Update 22
Subprime: Short-Term Performance Trends
Exhibit 76: 30-59 Exhibit 77: 60+
4.4 4.4 4.4 4.44.3 4.4 4.5 4.64.6 4.5 4.6 4.8
0
1
2
4
5
6
2005 H2 2006 H1 2006 H2 2007 H1
09/01/10 10/01/10 11/01/10
41.245.0 47.9 46.5
41.346.2 47.9 46.8
46.247.944.3
39.8
0
11
23
34
46
57
2005 H2 2006 H1 2006 H2 2007 H1
09/01/10 10/01/10 11/01/10
Source: Credit Suisse and remittance reports Source: Credit Suisse and remittance reports
Exhibit 78: VCPR Exhibit 79: CDR
1.7
1.3 1.41.61.7
1.3 1.3 1.4
1.7
1.3 1.41.6
0
0
1
1
2
2
2005 H2 2006 H1 2006 H2 2007 H1
09/01/10 10/01/10 11/01/10
10.411.5 11.7 11.210.8
10.511.410.8
8.99.08.1
9.8
0
3
6
8
11
14
2005 H2 2006 H1 2006 H2 2007 H1
09/01/10 10/01/10 11/01/10
Source: Credit Suisse and remittance reports Source: Credit Suisse and remittance reports
Exhibit 80: Severity
75.3 76.882.0 80.282.0 82.4 84.9 81.8
79.478.676.877.3
0
20
41
61
82
102
2005 H2 2006 H1 2006 H2 2007 H1
09/01/10 10/01/10 11/01/10
Source: Credit Suisse and remittance reports

29 November 2010
ABX and RMBS November Performance Update 23
Subprime: Long-Term Performance Trends
Exhibit 81: 30-59 Exhibit 82: 60+
30-59 DQby Deal AgeLast Data Point is November-10
01234456789
3 6 9 1215182124273033363942454851545760
% o
f Cur
rent
Bal
ance
2005 H22006 H12006 H22007 H1
60+ DLQ (inc F/R/B) by Deal AgeLast Data Point is November-10
06
131926323845515864
3 6 9 1215182124273033363942454851545760
60+,
% o
f Cur
rent
Bal
ance
2005 H22006 H12006 H22007 H1
Source: Credit Suisse and remittance reports Source: Credit Suisse and remittance reports
Exhibit 83: VCPR Exhibit 84: CDR
VCPR by Deal AgeLast Data Point is November-10
05
101520253035404550
3 6 9 1215182124273033363942454851545760
% V
CP
R 2005 H22006 H12006 H22007 H1
CDR Last Data Point is November-10
0.03.16.19.2
12.215.318.421.424.527.630.6
3 6 9 1215182124273033363942454851545760
2005 H22006 H12006 H22007 H1
Source: Credit Suisse and remittance reports Source: Credit Suisse and remittance reports
Exhibit 85: Severity
SeverityLast Data Point is November-10
0102031415161718292
102
3 6 9 1215182124273033363942454851545760
2005 H22006 H12006 H22007 H1
Source: Credit Suisse and remittance reports

..
STRUCTURED PRODUCTS RESEARCH
NORTH AMERICA Eleven Madison Avenue, New York, NY 10010
Asset-Backed Securities (ABS)
Chandrajit Bhattacharya, Director Senior Strategist, Group Head +1 212 325 1546 [email protected]
Aashish Marfatia, Vice President +1 212 325 4142 [email protected]
Thomas Suehr, Associate +1 212 325 3663 [email protected]
Collateralized Debt Obligations (CDO) / Collateralized Loan Obligations (CLO)
David Yan, Director +1 212 325 5792 [email protected]
Commercial Mortgage Backed Securities (CMBS)
Sylvain Jousseaume, Vice President +1 212 325 1356 [email protected]
Serif Ustun, Vice President +1 212 538 4582 [email protected]
Tee Chew, Associate +1 212 325 8703 [email protected]
Mortgage Backed Securities — Residential (MBS)
Mahesh Swaminathan, Director Senior Strategist, Group Head +1 212 325 8789 [email protected]
Mukul Chhabra, Vice President +1 212 325 0709 [email protected]
Qumber Hassan, Vice President +1 212 538 4988 [email protected]
LONDON One Cabot Square, London E14 4QJ
Carlos Diaz, Associate + 44 20 7888 2414 [email protected]
JAPAN Izumi Garden Tower, 1-6 Roppongi 1-Chome, Minato-ku, Tokyo 106-6024
Tomohiro Miyasaka, Director Japan Head + 81 3 4550 7171 [email protected]
Hua Wang, Associate + 81 3 4550 7447 [email protected]

Disclosure Appendix
Analyst Certification Thomas Suehr and Chandrajit Bhattacharya each certify, with respect to the companies or securities that he or she analyzes, that (1) the views expressed in this report accurately reflect his or her personal views about all of the subject companies and securities and (2) no part of his or her compensation was, is or will be directly or indirectly related to the specific recommendations or views expressed in this report.
Important Disclosures Credit Suisse's policy is only to publish investment research that is impartial, independent, clear, fair and not misleading. For more detail, please refer to Credit Suisse's Policies for Managing Conflicts of Interest in connection with Investment Research: http://www.csfb.com/research-and-analytics/disclaimer/managing_conflicts_disclaimer.html Credit Suisse’s policy is to publish research reports as it deems appropriate, based on developments with the subject issuer, the sector or the market that may have a material impact on the research views or opinions stated herein. The analyst(s) involved in the preparation of this research report received compensation that is based upon various factors, including Credit Suisse's total revenues, a portion of which are generated by Credit Suisse's Investment Banking and Fixed Income Divisions. Credit Suisse may trade as principal in the securities or derivatives of the issuers that are the subject of this report. At any point in time, Credit Suisse is likely to have significant holdings in the securities mentioned in this report. As at the date of this report, Credit Suisse acts as a market maker or liquidity provider in the debt securities of the subject issuer(s) mentioned in this report. For important disclosure information on securities recommended in this report, please visit the website at https://firesearchdisclosure.credit-suisse.com or call +1-212-538-7625. For the history of any relative value trade ideas suggested by the Fixed Income research department as well as fundamental recommendations provided by the Emerging Markets Sovereign Strategy Group over the previous 12 months, please view the document at http://research-and-analytics.csfb.com/docpopup.asp?ctbdocid=330703_1_en. Credit Suisse clients with access to the Locus website may refer to http://www.credit-suisse.com/locus. For the history of recommendations provided by Technical Analysis, please visit the website at http://www.credit-suisse.com/techanalysis. Credit Suisse does not provide any tax advice. Any statement herein regarding any US federal tax is not intended or written to be used, and cannot be used, by any taxpayer for the purposes of avoiding any penalties.
Emerging Markets Bond Recommendation Definitions Buy: Indicates a recommended buy on our expectation that the issue will deliver a return higher than the risk-free rate. Sell: Indicates a recommended sell on our expectation that the issue will deliver a return lower than the risk-free rate.
Corporate Bond Fundamental Recommendation Definitions Buy: Indicates a recommended buy on our expectation that the issue will be a top performer in its sector. Outperform: Indicates an above-average total return performer within its sector. Bonds in this category have stable or improving credit profiles and are undervalued, or they may be weaker credits that, we believe, are cheap relative to the sector and are expected to outperform on a total-return basis. These bonds may possess price risk in a volatile environment. Market Perform: Indicates a bond that is expected to return average performance in its sector. Underperform: Indicates a below-average total-return performer within its sector. Bonds in this category have weak or worsening credit trends, or they may be stable credits that, we believe, are overvalued or rich relative to the sector. Sell: Indicates a recommended sell on the expectation that the issue will be among the poor performers in its sector. Restricted: In certain circumstances, Credit Suisse policy and/or applicable law and regulations preclude certain types of communications, including an investment recommendation, during the course of Credit Suisse's engagement in an investment banking transaction and in certain other circumstances. Not Rated: Credit Suisse Global Credit Research or Global Leveraged Finance Research covers the issuer but currently does not offer an investment view on the subject issue. Not Covered: Neither Credit Suisse Global Credit Research nor Global Leveraged Finance Research covers the issuer or offers an investment view on the issuer or any securities related to it. Any communication from Research on securities or companies that Credit Suisse does not cover is factual or a reasonable, non-material deduction based on an analysis of publicly available information.
Corporate Bond Risk Category Definitions In addition to the recommendation, each issue may have a risk category indicating that it is an appropriate holding for an "average" high yield investor, designated as Market, or that it has a higher or lower risk profile, designated as Speculative and Conservative, respectively.
Credit Suisse Credit Rating Definitions Credit Suisse may assign rating opinions to investment-grade and crossover issuers. Ratings are based on our assessment of a company's creditworthiness and are not recommendations to buy or sell a security. The ratings scale (AAA, AA, A, BBB, BB, B) is dependent on our assessment of an issuer's ability to meet its financial commitments in a timely manner. Within each category, creditworthiness is further detailed with a scale of High, Mid, or Low – with High being the strongest sub-category rating: High AAA, Mid AAA, Low AAA – obligor's capacity to meet its financial commitments is extremely strong; High AA, Mid AA, Low AA – obligor's capacity to meet its financial commitments is very strong; High A, Mid A, Low A – obligor's capacity to meet its financial commitments is strong; High BBB, Mid BBB, Low BBB – obligor's capacity to meet its financial commitments is adequate, but adverse economic/operating/financial circumstances are more likely to lead to a weakened capacity to meet its obligations; High BB, Mid BB, Low BB – obligations have speculative characteristics and are subject to substantial credit risk; High B, Mid B, Low B – obligor's capacity to meet its financial commitments is very weak and highly vulnerable to adverse economic, operating, and financial circumstances; High CCC, Mid CCC, Low CCC – obligor's capacity to meet its financial commitments is extremely weak and is dependent on favorable economic, operating, and financial circumstances. Credit Suisse's rating opinions do not necessarily correlate with those of the rating agencies.

Structured Securities, Derivatives, and Options Disclaimer Structured securities, derivatives, and options (including OTC derivatives and options) are complex instruments that are not suitable for every investor, may involve a high degree of risk, and may be appropriate investments only for sophisticated investors who are capable of understanding and assuming the risks involved. Supporting documentation for any claims, comparisons, recommendations, statistics or other technical data will be supplied upon request. Any trade information is preliminary and not intended as an official transaction confirmation. OTC derivative transactions are not highly liquid investments; before entering into any such transaction you should ensure that you fully understand its potential risks and rewards and independently determine that it is appropriate for you given your objectives, experience, financial and operational resources, and other relevant circumstances. You should consult with such tax, accounting, legal or other advisors as you deem necessary to assist you in making these determinations. In discussions of OTC options and other strategies, the results and risks are based solely on the hypothetical examples cited; actual results and risks will vary depending on specific circumstances. Investors are urged to consider carefully whether OTC options or option-related products, as well as the products or strategies discussed herein, are suitable to their needs. CS does not offer tax or accounting advice or act as a financial advisor or fiduciary (unless it has agreed specifically in writing to do so). Because of the importance of tax considerations to many option transactions, the investor considering options should consult with his/her tax advisor as to how taxes affect the outcome of contemplated options transactions. Use the following link to read the Options Clearing Corporation's disclosure document: http://www.theocc.com/publications/risks/riskstoc.pdf Transaction costs may be significant in option strategies calling for multiple purchases and sales of options, such as spreads and straddles. Commissions and transaction costs may be a factor in actual returns realized by the investor and should be taken into consideration.
Backtested, Hypothetical or Simulated Performance Results Backtested, hypothetical or simulated performance results have inherent limitations. Unlike an actual performance record based on trading actual client portfolios, simulated results are achieved by means of the retroactive application of a backtested model itself designed with the benefit of hindsight. Backtested performance does not reflect the impact that material economic or market factors might have on an adviser's decision-making process if the adviser were actually managing a client's portfolio. The backtesting of performance differs from actual account performance because the investment strategy may be adjusted at any time, for any reason, and can continue to be changed until desired or better performance results are achieved. The backtested performance includes hypothetical results that do not reflect the reinvestment of dividends and other earnings or the deduction of advisory fees, brokerage or other commissions, and any other expenses that a client would have paid or actually paid. No representation is made that any account will or is likely to achieve profits or losses similar to those shown. Alternative modeling techniques or assumptions might produce significantly different results and prove to be more appropriate. Past hypothetical backtest results are neither an indicator nor guarantee of future returns. Actual results will vary, perhaps materially, from the analysis. As a sophisticated investor, you accept and agree to use such information only for the purpose of discussing with Credit Suisse your preliminary interest in investing in the strategy described herein.

References in this report to Credit Suisse include all of the subsidiaries and affiliates of Credit Suisse AG operating under its investment banking division. For more information on our structure, please use the following link: https://www.credit-suisse.com/who_we_are/en/. This report is not directed to, or intended for distribution to or use by, any person or entity who is a citizen or resident of or located in any locality, state, country or other jurisdiction where such distribution, publication, availability or use would be contrary to law or regulation or which would subject Credit Suisse AG or its affiliates (“CS”) to any registration or licensing requirement within such jurisdiction. All material presented in this report, unless specifically indicated otherwise, is under copyright to CS. None of the material, nor its content, nor any copy of it, may be altered in any way, transmitted to, copied or distributed to any other party, without the prior express written permission of CS. All trademarks, service marks and logos used in this report are trademarks or service marks or registered trademarks or service marks of CS or its affiliates. The information, tools and material presented in this report are provided to you for information purposes only and are not to be used or considered as an offer or the solicitation of an offer to sell or to buy or subscribe for securities or other financial instruments. CS may not have taken any steps to ensure that the securities referred to in this report are suitable for any particular investor. CS will not treat recipients of this report as its customers by virtue of their receiving this report. The investments and services contained or referred to in this report may not be suitable for you and it is recommended that you consult an independent investment advisor if you are in doubt about such investments or investment services. Nothing in this report constitutes investment, legal, accounting or tax advice, or a representation that any investment or strategy is suitable or appropriate to your individual circumstances, or otherwise constitutes a personal recommendation to you. CS does not advise on the tax consequences of investments and you are advised to contact an independent tax adviser. Please note in particular that the bases and levels of taxation may change. Information and opinions presented in this report have been obtained or derived from sources believed by CS to be reliable, but CS makes no representation as to their accuracy or completeness. CS accepts no liability for loss arising from the use of the material presented in this report, except that this exclusion of liability does not apply to the extent that such liability arises under specific statutes or regulations applicable to CS. This report is not to be relied upon in substitution for the exercise of independent judgment. CS may have issued, and may in the future issue, other reports that are inconsistent with, and reach different conclusions from, the information presented in this report. Those reports reflect the different assumptions, views and analytical methods of the analysts who prepared them and CS is under no obligation to ensure that such other reports are brought to the attention of any recipient of this report. CS may, to the extent permitted by law, participate or invest in financing transactions with the issuer(s) of the securities referred to in this report, perform services for or solicit business from such issuers, and/or have a position or holding, or other material interest, or effect transactions, in such securities or options thereon, or other investments related thereto. In addition, it may make markets in the securities mentioned in the material presented in this report. CS may have, within the last three years, served as manager or co-manager of a public offering of securities for, or currently may make a primary market in issues of, any or all of the entities mentioned in this report or may be providing, or have provided within the previous 12 months, significant advice or investment services in relation to the investment concerned or a related investment. Additional information is, subject to duties of confidentiality, available on request. Some investments referred to in this report will be offered solely by a single entity and in the case of some investments solely by CS, or an associate of CS or CS may be the only market maker in such investments. Past performance should not be taken as an indication or guarantee of future performance, and no representation or warranty, express or implied, is made regarding future performance. Information, opinions and estimates contained in this report reflect a judgement at its original date of publication by CS and are subject to change without notice. The price, value of and income from any of the securities or financial instruments mentioned in this report can fall as well as rise. The value of securities and financial instruments is subject to exchange rate fluctuation that may have a positive or adverse effect on the price or income of such securities or financial instruments. Investors in securities such as ADR’s, the values of which are influenced by currency volatility, effectively assume this risk. Structured securities are complex instruments, typically involve a high degree of risk and are intended for sale only to sophisticated investors who are capable of understanding and assuming the risks involved. The market value of any structured security may be affected by changes in economic, financial and political factors (including, but not limited to, spot and forward interest and exchange rates), time to maturity, market conditions and volatility, and the credit quality of any issuer or reference issuer. Any investor interested in purchasing a structured product should conduct their own investigation and analysis of the product and consult with their own professional advisers as to the risks involved in making such a purchase. Some investments discussed in this report may have a high level of volatility. High volatility investments may experience sudden and large falls in their value causing losses when that investment is realised. Those losses may equal your original investment. Indeed, in the case of some investments the potential losses may exceed the amount of initial investment and, in such circumstances, you may be required to pay more money to support those losses. Income yields from investments may fluctuate and, in consequence, initial capital paid to make the investment may be used as part of that income yield. Some investments may not be readily realisable and it may be difficult to sell or realise those investments, similarly it may prove difficult for you to obtain reliable information about the value, or risks, to which such an investment is exposed. This report may provide the addresses of, or contain hyperlinks to, websites. Except to the extent to which the report refers to website material of CS, CS has not reviewed any such site and takes no responsibility for the content contained therein. Such address or hyperlink (including addresses or hyperlinks to CS’s own website material) is provided solely for your convenience and information and the content of any such website does not in any way form part of this document. Accessing such website or following such link through this report or CS’s website shall be at your own risk. This report is issued and distributed in Europe (except Switzerland) by Credit Suisse Securities (Europe) Limited, One Cabot Square, London E14 4QJ, England, which is regulated in the United Kingdom by The Financial Services Authority (“FSA”). This report is being distributed in Germany by Credit Suisse Securities (Europe) Limited Niederlassung Frankfurt am Main regulated by the Bundesanstalt fuer Finanzdienstleistungsaufsicht ("BaFin"). This report is being distributed in the United States and Canada by Credit Suisse Securities (USA) LLC; in Switzerland by Credit Suisse AG; in Brazil by Banco de Investimentos Credit Suisse (Brasil) S.A; in Mexico by Banco Credit Suisse (México), S.A. (transactions related to the securities mentioned in this report will only be effected in compliance with applicable regulation); in Japan by Credit Suisse Securities (Japan) Limited, Financial Instruments Firm, Director-General of Kanto Local Finance Bureau (Kinsho) No. 66, a member of Japan Securities Dealers Association, The Financial Futures Association of Japan, Japan Securities Investment Advisers Association; elsewhere in Asia/ Pacific by whichever of the following is the appropriately authorised entity in the relevant jurisdiction: Credit Suisse (Hong Kong) Limited, Credit Suisse Equities (Australia) Limited, Credit Suisse Securities (Thailand) Limited, Credit Suisse Securities (Malaysia) Sdn Bhd, Credit Suisse AG, Singapore Branch, and elsewhere in the world by the relevant authorised affiliate of the above. Research on Taiwanese securities produced by Credit Suisse AG, Taipei Branch has been prepared by a registered Senior Business Person. Research provided to residents of Malaysia is authorised by the Head of Research for Credit Suisse Securities (Malaysia) Sdn Bhd, to whom they should direct any queries on +603 2723 2020. This research may not conform to Canadian disclosure requirements. In jurisdictions where CS is not already registered or licensed to trade in securities, transactions will only be effected in accordance with applicable securities legislation, which will vary from jurisdiction to jurisdiction and may require that the trade be made in accordance with applicable exemptions from registration or licensing requirements. Non-U.S. customers wishing to effect a transaction should contact a CS entity in their local jurisdiction unless governing law permits otherwise. U.S. customers wishing to effect a transaction should do so only by contacting a representative at Credit Suisse Securities (USA) LLC in the U.S. This material is not for distribution to retail clients and is directed exclusively at Credit Suisse's market professional and institutional clients. Recipients who are not market professional or institutional investor clients of CS should seek the advice of their independent financial advisor prior to taking any investment decision based on this report or for any necessary explanation of its contents. This research may relate to investments or services of a person outside of the UK or to other matters which are not regulated by the FSA or in respect of which the protections of the FSA for private customers and/or the UK compensation scheme may not be available, and further details as to where this may be the case are available upon request in respect of this report. CS may provide various services to US municipal entities or obligated persons ("municipalities"), including suggesting individual transactions or trades and entering into such transactions. Any services CS provides to municipalities are not viewed as “advice” within the meaning of Section 975 of the Dodd-Frank Wall Street Reform and Consumer Protection Act. CS is providing any such services and related information solely on an arm’s length basis and not as an advisor or fiduciary to the municipality. In connection with the provision of the any such services, there is no agreement, direct or indirect, between any municipality (including the officials, management, employees or agents thereof) and CS for CS to provide advice to the municipality. Municipalities should consult with their financial, accounting and legal advisors regarding any such services provided by CS. In addition, CS is not acting for direct or indirect compensation to solicit the municipality on behalf of an unaffiliated broker, dealer, municipal securities dealer, municipal advisor, or investment adviser for the purpose of obtaining or retaining an engagement by the municipality for or in connection with Municipal Financial Products, the issuance of municipal securities, or of an investment adviser to provide investment advisory services to or on behalf of the municipality. Copyright © 2010 CREDIT SUISSE GROUP AG and/or its affiliates. All rights reserved. Investment principal on bonds can be eroded depending on sale price or market price. In addition, there are bonds on which investment principal can be eroded due to changes in redemption amounts. Care is required when investing in such instruments. When you purchase non-listed Japanese fixed income securities (Japanese government bonds, Japanese municipal bonds, Japanese government guaranteed bonds, Japanese corporate bonds) from CS as a seller, you will be requested to pay purchase price only.