exercise sheet 3 probability density estimation till rohrmann - 343756 jens krenzin - 319308
DESCRIPTION
a) Scatter Plot:TRANSCRIPT
Exercise Sheet 3
Probability Density Estimation
Till Rohrmann - 343756Jens Krenzin - 319308
Problem 3.1 Toy Data

Problem 3.1 Toy Data
a) Scatter Plot:
Problem 3.1 Toy Data
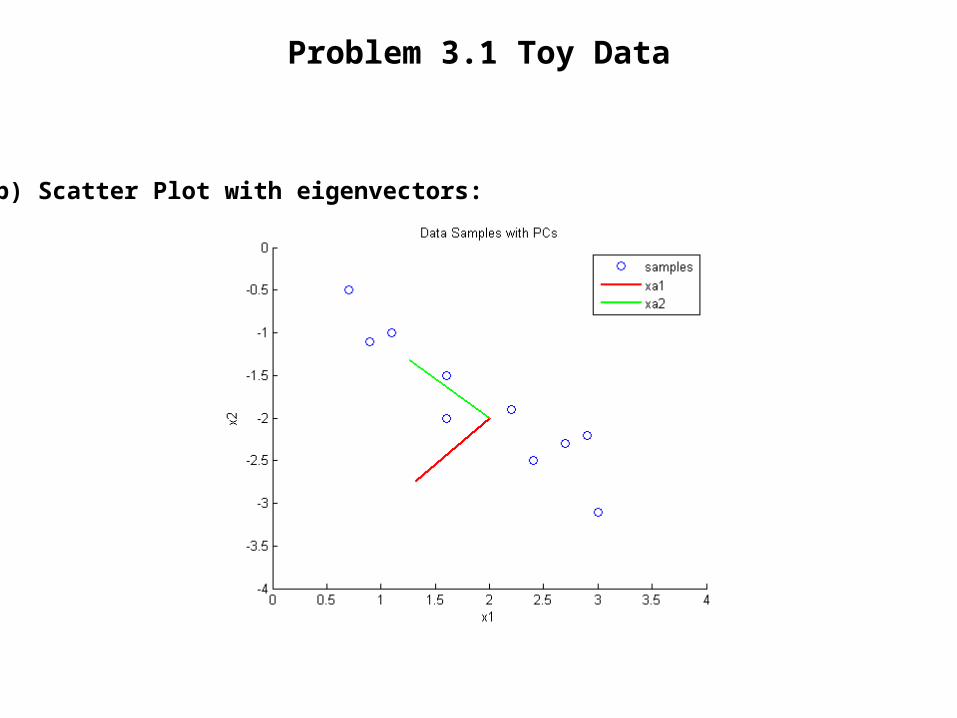
b) Scatter Plot with eigenvectors:

Problem 3.1 Toy Data
b) Scatter Plot of toy data with PCs as coordinates:
Problem 3.1 Toy Data
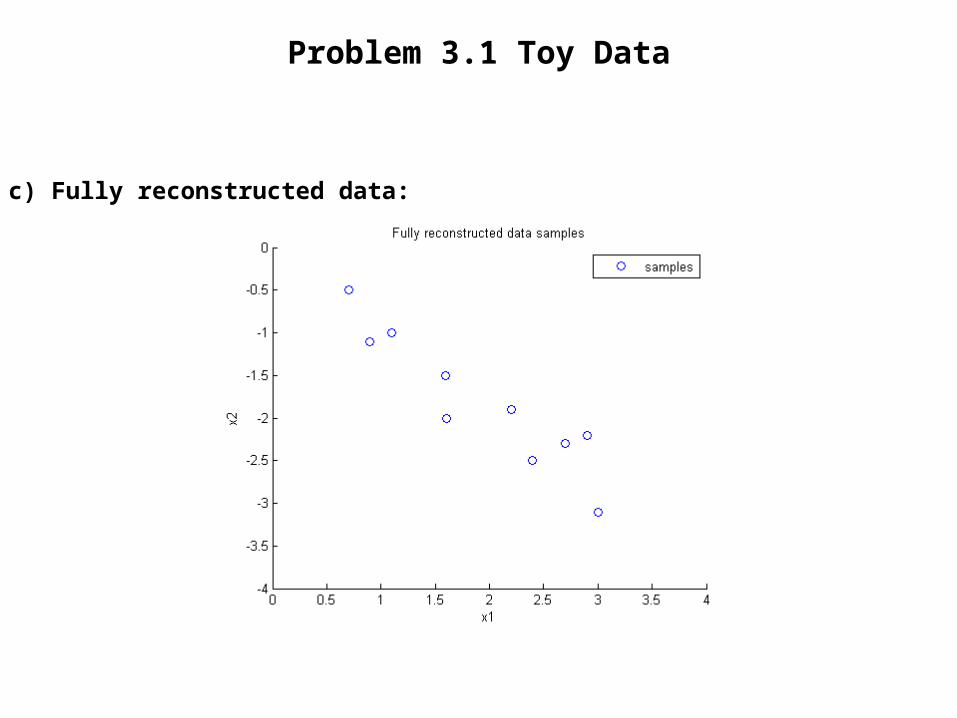
c) Fully reconstructed data:

Problem 3.1 Toy Data
c) Reconstructed data (only using xa1):
Problem 3.1 Toy Data
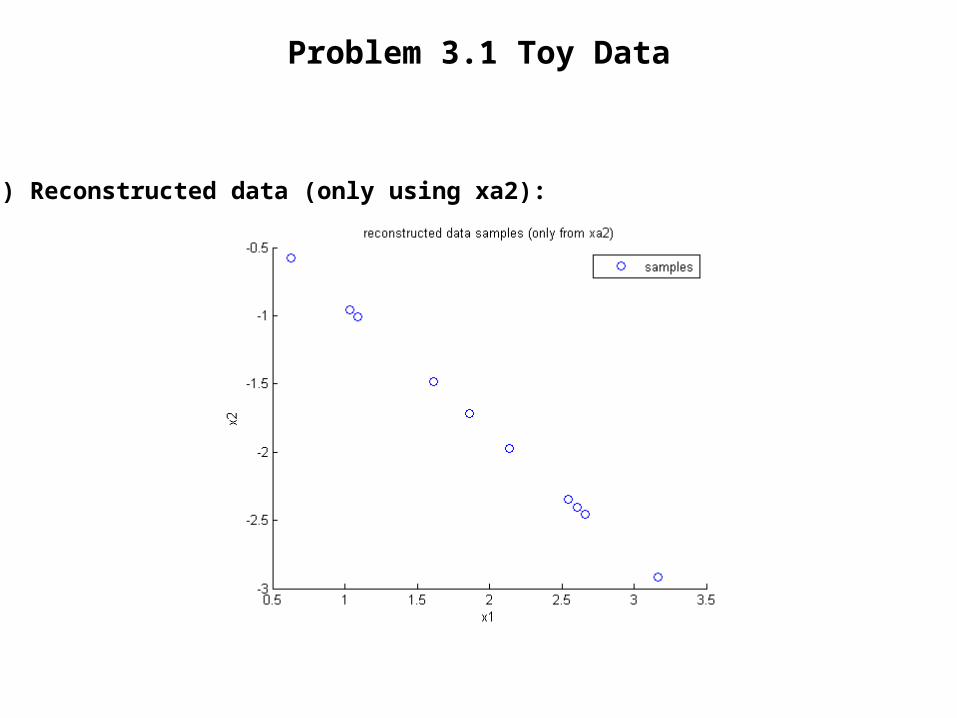
c) Reconstructed data (only using xa2):

Problem 3.2 PCA: Image Data
Problem 3.2 PCA: Image Data
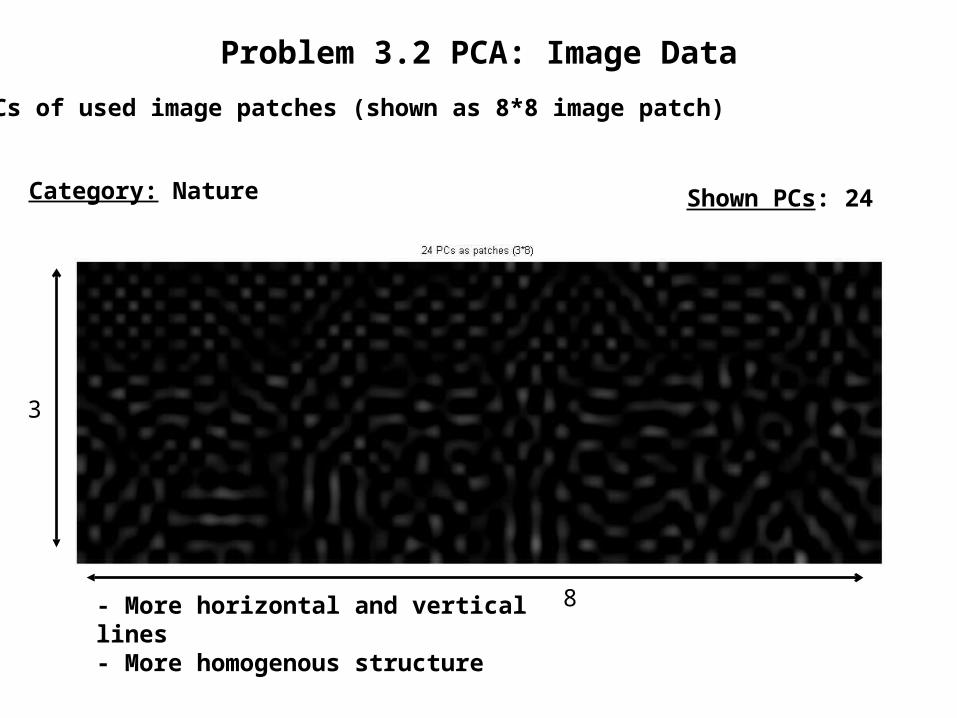
b) PCs of used image patches (shown as 8*8 image patch)
Category: Nature Shown PCs: 24
- More horizontal and vertical lines- More homogenous structure
3
8

Problem 3.2 PCA: Image Data
b) PCs of used image patches (shown as 8*8 image patch)
Category: Buildings Shown PCs: 24
- More diagonal lines- More inhomogenous structure
3
8

Problem 3.2 PCA: Image Data
b) PCs of used image patches (shown as 8*8 image patch)
Category: Nature Shown PCs: 488
6

Problem 3.2 PCA: Image Data
b) PCs of used image patches (shown as 8*8 image patch)
Category: Buildings Shown PCs: 488
6

Problem 3.3 Kernel PCA: Toy Data
Problem 3.3 Kernel PCA: Toy Data
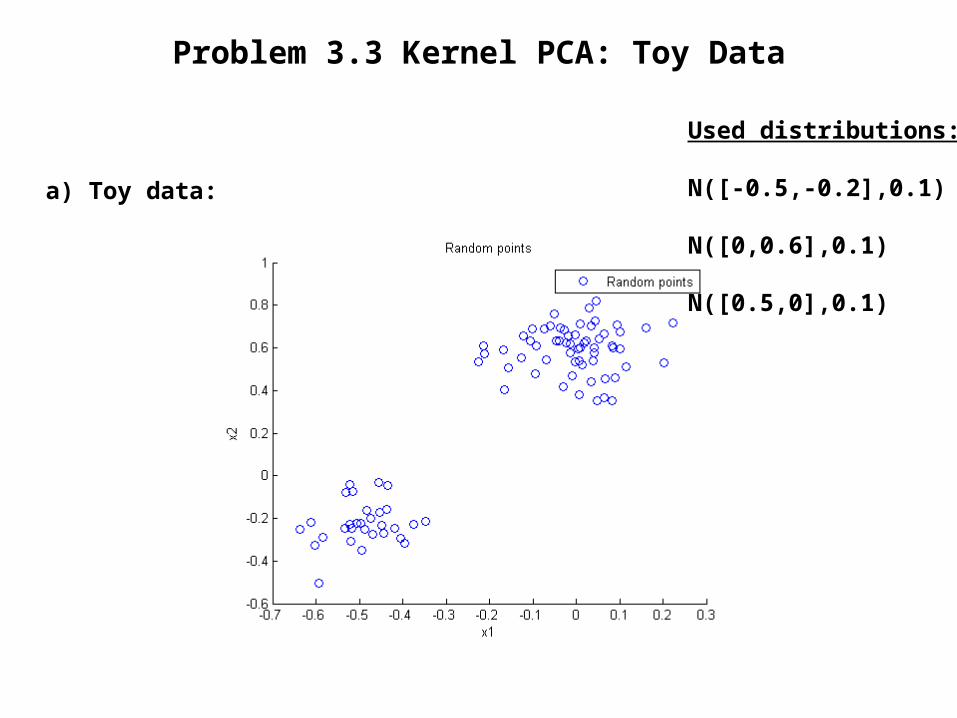
a) Toy data:
Used distributions:
N([-0.5,-0.2],0.1)
N([0,0.6],0.1)
N([0.5,0],0.1)
Problem 3.3 Kernel PCA: Toy Data
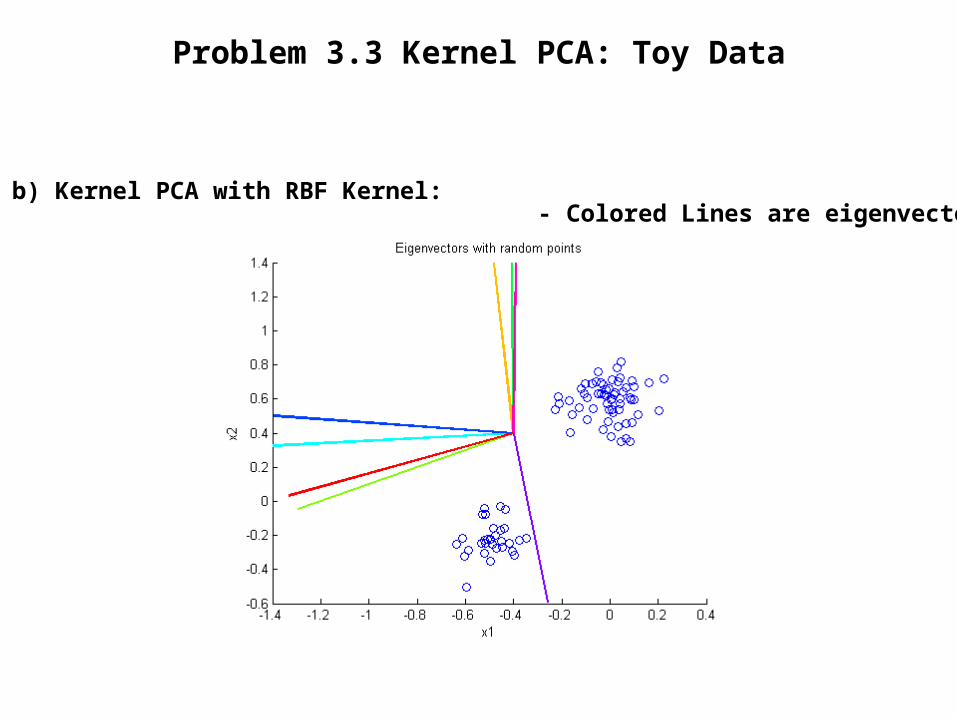
b) Kernel PCA with RBF Kernel:- Colored Lines are eigenvectors
Problem 3.3 Kernel PCA: Toy Data
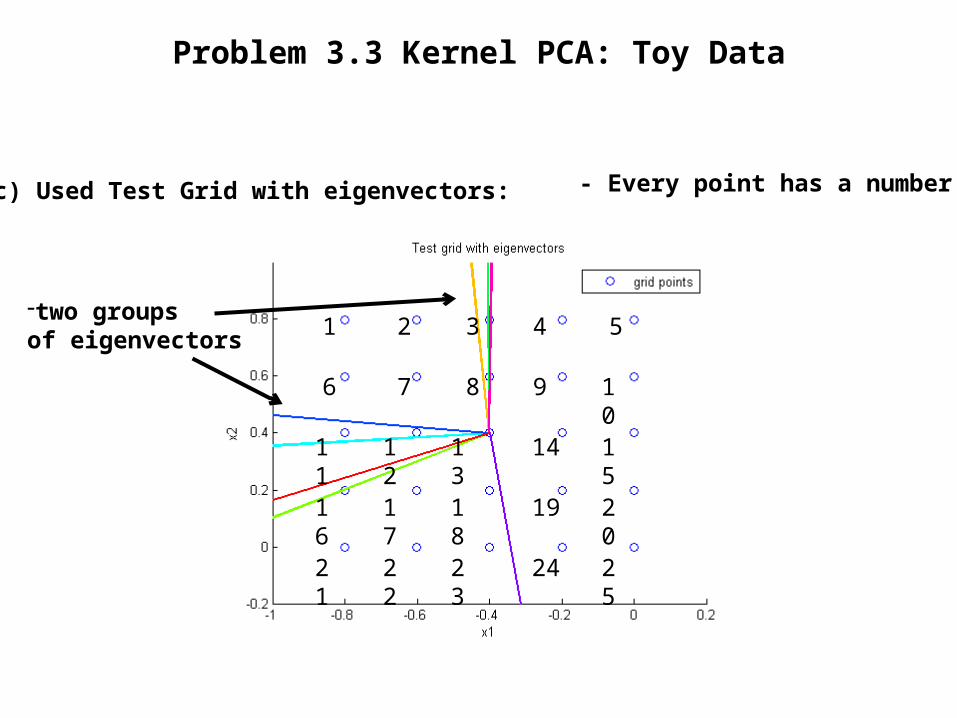
c) Used Test Grid with eigenvectors:
1 2 3 4 5
6 7 8 9 10
11 12 13 14 15
16 17 18 19 20
21 22 23 24 25
- Every point has a number
-two groupsof eigenvectors
Problem 3.3 Kernel PCA: Toy Data
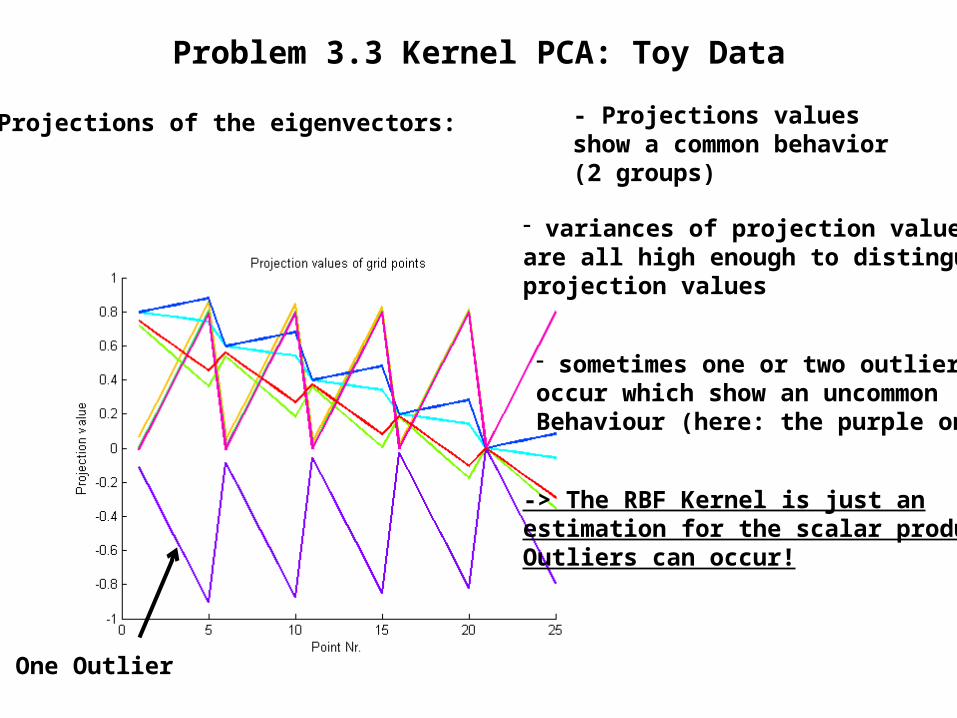
c) Projections of the eigenvectors:
One Outlier
- Projections valuesshow a common behavior(2 groups)
- variances of projection valuesare all high enough to distinguishprojection values
- sometimes one or two outliersoccur which show an uncommonBehaviour (here: the purple one)
-> The RBF Kernel is just anestimation for the scalar products!Outliers can occur!