executive summary the medical device industry in …
TRANSCRIPT

E X E C U T I V E S U M M A R Y
THE MEDICAL DEVICE INDUSTRY INMASSACHUSETTSA l a n C l a y t o n - M a t t h e w sU n i v e r s i t y o f M a s s a c h u s e t t s B o s t o n
Alan Clayton-Matthews is an assistant professor and the director of quantitativemethods in the Public Policy Program at the University of Massachusetts Boston.He is also president of the New England Economic Project.

MassMEDICMassachusetts Medical Device Industry Council
Hooks K. Johnston, Jr. Chairman
Thomas J. SommerExecutive Director
Written and produced by the University of Massachusetts Donahue Institute’sEconomic Research and Analysis division.
Steven LandauDirector
Carolyn Dash MaillerManaging Editor
Rebecca LovelandResearch Analyst
Ruth Malkin and Andrew HallResearch Assistants
Kathleen LaffertyCopy Editor
Nina DudleyDesigner
Copyright 2001
University of Massachusetts Donahue Institute
The contents of this publication may be reproduced only with permission of the author.
This study was funded by MassMEDIC and the University of Massachusetts Economic Project. Copies of
the full study are available from the University of Massachusetts Donahue Institute (413)545-0001.
This publication can be viewed on-line at www.donahue.umassp.edu.

CONTENTS
How Is the Medical Device Industry Defined? ................................................................1
Overview ..................................................................................................................................2
Massachusetts Medical Devices in a National Context: State Rankings ......................2
Basic Characteristics of the Massachusetts and U.S. Medical Device Industry ..........4Number and Size of Establishments ..........................................................................4Industrial Composition of the Medical Device Sector ..............................................4Productivity ................................................................................................................4
Demographic Characteristics of Medical Device Manufacturing Workers ..................5Occupation ..................................................................................................................6Education ....................................................................................................................6Employment Wages, Salaries, and Benefits ..............................................................7Age, Gender, Race, and Ethnicity ..............................................................................7
The Economic Impact of Medical Devices on the Massachusetts Economy: Industry Linkages ..................................................................................................................8
Industry Linkages: Suppliers ......................................................................................8Industry Linkages: Customers ....................................................................................9
The Economic Impact of Medical Devices on the Massachusetts Economy:The Multiplier ........................................................................................................................9
Current and Future Trends ................................................................................................10Employment ..............................................................................................................10Wages and Implied Productivity ..............................................................................10Exports ......................................................................................................................11Trends in Products, Markets, and Technology ........................................................11
Venture Capital ....................................................................................................................13
The Role of Hospitals and Universities............................................................................14
Government Regulation ......................................................................................................14The Food and Drug Administration (FDA) ............................................................14510(k) Submissions....................................................................................................15Premarket Approval Submissions ............................................................................15Industry’s Perception of FDA Regulation ................................................................15Health Care and Financing Administration (HCFA) ............................................15Industry’s Perception of HCFA Regulation ............................................................16
Policy Considerations ..........................................................................................................16
Conclusion ............................................................................................................................17Endnotes ................................................................................................................................18References ............................................................................................................................20

T H E M E D I C A L D E V I C E I N D U S T R Y I N M A S S A C H U S E T T S
We benefit from medical devices throughout our lives, young and old,
healthy and sick. Prenatal development is monitored by ultrasound
devices. Sports injuries are diagnosed with MRI machines and fixed
with arthroscopic tools. Heart blockages are cleared with angioplasties
and drug-coated stents. Devices include the simple and mundane—eyeglasses and
thermometers—and stretch to the boundaries of technology—laser scalpels, needles
embedded with microprocessors, magnetic resonance imaging machines, and artificial
hearts. All are products of the medical device industry.
HOW IS THE MEDICAL DEVICE INDUSTRY DEFINED?
Medical devices have drastically reduced the invasiveness of surgical procedures, short-ened recovery times, and lowered medical costs. This trend is continuing at a rapid
pace, aided by advances in electronics and biotechnology. For diabetics, for example,internal pumps to monitor and deliver insulin are being developed and may be the closestthing yet to an artificial pancreas. Medical devices and biotechnology developments arebecoming more complementary over time, as devices of increasing sophistication and minia-turization are used to deliver new pharmaceutical and biotechnological products. In thefuture, nano devices may be used to deliver biological agents directly to cancer cells.
The field of medical devices is the larger part of a medical science sector that supportsthe health services sector. According to statistics from the 1997 Economic Census(Department of Commerce, 2000a), the medical science sector in Massachusetts wascomposed of three industry groups:
1. Medical devices consisted of 264 manufacturing establishments with 20,756 employees, a payroll of $989 million, and shipments of $4.0 billion.
2. Pharmaceuticals consisted of 57 manufacturing establishments with 5,612 employees, a payroll of $270 million, and shipments of $1.8 billion.
3. Biotechnology consisted of 282 research establishments with 9,311 employees, a payrollof $589 million, and shipments of $1.5 billion.
Altogether, the medical science sector consisted of 603 establishments with 35,679 work-ers, a payroll of over $1.8 billion, and shipments of $7.3 billion. This sector is thereforelarger in size than several key high-technology sectors. It is larger than computers and officeequipment or electronic components (including semiconductors), which had recent employ-ment levels of 25,600 and 31,000, respectively.
THE MEDICAL DEVICE INDUSTRY IN MASSACHUSETTS

OVERVIEW
Massachusetts medical devices contribute to thehealth and quality of life of persons here in the
state and around the world, which may be why so many ofthe sector’s industry executives, scientists, engineers, andproduction workers chose careers in this field. On a moremundane—but still important—level, the production ofmedical devices also contributes to the economic health
and vitality of the Commonwealth. The purpose of thethis report is to enumerate the ways in which the sectoraffects the state’s economy, quantify these effects wherepossible, and explore current and future trends in theindustry.
As a preview, the key findings of the report may bebriefly summarized as follows:❿ Massachusetts is a leading state in the production of
medical devices.❿ Medical device workers are more highly skilled, better
educated, and better paid than workers in manufactur-ing as a whole—and in the economy overall.
❿ Production in Massachusetts is concentrated in surgical
and medical instruments, and electromedical andelectrotherapeutic instruments.
❿ Important linkages exist between medical device manu-facturers and manufacturers of electronics, producers ofprecision metal components, and plasticsmanufacturers.
❿ Every dollar of output produced by medical suppliers isassociated with another 45 cents of goods and servicesproduced by other firms in Massachusetts, and every100 jobs in medical devices is associated with anadditional 79 jobs in the state.
❿ Employment and wages in medical devices have grownfaster than in manufacturing as a whole.
❿ The aging of the population and growth in worldwideper capita incomes should provide a platform for stableand steady growth of the sector.
❿ Research, development, and improvements in techno-logy, so vital to this sector, are supported in large part bythe state’s hospitals and by suppliers of venture capital.
❿ Federal government regulation by the FDA and theHCFA directly impact the sector’s growth andprofitability. Indirectly, they impact the quantity andquality of health care services available to the generalpopulation.
❿ In order to foster continued growth in medical devicesand to keep Massachusetts in the forefront of theindustry, state public policy should focus on providingquality public education, work on lowering the highcost of living in Massachusetts, promote Massachusettsas a place to do business, and develop a liaison with theindustry.
MASSACHUSETTS MEDICAL DEVICES IN A NATIONAL CONTEXT: STATE RANKINGS
Using four measures of economic size and impactfrom the 1997 Economic Census—value of
shipments, employment, payroll, and value added (laborplus overhead)—expressed in both absolute size and percapita terms, Minnesota and Massachusetts appear to bethe two top states in the production of medical devices.Though Massachusetts does not rank first on any of theeight criteria, it ranks high on all.
2
T H E M E D I C A L D E V I C E I N D U S T R Y I N M A S S A C H U S E T T S
Medical Device Employment in Massachusetts, 1997by Industry
ELECTROMEDICAL AND
ELECTROTHERAPEUTIC APPARATUSES
23%
LABORATORY APPARATUSES
AND FURNITURE
4%
SURGICAL AND MEDICAL
INSTRUMENTS
37%
IRRADIATIONAPPARATUSES
9%
IN VITRO DIAGNOSTIC SUBSTANCES
7% OPTHALMIC GOODS
9%
SURGICAL APPLIANCESAND SUPPLIES
11%
SOURCE: U.S. BUREAU OF THE CENSUS,1997 ECONOMIC CENSUS

In terms of sheer size, California and Illinois rank firstand second, respectively, on all four measures.Massachusetts ranks third in value of shipments, fifth inemployment, third in payroll, and fourth in value added.Minnesota ranks fourth in value of shipments, fourth inemployment, fourth in payroll, and third in value added.New York ranks third in employment and fifth in payroll,and Florida ranks fifth in both value of shipments and val-ue added. In terms of population and overall economicactivity, California, Illinois, New York, and Florida are farlarger than either Massachusetts or Minnesota, so theirhigher rankings on measures of absolute size do notindicate a higher concentration of medical devicemanufacturing. To rank states in terms of concentration ofmedical device activity, per capita comparisons areappropriate.
In terms of per capita measures, Minnesota ranks firston all four, whereas Massachusetts ranks third in value ofshipments, employment, and value added, and second inpayroll. Utah, with a small presence in terms of absolutesize, ranks second in employment, fourth in value ofshipments and value added, and third in payroll. Connecti-cut, roughly half the size of Massachusetts in absolute size,ranks second in value of shipments and value added, fourthin employment, and fifth in payroll. Illinois ranks fourth inpayroll and fifth in employment, and Nebraska ranks fifthin value of shipments and value added.
One way to combine these criteria into a singlecomparison measure is to assign a rank score to each and
form each state’s total score as the sum of its rank scoreson each category.1 Using such a simple scheme,Minnesota and Massachusetts rank first and second,respectively, on the four per capita measures and tie forthird on the four absolute size criteria. Combining alleight criteria, Massachusetts ranks second behindMinnesota, and ahead of California, Illinois, Connecticut,and Utah.
The thrust of these rankings is confirmed byconversations with industry executives in theCommonwealth. Minnesota and Massachusetts have simi-lar agglomeration economies, with a favorable mix ofhigher education, medical, and high-tech industries.
Why be concerned about how Massachusetts ranks inmeasures of medical device production relative to otherstates? The one-word answer is “exports.” Over half theoutput of the Commonwealth’s medical device industryis exported to other states or countries.2 Becauserevenues from exports are ultimately received byMassachusetts workers and suppliers of capital to thestate’s medical device companies, industries that exportsupport the state economy’s health and growth. Giventhe agglomeration economies that are favorable toproduction of medical devices—that is, the state’sconcentration in higher education, teaching hospitals,precision production, and electronics—Massachusettswould be expected to rank high in measures of relativeproduction volume, and it does.
T H E M E D I C A L D E V I C E I N D U S T R Y I N M A S S A C H U S E T T S
3
Rankings of Top Five Medical Device States by Production Characteristic
Absolute Size Per Capita
VALUE OF VALUE OF SHIPMENTS EMPLOYMENT PAYROLL VALUE ADDED RANK SHIPMENTS EMPLOYMENT PAYROLL VALUE ADDED
CA CA CA CA 1 MN MN MN MN
IL IL IL IL 2 CT UT MA CT
MA NY MA MN 3 MA MA UT MA
MN MN MN MA 4 UT CT IL UT
FL MA NY FL 5 NE IL CT NE
Source: U.S. Bureau of the Census, 1997 Economic Census

4
T H E M E D I C A L D E V I C E I N D U S T R Y I N M A S S A C H U S E T T S
BASIC CHARACTERISTICS OF THEMASSACHUSETTS AND U.S. MEDICALDEVICE INDUSTRY
Number and Size of Establishments
According to the 1997 Economic Census, therewere 264 manufacturing establishments in the
state’s medical device industry. These companiesemployed 20,800 workers, or 3.39 of every thousand resi-dents. Nationally, there were 335,800 employees in 1997,or 1.26 per thousand residents. The industry is thus 2.7times as concentrated in Massachusetts as in the nationoverall. The value of shipments from the state’smanufacturing facilities totaled $4.0 billion, with apayroll in 1997 of $1.0 billion.
Aggregate sales are dominated by a handful of largecompanies. In a 2000 Boston Business Journal survey ofthe largest 25 medical device employers in Massachusetts,1999 sales ranged from $2.8 billion for Boston ScientificCorp., the largest company, to $2.5 million for UroMedCorp., the 24th-ranked company in terms of sales.
As of 1998, there were just over two dozenMassachusetts-headquartered, publicly held medical
companies, with $3.2 billionin sales. Although the vastmajority of companies areprivately held and small bycomparison (approximatelyhalf of these manufacturingestablishments were small,employing fewer than 20employees), they arecritically important to the
vitality and technological advancement of this industry.One indicator is the scale of venture capital funding,which is targeted to small start-ups. Over the fourquarters ending in the third quarter of 2000, venture capi-tal funding received by the state’s medical device firmstotaled $314 million (PriceWaterhouseCoopers, 2000). Toillustrate its magnitude, this investment is roughly equalto the total research and development spending of the 26Massachusetts-headquartered publicly held medical devicecompanies in 1997 and is nearly twice the amount spent in
1997 on capital expenditures for all medical devicemanufacturing establishments in the state.
Industrial Composition of the MedicalDevice SectorIn Massachusetts, the largest industry in the medicaldevice sector, with 37 percent of medical deviceemployment, is surgical and medical instruments. Thenext largest, with 23 percent of employment, iselectromedical and electrotherapeutic apparatuses. Incontrast, these two industries comprise 31 percent and 16percent of national medical device employment,respectively. The relative concentration of these twoindustries in Massachusetts reflects the state’scomparative specialization in precision specialtyproduction and electronics.
The distribution of employment in Massachusettsamong the other medical device industries is 11 percent insurgical appliances and supplies, 9 percent in irradiationapparatuses, 9 percent in ophthalmic goods, 7 percent inin vitro diagnostic substances, and 4 percent in laboratoryapparatuses and furniture. Relative to the nation as awhole, Massachusetts has a higher proportion of itsemployment in irradiation apparatuses and a lowerproportion in surgical appliances and supplies and in vitrodiagnostic substances.
ProductivityAnother important industry characteristic is productivity.In conjunction with employment, productivitydetermines the sector’s contribution to the economicproduct and income it generates. Whereas Massachusettsmanufacturing overall is characterized by high productiv-ity relative to the nation, medical devices is a high-productivity sector relative to manufacturing withinMassachusetts. According to the 1997 Economic Census(U.S. Department of Commerce, 2000a), productivity inmedical devices, measured by the value added perproduction worker hour,3 exceeds that of overallmanufacturing in Massachusetts by 52 percent, capitalexpenditures per worker in medical devices exceed thoseof overall manufacturing in Massachusetts by 26 percent,and the proportion of employees who hold non-
photo courtesy of Smith & Nephew, Inc., Endoscopy Division

T H E M E D I C A L D E V I C E I N D U S T R Y I N M A S S A C H U S E T T S
5
production-related positions in medical devices exceedsthat of overall manufacturing in Massachusetts by 51.6percent to 38.4 percent.
Value added per production worker hour averaged$129 per worker hour for medical devices inMassachusetts in 1997 versus $115 per worker hour forthe U.S. medical device sector. The higher overallproductivity in the state partly reflects a relativeconcentration in higher productivity industries—valueadded in electromedical and electrotherapeuticapparatuses was $178 per worker hour, for example—but,in addition, the state’s workers are more productive thanthe U.S. average in four of the sector’s seven industries.Those industries in which Massachusetts is less productivethan the national average—in vitro diagnostics substances,irradiation apparatuses, and ophthalmic goods—accountfor less than a quarter of employment in the industry.
These differences in productivity betweenMassachusetts and the nation as a whole may reflect theproduction of a different combination of products withineach of the seven industries as well as different production
technologies. In any case,higher productivity inMassachusetts is a commontheme across all manufactur-ing. The state has acomparative advantage inproducing products thatrequire higher skills or moreintensive use of engineering,and the area of medicaldevices is no exception(Clayton-Matthews, 1999).In the case of medicaldevices, higher productivityin Massachusetts versus theU.S. average is attained byhigher capital expendituresper worker and a less intenseuse of production workersrelative to non-productionworkers. Capital expend-itures per worker are higher
in Massachusetts relative to the nation as a whole in thosemedical device industries that have higher value added.Less intense use of production workers is probablyassociated with a more intense use of scientists andengineers (including computer-related engineers).4 Fiveof the state’s medical device industries have significantlylower proportions of their workforce in production thando their corresponding industries nationwide. For the twoexceptions—electromedical and electrotherapeuticapparatuses and in vitro diagnostic substances—theMassachusetts and U.S. proportions are similar.
DEMOGRAPHIC CHARACTERISTICS OF MEDICAL DEVICEMANUFACTURING WORKERS
5
Who works in the medical device industry, and whatare the demographic and economic charac-
teristics—gender, age, race, education, and occupation—of these workers? Does the industry provide good jobs atgood wages? The answers to these questions for thenation as a whole are provided by the March Current
0 10,000 20,000 30,000 40,000 50,000 60,000
United States
Massachusetts
All sectors combined
Opthalmic goods
Surgical appliances8and supplies
Surgical and8medical instruments
Laboratory apparatuses8and furniture
Irradiation apparatuses88
Electromedical and electrotherapeutic apparatuses
In vitro diagnostic8substances8
8
8Capital Expenditures per Production Worker, 0
United States versus Massachusetts, 1997
Source: U.S. Bureau of the Census 1997 Economic Census
(Nominal Dollars)
2001 Dollars

6
T H E M E D I C A L D E V I C E I N D U S T R Y I N M A S S A C H U S E T T S
Population Surveys (CPS) for1994 through 1998.
OccupationThe occupational distribution ofmedical device workers, likemanufacturing, is weightedmuch more heavily thannonmanufacturing towardmachine operators, assemblers,inspectors, and transportationand material-moving equipmentoccupations. Medical devices,however, employs a smaller pro-portion of its workers in theseoccupations than manufacturingoverall, 42.6 percent versus 49.9percent. Medical devices has37.6 percent of its workforce inexecutive, administrative, mana-gerial, professional specialty,and technical occupations, muchhigher than in manufacturing asa whole (25.5 percent) and substantially higher than in alljobs (27.5 percent). This concentration of employment inoccupations requiring higher levels of education isassociated, as discussed later, with higher levels ofeducational attainment and higher wages and salaries. Theproportion of medical device workers in sales occupationsis somewhat higher than in the rest of manufacturing, 5.3percent versus 3.9 percent. This difference reflects themore intense marketing effort required relative to mostother manufacturing industries, because medical deviceproducts need to be marketed to individual physicians.
Sales jobs in medical devices, and in manufacturing ingeneral, cannot be compared with the broad sales categoryfor all workers, which make up 14.3 percent of all jobs; theoverwhelming majority of jobs in the broader category arein retail sales establishments and are quite different inboth character and skill from sales jobs in manufacturing.The proportion of medical device workers in clericaloccupations, 10.8 percent, is about the same as inmanufacturing overall, 10.0 percent, and less than in the
overall economy, 13.1 percent. Not surprisingly, themedical device industry, like manufacturing, employs veryfew workers classified in service occupations.
EducationThe proportion of medical device workers who havecollege educations is substantially higher than that forother manufacturing workers and for all other workers.Just over half, 50.7 percent, of all workers have at leastsome college education. The proportion of allmanufacturing workers with at least some collegeeducation is lower, at 44.1 percent, but in medical devices,it is higher, at 57.1 percent. Furthermore, the proportionof workers who have college degrees is higher in medicaldevices than in the economy as a whole: 9.2 percent ofmedical device workers have associate’s degrees, 18.4percent have bachelor of arts or bachelor of sciencedegrees, and 12.0 percent have professional or graduatedegrees. The corresponding figures for all workers are,respectively, 7.8, 15.8, and 6.3 percent.
0.000
0.005
0.010
0.015
0.020
0.025
0.030All Employment
All Manufacturing
Medical Device Industry
0 30,000 60,000 90,000 120,000
U.S. Annual Wage Distribution for All 0
Employment, Manufacturing, and Medical Devices
Source: U.S. Bureau of the Census Current Population Surveys 1994-1998
Pro
po
rtio
n o
f W
ork
ers
at W
age
Rat
e
Wages in U.S. Dollars
8

T H E M E D I C A L D E V I C E I N D U S T R Y I N M A S S A C H U S E T T S
7
Employment Wages, Salaries, and BenefitsNot surprisingly, wages and salaries in medical devices arehigher than in the economy as a whole and in manufactur-ing as a whole. Median annual wages of medical deviceworkers were $30,000 during 1994–1998, according to theCPS, versus $28,000 in manufacturing and $21,243 for allworkers.6 Even though manufacturing workers on thewhole have a lower level of educational attainment than allworkers, they are generally paid better, which is true atevery level of educational attainment. For college-educated medical device workers, this premium is evengreater. A medical device worker with an associate’s degreeearned an average annual salary of $41,145 in 1994–1998,versus $36,916 in all manufacturing and $30,470 in alljobs. A medical device worker with a bachelor’s degreeearned on average $66,292 per year versus $54,012 in allmanufacturing and $44,307 in all jobs; a medical deviceworker with a professional or graduate degree earned onaverage $85,101 per year versus $77,477 in allmanufacturing and $70,704 in all jobs. These premiumsprobably reflect the value of specific job training for those
with a high school education or less and higher marketvaluations for degrees related to medical device researchand development for those with a college education. Manymedical device workers earn salaries that are quite high.One in twenty earned more than $100,000 per year in the1994–1998 period.
Medical device employers also gave their workersbetter benefits than employers in manufacturing as awhole. In the 1994–1998 period, 75 percent of medicaldevice workers had employer- or union-provided healthinsurance versus 71.3 percent of all manufacturingworkers and 50.1 percent of all workers. Pension andretirement benefits were also more common in medicaldevice firms, with 62.8 percent of employees participatingin employer or union plans versus 57.3 percent of all man-ufacturing employees and 36.7 percent of all employees.
Age, Gender, Race, and EthnicityThe age distribution of medical device workers is muchlike that of manufacturing, which in turn is just slightlyolder than of the nation’s workforce as a whole. The medi-
an age of medical device workers is 39,with half of workers (i.e., the interquartilespread) between the ages of 32 and 48.This median is the same as inmanufacturing as a whole and is slightlyolder than for all workers, where the medi-an age is 37, and where half of all workersare between 27 and 47 years of age.
The gender distribution in medicaldevices is more equal than in othermanufacturing and is much like that ofoverall employment. In medical devices,46.5 percent of workers are women, versus33.0 percent in all manufacturing and 45.5percent for all workers.
The racial and ethnic composition ofworkers in the U.S. medical deviceindustry is different from the rest of manu-facturing and the overall workforce in tworespects. Although the composition ofworkers in manufacturing is much like thatof the rest of the economy, there are0
$10,000
$20,000
$30,000
$40,000
$50,000
$60,000
$70,000
All Manufacturing
Medical Devices
1999199819971996199519941993
Massachusetts Annual Wages in 0
Medical Devices and Manufacturing, by Year
Source: Massachusetts Division of Employment and Training, ES-202

8
T H E M E D I C A L D E V I C E I N D U S T R Y I N M A S S A C H U S E T T S
proportionately fewer black non-Hispanics and moreAsian Americans in the medical device industry. Thisdifference may be related to the industry’s concentrationin specific metropolitan areas with higher concentrationsof Asian Americans and lower concentrations of AfricanAmericans than in the nation as a whole.
THE ECONOMIC IMPACT OF MEDICALDEVICES ON THE MASSACHUSETTSECONOMY: INDUSTRY LINKAGES
7
Massachusetts purchasers bought medical devicesworth $1.57 billion in 1998 (all dollar figures in
this section are in 1992 dollars), of which $1.342 billion,or 85 percent, were purchased from Massachusettsproducers. Massachusetts medical device manufacturerssold another $1.441 billion worth of devices to the rest ofthe United States and worldwide, so the industryexported more than half its output of $2.784 billion.Value added generated by the medical device industry in1998 was $1.529 billion. This figure represents thecontribution of medical devices to the gross state productfor 1998.
The economic impact of the medical device industrycan be understood by tracing the purchases required toproduce its output. For Massachusetts medical devices,the breakdown of purchases is materials, 45 percent;labor, 21 percent; and overhead, 34 percent. The last twocomponents form what economists call value added.Every dollar of a representative firm’s output consists of45 cents’ worth of materials and services purchased fromother firms plus 55 cents of value that is added by thefirm’s own production process. This 55 cents is paid outas wages and salaries, benefits, rents, business taxes,profits to investors, depreciation accounts, and researchand development.
Of the 45 cents’ worth of materials and servicespurchased from other firms required to produce a dollarof output in medical devices, 22 cents representspurchases from suppliers in the state and 23 cents fromsuppliers outside the state. Only the former has aneconomic effect on Massachusetts; the latter representsimports of materials or components from other statesand countries.
Industry Linkages: SuppliersEvery $1 million of medical device output requirespurchases of $88,900 from the electronic components andaccessories industry. Of this amount, $23,600 is fromsuppliers located in Massachusetts and $66,300 is fromout-of-state suppliers. In terms of cost, the electroniccomponents industry is the number one supplier to themedical device industry. Even though only 25 percent ofelectronic component inputs are purchased from in-statesuppliers, this proportion is many times theCommonwealth’s electronic components companies’ shareof the national/international market in electronics,illustrating two important and related aspects of thelinkages in the economy. First, medical devicemanufacturers, some of whom are primarily “testing andassembly” producers, often prefer using local suppliersbecause it allows greater control and management overtheir inputs. Such controlis very important forproducts that arespecialized, have highvalue added, or are inearly stages of productionand testing. Second, link-age is an aspect of thestate’s agglomerationeconomy in which theconfluence of supplyingand purchasing industriesin geographic proximityallow more efficient—that is, cheaper—produc-tion than would otherwise be the case.
The close connection between the medical device andelectronics industries also adds an element of stability tothe electronics industry and therefore to theMassachusetts economy. Most of the output of theelectronics industry goes to the supply of consumerelectronics and business investment goods, each of whichoperates on its own cycle of ebbs and flows in demand.The medical device industry adds another importantsource of demand, thus diversifying the sales base for theelectronics industry. Moreover, the long-term outlook for
Every dollar of
medical device output is
associated with, or connected
to, an additional 45 cents of
output of Massachusetts firms,
and every 100 jobs in medical
devices is associated with
another 79 jobs in
Massachusetts.

T H E M E D I C A L D E V I C E I N D U S T R Y I N M A S S A C H U S E T T S
9
medical devices isfor strong and rel-atively steadygrowth, asdemand for healthservices worldwideexpands with anaging populationand growth inworldwideincomes.
Next in impor-tance is the medical equipment industry itself. For every$1 million of medical devices produced, manufacturers inthe state purchase $47,800 of products from other medicaldevice firms. Furthermore, all but $4,300 of thesepurchases are made from establishments located withinthe state. Wholesale trade markups of $39,600 constitutethe next largest expenditure, and again, most go to in-statesuppliers. Other important suppliers include plastics, met-al products, transportation and communications services,and real estate.
Purchases of material and service inputs total $450,800for every $1 million of output, $218,800 from suppliers situated in Massachusetts, and $232,000 imported fromsuppliers outside Massachusetts. Labor costs total$206,800, and overhead/profit components total $342,400.
Industry Linkages: CustomersDue to intermediate goods production in the medicaldevice industry, the top purchaser is the medicalequipment industry itself. Not surprisingly, the health sec-tor is the other major customer of medical devices. Forevery $1 million of services provided by hospitals,hospitals buy $28,120 worth of medical equipment, instru-ments, and supplies; for every $1 million of services theyprovide, health practitioners purchase $25,050 of goodsfrom medical device companies. For nursing and personalcare facilities, $11,100 in medical devices are purchasedper $1 million of services provided; for ophthalmic goodsproducers, $19,160; and for health services not elsewhereclassified, $46,090. Other sectors are relatively smallpurchasers of medical device equipment and supplies.
THE ECONOMIC IMPACT OF MEDICALDEVICES ON THE MASSACHUSETTSECONOMY: THE MULTIPLIER
The economic effects of the medical device industrygo beyond the initial purchases of that industry
itself. They extend directly to firms that supply medicaldevice firms, to firms that produce the consumer goodsand services purchased by the workers, and to owners ofthese firms. The ratio of these initial, direct, and inducedeffects to the initial purchases is the economic impactmultiplier. The output and employment multipliers formedical devices in Massachusetts are 1.45 and 1.79,respectively.
These multipliers mean that every dollar of medicaldevice output is associated with, or connected to, anadditional 45 cents of output of Massachusetts firms, andevery 100 jobs in medical devices is associated with anoth-er 79 jobs in Massachusetts. Applying these multipliers tothe 1997 value of shipments of $3.996 billion and employ-ment of 20,756 from the 1997 Economic Census, the totaleffect of the medical device industry on the state’s 1997economy was approximately $5.8 billion and 37,000 jobs.In other words, the industry is associated with that mucheconomic activity in Massachusetts.
That statistic, however, does not mean that everyadditional dollar of output in medical devices adds $1.45to total output or that every additional 100 jobs in thesector add 179 jobs to the Commonwealth, at least not inthe short term. The expansion in medical devices in theshort term comes at some expense to other sectors bybidding material and service inputs and labor away fromother sectors of the economy. Even in the long term, theeconomic impact is somewhat less than these multiplierssuggest, because the supply of usable real estate for man-ufacturing is not unlimited. Nor is there any guaranteethat even if the real estate were developed, additionalworkers would come. The long-term impact multipliers,however, are probably close to 1.45 for output and 1.79for employment. Even in the short term, there is someadditional effect beyond a dollar-for-dollar change inaggregate output for a change in medical devices becauseof the agglomeration economies already noted. A signifi-cant capacity of plastics and metal fabrication
photo courtesy of Smith & Nephew, Inc., Endoscopy Division
10
T H E M E D I C A L D E V I C E I N D U S T R Y I N M A S S A C H U S E T T S
manufacturing, for example, would not exist in the Com-monwealth in the absence of a medical device industry.
CURRENT AND FUTURE TRENDS
The Commonwealth’s medical device industry isgrowing rapidly. Employment, wages, productivity,
and foreign exports in this industry have been growingfaster than manufacturing as a whole in Massachusetts,and medical device wages and foreign exports have beengrowing faster recently in Massachusetts than in thenation.
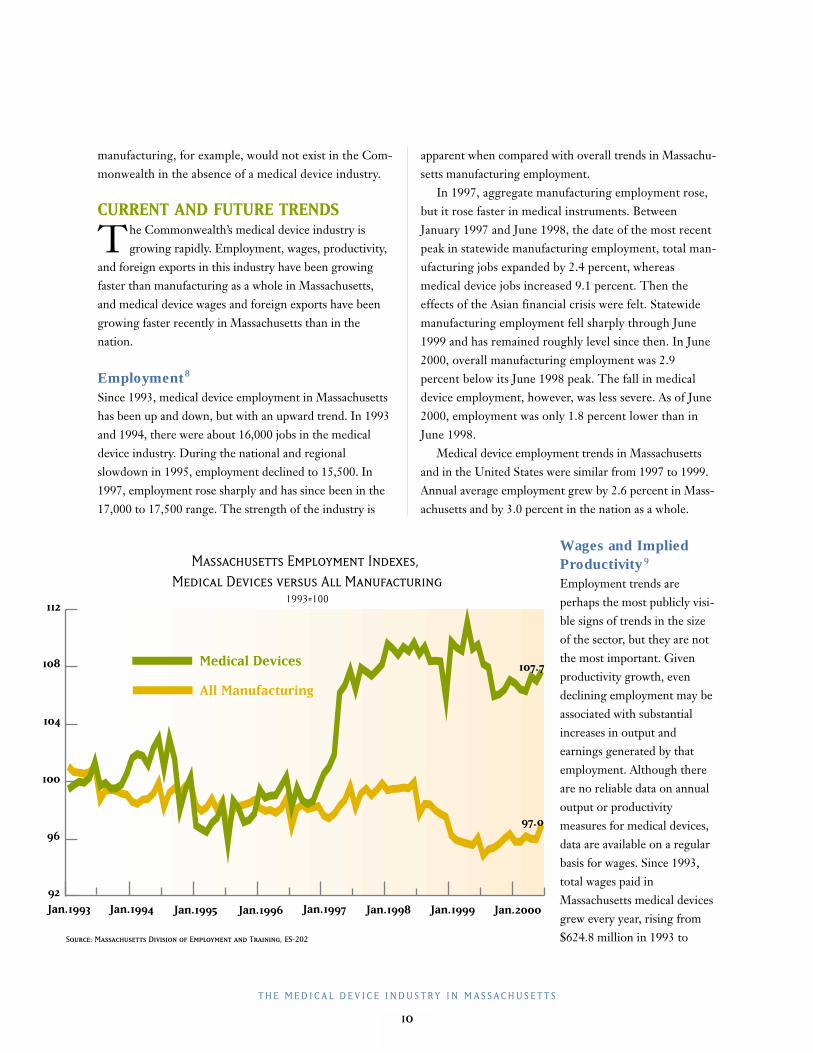
Employment8
Since 1993, medical device employment in Massachusettshas been up and down, but with an upward trend. In 1993and 1994, there were about 16,000 jobs in the medicaldevice industry. During the national and regionalslowdown in 1995, employment declined to 15,500. In1997, employment rose sharply and has since been in the17,000 to 17,500 range. The strength of the industry is
apparent when compared with overall trends in Massachu-setts manufacturing employment.
In 1997, aggregate manufacturing employment rose,but it rose faster in medical instruments. BetweenJanuary 1997 and June 1998, the date of the most recentpeak in statewide manufacturing employment, total man-ufacturing jobs expanded by 2.4 percent, whereasmedical device jobs increased 9.1 percent. Then theeffects of the Asian financial crisis were felt. Statewidemanufacturing employment fell sharply through June1999 and has remained roughly level since then. In June2000, overall manufacturing employment was 2.9percent below its June 1998 peak. The fall in medicaldevice employment, however, was less severe. As of June2000, employment was only 1.8 percent lower than inJune 1998.
Medical device employment trends in Massachusettsand in the United States were similar from 1997 to 1999.Annual average employment grew by 2.6 percent in Mass-achusetts and by 3.0 percent in the nation as a whole.
Wages and ImpliedProductivity 9
Employment trends areperhaps the most publicly visi-ble signs of trends in the sizeof the sector, but they are notthe most important. Givenproductivity growth, evendeclining employment may beassociated with substantialincreases in output andearnings generated by thatemployment. Although thereare no reliable data on annualoutput or productivitymeasures for medical devices,data are available on a regularbasis for wages. Since 1993,total wages paid inMassachusetts medical devicesgrew every year, rising from$624.8 million in 1993 to
All Manufacturing
Medical Devices
Jan.1993 Jan.1994 Jan.1995 Jan.1996 Jan.1997 Jan.1998 Jan.1999 Jan.2000
Massachusetts Employment Indexes, 0
Medical Devices versus All Manufacturing01993=100
Source: Massachusetts Division of Employment and Training, ES-202
96
92
104
108
112
100
97.0
107.7
T H E M E D I C A L D E V I C E I N D U S T R Y I N M A S S A C H U S E T T S
11
$1,096.5 million in 1999, a 75 percent increase. Thisgrowth reflects both increased employment and increasedproductivity. Because relationships between wages, valueadded, and output tend to change very slowly over time,this measure is a good proxy for the growth in output dur-ing this time. The best proxy for productivity growthavailable from these data is obtained from the trend intotal wages per worker. Average annual wages rose from$39,300 per worker in 1993 to $63,500 per worker in1999, an annual average growth of 8.3 percent. From 1993to 1999, average annual wages per worker in allMassachusetts manufacturing grew at the slower annualaverage rate of 5.6 percent by year, suggesting thatproductivity in medical devices grew faster than inmanufacturing as a whole.
From 1997 to 1999, wages per worker in medicaldevices rose faster in Massachusetts than in the United
States as a whole, at an annual average rate of 12.6 percentversus 6.7 percent, suggesting that productivity growth inMassachusetts may have been higher than in the nation.
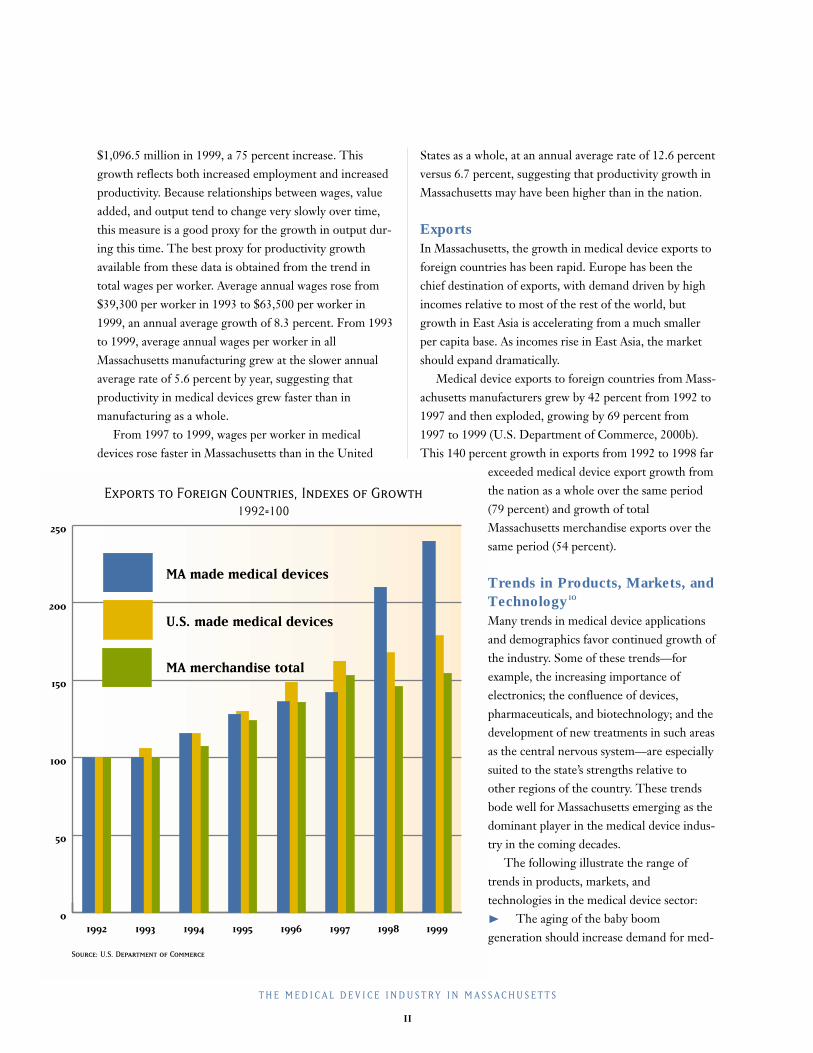
ExportsIn Massachusetts, the growth in medical device exports toforeign countries has been rapid. Europe has been thechief destination of exports, with demand driven by highincomes relative to most of the rest of the world, butgrowth in East Asia is accelerating from a much smallerper capita base. As incomes rise in East Asia, the marketshould expand dramatically.
Medical device exports to foreign countries from Mass-achusetts manufacturers grew by 42 percent from 1992 to1997 and then exploded, growing by 69 percent from1997 to 1999 (U.S. Department of Commerce, 2000b).This 140 percent growth in exports from 1992 to 1998 far
exceeded medical device export growth fromthe nation as a whole over the same period(79 percent) and growth of totalMassachusetts merchandise exports over thesame period (54 percent).
Trends in Products, Markets, andTechnology 10
Many trends in medical device applicationsand demographics favor continued growth ofthe industry. Some of these trends—forexample, the increasing importance ofelectronics; the confluence of devices,pharmaceuticals, and biotechnology; and thedevelopment of new treatments in such areasas the central nervous system—are especiallysuited to the state’s strengths relative toother regions of the country. These trendsbode well for Massachusetts emerging as thedominant player in the medical device indus-try in the coming decades.
The following illustrate the range oftrends in products, markets, andtechnologies in the medical device sector: ❿ The aging of the baby boomgeneration should increase demand for med-
0
50
100
150
200
250
MA merchandise total
U.S. made medical devices
MA made medical devices
19991998199719961995199419931992
Exports to Foreign Countries, Indexes of Growth01992=100
Source: U.S. Department of Commerce

12
T H E M E D I C A L D E V I C E I N D U S T R Y I N M A S S A C H U S E T T S
ical procedures that use medical devices. The boost indemand will be supported by the sheer number ofolder Americans, their willingness to spend on healthservices, and their wealth to support such spending.
❿ Worldwide growth in economic output and per capitaincomes will support increased demand for medicaldevices, because per capita expenditures on health serv-ices should rise with per capita income. This increasein demand favors medical devices made in the UnitedStates, because the U.S. Food and DrugAdministration (FDA) approval process is widelyviewed as the gold standard in establishing a product’ssafety and effectiveness. These trends are becomingevident in export growth to Europe and (even more)rapidly rising exports to Asia.
❿ With the aid of medical devices, the trend in surgery isfor faster and less invasive procedures that result in lesstrauma, fewer complications, and shorter recoverytimes. Thus, efficiency and cost saving in the provisionof medical services is tied to increased use and develop-ment of medical devices. For example, the typicalrecovery time for many arthroscopy surgeries has beenreduced from five or six weeks to one week.
❿ Medical devices will increasingly be involved indelivering pharmaceutical products. Recent examplesof this trend include (1) the coating of stents withmedicines that retard the formation of scar tissuearound these stents, (2) the development of needlesand pumps that regulate the delivery of insulin indiabetes patients, and (3) the use of silicon skinpatches to facilitate the delivery of a wide range ofpharmaceuticals.
❿ Another related trend is in the composition of productsthat are implanted or used to attach, stitch, staple, orotherwise fix internal parts of the body. The use ofmetal and other materials for these products is shiftingtoward bioabsorbable products and to genomicproducts that trigger the body to repair itself.
❿ The previous two trends are examples of a more gener-al trend coined “hybrid” technologies. This trend intechnology is being mirrored in the industrialorganization of the industry, with partnerships betweeninstrument makers and biotechnology firms and,
increasingly, with the formation of hybrid firmsthrough mergers and acquisitions.
❿ The market for cardiology applications continues togrow, but the next big wave is in the neural radiologymarket. In the 1970s and 1980s, new technology inmedical devices focused on the heart; in the early partof the twenty-first century, the focus will be on thebrain and central nervous system. Massachusettsshould benefit from this trend, especially because MIThas established a new center devoted exclusively tobrain research.
❿ Testing for in vitro and other devices is moving closerto the patient. In the past, such devices were usedprimarily in the lab. Today, they are frequently used atthe hospital bedside. In the future, they will be usedmore frequently in the physician’s office and in thepatient’s home.
❿ Reflecting the trend toward direct use by patients,marketing is also increasingly aimed directly at theultimate consumer. Two examples of devices beingmarketed directly are home glucose testing devices anddefibrillators.
❿ Electronics are becoming increasingly important.Trends in increased computing power and the smallersize of electronic components are resulting in medicaldevices that are smaller, mechanically simpler, andtherefore more reliable and more powerful in whatthey can do. This trend plays into one of the state’scomparative advantages, because Massachusetts is moreconcentrated in electromedical equipment than is thenation as a whole.
❿ There is more manufacturing of products that are pro-duced in high volume outside Massachusetts andoutside the country. This trend is common to all man-ufacturing, not just medical devices. Such products areat the mature end of the product cycle. Typically, theseproducts have large markets, price competition isfierce (and therefore profit margins are low), theproduction process is fully developed andstandardized, and significant cost savings can beachieved by exploiting low-cost labor. The type ofmanufacturing that remains—and is growing—inMassachusetts involves high research and development

T H E M E D I C A L D E V I C E I N D U S T R Y I N M A S S A C H U S E T T S
13
expenditures, prototyping, product design, technicalsupport, and large marketing expenditures. Thesecharacteristics are typical of products in the beginningstages of the product cycle.
❿ Two other manufacturing trends are (1) an increasingreliance on metal injection molding to replace complexmetal parts and (2) new data systems being used notonly to track inventories and the manufacturingprocess but also customers’ inventories so that, forexample, hospitals can maintain a stock of devices fortheir physicians more efficiently.
VENTURE CAPITAL
By financing the development of new technologies instart-up firms, venture capital funding plays a crucial
role in the growth of the medical device industry. In thefour-quarter period ending in the third quarter of 2000,Massachusetts firms received a total of $314 million inventure capital financing.11
The medical device sector competes with othertechnology-related sectors for venture capital funding,principally information technology (IT) andbiotechnology. The total supply of venture capital fundsdepends in part on investors’ perceptions of the likelihoodof successful “liquidity events” such as initial publicofferings (IPOs) or acquisitions in which investors recouptheir initial outlay plus a substantial profit.
Nationally, the medical device industry received 2.3percent of all venture capital funding in the four-quarterperiod ending in the third quarter of 2000 (the mostrecent period for which data are available). The share ofall venture capital funds going to medical devicecompanies is roughly equivalent to that received bybiotechnology firms, but well below that received by firmsin the IT sector. The relative unattractiveness of medicaldevice companies compared with IT is largely due to thelonger time to a liquidity event, especially an IPOoutcome, because FDA approval to market a device andHealth Care and Financing Administration (HCFA) reim-bursement approval needed to make the device profitableare time-consuming processes. The time to profitability ofIT ventures is perceived to be much shorter. Medicaldevices, however, compares favorably with biotechnology
on this score,especially if adevice can beregistered withthe FDA as a510(k) device.A 510(k) device can usually be brought to market quickly,without the need for clinical trials. (See discussion onFDA regulation, page 15.)
The competition of venture capital funds is alsoaffected by the size of the expected return and the risk of areturn. By their nature, venture capital investments arerisky. The expectation is that many, if not most, ventureswill fail to be profitable, but those that are will beprofitable enough to compensate for failed ventures. Rela-tive to biotechnology, medical devices are perceived to beless risky, but successes are perceived to be less profitable.The risk advantage derives from the small probability, inpharmaceuticals, of discovering a safe and effective drugrelative to the probability, in medical devices, ofdeveloping a safe and effective instrument. On the otherhand, the payoff to a successful drug is enormous relativeto the payoff to a successful device, because once the drugor device is approved for marketing, the marginal costs ofproducing a drug are typically very small relative to thoseof producing a medical device.
Massachusetts receives roughly 10 percent of the totalsupply of venture capital funds for medical devices in theUnited States, although the amount can vary markedly inthe short run. For the four-quarter period ending in thethird quarter of 2000, the state received 19.5 percent of allU.S. venture capital funding for medical devices. That fig-ure, however, is inflated by the remarkably successful firstquarter of 2000, when Massachusetts medical device com-panies received $163.3 million, nearly half of the U.S.total. In the next two quarters, Massachusetts companiesreceived $30.9 million and $46.2 million, representing 9.2percent and 8.7 percent of the U.S. total.
In the amount of venture capital funding it receives,how does Massachusetts fare relative to other areas? Interms of the share of national venture capital financing,the state does well. Its share of national venture capitalfunding for medical devices, roughly 10 percent, exceeds
14
T H E M E D I C A L D E V I C E I N D U S T R Y I N M A S S A C H U S E T T S
what would be expected based on medical device industrymeasures, such as the share of national shipments, valueadded, or employment, which is approximately 6 to 7percent. On the other hand, venture capital funding isconcentrated in a handful of regions, including SiliconValley, New England, San Diego, the Midwest, and theSoutheast. Although New England and Massachusettstypically rank second or third, Massachusetts falls farbehind Silicon Valley in the share of funds it receives.
THE ROLE OF HOSPITALS ANDUNIVERSITIES
12
Teaching hospitals and universities play an arguablymore important role in the growth of the medical
device sector than venture capital does. More research isdone in these institutions than in private industry, oftenresulting in the licensing of technology to medical devicefirms and occasionally in the formation of start-upcompanies or joint ventures with existing companies.Massachusetts hospitals and universities license and formventures with companies around the world, but roughly30 to 40 percent of the deals are with in-state partners.
Although aggregate figures for the effect on themedical device industry are not available, the order of
magnitude can be inferredfrom a couple of examples.The University ofMassachusetts receivesapproximately $200million in research moneyannually, more than half ofwhich goes to the UMassMedical Center. Theuniversity’s Office ofCommercial Ventures andIntellectual Property hadlicense revenues of $4 mil-lion to $5 million in 2000,and such revenues have
been rising at double-digit rates since the office wasstarted in 1995. Roughly three-quarters of these revenuesare medical related, and somewhat more than 10 percentare due directly to medical devices.
Universities attribute the rapid growth in the licensingof sponsored research to the Bayh-Dole Act, passed in the1980s. This legislation allows universities to own theintellectual property created by faculty and researchpersonnel. Other countries are beginning to emulate thismodel, an indication of the policy’s success in increasingthe volume of university-sponsored research.
In another example, Massachusetts General Hospitaldoes $250 million in research annually, with a significantportion related to medical device research in lasers,imaging devices such as MRIs, and other radiologyapplications. Much of this research is performed in thehospital’s Center for Minimally Invasive Technologies.Medical device–related licensing revenues are running atabout $2 million per year. The role of such research inother teaching hospitals is similar, although the scale isless than at Mass General or Brigham and Women’s,which rank first and second, respectively, in the volume of research performed by Massachusetts hospitals.
GOVERNMENT REGULATION
Medical device manufacturers are subject toregulation from two federal government regulatory
bodies, the FDA and the HCFA. These two agencieseffectively control whether or not a device may be market-ed and, if so, whether or not it will be profitable. TheFDA requires that a device be proven to be both safe andeffective. Before allowing a device to be reimbursableunder federal health programs, including Medicare andMedicaid, the HCFA conducts an additional assessment ofeffectiveness and requires the device be cost effective.
The Food and Drug Administration (FDA)Prior to 1976, there was little regulation of medical devices,and new device could be brought to the market rapidly. InMay 1976, the FDA promulgated regulations that classifiedany product currently on the market as a class I, II, or IIIdevice. Class I and class II devices were assumed to be safeand effective. Class III devices might require some data inthe future to demonstrate safety and effectiveness. Devicesin all three classes are called “old” devices.
In 1990, following several years of negotiation inCongress, the Safe Medical Devices Act (SMDA) was
Universities attribute
the rapid growth in
the licensing of sponsored
research to the Bayh-Dole
Act, passed in the 1980s.
This legislation allows
universities to own the
intellectual property created
by faculty and research
personnel.

T H E M E D I C A L D E V I C E I N D U S T R Y I N M A S S A C H U S E T T S
15
passed, which dramatically increased the federalgovernment’s role in regulating the introduction of newdevices to the market. At the time, the industry wasconcerned that the regulations were too complex, that theFDA was understaffed, and that the FDA would not beable to apply the regulations consistently (Olsen, 1993).
Today, when a company wants to bring a new device tothe market, it must notify the FDA 90 days prior tomarketing. The FDA then determines whether or not thedevice is new or if it can be considered substantially equiv-alent to an “old” device.
510(k) SubmissionsIf the claim is that a device is substantially equivalent to an“old” one, the FDA may require a demonstration of thatequivalence. Applications claiming equivalence to an olddevice are called 510(k) submissions. If a company needsto demonstrate equivalence to an old device, data on clini-cal human experience are filed in compliance with investi-gational device exemption (IDE) regulations for investiga-tions performed in the United States. A company mustwait for the FDA to issue an order finding substantialequivalence before it can put its device on the market.This route to the market is relatively short, even for mostclass III devices, unless the FDA calls for safety andeffectiveness data for that device.
Premarket Approval SubmissionsIf the device is new and is not substantially equivalent toan existing product, or if the device is a class III deviceand the FDA requires a safety and effectivenessdemonstration, the company must file a premarketapproval (PMA) application. Generally, the companymust conduct clinical trials (that comply with IDEregulations if that trial is conducted in the United States).The FDA will approve the PMA application if it isreasonably assured that the device is safe and effective forits intended purpose.
The FDA has wide latitude in its requirements. Almostall PMA routes to bringing a product to market require aclinical study. In recent years, the agency has becomemore inclined to require randomized control designs,which have resulted in larger clinical trials, more follow-
up time, and a longer demonstration period. The FDAcan also ban certain medical devices or intervene in themarket to restrain use of medical devices it later finds topose unreasonable risks to the public health.
Industry’s Perception of FDA Regulation13
During the first five or so years of the SMDA, therelationship between the FDA and the medical deviceindustry was adversarial. Since about a year prior topassage of the FDA Modernization Act (FDAMA) andunder the new leadership of Dr. Jane Henney, head of theFDA, and Dr. David Feigel, the new director of theCenter of Device and Radiological Health (CDRH), thecenter with whom the devices industry deals, theindustry’s perception of the FDA has improved markedly.Today the FDA seems open to suggestions from theindustry and willing to work with them. It is now easier touse the 510(k) route to bring a device to market,substantially reducing the wait.
Medical device manufacturers agree with the goals ofthe FDA to provide the public assurance that devices willbe safe and effective. The regulatory structure, however,lengthens the product development cycle for “new”products by several years. This process encourages thedevelopment of products that can pass as “old” underexisting guidelines. Ultimately, that strategy may not be inthe best interests of the public, because the opportunitycost of that route is to forgo work on a device that couldradically improve the treatment of some disease.
Health Care and Financing Administration(HCFA) Until about 1995, the major issues involved productapproval from the FDA; now the big issue is getting paidfor products. Almost all medical devices are marketed tohospitals, doctors, and other health care providers, whoare reimbursed by third-party payers, primarily Medicareor Medicaid programs, managed health care providers,and private insurers. These third-party payers add a thirdcriterion for marketability over and above the safety andeffectiveness criteria of the FDA: cost effectiveness. In thecost-containment environment that has prevailed since thetightening of Medicare regulations in the 1997 Balanced

16
T H E M E D I C A L D E V I C E I N D U S T R Y I N M A S S A C H U S E T T S
Budget Act, the medicaldevice industry perceivesan increasingly difficulttime in getting approvalfor reimbursement.
Because ofMedicare’s predominantrole in insuring the vastmajority of patients whoultimately receive theservices of medicaldevices, the HCFA playsa paramount role in
reimbursement. Private payers usually follow the lead ofthe HCFA in determining whether or not to approvereimbursement for a device’s use.
Industry’s Perception of HCFA Regulation14
The HCFA is perceived to view technology as a driver ofcosts rather than a saver of costs. The HCFA’s approach toreimbursement coding and classification has been a deep,dark secret. It has also been characterized as a black box.In some cases, due to cumbersome coverage, coding, andpayment procedures, the HCFA’s reimbursementprocesses delay the introduction of new medical productsfrom two to five years.
A new procedure that uses a new device may cost morein the short run but save money in the long run because itis more effective, has fewer side effects, has faster recoverytimes, or requires fewer health care services in the futurethan what is available today. The HCFA, however, fails totake these long-run savings into account when consideringcost effectiveness. Part of the problem is that efficacyreview and financial review take place in two differentoffices within the HCFA, and these offices do not commu-nicate effectively with one another.
The medical device community seems satisfied withthe efforts of the Commonwealth’s congressionaldelegation in addressing the problems of federalregulation. Senator Edward M. Kennedy was particularlyinstrumental in the passage of the FDAMA.
One welcome development has been the recentimplementation of a policy that allows reimbursement
for clinical trial costs equal to what costs would havebeen reimbursed had the patient not been in the clinicaltrial. This new policy substantially reduces the costs ofclinical trials.
POLICY CONSIDERATIONS
The following policy recommendations weresuggested by industry executives or are more or less
logical implications of their suggestions. Most of theserecommendations deal with state policy; the main federalpolicy issues, involving the FDA and the HCFA, were dis-cussed earlier.❿ Promote Massachusetts as a place for high-tech
precision manufacturing, such as the manufactureof medical devices. Other states promote theirproducts. There is a need to offset the lingering percep-tion that Massachusetts is not friendly toward business.It is also not widely known that in some areas of thestate, the cost of doing business is competitive withalternative desirable locations in the South and West.
❿ Develop a formal liaison between the industry andthe state’s legislative and executive branches. Sucha relationship could provide a conduit of informationbetween the medical device community and thegovernment to inform the Commonwealth’s policymakers about issues pertinent to the industry’s healthand competitiveness relative to other states. Forexample, how do tax provisions that affect the industry,such as the research and development and investmenttax credits, compare with those of Minnesota,California, Connecticut, Illinois, Utah, and so on?
❿ Improve the quality of K–12 education and thecommunity college system. Massachusetts cannotcompete in the production of high-volumestandardized “commodities” that rely on low-paidlabor to be cost effective. Rather, the state’scomparative advantage in manufacturing lies in preci-sion production that requires highly skilledproduction workers. Such production in turnrequires, at a minimum, a good base in mathematicsand good communications skills for many productionpositions and specialized technical training for otherpositions.

T H E M E D I C A L D E V I C E I N D U S T R Y I N M A S S A C H U S E T T S
17
❿ Implement more liberal and longer carryoverprovisions for business tax credits. Carryover provi-sions are important for start-ups, which are usually notprofitable for five to ten years, especially given thelong time to bring new products to market in light ofFDA and HCFA hurdles. Under existing tax codes,most carryovers would expire before the firm becomesprofitable.
❿ Expand the state’s research and development taxcredit to expenses involved in prototypemanufacturing. Small contract manufacturers have todo a lot of preliminary manufacturing: prototyping themanufacturing process and making alterations to theproduct and the way it is produced. Often, theproduction of thousands of units is needed todetermine how to produce the product reliably andcost effectively. These expenditures are like researchand development costs, but they are not allowed underthe Commonwealth’s current research anddevelopment tax credit guidelines.
❿ The high cost of living, especially housing, is anobstacle to growth. The only consolation is that thecost of living in California is also high. Other regions ofmedical device activity such as Florida, Minneapolis,and Deerfield, Illinois (home to Baxter Healthcare Cor-poration, one of the nation’s largest medical devicecompanies), however, have a much lower cost of living.While not immediately apparent, the high cost of hous-ing in Massachusetts is partially a result of disparitiesbetween municipalities in the quality of their publicschools. Massachusetts has some excellent public K–12systems, but the quality of each school system dependson the individual community. Not surprisingly, housingcosts in communities with excellent school systems areastronomical. Improvements in the K–12 system canhave a positive effect on housing in addition toeducational improvement per se. By making more com-munities attractive to families with children, medicaldevice companies will find it easier to recruit workersfrom other regions. In addition, it is more likely thatsuch families will stay in Massachusetts rather thanmove to another region of the country in search ofmore affordable housing.
❿ Encourage consistent foreign trade regulations.Obtain transparency and equity for how foreigngovernments regulate and approve medical devices.Different regulations across countries result in extraexpense and time to market. The European UnionDevice Directive to bring consistency to membercountries’ approval processes is a helpful approach.
❿ Encourage health care reform. There are some callsfor fundamental reform in health care and the way it isfinanced through the current insurance and managedcare system. Without offering specific solutions, oneproblem is that the incentive for health care providers isto minimize short-run rather than long-run health carecosts because the current provider may not be theinsurer in the long run. This problem is exacerbated bya system that is essentially private until age 65, at whichtime the primary insurer changes to Medicare. Otherperceptions are that cost containment has gone too farand that forced reductions in manufacturing costs mightaffect the “safety and effectiveness” of medical devices.
CONCLUSION
Massachusetts medical devices form the largest partof the state’s vibrant medical science sector, which
also includes pharmaceuticals and biotechnology.Massachusetts is one of the leading states in theproduction of medical devices, providing good jobs thatemploy high-paid scientists, engineers, and productionworkers. Through its economic links with electronics,metal and plastics manufacturers, hospitals, and financialinstitutions, the medical device sector comprises animportant part of the state’s high-technology economicbase. The long-term outlook for the sector is one ofcontinued growth, supported by growing worldwidedemand for health services, and the state’s comparativeadvantage in the development of new technologies. Inorder to ensure the future success of the medical devicesector—and the state’s economy as a whole—Massachusetts public policy should focus on providingquality public education, lowering the cost of living in thestate (especially housing costs), promoting Massachusettsas a place to do business, and developing an information-sharing liaison with the industry. �

18
T H E M E D I C A L D E V I C E I N D U S T R Y I N M A S S A C H U S E T T S
Endnotes
1 For each criterion, first place was assigned five points, second was assigned four points, and soon through one point for fifth place.
2 According to the Regional Economic Models Inc. Massachusetts economic accounts for 1998,exports of the medical device industry (SICs 384 and 385) were estimated to be 1,441 million($92) and output was estimated to be 2,784 million ($92), for an export to output ratio of .5176.Here, exports refer to sales to the rest of the United States and the world.
3 A firm’s value added represents the increase in market value over the cost of materials thatoccurs as a result of work done at the establishment. We use production worker hours in thedenominator of the productivity measure, rather than total worker hours, for two reasons. First,hours for non-production workers are not available. Second, leaving non-production hours outof the denominator essentially treats non-production workers like capital, which is perhaps abetter way to analyze the production technology in medical devices.
4 The Economic Census defines production workers as those workers engaged in activities close-ly associated with production operations at the establishment. Workers excluded from this clas-sification are many, if not most, scientists and engineers engaged in research, development, andproduct design.
5 The source of the information in this section is the March Current Population Survey (CPS)for the years 1995 to 1999 (U.S. Department of Commerce, 1995–1999). The basic monthlysurvey is the source of the official national and state resident employment series and is theprimary source of the official unemployment rate. The basic monthly survey includes, for eachsample individual, information on gender, age, race, and educational attainment. In March ofeach year, the U.S. Census Bureau asks a set of supplementary questions of each sampleindividual. These questions ask about the person’s income in the prior year by source ofincome; employment experience in the prior year, including weeks and hours worked; and theindustry and occupation of the individual’s “major” employer, the employer for whom theperson worked the longest in the prior year. The CPS definition of medical devices includes theStandard Industrial Codes (SICs) 384, 385, and 3827 (optical instruments and lenses). This lastsector is relatively small, so the CPS definition is close to the sector definition of this study.Unfortunately, the sample sizes are too small to estimate demographic characteristics for Mass-achusetts medical device workers, so the data are limited to a description of all U.S. medicaldevice workers. Even so, to get a large enough sample for statistical reliability, the analysis hereis based on a pooled sample of the last five March CPSs. The sample of 961 medical deviceworkers gives a picture of the workforce for this sector for the calendar years 1994–1998. Theseworkers are compared with the CPS-derived characteristics of manufacturing workers, and ofall workers, for the same period. The CPS provides weights to inflate the sample to populationtotals. The tabulations given use these weights, divided by five, so that totals represent averageU.S. population totals for 1994–1998.

T H E M E D I C A L D E V I C E I N D U S T R Y I N M A S S A C H U S E T T S
19
6 Annual wages are calculated as follows. For each sample individual, the CPS reports earnings inthe prior year from the primary employer (i.e., the employer for whom the individual workedthe longest in the prior year) as well as weeks worked last year and number of employers in theprior year. (If the person worked for more than one employer at the same time, only oneemployer is counted.) For purposes of calculating annual wages, the sample was restricted tothose individuals who worked for a single employer in the prior year. Annual earnings were cal-culated as earnings received from the primary employer divided by weeks worked times 52.
7 The source of information for this section is from Regional Economic Models Inc.’s regionalmodel for Massachusetts (Regional Economic Models Inc., 2000).
8 The sources of information for this section are the state and national data from the “covered”payroll employment series, ES-202 (Division of Employment and Training, 1993–2001, andthe U.S. Bureau of Labor Statistics, 2001). The ES-202 provides a time series of employmentand wages from 1993 to 1999 for Massachusetts and from 1997 to 1999 for the United States asa whole for the medical device sector defined as SICs 384 and 385. Employment for themedical device sector as measured by the ES-202 is different from that as measured by the 1997Economic Census, because these two sources use different classification systems for codingindustries. The SIC system used for ES-202 data is in the process of being replaced by the newNAICS system, which was used for the 1997 Economic Census.
9 The sources of information for this section are Division of Employment and Training,1993–2001, and the U.S. Bureau of Labor Statistics, 2001.
10 The sources of information for this section are interviews with executives from medical devicecompanies or related businesses.
11 The data on venture capital in this section are from PriceWaterhouseCoopers’s quarterlysurveys on venture capital investments (PriceWaterhouseCoopers, 2000).
12 The sources of information for this section are interviews with executives from medical devicecompanies or related businesses.
13 The views expressed in this section are those of executives of medical device and relatedbusinesses who were interviewed by the author.
14 The views expressed in this section are those of executives of medical device and relatedbusinesses who were interviewed by the author.

20
T H E M E D I C A L D E V I C E I N D U S T R Y I N M A S S A C H U S E T T S
References
Boston Business Journal (2000). Book of Lists 2001, Boston.
Clayton-Matthews (1999). Made in Massachusetts: Competitive Manufacturing in a High SkillLocation. Fourth Annual Massachusetts Expansion Report, Mass Insight Corp., Boston, fall 1999.
Division of Employment and Training (DET), Commonwealth of Massachusetts (1993–2001). ES-202 reports, Boston.
Olsen, Kevin, (1993). Minnesota Medical Devices Manufacturing: An Analysis of Industry Growth,Specializations and Location Factors. Minnesota Department of Trade and EconomicDevelopment, St. Paul, April 1993.
PriceWaterhouseCoopers LLP, (2000). Money Tree Survey, quarterly surveys,www.pwcmoneytree.com.
Regional Economic Models Inc. (REMI), (2000). Policy Insight Model, Massachusetts region,Amherst, MA.
U.S. Bureau of Labor Statistics (2001). ES-202: Covered Employment and Wages, U.S.Department of Labor.
U.S. Department of Commerce (2000a). 1997 Economic Census, Economics and StatisticsAdministration, U.S. Census Bureau, Washington, D.C.
U.S. Department of Commerce (2000b). Medical Equipment U.S. Domestic Exports, courtesy ofDorothy Blouin, International Trade Specialist, ITA, Washington, D.C.
U.S. Department of Commerce (1995–1999). Current Population Survey, March, Economics andStatistics Administration, U.S. Census Bureau, Washington, D.C.