executive summary: the fuel cell stack supply chain - navigant research · executive summary: the...
TRANSCRIPT
Ski Muir MilburnIndustry Analyst
Kerry-Ann Adamson, Ph.D.Research Director, Smart Energy
EXECUTIVE SUMMARY: The Fuel Cell Stack Supply Chain Supply Chain Opportunities and Constraints, Supplier Analysis by Sector, Breakdown of Stack Components, and Revenue Forecasts by Component Category
NOTE: This document is a free excerpt of a larger report. If you are interested in purchasing the full report, please contact Pike Research at [email protected].
Published 1Q 2012
The Fuel Cell Stack Supply Chain
© 2012 Pike Research LLC. All Rights Reserved. This publication may be used only as expressly permitted by license from Pike Research LLC and may not otherwise be accessed or used, without the express written permission of Pike Research LLC.
1
Section 1 EXECUTIVE SUMMARY
1.1 New Challenges
After a long gestation period, fuel cells are now offering a compelling value proposition for certain selected applications. This is being reflected in double- and even triple-digit growth rates (from an admittedly low base) for the leading developers. Go-to-market strategies have been identified and proven and fuel cell developers are starting to register significant sales growth. Now, the next set of challenges arises. Can these companies sustain high growth rates and become profitable, self-sustaining enterprises? What are the key success factors necessary for the next stage of commercial fuel cell evolution? Are they present or absent in the leading companies and the industry at large? And what are the critical constraints, both internal and external, that might inhibit these companies from meeting or sustaining their goals?
This report addresses the critical constraints that might inhibit the fuel cell companies from meeting their development goals by focusing on the supply chain. The supply chain, or the provision of high-quality, economically competitive critical components for the fuel cell stack is an area that has been somewhat overlooked. The focus of R&D has expanded to include deployment and performance issues, such as durability and start-up time; and the supply chain has been assumed to be able to meet demand when and as needed. This could be a dangerous assumption as the industry continues to grow. This report looks at the supply chain from the perspective of whether this is or could be a constraint to growth within the fuel cell industry.
When looking at the supply chain, the potential market growth in the area of fuel cell applications also needs to be addressed. This is the fundamental quandary of the fuel cell industry. Without a growing industry, the supply chain cannot benefit from component standardization, volume manufacturing, and cost-downs. In terms of cost-downs and volume manufacturing, however, the fuel cell industry has limited growth potential. This report analyzes the supply chain and also looks at three early market applications, which, even under the Pike Research business-as-usual (BAU) forecasting methodology, could provide enough volume demand to break the supply chain deadlock.
The three early market fuel cell applications that are somewhat more tolerant of high capital expenditures outlined in this report include:
Fuel cell industrial electric vehicles (IEVs) (primarily fuel cell forklifts)
Fuel cell uninterruptible power supply (UPS) systems
Fuel cell combined heat and power (CHP)
Pike Research also focuses on suppliers of the components that make up the fuel cell stack. Specifically, catalysts, membranes, membrane electrode assemblies (MEAs), gas diffusion layers (GDLs), and bipolar plates (BPPs). These components make up most of the manufacturing cost of a fuel cell stack – and about one-third of the cost of a complete fuel cell product. Moreover, they are generally not shared with other industries and are the most likely to pose any supply constraints that would inhibit the growth of the fuel cell industry. As such, these components serve as a useful microcosm of the fuel cell supply chain in general and a good predictor of the likely trajectory of the industry going forward.
The Fuel Cell Stack Supply Chain
© 2012 Pike Research LLC. All Rights Reserved. This publication may be used only as expressly permitted by license from Pike Research LLC and may not otherwise be accessed or used, without the express written permission of Pike Research LLC.
2
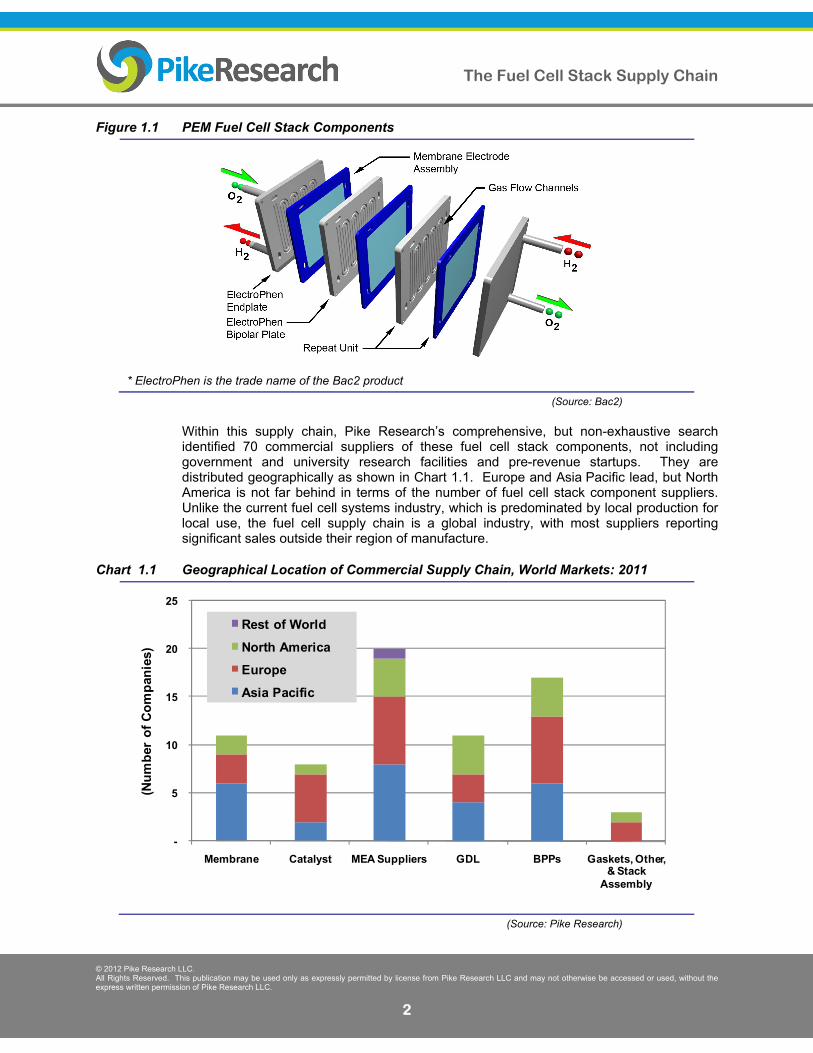
Figure 1.1 PEM Fuel Cell Stack Components
* ElectroPhen is the trade name of the Bac2 product
(Source: Bac2)
Within this supply chain, Pike Research’s comprehensive, but non-exhaustive search identified 70 commercial suppliers of these fuel cell stack components, not including government and university research facilities and pre-revenue startups. They are distributed geographically as shown in Chart 1.1. Europe and Asia Pacific lead, but North America is not far behind in terms of the number of fuel cell stack component suppliers. Unlike the current fuel cell systems industry, which is predominated by local production for local use, the fuel cell supply chain is a global industry, with most suppliers reporting significant sales outside their region of manufacture.
Chart 1.1 Geographical Location of Commercial Supply Chain, World Markets: 2011
-
5
10
15
20
25
Membrane Catalyst MEA Suppliers GDL BPPs Gaskets, Other, & Stack
Assembly
(Nu
mb
er o
f C
om
pan
ies)
Rest of World
North America
Europe
Asia Pacific
(Source: Pike Research)
The Fuel Cell Stack Supply Chain
© 2012 Pike Research LLC. All Rights Reserved. This publication may be used only as expressly permitted by license from Pike Research LLC and may not otherwise be accessed or used, without the express written permission of Pike Research LLC.
3
1.2 Past Trends and Future Developments
The Pike Research analysis of fuel cell component costs indicates that total 2011 revenue for the entire supply base was almost $295 million, with an average of just over $4 million in revenue per supplier. Not surprisingly, none of the suppliers contacted by Pike Research reported profitability at these revenue levels. However, most did report positive gross margins and declining manufacturing costs in response to sales growth, with profitability and positive cash flow a few years away. The majority of suppliers also reported adequate manufacturing capacity to sustain predicted fuel cell sales growth for the next 2 to 3 years. However, limited access to working capital is a recurring theme. This industry is some years from internal cash generation that can sustain the forecasted sales growth without external financing. Beyond the next 3 years, continued growth in manufacturing capacity and further progress down the cost curve will require significant investments in capital equipment to support advanced manufacturing processes.
Pike Research believes that significant attrition will occur in the supply base over the next few years. Due to the lack of component standardization and limited substitution opportunities, this is likely to disrupt fuel cell developers’ production plans, limiting industry growth in the near term. Later, once the entire industry has reached some level of nominal profitability, an acquisition phase can be expected to occur, whereby weak suppliers with leading technology are absorbed by larger players. The net effect will be a stronger fuel cell industry around the 2015-2016 timeframe, one that is more prepared to become a major player in the global power industry.
The Fuel Cell Stack Supply Chain
© 2012 Pike Research LLC. All Rights Reserved. This publication may be used only as expressly permitted by license from Pike Research LLC and may not otherwise be accessed or used, without the express written permission of Pike Research LLC.
59
Section 8 TABLE OF CONTENTS
Section 1 ...................................................................................................................................................... 1 Executive Summary .................................................................................................................................... 1
1.1 New Challenges ............................................................................................................................ 1 1.2 Past Trends and Future Developments ........................................................................................ 3
Section 2 ...................................................................................................................................................... 4 Market Issues .............................................................................................................................................. 4
2.1 Introduction .................................................................................................................................... 4 2.2 Drivers for Fuel Cell Adoption ....................................................................................................... 4
2.2.1 Increase in Energy Demand .................................................................................................... 4 2.2.2 Oil Price Volatility .................................................................................................................... 6 2.2.3 Carbon Emissions ................................................................................................................... 7 2.2.4 Energy Security and Energy Resilience .................................................................................. 7
2.3 Fuel Cell Stack and Supply Chain................................................................................................. 8 2.4 Revenue PEM Fuel Cell Supply Chain, 2011 ............................................................................. 11
Section 3 .................................................................................................................................................... 15 Technology Issues .................................................................................................................................... 15
3.1 Background ................................................................................................................................. 15 3.2 Fuel Cell Stack Overview ............................................................................................................ 16 3.3 Fuel Cell Types under Study ....................................................................................................... 16
3.3.1 PEM Fuel Cells ...................................................................................................................... 17 3.3.2 High-Temperature PEM Fuel Cells ....................................................................................... 17 3.3.3 Direct Methanol Fuel Cells .................................................................................................... 17
3.4 Stack Components Functional Breakdown ................................................................................. 17 3.4.1 Membrane ............................................................................................................................. 18
3.4.1.1 Membrane Functional Description ................................................................................ 18 3.4.1.2 Membrane Materials ..................................................................................................... 19 3.4.1.3 Membrane Manufacturing Processes and Cost ........................................................... 19
3.4.2 Catalysts ................................................................................................................................ 19 3.4.2.1 Catalyst Functional Description .................................................................................... 19 3.4.2.2 Catalyst Materials ......................................................................................................... 19 3.4.2.3 Catalyst Manufacturing Processes and Cost ............................................................... 20
3.4.3 Gas Diffusion Layers ............................................................................................................. 21 3.4.3.1 GDL Functional Description .......................................................................................... 21 3.4.3.2 GDL Materials ............................................................................................................... 22 3.4.3.3 GDL Manufacturing Processes and Cost ..................................................................... 22
3.4.4 Bipolar Plates ........................................................................................................................ 22 3.4.4.1 BPP Functional Description .......................................................................................... 22 3.4.4.2 BPP Materials ............................................................................................................... 22 3.4.4.3 Manufacturing Processes and Cost .............................................................................. 23
3.4.5 Other Components ................................................................................................................ 23 3.4.5.1 Gaskets and Seals ........................................................................................................ 23 3.4.5.2 Humidification and Cooling Plates ................................................................................ 23 3.4.5.3 Current Collectors ......................................................................................................... 23 3.4.5.4 End Plates and Tension Members ............................................................................... 23 3.4.5.5 Sensors ......................................................................................................................... 24 3.4.5.6 Cost of Other Components ........................................................................................... 24
3.4.6 Assembly and Production Technology .................................................................................. 24
The Fuel Cell Stack Supply Chain
© 2012 Pike Research LLC. All Rights Reserved. This publication may be used only as expressly permitted by license from Pike Research LLC and may not otherwise be accessed or used, without the express written permission of Pike Research LLC.
60
3.4.7 Stack Components Cost Breakdown .................................................................................... 24 3.4.8 Comparison between Pike Research and Directed Technologies Fuel Cell Stack Cost ...... 25
Section 4 .................................................................................................................................................... 27 Key Industry Players ................................................................................................................................. 27
4.1 Introduction .................................................................................................................................. 27 4.2 3M ............................................................................................................................................... 27 4.3 Acta Energy ................................................................................................................................. 28 4.4 Advent Technologies S.A. ........................................................................................................... 28 4.5 Asahi Glass Co., Ltd. .................................................................................................................. 28 4.6 Bac2 Limited ................................................................................................................................ 28 4.7 Ballard Material Products Division .............................................................................................. 29 4.8 BASF Fuel Cell ............................................................................................................................ 29 4.9 Bing Energy ................................................................................................................................. 29 4.10 Borit NV ....................................................................................................................................... 30 4.11 Cabot Corporation ....................................................................................................................... 30 4.12 CeTech Co., Ltd. ......................................................................................................................... 30 4.13 Dana Holding Corporation ........................................................................................................... 30 4.14 Danish Power Systems ............................................................................................................... 31 4.15 DuPont ........................................................................................................................................ 31 4.16 Entegris, Inc. ............................................................................................................................... 31 4.17 Freudenberg Fuel Cell Component Technologies ...................................................................... 31 4.18 FuMA-Tech GmbH ...................................................................................................................... 32 4.19 Golden Energy Fuel Cell Co., Ltd. .............................................................................................. 32 4.20 Horizon Fuel Cell Technologies .................................................................................................. 32 4.21 Johnson Matthey Fuel Cells ........................................................................................................ 32 4.22 Metro Mold & Design ................................................................................................................... 32 4.23 Mitsubishi Rayon Co., Ltd. .......................................................................................................... 33 4.24 Morphic Technologies AB ........................................................................................................... 33 4.25 N.E. CHEMCAT Corporation ....................................................................................................... 33 4.26 W.L. Gore & Associates, Inc. ...................................................................................................... 33 4.27 Wuhan WUT New Energy Co., Ltd. ............................................................................................ 33
Section 5 .................................................................................................................................................... 34 Market Forecasts ....................................................................................................................................... 34
5.1 Overview ..................................................................................................................................... 34 5.2 Key Flex Points ........................................................................................................................... 34
5.2.1 New Markets Open up for PEM Fuel Cells ........................................................................... 34 5.2.2 Reduction in CAPEX of Component Manufacturing Equipment ........................................... 35 5.2.3 Enactment of Buy Local Policies ........................................................................................... 35 5.2.4 Growth of New Countries for Fuel Cell Component Manufacturing ...................................... 36
5.3 Fuel Cell Supply Chain Forecasts and Application Projected Growth ........................................ 36 5.4 Global Supply Chain: Overview .................................................................................................. 40 5.5 Global Supply Chain: Component Revenue Projections ............................................................ 41 5.6 Global Supply Chain: Regional Revenue Projections ................................................................. 43 5.7 Analysis and Conclusions ........................................................................................................... 46
5.7.1 Fuel Cell Supply Chain Outlook ............................................................................................ 46 5.7.2 Risk Reduction Scenarios ..................................................................................................... 47
5.7.2.1 Component Standardization ......................................................................................... 47 5.7.2.2 Faster-than-Forecast Cost Reductions ......................................................................... 47 5.7.2.3 Faster-than-Forecast Growth ....................................................................................... 48 5.7.2.4 Industry Consolidation .................................................................................................. 48
5.7.3 New Entrants ......................................................................................................................... 49 5.7.4 Continued or Expanded Government Support ...................................................................... 49 5.7.5 Increased Investment in the Sector ....................................................................................... 49
The Fuel Cell Stack Supply Chain
© 2012 Pike Research LLC. All Rights Reserved. This publication may be used only as expressly permitted by license from Pike Research LLC and may not otherwise be accessed or used, without the express written permission of Pike Research LLC.
61
5.8 Summary ..................................................................................................................................... 50 Section 6 .................................................................................................................................................... 51 Company Directory ................................................................................................................................... 51 Section 7 .................................................................................................................................................... 56 Acronym and Abbreviation List ............................................................................................................... 56 Section 8 .................................................................................................................................................... 59 Table of Contents ...................................................................................................................................... 59 Section 9 .................................................................................................................................................... 62 Table of Charts and Figures..................................................................................................................... 62 Section 10 .................................................................................................................................................. 63 Scope of Study .......................................................................................................................................... 63 Sources and Methodology ....................................................................................................................... 64 Notes .......................................................................................................................................................... 64 Acknowledgements .................................................................................................................................. 65
The Fuel Cell Stack Supply Chain
© 2012 Pike Research LLC. All Rights Reserved. This publication may be used only as expressly permitted by license from Pike Research LLC and may not otherwise be accessed or used, without the express written permission of Pike Research LLC.
62
Section 9 TABLE OF CHARTS AND FIGURES
Chart 1.1 Geographical Location of Commercial Supply Chain, World Markets: 2011 .......................... 2 Chart 2.1 Fuel Cell Shipments by Application, World Markets: 2008-2010 ........................................... 4 Chart 2.2 Average Monthly Price per Barrel of Oil FOB, World Markets: 2007-2011 ............................ 6 Chart 2.3 CO2 Emissions from Fossil Fuel for Energy Generation, IEA Base Scenario, World Markets: 1990-2030 ..................................................................................................... 7 Chart 2.4 Fuel Cell Supply Chain by Component Manufacture, World Markets: 2011 ........................... 9 Chart 2.5 Fuel Cell Supply Chain of Companies by Region, World Markets: 2011 .............................. 10 Chart 2.6 Percentage Breakdown of Supply Chain by Company Location, World Markets: 2011 ....... 10 Chart 2.7 Fuel Cell Stack Manufacturing Companies by Region, World Markets: 2011 ...................... 11 Chart 2.8 Fuel Cell Stack Component Revenue, World Markets: 2011 ................................................ 12 Chart 2.9 Fuel Cell Stack Component Average Supplier Revenue, World Markets: 2011 ................... 12 Chart 2.10 PEM Fuel Cell Supply Chain Revenue by Component, World Markets: 2011 ..................... 13 Chart 2.11 PEM Fuel Cell Supply Chain Revenue by Region, World Markets: 2011 ............................. 14 Chart 3.1 Platinum Price Trends, World Markets: 2007-2011 .............................................................. 21 Chart 5.1 Fuel Cell IEV, UPS, & CHP System Shipments, World Markets: 2010-2017 ...................... 37 Chart 5.2 Fuel Cell IEV, UPS, & CHP Shipments by kW, World Markets: 2010-2017 ......................... 38 Chart 5.3 Fuel Cell IEV, UPS, & CHP Unit Shipments by Region, World Markets: 2010-2017 ........... 38 Chart 5.4 Fuel Cell IEV, UPS, & CHP Shipments by kW and by Region, World Markets: 2010-2017 ............................................................................................................................. 39 Chart 5.5 Fuel Cell IEV, UPS, & CHP Supply Chain Revenue, World Markets: 2010-2017 ................ 40 Chart 5.6 Fuel Cell Stack Component Supplier Revenue, World Markets: 2010-2017 ........................ 41 Chart 5.7 Revenue Percentage by Component, World Markets: 2017 ................................................. 42 Chart 5.8 Total Supply Chain Revenue by Region, World Markets: 2010-2017 ................................... 43 Chart 5.9 Supply Chain Revenue by Component, Europe: 2010-2017 ................................................ 44 Chart 5.10 Supply Chain Revenue by Component, Asia Pacific: 2010-2017 ......................................... 45 Chart 5.11 Supply Chain Revenue by Component, North America: 2010-2017 ..................................... 46
Table 2.1 Fuel Cell Stack Component Supplier Revenue: 2011 ........................................................... 11 Table 3.1 Stack Components Cost Breakdown: 2011 .......................................................................... 25 Table 3.2 U.S. DOE Automotive and Stationary Fuel Cell 2015 Cost Targets, as of 2011 .................. 25 Table 5.1 Stack Components Cost Breakdown: 2011 .......................................................................... 35
Figure 1.1 PEM Fuel Cell Stack Components .......................................................................................... 2 Figure 3.1 PEM Fuel Cell Stack Components ........................................................................................ 18
The Fuel Cell Stack Supply Chain
© 2012 Pike Research LLC. All Rights Reserved. This publication may be used only as expressly permitted by license from Pike Research LLC and may not otherwise be accessed or used, without the express written permission of Pike Research LLC.
63
Section 10 SCOPE OF STUDY
Pike Research has prepared this report to define the scope, capabilities, and potential constraints of global fuel cell stack component suppliers. Equal attention was given to all regions of the industrialized world, as the number of companies and degree of commercial development is quite non-uniform around the globe at this time.
A related objective of this report is to provide a working approximation of the revenue of the component suppliers as a guide to the scale and capabilities of the organizations. This was done by estimating the costs of the stack components on a per-kW basis and integrating the data into industry kW forecasts and a census of the number of suppliers. Confirmation in subsequent interviews with selected industry participants revealed that this approach, while far from perfect, did yield useful insights.
The focus of this study is on a group of revenue-stage, commercial suppliers of fuel cell stack components that have products and technology deemed worthy of consideration by customers, competitors, and reputation. This approach specifically excluded government and university research laboratories as non-commercial, but did attempt to capture commercial spinoffs from these organizations. Also note that Pike Research intentionally did not cover pre-revenue startups and it is possible that a few were overlooked that have recently moved into the revenue stage.
A number of collaborators who are fluent in Japanese, Korean, and Chinese were enlisted to help with the definition of the Asian supply base. However, despite these efforts, a known weakness of this study is the likely under-representation of Asian suppliers that do not have websites in English or other Latin alphabet-based languages.
While not a completely exhaustive list for these reasons, the suppliers that were contacted and studied in preparation for this report are believed to be representative of the entire industry. Pike Research welcomes contact by fuel cell stack component suppliers that would like to be included in possible future reports.
The Fuel Cell Stack Supply Chain
© 2012 Pike Research LLC. All Rights Reserved. This publication may be used only as expressly permitted by license from Pike Research LLC and may not otherwise be accessed or used, without the express written permission of Pike Research LLC.
64
SOURCES AND METHODOLOGY
Pike Research’s industry analysts utilize a variety of research sources in preparing Research Reports. The key component of Pike Research’s analysis is primary research gained from phone and in-person interviews with industry leaders including executives, engineers, and marketing professionals. Analysts are diligent in ensuring that they speak with representatives from every part of the value chain, including but not limited to technology companies, utilities and other service providers, industry associations, government agencies, and the investment community.
Additional analysis includes secondary research conducted by Pike Research’s analysts and the firm’s staff of research assistants. Where applicable, all secondary research sources are appropriately cited within this report.
These primary and secondary research sources, combined with the analyst’s industry expertise, are synthesized into the qualitative and quantitative analysis presented in Pike Research’s reports. Great care is taken in making sure that all analysis is well-supported by facts, but where the facts are unknown and assumptions must be made, analysts document their assumptions and are prepared to explain their methodology, both within the body of a report and in direct conversations with clients.
Pike Research is an independent market research firm whose goal is to present an objective, unbiased view of market opportunities within its coverage areas. The firm is not beholden to any special interests and is thus able to offer clear, actionable advice to help clients succeed in the industry, unfettered by technology hype, political agendas, or emotional factors that are inherent in cleantech markets.
NOTES
CAGR refers to compound average annual growth rate, using the formula:
CAGR = (End Year Value ÷ Start Year Value)(1/steps) – 1.
CAGRs presented in the tables are for the entire timeframe in the title. Where data for fewer years are given, the CAGR is for the range presented. Where relevant, CAGRs for shorter timeframes may be given as well.
Figures are based on the best estimates available at the time of calculation. Annual revenues, shipments, and sales are based on end-of-year figures unless otherwise noted. All values are expressed in year 2012 U.S. dollars unless otherwise noted. Percentages may not add up to 100 due to rounding.
The Fuel Cell Stack Supply Chain
© 2012 Pike Research LLC. All Rights Reserved. This publication may be used only as expressly permitted by license from Pike Research LLC and may not otherwise be accessed or used, without the express written permission of Pike Research LLC.
65
ACKNOWLEDGEMENTS
Pike Research would like to thank the following companies and contributors. Without their generous contribution of time and cooperation, this project would not have been possible.
Eric Funkenbush, 3M
Vasilis Gregoriou, Advent Technologies
John Shen, Asia Pacific Fuel Cell Technologies, Ltd
Mike Stannard, Bac2 Ltd.
David Whyte, Ballard Material Products
Richard Hennick, Bing Energy
Joachim Kroemer, Borit NV
William Yang, CeTech Co., Ltd.
Gary Lunz, Crown Manufacturing
Brian Cheadle, Dana Holding Corp.
Kim Albertsen, Danish Power Systems
Owen Hopkins, Entegris
Sheng Sui, Vice Director, Shanghai Jiao Tong University (SJTU), Institute of Fuel Cell
Mr. Zhang, Golden Energy Fuel Cell Co., Ltd. (GEFC)
Taras Wankewycz, Horizon Fuel Cell Technologies
Dean Miller, Metro Mold & Design (MMD)
Olivier Scheele, Nedstack
Michael Ulsh, National Renewable Energy Laboratory (NREL)
Charles Meyers, Trinergy
Peter Devlin, U.S. Department of Energy
The Fuel Cell Stack Supply Chain
© 2012 Pike Research LLC. All Rights Reserved. This publication may be used only as expressly permitted by license from Pike Research LLC and may not otherwise be accessed or used, without the express written permission of Pike Research LLC.
66
Published 1Q 2012
©2012 Pike Research LLC 1320 Pearl Street, Suite 300
Boulder, CO80302USA Tel: +1 303.997.7609
http://www.pikeresearch.com
This publication is provided by Pike Research LLC (“Pike”). This publication may be used only as expressly permitted by license from Pike and may not otherwise be reproduced, recorded, photocopied, distributed, displayed, modified, extracted, accessed or used without the express written permission of Pike. Notwithstanding the foregoing, Pike makes no claim to any Government data and other data obtained from public sources found in this publication (whether or not the owners of such data are noted in this publication). If you do not have a license from Pike covering this publication, please refrain from accessing or using this publication. Please contact Pike to obtain a license to this publication.