executive summary - ofgem · web viewgraphs illustrating the profile of actual expenditure to...
TRANSCRIPT

SP Transmission plc
Reporting year:
Executive Summary
Chapter 1 – Table commentary
1.4 Reconciliation to Regulatory Accounts
Allocation methodologies
Systems used to populate worksheet
Additional commentary
1.5 Net debt, interest and tax clawback
Allocation methodologies
Systems used to populate worksheet
Additional commentary
1.6 Fixed asset disposals
Allocation methodologies
Systems used to populate worksheet
Additional commentary
2.1 Provisional Price Control Financial Model (PCFM) Inputs
Allocation methodologies
Systems used to populate worksheet
Additional commentary
2.2 Totex Forecast

Allocation methodologies
Systems used to populate worksheet
Summary views (maximum words: 800 per summary section)1. Graphs illustrating the profile of actual expenditure to date and the
licensees’ current forecast of expenditure to be incurred for the remaining RIIO-T1 period for all SO and TO TOTEX, compared with (i) Final Proposals baseline TOTEX allowance, (ii) baseline TOTEX allowance including the impact of the November 2016 AIP (the latest published PCFM), (iii) revised allowances that reflect the outcome of revisions to the allowed TOTEX as a result of the company’s latest 8-year forecast.
2. Identification of the main reasons and drivers of under or over-performance (costs versus allowances) in the current year reporting year, the cumulative price control period to date and over the eight years of RIIO-T1 (latest forecast view).
For both 1 and 2; provide an explanation of: the extent to which forecasts have changed since last year the reasons and drivers for any significant changes and variances against
(i) the information provided as part of last year’s RIGs submission, and (ii) the expectations upon which the Final Proposals Baseline allowances were set, and a summary of the impact of material variances in both economic and technical terms.
Please provide all excel sheets that were used to create the above graphs and include confirmation of the source material of the data contained in each graph (the cell(s), column and row of the relevant tab of the Regulatory Reporting pack used to populate the data).
Additional commentary
2.3a Forecast Allowances
Allocation methodologies
Systems used to populate worksheet
Summary views (maximum words: 600 per summary section)1. Current year:
a. Comparison of the forecast allowances (the company’s latest 8-year forecast) against RIIO T1 baseline values (as per the latest published PCFM in November 2016) with main drivers of variances explained for:
load related capex base allowances; revised load related allowances;

asset replacement capex base allowances; other capex base allowances; revised other capex allowances; non-operational capex; opex base allowances allowance revised opex allowances.
b. Comparison of forecast allowance in previous year against this year’s allowances.
2. Eight year view:a. Comparison of the forecast allowances forecast allowances (the
company’s latest 8-year forecast) against RIIO T1 baseline values (as per the latest published PCFM in November 2016)with main drivers of variances explained (for the areas listed in 1 above).
b. Comparison of forecast allowance in previous year against this year’s forecast allowances (as mentioned above).
For both a and b; provide an explanation of: the extent to which forecasts have changed since last year the reasons for any significant changes and variances, and a summary of the impact of material variances in both economic and
technical terms.
Please populate the summary table below in £m (current reporting year prices)
A*: Allowance, £m
B: 2015-16 RRP expenditure, £m
C: 2016-17RRP expenditure, £m
D: Variance from forecast spend, £m (C-B)
E: Variance from Allowance, £m(C-A)
F**: Final Proposals Allowance, £m
TOTEX (i + ii + iii + iv + v)2016-17
Cumulative (1 April 2013 to
31 March 2017)
8 year (T1)CAPEX (i + ii + iii + iv)
2016-17Cumulative (1 April 2013 to
31 March 2017)
8 year (T1)i. LR CAPEX
2016-17Cumulative (1 April 2013 to
31 March 2017)
8 year (T1)ii. ASSET REPLACEMENT CAPEX
2016-17

Cumulative (1 April 2013 to
31 March 2017)
8 year (T1)iii. OTHER CAPEX
2016-17Cumulative (1 April 2013 to
31 March 2017)
8 year (T1)iv. NON-OPERATIONAL CAPEX
2016-17Cumulative (1 April 2013 to
31 March 2017)
8 year (T1)v. CONTROLLABLE OPEX
2016-17Cumulative (1 April 2013 to
31 March 2017)
8 year (T1)*NOTE: “2016-17” and “Cumulative” will reflect AIP 2016. “8 year (T1)” will reflect the company’s latest 8-year forecast.** NOTE: As defined in the PCFM at the time of the Final Proposals.
Please provide all excel sheets that support all graphs and tables used in the supporting narrative and include confirmation of the source material of the data contained in each graph (the cell(s), column and row of the relevant tab of the Regulatory Reporting pack used to populate the data).
Additional commentary
2.3b Forecast Volumes
Allocation methodologies
Systems used to populate worksheet
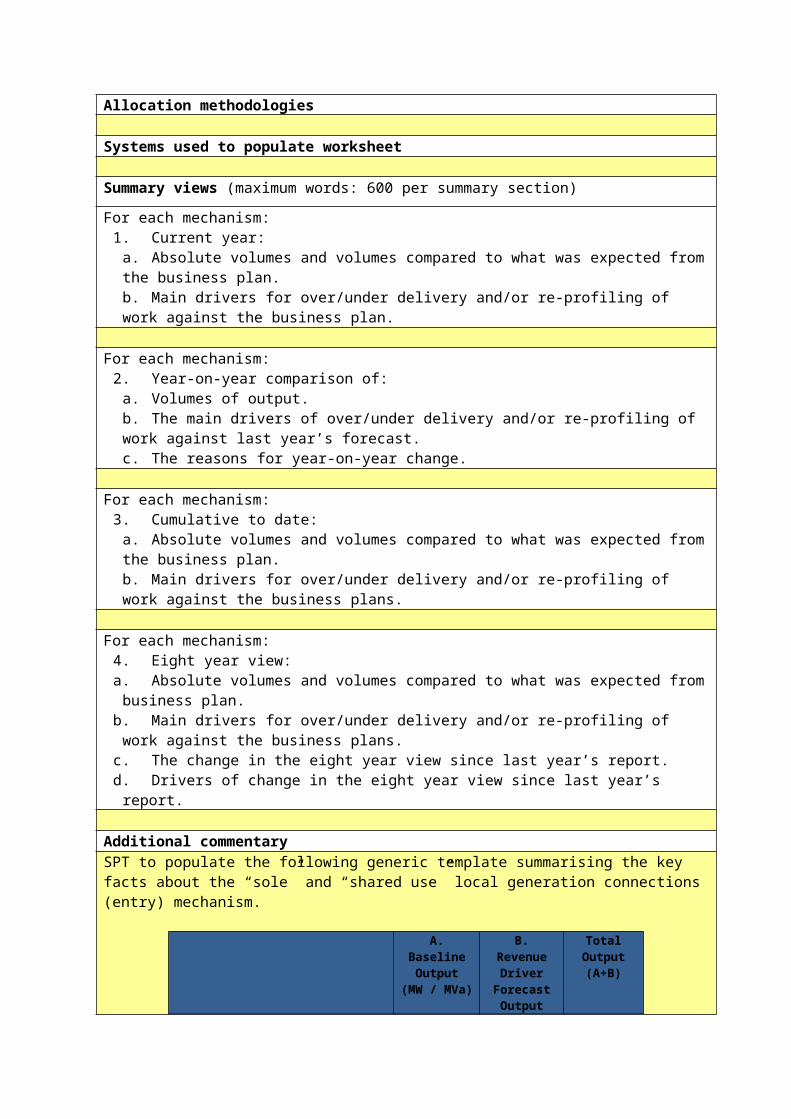
Summary views (maximum words: 600 per summary section)For each mechanism:
1. Current year:a. Absolute volumes and volumes compared to what was expected from the business plan. b. Main drivers for over/under delivery and/or re-profiling of work against the

business plan.
For each mechanism:2. Year-on-year comparison of:
a. Volumes of output.b. The main drivers of over/under delivery and/or re-profiling of work against last year’s forecast.c. The reasons for year-on-year change.
For each mechanism:3. Cumulative to date:
a. Absolute volumes and volumes compared to what was expected from the business plan. b. Main drivers for over/under delivery and/or re-profiling of work against the business plans.
For each mechanism:4. Eight year view:a. Absolute volumes and volumes compared to what was expected from
business plan. b. Main drivers for over/under delivery and/or re-profiling of work against the
business plans.c. The change in the eight year view since last year’s report. d. Drivers of change in the eight year view since last year’s report.
Additional commentarySPT to populate the following generic template summarising the key facts about the “sole” and “shared use” local generation connections (entry) mechanism.
A. Baseline Output
(MW / MVa)
B. Revenue Driver
Forecast Output
(MW / MVa)*
Total Output (A+B)
2015/16RRP: 8-year Forecast
2016/17RRP: 8-year Forecast:
Contracted
Best View
*NOTE: Value may be positive or negative.
A. Baseline Output
(MW / MVa)
B. Revenue Driver
Forecast Output
(MW / MVa)*
Total Output (A+B)
2015/16RRP: 2016-17 Forecast
2016/17RRP: 2016-17 Actual
*NOTE: Value may be positive or negative.
A. Baseline Output
(MW / MVa)
B. Revenue Driver
Forecast Output
(MW / MVa)*
Total Output (A+B)
2015/16RRP: Cumulative 4 year (Forecast)
2016/17RRP: Cumulative 4 year (Actual)
*NOTE: Value may be positive or negative.
2.4 Published Totex
Allocation methodologiesWhere a restated table 2.4 has been submitted the licensee must
detail the profile of all adjustments that have been made by the licensee, identify the categories of cost that are involved, explain the rationale for the movement (including links to all relevant
Ofgem decisions/correspondence – can be provided on a confidential basis if required),
explain the extent to which the level of restatement has changed since the levels reported in the previous year and the reasons for any significant changes and variances, and
the impact of the restatement on the level of under or over-performance in the current year, the cumulative price control period to date and the eight-year view.
Systems used to populate worksheet
Additional commentary
The Licensee will summarise the forecast spend and allowances against the seven main activity areas (TO LR capex, TO asset replacement capex, TO other capex, TO non-operational capex, TO opex, SO capex and SO opex) and the tables and graphs used in tables 2.2, 2.3a and 2.3b.
2.5 Published Outputs
Allocation methodologies
Systems used to populate worksheet
Additional commentary
2.6 Published Wider Works

Allocation methodologies
Systems used to populate worksheet
Summary views (maximum words: 400 per summary section)For each wider works mechanism:
1.Current year:a. Wider works outputs compared to what was expected from the business plan. b. Main drivers for over/under delivery and/or re-profiling of work against the business plans.
For each wider works mechanism:2. Year-on-year comparison of:
a. Wider works output delivered (to trigger additional allowances).b. The main drivers of over/under delivery and/or re-profiling.c. The reasons for year-on-year change.
For each wider works mechanism:3. Cumulative to date:
a. Output compared to what was expected from the business plan. b. Main drivers for over/under delivery and/or re-profiling of work against the business plans.
For each wider works mechanism:4. Eight year view:
a. Absolute output and specific outputs compared to what was expected from business plan. b. Main drivers for over/under delivery and/or re-profiling of work against the business plans.c. The change in the eight year view since last year’s report. d. Drivers of change in the eight year view since last year’s report.
Additional commentary
2.7 Input Prices
Allocation methodologies (Methodology and assumptions used to complete the table. If the current methodology and/or assumptions are different than those used to provide the RPE’s forecast in the business plan, please explain those differences and the rationale for change)
Systems used to populate worksheet (Data sources and assumptions that were used to complete this table. If the current data sources and/or assumptions are different than those used to provide the RPE’s forecast in the business plan, please explain those differences and the rationale for change)
Summary views (maximum words: 250 per summary section)

1.Current year:a. What Real Price Effects (RPEs) have been realised this year? How do these figures compare to the business plan?
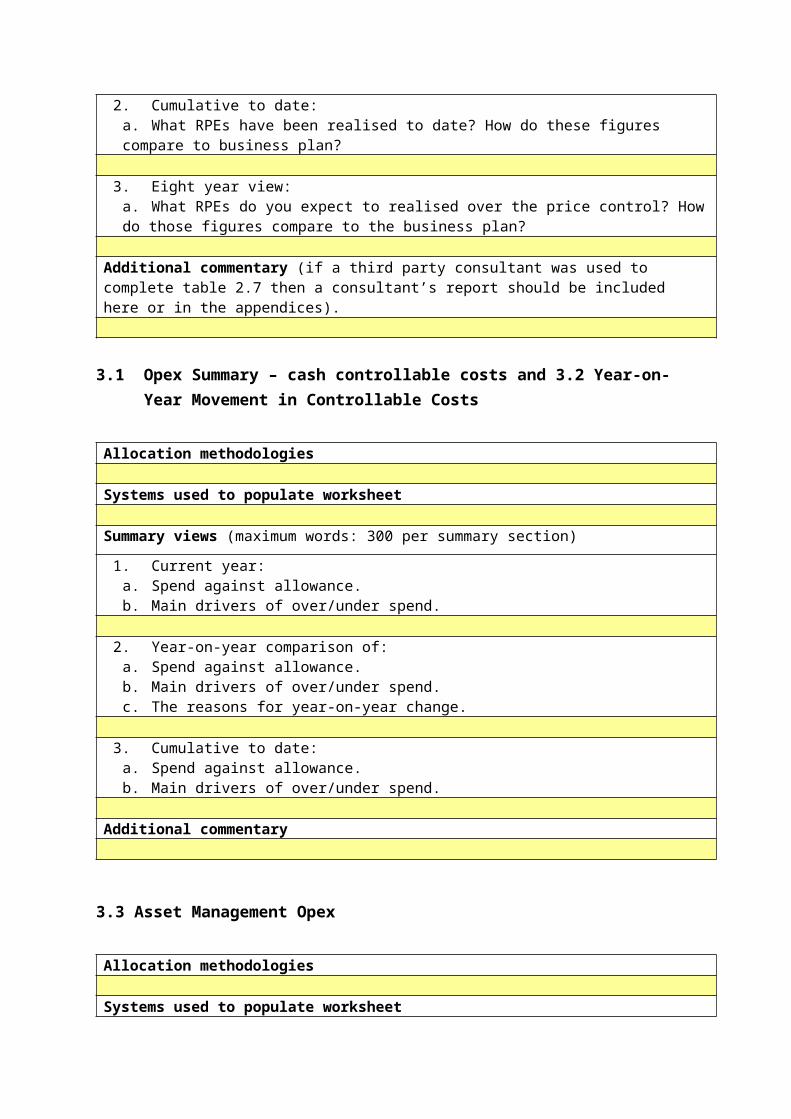
2.Cumulative to date:a. What RPEs have been realised to date? How do these figures compare to business plan?
3. Eight year view:a. What RPEs do you expect to realised over the price control? How do those figures compare to the business plan?
Additional commentary (if a third party consultant was used to complete table 2.7 then a consultant’s report should be included here or in the appendices).
3.1 Opex Summary – cash controllable costs and 3.2 Year-on-Year Movement in Controllable Costs
Allocation methodologies
Systems used to populate worksheet
Summary views (maximum words: 300 per summary section)1. Current year:
a. Spend against allowance.b. Main drivers of over/under spend.
2. Year-on-year comparison of:a. Spend against allowance.b. Main drivers of over/under spend. c. The reasons for year-on-year change.
3. Cumulative to date:a. Spend against allowance.b. Main drivers of over/under spend.
Additional commentary
3.3 Asset Management Opex
Allocation methodologies
Systems used to populate worksheet
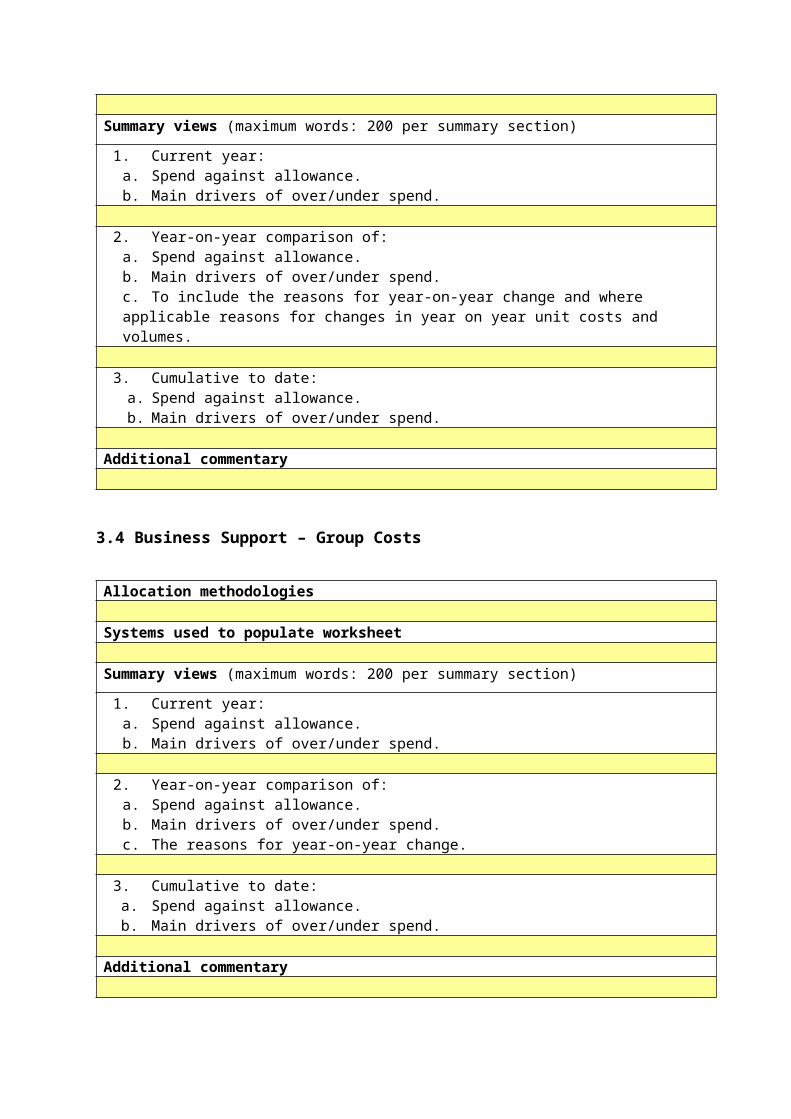
Summary views (maximum words: 200 per summary section)1. Current year:

a. Spend against allowance.b. Main drivers of over/under spend.
2. Year-on-year comparison of:a. Spend against allowance.b. Main drivers of over/under spend. c. To include the reasons for year-on-year change and where applicable reasons for changes in year on year unit costs and volumes.
3. Cumulative to date:a. Spend against allowance.b. Main drivers of over/under spend.
Additional commentary
3.4 Business Support – Group Costs
Allocation methodologies
Systems used to populate worksheet
Summary views (maximum words: 200 per summary section)1. Current year:
a. Spend against allowance.b. Main drivers of over/under spend.
2. Year-on-year comparison of:a. Spend against allowance.b. Main drivers of over/under spend. c. The reasons for year-on-year change.
3. Cumulative to date:a. Spend against allowance.b. Main drivers of over/under spend.
Additional commentary
3.5 Business Support – Allocation
Allocation methodologies
Systems used to populate worksheet
Additional commentary
3.6 Business Support – Supplementary Detail
Allocation methodologies
Systems used to populate worksheet
Additional commentary
3.7 Operational Training
Allocation methodologies
Systems used to populate worksheet
Summary views (maximum words: 200 per summary section)1. Current year:
a. Spend against allowance.b. Main drivers of over/under spend.
2. Year-on-year comparison of:a. Spend against allowance.b. Main drivers of over/under spend. c. Are training costs changing proportionately to FTE numbers?d. To include the reasons for year-on-year change.
Additional commentary
3.8 Total Transmission Salary and FTE numbers
Allocation methodologies
Systems used to populate worksheet
Summary views (maximum words: 200 per summary section)1. Year-on-year comparison of:
a. FTE numbers and whether this relates to any changes in the mix of different employee grades.
Additional commentary
3.9 Analysis of Excluded, Consented and De Minimis Services
Allocation methodologies
Systems used to populate worksheet
Summary views (maximum words: 250 per summary section)1. Current year:
a. Describe the outputs delivered through works associated with de minimis spend.b. Provide information where excluded and consented services have had a notable impact on non-excluded areas.
Additional commentary
3.10 Provisions
Allocation methodologies
Systems used to populate worksheet
Additional commentary
3.11 Related Party Transactions
Allocation methodologies
Systems used to populate worksheet
Additional commentary
3.12 Innovation Rollout Mechanism (IRM) Expenditure
Allocation methodologies
Systems used to populate worksheet
Summary views (maximum words: 400 per summary section)1. Current year:
a. Brief description and current status of successful IRM projects.b. Comparison of Allowed Expenditure for the relevant year to determine if it is different to the IRM value in the PCFM for the corresponding relevant year.
2. Comparison of total allowed expenditure and forecast total expenditure on

project(s), explaining any over or under expenditure.
Additional commentary
3.13 Network Innovation Allowance (NIA) Expenditure
Allocation methodologies
Systems used to populate worksheet
Summary views (maximum words: 250 per summary section)1. Please list the successfully completed and reported NIA projects.
Additional commentary
3.14 Network Innovation Competition (NIC) Expenditure
Allocation methodologies
Systems used to populate worksheet
Summary views (maximum words: 600 per summary section)1. Current year:
a. Summary and status of successful NIC projects including a brief summary of whether conditions set by Ofgem have been met.b. NIC funding allowance for each project – breaking down innovation funding and funding by licensee.c. NIC expenditure on each project (net and gross) explaining royalties/revenues.d. Reasons for over or under expenditure.
Additional commentary
3.15 Physical Security Opex
Allocation methodologies
Systems used to populate worksheet
Additional commentary

(Load related) 4.1 Capex Summary and Forecast and 4.2 Expenditure Profile of Load Related SchemesAllocation methodologies
Systems used to populate worksheets
Summary views (maximum words: 750 per summary section)1. Current year, by mechanism:
a. Comparisons across the portfolio between absolute output delivered and that expected from the business plan. Some individual explanation of the most significant schemes, to explain changes from the business plan, changes in scope of works, substitutions, or whether these schemes are no longer necessary, with reasons why and commentary on the economic impact of these delays/deferral decisions.
b. As above, for expenditure.c. For each mechanism, at the portfolio level (unless changes driven by
significant individual schemes, for which individual commentary is necessary) the main drivers of over/under delivery and over/under spend against business plans, and/or re-profiling of work. Explain the impact of material variances in both economic and technical terms.
d. Commentary on how the portfolio composition has changed between best view, base view, new schemes etc
2. Year-on-year comparison, by mechanism, of:a. Output and spend, both absolute and vs. allowance/targets.b. Main drivers of over/under performance. c. The reasons for year-on-year change. Explain the impact of material
variances in both economic and technical terms.d. Commentary on how the average portfolio basis has changed from the
previous reporting year and against the original business plan expectations.
3. Cumulative to date, by mechanism:a. Output and spend, both absolute and vs. allowance/targets.b. ain drivers of over/under performance. c. Explain the impact of material variances in both economic and technical
terms
4. Eight year view, by mechanism:a. Output and spend, both absolute and vs. allowance/targets.b. Main drivers of over/under performance.c. Change in the forecast since last year’s report.d. Drivers of change in forecast since last year’s report. e. Explanation of the impact of material variances in both economic and
technical terms. f. Commentary on how the portfolio composition (for each mechanism) has
changed between best view, base view, new schemes etc.
Additional commentaryAll Licensees to populate the tables 1, 2 and 3 below to assist in the above narrative. The template below reflects the categorisation applicable to NGET (TO)

and is used for illustration only. Each Licensees should modify accordingly.
Table 1Mechanism
RIIO-T1 Spend (£m) RIIO-T1 Outputs
RRP15-16 RRP16-17 Change RRP15 RRP16 Change
Entry - Sole Use
Exit - Sole Use
Local Demand (Infrastructure)
XSGTsXkmOHL
XkmC
YSGTsYkmOHL
YkmC
ZSGTsZkmOHL
ZkmC
Local GenerationXGWXkmOHL
XKmC
YGWYkmOHL
YkmC
ZGWZkmOHL
ZkmC
Wider Works XGW YGW ZGW
SWWDNO / Undergrounding
TSS (Infrastructure)
Other (not associated with any uncertainty mechanism) Total Spend
Customer ContributionsTotal (with Contributions)
Table 2
Mechanism
T1 Final Proposals Baseline Allowance
T1 Allowance (8-year current best view)
Spend 2015/16 (£m)(excl Capital Contributions)
Business Plan RRP16-17 Change
Entry - Sole Use
Exit - Sole Use
Local Generation
Local Demand
Wider Works
Western HVDC
DNO / Undergrounding
SWW
TSS (Infra)
Other (not associated with any uncertainty mechanism)
Total

Table 3Spend and Allowances for 2016-17 (£m)
Gen Dem WW WHVDC SWW DNO/U’ground TSS Non variant
Other
SPEND(i) Baseline (ii) Actual 2016-17 Spend ALLOWANCESA: FP baselineB: AIP 2016 baselineC: Uncertainty Mechanism adjustmentD: Other adjustmentsE: 2016-17 allowance
Y: Spend difference (ii - i)Z:Allowance difference (E-A)DIFFERENCE (Z-Y)
(Non-load related) 4.1 Capex Summary and Forecast and 4.3 Expenditure Profile of Non-Load Related Schemes
Allocation methodologies
Systems used to populate worksheets
Summary views (maximum words: 400 per summary section)1. Current year:
a. Absolute output and output compared to what was expected from business plan. Spend, both absolute and against allowance.
b. Main drivers of over/under delivery, over/under spend and/or re-profiling of work.
2. Year-on-year comparison of:a. Output and spend both absolute and compared to what was expected in
business plan. b. The main drivers of over/under performance, over/under spend and re-
profiling of work.c. The reasons for year-on-year change.
3. Cumulative to date:

a. Absolute output and output compared to what was expected from business plan. Spend, both absolute and against allowance.
b. Main drivers of over/under delivery, over/under spend and/or re-profiling of work.
4. Eight year view:a. Absolute output and output compared to what was expected from business
plan. Spend, both absolute and against allowance.b. Main drivers of over/under delivery, over/under spend and/or re-profiling of
work.c. The change in the eight year view since last year’s report. d. Drivers of change in the eight year view since last year’s report.
Additional commentary
Non-load Related: 4.3.1 – 4.3.3
Allocation methodologies
Additional commentary
4.4 Uncertain Costs
Allocation methodologies
Systems used to populate worksheet
Additional commentary
4.5 TO Non Operational Capex
Allocation methodologies
Systems used to populate worksheet
Additional commentary
4.7 Transmission Investment Renewable Generation (TIRG)
Allocation methodologies
Systems used to populate worksheet
Additional commentary

4.8 Physical Security Capex (CNI only)
Allocation methodologies
Systems used to populate worksheet
Summary views (maximum words: 250 per summary section)1. Current year:
a. Absolute output and output compared to what was expected from business plan. Spend, both absolute and against allowance.
b. Main drivers of over/under delivery, over/under spend and/or re-profiling of work.
2. Cumulative to date:a. Absolute output and output compared to what was expected from business plan. Spend, both absolute and against allowance.b. Main drivers of over/under delivery, over/under spend and/or re-profiling of work.
3. Eight year view:a. Absolute output and output compared to what was expected from business plan. Spend, both absolute and against allowance.b. Main drivers of over/under delivery, over/under spend and/or re-profiling of work.c. The change in the eight year view since last year’s report. d. Drivers of change in the eight year view since last year’s report.
Additional commentary
5.1 System Characteristics and Activity Indicators
Allocation methodologies
Systems used to populate worksheet
Summary views (maximum words: 150 per summary section)1. Year-on-year comparison (where something notable) of:
a. Asset inventory.b. Activity levels.c. The reasons for year-on-year change.
Additional commentary

5.2 Fault and Failure Reporting
Allocation methodologies
Systems used to populate worksheet
Summary views (maximum words: 300 per summary section)1. Current year:
a. Summary of any significant fault which led to significant disruption, loss of supply or customer disconnection greater than 3 minutes on both lead assets and non-lead assets and the system loss incurred as well as the duration.b. Summary of any significant condition related faults affecting a family or a number of lead or non-lead asset category that have occurred, a description of the fault and its cause and actions that will be taken e.g. maintenance, replacement etc.
Additional commentary
5.3 Boundary Transfer Requirements & 5.4 Boundary Transfers and Capability Development
Allocation methodologies
Systems used to populate worksheet
Summary views (maximum words: 300 per summary section)For planned and required boundary transfer, and aggregate boundary transfer:1. Current year:
a. Outputs compared to what was expected from the business plan. b. Main drivers for over/under delivery and/or re-profiling of work against the
business plans.
For planned and required boundary transfer, and aggregate boundary transfer:2. Year-on-year comparison of:
a. Outputs delivered (to trigger additional allowances).b. The reasons for year-on-year change.
For planned and required boundary transfer, and aggregate boundary transfer:3. Cumulative to date:
a. Output compared to what was expected from the business plan. b. Main drivers for over/under delivery and/or re-profiling of work against the
business plans.
For planned and required boundary transfer, and aggregate boundary transfer:4. Eight year view:
a. Absolute output and specific outputs compared to what was expected from business plan.

b. Main drivers for over/under delivery and/or re-profiling of work against the business plans.
c. The change in the eight year view since last year’s report. d. Drivers of change in the eight year view since last year’s report.
Additional commentary (to include the boundary diagrams noted in chapter 7 of the RIGs)
5.5 Demand and Supply at Substations
Allocation methodologies
Systems used to populate worksheet
Summary views (maximum words: 150 per summary section)1. Current year:a. Highlight any significant changes to >1500MW demand groups.
Additional commentary
5.6 Lead Assets Additions and Disposals
Allocation methodologies
Systems used to populate worksheet
Summary views (maximum words: 150 per summary section)1. Current year:
a. Were there any data revisions during the year? What were the reasons behind these?
Additional commentary
5.7 Non-Lead Assets Additions and Disposals
Allocation methodologies
Systems used to populate worksheet
Additional commentary
5.8 Lead Asset – Unit Cost Actuals

Allocation methodologies
Systems used to populate worksheet
Summary views (maximum words: 800 per summary section)1. Current year:
a. Summarise the projects delivered and explain any significant changes in scope of works from the business plans (i.e. where single assets valued over £100k) compared to what was expected from the business plan.
b. Main drivers for over/under spend , and timing of delivery against the business plan by:
i. Scope – explain why the scope of works changed.ii. Cost driver – explain what drivers led to cost changes (using the new
unit cost table – e.g. consenting, environmental conditions).iii. Cost type – explain where the drivers impacted costs (e.g. project
management, construction – see new unit cost template).
Additional commentary
5.9 Non Lead Asset – Unit Cost Actuals
Allocation methodologies
Systems used to populate worksheet
Additional commentary
5.10 Average Circuit Unreliability (ACU)
Allocation methodologies
Systems used to populate worksheet
Summary views (maximum words: 150 per summary section)1. Year-on-year comparison of:a. ACU percentages, with explanation of change from previous year’s values.
Additional commentary
6.1 Scot Customer Satisfaction
Allocation methodologies
Systems used to populate worksheet

Summary views (maximum words: 150 per summary section)1. Current year:
a. Performance against stakeholder satisfaction surveys and against KPIs. These should be compared to baselines.
2. Year-on-year comparison of:a. Performance against stakeholder satisfaction surveys and against KPIs.b. Are any reasons known for the change from last year?
Additional commentary
6.2 Business Carbon Footprint (BCF)
Allocation methodologies
Systems used to populate worksheet
Summary views (maximum words: 200 per summary section)1. Current year:
a. Emissions levels and how this compares to business plan. b. Main drivers of any notable differences between actual emissions and business plan projections.
2. Year-on-year comparison of:a. Emissions levels and how this compares to business plan (both absolute and within category). b. The main drivers of any notable differences between actual emissions and business plan projection.
Additional commentary
6.3 Reliability
Allocation methodologies
Systems used to populate worksheet
Summary views (maximum words: 250 per summary section)1. Current year:
a. Performance compared to target.b. Drivers behind difference between actual performance and target.c. Summary of exceptional event applications to the authority, decision and
impact on reliability incentive adjustment.
2. Year-on-year comparison of:a. Performance.b. Drivers behind difference between actual performance and target.

Additional commentary
6.5 SF6 Emissions
Allocation methodologies
Systems used to populate worksheet
Summary views (maximum words: 200 per summary section)1. Current year:
a. Emissions levels and how this compares to business plan. b. Main drivers of any notable differences between actual emissions and business plan projections. c. Summary of exceptional event applications to the authority, decision and impact on reliability incentive adjustment.
2. Year-on-year comparison of:a. Emissions levels and how this compares to business plan. b. The main drivers of any notable differences between actual emissions and business plan projections.
Additional commentary
6.6 Designated Area Visual Amenity Outputs for Existing Transmission Infrastructure
Allocation methodologies
Systems used to populate worksheet
Summary views (maximum words: 300 per summary section)1. Current year:
a. Output and spend, both absolute and against approved VA output and allowance.b. Main drivers for over/under spend and delivery.
2. Cumulative to date:a. Output and spend, both absolute and against approved VA output and allowance.b. Main drivers for over/under spend and delivery.
3. Eight year view:a. Output and spend, both absolute and against approved VA output and allowance.b. Main drivers for over/under spend and delivery.c. Change in the eight year view since last year’s report.d. Drivers of change in eight year view since last year’s report.

Additional commentary
For load related output tables:6.4 SHE Transmission and SPTL Timely Connections 6.7 Baseline Wider Works Outputs and Strategic Wider Works (SWW) Outputs6.8 SWW Pre-construction Deliverables 6.10 SPTL Local Generation Connections Volume Driver – Sole Use6.10 SPTL Local Generation Connections Volume Driver – Shared Use
Allocation methodologies
Systems used to populate worksheets
Summary views (maximum words: 1000 per summary section)For each mechanism:1. Current year:
a. Outputs and spend compared to what was expected from the business plan or licence requirement (whichever is more relevant). Provide comparisons at the (i) aggregated level, but must also distinguish at a sub-aggregated level between (ii) schemes in the business plan that continue to be delivered, (iii) those which were not in the business plan and are new, and (iv) those preceding RIIO that also were not in the business plan. Information should summarise the outputs (e.g. total MW) for business plan schemes: as planned, displaced by new schemes, delayed, or no longer needed.
b. Main drivers for over/under delivery and/or re-profiling of work against the business plans.
For each mechanism:2. Year-on-year comparison of:
a. Outputs and spend compared to what was expected from last year’s forecast. Comparisons at the (i) aggregated level, but also between (ii) schemes in the business plan that continue to be delivered, (iii) those which were not in the business plan and are new, and (iv) those preceding RIIO that also were not in the business plan. Information should summarise the outputs (e.g. total MW) for business plan schemes: as planned, displaced by new schemes, delayed, or no longer needed.
b. The main drivers of over/under delivery and/or re-profiling of work against the business plans.
c. The reasons for year-on-year change.
For each mechanism:3. Cumulative to date:
a. Outputs and spend compared to what was expected from the business plan or licence requirement (whichever is more relevant). Provide comparisons

at the (i) aggregated level, but must also distinguish between (ii) schemes in the business plan that continue to be delivered, (iii) those which were not in the business plan and are new, and (iv) those preceding RIIO that also were not in the business plan. Information should summarise the outputs (e.g. total MW) for business plan schemes: as planned, displaced by new schemes, delayed, or no longer needed.
b. Main drivers for over/under delivery and/or re-profiling of work against the business plans.
For each mechanism:4. Eight year view:
a. Absolute output and spend at the absolute level, and specific level where relevant, compared with what was expected from business plan or licence requirement (whichever is more relevant). Provide comparisons at the (i) aggregated level, but must also distinguish at a sub-aggregated level between (ii) schemes in the business plan that continue to be delivered, (iii) those which were not in the business plan and are new, and (iv) those preceding RIIO that also were not in the business plan. Information should summarise the outputs (e.g. total MW) for business plan schemes: as planned, displaced by new schemes, delayed, or no longer needed.
b. Main drivers for over/under delivery and/or re-profiling of work against the business plans.
c. The change in the eight year view since last year’s report. d. Drivers of change in the eight year view since last year’s report.
Additional commentary
6.15.1 NOMs Detail and 6.15.2 NOMs RP
Allocation methodologies
Systems used to populate worksheet
Summary views (maximum words: 300 per summary section)1. Current year:
c. Output against what was expected in business plan.d. Main drivers of any over/under delivery or re-profiling of work.
2. Year-on-year comparison of:a. Output against what was expected in business plan.b. Main drivers of any over/under delivery or re-profiling of work.c. The reasons for year-on-year change.
3. Cumulative to date:a. Output against what was expected in business plan.b. Main drivers of any over/under delivery or re-profiling of work.
4. Eight year view:a. Output against targets.

b. Main drivers of any over/under delivery.c. Change in the eight year view since last year’s report.d. Drivers of change in eight year view since last year’s report.
Additional commentary
6.16.1 Criticality Substations
Allocation methodologies
Systems used to populate worksheet
Additional commentary
6.16.2 Criticality Circuits
Allocation methodologies
Systems used to populate worksheet
Additional commentary
6.17 Flood mitigation
Allocation methodologies
Systems used to populate worksheet
Additional commentary
Chapter 2 – Forecasting
Chapter 3 – Drivers
Appendices