executive service corps maine association of nonprofits setting effective & ethical...
TRANSCRIPT
Executive Service Corpswww.Nonprofit-Consultants.org
Maine Association of Nonprofits
Setting Effective & Ethical Compensation Levels
2
Presenters
Len Cole, Esq
Michael Daily, Executive Service Corps
Brenda Peluso, Maine Association of Nonprofits

3
Agenda
Introductions/What do we want to learn today? History of the Survey What we have learned over the years Overview of 2010 Survey Using the Survey Salary Administration Case Benchmarking Benefits Annual Budget Cycle - CFO for a day Designing Benefits Programs
4
Why?
Retaining good employees Turnover can be disruptive and costly
Being as fair and equitable as possible
5
History of the Survey
Started in 1997 ESC joined MANP for the 1999 Survey ESC and NH Center for Nonprofits did 2005 NH
Survey NH joined Maine in 2006 – Moved to Online Survey
6
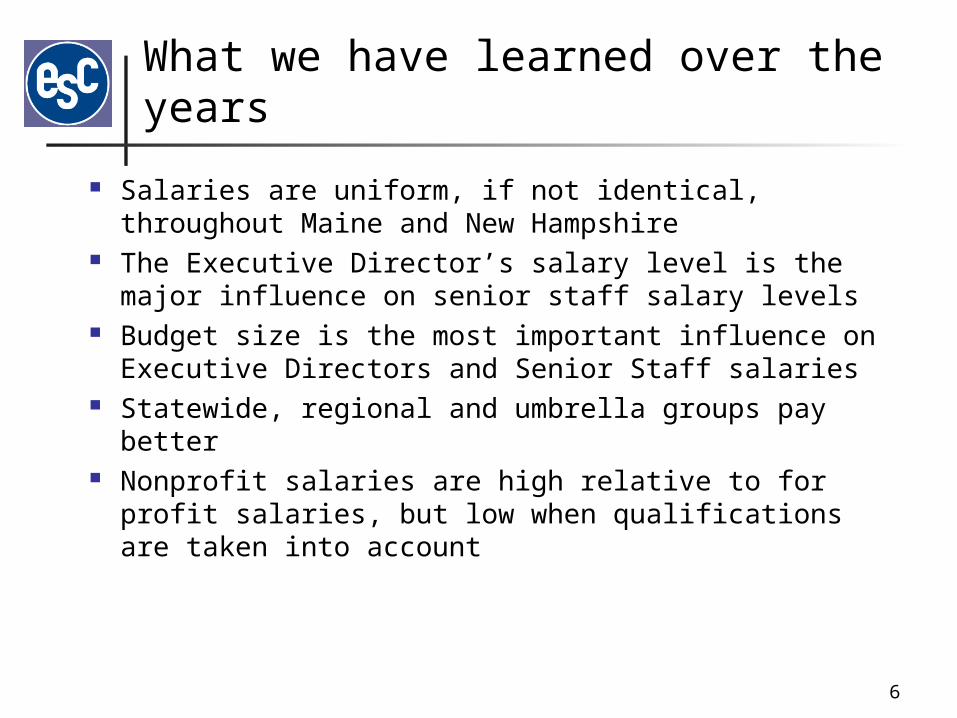
What we have learned over the years
Salaries are uniform, if not identical, throughout Maine and New Hampshire
The Executive Director’s salary level is the major influence on senior staff salary levels
Budget size is the most important influence on Executive Directors and Senior Staff salaries
Statewide, regional and umbrella groups pay better Nonprofit salaries are high relative to for profit
salaries, but low when qualifications are taken into account
7
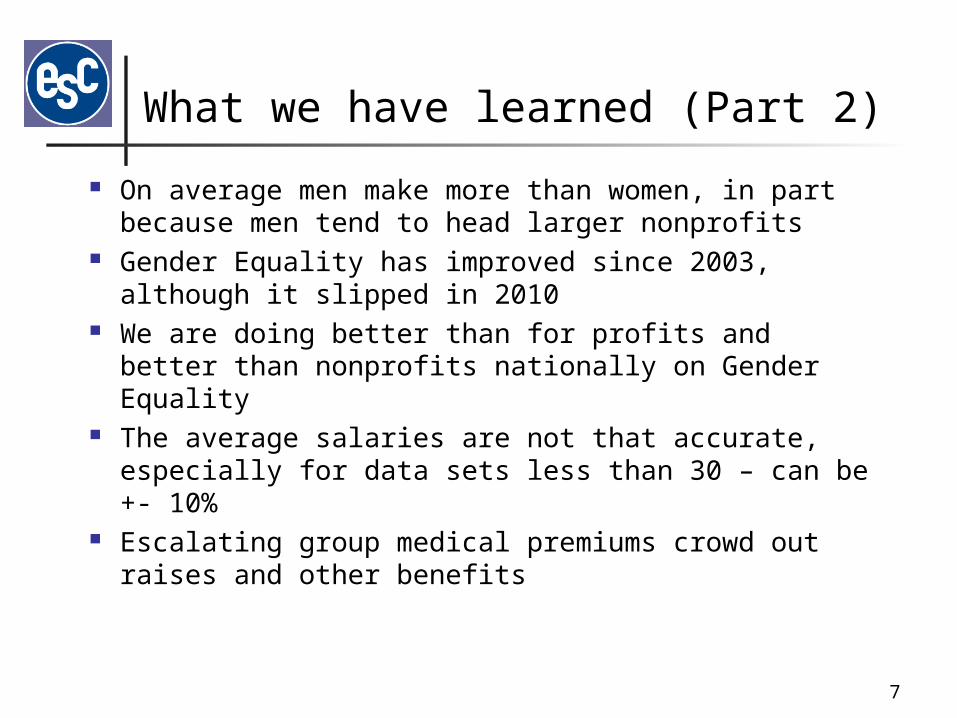
What we have learned (Part 2)
On average men make more than women, in part because men tend to head larger nonprofits
Gender Equality has improved since 2003, although it slipped in 2010
We are doing better than for profits and better than nonprofits nationally on Gender Equality
The average salaries are not that accurate, especially for data sets less than 30 – can be +- 10%
Escalating group medical premiums crowd out raises and other benefits
8
Economic Conditions & Salary Survey
Nonprofit Finance Fund Survey Wage and Benefit Survey in Northern New England
9
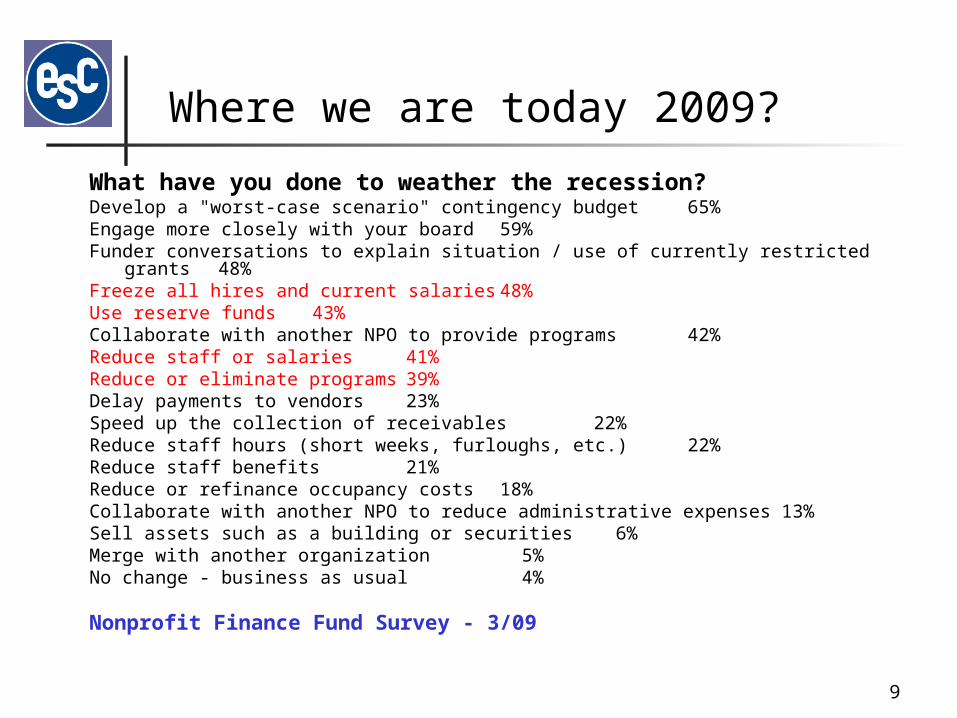
Where we are today 2009?
What have you done to weather the recession?Develop a "worst-case scenario" contingency budget 65%Engage more closely with your board 59%Funder conversations to explain situation / use of currently restricted grants 48%Freeze all hires and current salaries 48%Use reserve funds 43%Collaborate with another NPO to provide programs 42%Reduce staff or salaries 41%Reduce or eliminate programs 39%Delay payments to vendors 23%Speed up the collection of receivables 22%Reduce staff hours (short weeks, furloughs, etc.) 22%Reduce staff benefits 21%Reduce or refinance occupancy costs 18%Collaborate with another NPO to reduce administrative expenses 13%Sell assets such as a building or securities 6%Merge with another organization 5%No change - business as usual 4%
Nonprofit Finance Fund Survey - 3/09
10
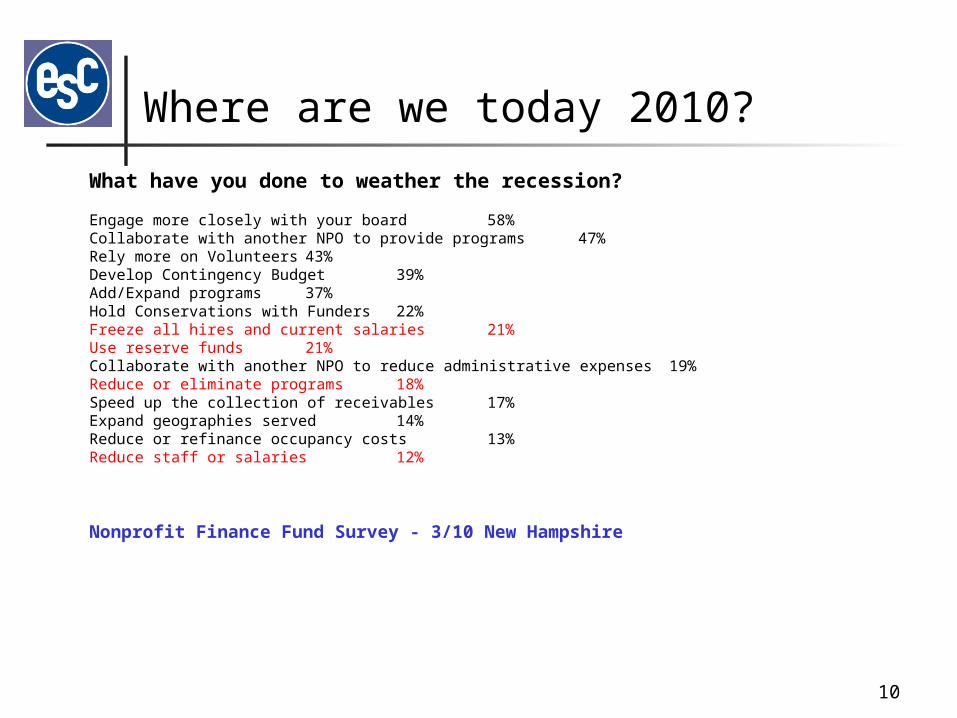
Where are we today 2010?
What have you done to weather the recession?
Engage more closely with your board 58%Collaborate with another NPO to provide programs 47% Rely more on Volunteers 43%Develop Contingency Budget 39%Add/Expand programs 37%Hold Conservations with Funders 22%Freeze all hires and current salaries 21%Use reserve funds 21%Collaborate with another NPO to reduce administrative expenses 19%Reduce or eliminate programs 18%Speed up the collection of receivables 17%Expand geographies served 14%Reduce or refinance occupancy costs 13%Reduce staff or salaries 12%
Nonprofit Finance Fund Survey - 3/10 New Hampshire
11
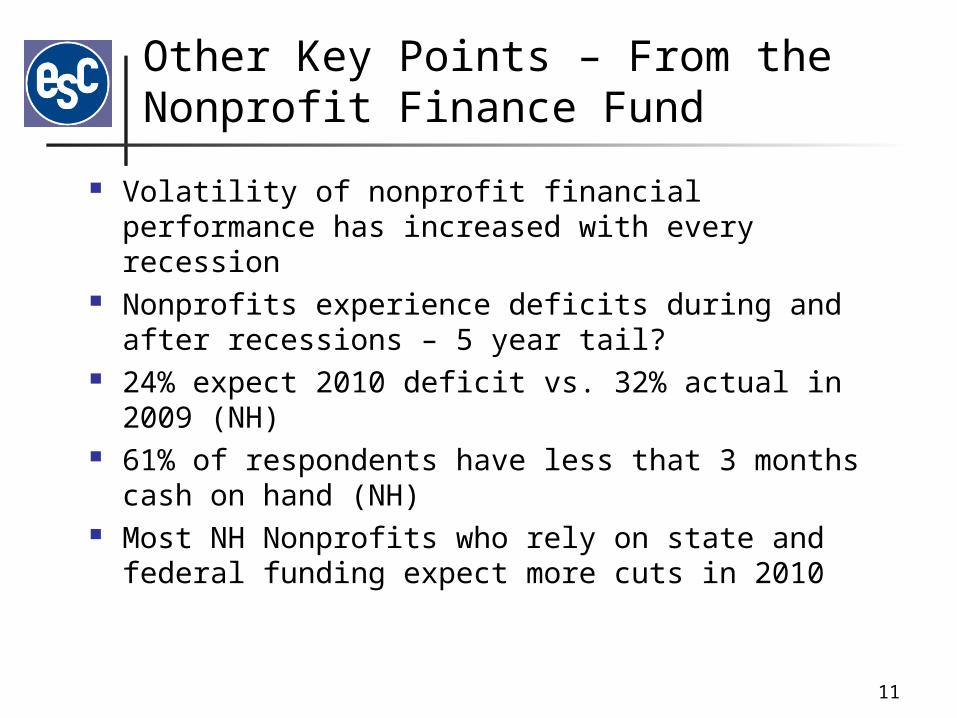
Other Key Points – From the Nonprofit Finance Fund
Volatility of nonprofit financial performance has increased with every recession
Nonprofits experience deficits during and after recessions – 5 year tail?
24% expect 2010 deficit vs. 32% actual in 2009 (NH) 61% of respondents have less that 3 months cash on
hand (NH) Most NH Nonprofits who rely on state and federal
funding expect more cuts in 2010
12
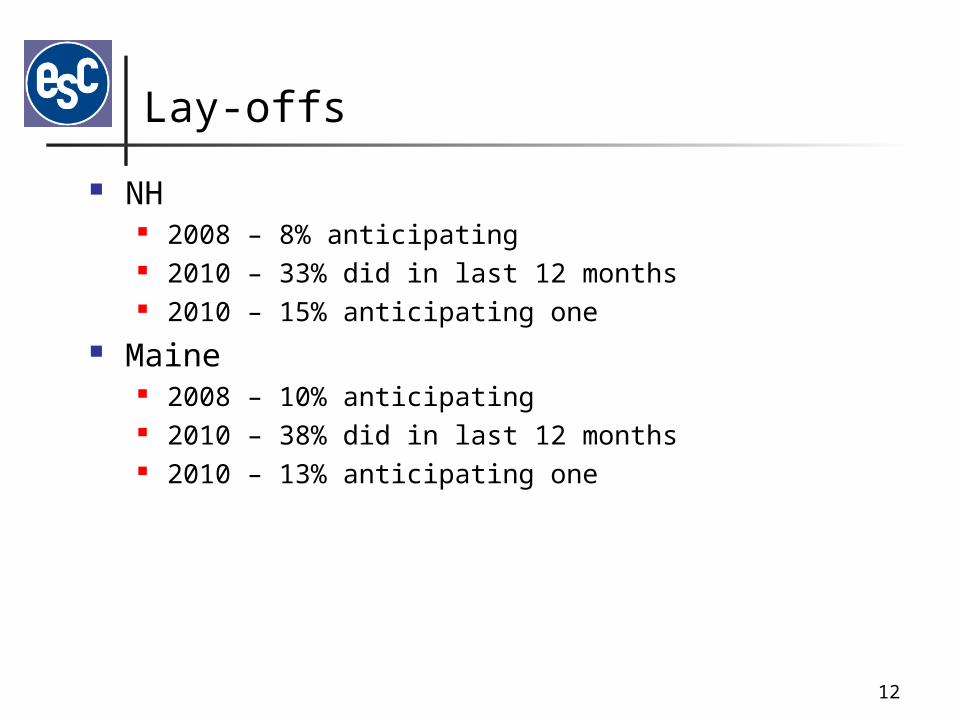
Lay-offs
NH 2008 – 8% anticipating 2010 – 33% did in last 12 months 2010 – 15% anticipating one
Maine 2008 – 10% anticipating 2010 – 38% did in last 12 months 2010 – 13% anticipating one
13
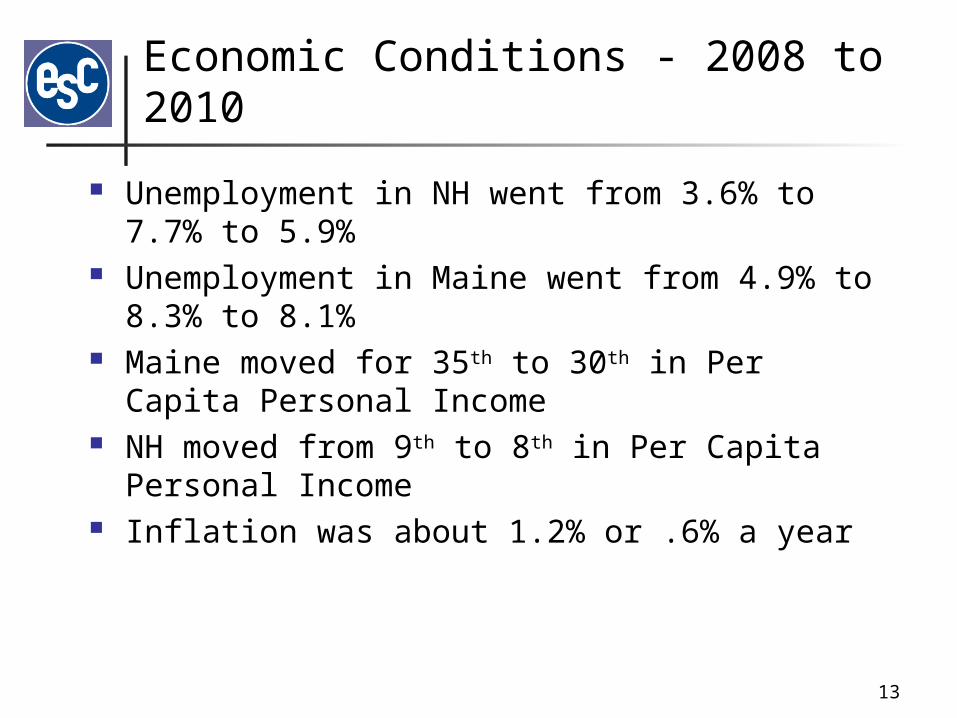
Economic Conditions - 2008 to 2010
Unemployment in NH went from 3.6% to 7.7% to 5.9%
Unemployment in Maine went from 4.9% to 8.3% to 8.1%
Maine moved for 35th to 30th in Per Capita Personal Income
NH moved from 9th to 8th in Per Capita Personal Income
Inflation was about 1.2% or .6% a year
14
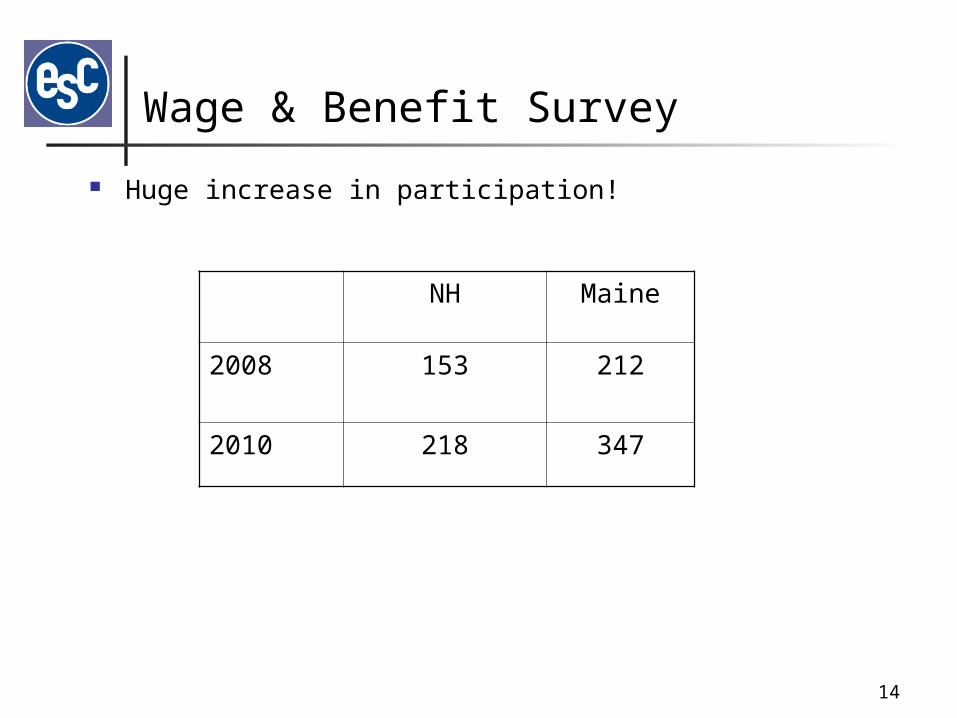
Wage & Benefit Survey
Huge increase in participation!
NH Maine
2008 153 212
2010 218 347
15
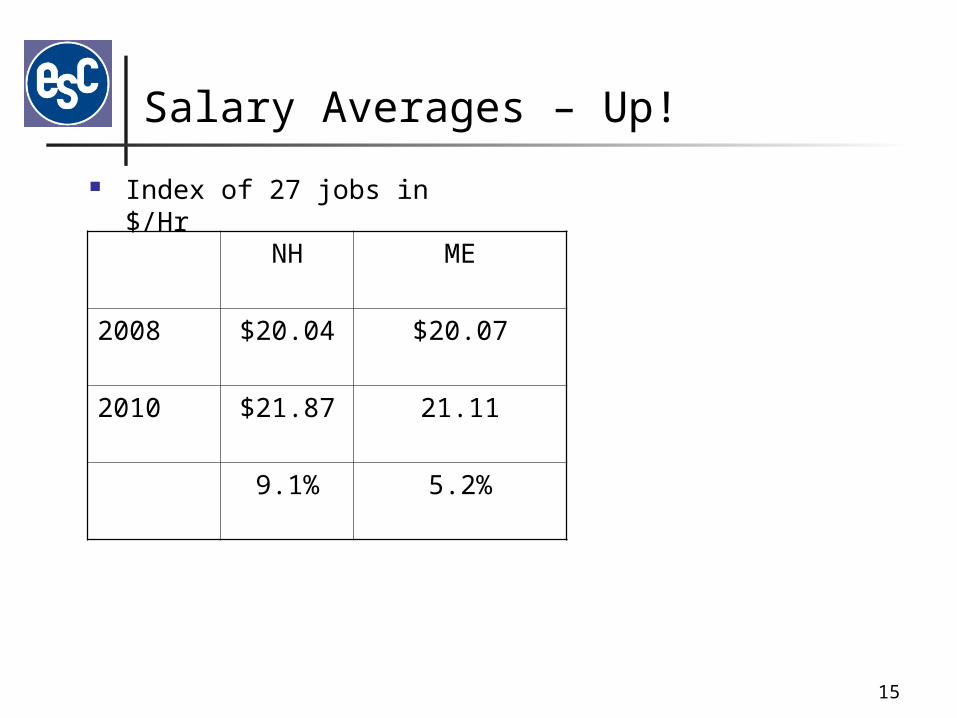
Salary Averages – Up!
Index of 27 jobs in $/Hr
NH ME
2008 $20.04 $20.07
2010 $21.87 21.11
9.1% 5.2%
16
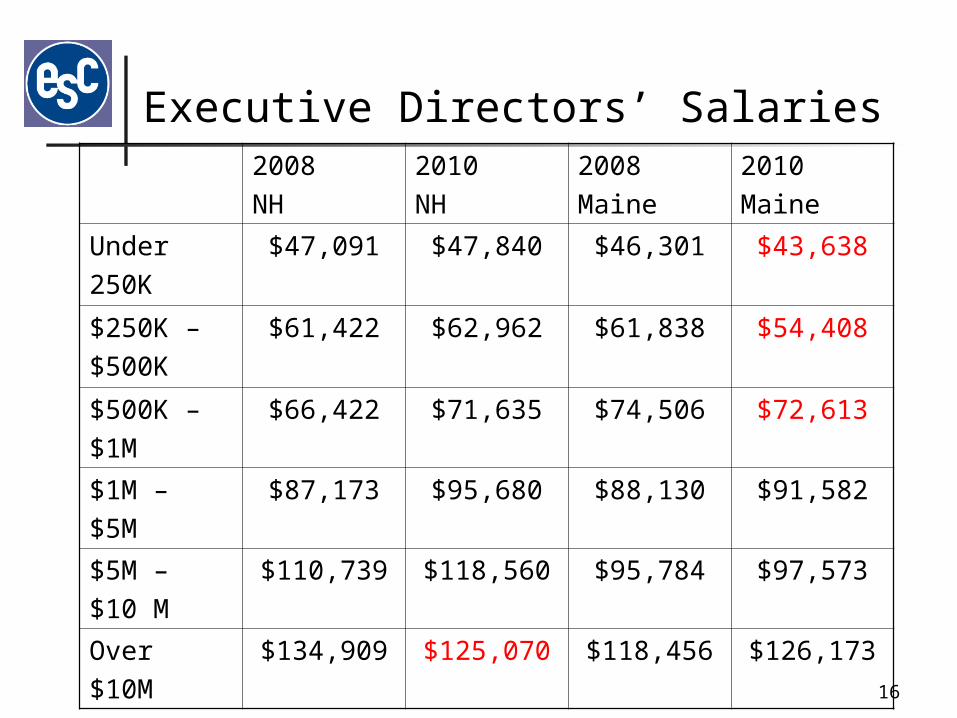
Executive Directors’ Salaries2008
NH
2010
NH
2008
Maine
2010
Maine
Under
250K
$47,091 $47,840 $46,301 $43,638
$250K –
$500K
$61,422 $62,962 $61,838 $54,408
$500K –
$1M
$66,422 $71,635 $74,506 $72,613
$1M –
$5M
$87,173 $95,680 $88,130 $91,582
$5M –
$10 M
$110,739 $118,560 $95,784 $97,573
Over
$10M
$134,909 $125,070 $118,456 $126,173
17
Executive Directors’ Pay Changes over 2 years
Up 2.3% in Maine Up 4.9% in NH
18
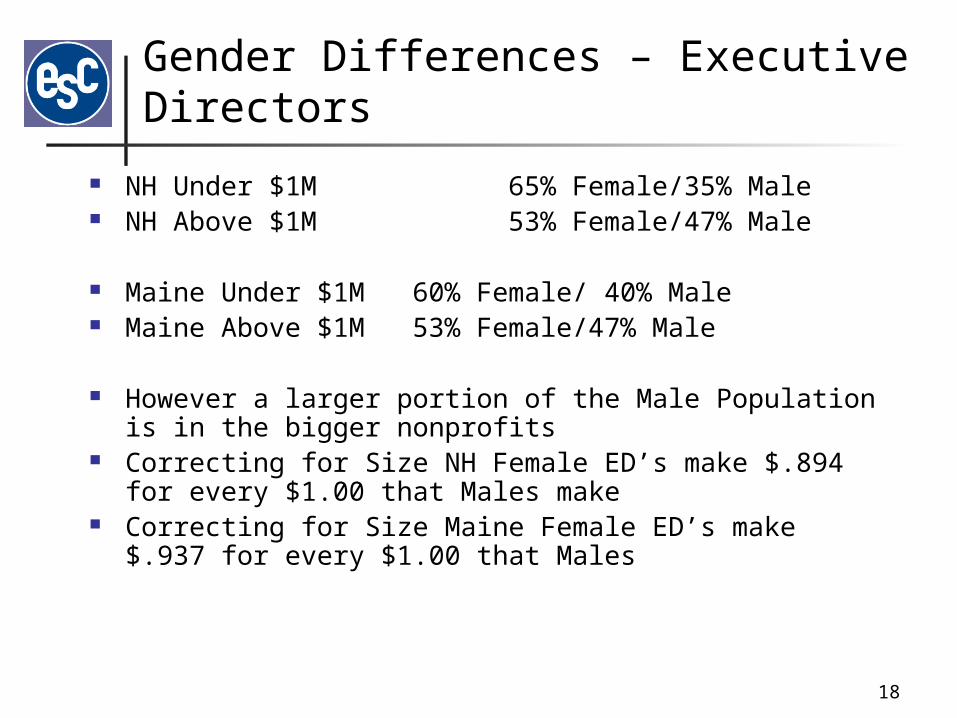
Gender Differences – Executive Directors
NH Under $1M 65% Female/35% Male NH Above $1M 53% Female/47% Male
Maine Under $1M 60% Female/ 40% Male Maine Above $1M 53% Female/47% Male
However a larger portion of the Male Population is in the bigger nonprofits
Correcting for Size NH Female ED’s make $.894 for every $1.00 that Males make
Correcting for Size Maine Female ED’s make $.937 for every $1.00 that Males
19
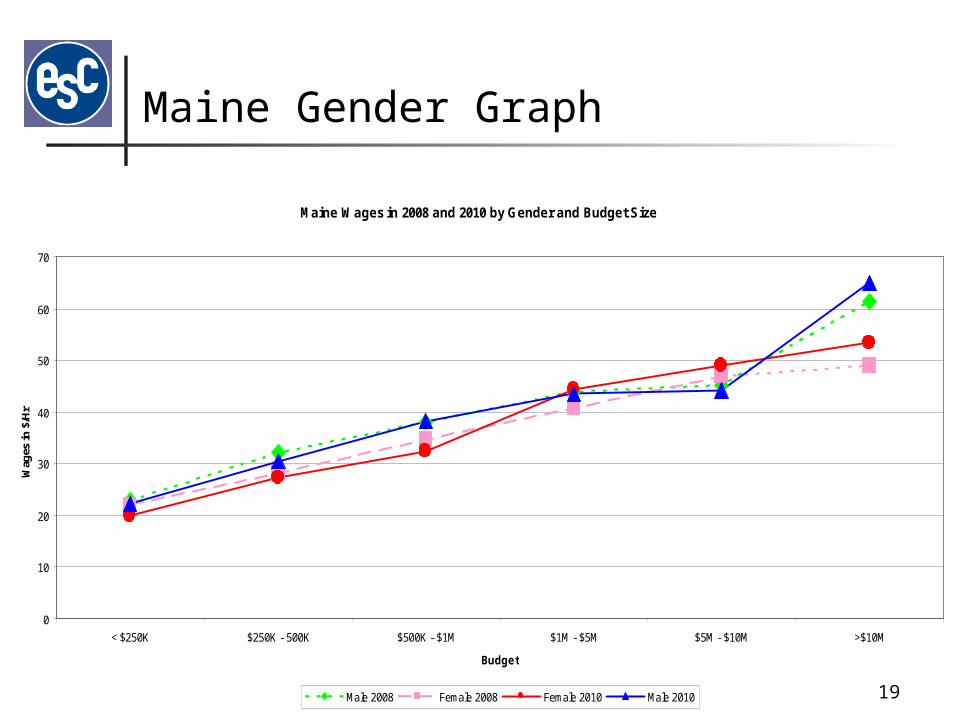
Maine Gender Graph
Maine Wages in 2008 and 2010 by Gender and Budget Size
0
10
20
30
40
50
60
70
< $250K $250K - 500K $500K - $1M $1M - $5M $5M - $10M >$10M
Budget
Wag
es in
$/H
r
Male 2008 Female 2008 Female 2010 Male 2010
20
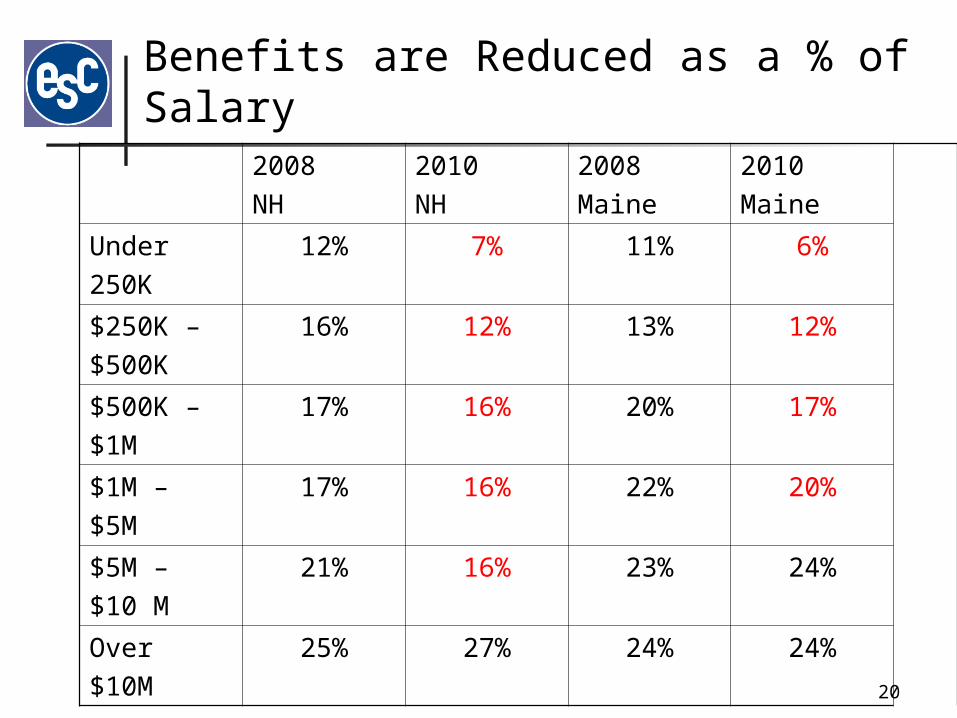
Benefits are Reduced as a % of Salary2008
NH
2010
NH
2008
Maine
2010
Maine
Under
250K
12% 7% 11% 6%
$250K –
$500K
16% 12% 13% 12%
$500K –
$1M
17% 16% 20% 17%
$1M –
$5M
17% 16% 22% 20%
$5M –
$10 M
21% 16% 23% 24%
Over
$10M
25% 27% 24% 24%
21
Benefits Cuts - Summary
NH Group Health offerings dropped from 83% to 75% of nonprofits
Maine Group Health offerings dropped from 84% to 74% of nonprofits
25% of nonprofits do not offer Group Medical In NH the only benefit out of 22 that was found in a
larger % of nonprofits was Retirement Counseling (5% to 6%)
In Maine only three benefits out of 22 increased: Health Wellness (1(% to 20%) Child Care Assistance (4% to 6%) and Retirement Counseling (3% to 6%)
22
Conclusions
NH faired better than Maine Large nonprofits did better than small nonprofits
23
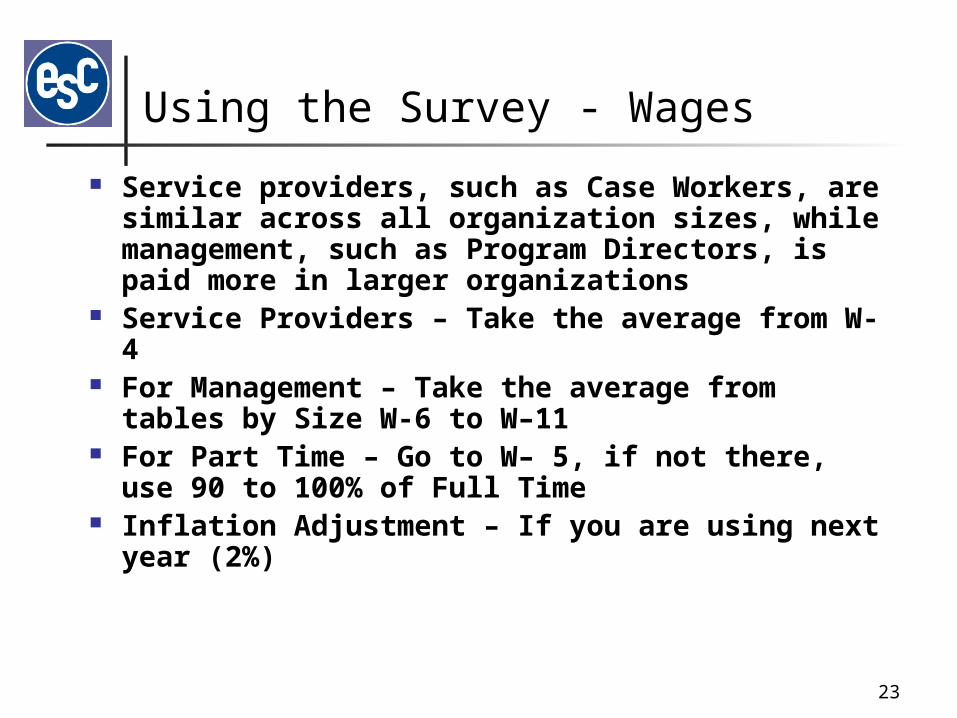
Using the Survey - Wages
Service providers, such as Case Workers, are similar across all organization sizes, while management, such as Program Directors, is paid more in larger organizations
Service Providers – Take the average from W-4 For Management – Take the average from tables
by Size W-6 to W–11 For Part Time – Go to W– 5, if not there, use 90 to
100% of Full Time Inflation Adjustment – If you are using next year
(2%)
24
Examples
Executive Director - $350,000 Budget Finance Director – $3,000,000 Budget Program Director - $1,500,000 Budget Director Care Worker - $500,000 Budget
25
How do I use the other data
Region Mission Education
26
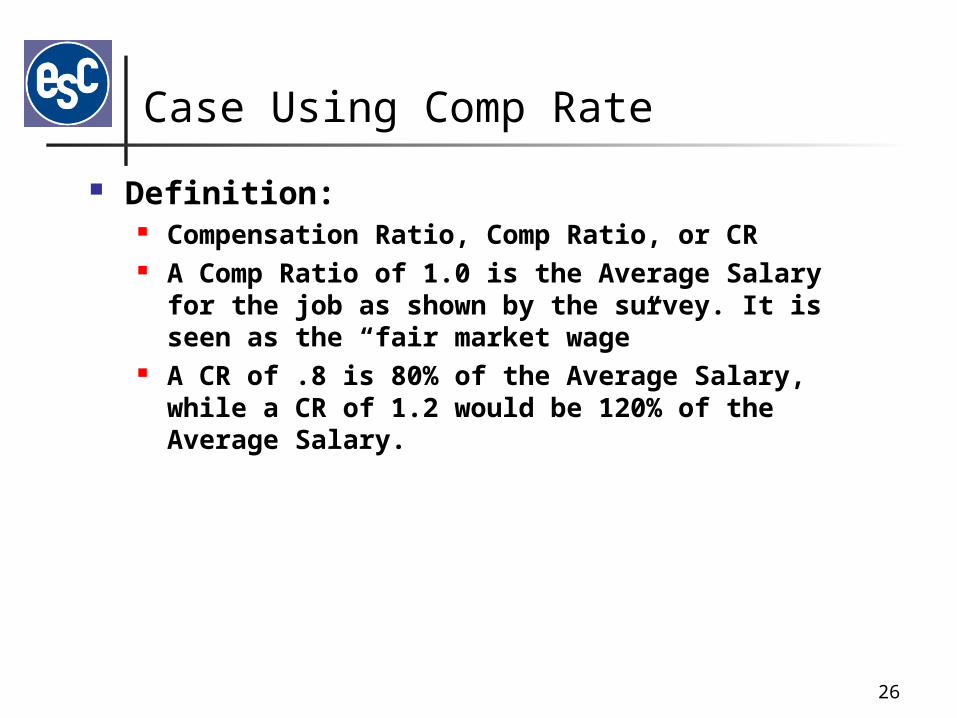
Case Using Comp Rate
Definition: Compensation Ratio, Comp Ratio, or CR A Comp Ratio of 1.0 is the Average Salary for the job as
shown by the survey. It is seen as the “fair market wage”
A CR of .8 is 80% of the Average Salary, while a CR of 1.2 would be 120% of the Average Salary.
27
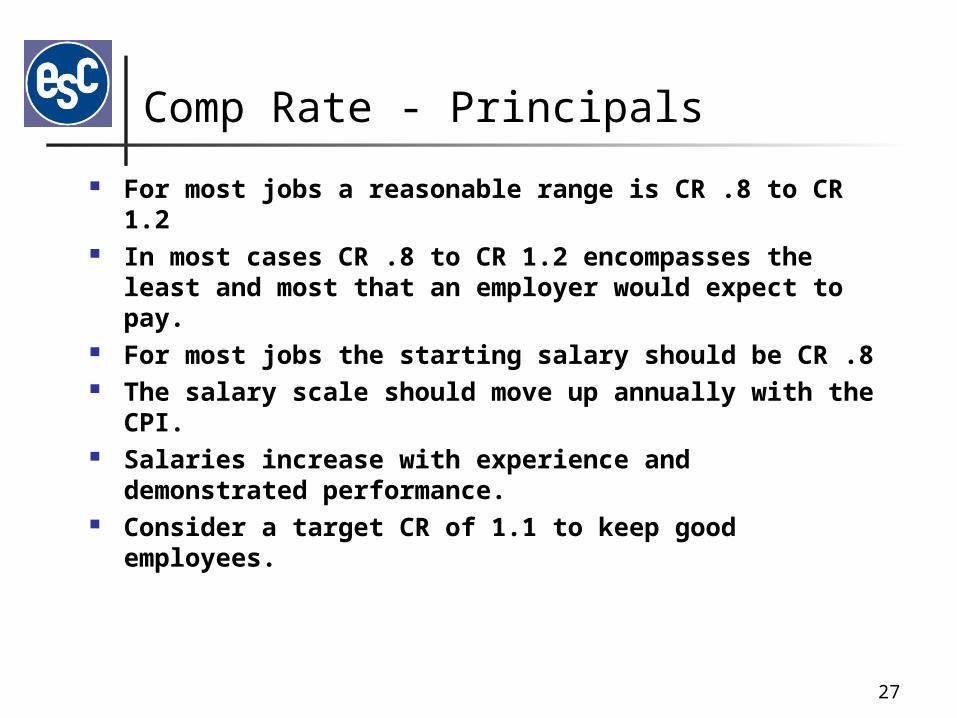
Comp Rate - Principals
For most jobs a reasonable range is CR .8 to CR 1.2 In most cases CR .8 to CR 1.2 encompasses the least and
most that an employer would expect to pay. For most jobs the starting salary should be CR .8 The salary scale should move up annually with the CPI. Salaries increase with experience and demonstrated
performance. Consider a target CR of 1.1 to keep good employees.
28
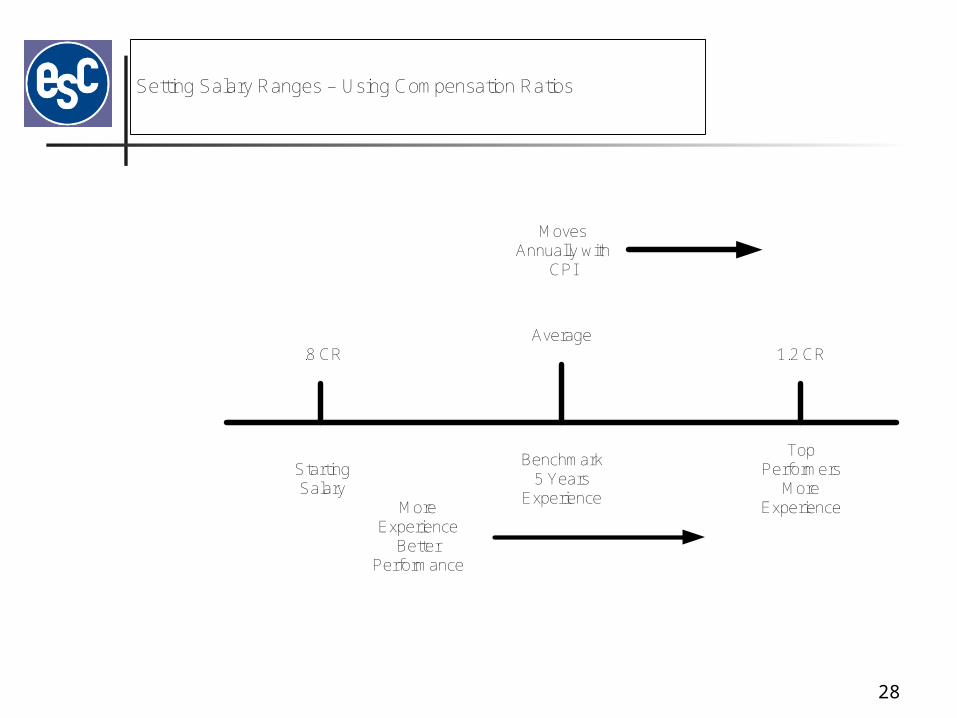
Setting Salary Ranges – Using Compensation Ratios
Average1.2 CR.8 CR
StartingSalary
Benchmark5 Years
Experience
Top Performers
More ExperienceMore
ExperienceBetter
Performance
MovesAnnually with
CPI
29
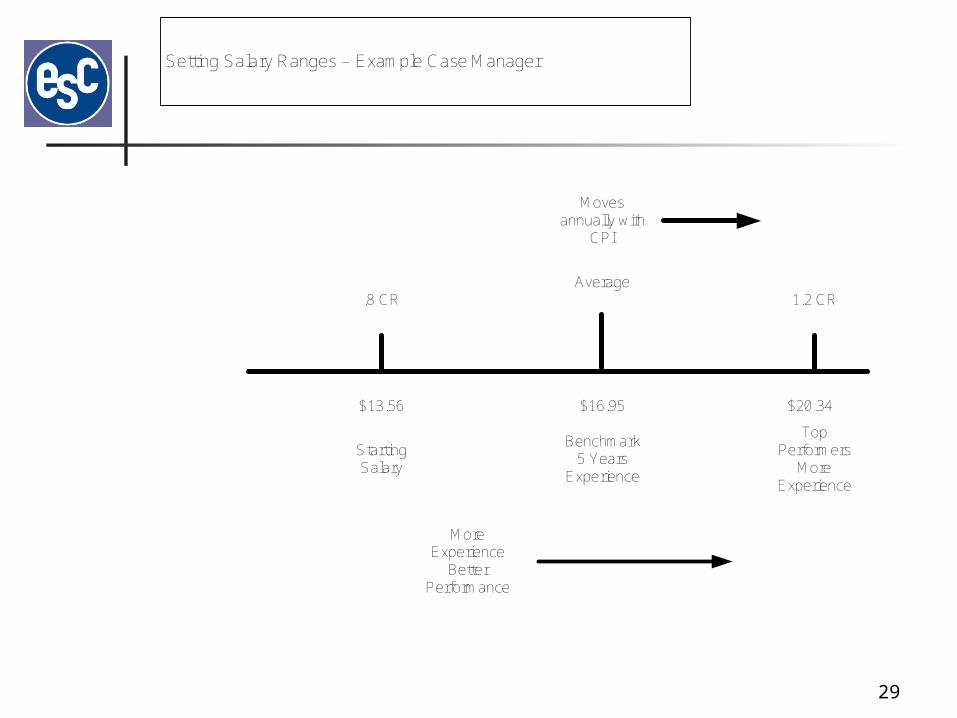
Setting Salary Ranges – Example Case Manager
Average1.2 CR.8 CR
StartingSalary
Benchmark5 Years
Experience
Top Performers
More Experience
More Experience
Better Performance
$13.56 $16.95 $20.34
Moves annually with
CPI

30
Setting Salary Ranges – Example Case Manager – Annual Increases with 2% Inflation
Average1.2 CR.8 CR
2% - 4%+2%
1% - 3%+2%
0+2%
More Experience
Better Performance
$13.56 $16.95 $20.34
Moves annually with
CPI
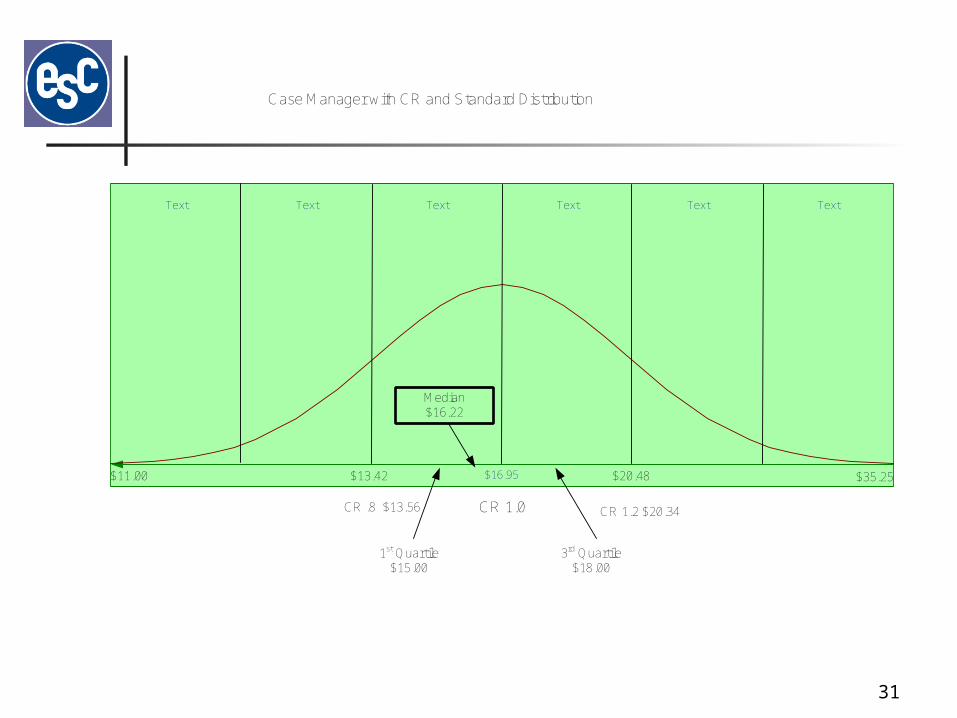
31
Text Text Text Text Text Text
$16.95 $20.48$13.42$11.00 $35.25
Median$16.22
CR .8 $13.56 CR 1.2 $20.34CR 1.0
3rd Quartile$18.00
1st Quartile$15.00
Case Manager with CR and Standard Distribution
32
What about jobs not in the survey?
Guidestar – 990’s Other nonprofits or for profits Ads Salary.com Interpolate Other surveys – Museum Association
33
Benefits
How broad are your benefits? Who pays for them – cost sharing?
34
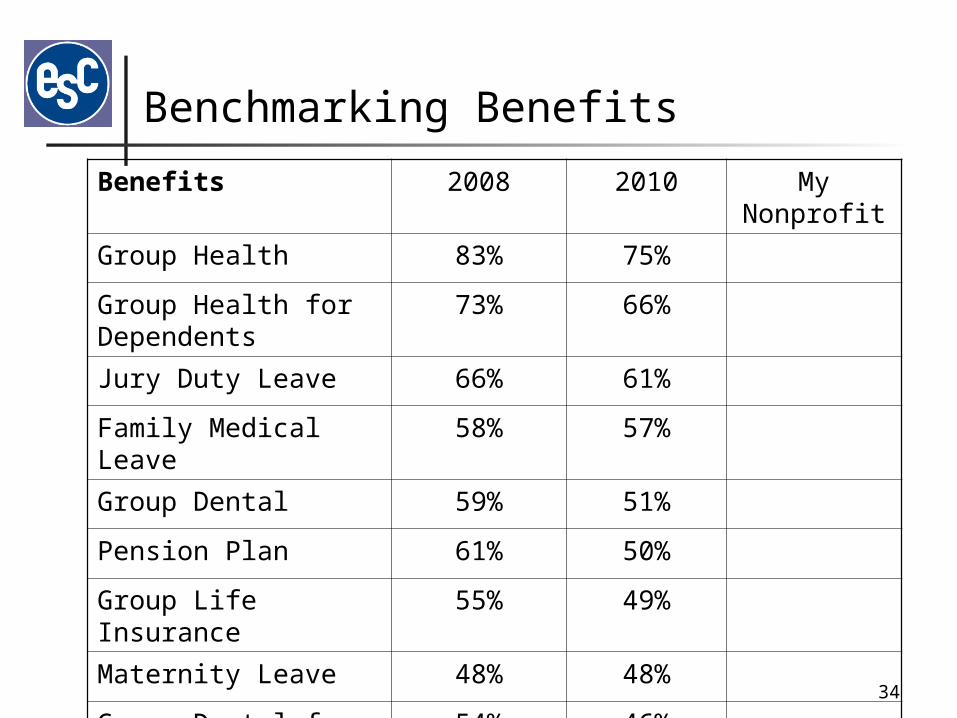
Benchmarking Benefits
Benefits 2008 2010 My Nonprofit
Group Health 83% 75%
Group Health for Dependents
73% 66%
Jury Duty Leave 66% 61%
Family Medical Leave 58% 57%
Group Dental 59% 51%
Pension Plan 61% 50%
Group Life Insurance 55% 49%
Maternity Leave 48% 48%
Group Dental for Dependents
54% 46%
35
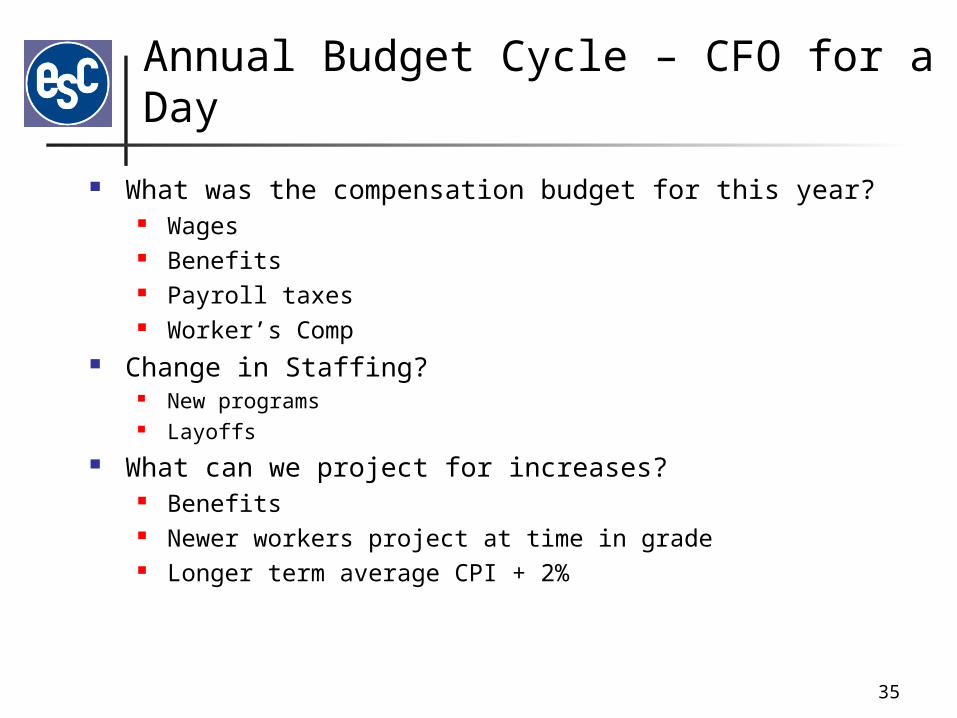
Annual Budget Cycle – CFO for a Day
What was the compensation budget for this year? Wages Benefits Payroll taxes Worker’s Comp
Change in Staffing? New programs Layoffs
What can we project for increases? Benefits Newer workers project at time in grade Longer term average CPI + 2%
36
Annual Budget Cycle
What can we afford? Add or delete Benefits? Change Cost Sharing? How big is the raise pool?
How do we allocate it?
37
Benefits Design
Consider Mix Older workers Younger workers Young families High vs. Low wages
Employee Surveys can be a big help
38
Len Cole, Esq.
IRS Compliance
39
Executive Service Corps Contacts
Michael Daily – ESC Northern New England (207) 641-2300 (603) 362-9300 [email protected] www.Nonprofit-Consultants.org