executive information systems: an identification of ...unilever would thus like to identify,...
TRANSCRIPT

Executive Information Systems: An identification of factors likely to affect user acceptance, usage and adoption of the Unilever EIS.
By
SONNY ANYETEI MOSES AKO-NAI
Student number: 202519925
Submitted in partial fulfilment of the requirement for the degree of MASTER IN BUSINESS ADMINISTRATION
Graduate School of Business, Faculty of Management University of KWAZULU-NATAL
Supervisor: Craig Blewett
Date: July, 2005

ii
DECLARATION
I, Sonny Anyetei Moses Ako-Nai, declare that this research has not been previously
accepted for any degree and is not being currently submitted in candidature for any degree.
Signed:
Date: XT*

ACKNOWLEDGEMENTS
This research has been conducted and directed by the expert guidance and coaching of my supervisor, Craig Blewett, to whom I say a 'big' thank you.
My thanks also go to all my lecturers in the GSB who have been dedicated and imparted their knowledge to make the completion of this study possible.
My sincere gratitude goes to my family, especially my mum, for her continuous prayers, my siblings for their support and encouragement, my dad (deceased) for believing in me and cheering me on.
My most profound gratitude to you, Patience and Gifty, for your great support and understanding, and to my 'cheer-leaders' Nii Nai, Sowah and Nii Nai Fifii, you are my inspiration.
Thanks to all the new friends I made in South Africa and the GSB who made my stay comfortable and enjoyable. Your friendship is greatly appreciated.
Last, but not least, to my editors Ivondia and Cathy, for correcting all my mistakes, thanks a lot.
" .' w ."• / ^

iv
ABSTRACT
Executive Information Systems (EIS) are information systems designed for the direct use of the Executive to access business relevant information, including information about customers, competitors, key performance indicators, internal operations, stock prices and news.
Classified as high-risk projects, just like any other IS projects, organizations have been cautious and critical in ensuring EIS successful implementation and continuous usage by their intended users, the Executives.
Unilever South Africa is no exception, and would thus like to ensure a successful implementation and acceptance of its EIS. An EIS system that once implemented will be used, accepted and adopted by executives to drive the achievement of its strategic objectives.
This research is intended to investigate and identify potential factors that are likely to affect user acceptance, usage and adoption of an EIS implemented by Unilever South Africa.
The research investigation was based on a proposed model derived from Davis (1989) Technology Acceptance Model (TAM) that explores the phenomena of 'perceived usefulness' and 'perceived ease of use', as drivers of user acceptance and illustrates the dynamics of the factors that affect the users' acceptance of the system.
The research data was obtained via questionnaires and semi-structured interviews of users from the Unilever EIS user group. The feedback obtained was then analysed and tested against three hypotheses. All three hypotheses were accepted leading to the conclusions that:
(a) Users' attitudes towards usage of the Unilever EIS are positively influenced by both their 'perceived usefulness' and 'perceived ease of use' of the system.
(b) The Unilever EIS users' 'perceived usefulness' of the system positively influences their 'perceived ease of use' of the system.
(c) The Unilever EIS users' 'perceived ease of use' of the system has a greater influence on their attitude towards the system usage than their 'perceived usefulness' of the system.

V
TABLE OF CONTENTS
Chapter 1. Introduction 1
1.0 Introduction 1 1.1 Background 4 1.2 Motivation for the Study 7 1.3 Value of Study 8 1.4 Problem Statement 9 1.5 Objectives of the Study 9 1.6 Limitation on study results 10 1.7 Layout of the study presentation 10
Chapter 2. Literature Review 11
2.0 Introduction 11 2.1 Information Systems in organizations 11 2.2 EIS Development 14 2.3 EIS Features 15 2.4 Some proposed frameworks 16 2.5 Critical Success Factors for EIS 21 2.6 EIS Acceptance 24 2.7 Models on Technology Adoption 24 2.8 Other Extensions on TAM 27 2.9 Proposed Model 31 2.10 Conclusion 33
Chapter 3. Research Methodology 35
3.0 Introduction 35 3.1 Research philosophy 35 3.2 Research purpose 36 3.3 Research Approach 37 3.4 Research Methods 38 3.5 Research Techniques 39 3.6 Time frames of research 40 3.7 Sampling Technique 41 3.8 Data Source 42 3.9 Data Collection 42 3.10 Questionnaire design 43 3.11 Validity and Reliability 44 3.12 The Research Instrument 45 3.13 Summary 49

vi
Chapter 4. Company Background 50
4.0 Introduction 50 4.1 The Unilever Entity 50 4.2 Unilever Information Systems 51 4.3 EIS in Unilever 53 4.4 Conclusion 54
Chapter 5. Results and Discussions 55
5.0 Introduction 55 5.1 Results 55 5.2 Discussions on Results 60 5.3 Conclusion 65
Chapter 6. Conclusion and Recommendation 66
6.0 Introduction 66 6.1 Key Findings 66 6.2 Recommendations 70
Appendices 74
Appendix A - Research instrument sent to users 74 Appendix B - Research instrument used for semi-structured interview 76 AppendixC - Reliability test for PU 78 Appendix D - Reliability test for PEU before adjustments 19 Appendix E - Reliability test for PEU after adjustments 80 Appendix F - Raw data as captured from questionnaires 81 Appendix G - Spearman's and Regression coefficients before adjustments 82 Appendix H - Spearman's and Regression coefficients after adjustments 83 Appendix I - System Development Life Cycle (SDLC) 84
Reference 88
Internet 93

vii
List of Tables
Table 2.1: Comparison of the frameworks 20 Table 2.2: ListofCSF 23 Table 2.3: Ranked EIS CSF 23 Table 3.1: Sources of Questions adapted 46 Table 5.1: Descriptive Statistics 56 Table 5.2: PEU factors correlation coefficients 58 Table 5.3: Spearman correlation coefficient 59 Table 5.4: Regression coefficients (P) 60 Table 6.1: Factors and their characteristics 68

viii
List of Figures
Figure 2.1: Technology Acceptance Model (TAM) 31 Figure 2.2: Proposed Research Model based on TAM 32 Figure 5.1: Correlation and Regression coefficients 59

ACRONYMS
Abbreviations AT BI BW CSF DSS EIS ES GSB GUI INOPLAN IS IT KMS KPI MIS PAS PEU PU SD SIS SN SDLC TAM TPB TPvA TTF
Meaning Attitude Behavioural Intension Business Warehouse Critical Success Factor Decision Support Systems Executive Information System Executive Systems Graduate Business School Graphical User Interface Innovation Planning Process Information Systems Information Technology Knowledge Management Systems Key Performance Indicators Management Information System People, Activities and Systems Perceived Ease of Use Perceived Usefulness Standard Deviation Sales Information System Subjective Norm System Development life Cycle Technology Acceptance Model Theory of Planned Behaviour Theory of Reasoned Action Task-Technology Fit

Chapter 1. INTRODUCTION
1.0 Introduction
The purpose of this research is to identify factors that are likely to influence users'
acceptance, usage and adoption of the Unilever Executive Information System (EIS).
Organizations have overtly invested in Information Systems (IS) to increase effectiveness
and efficiency, with the ultimate aim of increasing their market share and profitability
(Beynon-Davies, 2002).
However many Information Systems have failed (McBride, 1997) even in environments
where all the right methodologies and development processes have been followed and the
system successfully tested and rolled out. Beynon-Davies (2002) thus cautioned that
successful IS employment in an organization involves more than technical and
development issues.
Beynon-Davies (2002) defines an Information System (IS) as a system of communication
between people (users) that involves the gathering, processing and distribution of
information for the relevant use by the people (users).
The IS, according to Beynon-Davies (2002) must have the capability to gather, process and
distribute the information to the relevant users.
To successfully achieve this, three critical key features must be present; functionality,
usability and utility. The Functionality of the IS is its ability to do or perform what it is
designed to do. This can be achieved by a close examination of the users' requirements and
fulfilling them. Usability is the ease of use of the IS for the purpose for which it was
designed. This involves the ease of the interaction between the user and the system. Utility
defines how acceptable the system is to the users, in terms of meeting those needs in the
manner expected by them (users).

An organization would therefore benefit or obtain the full worth of an IS based on its
contribution to the users' requirements and process it supports and thus the organization as
a whole.
To successfully achieve this, the design and implementation of IS by an organization must
involve all stakeholders including the system users, system developers, external partners
and all other interest groups. This would improve system acceptability and satisfaction with
the system (Newman and Sabherwal, 1996). Risk of failure of IS in an organization is high
(Rainer and Watson, 1995; Young and Watson, 1995; Herrero and Salmeron 2004) causing
an adverse impact on human resources, costs and hampering any trust for future or new
systems that would otherwise benefit the organization greatly (Beynon-Davies, 2002).
To benefit from IS in support of high organizational performance, an increasing number of
organizations are implementing IS for direct use by executives to access information about
customers, competitors, key performance indicators, internal operations, stock prices and
news. These systems are preferably called Executive Information System (EIS) (Watson, et
ah, 1991). This is to facilitate faster and higher quality decisions, an increasingly important
requirement for executives, given the current trends of increased globalization and
heightened competition (Elam and Leidner, 1995).
Classified as high-risk projects, just like any other IS projects, organizations have been
cautious and critical in ensuring EIS successful implementation and continuous usage by its
intended users, the executives (Belcher and Watson, 1993).
Based on this background, Unilever would like to avoid failure of its newly implemented
EIS system and to rather ensure its successful acceptance, usage and adoption by its users.
Unilever would thus like to identify, proactively, possible factors relating to users' attitudes
towards the system that are likely to influence, positively or negatively, its users'
acceptance, usage and adoption of the system. These factors will then be appropriately
dealt with in a proactive manner to ensure the successful acceptance, usage and adoption of
the system.
Unilever's EIS is crucial to the successful achievement of its strategy objectives. EIS is the
main monitoring tool which would provide information on key performance indicators that
2

are directly linked to its strategic objectives in a timely and accurate manner. This would be
directly accessible to decision-makers to facilitate timely and appropriate decision-making
to sustain the achievement of its strategic objectives and competitiveness.
Users' acceptance, usage and adoption of its EIS system is thus vital to the achievement of
its strategic goals.
This research will therefore investigate or identify potential factors that are likely to affect
user acceptance, usage and adoption of the EIS system implemented by Unilever South
Africa. The research will explore the phenomenon of user acceptance and illustrate the
dynamics of the factors that would affect the users' acceptance of the system. The feedback
obtained will then be analyzed and tested against hypotheses. The rejection or acceptance
of the hypotheses will highlight the various factors of significant influence on user
acceptability, usage and adoption of the system.
The research investigation will be based on a proposed model derived from Davis (1989)
Technology Acceptance Model (TAM) and the research data will be obtained via issuing of
questionnaires and conducting of semi-structured interviews of users from the Unilever EIS
user group.
Recommendations, based on the identified factors, will be suggested by the research at the
end of the study. These recommendations to the company, Unilever South Africa, would
enable a timely and proactive address of these factors to ensure that user acceptance, usage
and adoption of the system would be enhanced.
3

1.1 Background
"There are no such things as business surprises. Such surprises are events that provided
warning, but were just not detected or appropriately acted upon in a timely fashion"
(Ken McGee, group vice-president, GartnerG2 , Internet 1).
Over the years, Information systems have become the backbone of businesses to the point
where it would be impossible for many to function (let alone succeed) without them. As a
result of its increasing role in the enterprise, the Information system management function
is changing; metamorphosing from a support function provider into a strategic partner
(Mathias Salle, HP, 2003).
King (1987), stated that an organization cannot afford to ignore the strategic opportunities
that IS may offer, and, therefore, 'the potential of information as a strategic resource should
be incorporated as a routine element of the business planning process, so that all managers
become used to thinking in these new terms'.
Thus, in order to effectively achieve strategic benefit from IS via the business planning or
strategic process, management must concentrate on rethinking business management by
analyzing current business problems and environmental change, and considering IS as one
ingredient of the total solution (Earl, 1992).
As a result of the increased interaction and dependency, more information systems have
been designed to support management of the organization. Management Information
systems (MIS) were introduced to generate regular, predefined reports containing
information about the organization (Millet et ah, 1991) and were mainly operated by the
information systems design professionals. This did not give the users (management or
managers) the control they needed as to what information was important, relevant or really
needed. A later system to provide more assistance with specific decision-making tasks was
introduced, the Decision Support System (DSS), which gave managers more control as to
what information they really needed to make decisions.
Though some of these earlier IS were used, their relative success was mainly amongst
middle and lower management, but they failed to provide the necessary support to
executive management (Watson et al, 1991). Executives have been overloaded with
4

information from information system operators that, more often, is not necessary to support
the executives' decision-making process (Internet 2).
The alternative, and probably a solution to this, is to bypass the traditional reliance on
subordinates and information system managers for the supply of information (Internet 2).
The executive must have direct access to the relevant information s/he needs in the right
time and format to facilitate appropriate decision-making.
Executives, or top management are charged by shareholders (owners) and board of
directors with the formal authority and responsibility to make final decisions concerning
the direction or running of the organization (McLeod and Jones, 1986). The executive is
thus responsible for making decisions regarding his/her line of action amongst various
possible alternatives (Mintzberg, 1975). Such a decision, a selection among several courses
of action, is almost always faced with a varying level of uncertainty about what would
happen with each alternative choice. Information reduces these uncertainties. The
effectiveness of the decision and the certainty of being right is highly improved if the
information provided is related to the decision for which it is intended (Nickerson, 2001).
Decision-making is reliant on information, and access to the right information therefore
reduces the uncertainty in decision-making (Beynon-Davies, 2002). To successfully make
decisions, the executive must have access to high quality information that is relevant to the
issue at stake and that is current and accurate.
The executive information system was introduced and made popular in the 1980s. The
name 'Executive Information System' (EIS) was first coined by Rockart and Treacy (1982)
to specifically refer to systems being used by executives to meet their information needs
and to facilitate effective decision-making. EIS has been defined differently by researchers
(Paller and Laska, 1990; Turban and Watson, 1989). However, for the purpose of this study
EIS will be defined as "a computerised system that provides executives with easy access to
internal and external information that is relevant to their critical success factors" (Watson et
ai, 1991). Though there has been no one official definition for EIS, Kimble and Kaniclides
(1991) in their research used a definition they termed "a workable definition" based on
some typical basic characteristics of an EIS. These characteristics include the following;
5

EISs:
- must obviously be a computer-based information system
must be used directly by executives without intermediaries
- must provide fast and easy access to information from a variety of sources, both
internal and external to the business
the information must be based on key performance indicators from the business's
strategic critical success factors
- must facilitate customising and have the potential to be tailored to the needs and
preferences of the individual executive using it
- information must be presented in such a way that the executive is able to assimilate
and quickly identify problems and opportunities
the information must be presented in an accessible and readily interpretable format
must use a GUI
Other characteristics defined by other researchers (Burkan, 1988; Friend, 1986; Kogan,
1986; Zmud, 1986) include that EIS should:
- extract, filter, compress, and track critical data
provide online status access, trend analysis, exception reporting, and "drill-down"
from a summarized report to underlying details
access and integrate a broad range of internal and external data
- be user-friendly and require minimal training, or no training to use
Over the years, many researchers have tried to assess the success or failure of EIS systems
and have come up with various frameworks to employ in EIS development and
implementation to ensure success. However, according to Delong and Rochart, (1992), the
existing literature on EIS has no clear factors to base the definition of success or failure on,
although it is agreed that this would depend considerably on the development and
implementation process and the use of the system thereafter.
Like most other IS, EIS has enjoyed some successes and failures. Various researchers
(Watson and Rainer, 1995; Srivihok, 1999; Wagner and Poon, 2000) have tried to assess
reasons why some EIS projects succeed and why others fail. These researchers have
explored factors based on user acceptability of the technology leading to its further
adoption. Various models have been proposed in order to achieve this, including 'Theory of
6

Reasoned Action' (TRA) (Fishbein and Ajzen, 1975), 'Theory of Planned Behavior' (TPB)
(Ajzen, 1991), 'Task-Technology Fit' (TTF) (Goodhue and Thompson, 1995) and
'Technology Acceptance Model' (TAM) (Davis, 1986).
This research will employ a similar approach, using an extension of TAM to identify
factors that are likely to affect user acceptability, usage and adoption of the EIS system
implemented by Unilever South Africa.
1.2 Motivation for the Study
The motivation for this research is to explore possible issues that are non-technical and
non-developmental in nature, which can affect the success or failure of EIS employment.
Most previous research has concentrated on the development process, development team
and the technical issues, with an assumption that success of EIS depends solely on these
factors. However, EIS just like any other IS project, has driven change, affected
organizational structure and has been greatly affected by organizational culture that is
either averse to or supportive of IS usage in the organization.
Assessing the effect of these factors would greatly provide organizations and other
researchers an insight and suggest possible actions to take to minimize the risk of failure of
such projects.
In addition to the above motivation, the insight that would be derived would be of great
interest and support for Unilever South Africa in their quest to successfully implement their
first EIS.
To achieve success in both its strategies, "Path to Growth" and "Vitality to Life", one of
the principle components of Unilever's plan is "Simplification". This involves revision of
its knowledge and information systems for and the re-focusing of resources behind its 400
leading brands with consequent reduction of overheads and streamlining of the Corporate
Center, costing some €2.0 billion (Internet 3).
Unilever has employed IS in very significant ways. It employed an IS called "INOPLAN"
for its "Path to Growth" strategy in the management of innovation process and procedures
for business teams in assessing brands' value and equity. INOPLAN also controlled the
7

process for the approval and (or) rejection of innovation projects for product (brand)
development. This helped Unilever identify and focus on its 400 key brands which are
profitable out of over 2000 brands, a high cost-saving initiative.
To achieve its current strategy "Vitality to Life" and beat the competition, Unilever has
employed various other systems to monitor its performance. Essential to these systems is
the EIS which must keep track of all Key Performance parameters of the strategy's CSF
and continuously make these accessible to the Executives for decision making.
Thus insight obtained by the study on the factors that affect EIS employment would be a
helpful guideline to assist Unilever to successfully rollout its EIS.
1.3 Value of Study
Unilever's Strategy for 2005 to 2010 is to add "Vitality to Life" which is aimed at
expanding further the awareness and use of its brands to the enhancement of the
consumers' life and well being.
To achieve this, Unilever is again determined to employ the appropriate IS to further drive
the success of its 400 profitable brands by ensuring that the brands deliver value to the
consumer. To add vitality to the life of its consumers, Unilever must ensure that its brands
are readily available to the consumer and fully satisfy his/her needs. The underlying
strategy of Unilever to achieve this via its CSF must be fully monitored to ensure this
happens.
The introduction of Unilever's first EIS is to do exactly that, monitor and make available
all the key performance indicators on its CSF to the Executives at all times, to equip them
in making timely decisions and enable them to take advantage of other opportunities that
may arise.
Unilever would thus benefit from the findings and recommendations that would be
obtained from this study to ensure a successful implementation of its EIS system which the
main IS is to support and to sustain achievement of its strategy and competitive position.
8

1.4 Problem Statement
Having successfully completed the initial development of its first EIS and resolved
technical and developmental process issues, Unilever is determined to ensure a successful
rollout of the system with minimal or no hitches. To achieve this, issues outside the
development process that have not yet been addressed would have to be identified and
appropriately managed.
The problem statement is thus: To identify factors that are likely to affect the users'
acceptability, usability and adoptability of the Unilever EIS system.
To address this research problem the following questions will be answered:
What are the possible factors that affect user perception of the EIS system?
- What are the possible factors that affect user perception of the EIS usefulness and
ease of use of the system?
What are the other non-technical and non-developmental issues that need to be
managed appropriately to ensure user acceptability, usability and adoptability of the
system?
1.5 Objectives of the Study
To identify the internal organization factors that are likely to affect or ensure the successful
implementation of an EIS in an organization, and to propose appropriate ways to manage
them to ensure EIS implementation success. This excludes all technical and developmental
process factors.
The development and implementation of EIS has been faced with many challenges that
have affected its successful implementation and continuous use of the system within an
organization. In studying the factors underlining these challenges, many researchers have
concentrated on the technical and the core developmental issues.
However, other non-technical and non-developmental process factors have affected EIS
implementation and acceptance or usage. These include leadership issues, both general and
project base leadership, organizational culture in relation to IS acceptance and appreciation,
change management to deal with possible changes that may be driven by the new IS (EIS)
9

and finally, getting the total buy-in of stakeholders, that is, all interested parties who may
be affected by or use the system.
On completion of the study, various factors under Leadership, Organizational Culture,
Organization structure and Stakeholders interest that would affect EIS implementation and
adoption success will be identified and a recommendation on how to effectively manage
them for success will be given.
1.6 Limitation on study results
The methodology employed in reaching results limits the use of the findings in
generalization in the researched field. These findings only relate directly to the case as the
findings reflect reality at the time of the research, and hence the situation is subject to
change (Marshall and Rossman, 1999). The scope of the research and results is only
applicable and limited to Unilever South Africa.
1.7 Layout of the study presentation
The above given introduction to this study, forms Chapter One of the study presentation
layout. There are five other chapters that are structured as follows: Chapter Two reviews
available literature on IS and EIS as the focus, leading to the proposed research model to
use as a bases for analysis; Chapter Three gives the company background of Unilever
South Africa, as the case study of this research. Chapter Four covers the details of the
research methodology and the instrumentation to be employed in data collection; Chapter
Five will discuss the findings and Chapter Six the recommendations.
10

Chapter 2. LITERATURE REVIEW
2.0 Introduction
"... The effectiveness of an Information System is measured by the quality of the
information it produces. If the information produced by the information system is not used
by users, then that information system has become extinct or worthless". (Wessels et al.,
2003, pl21).
This chapter covers Information System (IS) literature review on IS usage in organizations
since the introduction of Management Information Systems (MIS) to EIS.
The chapter commences with discussions on Information System usage within
organizations, followed by the various types of IS developed and employed by
organizations. This leads to the introduction of EIS, features of EIS and various
development frameworks proposed by researchers to ensure successful development and
implementation of EIS. Various models that have been researched on technology
acceptance will be discussed leading to the proposed framework for this study, TAM.
2.1 Information Systems in Organizations
Information Systems have become vital to organizations as more organizations become
increasingly dependent on information and information tools to make effective decisions,
without which the organizations run high risk of irreparable damage or failure (McGee et
al., 2003). This has made IS part of the overall organization strategic plan and one of the
key success factors (McGee et al., 2003).
It is clearly obvious that organizations have invested in IS to increase effectiveness and
efficiency. Ultimately, this is to enhance their products and services (Spraque, 2004) and to
increase their market share and thus profitability (Beynon-Davies, 2002), and to drive the
achievement of the overall business objective (John Ward, 2002).
IS has become essential in order to create competitive firms, manage global corporations,
and provide useful products and services to customers (Laudon and Laudon, 1998).
11

Once an organization begins to use information strategically, its decision processes,
management structure and even the way its work gets done begins to transform (Drucker,
1988).
Information systems thus support management in all the various functional areas or
departments (Nickerson, 2001). Sources of information for the various information systems
would include Accounting and Financial information systems, Marketing information
systems, Human Resource information systems, Manufacturing information systems, etc.
just to mention a few. The various types of information systems developed and used within
organizations are discussed below.
2.1.1 Management Information Systems (MIS)
These provide information to all levels of management in the form of reports and query
responses. The information is obtained from a database with data from both internal and
external sources, but mainly internal, from transactional processing systems. These systems
provide little or no analyses on the information. The setback of these systems is their rigid
nature and the combination of large data in reports.
2.1.2 Decision support Systems (DSS)
These information systems provide managers with further analysis capabilities to perform
scenario analysis for decisions to be made, based on the various 'what-if scenarios. DSS
obtain information inputs from both internal, mainly the MIS, and external sources. DSS
provide both periodic and history information for analysis and trends verification to help
management make decisions. DSS have been suitable and used at tactical and operational
levels but have never really been popular with executives (Thodenius, 1994).
2.1.3 Expert Systems (ES)
These systems provide management with information needed for decision-making and in
addition suggest advice to the decision-maker on what to do. ES have been designed with
human expert knowledge and are thus able to analyze information and mimic human
decision-making, by making recommendations.
12

ES are interactive in nature, arriving at a decision by requesting answers to a set of
questions based on the expert advice needed. They rely on a 'knowledge-base', a database
of expert knowledge.
2.1.4 Knowledge Management System (KMS)
These information systems provide capability for organizations to store, organize, access
and share their knowledge, i.e. organizational knowledge. KMS may use ES and any other
intelligent agents to acquire more knowledge.
2.1.5 Executive Information System (EIS)
Although MIS and DSS meet some of the information requirements of top executive
management, they are mainly used by middle and lower management and are thus less
appropriate for top management support.
Executives often work in an unstructured way with little knowledge of what information
they would need in advance. Their information needs must be managed by flexible systems
that are adaptable to their working patterns and requirements. EIS provides executives with
external information, covering relevant external business environment parameters that
affect the organizations' performance, that enable executives to understand the external
business-operating environment. EIS provides the executives with the capability to focus
on more detailed information to identify trends or sources of problems.
EIS is being developed to help business executives access information necessary to make
strategic and effective decisions. These systems provide information from internal
operations of the business and from external sources such as competitors' information,
stock or share prices, and other key performance indicators (Frolick, 1993). EIS focuses on
helping the executives assimilate information quickly to identify problems and
opportunities, and also to keep track of their set business critical success factors in a
continuous and on-going manner (Internet 2).
The key to the successful development of EIS is knowing what information the executives
need in order to make effective and strategic decisions. The nature of the executives' jobs
requires changing information needs which the EIS must keep abreast of and make
accessible (Frolick, 1993).
13

The executive's work is more unstructured, non-routine and long-term (Mintzberg, 1975),
coupled with activities that are usually diverse, brief and fragmented in nature.
A large part of the executive's work involves setting priorities, planning and scrutinizing
strategy implementation and building networks at corporate level with both internal and
external role players, in the development and implementation of the organizations'
strategies (Kotter, 1982). These extensive responsibilities demand extensive information
from both internal and external sources (Daft et al, 1986) for the executive to make the
right decision.
The ever-changing business environment, markets, industry and organizational changes,
affects the information needs of the executive. This requires the continuous updating of the
EIS information base to provide the most current information to the executive at all times.
EIS development is thus an on-going process that requires a sustainable information update
process to maintain its usefulness.
2.2 EIS Development
According to Houdeshel (1990) and Watson et al. (1991), EIS development has two
phases, the initial phase and the on-going phase. The initial phase of the EIS development
provides the comprehensive initial information needs of the executive. This is then
followed by the development and implementation of the system. Users are then introduced
and trained in system usage.
The on-going phase or process involves the identification of additional information needs
and other information sources on a continuous basis to update the EIS information-base.
This phase continues throughout the life of the system. More users, information and
capabilities are added to the system and usage is monitored and measures taken to sustain
usage and adaptation.
It must be noted that EIS is on-going as the system continues to develop over time in
response to market, industry, and organizational changes that affect executives'
information needs (Watson and Frolick, 1993).
14

A number of methods are employed in overcoming the difficult task of initially identifying
and keeping executive information up-to-date. Volonino and Watson (1990-91) and
Watson & Frolick (1992) identify a variety of methods including part-taking in strategic
planning sessions, interviewing executives, tracking executives' activities, interviewing
executives' personal assistants, attending executive meetings, tracking EIS usage via
monitoring agents. A higher level of success is achieved when these methods are combined
(Frolick, 1993).
2.3 EIS Features
Having looked at the main types of IS, attention will now be paid to the features of an EIS.
According to Kimble and Kaniclides (1994), EIS must have or exhibit the following typical
characteristics:
must obviously be a computer-based information system
must be used directly by executives without intermediaries
must provide fast and easy access to information from a variety of sources both
internal and external to the business
- the information must be based on key performance indicators from the business's
strategic critical success factors
must accommodate customisation and be tailored to the needs and preferences of
the individual executive using it
- information must be presented in a way that the executive is able to assimilate and
identify problems and opportunities quickly
the information must be presented in an accessible and readily interpretable format
must use a graphical user interface (GUI).
Other authors (Burkan, 1988; Friend, 1986; Kogan, 1986; Zmud, 1986) suggest the
following additional characteristics;
EISs must:
extract, filter, compress, and track critical data
provide online status access, trend analysis, exception reporting, and "drill-down"
from a summarized report to the details
access and integrate a broad range of internal and external data
- be user-friendly and require minimal training or no training to use.
15

To ensure that these characteristics are incorporated, various frameworks have been
proposed, all in order to ensure that almost all of these features or characteristics are
incorporated. Some of these frameworks, as obtained from the literature will now be
discussed.
2.4 Some Proposed Frameworks
In referencing Sprague (1980), Watson et al, (1991) described a framework as a helpful
instrument in organizing a complex subject, identifying the relationships between the parts,
and revealing the areas in which further developments would be required for improvement.
The following five EIS development frameworks will be considered;
1. ESPRIT Framework
2. Structural Framework
3. Path Framework
4. Structurational Framework
5. PAS Framework
With ESPRITE being the earliest of conceptualized framework, each of the subsequent
frameworks that followed have attempted to identify gaps, weaknesses and strengths of the
earlier ones, to build and propose better frameworks.
2.4.1 ESPRIT Framework
This framework was derived from the installation approach of Metapraxis's EIS package
'Resolve' (Meiklejohn, 1989). It starts with an initial evaluation of the consultancy team,
also termed the development team, to ensure their ability to develop the system
successfully. The main framework then employs a systematic approach by first identifying
the business needs and conducts a feasibility study to identify a suitable prototype or
development package. The system development process or the prototype development
follows the System Development Life Cycle (SDLC, see appendix I for details)
methodology. Once the prototype is completed and tested, management approval is then
obtained for a planned roll-out. Final changes are made to the prototype and final
implementation is done together with user training.
This approach thus features an evolutionary prototyping methodology with considerable
details at each stage. It is focused on technical and developmental issues but with great user
16

involvement and approval. It lacks, however, the incorporation of other organizational
factors and any relationship or linkage to other procedures or operational systems
(Meiklejohn, 1989).
2.4.2 A Structural Framework
Watson, Rainer and Koh (1991) proposed this framework, after conducting a study on EIS
practices in companies in the US in 1988 (Watson, Rainer, Koh, 1991).
This framework consists of three components; the first part deals with the structural
perspective of the development of EIS and details the interaction of the processes. It also
covers the development team and data source issues. Part Two deals with actual
development processes, activities and technical issues including infrastructure of both
hardware and software. The final part addresses issues with user and the EIS interaction.
Criticism of this framework lies in the lack of interaction of the three parts. The framework
does not explore the impact of the structure on the development process and that of user
attitude on the success, or otherwise, of the EIS development.
The researchers at the end of applying this framework acknowledge the issues not covered
by this framework, and pose the following questions as areas for further research:
1. Is the organizational position and level of commitment of executive sponsorship
related to EIS success?
2. What level of staffing and organization structure is best for the EIS builders/support
staff?
3. What are the major problems associated with EIS "spread" and evolution?
2.4.3 A Path Framework
Millet et al., (1991) proposed this framework. This comprises an approach that details the
development of EIS from MIS. It highlights timing and decision-making at various levels
of maturity within the organization. Millet et al., (1991) depict that EIS evolved from MIS
as an answer to executive needs for information in an integrated manner (internal and
external sources) and place emphasis on managing the transition from MIS to EIS. Though
it is also technically inclined and focuses on the development (transition) process, it does,
however, highlight the need to build organizational capabilities which might not
necessarily be technical.
17

It thus makes clear some relationships between EIS and other organizational systems, but
lacks in any analysis of the links to the other factors outside the systems development
processes.
2.4.4 Structurational Theory Framework
Proposed by Orlikowski and Robey (1991), this framework focuses on the social and
organizational processes that go on during the information system development process and
relates it to EIS development processes. It is strong in providing an integrated and coherent
linkage between the various elements of EIS development and other organizational
activities (human action). The difficult part of this approach is the detailed attempt to
model each social process to be specific to each individual situation. However, it makes
clear the need to consider the influence of other organizational and social factors that affect
EIS development. Other researchers who have incorporated the framework in their works
acknowledge its usefulness in drawing attention to these issues. Some issues considered
include organizational norms and values (culture), conventions, authority and resources
(organizational structure and leadership).
2.4.5 PAS Framework
This framework proposed by Kanielides and Kimble (1994), incorporates elements within
the organization that according to the developers have an effect on and describe EISs
development and usage. The framework has three main components, People, Activities and
Systems (PAS).
This framework therefore acknowledges the fact that people and organizational activities,
whether directly connected to EIS development or not, affect EIS development. This is thus
placed within the context of other information development and connected issues that
affect information system development.
It also includes the importance of other organization information systems that may be
linked to the EIS, be it a transition from an old information system to EIS or a completely
independent EIS system.
18

Post-EIS issues are also considered as important, since EIS would be continuously
expanded and enhanced. This is where Millet et al, (1991), did acknowledge that
organizational issues have an effect on EIS development, implementation and usage.
2.4.6 Summary on the frameworks
There are obviously considerable differences between each of the frameworks based on
their perspective of EIS development. Kanielides and Kimble (1994) summarized these
differences in a comparative manner. This is depicted in table 2.1 with the inclusion of the
PAS framework.
The various models have attempted to identify elements of EIS development that need to
be included and managed appropriately, to ensure a successful implementation and usage.
The key difference in the models, as depicted in Table 2.1, has been driven by attempts by
the models to resolve or address elements omitted or excluded by other models. Though the
models are split between formal and semi-formal frameworks, various attempts have been
made to address the implementation approach from different perspectives. PAS has tried to
represent reality whilst ESPRIT has a more practical approach to its perspective.
The models also differed in their purpose and thus the emphasis on different issues. PAS
places emphasis on both internal and external organizational issues affecting of EIS
development, whilst the 'Struturational framework' emphasizes social processes within the
organization and PATH emphasizes the transition in organization systems and thus the
timing of the implementation of EIS system. Though these various emphases might have
been considered in isolation, the strength or weakness of the various models is in their
linkage or lack thereof of the system development to the human and organizational issues.
PAS scores high in its classification of the various elements into EIS development, usage
and highlighting of external and internal development issues. However, it falls short of
identifying critical elements for EIS successful implementation and use. PATH'S strength
is its consideration of timing in the organization's decision maturity in implementing
appropriate systems, whilst the Structurational model is strong by virtue of its coherent
linkage of system development to human action.
19

Table 2.1: Comparison of the frameworks
Nature
Perspective Origin
Purpose
Abstraction Level Emphasis
Scope
Level of Details Strengths
Weaknesses
Source: Kai
ESPRIT Formal Model
Practical - From consultant's point of view
Representing installation of Resolve Software
Low
Series of steps to follow
Development (Low level) High
Sequential approach High level of details
No emphasis on methods of extracting information No links between other systems in organization No timing considerations taken into account
niclides and Kin
Structural Semi-formal Framework Academic -trying to represent reality To serve as a tool for reporting the findings of survey
Medium
Relationship between elements involved in EISs development Development and use High
Completeness of issues covered
Relationship between the relevant parts of the framework is not made clear
lble, (1994) (P,
Path Semi-formal Framework Academic -Less pragmatic approach Highlight new issues about EISs development
Medium
Transition in organizational systems and timing
Development (high level) Low
Timing consideration Decisional maturity of organizations
Not high level of detail Issues discussed at organizational level
\S column inc
Structurational Formal Framework Academic -Purely theoretical perspective Interpret social processes that go on in organizations
High
Social processes that go on during development
Development and use Can be High
Coherent way of linking elements of development to human action
Inherent limitations in approach
luded by researc
PAS Semi-formal Framework Academic -trying to represent reality Highlight the interaction of external factors and EIS development High
Internal and external organizational activities affecting EIS development Development and use Can be High
Classifies elements into EIS development and usage areas Highlights the interaction of external and internal development issues Stops short of identifying the critical element for successful EIS development and use
ier)
20

In summary, none of these frameworks have adequately and comprehensively tackled all
the possible factors or elements that address a successful EIS implementation and usage.
This effectively makes systems' success depend not only on the way the development
process is managed, but also on various factors relating to the use of the system. Therefore,
when developing an EIS, clear knowledge of the mechanism by which these factors
influence success must be comprehensively understood and employed, in order to minimize
risk of failure (Kaniclides and Kimble, 1991). This encompasses all those factors that are
critical to the development, implementation and usage of the EIS system.
2.5 Critical Success Factors for EIS
CSF analysis would help management identify the key factors which the business must
focus attention on in order to achieve or ensure success (Internet 2). It is "the few key areas
of an executive's job where things must go right in order for the organization to flourish"
(McNurlin and Sprague, 2004, p559). In the case of the EIS development framework, CSF
would be derived from the Business Strategy and IS Strategy interaction, and would then
be the factors that EIS would focus on.
The first step in the process clearly states the business mission and goals that need to be
achieved. From this, clear objectives would be derived and factors critical to the
achievement of the objectives defined. The next step, and probably the most important, is
identifying what Information Systems (IS) are required to deliver on these factors. The
combination of these factors and the IS needed to deliver on these then become the CSFs
for the EIS. Resources are then made available and the needed capacity is obtained
(McNurlin and Sprague, 2004).
Key Performance Indicators (KPI) are defined for each CSF. These are measurable
parameters that can be measured as evidence of the performance of the organization in the
areas of the CSF. KPI therefore needs to be constantly monitored and fed back to
executives for critical decisions to be made. This is the key role of EIS and thus all KPI are
incorporated and monitored or measured via the EIS. It must be noted here, that there is
certain to be more than one KPI for each CSF. The EIS is, in fact, designed to provide these
KPI data for monitoring of the entire executive's CSF (Internet 2).
21

"The most comprehensive investigation of success factors for EIS implementation is still
the work by Rockart and Delong in 1988", (Poon and Wagner, 2000). Poon and Wagner
(2000) further cited several other researchers who have subsequently reconfirmed the
factors observed by Rockart and DeLong. There is thus literary support for the employment
of CSF approach to EIS, and a list of CSF to ensure success of its implementation and
usage.
Averweg (2002,) in his research on EIS usage cited DeWitt's (1992) nine CSFs, with a
caution that these selections are not finite as opinions on this differ within the literature.
Averweg (2002) also cited Steer's (1995) top ten CSFs out of twenty-one which Steer
stated as all being important. The concept of CSFs, to date, has not been determined to be a
universal application to different organizations, business environments and cultures (Poon
and Wagner, 2000). Averweg (2002) did conclude that, there is not a consistent "shopping
basket" of CSFs for EIS implementation and no single comprehensive listing of factors has
emerged in the literature (Watson and Rainer, 1995).
However, in recent times, attempts have been made to identify more consistent CSFs and
rank them based on level of priority (Sameron and Herrero, 2004).
In research on EIS success and CSF management, Poon and Wagner (2000) found that all
the organizations in the study that have successfully put EIS in place, correctly managed all
the CSF listed in table 2.2, while all those that failed with their EIS employment did not
manage all of these CSF.
In recent research on CSF for EIS, Sameron and Herrero (2004) identified and classified
EIS CSFs in an organizational context. They established three categories: human resources,
information and technology, and system interaction. The various CSFs within each
category were then investigated. According to Sameron and Herrero, (1994), "the goal is to
obtain the users' perception about the importance of CSF in order to establish a rank among
them". This they concluded to be a valuable effort since IS users and IS experts have
significant different perceptions on IS success (Jiang et al, 2002). The ranked CSFs for
EIS obtained are stipulated in table 2.3.
22
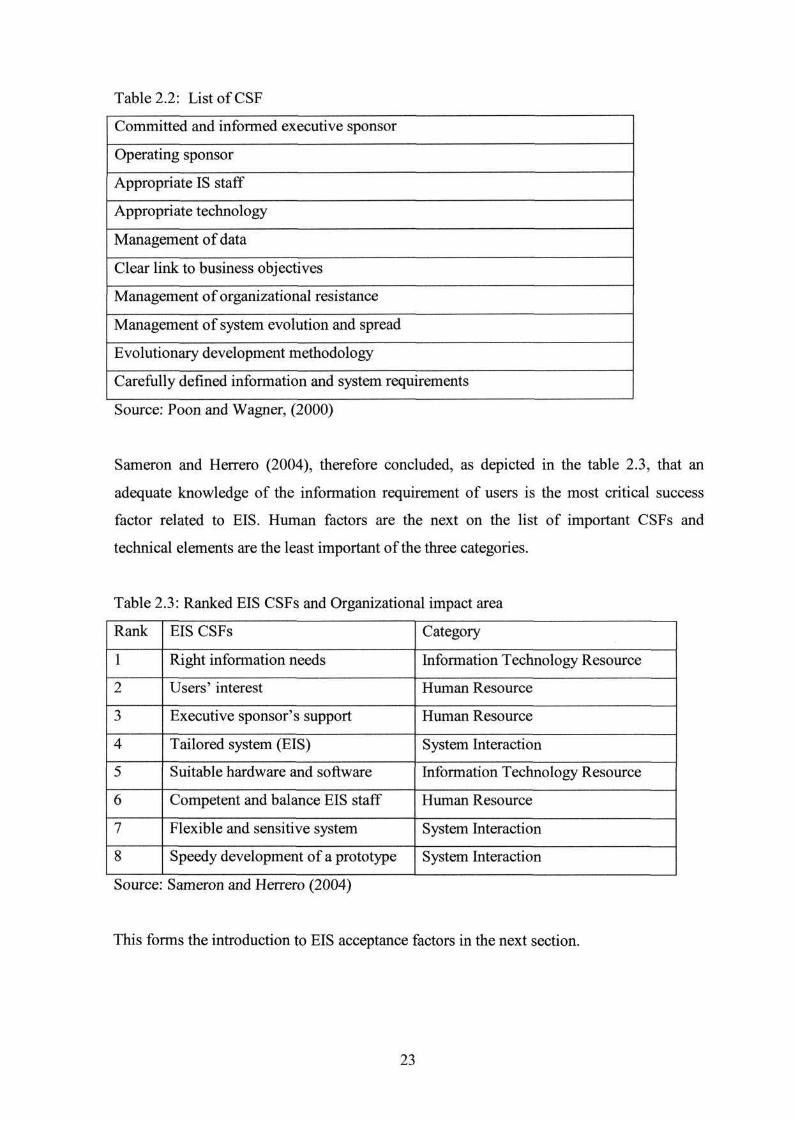
Table 2.2: ListofCSF
Committed and informed executive sponsor
Operating sponsor
Appropriate IS staff
Appropriate technology
Management of data
Clear link to business objectives
Management of organizational resistance
Management of system evolution and spread
Evolutionary development methodology
Carefully defined information and system requirements
Source: Poon and Wagner, (2000)
Sameron and Herrero (2004), therefore concluded, as depicted in the table 2.3, that an
adequate knowledge of the information requirement of users is the most critical success
factor related to EIS. Human factors are the next on the list of important CSFs and
technical elements are the least important of the three categories.
Table 2.3: Ranked EIS CSFs and Organizational impact area
Rank
1
2
3
4
5
6
7
8
EIS CSFs
Right information needs
Users' interest
Executive sponsor's support
Tailored system (EIS)
Suitable hardware and software
Competent and balance EIS staff
Flexible and sensitive system
Speedy development of a prototype
Category
Information Technology Resource
Human Resource
Human Resource
System Interaction
Information Technology Resource
Human Resource
System Interaction
System Interaction
Source: Sameron and Herrero (2004)
This forms the introduction to EIS acceptance factors in the next section.
23

2.6 EIS Acceptance
User acceptance and continuous usage (adoption) are the most important determinants to
assess the success or failure of the system, making the identification and explanation of
user acceptance factors a long-standing research issue (Lucas, 1975, Davis, 1993, Young
and Watson, 1995). Although most executives accept EIS based on their executive role,
and get involved in its development, the actual use of EIS by executives is low (Thodenius,
1996; Fitzgerald, 1998).
Potentially, EIS has been designed and tailored to meet the executives' distinct information
needs, integrating information from both the external environment and all parts of the
organization and presented it in a meaningful way for the comprehension of the executive
(Poon & Wagner, 2001; Salmeron, 2002; Rockart & Treacy, 1980; McBride, 1997).
Nonetheless, usage by executives is low, with figures of 32% for executives, and 68% for
middle management as per a study by Fitzgerald and Murphy (1994), usage by senior
management is also relatively low (Thodenius, 1995, 1996). These low figures were further
confirmed by Fitzgerald (1998).
In order to identify the factors that affect user acceptance of EIS in Unilever, an appropriate
acceptance Technology Adoption model (TAM) needs to be used. In the next section,
various models will be considered.
2.7 Models on Technology Adoption
Models identified among others most widely used to investigate general adoption of
information technology within organizations are as follows: the Theory of Reasoned Action
(TRA), originally proposed by Fishbein and Ajzen (1975), the Technology Acceptance
Model (TAM) developed by Davis (1989) with bases obtained from TRA. Ajzen (1991)
extended the study on TRA and proposed the Theory of Planned Behavior (TPB), and the
Task-Technology Fit (TTF) was later developed by Goodhue and Thompson (1995).
2.7.1 Theory of Reasoned Action (TRA)
TRA derives its bases from human social psychology with determinants of human
conscious intended behavior (Fishbein and Ajzen, 1975). TRA includes four general
concepts - behavioural intention (BI), subjective norm (SN), attitude (AT) and actual use
(AU). According to TRA, a person's behavior is determined by his prior intention to
24

perform that behavior, and a person's BI is influenced by the AT and SN. TRA thus argues
therefore that an actual use of a given technology is driven by the BI and hence by the SN.
However, in deriving the final model of TAM, Davis et al. (1989) omitted SN and thus AT,
due to a weak link between AT and perceived usefulness, but a strong link with BI. Davis
(1986) and Davis et al. (1989) thus highlighted the need for further research in the area of
BI and SN. This led to extension work on TRA by Ajzen (1991) on TPB.
2.7.2 Theory of Planned Behaviour (TPB)
TPB was proposed as an extensional work on TRA, with the inclusion of perceived
behavioural control that accounts for constraint on an individual's behaviour that limits
complete control of the behaviour. This constraint in the form of control thus influences BI
and actual use of a given technology. In the application of TPB in IS research, Taylor and
Todd (1995) viewed control belief structure in three categories, self-efficacy, technology
facilitating, and resource facilitating conditions.
Computer self-efficacy is an individual's belief about his/her ability to perform a specific
task/job using a computer (Compeau & Higgins, 1995a, 1995b). This is the user's
confidence in his/her abilities and knowledge as bases, to judge how difficult or easy is it to
use the System. Thus, without any experience at all with a system, a user's confidence, and
hence computer self-efficacy, becomes a basis for his/her judgment of ease of use of the
system (Venkatesh and Davis, 1996).
Technology facilitating conditions in a workplace would include control of the user in the
use of technology (particularly, new technology). This relates to the availability of help,
user support in response to user need for assistance to overcome barriers and hurdles to
technology use (particularly, new technology) (Bergeron et al., 1990). This creates a
perception in the user (Taylor and Todd, 1995) about the ease of use of the system. Prior
introduction to similar technology would minimize the effect of this factor.
2.7.3 Task-Technology Fit (TTF)
The TTF model was developed to better explain the relationship between technology and
the task that it supports. Goodhue and Thompson (1995) found that for information
technology to be effective on an individual's performance, it must demonstrate a good fit
25

with the task it is used for, and accordingly influences a user's performance. The
hierarchical nature of organizational structure implies that the various levels of
management would have different tasks and hence different technologies to support their
work (Goodhue and Thompson, 1995). Dishaw and Strong (1999) further integrated the
TTF and TAM, demonstrating how technology employed in support of a task relates to its
usefulness, and how easily it is used in support of the task (Dishaw and Strong, 1999). In a
further use of TTF, Igbaria et al. (1997) concluded that user training and support have a
significant effect on the ease of use and usefulness of the technology being used.
2.7.4 Technology Acceptance Model (TAM)
TAM was developed by Davis et al., (1989) to explain human computer-usage behaviour
and the determinants of computer acceptance that are general and applicable across a broad
range of user population and computing technologies.
Venkatesh (2000) in a justification of usage of TAM in his research, stated that TAM has
received extensive empirical support through validation, application and replications by
researchers and practitioners, suggesting that TAM is robust across time, settings,
populations and technologies. TAM is thus the most widely applied model of user
acceptance and usage of information technology (Venkatesh, 2000).
TAM is formulated on two main domains or beliefs, Perceived Usefulness (PU) and
Perceived Ease of Use (PEU).
PU is defined as the extent to which a person believes that using the technology will
enhance his/her productivity. EIS users would therefore perceive EIS as useful, depending
on the extent to which it contributes to the enhancement of their performance. A System
that does not help the user perform his/her work better as he/she expects, would not be used
(Robey, 1979). Perceived Usefulness has a positive impact on the adoption of IS, Straub et
al. (1997).
PEU is defined as the extent to which a person believes that using a technology will be free
of effort. Ease of use relates to the effort required by the user (executive) to take advantage
of the application (EIS).
26

TAM postulates that a user's actual use of a system is dependent on his Behavioural
Intention (BI) to use the system. TAM explains BI to have a strong link with PU and posits
that PU will be influenced by PEU. However, in cases where the user is actually using the
system, BI becomes null, creating a direct link between attitude towards using the system
and actual usage of a system (Davis, 1993; Thompson et al, 1991). Based on this, user
acceptance and adoption of a system is directly as a result of PEU and PU.
According to TAM, to measure PU and PEU, one must identify the factors that determine
or influence the users' PU and PEU. Agarwal and Prasad (1998) in support of this, posit
that these factors can only be external, as the TAM is based on internal psychological
behavior. Davis (1989) incorporated the following factors in his research instrument which
he later validated and found reliable:
PEU - Easy to Learn, Clear and Understandable, Easy to Become Skillful, Controllable,
Flexible;
PU - Usefulness, Work more Quickly, Job Performance, Increase Productivity,
Effectiveness, Makes Job Easier
2.8 Other Extensions on TAM
TAM is based on an expectancy model which is consistent with social cognitive theory
(Bandura, 1986) that dictates that, process expectancy (PEU) and an outcome expectancy
(PU) are key to the final predictions (BI). It is thus an implicit assumption that
incorporating additional determinates into PEU and PU (the process expectance and
outcome expectancy) would influence BI (the final prediction), which in this case is actual
usage outcome (Venkatesh, 2000).
To identify more extension factors, especially in the case of a new system, Venkatesh and
Davis (1996) stated that there is a set of system specific "common" determinants that
would affect a user's PEU. Due to lack of prior direct hands-on experience with the new
system, these determinants are dependent on the users' prior experience with other
computer-based systems within the given organization (Venkatesh, 2000).
Other research undertaken based on the TAM to identify more underlining or influencing
factors on user behavior will now be discussed.
27

2.8.1 Venkatesh Model
In a research on determinants of PEU, Venkatesh (2000) included computer playfulness
and user anxiety as significant determinant factors on PEU.
Computer Playfulness refers to the drive factor that motivates the user to use the system to
achieve specific goals, and at the same time be curious and challenged to explore and
discover more about the system (Malone 1981a, 1981b). It is also the user's degree of
spontaneous interaction with the computer (Webster and Martocchio, 1992). This has
successfully been applied and operationalized in prior research by Webster & Martocchio
(1992).
Computer Anxiety is defined as an individual's apprehension, or even fear, when faced
with the possibility of using computers (Simonson et al, 1987). This implies a negative
affective reaction and adverse effect by the user towards computer use.
2.8.2 Delone and McLean Model
This model synthesized a six-factor taxonomy of IS success classified as system quality,
information quality, IS use, user satisfaction, individual impact and organizational impact
(Delone and McLean, 1992). These elements have been tested in other research, for
example, Hunton and Flowers (1997) and, Seddon and Kiew (1994), as documented by Rai
et al., (2002). These researchers found support for the relationships of the DeLone and
McLean model.
The model depicts system quality and information quality as affecting IS use and User
satisfaction, which in turn, are direct antecedents of individual impact. The model further
posits IS use as a behaviour which is dependent on the IS and thus user satisfaction as well.
This is thus in line with TAM and TPB, suggesting that attitude does impact behavior, Rai
et al. (2002).
This model therefore includes a path between IS use and perceived usefulness.
28

2.8.3 Seddon Model
The Seddon model builds on the Delone and McLean (1992) Model by redefining the
classifications of the elements of the latter. It includes society impact and measures of
benefit of IS use. Seddon (1997) argues that IS use precedes IS impact and benefit and not
the other way round, suggesting that IS use is a behaviour that reflects an expectation of
nett benefit from the use of the IS. This alternate definition of IS use suggests that it is a
consequence of IS success.
Seddon (1997) posits a causal connection between nett benefit of IS use to individuals,
organizations and society, measured by perceived usefulness and user satisfaction, and
system quality and information quality (Rai et al, 2002). In turn, User satisfaction is linked
indirectly to a behavioural measure of IS use. This indirect link employs other theories of
Partial Behavior (not explained in this study) and Expectations of nett benefits from future
IS use.
2.8.4 Summary of Models
Based on all the described models above, this summary highlights the variables and the
relationship with the two main beliefs of TAM, Perceived Ease of Use and Perceived
Usefulness.
Davis' (1989) Technology Acceptance Model (TAM) is based on an adaptation of TRA,
and TRB, two of the most popular models used to explain IS behavior (Taylor and Todd,
1995). These models have been rigorously tested in a variety of contexts (Rai et al, 2002)
and form the bases of other models, which are extensions of the two.
TAM suggests that two key beliefs, Perceived Usefulness and Perceived Ease of Use, shape
users' behavioural intention, which in turn impact IS Use. Perceived Ease of Use has a
direct impact on Perceived Usefulness. IS Use is directly impacted by behavioural
intentions. Behavioural intention is a weighted function of attitude towards usage and
Perceived Usefulness. Perceived Usefulness and Perceived Ease of Use determine attitudes
toward usage. According to Davis (1989), all other facts are expected to impact intentions
and usage through ease of use and usefulness (Rai et al, 2002). Thus TAM consists of
three classes of variables: beliefs about the system, attitudes about using the system, and
usage behaviour.
29

TPB suggests that behavioural intention is formed by one's attitude towards the actual
performance of a behaviour. Attitudes, in turn, are formed by the aggregation of core
beliefs about performing a behaviour and the desirability of that behaviour. In addition,
TPB considers subjective norms and perceived behavioural control as impacting on
behavioural intention, and perceived behavioural control and behavioural intention as
impacting on usage behavior. As with TAM, TPB consists of three classes of variables,
namely beliefs about the system and environment, attitudes about using the system, and
usage behaviours (Rai et al. 2002).
Goodhue and Thompson (1995) TTF model argues that the technology employed in
support of a task must fit the purpose. User acceptance is dependent on the usefulness of
the technology in supporting the task. The users' judgment as to whether using the
technology would get the work done, impacts on the attitude (Igbaria et al., 1997). The ease
of use is then determined by external factors such at training and design, among other
factors.
The extension of TAM by Venkatesh (2000) included computer playfulness and computer
anxiety as influences on one's belief and thus attitude towards technology. Computer
playfulness is the motivation to use a technology with the belief that it would support the
work and other expectations (Malone 1981a, 1981b.; Webster & Martocchio, 1992).
Computer anxiety on the other hand limits the motivation to use the technology. Both of
these factors affect the user's perception and attitude towards the technology (Venkatesh,
2000).
The DeLone and McLean model consists of six classifications of variables: Information
Quality, System Quality, IS Use, User Satisfaction, Individual Impacts, and Organizational
Impacts. Seddon's model considers three classifications of the variables: measures of
information and system quality, general measures of nett benefits of IS use, and behaviour
with respect to IS use. Measures of information and system quality represent beliefs,
general measures of nett benefits of IS use represents attitudes, and behaviour with respect
to IS use focuses on behavioural measures (Rai et al. 2002).
30

These summaries have helped highlight all the factors presented by all the models and
classifications into areas of belief, attitudes and behaviour to develop relationships.
The proposed model for this study is formulated to include factors classified under these
areas as an extension of TAM.
2.9 Proposed Model
The proposed model, figure 2.2, is based on TAM, figure 2.1, but extended to include other
factors from the summary of all the models as discussed above.
Figure 2.1: Technology Acceptance Model (TAM)
External Variables
^ 4
Perceived Usefulness
i i
Perceived Ease of Use
> Attitude ^
W Behavioural
Intention w w
Actual System Use
(Source: Davis et al., 1989)
The main concept of TAM has been maintained and other factors incorporated from the
other extensions of the TAM by the other researchers.
The factors of the TAM (Davis, 1989) relating to perceived usefulness and perceived ease
of use have been maintained as follows; PEU - Easy to Learn, Clear and Understandable,
Easy to Become Skillful, and Controllable.
PU - Usefulness, Work more Quickly, Job Performance, Increase Productivity,
Effectiveness, Makes Job Easier
31

Figure 2.2: Proposed Research Mode, based on TAM User satisfaction System Utilization Information quality Benefit from system Useful Work more quickly Improve job performance Increase productivity Make job easier Improve effectiveness
Computer Anxiety Motivation to use Technology Perception Self-efficacy Easy to learn Clear and understandable Controllable
Perceived Usefulness
Perceived Ease of Use
Attitude toward use
Actual System Use
The other incorporated influencing factors are as follows;
Perceived Usefulness - factors influencing this incorporated from the literature include,
user satisfaction (DeLone and McLean, 1992; Seddon, 1997), information quality (DeLone
and McLean, 1992), and benefit from system (Seddon, 1997).
Perceived Ease of Use - influencing factors included here are; computer anxiety
(Venkatesh, 2000), motivation to use (Venkatesh, 2000), technology perception (Goodhue
and Thompson, 1995; Venkatesh, 2000), and Self-efficacy (Venkatesh, 2000).
Technology perception is directly influenced by Training and Support (Goodhue and
Thompson, 1995; Venkatesh, 2000), which have an effect on the belief variable, perceived
ease of use of TAM (Igbaria, 1990, 1993).
Davis (1989) dropped flexibility as an influencing factor, arguing that flexibility gives the
user a greater number of decisions to make in the usage of the system and thus reduces ease
of use. The flexibility item was also omitted by Adams et al. (1992) in the employment of
Davis' (1989) instrument, and based on the same argument.
32

The other item omitted is that on "Skillfulness", which was argued by Moore (1989) in his
study to have a low correlation to the rest of the items' measurements.
Davis (1993) and Thompson et al. (1991) drop behavioural intention, linking attitude
directly to actual use. This was based on the argument that intention is future oriented, thus
in cases of actual use being experienced, intention is history, since the behaviour is already
taking place. Behaviour intention is therefore excluded from this construct.
According to the TAM construct (Davis et al, 1989), attitude towards using a system is
jointly determined by ease of use and usefulness; attitude then directly influences the
intended behaviour of use of a system. This was however found to be irrelevant in cases
where actual use is experienced and measurable (sic).
This proposed model thus maintains the TAM concept, maintaining PEU and PU as
dependent variables of attitude, while PEU and PU are independent variables of all the
incorporated external factors (Davis et al., 1989, Davies, 1986). Attitude would in turn,
with BI dropped, be the dependent variable of actual usage of the EIS system. Accordingly,
this proposed model's variables are expected to have a significant influence in explaining a
user's attitude towards and actual usage of EIS in Unilever.
2.10 Conclusion
The chapter has reviewed IS types and usage within the organization, in an attempt to make
relevant information available, to facilitate the making of effective decisions. Various IS
have been discussed, together with their relevance and success levels in meeting the
information needs of the decision-maker in the organization.
EIS was introduced as an executive IS to serve the executive directly with his/her needed
information to make effective decisions. The various frameworks employed to ensure
success of EIS deployment were then discussed.
EIS expected characteristics, features and CSF proposed by various researchers were
reviewed. The issue of EIS successes and failures was noted, and various models to explain
or explore user acceptability of such technologies like EIS were also reviewed and
discussed.
33

The chapter then concluded with a proposed model, an extension of the TAM to be used in
this research to identify factors that are likely to affect the users' acceptability, usability
and adoptability of the Unilever EIS system.
The next chapter will cover how the proposed model will be used to achieve the objectives
of this study. This will include the research methodology, design, and the justification of
the study instrument.
34

Chapter 3. RESEARCH METHODOLOGY
3.0 Introduction
The purpose of the chapter is to discuss the research methodology, design, and the
justification of the study instrument as well as the data collection methods, how responses
would be analyzed and how results would be obtained.
The research instrument has been constructed based on the proposed model, an extension
of TAM, in order to obtain the right information needed for the analysis and attainment of
the set research objectives. The content of the instrument is also an adaptation from other
similar instruments used, based on TAM and extensions of it. These will be discussed later
in this chapter.
3.1 Research Philosophy
Saunders et al. (2003), define research as "something that people undertake in order to find
out things in a systematic way, thereby increasing knowledge". Research, according to
Ghauri and Gronhaug (2002), is therefore based on logical relationships and not just
beliefs. Saunders et al. (2003), believe that the researcher's view on the development of
knowledge would, "albeit wittingly", affect the way he/she would conduct the research.
Saunders et al. (2003) discussed three different philosophical views on this.
3.1.1 Positivism
Positivism is based on the philosophy of natural science where there are laws of nature
based on predictable cause and effect. There is a highly structured methodology to facilitate
replication and quantifiable observations that lead to statistical analysis.
3.1.2 Realism
Realism is based on the belief that a reality exists that is independent of human thoughts
and beliefs (Saunders et al., 2003, p84). This further posits the existence of an unknown
stimulus in a given environment that affects behaviour and interpretation of issues without
a conscious note of the stimuli.
35

3.1.3 Interpretivism
Interpretivism posits that there is rich insight into subjectivity that is necessary to explore
to understand people's reactions and their influencing factors. Interpretivism argues that,
due to the dynamic changes in the business environment, business and management must
understand these environmental changes in order to act appropriately.
For the purposes of the research, the Interpretivism philosophy seems appropriate, as the
causes and effects of the factors influencing EIS usage and adoption may not be the same
nor predictable outside the context of this research. The research findings are hence within
the context and should not be generalized (Saunders et al. 2003).
3.2 Research Purpose
The purpose of a research, according to Saunders et al. (2003), may be to explore, describe
or explain a given phenomenon or whatever is being investigated. These are classified as
Exploratory, Descriptive and Explanatory studies.
3.2.1 Exploratory
Exploratory research seeks to find out what is happening and to seek new insights. It would
ask questions, assess phenomena in a new light and is useful in clarifying understanding of
a research problem. This can be achieved either through a review of the literature, seeking
expert opinion, or conducting focus group interviews.
3.2.2 Descriptive
The objective of Descriptive study is to portray an accurate profile of persons, events or
situations (Robson, 2002), depicted in Saunders et al. (2003). It demands that the
researcher have a clear picture of the phenomena to research prior to data collection.
Results are descriptive and often not detailed enough and not conclusive. Descriptive study
is thus the means to an end and not the end itself, further research would be needed.
3.2.3 Explanatory
Explanatory studies help establish causal relationships between variables. The emphasis is
on studying the given problem or situation being researched to explain the relationship
between variables. Once such a relationship is established, further analyses, statistical
analysis, need to be conducted to obtain a clearer view of the relationship.
36

This research is a combination of explanatory and descriptive as it seeks to identify the
factors that affect the usage, acceptance and adoption of EIS in Unilever South Africa. The
relationship between these factors and the significant impact on these three user behaviours
would be discussed. According to Saunders et al. (2003), it is possible for research to have
a combination of purposes.
3.3 Research Approach
Saunders et al. (2003) advise that a researcher must understand the theory and have a clear
thought about the objectives in order to choose the right approach. Saunders et al. (2003)
then describes these as inductive and deductive approaches.
3.3.1 Inductive and Deductive approach
Inductive approach is pursued in cases where data is first collected and some theory is then
developed as a result of analyses of the data. Deductive approach on the other hand,
develops the theory, constructs a hypothesis and then designs a research strategy to test the
hypothesis. It is however possible to have both approaches, but with one feeding the other.
An inductive approach would help in a first-time research area to develop some theory,
which can be tested further via a deductive approach. Saunders et al. (2003) referred to this
as 'multi-methods'.
This research approach is deductive with a proposed model arrived at after a background
literature review on EIS usage. The proposed model would be adapted from TAM and
other extensions of it in analyzing EIS acceptance and adoption based on user attitudes (see
section 2.9). Three hypotheses would be constructed (see section 4.1.2), tested, and
conclusions drawn from the results.
In both Inductive and Deductive approaches, before commencing data collection, the
researcher must have a clear perception of what type of data is needed. Two types of data
exist in research, qualitative and quantitative, "however the choice of data collection will
depend upon an overall judgment on which type of data is needed for a particular research
problem" (Ghauri and Gronhaug, 2002, p85). The data type and collection decision for this
research is covered under research methods (see section 3.4).
37

3.4 Research Methods
According to (Ghauri and Gronhaug, 2002), research method refers to the systematic,
focused and orderly collection of data for the purpose of obtaining information from this, to
solve or answer the research questions or problems. The two types of research methods are
Qualitative and Quantitative methods.
3.4.1 Qualitative and Quantitative methods
The difference between these two is more about the procedure, reflecting differences in
perspective on knowledge and the research objectives, rather than just quantification or
otherwise (Ghauri and Gronhaug, 2002).
Qualitative methods are flexible and unstructured, making them suitable in cases where the
objective of the study demands in-depth insight into a phenomenon.
Quantitative methods rather focus on facts and are subjected to controlled measurements of
data. Results are dependent on statistical tools and the emphasis is on testing or verifying a
phenomenon.
The techniques (Ghauri and Gronhaug, 2000) or strategy (Saunders et al, 2003) for
collecting data, be it qualitative or quantitative, may vary as they involve the step-by-step
procedure that is followed to gather and analyze the data for answers to the research
problem.
The researcher will for the purpose of this research, combine both methods, using a multi-
method approach (Saunders et al., 2003). The researcher will then employ both statistical
and non-statistical methods to analyse the results. This approach is referred to as
Triangulation (Internet 4).
3.4.2 Triangulation
Triangulation is the application and combination of several research methodologies in the
study of the same phenomenon (Internet 4). In methodological triangulation, the researcher
uses more than one method consisting of either within-method or between-method
strategies.
38

In this research, the researcher has employed methodological triangulation by using a
combination of a case study (see section 3.5.3) and quantitative statistical methods (see
section 3.4.1) to arrive at a conclusion on the research. In the case study approach, which is
a qualitative approach, the researcher conducted interviews for the user-group of interest
using a semi-structured interview format. This, according to Saunders et al. (2003) also
facilitates flexibility in obtaining more information from respondents.
Questionnaires were also given to users with questions and response measurements based
on the Likert-scale. This will be quantified to enable a statistical analysis to be conducted.
This is a multi-method approach and is supported by Saunders et al. (2003), and used by
other researchers in similar works (Davis et al, 1989; Ventash, 2000; Seddon, 1997;
DeLone and McLean, 1992; Al-Gahtani and King, 1999; Yang, 2003; Yang and Chang,
2004; etc.).
3.5 Research Techniques
Different research techniques or strategies have been suggested across research literature.
Among these, six have been prominent and are discussed by Saunders et al. (2003) as
follows; experiment, survey, case study, grounded theory, ethnography, and action
research.
Among these techniques, the researcher will employ the following; Survey, Case Study and
Action Research.
3.5.1 Survey
Survey allows the collection of large amounts of data from a sizable population in a cost-
effective way. Data may be obtained via questionnaires, structured interviews, and
structured observation, but in all cases the questions are standardized, making comparison
easy. The researcher has better control over the research process.
39

3.5.2 Case Study
Case study is used in cases where answers to 'why' things are happening or 'what' causes
them to happen are required. As stated in Saunders et al. (2003, p93), Robson (2002, pi78)
defines case study as "a strategy for doing research which involves an empirical
investigation of a particular contemporary phenomenon within its real life context using
multiple sources of evidence".
3.5.3 Action Research
Action research is described by Coghlan and Brannick (2001) and referenced by Saunders
et al. (2003, pp. 94) as, "the purpose of (action) research and discourse is not just to
describe, understand and explain the world but also to change it". The research strategy
starts with recognition for change and setting the criteria for intervention. The research
commences to find facts and analyses to attain intervention and action. From this point,
implementation is undertaken by the organization, monitored and evaluated over time. On a
continuous basis, if change is needed, the research process is repeated.
In this research, a case study based on Unilever South Africa is to identify factors that
affect or would affect the usage, acceptance and adoption of the company's EIS. To
achieve this, a survey was conducted in the company covering the system (EIS) users.
Other researchers like Al-Gahtani and King (1999), Yang (2003), and, Hung and Yang
(2004), also used surveys in similar research.
3.6 Time frames of Research
Time is a constraint, and researchers would have to consider this as they pursue the data
collection technique. This can be undertaken over a long period of time (longitudinal), or in
a short and brief time frame (cross-sectional).
3.6.1 Cross-sectional
Cross-sectional study occurs over a brief period and under circumstances where an incident
based on a phenomenon may be investigated in a research. It may also be to compare
factors in different organizations or settings.
This research is conducted in a cross-sectional time frame, conducted over a short time
period, in fact a snap-shot of users' perceptions of EIS usage as at time of data collection.
40

3.6.2 Longitudinal
Longitudinal studies seek to research changes that may have occurred over a given time,
but are still applicable within a short time frame if past data is used.
3.7 Sampling Technique
In order to find answers to research question(s), the researcher would like to collect and
analyse from every possible case or member of the target group or population (Saunders et
al., 2003, pi50). However, some constraints like time (section 3.6), budget or cost,
population size and the impossibilities in accessing all cases would prevent the researcher
from accessing the entire population.
Sampling is a technique of selecting a sub-group from the population, such that the sub
group, called a 'Sample', is representative of the population. Research results obtained
from the sample can then be applied to the population as a whole.
Saunders et al. (2003) identified two main sampling techniques; probability sampling and
non-probability sampling. Subsequently, various sub-techniques are classified under these
two main techniques.
Purposive sampling, a non-probability technique, will be used in selecting the group of
employees to be interviewed. According to Saunders et al. (2003) and Neuman (2000), this
sampling technique enables the researcher to use his judgment to select cases that will best
enable him to answer the research questions and meet the objectives. These sample cases
are those that are particularly informative and provide in-depth study results.
EIS users, defined by the Unilever as 'senior decision-makers' is made up of a total of
twenty (20) members, both executive and non-executive directors. This will be the target
group for the study which thus limits the sample size to twenty (20).
Though IS is widely used in the company, EIS is used only by decision-makers and thus it
makes sense to concentrate on this group to obtain the needed insight.
41

3.8 Data Source
There are two main sources of data, Primary and Secondary. While primary data is
collected during the research and for the particular research only, secondary data on the
other hand, is data collected for the purpose of other research different from the current
research it's being used for (Ghauri and Gronhaug, 2002; Saunders et ah, 2003). In a
research, both secondary and primary data could be used but with some caution.
For this research, primary data will be obtained via interviews and questionnaires
administered to the twenty (20) 'senior decision-makers', whilst secondary data will be
from financial reports, IS and EIS investments, in support of Unilever's strategic
employment of IS in the business and thus the current employment of EIS.
3.9 Data Collection
According to Saunders et al. (2003), interviews are appropriate when collecting sensitive
and confidential information required and to ensure that the right people are indeed the
ones who respond to the questions. This gives a high level of guarantee to the respondents
and hence readiness to give responses. This would also ensure that all questions are
answered and reasons obtained for non-response questions.
Two instruments will be used, the first instrument is an adaptation from Venkatesh (2000)
and consists mainly of open questions (section 3.10.1), and the second instrument is a
combination of questions extracted from similar research instrument.
Executives would be thus interviewed using the first instrument, a semi-structured
interview technique (see section 3.4.1) to obtain all relevant information and responses
needed by the research purpose and to achieve the objectives.
The second instrument would be administrated to non-executive decision-makers to obtain
data on perceived usefulness and ease of use, attitude and future usage (section 3.12).
42

3.9.1 Interview Technique
Semi-structured interviews would be used to obtain data. Semi-structured, in-depth or non-
standardized interviews are used in qualitative research in order to conduct discussions not
only to reveal and understand the "what "and the "how", but also to place more emphasis
on exploring the "why" (Saunders, 2003).
According to Robson (2002) and referenced in Saunders et al. (2003), in-depth or semi-
structured interviews can be used and can be very helpful to "find out what is happening
[and] to seek new insight".
Healey and Rawlinson (1994), referenced in Saunders et al. (2003), state that a
combination of styles may be used within one interview: "one section of an interview may
ask a common set of factual questions ... while in another section a semi-structured
qualitative approach may be used to explore [response]".
The use of the semi-structured interview technique in this research is to enable the
researcher to explore or 'probe' answers in order to obtain further explanations or build on
responses. This would ensure that answers are obtained that would sufficiently answer the
research questions and achieve the set objectives. The technique enhances flexibility in the
order of questioning, and enables the researcher to ask more questions that were not
formally intended. Given the organizational context, the researcher is thus able to obtain
more information.
3.10 Questionnaire Design
Bourque and Clark (1994), proposed that in questionnaire designing, researchers may opt
for one of three approaches:
adopt questions or questionnaires used in other similar research
- adapt questions used in other questionnaires
develop their own questionnaire
Adopting or adapting questions may be necessary if the researcher wishes to replicate, or to
compare findings with another study (Saunders et al, 2003). This according to Saunders et
al. (2003, pp. 291), "allows reliability to be achieved" and is more efficient then
developing one's own questions that would meet the set research objective.
43

The research questionnaire or instrument used is an adoption and adaptation from previous
similar research works (Davis, 1989; DeLone and McLean, 1992; Seddon, 1997;
Venkatesh, 2000; Yang, 2003). This is fully covered in section 3.12.
3.11 Validity and Reliability
Reliability is defined as the degree to which data collection method(s) employed yields
consistent findings, similar observations made or conclusions reached by other researchers
using the same method(s).
Validity complements reliability and is defined as the extent to which the method(s)
accurately measure what it is intended to measure (Saunders, 2003, p492).
Foddy (1994) explained this in a very simple way as referenced by Saunders et al. (2003).
According to Foddy (1994), for a question or questionnaire to be valid and reliable, it must
have successfully passed four stages:
• that the researcher has a clear idea about the information he/she requires and
designs the questions that would collect such information
• that the respondent understood the question, decoding it in the way the researcher
intended
• that the respondent then did answer the question
• that the researcher receives the answer or responds and decodes it in the way the
respondent intended.
To validate and confirm the reliability of the use of the various items incorporated in his
instrument, Davis (1989) used Cronbach's alpha, a measure of reliability, and Guttman's
lower bound to measure the lower estimate for the true reliability of this approach. He then
used discriminate validity and factor analysis to assess validity.
These results confirm the validity and reliability of the instrument. This research would
accept that as a confirmation of Validity and Reliability of the portion of the instrument.
However the actual overall validity and reliability of the instrument will be justified and
tested. Results must be significant and comparable to other research results (Davies, 1989;
Venkatesh, 2002)
44

The management of Unilever South Africa conducted pre-testing of the instrument and
further validation and reliability was affirmed. Feedback from this led to some rewording
for clarification and final acceptance of the instrument by management. A research
consultant also assisted in this process.
3.12 The Research Instrument
The research instrument construction was adopted from relevant previous studies and
adapted to this particular research with validation and wording changes as necessary.
The wording changes include replacing IT/MIS/SIS with EIS.
Two different instruments were used. The first instrument was adapted from Poon and
Wagner (2001) to obtain background information on the EIS development and
implementation issues. Poon and Wagner (2001) used this instrument to assess CSF that
significantly influences EIS implementation success. Poon and Wagner (2001) concluded
that successful EIS implementation got all critical success factors (CSF) right, whilst those
that failed with the EIS implementation got all the CSFs wrong.
This instrument was used to gather information on Unilever South Africa's EIS, from idea
conceptualization to actualization and implementation. This was administrated to the MIS
management and Executives in semi-structured interview (see section 3.9.1) sessions.
The second instrument, sent to all EIS users was to obtain information on PU, PEU, and
attitude and intended future usage of EIS within the company. This instrument had two
sections. The first section has two questions that collected data on the respondent's position
in the business and his/her functional area or department. Since EIS has been originally
designed for Executives (Watson, Rai and Koh, 1991) this section enabled assessment of
the proliferation of EIS within top management and within the entire organization. A
similar approach was used by Watson, Rai and Koh (1991).
45

1
2
3
4
5
6
7
8
9
10
11
12
13
14
15
16
17
18
19
20
21
22
23
24
Question
PU
Using EIS enables me to accomplish tasks more quickly in my job Using EIS improves my performance in my job
Using EIS in my job increases my productivity
Using EIS enhances my effectiveness in my job
Using the EIS makes it easier for me to do my job
I find EIS to be useful in my job
I do obtain timely information from EIS
EIS provides me with accurate information
I am satisfied with EIS
I am dependent on EIS
EIS provides me with the relevant information I need PEU
Learning to operate EIS is easy for me
I find it easy to get EIS to do what I want to do
Interacting with EIS is clear and understandable
I find EIS easy to use
Personally, I would use a computer (applications, software, etc.) to do my work I get enough user support when using EIS
I need more training on EIS to use it more effectively Working with a computer makes me nervous
I feel comfortable working with a computer
I do need support to use computers (applications, software, etc.) I currently use EIS in my job
I will continue to use EIS in the future
Ultimately, I think the use of EIS is a good idea
Source
Davis (1989)
Davis (1989)
Davis (1989)
Davis (1989)
Davis (1989)
Davis (1989)
Watson &Rainer (1995)
Watson &Rainer (1995)
Srivihok(1999)
Rai, Lang & Welker (2002) (replace SIS with EIS) Watson &Rainer (1995)
Davis (1989)
Davis (1989)
Davis (1989)
Davis (1989)
Venkatesh (2000)
Venkatesh (2000) Srivihok(1999) Venkatesh (2000) Srivihok(1999) Venkatesh (2000)
Venkatesh (2000)
Venkatesh (2000)
Averweg (2002)
Averweg (2002)
Hung & Chang (2005)
Table 3.1: Sources of adapted questions
46

The second section of the instrument is as in table(C). Specifically, measures of PU and
PEU [1-6, 12-15] were adapted from Davies (1989), measures of timeliness, accuracy and
relevance of information [7,8,11] were adapted from Watson and Rainer (1995), measures
of satisfaction, support and training [9, 17, 18] adapted from Srivihok (1999) and, measures
of motivation, self-efficacy and anxiety [16-21] adapted from Venkatesh (2000). Item [10]
was adapted from Rai, Lang & Welker (2002) replacing SIS with EIS. Two measures were
adapted from Averweg (2002) to measure current use and future intended use [22, 23] and
the last measure [24] was of attitude and adapted from Hung and Chang (2005). Table 3.1
gives the summary of the entire adapted questions and their sources as discussed.
All the items were measured on a seven-point Likert-type scale with anchors ranging from
"strongly agree" to "strongly disagree". Venkatesh (2000) concluded with strong support
for the anchors and determinants adjustments made.
This approach of collating questions from other similar research instruments has been
adapted by other researchers, for example Davies (1989), Venkatesh and Davies (1996)
and, Venkatesh and Morris (2000).
3.12.1 Goodness of Fit
The model fits the data if computed measure(s) of fit index are within acceptable value
range. Goodness of fit indicators include, goodness of fit index (GFI), adjusted goodness of
fit (AGFI) and root mean square residual (RMSR).
GFI and AGFI acceptable values range between zero(0) and one(l), with one being the best
fit value whilst with RMSR values close to zero is the most acceptable.
According to Al-Gahtani Said and Malcolm King (1999), both Joreskog and Sorborn
(1986) and Hayduk (1987) recommended that, the goodness of fit indicator can be
calculated as the Chi-square divided by the degree of freedom. Values between zero(0) and
five(5) are considered as adequate measure of a good fit (Bollen and Long 1993).
Based on this recommendation, a value of 2.23 was obtained for the research model as the
goodness of fit (appendix H). This is within the acceptable range and hence the model fits
the data.
47

Coefficients between the factors and the dependent variables (PEU, PU) will be tested and
must be significantly different from zero. T-values to the extremes of the range +2 and -2
are considered to be significantly different from zero (Joreskog and Sorborn, 1986) whilst
factors with values close to zero would be expected to have low factor loading, and as a
result are dropped as they do not significantly influence PU or PEU. After this, the
indicators are measured again to ascertain that the final factors do indeed have high factor
loading.
3.12.2 Data Analysis
To find out if there is indeed any significant relationship or difference between any of the
factors PU and PEU, a statistical significance testing will be carried out. According to
Saunders et al. (2003), a correlation coefficient is used to establish the strength of a
relationship between two ranks or quantifiable variables (PU and PEU). In using the Likert-
scale, responses to each question would be quantified and totals obtained for the PU and
PEU (group of) factors. The Cronbach coefficient of reliability would be computed for PU
and PEU and the Spearman's rank correlation coefficient used as a measure of correlation
between the two groups of ranked factors (PU and PEU).
To investigate the relationship between PU, PEU and AT, as determinants of adopting of
EIS, regression analysis will be conducted. Multiple regression analysis, to determine and
compare the consistency of the relationship between PU, PEU and AT (all three) as against
any two (PU-PEU, PEU-AT, AT-PU) will be conducted. The significance of these will
give indication of the goodness of the relationship or otherwise. This will lead to
identifying factors that affect user acceptance, adaptation, adoption and continuous usage
of the EIS system. Recommendation will then be based on these factors in order to address
the negative impact that might be encountered.
48

3.13 Summary
This chapter has described the nature and methodology of this study. In summary, the
research is explanatory, descriptive, cross-sectional and based on a case study of EIS usage
in Unilever South Africa. A deductive approach and a survey technique were used to obtain
both quantitative and qualitative data, and analyses.
To obtain data, questionnaires were administrated and semi-structured interviews
conducted with the research instrument (questionnaires) adopted and adapted from other
similar research instruments. Appropriate analyses to be conducted have been identified
and the detailed analysis will be covered in chapter 5.
49

Chapter 4. COMPANY BACKGROUND
4.0 Introduction
This chapter gives a brief background of the company understudy. The company used is
Unilever South Africa, a subsidiary of Unilever Global. The chapter will discuss the
Unilever entity, its parent and shareholdings and its business performance. The vision and
strategy of the business, objectives and set targets will also be discussed.
The latter part of the chapter will cover the IS strategy and systems employed by the
company. Finally the EIS, the company's recent IS will be discussed reviewing its
conception to implementation and lessons learnt from the entire project.
4.1 The Unilever Entity
Unilever Global (also referred to as Unilever Overseas Holdings Limited) is a multinational
corporation made up of two parent companies - Unilever NV and Unilever PLC - which,
although two separate legal entities with separate stock exchange listings, in practice
operate as a single unit with the same board of directors, with an Executive Committee of
the board, responsible for setting strategy for the overall business performance. Unilever's
corporate centers are London and Rotterdam (Internet 5). Its worldwide turnover for 2003
was €42,942 million (Internet 6).
Unilever's purpose, as enshrined in its mission statement, "is to meet the everyday needs of
people everywhere - to anticipate the aspirations of our consumers and customers and to
respond creatively and competitively with branded products and services which raise the
quality of life" (Internet 7).
Unilever's strategy from 2000 to 2005, 'Path to Growth', a five-year strategic plan
announced in February 2000, was designed to accelerate top-line growth and further
increase operating margins. This was centered on a series of initiatives to focus on fewer,
stronger brands to accelerate growth.
50
^ S I 7 >
LIBRARY

The cornerstone of the plan was to focus on product innovation and brand development on
a portfolio of around 400 leading brands which would lead to less fragmentation of
resources and bigger hit innovations.
"Through Path to Growth we have greatly strengthened the business. We have a much
more focused brand portfolio, while the major reductions in costs and streamlining the
asset base have resulted in sharply higher operating margins beia [beia = digit earnings per
share growth] (from 11% to 15.7%) and improved capital efficiency (from 29% to 20% of
sales); underlying tax rate has been reduced by 2%; 'ungeared' free cash flow has totaled
€16.4 billion" (Internet 8).
Unilever's new mission for 2005 to 2010 is "To add Vitality to life", meeting the everyday
needs for nutrition, hygiene, and personal care with brands that help people feel good, look
good, and get more out of life (Internet 9).
To ensure the success of its "Path to Growth" strategy, Unilever identified "Simplification"
as one of its key drivers. Simplification defined the revision of the company's knowledge
and information systems for, and the refocusing of resources behind its 400 leading brands
with consequent reduction of overheads and streamlining of the corporate centre, costing
some €2.0 billion.
4.2 Unilever Information Systems
In the past ten years (from 1995 to 2005), Unilever has made very strategic and pragmatic
steps to move from fragmented non-integrated information systems to more integrated
information systems driven by Enterprise Resource Planning (ERP).
In the early 1990s, Unilever used mainframe based systems that provided management
sales focused information extracted from its Transaction Processing Systems (TPS).
Running on mainframes (Hitchi / Natural), these proprietary systems (SMI / Vision) were
non-flexible, providing sales-based information, extracted and reported to management by
mainly accounting assistants. However, Unilever needed more flexible and business wide
information in an integrated reported form. This motivated the introduction of a new ERP
system in the early 2000s.
51

The company implemented SAP R/3 on an Oracle database, an ERP system, with the
strategic objective to integrate the entire supply chain to facilitate the integration of
business information systems. Eureka, a sales focused system, was the first to be
implemented, a quick and effective migration of the old sales systems to this new one.
Eureka is flexible, with a larger audience and is directly accessible to sales personnel and
other managers in a user friendly interface. Eureka was also a global implementation by
Unilever as the starting point for a future enterprise information system platform.
Unilever's SAP platform has since been upgraded continuously and currently has a data
warehouse information base.
Since 2001 Unilever has incorporated more information into its SAP database. This has
been on-going with the ultimate aim of integrating its supply chain, finance, brands and
product information and all other internal information needed for management awareness
and decision-making. This led to the incorporation of a new SAP product, BW (business
warehousing), which would become the data warehouse of the Unilever information base,
with both external and internal information.
Information in the data warehouse must be classified and presented to the various
information recipients in a more relevant and on an 'as needed' basis. This requires a more
focused approach with management specific information among others, to management for
decision-making. Unilever planned a Business Intelligence system based on an EIS as its
starting point.
Unilever EIS was thus developed in 2004 out of a business need and IS strategic response
to provide the information needed. The EIS development was outsourced and knowledge
was transferred to Unilever IS personnel. Development was via prototyping using a third
party EIS product; Pilot Lighthouse.
Currently, the Unilever EIS is live and fully operational. Unilever defined its EIS users as
'senior management' who need information to make decisions. Other sources of non-
integrated information exist in Unilever that management can access for information to
make decisions. However EIS, a more focused information system, integrates all relevant
information, mainly from internal sources, and presents it in a user-friendly manner. It also
52

incorporates analytical tools for its users to analyse information in various forms and from
different perspectives. Reports are also pre-formatted to meet the immediate information
scenarios needed by the decision-maker.
4.3 EIS in Unilever
Conceptually, EIS was proposed in Unilever between 2002 and 2003, and was first
established as a decision tool based on business intelligence (BI) tools. EIS however
become operational in early 2004 with the purpose being to place information needs of
decision-makers directly at their disposal. This thus presented decision-makers with a
system for strategic planning, performance evaluation, tracking and control and for
forecasting further performance, growth and profitability. The initial users have been board
members, executives and managers.
EIS development requires input from three stakeholders' groups, according to Watson and
Rainer (1995). These are the EIS executive users, EIS providers (i.e. persons responsible
for building and maintaining the EIS), and often, EIS vendors and consultants.
Unilever EIS development has been a collaboration of in-house IS expertise and support
from external EIS consultants. The development methodology has been based on
prototyping, using SAP's BW EIS tools. This thus involves SAP consultants as part of the
consultation team. Poon and Wagner (2001) identified similar approaches to EIS
development in their research on EIS CSF.
The contents and requirements of the system have largely been driven by the MIS experts
with intimate knowledge of the business climate, but also in conjunction with external
business consultants and with the executive users as well.
The main content of the system covers information from finance, marketing, sales and
some external market trends. At this early stage of the system usage, this information is
targeted at providing strategic views of product and customer profitability. Users are able
to perform analysis on this information, and gain business intelligence for further
functional analysis.
53

The day-to-day management and support is done by the MIS staff (or IT experts) in
conjunction with the external consultants and with enhancements of the information in the
system done in conjunction with senior executives.
EIS development and implementation did face numerous setbacks due to resistance from
various internal stakeholders. This Unilever attributed to changes in work style driven by
the introduction of EIS. For example, by having direct access to information via the EIS
system, the executives by-pass their executive-assistants and other assistant managers who
would otherwise provide them with such information. This creates a sense of insecurity,
thus generating resistance from these groups towards the EIS project.
The evolution and spread of EIS use within the business has been driven by ensuring that
all new and strategic issues are incorporated in EIS and its use promoted to senior
management.
The learning from EIS implementation in Unilever, according to the MIS management
includes work culture and change management, understanding the link between business
strategic objectives and EIS via 'key performance indicators' (KPI) monitors. The key
challenge is to ensure the continuous use of the system by users and be adopted as a key IS
tool for effective decision-making.
4.4 Conclusion
This chapter has discussed the company being understudied, Unilever South Africa, its
entity shareholding, strategies, objectives and performance. It also accounted the various IS
used by the company and its recently developed and implemented EIS. Discussions on
lessons learnt and current challenges facing the company in ensuring continuous use of EIS
concluded the chapter.
The next chapter will cover the analysis of the results obtained by the research and discuss
the findings.
54

Chapter 5. RESULTS AND DISCUSSIONS
5.0 Introduction
This chapter covers the results as obtained from the response to the research instruments
and from the interviews conducted. It will also cover discussions on the findings as
reported by the results.
The chapter is divided into three sections and a conclusion. The first section will be on all
the results obtained via the statistical computations. This will be used to assess the three
hypotheses, leading to either their rejection or acceptance (confirmation). The second
section will be a discussion of the results and the outcome of the hypotheses tested.
The conclusion, being the third section, will be a summary of the findings, discussions and
will include a statement on whether the objectives of the research have been achieved.
5.1 Results
This will cover the descriptive statistics and the hypothesis testing.
According to Freund et al. (1993), descriptive statistics are important in summarizing and
describing some important features of research data collected. However any form of
generalisation of any kind lies outside of descriptive statistics.
The mean and standard deviation are two descriptive statistic parameters employed in this
analysis. The values obtained summarize and describe the mean response of the
respondents (Unilever EIS users) to the research constructs, PEU, PU and AT. This would
give an indication of users' agreement or disagreement (by the Likert-scale used) with
these constructs. The standard deviation would measure the extent to which these values
deviate from the true mean values.
Table 5.1 gives a summary of the descriptive statistics covering the mean, standard
deviation and the Cronbach alpha for the composite constructs values of PU (PUC), PEU
(PEUC) and AT.
55

The measure for each of the constructs, PU and PEU, was represented by the composite
value of all the factors under the construct. These values are referred to as composite values
(PUC and PEUC) and are represented as the mean of the factors measured (see Davis, 1989;
Yang, 2003; Hung and Chang, 2004; Ventakesh, 2000; McGill and Hobbs, 2003).
Table 5.1: Descriptive Statistics
Perceived Usefulness Using EIS enables me to make strategic decisions more quickly
Using EIS effectively supports my analytical thought process, increasing my performance
Using EIS enhances my efficiency
Using EIS enhances my effectiveness in my job
Using the EIS makes it easier for me to do my job
1 find EIS to be useful in my job
1 do obtain timely information from EIS
EIS provides me with accurate information
1 am satisfied with EIS
1 can still do my work without EIS
EIS provides me with all the information 1 need
Perceived Ease of Use (after adjustments)
Learning to operate EIS is easy for me
1 find it easy to get EIS to do what 1 want to do
Interacting with EIS is clear and understandable
1 find EIS easy to use
Personally, 1 would use a computer (applications, software, etc.) to do my work
*/ get enough user support when using EIS
1 need more training on EIS to use it more effectively
'Working with a computer makes me nervous
1 feel comfortable working with a computer
*/ do need support to use computers (applications, software, etc.)
Attitude Ultimately, 1 think the use of EIS is a good idea
Current use 1 currently use EIS in my job
Future use 1 will continue to use EIS in the future
Mean
5.4607
5.57
5.86
5.86
6.00
5.14
6.07
6.00
5.86
5.57
4.21
#3.93
4.96 (4.0)
6.21
5.21
6.07
6.21
6.00
5.43
#3.71
#1.14
6.57
#3.07
6.71
6.21
6.43
Std. Deviation
1.288
1.342
1.351
1.406
.961
1.748
1.072
.877
.864
1.284
1.672
1.592
.9737 (.6705)
.579
1.251
.616
.579
1.177
1.284
1.858
.363
.646
1.385
.611
.893
.938
* Factors excluded to obtain 'adjusted' mean value and improve reliability # Factors with low mean values
The mean values obtained for the composite variables PUC and PEUC before any
adjustments were made to the PEU construct to improve reliability (see section 5.1.1) were
56

5.46 and 4.96 respectively. These values indicate that the users' "quite agree" ( a value of 5
on the Likert-scale) with both construct factors. However, the mean value of PEUC after the
adjustment dropped to 4.0, a neutral value on the Likert-scale. The single factor construct
for attitude (AT) - "Ultimately, I think the use of EIS is a good idea" - scored a mean
value of 6.71, a "strong agreement" indicator of the users' positive attitude towards the use
of EIS. The SD range of 0.579 (the lowest) to 1.858 (the highest) indicates a low deviation
from the mean values of the constructs.
Though these means are favourable and look good for the construct, the mean values of
some of the individual factors making up the constructs indicate lower means that raises
issues for discussion and redress. These factors (see table 5.1) are as follows;
1. "I do need support to use computers" - with a mean value of 3.00 ("slightly
disagree") requires attention on user support in the use of computers
2. "I need more training on EIS" - with a mean value of 3.6 (b/n "slightly disagree"
and "neutral") also requires some attention for more training on EIS for users
3. "EIS provides me with all the information I need" - with a mean value of 4.09
("neutral"), EIS contents need to be significantly improved to include,
comprehensively, all or most user information need.
However, a more positive mean value of 6.57 for the User Efficacy item - "I feel
comfortable working with computers" - is a very positive and encouraging finding, an
indication that users are comfortable with computers and thus would be comfortable with
EIS and Information Technology related issues.
5.1.1 Reliability
The Cronbach's alpha, a measure of reliability (see section 3.11), is 0.80 for PUC and 0.40
for PEUC (see appendix D). According to Davis (1989) a Cronbach alpha of 0.8 in a case
where TAM is used, is acceptable as a good measure of reliability. However, a value of 0.7
and above is acceptable in the case of a general statistical analysis (Hair et al., 1998). Thus
the value of 0.40 for PEUC is low and further investigation was conducted.
A low Cronbach alpha indicates an inconsistency in the contributing effect of the factors to
the construct (Reynaldo and Santos, 1999). According to Reynaldo and Santos (1999),
57

these factors are not measuring the same construct as the rest of the construct factors. These
factors also have a lower contributing value to the construct correlation value.
In a case like this where the construct show poor or less reliability, the individual factors of
the constructs that have the lowest correlation are dropped and the reliability coefficient
recalculated (Internet 10). The same approach was applied by other researchers like Adams
et al. (1992), Yang (2004), Hung and Chang (2004), McGill and Hobbs (2003).
In this case, by dropping the following factors with the lowest correlation coefficients (see
table 5.2 and appendix D) one after the other, a reliability of 0.81 was obtained (see
appendix E);
• I get enough user support when using EIS
• Working with a computer makes me nervous
• I do need support to use computers (applications, software, etc.)
Table 5.2: PEU factors Correlation coefficients (r)
PEU Factors (questions) Learning to operate EIS is easy for me I find it easy to get EIS to do what I want to do Interacting with EIS is clear and understandable I find EIS easy to use Personally, I would use a computer (applications, software, etc.) to do my work I get enough user support when using EIS I need more training on EIS to use it more effectively Working with a computer makes me nervous I feel comfortable working with a computer I do need support to use computers (applications, software, etc.)
R 0.39 0.462 0.518 0.644 0.477
0.351* 0.667 -0.610* 0.492 -0.035*
* Factors excluded in order to improve reliability
This thus implies that these factors do not significantly affect PEU, but however does not
imply that they are less important.
58

5.1.2 Hypothesis Testing
The three hypotheses tested are:
• HI Factors of PU positively influences AT towards EIS usage
• H2 Factors of PEU positively influences AT towards EIS usage
• H3 Factors of PU positively influences Factors of PEU of the EIS system
To test these hypotheses, it was necessary to first establish if there was any correlation
between the variables. This was accomplished via the computation of a Spearman
correlation coefficient, used in cases of ranked-data (Freund et al, 1993). The Spearman
correlation coefficient for the model is summarised in Table 5.3 and illustrated in figure 5.1
(see also appendices G and H).
Table 5.3: Spearman correlation coefficients
R
Between PU and AT
Between PEU and AT
Between PU and PEU
Before adjustment
0.238
0.340
0.324
After adjustments
0.238
0.459
0.460
Though all the values are positive and in agreement with the TAM construct, the values
between PEU and AT were found to be greater than those between PU and AT, before and
after adjustment.
0.238 (0.238)
R2=0.172 (0.292)
PEU ^ ^ ^
0.34 (0.459)
Figure 5.1: Correlation and regression (R2) coefficient within model
The positive correlation coefficients between the variables PU, PEU and AT thus indicate a
relationship between them as postulated by TAM and the strength of the relationship is
measured by the indicated coefficient values (Freund et al., 1993). Though being positive,
59

these values are low and can be attributed to the low heterogeneous nature of the data
results obtained (Internet 16). An in-depth review of the obtained data reveals very low
variation in response, with response values ranging mostly between "5 - slightly agree"
and "7 - strongly agree". Such low variation does affect the value of the correlation
coefficient but not its positive or negative nature. A similar result was obtained and
explained in the same way by Averweg (2002). A positive but low correlation coefficient
can also be attributed to the fact that, EIS in Unilever is still at its earliest stage of diffusion
in the company (Hung and Chang (2004).
To test the hypothesis, a regression model analysis was employed in support of the positive
relationship between the variables and the postulated influence of PE and PEU, the
independent variables, on AT, the dependent variable. In the regression model, PU
accounted for 19.7% of the variance in AT before the adjustment, but increased to 48.2%
after the adjustments. PEU accounted for 36.7% of the variance in AT but decreased to
16.2 after the adjustments. The results are summarised in Table 5.4 (see also appendices G
and H).
Based on these results, all three hypotheses, HI to H3, were accepted.
PU Towards AT
PEU Towards AT
R2
Before adjustment
B
0.197
0.327
T
0.703
1.164
0.172
After adjustment
B
0.482
0.162
T
1.857
0.622
0.292
Table 5.4: Regression coefficients
5.2 Discussions of Results
The discussions of the results will be based on the combination of the statistical analysis
done in section 4.1 and information obtained from the interview conducted with the
Executive user group in the company, Unilever South Africa.
This is in accordance with the research methodology employed by the researcher,
'Triangulation'. According to Ghauri and Gronhaug (2002, p. 182), "the main advantage of
60

Triangulation, however, is that it can produce a more complete, holistic and contextual
portrait of the object under study". The statistical results will thus be discussed on one hand
with support from the interview and vice-versa.
The executive user group interviewed was represented by a group of five 'Executive-
Decision-Makers' (EDM, as Unilever prefers them to be called). Unilever identified the
members of this group as typical EIS users who utilize the full potential of the system. It is
thus expected to find or obtain most of the EIS benefits from this group. The interviews
were designed to verify the information to be obtained from the questionnaire on the usage,
acceptance and possible adoption of EIS by the users' group.
The interviews were typically 30-45 minutes long, with further in-depth probing to obtain
more information of significant value and benefit to the researcher.
(The interview instrument is attached as appendix B).
The TAM model postulates that the effects of user perception(s) are channeled through
attirude(s), which impact on usage, rather than a direct impact on usage (Davis, 1989; Al-
Gahtani and King, 1999). The results obtained indicate a positive influence of both PU and
PEU on AT and this is measured by the positive correlation figures within the model
construct (see section 5.1.2). This result is thus in agreement with the expectations from the
TAM model and with other previous research works.
The model construct-factors PU, PEU and AT, indicate a positive correlation both between
the pairs and within the model. The model hence confirms a positive relationship between
PU and AT, PEU and AT, and between PU and PEU.
However, it was the expectation of the researcher and in accordance with the TAM model,
that the influence of PU on AT should be greater than that of PEU on AT. But in every
research, there are bound to be surprise findings or a lack of expected findings (Pedersen &
Herbjorn, 2001), and in this case it was the reverse impact value of the two factors, PU and
PEU, on AT. The correlation factor of PEU on AT was found to be higher (both before and
after adjustments) than that of PU, a contradiction of the expectations from the TAM
postulated construct.
61

This is further supported by the response received from interviewees. According to the
group, EIS was conceived and requested by the executive board out of the need to access
information quickly, easily, and at will, without any intermediaries and also without a pile
of reports. This request was granted and first tested by the foods team for brand specific
information via the use of an IS system called Lightship. This has since become a corporate
wide EIS system built on SAP/BW (see section 4.3). The executives thus see EIS currently
as the power of information at their fingertips. "I use EIS every morning, religiously, in and
out of the office". As depicted by Davis (1989), a person's PU of a system is defined by the
extent to which he/she believes the system usage enhances his/her productivity. This hence
underscores the executives' perception of the EIS system as a useful IS.
However, in response to the question as to what EIS meant to the Unilever executive, the
group acknowledge the system as a true executive information system that provides top-
line or high-level information in a quick and highly effective way. In most cases a
comparison was made with SAP/BW, the previous system, in which case EIS was found to
be flexible, efficient and easy to use (PEU) with no constraints. It is a system that "keeps us
on top with key things (issues), refers us to what is going on in a simple format and enables
us to drill down into the issues (details)". The interviewees thus stress PEU as against PU.
According to Venkatesh and Davis (1996) there is experimental evidence supporting a
causal effect between a user's computer self-efficacy (ability to use, experience or
comfortability with the use of computers) and system-specific (e.g. EIS) PEU. Based on
this, the results can hence be better explained by exploring the detail results under PEU.
PEU scored a mean value of 4.6 but increased to 5.71 after the construct was adjusted to
improve reliability (see section 4.1.1). A closer look at the three factors shows high levels
of agreement on the issues raised by the factors. Users indicated a mean score of 5.43 and
1.41 on having enough EIS user support and "Using computers make me nervous"
respectively. The score of 1.41 indicates a "strong disagreement" with the statement and a
mean score of 6.57, a "strong agreement" on the statement that they felt comfortable using
computers further support this. Users are therefore used to computers and are not nervous
in their usage but rather comfortable with its use.
62

Venkatesh (2002) found computer self-efficacy, among other factors, to be a strong
determinant of user-system interaction and hence usage. This could hence be a contributing
cause to the higher influence of PEU on AT.
The interviewees also concur with this finding, as they use EIS on a daily basis and it is
more often the first thing they check once they get into the office. The executive mainly
uses EIS on a daily basis to monitor business performance against set targets. The
information accessed on EIS by executives follows: product information, customer
information, income statement, sales, profitability, promotional and investment
information, daily sales on a month-to-date, year-to-date, and brands performance versus
target and history, etc. The group confirmed that they use EIS "for anything in connection
with the business and business performance". This includes financial performance at
corporate, divisional, brand and smallest key unit (SKU) levels, identifying trends and gaps
to aid decision-making.
Other contributing confirmation on the high emphasis on ease of use is recorded by
interviewees' comments on flexibility of EIS as compared to previous systems (SAP/BW).
These systems according to the respondents lacked flexibility, were complex to use and
were not user-friendly. Respondents hence responded positively and concurred that EIS is
more flexible and easy to use. Their quest for ease of use is thus influenced by prior
experience.
PU recorded a high mean value of 5.46, with almost all the contributing factors having
mean score values above 5 ("slightly agree"), except for two factors - I can still do my
work without EIS, and EIS provides me with all the information I need - which scored
mean values of 4.21 and 3.93 respectively. This indicates that users do require more
information that is not available via EIS. However, they can still work without EIS, an
indication that they do have other sources of information. This is indeed supported by
responses from interviewees confirming having other sources of information, internal
information from other systems, SAP/BW, and external information from Nielson and
customer information from customers. This finding may also be a contributing factor to the
lower influence of PU on AT as compared to PEU on AT, thus weakening the perceived
usefulness of EIS.
63

The lower influence of PU is again supported by the response obtained from interviewees.
When executives were asked whether they would continue to function effectively without
EIS, the interviewees responded in the positive, but however stated that it would be
incredibly difficult and that they would experience some complexity in obtaining all the
information they would require to make decisions. This would mean going back to the
previous system which was complex and slow to obtain business relevant information.
They would lose the day-to-day update on business performance, and it would be difficult
to identify problems timely, hence this would lead to a reduction in business performance.
"Without EIS, I would still have access to information but it would be slow, inconsistent
and not interactive".
Besides EIS, executives use other sources of data and information, the most prevalent being
the Nielson database sources. This is mainly to access external business information that is
not provided by EIS. EIS, they said, covers only internal information. However, they do
require external information in order to make more informed decisions. Other external
information they require concerns their customers and this is often made available by the
customers themselves.
With access to these other external sources of information outside the Unilever EIS system,
the system is thus not the most useful source of information to the user. This thus
influences the PU of the user, thus the lower PU of the Unilever EIS system to its users.
The expectation expressed by interviewees from the EIS system is that of the incorporation
of external information to facilitate informed decision-making and to enable easy
benchmarking with industry and other business indicators. Also expressed is the lack of
flexibility with the current report format which is predefined and cannot be altered. Users
thus expressed the need to include system tools and system functionality to enable them
manipulate data to analyse scenarios and create their own report dimensions and reports.
The Unilever EIS user therefore requires more incorporation of relevant external
information, system tools and functionality into the EIS system to facilitate his/her
decision-making. Obviously this would improve the usefulness of the system to the user.
64

5.3 Conclusion
This chapter has covered the findings of the research work and the discussions that
followed. The findings have confirmed the concept of the TAM model that postulates a
positive influence of PU and PEU on AT towards IS usage.
The findings indicated that the Unilever users' perception of usefulness and ease of use of
the Unilever EIS has a positive influence on their attitude towards its use. This also
indicated a significant positive relationship between the three variables, PEU, PU and AT.
This hence led to the acceptance of all three sets of hypotheses tested.
This thus identifies the Unilever users' PEU and PU factors as a positive influence on their
attitude towards EIS. The results highlighted that the PEU factors have a greater effect on
the users' attitude as compared to their PU.
The researcher referenced other researchers with similar findings in their research and
attributed this to prior experience of users with similar systems, which though useful, were
difficult and complex to use.
The chapter also reported the findings from the researcher's interviews and discussed these
in line with the TAM concept covering the usefulness and ease of use of the EIS system.
These discussions will motivate the recommendation to be covered in the next chapter.
The objectives of the research have been achieved, having identified the various factors
under the Unilever users' perceived usefulness and perceived ease of use that directly
influence attitude towards use of the Unilever EIS system.
65

Chapter 6. CONCLUSION AND RECOMMENDATION
6.0 Introduction
This chapter consists of the conclusions arrived at by the researcher. The chapter is in two
sections; the first section will recap, in summary, the entire research as undertaken by the
researcher and the conclusions drawn. The second section will then discuss
recommendations as seem appropriate in addressing issues arising from the research
analyses.
6.1 Key Findings
The researcher set out in search of factors that are likely to affect user acceptability, usage
and adoption of Unilever EIS system. To achieve this, the researcher embarked on seeking
answers to the research questions; to identify possible factors that affect user perception of
the EIS system, factors that affect users' perception of EIS usefulness and ease of use. The
research commenced with a review of past literature on various IS developed and used by
organizations, including Unilever South Africa. The review also covered the strengths and
weaknesses of these systems and the developed frameworks. The review then concluded by
identifying EIS as a specific IS directed at executives to improve the effectiveness of their
decision-making process.
EIS successes and failures, just like other IS were discussed, with emphasis on its features,
characteristics and user acceptability, determinants of success or failure. This brought the
researcher to the research objectives; to identify 'factors that are likely to affect the EIS
user's acceptability of the EIS system and drive future use and adoption'.
To achieve this, the researcher discussed various assessment models on 'user acceptance of
technology' and the relationships between them. The TAM emerged as a well tested, used
and most preferred model used by many researchers for research on 'user acceptability of
new technologies'. Various extensions of the model were also discussed leading to the
proposed model, an extension of TAM, on which all the research investigations and
analyses were based. The researcher included various factors of relevance, as obtained
from the literature review, which are likely to affect user perception of the EIS system.
These were classified into the two main constructs of the model, i.e. 'Perceived Usefulness'
and 'Perceived Ease of Use'. According to the literature review, these two constructs
66

directly influence the users' attitude towards the actual use of the EIS (technology) and
thus are non-technical in nature. Also, since they affect the users' attitude, these factors are
not system development issues and thus 'non-system-developmental' in nature.
These factors thus contribute to the overall measure of the constructs and are the main
factors that are likely to affect the Unilever EIS users' acceptability, use and adoption of
the Unilever EIS system.
The researcher employed a 'triangulation' methodology approach, set research hypotheses,
and collected the research data via semi-structured interviews and from administered
questionnaires. Statistical analyses were done and the results led to the acceptance of all set
hypotheses.
Discussion of the results revealed that the construct was reliable and is a valid prediction of
future user acceptability and usage of the Unilever EIS system. This was as a result of their
positive impact on the 'user attitude' towards EIS use. Whilst all the factors of PU were
reliable, three factors of PEU had to be dropped, to achieve reliability.
The results also revealed that the influence of PEU on AT was higher than that of PU. This
contradicted the researcher's expectation based on previous researched results that found
PU to have a higher influence on AT as compared to that of PEU. However, this was not an
isolated case, as some other research referenced obtained similar results.
The discussion on the results concluded with the supporting insight obtained from the
interview results analysis. This supported users' higher emphasis on 'ease of use' as against
'usefulness', an outcome driven by previous experience with inflexible and difficult to use
IS systems.
By these findings, the researcher concludes with having achieved the objectives of the
research. The researcher has identified factors likely to affect future user acceptability, use
and adoption of Unilever EIS. These factors affect the users' perception of the Unilever
EIS in terms of its usefulness and ease of use. These factors have been classified as
'Perceived ease of use' factors and 'Perceived usefulness' factors respectively, with the
67

former having a heavier impact than the latter, on the users' future attitudes towards the
system usage.
The factors that contributed to the 'Perceived ease of use' included (see section 3.12);
measures of (user) training, motivation and computer self-efficacy (comfortability and
control of computer use). Factors that contributed to the 'Perceived usefulness' included;
measures of timeliness, accuracy and relevance of information, speed of strategic decision
making, support of analytical thought process, and (user) satisfaction.
These have been summarized in table 6.1, with some explanation of their characteristics in
the business context.
Table 6.1 Factors and their Characteristics
Factors relating to:
Information relevance (content)
Accuracy
Timeliness (up-to-date)
External control on use
Comfortable with EIS use
Strategic decision-making speed
Support the 'thought process'
Characteristics Strategic information, internal organizational
information, external industry and
competitors information, global market
indicators
Information integrity, consistency
Must be very current, made available
immediately
Not to mandate EIS use!, Ensure assess levels
to various user levels
User support, flexibility with manipulation of
reports and analyses constructs
Link of EIS directly to business objectives
and key performance indicators
Integrated EIS system tools; to construct
trends, comparisons with market indicators
and competitors, flexible reports and analyses
scenarios
68

6.1.1 Support of Key Findings
The employment of the triangulation methodology enables the researcher to further validate
the research findings by a combination of the statistical methods results against the
interview overview.
The perceived usefulness of the Unilever EIS system was evident by the response obtained
from interviewees. They concurred that EIS has been successful so far and when asked to
rate this on a scale of 1 to 10 (10 being the highest), gave a mean of 8.
In proposing improvements to the usefulness of the system, interviewees expressed the
need to include access to external information or incorporate such information directly into
the EIS system. They also proposed the incorporation of system tools that would enable
forecasting and thus aid proactive planning.
They highlighted other non-technical issues of success such as access to information and
information ownership as issues now being taken more serious by stakeholders. Previously,
finance has been viewed as being responsible for all information, but EIS has since
changed this and taken responsibility for the business.
As to how to ensure success in the future, the group stated the need for more flexibility to
enable users to design their own reports and the incorporation or linkage to external
business relevant information. The system must incorporate system tools and functionality
to offer this flexibility.
The group expressed the urgent need to extended EIS to cover other parts of the business
that are not currently covered by the system. The example given is the financial reporting
system that is currently being done manually on spreadsheets which is time consuming and
prone to errors.
Other problems like access to the system from outside the office, remote access, must be
resolved.
The group is of the view that much more needs to be done to get much more company-wide
buy-in and acceptance.
69

In a summary on the perceived usefulness (PU) of the Unilever-EIS to the Unilever
executives, the interviewees (EDM members) agreed that EIS has become the critical tool
used to appraise the business on a short-term basis enabling a comparison between current
performance against set targets and historical figures.
EIS is being consistently used by all EDMs and therefore all executives have access to the
same information in a consistent manner as compared to the pre-EIS era where people had
different information that was inconsistent thus making decision-making very difficult.
EIS has successfully put together both financial and volumes data, making decision-making
more effective. "EIS has made my work 40 to 50 percent more effective. Massively!".
Overall, EIS is driving the right business behaviour and instilling the responsibility of
information ownership to stakeholders in the business. The collective view from the
interviewees is that EIS is indeed "Fantastic".
"EIS has breathed new life into the business because we do not argue about what the fact is
anymore! We see what the facts are by a click of a button or mouse. We argue about the
best way to fix them".
6.2 Recommendations
It is important to address both issues of usefulness of the system and its 'ease of use'.
Users, to a large extent, find the system easy to use. They are also comfortable with the use
of computers and would use computer-based solutions or applications proactively if it
would make their job more effective and improve their performance.
The challenge for Unilever now is how to greatly improve the users' perceived usefulness
(PU) of the system, communicate it and then demonstrate that to the user.
The global arena of business and the high levels of competition compound the challenge to
the decision-maker in making effective decisions. The decision-maker thus needs access to
a composite source of information on competitors, industry and emerging technology to
facilitate competitive decisions and strategies.
70

There are two main issues about the information content of EIS that need to be resolved.
Firstly, the information is limited to internal information and secondly, it is still incomplete
as it does not cover or include all internal information sources.
EIS information content must be extended to cover all internal information sources, a 'one
point access' to all information. Also, links to other information sources must be included
to facilitate comparative analyses on trends and competitive performance analyses with
global and industry market values. The system must include all the necessary tools to
enable the users to perform all the relevant information analyses needed. These tools must
also be easy for the user to apply.
To ensure that the system captures all information relevant to the executive, two
approaches have been documented to be very effective (see appendix);
Continuous discussions with the executives, as the main EIS users. This would
involve understanding the job responsibilities of the executives, their frequent and
current problems encountered, and commonly used information.
Continuous discussions with executives' support personnel. These staff members
have proved to have a good and extensive understanding of the executives'
information needs, especially the most frequently requested information.
EIS is designed to be simple and easy to use, hence it requires minimum training for the
user. Though training is minimal, it must be ongoing and should be complemented by
effective user support. Executives need to maximize their time and need prompt responses
to their requests for support otherwise they would have to abandon the system and request
information from assistants and managers. This would defeat the purpose of EIS, slowing
down decision-making time and effectiveness, the very problems meant to be solved by
EIS.
Organizational culture and practices are two important, non-technical influencing factors to
be considered and managed when introducing 'something new' within an organization. The
use of EIS and the way it is employed within the company must be compatible with the
existing working practices. The total establishment of EIS within the organization must be
'multiphase' rather than a single phase. This would minimize the culture shock, enabling
the users to gradually adopt the new EIS culture.
71

Company-wide buy-in can be achieved by effective campaigns by the project champion(s)
and sponsor(s). Unilever already use the concept of project champions and process owners
to ensure efficiency and effectiveness of projects. This concept is still relevant and can be
employed in the deployment of EIS. However since EIS is directed at executives, these
persons must be executives to highlight the significant importance of EIS to the business.
Caution must be taken not to impose the system on users. The least impact of usage is the
introduction of managerial or organizational mandate. This must be avoided.
Based on all the collated user(s) needs and concerns expressed, it will be beneficial to
redefine and collate a new set of user requirement for the Unilever EIS. Though one of the
major problems in system development (Watson and Frolick, 1993), user(s) requirements
definition is the most important phase in determining information requirement and system
design, features and functionality at the System Design Phase (see Appendix I, SDLC).
Finally, EIS is meant for the business, and thus it is the individual users who determine its
business value. If EIS facilitates or helps the users to achieve their business objectives, then
value is added and users would continue to use EIS to further achieve future objectives.
EIS must thus be significantly linked and drive the business objectives.
For future examining of the impact of these factors, the following research is proposed:
a repeat of this research in the future as more users adopt EIS usage. This would be
to investigate any changes in AT as the user group becomes larger
- a longitudinal study is needed to analyse the changes in user attitude in relation to
the identified factors over a longer period of time after EIS adoption
a comparative research on EIS between and within similar companies in the same
industry with Unilever
- a research to examine the effect of EIS at the organizational level, and its impact on
the achievement of business objectives.
END
72

"Genius lies in the ability to see how two things that nobody else sees as related are related.
This ability to make distant analogies unlocks a world of potential. And it's all a matter of
looking for how things are the same, not for how they are different".
Fred Stratton, CEO, Briggs & Stratton (Internet 11)
73

Appendix A - Research instrument sent to users
Purpose of the questionnaire: This is in connection with a research work, in a partial fulfillment of a Masters Degree in Business Administration (MBA) with the University of KwaZulu-Natal.
Student Details: Sonny Ako-Nai, University of KwaZulu-Natal, Tel. No. 0832474615, email: sonny 133(Shotmail.com
Aim of Research: To identify factors that are likely to affect EIS users' acceptability, adaptability, adoption and continuous use of the EIS system as a strategic tool for decision making.
Timings: Please endeavor to complete and return by 13th May, 2005. However a seven days responds time would be greatly appreciated.
Instruction: Please respond to each of the questions by ticking the column that best describes your opinion or answer to the question. You have seven (7) choices as described in the measurement scale table below. (1 - Strongly disagree,...., 7 - Strongly agree)
Measurement scale 1
2
3
4
5
6
7
Strongly disagree
Quite disagree
Slightly disagree
Neutral
Slightly agree
Quite agree
Strongly agree
i.e. less than 20%
i.e. 21% - 34%
i.e. 35% - 44%>
i.e. 45% - 54%
i.e. 55% - 64%
i.e. 65% - 79%
i.e. 80% -100%
Please fill in:
apartment or 1 Finance
Marketing
Sales
functional area of work? Accounting
Administrative
Customer service
HR
Manufacturing
Operations
Others (please specify) Job position? (assistant manager, middle manager, senior manager, executive) or (WL1,WL2, etc.)
74

l=Strongly disagree; 2=Quite disagree; 3=Slightly disagree; 4=Neutral; 5=Slightly agree; 6=
1
2
3
4
5
6
7
8
9
10
11
12
13
14
15
16
17
18
19
20
21
22
23
24
Using EIS enables me to make strategic decisions more quickly Using EIS effectively supports my analytical thought process, increasing my performance Using EIS enhances my efficiency
Using EIS enhances my effectiveness in my job
Using the EIS makes it easier for me to do my job
I find EIS to be useful in my job
I do obtain timely information from EIS
EIS provides me with accurate information
I am satisfied with EIS
I can still do my work without EIS
EIS provides me with all the information I need
Learning to operate EIS is easy for me
I find it easy to get EIS to do what I want to do
Interacting with EIS is clear and understandable
I find EIS easy to use
Personally, I would use a computer (applications, software, etc.) to do my work I get enough user support when using EIS
I need more training on EIS to use it more effectively Working with a computer makes me uncomfortable
I fell comfortable working with a computer
I do need support to use computers (applications, software, etc.) I currently use EIS in my job
I will continue to use EIS into the future
Ultimately, I think the use of EIS is a good idea
1 3uite agree;
2 3 7=Strongly s
4 5 gree
6 7
75

Appendix B - Research instrument used for semi-structured interview
Questionnaire for semi-structure interview
What are the factors that are likely to affect user acceptance, usage and adoption of the Unilever Executive Information System?
The purpose of the study is thus to identify factors that influence users'
acceptance, usage and adoption of the Unilever EIS system and to recommend
ways to deal with arising issues in both a proactive and pragmatic manner.
The question is; why do users of such systems with everything to offer in terms of a
complete portfolio of user requirements decide to reject such a system?
1. EIS is an Executive Information System; having been introduced to EIS, what
would you say is EIS to you?
2. Who requested for EIS?
3. What do you use EIS for?
4. Do you use EIS on a daily bases?
5. Is it or has it become a key driver to your daily operation or work?
6. Would you function without it?
7. Do you have other source of information or would you rather have information
from other sources?
8. Are there any personal expectations from EIS that have not been met by the
system?
9. Any future expectations?
76

10. What are the most important factors that would drive EIS future
success i.e. usage?
11. Has EIS been successful so far?
12. Potentially, how important is EIS to you as a decision maker?
13. Overall comment on EIS?
77

Appendix C - Reliability test for PU
Reliability test for PU R E L I A B I L I T Y A N A L Y S I S F O R P U
S C A L E ( G U T T M A N / A L H P A )
C o r r e l a t i o n M a t r i x
STRATEGI PERFORM EFFICIEN EFFECT EASIER
STRATEGI PERFORM EFFICIEN EFFECT EASIER USEFUL TIMELY ACCURATE SATISFIE WITHOUT ALLINFO
USEFUL TIMELY ACCURATE SATISFIE WITHOUT ALLINFO
ALLINFO
N of Cases =
1.0000 .7273 .4132 .5964 .6838 .4507
-.1307 .0095 .4654
-.3328 .6326
USEFUL
1.0000 -.0818 -.1542 .1917
-.5672 .2738
ALLINFO
1.0000
14.0
1
-
.0000
.6364
.7706
.7914
.5922
.0000
.0471
.5830
.4963
.4959
TIMELY
1 .0000 .5073 .4099 .0000 .1102
1.0000 .7401 .7913 .4156 .3742 .1717 .8155
-.4112 .6137
ACCURATE
1.0000 .5644
-.1900 -.0080
1.0000 .7329 .6724 .1826 .2779 .7483
-.5266 .3521
SATISFIE
1.0000 -.3480 .4733
1.0000 .7334 .0502
-.0873 .6121
-.5376 .5847
WITHOUT
1.0000 -.4273
R e l i a b i l i t y C o e f f i c i e n t s 11 i t e m s
Lambda 1 = .7143 Lambda 2 = .8660 Lambda 3 = .7858 Lambda 4 = .3977 Lambda 5 = .8481 Lambda 6 = .9726
Alpha .7858 Standardized item alpha .8048
78

Appendix D - Reliability test for PEU before adjustments
Reliability test for PEU (before adjustments)
R E L I A B I L I T Y A N A L Y S I S F O R P E U S C A L E ( G U T T M A N / A L P H A )
C o r r e l a t i o n Matrix
LEARNING DOWHAT CLEAR EASY COMPUTER ESUPPORT TRAINING NERVOUS COMFORT NSUPPORT PEU
ESUPPORT TRAINING NERVOUS COMFORT NSUPPORT PEU
PEU
LEARNING
1.0000 .1441 .6011 .7705 .3388
-.5470 .1328
-.5227 .6756
-.2125 .6044
ESUPPORT
1.0000 .4746 .0236
-.0397 .0247
-.0384
PEU
1.0000
DOWHAT
1.0000 -.0214 .0379 .4702
-.1573 .1938
-.5804 .2174
-.0539 .5475
TRAINING
1.0000 -.2769 .3387
-.4101 .6812
CLEAR
1.0000 .8169 .4247
-.2363 .2210
-.3932 .6628 .0838 .6255
NERVOUS
1.0000 -.7024 .2841
-.7734
EASY
1.0000 .3388
-.1331 .4905
-.5227 .6756
-.2125 .7571
COMFORT
1.0000 -.1351 .7319
COMPUTER
1.0000 -.2546 .1408
-.7201 .4047
-.1416 .6700
NSUPPORT
1.0000 -.2930
N of Cases 14.0
Reliability Coefficients 10 items
Lambda 1 Lambda 4
.3141 ,0313
Lambda 2 = Lambda 5 =
5172 5281
Lambda 3 Lambda 6
.3490
.8885
Alpha = .3490 Standardized item alpha = .3909
79

Appendix E - Reliability test for PEU after adjustments
Reliability test for PEU (after adjustments)
R E L I A B I L I T Y A N A L Y S I S F O R P E U S C A L E ( G U T T M A N / A L P H A )
C o r r e l a t i o n M a t r i x
LEARNING DOWHAT CLEAR EASY COMPUTER TRAINING COMFORT PEU
TRAINING COMFORT PEU
LEARNING
1.0000 .1441 .6011 .7705 .3388 .1328 .6756 .6044
TRAINING
1.0000 .3387 .6812
DOWHAT
1.0000 -.0214 .0379 .4702 .1938 .2174 .5475
COMFORT
1.0000 .7319
CLEAR
1.0000 .8169 .4247 .2210 .6628 .6255
PEU
1.0000
EASY
1 .0000 .3388 .4905 .6756 .7571
COMPUTE
1.0000 .1408 .4047 .6700
N of Cases = 1 4 . 0
R e l i a b i l i t y C o e f f i c i e n t s 7 i t e m s
Alpha = .6893 Standardized item alpha = .8139
80

App
endi
x F
R
aw d
ata
as c
aptu
red
from
que
stio
nnai
res
1 2
3 4
5 6 Cus
tom
er
DE
FT
PO
SIT
ION
ST
RA
TE
GI
PE
RF
OR
M
EF
FIC
IEN
EF
FE
CT
EA
SIE
R
US
EF
UL
TIM
EL
Y
AC
CU
RA
TE
SA
TIS
FIE
WIT
HO
UT
AL
LIN
FO
LE
AR
NIN
G
DO
WH
AT
CLE
AR
EA
SY
CO
MP
UT
ER
ES
UP
PO
RT
TR
AIN
ING
NE
RV
OU
S
CO
MF
OR
T
NS
UP
PO
RT
CU
RR
EN
T
CO
NT
INU
E
GO
OD
IDE
A
Sa
les
WL3
5 6 7 7 4 5 7 7 7 4 3 6 2 6 6 3 6 3 2 6 4 6 7 7
Sa
les
WL
3
5 7 7 7 7 7 6 6 7 5 2 7 7 7 7 7 3 5 1 7 3 7 7 7
Ma
rke
tin
g
WL3
6 7 6 6 5 5 7 7 7 3 5 6 6 6 6 7 7 5 1 7 5 7 7 7
Sa
les
WL3
7 6 6 6 6 6 6 6 6 4 6 6 6 6 6 6 5 2 1 6 4 6 6 6
Fin
an
ce
Se
rv.
WL2
W
L2
6 5 5 5 5 5 6 5 5 7 3 6 5 5 6 6 6 4 1 6 1 6 7 7
7 7 7 7 6 7 7 6 6 6 5 6 6 6 6 6 6 4 1 7 3 6 7 7
7 8
9 10
Med
ia
Mar
ketin
g
Fina
nce
Mar
ketin
g
WL
3 W
L2
WL
2 W
L3
5 5 2 5 2 6 5 6 3 5 1 7 5 6 6 7 3 2 1 7 1 6 6 7
7 7 7 7 7 7 5 7 7 2 5 6 4 7 7 7 7 7 1 7 1 7 7 7
6 6 6 5 5 5 5 5 5 5 5 5 5 5 5 5 5 2 2 5 4 5 5 5
5 6 7 6 6 7 7 6 6 3 6 6 5 6 6 6 6 4 1 7 4 7 7 7
81
11
12
13
14
Mar
ketin
g
Fina
nce
Rn
ano
e M
arke
ting
WL
3 W
L2
WL
2 W
L2
5 7 6 6 6 7 5 4 4 3 4 6 6 6 6 5 6 2 1 7 3 6 6 7
2 2 4 4 1 4 6 6 4 7 2 7 4 7 7 7 4 1 1 7 5 4 4 6
5 5 6 6 6 7 7 6 5 2 3 7 6 6 7 5 6 7 1 7 2 7 7 7

Appendix G - Spearman's and Regression coefficients before adjustments
Spearman's Correlation coefficient (between constructs PU, PEU, AT)
(Before adjustments)
Perceived Usefulness
(PU)
Perceived Ease of Use
(PEU)
Ultimately, 1 think the use of EIS is a good idea (AT)
Correlation Coefficient
Sig. (1 -tailed)
N
Correlation Coefficient
Sig. (1-tailed)
N
Correlation Coefficient
Sig. (1-tailed)
N
Perceived Usefulness
(PU) 1.000
.
14
.324
.129
14
.238
.206
14
Perceived Ease of Use
(PEU) .324
.129
14
1.000 .
14
.340
.117
14
Ultimately, I think the use
of EIS is a good idea
(AT)
.238
.206
14
.340
.117
14
1.000
14
Regression coefficients (AT as dependent variable)
(Constant) Perceived Usefulness (PU) Perceived Ease of Use (PEU)
Unstandardized Coefficients
B 3.864
.162
.427
Std. Error
1.889
.230
.367
Standardized Coefficients
Beta
.197
.327
t
2.045
.703
1.164
Sig.
.066
.497
.269
95% Confidence Interval for B
Lower Bound
-.294
-.345
-.380
Upper Bound
8.023
.668
1.234
* Dependent variable is AT (Ultimately, I think the use of EIS is a good idea) * Independent variables PEU and PU
82

Appendix H - Spearman's and Regression coefficients after adjustments
Spearman's Correlation coefficient (between constructs PU, PEU, AT)
(After adjustments)
Perceived Usefulness
(PU)
Perceived Ease of Use
(PEU)
Ultimately, 1 think the use of EIS is a good idea (AT)
Correlation Coefficient
Sig. (1-tailed) N
Correlation Coefficient
Sig. (1-tailed)
N
Correlation Coefficient
Sig. (1-tailed)
N
Perceived Usefulness
(PU) 1.000
.
14
.460(*)
.049
14
.238
.206
14
Perceived Ease of Use
(PEU)
.4600
.049 14
1.000 .
14
.4590
.049
14
Ultimately, I think the use
of EIS is a good idea
(AT)
.238
.206
14
.459(*)
.049
14
1.000
14
Regression coefficients (AT as dependent variable)
(Constant)
Perceived Ease of Use (PEU) Perceived Usefulness (PU)
Unstandardized Coefficients
B
3.301
.471
.133
Std. Error
1.657
.253
.213
Standardized Coefficients
Beta
.482
.162
T
1.992
1.857
.622
Sig.
.072
.090
.546
95% Confidence Interval for B
Lower Bound
-.346
-.087
-.336
Upper Bound
6.949
1.029
.601
* Dependent variable is AT (Ultimately, I think the use of EIS is a good idea) * Independent variables PEU and PU
Model Fitting Information
Model Intercept Only
Final
-2 Log Likelihood
18.367
9.434
Chi-Square
8.933
df
4
Sig.
.063
83

Appendix I - The System Development Life Cycle (SDLC) (Internet 16)
INTRODUCTION TO SDLC
The SDLC includes ten phases during which defined IT work products are created or modified. The tenth phase occurs when the system is disposed of and the task performed is either eliminated or transferred to other systems. The tasks and work products for each phase are described in subsequent chapters. Not every project will require that the phases be sequentially executed. However, the phases are interdependent. Depending upon the size and complexity of the project, phases may be combined or may overlap. See Figure 1-1.
Figure 1-1
S y s t e m s D e v e l o p m e n t L i fe C y c l e ( S D L C ) L i f e - C y c l e P h a s e s
l*iVi;l*)MHt^M j *
i.is.iSiit-;* sivi$nii'i!i!«:
1|1,FS,U»*« i ••--iV.illvtM,.-:!!-.,. WCOmsKpiKW. ,
««i»«. • ' - • • " " « • * " " " " " " ~ ~ " in„ i , .n . .M. —*——• • * • * " h a - * * . * K » *m*m* I T , , , , , , . , . . . < _ » ~ t « • • — ..puMtfanOe. * •«»»* . ,„,„,», ""» " , l" ,„fc,.v„,», , I - I I - - | ' " < • - i„.i,<tas>,i™, 1.1—m n*"""""- 'TV. '" ' —nm»••««• , * r » _ i * « ~ * w *„.„,.,,„, - -, - ii I»IMI ,. in m i , c — w w i — • " " '""^ <•„«*» j i U n - - |
Analf i l l . Ufa* s ta in ing <*
***** a * l HMAtd K*
The SDLC encompasses ten phases:
Initiation Phase
The initiation of a system (or project) begins when a business need or opportunity is identified. A Project Manager should be appointed to manage the project. This business need is documented in a Concept Proposal. After the Concept Proposal is approved, the System Concept Development Phase begins.
84

System Concept Development Phase
Once a business need is approved, the approaches for accomplishing the concept are reviewed for feasibility and appropriateness. The Systems Boundary Document identifies the scope of the system and requires Senior Official approval and funding before beginning the Planning Phase.
Planning Phase
The concept is further developed to describe how the business will operate once the approved system is implemented, and to assess how the system will impact employee and customer privacy. To ensure the products and /or services provide the required capability on-time and within budget, project resources, activities, schedules, tools, and reviews are defined. Additionally, security certification and accreditation activities begin with the identification of system security requirements and the completion of a high level vulnerability assessment.
Requirements Analysis Phase
Functional user requirements are formally defined and delineate the requirements in terms of data, system performance, security, and maintainability requirements for the system. All requirements are defined to a level of detail sufficient for systems design to proceed. All requirements need to be measurable and testable and relate to the business need or opportunity identified in the Initiation Phase.
Design Phase
The physical characteristics of the system are designed during this phase. The operating environment is established, major subsystems and their inputs and outputs are defined, and processes are allocated to resources. Everything requiring user input or approval must be documented and reviewed by the user. The physical characteristics of the system are specified and a detailed design is prepared. Subsystems identified during design are used to create a detailed structure of the system. Each subsystem is partitioned into one or more design units or modules. Detailed logic specifications are prepared for each software module.
Development Phase
The detailed specifications produced during the design phase are translated into hardware, communications, and executable software. Software shall be unit tested, integrated, and retested in a systematic manner. Hardware is assembled and tested.
85

Integration and Test Phase
The various components of the system are integrated and systematically tested. The user tests the system to ensure that the functional requirements, as defined in the functional requirements document, are satisfied by the developed or modified system. Prior to installing and operating the system in a production environment, the system must undergo certification and accreditation activities.
Implementation Phase
The system or system modifications are installed and made operational in a production environment. The phase is initiated after the system has been tested and accepted by the user. This phase continues until the system is operating in production in accordance with the defined user requirements.
Operations and Maintenance Phase
The system operation is ongoing. The system is monitored for continued performance in accordance with user requirements, and needed system modifications are incorporated. The operational system is periodically assessed through In-Process Reviews to determine how the system can be made more efficient and effective. Operations continue as long as the system can be effectively adapted to respond to an organization's needs. When modifications or changes are identified as necessary, the system may re-enter the planning phase.
Disposition Phase
The disposition activities ensure the orderly termination of the system and preserve the vital information about the system so that some or all of the information may be reactivated in the future if necessary. Particular emphasis is given to proper preservation of the data processed by the system, so that the data is effectively migrated to another system or archived in accordance with applicable records management regulations and policies, for potential future access.
CONTROLS/ASSUMPTIONS
The IT Strategic Plan defines the strategic vision for using IT to meet business needs of the organization. The organization's Technical Reference Model (TRM) standards guidance provides standards for all IT systems funded by the organization. It applies to both the development of new systems and the enhancements of existing systems.
SDLC calls for a series of comprehensive management controls. These include:
• Life Cycle Management should be used to ensure a structured approach to information systems development and operation.
• Each system project must have an accountable sponsor. • A single project manager must be appointed for each system project.
86

• A comprehensive project management plan is required for each system project. • Data Management and security must be emphasized throughout the Life Cycle. • A system project may not proceed until resource availability is assured.
All system development would adhere to the organization's general policy on Information Resources Management, to include roles and responsibilities for information collection, resource management and privacy act requirements.
87

REFERENCES
1. Adams, D. A., Nelson R. R., and Todd P. A. (1992). Perceived Usefulness, Ease
of Use, and Usage of Information Technology: A Replication. MIS Quarterly,
Vol. 16, No. 2, pp. 227-247.
2. Applegate, L.M. , McFarlan, F.W. and McKenney, J.L. (2000). Corporate
Information Systems Management: Text and Cases. Chicago: Dow Jones-Irwin.
3. Udo Averweg (2002). Executive Information Systems Usage: The impact of
web-based technologies. Dissertation Research: University of Natal,
Pietermeritzburg.
4. Bandura, A. (1986). Social Foundation of Thought and Action: A social
Cognitive Theory. Englewood Cliffs, New Jersey: Prentice-Hall.
5. Bollen, K. A. and Long, J. S. (1993). Testing structural equation models.
London: Sage Publishing Inc.
6. Burkan, W. C. (1988). "Making EIS Work" in DSS 88 Transactions. The
Institute of Management Sciences, E Sue Weber (ed.), Providence, RI, pp. 121-
136.
7. Compeau, D. R., Higgins, C. A. (1995a). Application of social cognitive theory
to training for computer skills. Information Systems Research, Vol. 6, No. 2, pp.
118-143.
8. Compeau, D. R., Higgins, C. A. (1995b). Computer self-efficacy: Development
of a measure and initial test. MIS Quarterly, Vol. 19, No. 2, pp. 189-211.
9. Daft R. and Lengel R. (May, 1986). Organizational Information Requirements,
Media Richness and Structural Design. Management Science Vol. 32, No. 4, pp.
554-571.
10. Davenport, T.H. and Pearlson, K. (1998). Two cheers for the Virtual Office.
Sloan Management Review, Vol. 39, No. 4, pp. 51-65.
11. David Boddy, Albert Boonstra and Graham Kennedy (2002). Managing
Information Systems: An organisational perspective. Prentice Hall.
12. Davis, F. D. (1989). Perceived Usefulness, Ease of Use, and user acceptance of
Information Technology. MIS Quarterly, Vol. 13, No. 3, pp. 319-339.
13. Davis, F. D. (1993). User acceptance of information technology: System
characteristics, user perceptions and behavioural impacts. International Journal
of Man-Machine Studies, Vol. 38, pp. 475-487.
88

14. Davis, F. D. and Venkatesh, V. (1996). A critical assessment of potential
measurement biases in the technology acceptance model: Three experiments.
International Journal of Human-Computer Studies, Vol. 45, No.l, pp. 19-45.
15. Davis, F. D., Bagozzi, R. P. and Warshaw, P. R. (1989). User acceptance of
Computer Technology: A comparison of Two. Management Science, Vol. 35,
No. 8, pp. 982-1003.
16. DeLone, W. J. and McLean, E. R. (1992). Information Systems Success: A
quest for the dependent variable. Information Systems Research, Vol. 3, No. 1,
pp. 60-95.
17. Donald A. Marchand, Thomas H. Davenport and Tim Dickson (2000).
Mastering Information Management. Prentice Hall.
18. Druker P. F. (1988). The coming of the New Organization. Harvard Business
Review, Boston, Massachusetts, Vol. 88, No.l.
19. Ewusi-Mensah, K. and Przasnyski, Z. H. (1995). Learning from abandoned
Information Systems development projects. Journal of information technology,
Vol. 10, pp. 13-14.
20. Fitzgerald, B. (1998). Executive Information Systems without Executives.
(Internet 11).
21. Friend, D. (1986). Executive Information Systems: Successes, Failures,
Insights, and Misconceptions, DSS 86 Transactions. The Institute of
Management Sciences, Providence, RI, pp. 35-40.
22. Fuller-Love, N. and Cooper, J. (2000). Deliberate versus Emergent Strategies: A
case study in information technology in the post Office. International Journal of
Information Management, Vol. 20, pp. 209-223.
23. Hair, J. F., Anderson, R. E., Tatham, R. L. and Black, W. C. (1998).
Multivariate Data Analysis. New Jersey: Prentice-Hall Inc.
24. Hayduk, L. A. (1987). Structural Equation Modelling with LISREL: Essentials
and Advances. Baltimore and London : The John Hopkins University Press.
25. Houdeshel, G and Watson, H.J. (1987). The Management Information and
Decision Support (MIDS) System at Lockheed-Georgia. MIS Quarterly Vol.11,
No.l, pp. 127-140.
26. Houdeshel, G. (1990). Selecting Information for an EIS: Experiences at
Lockheed-Georgia. IEEE Computer Society, J. F. Nunamaker (ed.), Vol. 3, pp.
178-185.
89

27. Hugh J. Watson and Mark N. Frolick (1993). Determining Information
requirements for an EIS. MIS Quarterly, Vol. 17, No. 3, pp. 255-269.
28. Hugh J. Watson, Kelly Rainer R. Jr. and Chang Koh E. (1991). Executive
Information System: Framework for Development and a Survey of Current
Practices. MIS Quarterly, Vol. 15, No. 1, 13-30.
29. Ikart, M. E., A New Theoretical Foundation for the Study of Executive
Information. (Internet 12).
30. Jiang, J. J., Klein, G. and Discenza, R. (2002). Perception differences of
software success: Provider and user views of system metrics. Journal of
Systems and Software, Vol. 63, No. 1, pp. 17-27.
31. John Ward and Joe Peppard (3rd Edition ,2002). Strategic Planning for
Information Systems. John Wiley and Sons, Ltd.
32. Kaniclides T. and C. Kimble (1994). Executive Information System:
Framework for their Development and Use. (Internet 14).
33. Kaniclides T. and Kimble C. (1995). A Framework for the Development and
Use of Executive Information System. Proceedings of GRONICS '95,
Groningen, Netherlands, Ed T LOURENS, pp. 47-52.
34. Keen P. (1981). Information Systems and Organizational Change.
Communications of the ACM, Vol. 24, No.l, pp. 24 - 33.
35. Kogan, J. (1986). Information for Motivation: A key to Executive Information
Systems that translate strategy into results for management, DSS 86
Transactions. The Institute of Management Sciences, Providence, RI, pp. 6-13.
36. Kotter, J. P. (1982). What Effective General Managers Really Do. Harvard
Business Review, Vol. 60, No. 6, pp. 156-157.
37. Laudon, K. and Laudon, J. (5th Edition, 1998). Management Information
Systems: New Approaches to Organization and Technology. Pearson Prentice
Hall, 1998
38. Lloyd W. Belcher and Hugh J. Watson (1993). Assessing the Value of Conoco's
EIS. MIS Quarterly, Vol. 17, No. 3, pp. 239-253.
39. Malone, T. W. (1981a). Toward a theory of intrinsically motivating instruction.
Cognitive Sciences, Vol. 5, No. 4, pp. 333-369.
40. Malone, T. W. (1981b). What makes computer games fun?. Byte, Vol. 6, No.
12, pp. 258-278.
90

41. McBride, N. (1997). The Rise and Fall of an Executive Information System: A
Case Study. Info System Journal, No. 7, pp. 277-287.
42. McGill, T. and Hobbs, V. (2003). User-Developed Applications and
Information Systems Success: A test of DeLone and McLean's Model.
Information Resources Management Journal, Vol. 16, No.l, pp. 24-45.
43. Mintzberg H. (1975). The Manager's Job: Folklore and Fact. Harvard Business
Review, Vol. 53, No. 4, pp. 49-61.
44. Mintzberg, H. (1973). The Nature of Managerial Work. Organization Studies,
Vol. 25, No. 4, pp. 583-606.
45. Mintzberg, H. (1991). The Strategy Process: Concepts, Context, Cases. Hemel,
Hempstead: Prentice Hall International.
46. Newman, M and Sabherwal, R. (1996). Determinants of commitment to
information systems development: A longitudinal investigation. MIS Quarterly,
Vol., No., pp. 23-54.
47. Orlikowski W. J. and Robey D. (1991). Information Technology and
Structuring of Organizations. Information Systems Research, Vol. 2, No. 3141,
pp.
48. Paul Beynon-Davies (2002). Information Systems: An introduction to
informatics in Organizations. Palgrave.
49. Pijpers, G. G. M. (2001). Understanding Senior Executives' Use of Information
Technology and the Internet. Anandarajan and Simmers (eds), Managing Web
Usage in the Workplace: A Social, Ethical and Legal Perspective. Hershey, PA,
USA: Idea Group Publishing.
50. Poon, P. and Wagner C. (2001). Critical success factors revisited: Success and
failure cases of information systems for senior executives. Decision Support
Systems, Vol. 30, No. 4, pp. 393-418.
51. Rai, A., Lang, S. S. and Welker, R. S. (2002). Assessing the Validity of IS
Success Modeld: An Empirical Test and Theoretical Analysis. Information
Systems Research, Vol. 13, No. 1, pp. 50-69.
52. Reynaldo J. and Santos A. (1999). Cronbach's Alpha: A Tool for assessing the
Reliability of scales. Journal of Extension (online), Vol. 37, No.2, pp. 1-5.
53. Robey, D. (1979). User Attitude and Management Information System Use.
Academy of Management Journal, Vol. 22, No. 3, pp. 527-538
91

54. Rockart, J.F. and Delong, D.W (1988). Executive Support Systems: The
Emergence of Top Management Computer Use. Homewood, Illinois: Dow
Jones-Irwin.
55. Salmeron J. L. and Herrero, I. (2004). An AHP-based methodology to rank
critical success factors of executive information systems. Computer Standards
and Interfaces. (Internet 13).
56. Scarbrough, H. and Swan, J. (1999). Case Studies in Knowledge Management.
California Management Review, Vol. 41, No. 20, pp. 95-107.
57. Seddon, P. B. (1997). A re-specification and extension of the DeLone and
McLean model of IS success. Information Systems Research, Vol. 8, pp. 240-
253.
58. Seddon, P. B. and Kiew, M. Y. (1994). A partial test and development of
DeLone and McLean's model of IS success. Proceedings, International
Conference, Information Systems, Vancouver, Canada, pp. 99-110
59. Stecklow, S. (1989). The New Executive Information Systems. Lotus, pp. 51-
53.
60. Straub, D., Keil, M. and Brenner, W. (1997). Testing technology acceptance
model across cultures: A three countries study. Information and Management,
Vol. 33, pp. 1-11.
61. Szajna, B. (1993). Determining Information System Usage: Some Issues and
Examples. Information and Management, Vol. 25, pp. 147-154.
62. Thodenius, B. (1995), The Use of Executive Information System in Sweden.
"CEMS Academic Conference - Recent Development in Economics &
Business Administration" at the Wirchaftsuniversitat Wien, Austra, April 20-22.
63. Van der Heijden, H. (2003). Factors influencing the usage of websites: The case
of a generic portal in the Netherlands. Information and management, Vol. 40,
pp. 541-549.
64. Venkatarman, N. (1998). IT agenda 2000. Not fixing technical bugs but creating
business value. European Management Journal, Vol. 16, No. 5, pp. 573-585.
65. Venkatesh V. (2000). Determinants of Perceived Ease of Use: Integrating
Control, Intrinsic Motivation, and Emotion into the Technology Acceptance
Model. Information Systems Research, Vol. 11, No. 4, pp. 342-365.
92

66. Venkatesh, V. and Davis, F. D. (2000). A theoretical extension of the
technology acceptance model: Four longitudinal field studies. Management
Science, Vol. 46, No. 2, pp. 186-204.
67. Volonino L. and Watson H. J. (1990-91). The Strategic Business Objective
Method for Guiding Executive Information System Development. Journal of
Management Information Systems, Vol. 4, No. 4, pp. 27-39.
68. Webster, J. and Martocchio, J. J. (1992). Microcomputer Playfulness:
Development of Measures with Workplace Implications. MIS Quarterly Vol.
16, No. 2, pp. 201-226.
69. Wessels, P.L., Grobbelaar, E. and McGee A. (2003). Information Systems in
South African, Business Environment. Durban: LexisNexis Butterworths.
70. Young, D. and Watson, H. J. (1995). Determinants of EIS Acceptance.
Information and Management, Vol. 29, pp. 153-164.
71. Zmud, R. W. (1986). Supporting senior executives through Decision Support
Technologies: A review and directions for future research in Decisions Support
Systems: A Decade in Perspective. E. R. McLean and H. G. Sol (eds.), Elsevier
Science Publishers B. V., pp. 87-101.
Internet
Internet 1: www.gartner.com/resources/109100/109114/executive summa.pdf Internet 2: www-users.cs.york.ac.uk/~kimble/research/ak/eis.html Internet 3: http://www.unilever.com/companv/ourcompany/unilever at a glance/ Internet 4: www.qualitative-research.net/fqs-texte/l-01/l-01iakob-e.htm). Internet 5: http://www.unilever.com/companv/ourhistory/ Internet 6: http://www.unilever.com/investorcentre/quarterlvresults/2003/ Internet 7: www.unilever.com Internet 8: http://www.unilever.com/mediacentre/finance/pathtogrowthsummaryupdate/default.asp
Internet 9: http://www.unilever.com/company/ourcompany/unilever at a glance/ Internet 10: http://ioe.org/ioe/1999april/tt3.html Internet 11: www.csis.ul.ie/staff/bf/eisl.pdf Internet 12: www.uow.edu.au/commerce/infosys/wpaper.html Internet 13: www.elsevier.eom/locate/csi/10.1016/i.csi.2004.09.002 Internet 14: www.uark.edu/rd vcad/urel/publicatioris/research frontiers/fall 2003/15 70.htm Internet 15: http://irp.savstate.edu/irp/glossary/correlation.html Internet 16: http://www.usdoj.gov/imd/irm/lifecycle/ch 1 .htm#paral
93