executive budget: five-year capital program and financing plan
TRANSCRIPT

EXECUTIVE BUDGET FIVE-YEAR CAPITAL PROGRAM
AND FINANCING PLAN
CONTENTS INTRODUCTION ................................................................................................................ 3 OVERVIEW .......................................................................................................................... 7 EXECUTIVE SUMMARY ................................................................................................ 11 Proposed Debt Management Initiatives ............................................................................ 11 Capital Projects Spending Recommendations .................................................................. 12 Debt Affordability Summary ............................................................................................ 15 Financing of Capital Spending ......................................................................................... 16 Debt Levels ........................................................................................................................ 17 Debt Service ...................................................................................................................... 19 Debt Issuances ................................................................................................................... 21 Debt Retirements ............................................................................................................... 22 DEBT AFFORDABILITY ................................................................................................. 27 State Debt as a Percent of Personal Income Since 1998-99 ............................................ 27 State Debt Since 1998-99 .................................................................................................. 28 State Debt Per Capita Since 1998-99 ............................................................................... 30 State Debt Service Since 1998-99 .................................................................................... 32 DEBT POLICY AND PORTFOLIO ............................................................................... 37 Debt Policy ........................................................................................................................ 37 State Debt Guidelines ........................................................................................................ 37 State Debt Obligations ...................................................................................................... 38 State Debt Portfolio Overview .......................................................................................... 40 Refundings ..................................................................................................................... 44 Available Information ................................................................................................... 45 CAPITAL SPENDING ...................................................................................................... 49 Multi-Year Overview ........................................................................................................ 49 Transportation ................................................................................................................... 52 Parks and Environment ..................................................................................................... 53 Economic Development and Government Oversight ...................................................... 55 Health and Social Welfare ................................................................................................ 56 Education ........................................................................................................................... 57
This document is available in electronic format at the New York State Division of the Budget web site: http://www.budget.state.ny.us/

CAPITAL SPENDING (continued) Public Protection ............................................................................................................... 58 Mental Hygiene ................................................................................................................. 59 General Government ......................................................................................................... 60 Other .................................................................................................................................. 61 AGENCY CAPITAL PROGRAM PLANS ..................................................................... 65 Transportation ................................................................................................................... 66 Parks and Environment ..................................................................................................... 71 Economic Development and Government Oversight ...................................................... 75 Health and Social Welfare ................................................................................................ 80 Education ........................................................................................................................... 83 Public Protection ............................................................................................................... 88 Mental Hygiene ................................................................................................................. 91 General Government ......................................................................................................... 95 Other .................................................................................................................................. 98 DETAILED DATA ........................................................................................................... 101 Statutory Debt Limitations .............................................................................................. 101 The Debt Reform Act of 2000 .................................................................................... 101 Interest Rate Exchange Agreements and Variable Rate Exposure ............................ 102 Bond Authorizations ....................................................................................................... 104 State and Federal Pay-As-You-Go Financing ................................................................ 107 General Obligation Bond Financing ............................................................................... 112 State Revenue Bond Financing ....................................................................................... 113 Authority Bond Financing .............................................................................................. 114 Personal Income Tax Revenue Bond Program .............................................................. 116 Dedicated Highway and Bridge Trust Fund Summary Plan .......................................... 117 Capital Projects Funds Financial Plan ............................................................................ 118 State Debt Detail ............................................................................................................. 119 Debt Outstanding ......................................................................................................... 120 Debt Service ................................................................................................................. 123 Debt Issuances ............................................................................................................. 126 Debt Retirements ......................................................................................................... 128 Debt Service Funds Financial Plan ................................................................................. 131 Agency Summary Five-Year Capital Tables .................................................................. 132 Transportation Transportation, Department of ................................................................................ 133 Motor Vehicles, Department of ............................................................................... 135 Thruway Authority, New York State ...................................................................... 136 Metropolitan Transportation Authority ................................................................... 137 Parks and Environment Environmental Conservation, Department of ......................................................... 138 Environmental Facilities Corporation ..................................................................... 140 Hudson River Park Trust ......................................................................................... 141 Parks, Recreation and Historic Preservation, Office of .......................................... 142 Economic Development and Government Oversight Agriculture and Markets, Department of ................................................................ 143 Empire State Development Corporation ................................................................. 144 Economic Development Capital (Miscellaneous) .................................................. 145

Economic Development and Government Oversight (continued) Strategic Investment Program (Miscellaneous) ...................................................... 146 Science, Technology and Innovation, Foundation for ............................................ 147 Economic Development Program, New York State (Miscellaneous) ................... 148 Javits Convention Center Program, New York State (Miscellaneous) .................. 149 High Technology and Development Program (Miscellaneous) ............................. 150 Regional Economic Development Program (Miscellaneous) ................................ 151 Olympic Regional Development Authority ............................................................ 152 Energy Research and Development Authority, New York State ........................... 153 Housing and Community Renewal, Division of ..................................................... 154 Health and Social Welfare Children and Family Services, Office of ................................................................ 155 Health, Department of ............................................................................................. 156 Temporary and Disability Assistance, Office of .................................................... 157 Education Education Department, State ................................................................................... 158 State University of New York ................................................................................. 159 City University of New York .................................................................................. 160 Higher Education Facilities Capital Matching Grants Program (Miscellaneous) .................................................................................................... 161 Public Protection Correctional Services, Department of ..................................................................... 162 State Police, Division of .......................................................................................... 163 Military and Naval Affairs, Division of .................................................................. 164 Homeland Security (Miscellaneous) ....................................................................... 165 Mental Hygiene Mental Health, Office of .......................................................................................... 166 Mental Retardation and Developmental Disabilities, Office of ............................. 167 Alcoholism and Substance Abuse Services, Office of ........................................... 168 General Government General Services, Office of ..................................................................................... 169 State, Department of ................................................................................................ 170 Technology, Office for ............................................................................................ 171 Other Judiciary ................................................................................................................... 172 World Trade Center (Miscellaneous) ...................................................................... 173 State Equipment Finance Program (Miscellaneous) .............................................. 174 Summary of Projected Appropriations, All Funds, All Programs by Fund Type and Major Fund, 2008-2009 through 2012-2013 ................................................... 175 Detailed Agency Five Year Capital Tables .................................................................... 177 Transportation Transportation, Department of ................................................................................ 178 Motor Vehicles, Department of ............................................................................... 190 Thruway Authority, New York State ...................................................................... 191 Metropolitan Transportation Authority ................................................................... 192 Parks and Environment Environmental Conservation, Department of ......................................................... 193 Environmental Facilities Corporation ..................................................................... 209 Hudson River Park Trust ......................................................................................... 210 Parks, Recreation and Historic Preservation, Office of .......................................... 211

Economic Development and Government Oversight Agriculture and Markets, Department of ................................................................ 215 Empire State Development Corporation ................................................................. 216 Economic Development Capital (Miscellaneous) .................................................. 218 Strategic Investment Program (Miscellaneous) ...................................................... 219 Science, Technology and Innovation, Foundation for ............................................ 220 Economic Development Program, New York State (Miscellaneous) ................... 221 Javits Convention Center Program, New York State (Miscellaneous) .................. 222 High Technology and Development Program (Miscellaneous) ............................. 223 Regional Economic Development Program (Miscellaneous) ................................ 224 Olympic Regional Development Authority ............................................................ 225 Energy Research and Development Authority, New York State ........................... 226 Housing and Community Renewal, Division of ..................................................... 227 Health and Social Welfare Children and Family Services, Office of ................................................................ 231 Health, Department of ............................................................................................. 235 Temporary and Disability Assistance, Office of .................................................... 237 Education Education Department, State ................................................................................... 238 State University of New York ................................................................................. 240 City University of New York .................................................................................. 242 Higher Education Facilities Capital Matching Grants Program (Miscellaneous) .................................................................................................... 244 Public Protection Correctional Services, Department of ..................................................................... 245 State Police, Division of .......................................................................................... 249 Military and Naval Affairs, Division of .................................................................. 251 Homeland Security (Miscellaneous) ....................................................................... 253 Mental Hygiene Mental Health, Office of .......................................................................................... 254 Mental Retardation and Developmental Disabilities, Office of ............................. 260 Alcoholism and Substance Abuse Services, Office of ........................................... 264 General Government General Services, Office of ..................................................................................... 268 State, Department of ................................................................................................ 272 Technology, Office for ............................................................................................ 273 Other Judiciary ................................................................................................................... 274 World Trade Center (Miscellaneous) ...................................................................... 275 State Equipment Finance Program (Miscellaneous) .............................................. 276 Dedicated Highway and Bridge Trust Fund Detail......................................................... 277 Increasing Opportunity for Minority and Women-Owned Business Enterprises .......287

INTRODUCTION


INTRODUCTION
The Capital Program and Financing Plan (the “Plan”) is intended to provide a single, comprehensive report on State debt levels, debt service costs and capital projects spending. The Plan is published twice annually – with the Executive Budget and the Enacted Budget – and key data are also updated with each Quarterly Financial Plan Update.
The Plan, which includes historical trends and provides detailed information for the
period from 2007-08 through 2012-13, is separated into major sections as follows: ● The Overview provides a high-level summary, including key debt and capital
spending measures. ● The Executive Summary provides highlights of the key components of Executive
Budget recommendations, including overall capital spending and projected levels of debt service costs, debt outstanding, new debt issuances, and debt retirements.
● Debt Affordability includes information related to the State’s historical and projected debt levels and debt service costs, as well as detailed comparisons to objective affordability measures.
● The Debt Policy and Portfolio explains the State’s overall debt policy, current guidelines, information on the reporting of State debt, the levels of fixed and variable rate debt, refundings, and places to find additional information.
● Capital Spending provides annual estimates of capital spending by agency and program, and describes agency capital goals, objectives, and capital maintenance efforts.
COMPREHENSIVE REPORTING OF STATE DEBT
This Plan provides information on State-supported debt and the more comprehensive measure of State-related debt: State-supported debt includes general obligation debt approved by the voters as well as debt issued on behalf of the State by public authorities, where the State is contractually obligated to pay debt service, subject to appropriation. State-related debt is more comprehensive and includes the State-supported debt noted above, as well as State-guaranteed debt, moral obligation financings and certain contingent-contractual obligation financings, where debt service is paid from non-State sources and State appropriations are available, but not expected to be needed, to make payments. State-related debt levels reported in this Plan are cash-basis amounts and reflect all debt issued by the State (including blended component units) for government activities and business-type activities as defined in the Comprehensive Annual Financial Report published by the State Comptroller. The Plan does not include debt that is issued by, or on behalf of, local governments that may be funded in part by State local assistance aid payments. For example, State support for programs such as school aid to local districts or aid for New York City may in turn be
3

INTRODUCTION
4
used by those local entities to help finance debt service for locally-sponsored and locally-determined financings. Since this debt was not issued by the State (or on behalf of the State), does not result in a State obligation to pay debt service, and is not considered State debt in the Comprehensive Annual Financial Report of the State, it is not included in this Plan. Instead, this debt is reflected in the respective financial statements of the local governments responsible for the issuance of such debt. IMPROVING THE TRANSPARENCY OF NEW YORK STATE’S DEBT PORTFOLIO To increase the transparency of the State’s debt portfolio, the Division of the Budget (DOB) continues to provide information on its public website (http://www.budget.state.ny.us) to supplement this Plan and its companion which is published with the Enacted Budget. The Investor’s Guide section of the site contains detailed information on New York State bonds including: swap and variable rate capacity reports, variable rate trading activity, Personal Income Tax (PIT) revenue bond debt service and debt outstanding, and swaps performance reports. The information available on the site will continue to be expanded on a regular basis in an effort to provide the public with greater “real-time” access to the composition and performance of the State’s debt portfolio. Recent additions include an “insurance profile” which provides information on the amount of insurance and the firms who provide such insurance for State-related debt, and an annual swap performance report.

OVERVIEW


OVERVIEW The Capital Program and Financing Plan reflects the following highlights:
● Capital spending averages approximately $9.7 billion annually, with the largest spending for transportation (50 percent), education (18 percent), economic development (8 percent), mental hygiene and the environment (6 percent each).
● A number of new or expanded capital initiatives are recommended with the
Executive Budget, including:
▪ Increased funding for maintenance and targeted initiatives for both the State University of New York (SUNY) and the City University of New York (CUNY)’s capital programs, including increasing spending on critical maintenance projects from $450 million to roughly $600 million annually.
▪ A comprehensive, $2.2 billion infrastructure and economic development
program that will support a new Upstate Revitalization Fund and provide critical investments in the downstate region and statewide to sustain growth and improve quality of life. The program includes the following:
− A total of $1.0 billion will be invested in the upstate region, including $942
million of capital funding and $59 million of local assistance grants to: 1) finance city-by-city projects; 2) provide capital access for businesses, local governments, arts and cultural facilities and agribusiness; 3) finance supportive and affordable housing; and 4) provide resources for a new State and local bridge maintenance initiative.
− $1.2 billion for downstate and statewide investments including: 1) $300
million for supportive and affordable housing; 2) $200 million for distressed community revitalization; 3) $45 million for waterfront park improvements; 4) more than $650 million for other critical investments, including transportation enhancements on Manhattan’s west side and in the Hudson Valley; and 5) $60 million for statewide projects.
This $2.2 billion investment will be financed with a prudent balance of pay-as-you-go (PAYGO) capital and bond proceeds. Of the $2.2 billion, $1 billion will be financed through the sale of surplus properties currently held by the Office of Mental Health, Office of Mental Retardation and Developmental Disabilities and Jacob Javits Convention Center Development Corporation. In addition, $200 million of cash resources — $100 million from the release of reserve funds held by the State of New York Mortgage Agency and $100 million of new, full annual revenues from an auto insurance surcharge — will be used to support PAYGO spending. As a result, debt financing will be limited to $1 billion for the new program.
● Overall debt affordability measures are projected to remain relatively stable from
2007-08 through 2012-13:
▪ State-related debt (the most comprehensive measure) declines from 5.5 percent of personal income in 2007-08 to 5.3 percent in 2012-13.
7

OVERVIEW
8
▪ State-related debt service increases from 4.2 percent of the All-Funds Budget in 2007-08 to 4.9 percent in 2012-13.
▪ PAYGO spending remains at roughly 42 percent of overall capital spending.
● A variety of debt management initiatives are proposed to reduce debt service costs by $31 million in 2008-09.
● In light of the current fiscal challenges, certain programs that were previously PAYGO are planned for bond financing in 2008-09 only, including:
▪ $75 million for the Environmental Protection Fund (EPF). ▪ $65 million of systems development costs.
● State-related debt levels are projected to increase from $50.0 billion in 2007-08 to
$53.3 billion in 2008-09, an increase of $3.3 billion (6.6 percent). Over the Five-Year Plan, debt is projected to increase by 4.0 percent annually, to a total of $60.9 billion in 2012-13. The vast majority of the overall increase is for transportation ($4.5 billion), higher education facilities ($4.1 billion), school facilities through the Expanding our Children’s Education and Learning (EXCEL) program ($815 million) and economic development projects ($2.4 billion).
● Debt issuances of $6.0 billion are planned in 2008-09, primarily for transportation
($1.5 billion), economic development ($1.1 billion), higher education ($1.2 billion) and EXCEL school facilities ($650 million).
● Debt retirements (which reduce outstanding debt) are projected to total $2.7 billion
in 2008-09, primarily for transportation ($587 million), education ($520 million) and economic development and housing ($308 million).
● Debt service costs are projected to increase from $4.9 billion in 2007-08 to $5.3
billion in 2008-09, due primarily to increasing costs from capital investments in transportation, economic development and education.

EXECUTIVE SUMMARY


EXECUTIVE SUMMARY This section summarizes proposed debt initiatives, new capital spending recommendations and debt affordability measures, as well as five-year projections of capital spending, PAYGO revenues, debt levels, debt service costs, debt issuances and debt retirements. PROPOSED DEBT MANAGEMENT INITIATIVES
The Budget recommends a package of statutory and administrative reforms to enhance the State’s debt management practices, and generate an additional $31 million in total debt service savings in 2008-09. The recommendations include:
• Implementing refunding opportunities that meet the State’s savings criteria,
including consolidated service contract refundings.
• Applying swaps capacity to maximize savings, if market conditions are favorable.
• Continuing the increased use of competitive processes for bond sales and/or selection processes, with a goal of competitively selling about 25 percent of new debt issuances.
• Realigning the existing variable rate debt portfolio to best tailor the mix of the
lowest cost variable rate products while maintaining diversification. • Providing enhanced issuer flexibility for the PIT Program. This will result in
improved scheduling and sizing for PIT bond sales, producing savings through efficiencies in bond pricings and lower administrative costs.
• Consolidating all State-supported bond authorizations into a single provision of
law. This would ensure greater public knowledge about existing and proposed new bond authorizations, and ensure that all State debt authorizations and practices are conducted on a consistent and streamlined basis.
• Prohibiting the future use of State aid to entirely support locally determined
financings.
11

EXECUTIVE SUMMARY
12
CAPITAL PROJECTS SPENDING RECOMMENDATIONS
Recommended capital spending is projected to total $48.4 billion over the five-year period beginning in 2008-09, primarily to support transportation and higher education projects.
$48.4 Billion in Capital Spending Over Five Years
Mental Hygiene & Public Protection
(11%)
Other(9%)
Parks/Environment
(6%)
Higher Education(15%)
Transportation(50%)
Economic Development & Gov't Oversight
(9%)
Approximately $4.7 billion in new capital projects spending is included in the five-year
plan, primarily for SUNY, CUNY, and economic development.
Proposed New Capital Initiatives Beginning in 2008-09 ($ 4.7 Billion In Spending Over Five Years)
Parks/Environment $125 M
CUNY $1,043 M
SUNY $1,896 M
Transportation $427 M
Other $328 M
Economic Development $900 M
Transportation
The largest component (50 percent) of capital projects spending is for transportation projects. Spending increases annually from $4.4 billion in 2008-09 to $4.9 billion in 2012-13 and reflects commitments from the existing Department of Transportation (DOT) five-year plan. Also included is a new bridge maintenance initiative, with projected spending of $42 million in 2008-09, increasing to $95 million annually in 2009-10.

EXECUTIVE SUMMARY
13
Education The 2008-09 Executive Budget recommends spending of almost $8.6 billion over the five-year Plan for education (18 percent), which includes spending for SUNY, CUNY, EXCEL and State Education (SED) projects. Disbursements for ongoing higher education projects are projected at almost $4.2 billion and include $356 million for SUNY residence facilities, $106 million for SUNY community colleges, $2.2 billion for SUNY senior college academic facilities and hospitals, as well as $1.4 billion for CUNY senior and community colleges. Also included is $140 million for higher education capital matching grants. Most of the ongoing projects reflect existing commitments to maintain the physical plant. SUNY State-operated campuses include approximately 2,100 buildings encompassing classrooms, dormitories, libraries, research laboratories, athletic and recreation facilities, hospitals and dining halls. Currently, 73 percent of SUNY’s facilities exceed 30 years of age and are in need of renovation, rehabilitation and repair. CUNY projects encompass critical maintenance, health and safety, preservation and handicapped access projects, as well as ongoing projects at John Jay College and Medgar Evers College. Additional higher education project spending of approximately $2.9 billion is recommended through a new five-year Plan, including $1.9 billon for SUNY and $1 billion for CUNY. This includes $235 million for SUNY residence facilities, $93 million for SUNY community colleges, $1.6 billion for SUNY senior college academic facilities and hospitals, and $1.0 billion for CUNY senior and community colleges. This enhanced capital investment program for CUNY will provide for critical maintenance needs and strategic priorities of senior colleges and community colleges, while the SUNY spending will fund critical maintenance projects, academic and residence facilities, laboratories, hospitals, and other projects at community colleges. This additional higher education spending is estimated to begin at $121 million in 2008-09, and increase to $245 million in 2009-10, $468 million in 2010-11, $867 million in 2011-12, and to $1.2 billion in 2012-13. Projected spending for other education projects is for SED and EXCEL. Remaining spending for EXCEL, a State-funded school construction initiative, is projected to total $1.3 billion during the next two fiscal years. SED projects will total approximately $140 million over the next five years and includes supplemental projects for public library construction ($14 million); expansion of the State Records Center ($12.6 million); collections preservation and stewardship at the Cultural Education Center ($24.1 million); and various projects at the Batavia School for the Blind, SED facilities, and the Rome School for the Deaf ($5.9 million). Economic Development Economic Development spending is projected at almost $4.0 billion during the new Plan and represents 8 percent of total capital spending. A total of $2.2 billion of initiatives is proposed with the Budget to support a variety of statewide economic development initiatives. Of this amount, up to $900 million is expected to be funded by a combination of sources including the sale of property at the Jacob K. Javits Convention Center site. Funds generated from the release of reserves and the sale of property will be spent directly from non-State accounts and, therefore, are not reflected in the spending estimates contained in this Plan. The new Upstate Revitalization Fund, a targeted and comprehensive infrastructure and economic development plan with initiatives and programs targeted to

EXECUTIVE SUMMARY
14
stimulate the upstate economy, will be financed with $942 million in capital funding sources as well as local assistance funds for a total program of up to $1.0 billion. The new on-budget components of the capital funded economic development initiatives are expected to be fully spent over the five-year Plan as follows: $90 million in 2008-09, $225 million in 2009-10, $270 million in 2010-11, $225 million in 2011-12, and $90 million in 2012-13. Over $2.5 billion is projected to be spent for a variety of projects including support of an international computer chip research and development center ($240 million), capital improvements at Governor’s Island and Roosevelt Island in New York City ($24 million), redevelopment initiatives at the Harriman Research and Technology Park and in Niagara Falls ($11 million), and specific economic development, cultural facilities, university development, environmental, and energy projects administered by Empire State Development Corporation (ESDC) and Dormitory Authority of the State of New York (DASNY), including $650 million for the development of a semiconductor manufacturing facility, $425 million for technology and economic development programs, $300 million for renovation of the Javits Center, and $300 million for the Restore NY Communities Initiative. Parks and Environment Parks and Environment spending comprises $3.1 billion (6 percent) of the projected spending over the Plan and includes ongoing projects to protect and maintain the State’s water and air quality, eliminate instances of hazardous waste, and protect State parks and lands. New spending of $110 million is recommended in parks to address critical infrastructure needs ($102 million), and the Walkway Over the Hudson River ($8 million). This spending is expected to be completed quickly, with $75 million being disbursed in 2008-09 and the $35 million balance in 2009-10. All Other The remaining five-year spending of approximately $8.7 billion (18 percent) is for projects in the areas of public protection, mental hygiene, health and social welfare and general government. Most of the projected spending is for ongoing needs that were included in previous Plans. This includes roughly $2.0 billion for public protection facilities and $3.1 billion for mental hygiene projects. New spending recommendations include a consolidated program to finance major information systems research and development, and expanded development of community mental hygiene facilities. Spending for the systems development is projected at $65 million in 2008-09, $104 million in 2009-10, $81 million in 2010-11, $57 million in 2011-12, and $40 million in 2012-13. The new mental hygiene spending is estimated to disburse $3 million in 2008-09, growing to $14 million in 2010-11, with the final $5 million disbursed in 2012-13.

EXECUTIVE SUMMARY
15
DEBT AFFORDABILITY SUMMARY State debt levels and costs continue to remain affordable, based on a variety of debt
measures commonly used by the financial community. Some key measures are summarized below. All measures reflect the total level of State-related debt issued for all State purposes as described in the Introduction of this Plan. A more detailed analysis of affordability measures appears later.
The State debt projections from 2007-08 to 2012-13 reflect a 4.0 percent average annual increase in debt levels and a 4.8 percent annual average increase in statewide personal income. As a result, debt as a percentage of personal income is expected to decline gradually over the five-year plan period.
State-Related Debt as a Percent of Personal Income
5.3%5.5%
5.7%5.7%
5.7%
5.5%
2007-08 2008-09 2009-10 2010-11 2011-12 2012-13
Total State-related debt as a percent of personal income is projected to decline from 5.5 percent in 2007-08 to 5.3 percent in 2012-13.
From 2007-08 through 2012-13, debt service costs are projected to increase by an average of 7.6 percent annually, while net All Funds receipts are projected to grow by 4.2 percent annually. Thus, debt service costs are projected to grow to 4.9 percent of the All Funds budget and 7.4 percent of the State Operating budget.

EXECUTIVE SUMMARY
16
State-Related Debt Service as a Percent of All Funds Budget
4.2%4.3%
4.5% 4.8%
4.9%
4.9%
2007-08 2008-09 2009-10 2010-11 2011-12 2012-13
Total State-related debt as a percent of All Funds Budget is projected to increase from 4.2 percent in 2007-08 to 4.9 percent in 2012-13.
As explained in more detail below and later in this Plan, the level of projects financed with cash from both State and Federal sources of PAYGO is expected to fluctuate, but average roughly 42 percent of total capital spending over the five-year plan.
Pay-As-You-Go and Bond Financed Capital Disbursements
39.9% 39.6%42.6% 44.2% 44.7%
37.8%
60.1% 57.4% 55.8% 55.3%62.2% 60.4%
0.0%
10.0%
20.0%
30.0%
40.0%
50.0%
60.0%
70.0%
2007-08 2008-09 2009-10 2010-11 2011-12 2012-13
State & Federal Pay-As-You-Go
Authority and GO
FINANCING OF CAPITAL SPENDING
The State utilizes Federal and State PAYGO resources and issues bonds (both directly and through public authorities) to finance capital spending. The amounts for All Governmental Funds spending includes both those capital projects disbursements that are reflected in the Comptroller’s accounting system and those disbursements which would

EXECUTIVE SUMMARY
17
have formerly been made directly from bond proceeds which had been reflected only in the Generally Accepted Accounting Principles (GAAP) accounting statements. The types and amounts of financing used to support this capital spending is summarized below. As noted, in 2008-09 roughly 38 percent of all capital spending is projected to be financed with State and Federal PAYGO resources, while 62 percent is projected to be financed with authority-issued bond proceeds and voter-approved general obligation bonds.
CAPITAL SPENDING BY FUNCTION AND FINANCING SOURCE CAPITAL PROGRAM AND FINANCING PLAN
2007-2008 THROUGH 2012-2013 (thousands of dollars)
Spending 2007-2008 2008-2009 2009-2010 2010-2011
Transportation 4,023,886 4,415,846 4,801,245 4,969,387
2011-2012
4,953,913
2012-2013
4,997,657Parks and Environment 586,003 667,740 633,003 590,503 588,191 590,503Economic Development & Gov't. Oversight 929,032 1,217,816 1,190,830 905,301 655,373 366,290Health and Social Welfare 292,098 348,048 286,303 334,413 157,480 76,480Education-EXCEL 1,000,000 750,000 554,000 0 0 0Education-All Other Programs 1,060,055 1,355,446 1,360,212 1,426,854 1,502,222 1,633,905Public Protection 313,284 395,468 384,005 406,280 398,800 398,800Mental Hygiene 407,320 602,977 736,865 590,430 601,747 582,572General Government 123,859 148,542 181,893 284,163 195,380 193,501Other 101,000 196,000 262,950 205,150 154,582 120,000
8,959,708
1,438,758
Total 8,836,537 10,097,883 10,391,306 9,712,481 9,207,688
GAAP Spending 2,191,832 2,170,568 1,949,536 1,264,423 1,353,174
Net Cash Spending 6,644,705 7,927,315 8,441,770 8,448,058
Financing Source 2007-2008 2008-2009 2009-2010 2010-2011
State Pay-As-You-Go 1,636,720 1,845,364 2,114,540 2,205,570
7,854,514
2011-2012
2,178,305
7,520,950
2012-2013
2,111,184Federal Pay-As-You-Go 1,885,048 1,972,922 1,998,362 1,931,307 1,894,471 1,892,231General Obligation Bonds 310,905 471,786 614,587 660,613 513,364 455,435Authority Bonds 5,003,864 5,807,811 5,663,817 4,914,991 4,621,548 4,500,858
8,959,708 Total 8,836,537 10,097,883 10,391,306 9,712,481
9,207,688
DEBT LEVELS The State’s debt levels are the result of three factors: (i) the amount of debt issued in prior years (ii) the amount of new debt that is planned to be issued during the forecast period and (iii) the amount of debt that is planned to be retired (paid off) during the forecast period.

EXECUTIVE SUMMARY
Projected Debt Outstanding(millions of dollars)
Existing State-Related Debt Outstanding2007-08 2008-09 2009-10 2010-11 2011-12 2012-13
47,735 45,218 42,477 39,763 36,573 33,374 (as of 1/10/08)Total New Debt Economic Development 773 1,723 2,621 3,350 3,851 4,019 Transportation 405 1,459 2,574 3,801 5,105 6,428 EXCEL (School Construction) 0 629 1,121 1,081 1,040 996 SUNY/CUNY 0 1,149 2,453 3,795 5,154 6,595 All Other 1,078 3,120 5,061 6,879 8,268 9,529
Total State-Related Debt Outstanding $49,991 $53,299 $56,308 $58,670 $59,991 $60,942
18
Five-Year Increase in State-Related Debt Outstanding
(millions of dollars)
2007-08 Debt Outstanding 49,991
Total Debt Increases / (Decreases) 10,951 Transportation 4,465 Economic Development & Housing 2,431 Higher Education 4,056 EXCEL 815Health & Mental Hygiene 1,544 State Facilities & Equipment 852Tobacco & LGAC (2,884)All Other (328)
2012-13 Debt Outstanding 60,942
The vast majority of the five-year increases in debt (4.0 percent annual growth) is for
transportation, higher education, economic development programs, and includes recommended increases for economic development projects and higher education facilities described earlier. More detail is provided later in this Plan. The $53 billion of State-related debt in 2008-09 consists of debt issued for each of the major programmatic areas as summarized below. The debt of the Local Government Assistance Corporation (LGAC) (issued to eliminate seasonal borrowing) and Tobacco bonds (issued to stabilize finances after September 11th) are not allocable to any specific functional area since they served a statewide purpose.

EXECUTIVE SUMMARY
19
Debt Outstanding by Function$53 Billion Projected at March 31, 2009
Education23%
Corrections & State Facilities
11%
Tobacco7%
Health & Mental Hygiene
9%
Transportation27%
Other2%
EcDev & Housing9%
LGAC 7%
Environment5%
The graph below portrays the same level of debt outstanding, but allocates it by type of borrowing mechanism or credit structure, rather than by program. As the State continues to issue bonds using the lower-cost PIT credit, it is expected that the debt outstanding for service contract bonds will decline, while the PIT revenue debt will increase. Analyses later in this Plan provide more detail on the components and types of State debt.
Debt Outstanding by Credit Structure$53 Billion Projected at March 31, 2009
Tobacco7%
LGAC7%
Other2%
Service Contract26%
PIT Revenue28%
General Obligation6%
Dedicated - Transportation
13%
SUNY Dorm Income
2%
Health & Mental Hygiene
9%
DEBT SERVICE
The State’s debt service costs consist primarily of payments to meet obligations for bonds issued over the past 30 years, as well as new debt service costs that will result from bond issuances projected to occur during the forecast period. The following table summarizes the State’s existing debt service costs, and new debt service costs resulting from planned new issuances from 2007-08 through 2012-13:

EXECUTIVE SUMMARY
20
Projected Debt Service(millions of dollars)
Existing State-Related Debt Service2007-08 2008-09 2009-10 2010-11 2011-12 2012-13
4,880 4,894 4,863 4,979 4,838 4,723 (as of 1/10/08)Total New Debt Service Economic Development 0 89 207 317 399 476 Transportation 0 78 165 263 373 490 EXCEL (School Construction) 0 35 79 92 92 92 SUNY/CUNY 0 62 149 244 343 446 All Other 0 122 315 505 689 824
Total State-Related Debt Service $4,880 $5,281 $5,779 $6,399 $6,733 $7,051
The following charts summarize the major debt service costs by both function and
financing program.
Debt Service by Function$5.3 Billion Projected in 2008-09 Budget
Education22%
Health & Mental Hygiene
7%
LGAC 7%
Transportation25%
EcDev & Housing9%
Corrections & State Facilities
11%Other2%
Environment7%
Tobacco10%
.

EXECUTIVE SUMMARY
21
Debt Service by Credit Structure$5.3 Billion Projected in 2008-09 Budget
Dedicated - Transportation
11%
SUNY Dorm Income
1%
PIT Revenue22%
Other2%
General Obligation9%
Tobacco10%
Health & Mental Hygiene Revenue
7%
Service Contract31%
LGAC7%
Significant bond-financed capital investments, primarily for transportation, education, corrections and economic development drive most of the State’s debt service costs.
The vast majority of debt service costs are for bonds issued on the State’s behalf by
public authorities. As the State continues to issue bonds using the PIT credit, it is expected that debt service for service contract bonds will decline, while the PIT revenue program debt service will increase. DEBT ISSUANCES
Projected debt issuances will finance capital investments authorized in the five-year Transportation Plan, the five-year Higher Educational Facilities Plan, to protect the environment, enhance the State’s economic development, and to preserve correctional and mental hygiene facilities. New debt issuances are projected to average about $5.5 billion annually.
The following pie charts provide a distribution of the projected debt issuances for
2008-09 by both functional area and financing program.

EXECUTIVE SUMMARY
22
2008-09 Debt Issuances by Function$6.0 Billion Projected
EXCEL11%
Transportation24%
Corrections & State Facilities
9%
Health & Mental Hygiene
10%
Environment7%
Higher Education20%
EcDev & Housing19%
2008-09 Debt Issuances by Credit Structure
$6.0 Billion Projected
PIT Revenue69%
SUNY Dorm Income
2%
Health & Mental Hygiene Revenue
9%
Dedicated - Transportation
12%
General Obligation8%
Consistent with recent experience, education (higher education and EXCEL), transportation, and economic development projects are projected to result in roughly 74 percent of new issuances. For the Plan period, the PIT credit has replaced all of the State’s service contract bonding, and is projected to compromise over three-fourths of all new State bond issuances. The remaining one-fourth is divided between general obligation bonds and other revenue credits. DEBT RETIREMENTS
Retirements represent the annual repayment of principal for State-related debt as of the payment date due to bondholders, rather than the actual date the State makes the cash payment. For example, if principal payments are due on April 1, the bonds are considered outstanding on March 31, even if the State is contractually obligated to make payments to the trustee prior to that date. The following pie charts provide a distribution of projected debt retirements by both functional area and financing program.

EXECUTIVE SUMMARY
23
Debt Retirements by Function$2.7 Billion Projected in 2008-09 Budget
EcDev & Housing
12%
Education19%
Corrections & State Facilities
10%
Tobacco12%
Other2%
Transportation22%
Environment10%
LGAC 6%
Health & Mental Hygiene
7%
Debt Retirements by Credit Structure
$2.7 Billion Projected in 2008-09 Budget
General Obligation
13%
Tobacco12%
Dedicated - Transportation
7%
Health and Mental Hygiene
Revenue7%
SUNY Dorm Income
1%
PIT Revenue23%
LGAC6%
Other2%
Service Contract29%
The rate at which State-related debt is retired or paid off has a significant impact on the
State’s ability to generate bond capacity to finance its capital programs. The term of new money bonds will continue to be no greater than the useful lives of the projects financed. In addition, a maximum of ten-year terms will continue to be used for taxable programs.
Retirements of State-related debt are projected to average $3.5 billion annually.
Retirements will increase for many of the State’s largest bonding programs, including those for Consolidated Highway Improvement Programs (CHIPs), SUNY, CUNY, the Department of Correctional Services (DOCS), and Mental Health.

DEBT AFFORDABILITY


DEBT AFFORDABILITY State debt levels and debt costs continue to remain affordable based on a variety of debt
measures commonly used by the financial community — debt as a percent of statewide personal income, debt per capita, and debt service costs as a percent of the All Funds budget.
As discussed in the Introduction, State debt is classified as either State-supported debt,
which includes both general obligation debt and debt issued on behalf of the State by public authorities, or State-related debt — a more comprehensive measure — which includes State-supported debt plus State-guaranteed debt, moral obligation debt and contingent-contractual financings, where debt service is paid from non-State sources. The following measures all utilize the more comprehensive State-related debt amounts.
DEBT AS A PERCENT OF PERSONAL INCOME SINCE 1998-99
State-Related Debt as a Percent of Personal Income
4.5%
5.0%
5.5%
6.0%
6.5%
7.0%
7.5%
8.0%
1998-99 2000-01 2002-03 2004-05 2006-07 2008-09 2010-11 2012-13
Total State-related debt as a percent of personal income is projected to decline
from 6.4 percent in 1998-99 to 5.3 percent in 2012-13.
State-related debt outstanding as a percentage of personal income is projected to
drop from 6.4 percent in 1998-99 to 5.3 percent in 2012-13. Much of the decline that occurs from 1998-99 through 2001-02 results from the elimination of the State’s moral obligation on some $4.2 billion in New York City Municipal Assistance Corporation (MAC) bonds. For a two-year period beginning in 2001-02, State-related debt outstanding increased as the State issued $4.5 billion in tobacco bonds to help address the fiscal crisis following September 11th. By the end of the fifth year of the Plan, debt outstanding as a percentage of personal income is projected to drop to its lowest level since 2001-02 as the combined result of controlled use of new bond financings and projected growth in personal income.
27

DEBT AFFORDABILITY
28
Between 1998 and 2006, New York’s debt as a percent of personal income decreased from 6.4 percent to 5.7 percent. New York’s experience of the last several years mirrors that of peer states, and reflects a national trend toward increased debt in response to fiscal stress following September 11th.
New York's Debt as a Percent of Personal Income Compared to Other States
6.4 %
5.7%
0123456789
10
1998 1999 2000 2001 2002 2003 2004 2005 2006
Perc
ent o
f Per
sona
l Inc
ome
Peer AverageU.S. AverageNew York
Note: Data points represent debt at the calendar year-end as a percent of the previous year’s personal income.
Source: Moody’s Investors Service, Inc. for peer states.
Peer states include: MA, CA, NJ, IL, FL, PA, OH, MI, TX, CT.
STATE DEBT SINCE 1998-99 The 3.5 percent average growth in State-related debt from 1998-99 to 2008-09 is above the 2.9 percent average annual growth in inflation, but below the 4.8 percent growth in personal income during that same time period.
Percent Growth in State-Related Debt Outstanding1998-99 through 2008-09
3.5%2.9%
4.8%
Debt Outstanding Personal IncomeInflation

DEBT AFFORDABILITY
29
As noted in the chart below, the above average increase in State debt in 2002-03 and 2003-04 is related primarily to the issuance of tobacco bonds to help respond to the fiscal impact of September 11th. The overall average increase during this time period (including tobacco bonds) is 3.5 percent.
Percent Change in State-Related Debt Outstanding
1.8% 2.3%
0.2%
-0.2%
5.0%
-0.1% 0.4%
2.5%3.9%
6.6%5.6%
4.2%
2.3%1.6%
15.4%
1998-99 2000-01 2002-03 2004-05 2006-07 2008-09 2010-11 2012-13
The following table provides the detailed data to support the earlier graphs.
State-Related Debt Outstanding, 1998-99 through 2006-07(millions of dollars)
1998-99 1999-00 2000-01 2001-02 2002-03Personal Income $591,847 $619,659 $663,005 $679,886 $677,605State-Related Debt Outstanding $37,699 $38,582 $38,661 $38,601 $40,531State-Related Debt Outstanding as a % of Personal Income 6.4% 6.2% 5.8% 5.7% 6.0%
2003-04 2004-05 2005-06 2006-07Personal Income $693,533 $739,795 $790,330 $848,745State-Related Debt Outstanding $46,773 $46,744 $46,927 $48,095State-Related Debt Outstanding as a % of Personal Income 6.7% 6.3% 5.9% 5.7%
Projected State-Related Debt Outstanding, 2007-08 through 2012-13(millions of dollars)
2007-08 2008-09 2009-10 2010-11 2011-12 2012-13Personal Income $907,112 $943,241 $986,579 $1,035,405 $1,087,763 $1,144,326State-Related Debt Outstanding $49,991 $53,299 $56,308 $58,670 $59,991 $60,942State-Related Debt Outstanding as a % of Personal Income 5.5% 5.7% 5.7% 5.7% 5.5% 5.3%

DEBT AFFORDABILITY
30
DEBT PER CAPITA SINCE 1998-99 The average annual growth in debt per capita is slightly higher than the growth in inflation over the past ten years.
Percent Growth in State Debt per Capita1998-99 through 2008-09
3.2%2.9%
0.3%
Debt Per Capita PopulationInflation
State-Related Debt per Capita
$1,000
$1,250
$1,500
$1,750
$2,000
$2,250
$2,500
$2,750
$3,000
$3,250
1998-99 2000-01 2002-03 2004-05 2006-07 2008-09 2010-11 2012-13
State-related debt per capita is projected to increase from $2,008 in
1998-99 to $3,149 in 2012-13.

DEBT AFFORDABILITY
31
State-related debt per capita is projected to increase from $2,008 in 1998-99 to $3,149 in 2012-13, an average annual increase of 3.2 percent. The State’s population is projected to remain relatively stable at approximately 19.3 million individuals, thus the projected increase over the Plan period results primarily from the issuance of new debt to fund new State capital projects, primarily for transportation, economic development and higher education projects.
$415$747
$852$974$1,020$1,101
$1,623$1,976
$2,491$3,317
$3,713$4,153
$0 $1,000 $2,000 $3,000 $4,000 $5,000
Texas
M ichigan
Pennsylvania
Ohio
Florida
U.S. Average
California
Illinois
New York
New Jersey
Connecticut
Massachusetts
2006 Total Per Capita State DebtNew York and Peer State Rankings
Source: Moody’s Investors Service, Inc. for peer states.
U.S. R
an k
1
2
4
5
710
21
24
41
26
20
As shown in the chart above, New York’s debt per capita of $2,491 ranks fifth highest in the nation. Connecticut, Massachusetts, Hawaii, and New Jersey have higher debt per capita ratios than New York. The following table provides the detailed data to support the earlier graphs.
State-Related Debt Per Capita, 1998-99 through 2006-07
(millions of dollars)1998-99 1999-00 2000-01 2001-02 2002-03
State-Related Debt Outstanding $37,699 $38,582 $38,661 $38,601 $40,531State Population (millions) 18.8 18.9 19.0 19.1 19.2State-Related Debt Per Capita $2,008 $2,042 $2,033 $2,021 $2,114
2003-04 2004-05 2005-06 2006-07State-Related Debt Outstanding $46,773 $46,744 $46,927 $48,095State Population (millions)State-Related Debt Per Capita
19.2 19.3 19.3 19.3$2,430 $2,423 $2,430 $2,491
Projected State-Related Debt Per Capita, 2007-08 through 2012-13(millions of dollars)
2007-08 2008-09 2009-10 2010-11 2011-12 2012-13State-Related Debt Outstanding $49,991 $53,299 $56,308 $58,670 $59,991 $60,942State Population (millions)State-Related Debt Per Capita
19.3 19.3 19.3 19.4 19.4 19.4$2,588 $2,757 $2,911 $3,031 $3,098 $3,149

DEBT AFFORDABILITY
32
DEBT SERVICE SINCE 1998-99 State-related debt service as a percentage of the All Funds Budget is projected to
decline from 5.2 percent in 1998-99 to 4.9 percent at the end of 2012-13. The sharp decline in 2002-03 and 2003-04 results from two factors: (i) the use of $1 billion in surplus moneys to eliminate high-cost debt which artificially increased debt service costs in the prior years and (ii) a series of refundings which took advantage of historically low interest rates. Due to the post-September 11th State deficits, most of the refundings were structured to provide maximum debt service savings over a three-to-five-year period. Beginning in 2004-05, debt service costs begin to rise again, due primarily to the end of the aforementioned refinancing savings, the restructuring of the Dedicated Highway Program, the issuance of Tobacco Bonds with a relatively short amortization period of 16 years, and the onset of the Transportation Bond Act of 2005 and bond-financed economic development projects.
State-Related Debt Service as a Percent of All Funds Budget
3.0%
3.5%
4.0%
4.5%
5.0%
5.5%
6.0%
1998-99 2000-01 2002-03 2004-05 2006-07 2008-09 2010-11 2012-13
Total State-related debt service as a percent of the All Funds Budget is
projected to decline from 5.2 percent in 1998-99 to 4.9 percent in 2012-13.

DEBT AFFORDABILITY
33
The 3.5 percent average annual rate of growth in debt service from 1998-99 through 2008-09 is slightly higher than inflation of 2.9 percent, but well below the 5.4 percent growth in State revenue (after tax cuts) during that same time period.
Percent Growth in State-Related Debt Service1998-99 through 2008-09
3.5%2.9%
5.4%
Debt Service All Funds BudgetInflation
Debt service growth is projected to average roughly 7.5 percent in the forecast period due to fewer refunding opportunities, the Dedicated Highway debt restructuring, continued support for education and economic development capital programs, and continued implementation of the Transportation Bond Act of 2005.
Percent Change in State-Related Debt Service
0.0%4.0%
12.4%
1.6%
-24.3%
-3.4%
17.4%
9.4% 10.7%
5.2% 4.7%
14.7%
8.2%
-2.5%
14.6%
1998-99 2000-01 2002-03 2004-05 2006-07 2008-09 2010-11 2012-13

DEBT AFFORDABILITY
34
The following table provides the detailed data to support previous graphs.
State-Related Debt Service, 1998-99 through 2007-08(millions of dollars)
1998-99 1999-00 2000-01 2001-02 2002-03All Funds Budget $72,551 $76,804 $83,527 $84,312 $88,274State-Related Debt Service $3,738 $3,887 $4,368 $4,437 $3,358State-Related Debt Service as a % All Funds Budget 5.2% 5.1% 5.2% 5.3% 3.8%
2003-04 2004-05 2005-06 2006-07All Funds Budget $99,698 $101,381 $107,027 $112,396State-Related Debt State-Related Debt
ServiceService as a % All Funds Budget
$3,847 $4,412 $4,264 $5,0043.9% 4.4% 4.0% 4.5%
Projected State-Related Debt Service, 2007-08 through 2012-13(millions of dollars)
2007-08 2008-09 2009-10 2010-11 2011-12 2012-13All Funds Budget $117,132 $123,567 $128,791 $133,913 $138,758 $144,173State-Related Debt Service $4,880 $5,281 $5,779 $6,399 $6,733 $7,051State-Related Debt Service as a % All Funds Budget 4.2% 4.3% 4.5% 4.8% 4.9% 4.9%

DEBT POLICY AND PORTFOLIO


DEBT POLICY AND PORTFOLIO DEBT POLICY The State’s overall debt policy goal is to ensure that debt levels and costs remain affordable, while providing the financing support necessary to proceed with critical capital investments. The State’s current policy is to reduce the total amount of outstanding debt to less than 4 percent of statewide personal income and reduce debt service costs to less than 5 percent of the overall budget. STATE DEBT GUIDELINES
A detailed report on current State debt management polices is available on DOB’s
website. Some key elements of the current policy include:
All new tax exempt State debt must utilize level debt service with a final maturity that is not greater than the projects’ useful lives, but in no event longer than 30 years.
Taxable debt shall be issued with a final maturity that is not greater than the projects’ useful lives, but in no event longer than ten years.
For a standard fixed rate refunding, each individual bond maturity must have net present value (NPV) savings of at least the following amounts:
Years From Call to Maturity Years to Call
0 to 2 3 to 7 8 to 10 0 to 5 0.5% 1.0% 2.0% 6 to 10 1.0% 2.5% 4.0% 11 to 15 3.0% 4.0% 5.0% 16 to 20 4.0% 5.0% 5.5%
In addition to achieving the above maturity-by-maturity NPV savings, total NPV
savings must be at least the lesser of 2 percent of the par amount of refunded bonds, or three times the refunding’s costs of issuance including underwriters’ discount.
Refundings utilizing fixed rate payer swaps must have individual maturity NPV savings that are at least 2 percent higher than that for traditional fixed rate bonds noted above for the Securities Industry and Financial Markets Association (SIFMA) index-based swaps, and 5 percent higher for 65 percent of London Interbank Offered Rates (LIBOR)-based swaps.
Refundings utilizing convertible or put bonds must have individual maturity NPV savings that are at least 3 percent higher than that for traditional fixed rate bonds noted above.
37

DEBT POLICY AND PORTFOLIO
38
STATE DEBT OBLIGATIONS This Plan provides information on both State-supported and the more comprehensive State-related debt levels as described below: State-supported debt includes general obligation debt approved by the voters as well as debt that is issued on behalf of the State by public authorities, where the State is contractually obligated to pay debt service, subject to appropriation. State-related debt is more comprehensive and includes State-supported debt noted above, as well as State-guaranteed debt, moral obligation financings and certain contingent-contractual obligation financings, where debt service is paid from other non-State sources and State appropriations are available, but not expected to be needed, to make payments. State-related debt levels reported in this Plan are the cash-basis amounts consistent with the actual GAAP-basis debt levels reported in the Comptroller’s Comprehensive Annual Financial Report (CAFR). Thus, it reflects all debt issued by the State (including blended component units) for government activities and business-type activities as defined in the CAFR. However, the Plan does not include debt that is issued by, or on behalf of, local governments that may be funded in part by State local assistance aid payments. For example, State support for programs such as school aid or aid for New York City may in turn be used by those local entities to help finance debt service for locally-sponsored and locally-determined financings. Since this debt (i) was not issued by the State (or on behalf of the State), (ii) does not result in a State obligation to pay debt service, and (iii) is not considered State debt in the CAFR, it is not included in this Plan. However, such debt is reflected in the respective financial statements of the local governments responsible for the issuance of such debt. Types of State-related debt in addition to State-supported debt include the following: State-Guaranteed Debt The State Constitution and applicable statutes expressly authorize the State to directly guarantee certain public authority debt obligations that finance or guarantee loans to encourage economic development throughout the State. The statute further limits to $750 million the amount of such bonds that may be outstanding at any one time. The only obligations outstanding under this authorization have been issued by the Job Development Authority (JDA), doing business as ESDC. As of March 31, 2008, outstanding JDA obligations are projected to be $37.4 million. The State has never been called upon to make any payments pursuant to such guarantees and does not anticipate having to do so in the future.

DEBT POLICY AND PORTFOLIO
39
Moral Obligation Financings
The State’s current outstanding moral obligation financings have involved the issuance of debt by a public authority to finance a revenue-producing project. The debt is secured by project revenues and includes statutory provisions morally committing the State, subject to appropriation by the Legislature, to restore any deficiencies that may occur in the issuer’s debt service reserve fund.
Two authorities currently have outstanding moral obligation debt as authorized by their enabling acts. The Housing Finance Agency (HFA) issued bonds to finance various housing programs and hospital and health care facilities, while DASNY has statutorily assumed liability for bonds issued originally by the Medical Care Facilities Finance Agency (MCFFA) for the purpose of financing hospital and nursing home facilities. As of March 31, 2008, outstanding moral obligation bonds are projected to total $50.3 million.
The Executive Budget does not recommend new moral obligation financings, and there
has never been a default on any moral obligation debt of any public authority. Contingent Contractual Obligations
The State has also used statutorily-authorized contingent-contractual obligation financings, under which a contract obligates it to recommend appropriations to pay debt service on bonds in the event there are shortfalls in revenues from the non-State resources available to pay debt service on the bonds. Pursuant to legislation enacted in 1985 and 2003, respectively, the State has entered into contingent contractual-obligation agreements related to bonds issued by DASNY under the Secured Hospital Program and asset-backed revenue bonds issued by the Tobacco Settlement Financing Corporation (TSFC). As required by these agreements, the debt service appropriation bill submitted with the Executive Budget includes appropriation authority sufficient to pay debt service due in 2008-09 on all such outstanding contingent contractual-obligations. The Executive Budget does not anticipate that any payments would be made from these contingent appropriations.
Contingent contractual-obligations under the Secured Hospital Program were issued for the purpose of enabling 11 financially distressed not-for-profit hospitals to gain access to the capital markets. Subject to annual appropriation, the State is contractually obligated to pay debt service in the event there are shortfalls of revenues from other sources, which include hospital payments made under loan agreements between DASNY and the hospitals, and certain reserve funds held for the bonds. The initial authorization to issue bonds under the Program, including refunding bonds, expired on March 1, 1998. Two pieces of Legislation enacted in 2002 (which expired on December 31, 2004) and in 2006 (which expired on March 31, 2007) allowed certain eligible secured hospital borrowers to refinance outstanding debt, and three eligible borrowers have refinanced their outstanding debt. As of March 31, 2008, $749 million in Secured Hospital bonds are projected to be outstanding.
Legislation enacted in 2003 authorized the State to sell all of its tobacco settlement payments to the TSFC (a statutorily-created corporation that is a subsidiary of the Municipal Bond Bank Agency) through an asset-backed securitization transaction. The State entered into a contingent contractual-obligation to pay debt service in the event that

DEBT POLICY AND PORTFOLIO
40
tobacco receipts are insufficient. To ensure that State contractual payments will not be required and that tobacco receipts are sufficient to pay debt service, the tobacco bonds were structured to meet or exceed all rating agency tobacco bond stress tests. The bonds carry a final nominal maturity of 20 years and an expected final maturity of 13 years. As of March 31, 2008, $3.8 billion in tobacco bonds are projected to be outstanding.
The Executive Budget does not recommend new contingent contractual-obligations, and there have never been any payments from these contingent appropriations. DEBT PORTFOLIO OVERVIEW The market for New York State-supported bonds is large and diverse, consisting of individual investors, mutual funds, insurance companies, hedge funds, investment banks, trust departments and money market funds. The concentration of high net worth individuals and businesses based in the State creates significant demand for New York State bonds. This large investor base has traditionally been attracted to the State’s diverse economy and relatively stable tax base. In addition, strong fiscal and debt management practices have encouraged investor confidence, including:
● Passage of the debt service appropriation bill before the start of the fiscal year; ● A history of balanced budgets; ● Significant cash reserves; ● The overall debt limitations of the Debt Reform Act of 2000; and ● Comprehensive multi-year financial reports on receipts, spending, debt levels and
affordability resources.
Rating agencies have recognized the State’s strong fiscal and debt management practices. Currently, Standard and Poor’s rates the State Personal Income Tax-backed revenue bond program at AAA. In addition, New York State’s general obligation debt is rated AA by Standard and Poor’s, AA- by Fitch Ratings, Inc. and Aa3 by Moody’s. Over the past several years, New York State’s debt portfolio has grown in complexity as the State began using more sophisticated investments to reduce its debt service costs. To provide some context to the discussion on the State’s debt portfolio, this section explains the composition of the State’s debt portfolio.

DEBT POLICY AND PORTFOLIO
41
Debt Outstanding can be classified in two broad categories: • Fixed rate exposure, which bears interest at fixed rates determined at the time of the
sale; and • Variable rate exposure, which bears interest at a variable rate that resets
periodically through a public re-offering.
Composition of State Related Debt Portfolio$50 Billion Projected at March 31, 2008
Fixed Rate Bonds78%
Synthetic FR Debt12%
Synthetic VR0.3%
FR Syn. Convertible
1%
FR Convertible Bonds
5%
Natural VR4%
Fixed Rate
In the State-supported debt portfolio, fixed rate exposure is categorized by the different types of investment vehicles used to create the fixed rate exposure. The majority of fixed rate debt is traditional fixed rate debt, where the State issues bonds at fixed rates that remain in place until the bonds mature. Other fixed rate vehicles, which are described in more depth below, may include bonds where the State pays a fixed rate for a period of time but which subsequently convert to a variable rate, or bonds that are issued as variable rate but are converted to a fixed rate using a swap (synthetic fixed rate bonds). Fixed Rate Exposure – Fixed Rate Bonds ($38.7 Billion) As the preceding charts show, the majority of State-Supported debt outstanding, $38.7 billion, consists of fixed rate bonds. The State issues its bonds through several different structures:
● General Obligation ● PIT Revenue Bonds ● Other Revenue Credits (Thruway Dedicated Highway and Bridge Trust Fund
(DHBTF), Mental Hygiene, SUNY Dormitory Income Fund bonds, Department of Health (DOH) Income Fund Bonds)
● Service Contract and Lease Purchase ● Tobacco ● Secured Hospital ● Other Contingent-Contractual/Moral Obligations
DEBT POLICY AND PORTFOLIO
42
Synthetic Fixed Rate Debt ($6.0 Billion)
Synthetic fixed rate debt is created using a swap. In this type of swap, the State effectively converts a variable rate bond into a fixed rate obligation. It does so by entering into an agreement with a counterparty (a highly rated commercial or investment bank) to exchange payments, in which the State receives a payment expected to be equivalent to the cost of the variable rate bonds it issued and pays a “below market” fixed rate to the counterparty. Swap agreements are often referred to as “synthetic” debt obligations.
The State has $6.0 billion in synthetic fixed rate debt which was used to refinance existing high cost debt, generating significant debt service savings above traditional fixed rate financings. In all of these transactions, the State sold variable rate bonds. The State then entered into swaps in which it receives a variable rate payment (65 percent of LIBOR) expected to be equivalent to the costs of the variable rate bonds issued. In return, the State pays a fixed rate, resulting in net fixed interest rate payments. On average, the net fixed interest rates paid by the State through the swaps were 80 to 100 basis points less costly than what would otherwise be paid through a traditional fixed rate bond sale.
Fixed Rate Exposure – Convertible Bonds ($2.4 Billion)
$2.4 billion of State-supported fixed rate debt are convertible bonds. These bonds bear a fixed rate until future mandatory tender dates in 2009, 2011, 2012 and 2013 at which time they can convert to either a fixed or variable rate. For planning purposes, the State assumes the bonds will convert to a variable rate mode on the conversion date, although a fixed rate mode is still possible. $6 million of convertible bonds ultimately were converted to a fixed rate in 2005 and, during the Plan period, another $2.1 billion of convertible bonds are assumed to convert to a variable rate on their 2009, 2011 and 2012 mandatory tender dates.
Fixed Rate Exposure – Synthetic Convertible Bonds ($693 Million)
$693 million of State-supported fixed rate debt are synthetic convertible bonds.
Synthetic convertible bonds are created by issuing fixed rate bonds and entering into a swap that converts the fixed rate to a variable rate at a future date. The synthetic convertible bonds result in the State paying fixed rates through March 15, 2014 and variable rates beginning March 16, 2014 through 2034. The State benefits from this structure by paying lower net variable rates than could be achieved using natural variable rate products. In March 2014, the State will begin receiving fixed rate swap payments that will be greater than the fixed rate it is paying for the bonds, resulting in lower cost variable rate payments beginning in 2014. Variable Rate
In the State-supported debt portfolio, variable rate exposure is categorized by the type of investment vehicles used to create the variable rate exposure. The majority of variable rate debt has been created naturally, where the State issues bonds in a variable rate mode. The State has also created variable rate exposure synthetically, where the State issues fixed rate bonds, but converts the mode to variable rate using a swap. The following chart shows all variable rate bonds, including those associated with synthetic fixed-rate bonds (which no longer result in variable rate exposure), by variable rate product.

DEBT POLICY AND PORTFOLIO
43
$8.2 billion in Gross Variable Rate Debt (including bonds associated with swaps)
VRDB45%
7 day Auction Rate31%
Commercial Paper5% Synthetic
Variable2%
28 day Auction rate6%
35 day Auction rate11%
Roughly $6.0 billion of this gross variable rate debt has been issued in conjunction with a fixed rate swap where the State will receive a payment that is expected to be equivalent to the variable rate cost of these bonds (thus “eliminating” the variable rate exposure), and pay a fixed rate that is on average 80 to 100 basis points less costly than if the State had directly issued fixed rate bonds. The remaining $2.3 billion in net variable rate exposure is summarized below.
State-Related Variable Rate Debt$2.3 Billion Projected at March 31, 2008
Synthetic Var. Rate$167,975,000
9%
Tobacco - Natural VR
$442,500,000 18%
Natural Var Rate$1,644,474,000
73%

DEBT POLICY AND PORTFOLIO
44
Variable Rate Exposure – Natural Variable Rate Bonds ($2.1 Billion) The State has $2.1 billion in outstanding natural variable rate obligations, where the
State issued bonds in a variable rate mode that remains in place until the bonds mature. The composition of the State’s unhedged, natural variable rate portfolio can be further delineated by the type of variable rate products used, such as auction rate versus variable rate demand bonds (VRDBs), as well as the reset frequency of the variable rate obligations.
Variable Rate Exposure – Synthetic Variable Rate Bonds ($168 Million)
The State has also entered into approximately $168 million in swaps to create synthetic
variable rate exposure. In these transactions, the State issues fixed rate bonds and enters into swaps in which it will receive a fixed rate comparable to the rate it pays on the bonds and pay a SIFMA variable rate, resulting in the State paying net variable rates.
The net variable rate costs in these transactions were lower than what the State could have achieved issuing traditional variable rate bonds because they did not require additional support costs (liquidity, insurance, broker-dealer fees, and remarketing fees). On average, the State lowered its debt service costs by roughly 20 basis points by utilizing synthetic variable rate exposure. At the same time, issuing this debt reduced the supply of natural variable rate bonds in the marketplace, allowing those bonds to re-price more favorably. REFUNDINGS In the last decade, the State has refinanced roughly 48 percent of its debt portfolio at historically low interest rates. The chart below provides an overview of the State’s $50.0 illion debt portfolio. b
Refunding Opportunities
$50 Billion State-Related Debt Portfolio
Refunded Since 2002-03
43%
Possible Refunding
1%
Variable Rate Bonds16%
Tobacco-Turbo8%
Previously Refunded/Non
Callable17%
Very Low Interest Rates15%

DEBT POLICY AND PORTFOLIO
45
AVAILABLE INFORMATION The State provides investors and the public with complete, accurate and timely disclosure of financial information and other developments relating to the State’s overall finances and debt levels. In addition to quarterly multi-year Financial Plan reports, and monthly and annual comprehensive accounting reports, the State provides the following information:
● The Capital Program and Financing Plan (this report) is published twice a year, and provides “one-stop shopping” for comprehensive information on State debt levels, debt service costs, capital projects spending and debt affordability measures.
● The Annual Information Statement (AIS) is the principal means for disclosing
financial information pursuant to Federal securities law requirements. The AIS is published annually within 30 days of budget enactment, and updated on a quarterly basis – with supplements, as needed, for significant events or developments that occur between quarterly updates.
● The Continuing Disclosure/Annual Update consists of information directly relevant
to the security of specific bonds that were issued by the State. When the State or its authorities issues bonds, the issuer agrees to annually update certain financial information contained in the Official Statement used in connection with the issuance of the bonds, and to provide timely notice of material events (as defined by the Securities and Exchange Commission), for the benefit of investors in the secondary market.
All of this information is provided on the Division of the Budget’s website.


CAPITAL SPENDING


CAPITAL SPENDING MULTI-YEAR OVERVIEW
The following section discusses in more detail the Capital Projects spending recommendations section contained in the Executive Summary. Key recommendations included in 2008-09 and over the remaining four years of the Plan are discussed below.
$48.4 Billion in Capital Spending Over Five Years
Mental Hygiene & Public Protection
(11%)
Other(9%)
Parks/Environment
(6%)
Higher Education(15%)
Transportation(50%)
Economic Development & Gov't Oversight
(9%)
Transportation spending, primarily for improvements and maintenance to the State’s highways and bridges, continues to account for the largest share (50 percent) of total spending over the Plan. The balance of total spending will support other capital investments in the areas of higher education (15 percent), mental hygiene and public protection (11 percent), economic development and government oversight (9 percent), parks and the environment (6 percent), and health and social welfare, general government and other areas (9 percent).
49

CAPITAL SPENDING
50
2007-08 through 2012-13 Capital Spending Overview
CAPITAL SPENDING BY FUNCTION AND FINANCING SOURCE CAPITAL PROGRAM AND FINANCING PLAN
2007-2008 THROUGH 2012-2013 (thousands of dollars)
Spending
Transportation
2007-2008 2008-2009 2009-2010 2010-2011
4,023,886 4,415,846 4,801,245 4,969,387
2011-2012
4,953,913
2012-2013
4,997,657Parks and Environment 586,003 667,740 633,003 590,503 588,191 590,503Economic Development & Gov't. Oversight 929,032 1,217,816 1,190,830 905,301 655,373 366,290Health and Social Welfare 292,098 348,048 286,303 334,413 157,480 76,480Education-EXCEL 1,000,000 750,000 554,000 0 0 0Education-All Other Programs 1,060,055 1,355,446 1,360,212 1,426,854 1,502,222 1,633,905Public Protection 313,284 395,468 384,005 406,280 398,800 398,800Mental Hygiene 407,320 602,977 736,865 590,430 601,747 582,572General Government 123,859 148,542 181,893 284,163 195,380 193,501Other 101,000 196,000 262,950 205,150 154,582 120,000 Total 8,836,537 10,097,883 10,391,306 9,712,481 9,207,688 8,959,708
GAAP Spending
Net Cash Spending
Financing Source
State Pay-As-You-Go
2,191,832 2,170,568 1,949,536 1,264,423
6,644,705 7,927,315 8,441,770 8,448,058
2007-2008 2008-2009 2009-2010 2010-2011
1,636,720 1,845,364 2,114,540 2,205,570
1,353,174
7,854,514
2011-2012
1,438,758
7,520,950
2012-2013
2,178,305 2,111,184Federal Pay-As-You-Go 1,885,048 1,972,922 1,998,362 1,931,307 1,894,471 1,892,231General Obligation Bonds 310,905 471,786 614,587 660,613 513,364 455,435Authority Bonds Total
5,003,864 5,807,811 5,663,817 4,914,9918,836,537 10,097,883 10,391,306 9,712,481
4,621,5489,207,688
4,500,8588,959,708
Annual Spending Change Capital projects spending is projected to increase by $1.3 billion from 2007-08 to 2008-09. The year-to-year spending changes are displayed on a functional basis on the following chart.

CAPITAL SPENDING
51
Percent of Total Annual Spending Increase by Function Change from 2007-08 to 2008-09
Transportation (31 %)
Mental Hygiene/Public
Protection(22 %)
Other(12 %)
Higher Education (21 %)
Environment (6 %)
Economic Development and Gov't Oversight
(23 %)
Spending for transportation is projected to increase by $392 million (10 percent) and largely reflecting planned increases for Department of Transportation highway and bridge projects ($200 million) and Metropolitan Transportation Authority (MTA) transit projects ($95 million) associated with the fourth year of the State five-year Transportation Capital Plan. Other increases include $47 million in estimated spending for the new Department of Transportation State and Local Bridge Preservation Program, $16 million for State compliance with the Western Hemisphere Travel Initiative and approximately $3 million in savings attributable to agency administrative efficiencies.
Parks and environment spending will increase by $82 million (14 percent) primarily for
spending from the environmental component of the new Upstate Revitalization Fund ($75 million). The majority of spending in the parks and environment category is for ongoing preservation and maintenance of various lands, facilities and other structures. Other important efforts include projects to protect the State’s water and air quality, Brownfields projects, other hazardous waste site cleanups and landfill closures.
Economic development spending is projected to increase by $278 million (34 percent) which is attributable to $90 million in on-budget spending from the proposed $2.2 billion in new economic development initiatives and $188 million for prior economic development commitments. Of the $2.2 billion in new economic development initiatives, $1.11 billion represents on-budget spending, including $712 million from the Upstate Revitalization Fund for upstate economic development initiatives and $188 million for downstate projects. The remaining $210 million in on-budget capital spending is reflected in transportation ($100 million) and parks ($110 million). Ongoing projects, for which spending increases by $188 million from 2007-08 to 2008-09, include continued support of an international computer chip research and development center, capital improvements at Governor’s and Roosevelt Island in New York City, redevelopment initiatives at the Harriman Research and Technology Park and in Niagara Falls, and specific economic development, cultural facilities, university development, environmental, and energy projects administered by ESDC and DASNY, including the development of a semiconductor manufacturing facility and the Restore NY Communities Initiative.

CAPITAL SPENDING
52
Spending for health and social welfare is projected to increase by $56 million (19 percent). It reflects revised projections based on more recent project activity levels for the $1 billion Health Care Efficiency and Affordability Law for New Yorkers (HEAL NY) enacted in 2005-06.
Education spending is projected to increase by a net $46 million (2 percent) in 2008-09,
which is attributable to increases in bonded spending for higher education (SUNY, CUNY, and higher education capital matching grants) of $267 million, offset by a projected $250 million decrease in estimated spending for EXCEL as the $2.6 billion program begins to conclude. Spending for SED facilities increases by approximately $30 million, primarily for projects related to the Cultural Education Center and libraries.
Spending increases of $82 million (26 percent) for Public Protection primarily reflect
the expanded scope, including other related State functions, for the new headquarters for Troop G and rehabilitation of existing facilities.
Mental hygiene capital spending will increase $196 million (48 percent) for continued
critical rehabilitation projects at State facilities and development of community residences. In addition, $42 million in new spending over the life of the Plan is recommended for Office of Mental Retardation and Developmental Disabilities (OMRDD) community development initiatives, of which $3 million is anticipated to be disbursed in 2008-09.
General government spending increases by $25 million (20 percent) which primarily reflects increased spending for the Office for Technology on a statewide broadband initiative, development of interim data center capacity, and radio equipment for the Statewide Wireless Network (SWN), offset by the anticipated conclusion of the Department of State’s wireless E-911 service project.
Spending in the other category, which supports capital investments for the Judiciary, statewide equipment, and capital spending financed with Federal funds for the World Trade Center site, is projected to increase $95 million, from $101 million to $196 million, and primarily reflects $20 million for projects at the World Trade Center and $65 million for the new bonded program for new information systems software development and upgrades for the connections system and a statewide Financial Management System.
TRANSPORTATION The Plan reflects the fourth year of the 2005-06 through 2009-10 DOT program, which totaled approximately $17.9 billion when adopted in 2005. The Executive Budget builds upon increases enacted in 2007-08 by adding an additional $587 million, bringing the DOT program to $19.4 billion. This includes an additional $287 million for the Department of Transportation’s new State and Local Bridge Preservation Program and $300 million in supplemental Federal funding for Projects of Statewide Significance contained in the State transportation plan memorandum of understanding (MOU). This overall program includes $10.5 billion for highway and bridge construction and maintenance contracts, exclusive of the new Bridge Preservation Program.

CAPITAL SPENDING
53
The Plan will continue to be financed by PAYGO resources supported by dedicated taxes and fees, Federal aid, funds from the Rebuild and Renew New York Transportation Bond Act, and State-supported DHBTF bonds. Federal obligation authority available to DOT is projected to be in excess of $1.7 billion annually throughout the Plan, consistent with the Safe, Accountable, Flexible, Efficient Transportation Equity Act: A Legacy for Users (SAFETEA-LU), the Federal transportation act.
Additional resources will still be required to fully fund the final two years of the DOT Plan. The 2008-09 Executive Budget includes a cash transfer of up to $119 million from the General Fund to the Dedicated Highway and Bridge Trust Fund to address estimated funding shortfalls in the DOT Capital Plan for 2008-09 and an additional transfer of $212 million in 2009-10.
The new Plan also continues to assist localities in funding various local transportation
projects. Funding for such programs, including CHIPs and the Marchiselli Program, is projected at $350 million in 2008-09, and is estimated to total almost $1.8 billion over the new Plan.
Spending for transportation is projected to increase by $392 million or by 10 percent
from 2007-08 to 2008-09, reflecting the anticipated spendout of the over $17.9 billion five-year DOT Capital Plan. Projections for 2012-13 are based on an assumption of flat commitment levels, as a placeholder for a successor transportation plan.
FUNCTIONAL CAPITAL SPENDING BY FINANCING SOURCE 2007-2008 THROUGH 2012-2013
(thousands of dollars)
Transportation 2007-2008 2008-2009 2009-2010 2010-2011 2011-2012 2012-2013
State Pay-As-You-Go 1,029,199 1,215,830 1,323,014 1,353,945 1,399,354 1,424,883Federal Pay-As-You-Go 1,638,433 1,734,384 1,787,282 1,732,227 1,701,891 1,712,151General Obligation Bonds 227,562 409,343 552,144 598,170 450,921 392,992Authority Bonds 1,128,692 1,056,289 1,138,805 1,285,045 1,401,747 1,467,631
Transportation Total
Transportation
4,023,886 4,415,846 4,801,245 4,969,387
2007-2008 2008-2009 2009-2010 2010-2011
4,953,913 4,997,657
2011-2012 2012-2013
State Pay-As-You-Go 25.58% 27.53% 27.56% 27.25% 28.25% 28.51%Federal Pay-As-You-Go 40.72% 39.28% 37.23% 34.86% 34.35% 34.26%General Obligation Bonds 5.66% 9.27% 11.50% 12.04% 9.10% 7.86%Authority Bonds 28.05% 23.92% 23.72% 25.86% 28.30% 29.37%
Transportation Total
100.00% 100.00% 100.00% 100.00% 100.00% 100.00%
PARKS AND ENVIRONMENT
Parks and environment capital spending of $3.1 billion will average over $600 million annually, and will continue to focus on the cleanup of environmental hazards. Spending in this category declines over the Plan as a result of the completion of voter-approved general obligation bonding authorizations.

CAPITAL SPENDING
54
Spending to support the refinanced State Superfund Program and the Brownfields Program for the remediation of hazardous waste and hazardous substances and for off-site contamination of Brownfield clean-up sites will average about $136 million annually. Another $15 million in annual disbursements will support PAYGO grants and the implementation of State Superfund and Brownfield Cleanup Programs.
Annual appropriations for the Environmental Protection Fund (EPF) are recommended to average $290 million annually over the Plan. Average annual spending of almost $180 million will finance a variety of critical environmental and recreational activities. To finance capital projects supported by the EPF, dedicated Real Estate Transfer taxes will increase from $212 million in 2007-08 to $237 million in 2008-09, and then to $287 million each year thereafter over the Plan. In order to more accurately finance projects according to their useful life, the Executive Budget recommends financing $75 million in 2008-09 with the proceeds of authority bonds.
The Executive Budget contains a proposal to expand the Bottle Bill to most non-carbonated beverages, and to redirect all unclaimed deposits to the State to support future spending in the EPF. These modifications will provide approximately $25 million in additional receipts to the EPF in SFY 2008-09. These unclaimed deposits are expected to total $100 million annually. Additional EPF appropriations of $1.4 billion through 2012-13 will continue funding for these important activities.
Spending financed by reappropriations for the Clean Water/Clean Air Bond Act
(CW/CA) approved by the voters in 1996 will average about $50 million annually over the Plan and will finance water quality improvement and landfill and recycling projects. Spending from the State Parks Infrastructure Fund (SPIF) is projected to average over $48.3 million annually over the Plan. Parks and environment spending will increase by over $81 million (14 percent) from 2007-08 to 2008-09, primarily for the new bonded program in SPIF. In order to more accurately finance projects according to their useful life, the Executive Budget recommends funding $110 million of additional critical environmental projects with the proceeds of authority bonds over the next two fiscal years. This spending is expected to be completed quickly, with $75 million being disbursed in 2008-09 and the $35 million balance in 2009-10.

CAPITAL SPENDING
55
FUNCTIONAL CAPITAL SPENDING BY FINANCING SOURCE 2007-2008 THROUGH 2012-2013
(thousands of dollars)
Parks and Environment 2007-2008 2008-2009 2009-2010 2010-2011 2011-2012 2012-2013
State Pay-As-You-Go 237,153 165,642 254,960 259,960 259,960 269,960Federal Pay-As-You-Go 106,100 106,100 106,100 106,100 106,100 106,100General Obligation Bonds 83,343 62,443 62,443 62,443 62,443 62,443Authority Bonds 159,407 333,555 209,500 162,000 159,688 152,000
Parks and Environment Total 586,003 667,740 633,003 590,503 588,191 590,503
Parks and Environment 2007-2008 2008-2009 2009-2010 2010-2011 2011-2012 2012-2013
State Pay-As-You-Go 40.47% 24.81% 40.28% 44.02% 44.20% 45.72%Federal Pay-As-You-Go 18.11% 15.89% 16.76% 17.97% 18.04% 17.97%General Obligation Bonds 14.22% 9.35% 9.86% 10.57% 10.62% 10.57%Authority Bonds
Parks and Environment Total
27.20% 49.95% 33.10% 27.43%
100.00% 100.00% 100.00% 100.00%
27.15% 25.74%
100.00% 100.00%
ECONOMIC DEVELOPMENT AND GOVERNMENT OVERSIGHT
Economic development and government oversight spending of over $4.4 billion is projected to average $886 million annually and support: economic development projects; housing programs administered by the Division of Housing and Community Renewal (DHCR); the disposal of nuclear waste at the Western New York Nuclear Service Center at West Valley; and the preservation and improvement of State Fairground buildings.
The Plan includes support for new and existing programs that will encourage economic
development and investment in high-technology projects including: • A key new initiative is a comprehensive $2.2 billion economic development
program that includes a statewide competitive grant program administered by ESDC; specific downstate regional initiatives and upstate city-by-city projects; a targeted and comprehensive infrastructure and economic development plan with statewide initiatives; housing initiatives; and programs targeted to the upstate. It consists of $1 billion for an Upstate Revitalization Fund and $1.2 billion in the downstate region and statewide.
• The initiative will result in roughly $900 million in new economic development
capital spending that is reflected in the State’s budget, including $712 million from the Upstate Revitalization Fund and $188 million for downstate economic development projects (an additional $210 million is reflected in parks and transportation). The on-budget capital funded economic development initiatives are expected to be fully spent over the five-year Plan as follows: $90 million in 2008-09, $225 million in 2009-10, $270 million in 2010-11, $225 million in 2011-12, and $90 million in 2012-13. In addition, roughly $60 million of local assistance grants will be provided through the Budget. The remaining balance of the program will be generated on a PAYGO basis. The PAYGO components include the release of reserves held by SONYMA, annual revenues from an auto

CAPITAL SPENDING
56
insurance surcharge and the sale of surplus property, most of which will be spent directly from non-State accounts and, therefore, are not reflected in the spending estimates contained in this Plan.
• Over $2.5 billion for continued support of an international computer chip research
and development center, capital improvements at Governor’s Island and Roosevelt Island in New York City, redevelopment initiatives at the Harriman Research and Technology Park and in Niagara Falls, and specific economic development, cultural facilities, university development, environmental, and energy projects administered by ESDC and DASNY, including $650 million for the development of a semiconductor manufacturing facility and $300 million for the Restore NY Communities Initiative.
Economic development spending is projected to increase by $278 million (34 percent)
from 2007-08 to 2008-09 and is primarily attributable to spending for the new Upstate Revitalization Fund ($90 million) and existing economic development programs ($188 million).
FUNCTIONAL CAPITAL SPENDING BY FINANCING SOURCE 2007-2008 THROUGH 2012-2013
(thousands of dollars)
Economic Development & Gov't. Oversight 2007-2008 2008-2009 2009-2010 2010-2011 2011-2012 2012-2013
State Pay-As-You-Go 2,947 3,325 3,325 3,325 3,325 3,325Federal Pay-As-You-Go 3,000 3,000 3,000 3,000 3,000 3,000Authority Bonds 923,085 1,211,491 1,184,505 898,976 649,048 359,965
Economic Development & Gov't. Oversight Total 929,032 1,217,816 1,190,830 905,301
Economic Development & Gov't. Oversight 2007-2008 2008-2009 2009-2010 2010-2011
655,373 366,290
2011-2012 2012-2013
State Pay-As-You-Go 0.32% 0.27% 0.28% 0.37% 0.51% 0.91%Federal Pay-As-You-Go 0.32% 0.25% 0.25% 0.33% 0.46% 0.82%Authority Bonds 99.36% 99.48% 99.47% 99.30%
Economic Development & Gov't. Oversight Total 100.00% 100.00% 100.00% 100.00%
99.03% 98.27%
100.00% 100.00%
HEALTH AND SOCIAL WELFARE
Spending of over $1.2 billion for health and social welfare is projected to average over $240 million annually and support: the preservation and maintenance of youth facilities operated by the Office of Children and Family Services; Homeless Housing Assistance Program (HHAP) Grants administered by the Office of Temporary and Disability Assistance; and capital projects to protect the health and safety of patients at veterans homes and health care facilities operated by DOH, including the new veterans nursing home at Oxford.
The Plan also includes $250 million in new capital appropriations, the major portion of
which will continue the Health Care Efficiency and Affordability Law for New Yorkers (HEAL NY) program which was enacted in 2005-06. The program would support targeted investments in the health care infrastructure designed to enhance the efficient operation of

CAPITAL SPENDING
57
health care facilities, close or restructure underutilized capacity and upgrade information and health care technologies. Program costs are projected to be financed through a combination of PAYGO and bond-financed resources.
Spending for the health and social welfare functional area is projected to increase by
$56 million (19 percent) from 2007-08 to 2008-09 and primarily reflects a shift in projected capital costs based on more recent project level activity for the $1 billion HEAL NY program enacted in 2005-06.
FUNCTIONAL CAPITAL SPENDING BY FINANCING SOURCE
2007-2008 THROUGH 2012-2013 (thousands of dollars)
Health and Social Welfare 2007-2008 2008-2009 2009-2010 2010-2011 2011-2012 2012-2013
State Pay-As-You-Go 131,236 187,868 107,116 110,500 98,500 17,500Federal Pay-As-You-Go 36,812 9,980 9,980 9,980 9,980 9,980Authority Bonds 124,050 150,200 169,207 213,933 49,000 49,000
Health and Social Welfare Total 292,098 348,048 286,303 334,413 157,480 76,480
Health and Social Welfare 2007-2008 2008-2009 2009-2010 2010-2011 2011-2012 2012-2013
State Pay-As-You-Go 44.93% 53.98% 37.41% 33.04% 62.55% 22.88%Federal Pay-As-You-Go 12.60% 2.87% 3.49% 2.98% 6.34% 13.05%Authority Bonds
Health and Social Welfare Total
42.47% 43.15% 59.10% 63.97%
100.00% 100.00% 100.00% 100.00%
31.12% 64.07%
100.00% 100.00%
EDUCATION
Education spending of over $8.6 billion is projected to average $1.7 billion annually. This reflects the new five-year plans for SUNY and CUNY, as well as the existing Five-Year Capital Investment Programs for SUNY and CUNY enacted in 2004-05 to support facility and infrastructure improvements that are consistent with the needs and priorities of each system. Also included is continued spending for EXCEL ($750 million in 2008-09 and $554 million in 2009-10). Education reappropriations also include support for the five-year SUNY and CUNY Community College Plans and the five-year SUNY Dormitories Plan enacted in 2003-04.
The recommended new higher education five-year plans for SUNY and CUNY
respond to the critical maintenance needs and strategic priorities of both systems. The $6.5 billion recommended for SUNY includes $4.4 billion for State-operated campuses, as well as $526 million in community college support. In addition, $1.02 billion in appropriation authority is recommended for self-supporting capital projects for SUNY’s Hospitals and Residence Halls programs, as well as $500 million in spending authority for Educational Facilities projects supported by non-State funds (i.e., grants and donations). The 2008-09 Executive Budget recommends a new $2.8 billion five-year capital investment program for CUNY that will provide more than $2.58 billion for critical maintenance needs and strategic priorities of senior colleges and $260 million for community colleges. Funded projects encompass critical maintenance, health and safety, preservation and handicapped

CAPITAL SPENDING
58
access projects as the plan’s main component, as well as the completion of ongoing projects at John Jay College and Medgar Evers College. As with SUNY, strategic initiative projects for senior colleges that are advanced by the CUNY Board of Trustees will be subject to approval by a newly established University Capital Projects Review Board. This additional higher education spending is estimated to begin at $69 million in 2008-09, increase over the next four years to $146 million in 2009-10, $323 million in 2010-2011, $503 million in 2011-12, and to $811 million by 2012-13. Projected spending for State Education Department projects will total $150 million over the five years and includes total new capital appropriations of $56.6 million for SED projects including public library construction ($14.0 million); expansion of the State Records Center ($12.6 million); collections preservation and stewardship at the Cultural Education Center ($24.1 million); various projects at the Batavia School for the Blind, SED facilities, and the Rome School for the Deaf ($5.9 million). Ongoing spending for EXCEL is projected to total $1.3 billion during the next two fiscal years.
Education spending is projected to increase by a net of $46 million (2 percent) in
2008-09, which is attributable to increases in bonded spending for SUNY and CUNY senior and community colleges, SUNY Dormitory Facilities and SED Cultural Education Facilities. These increases are offset by a projected $250 million decrease in estimated spending for EXCEL, as $1 billion of the $2.6 billion program is estimated to be disbursed in 2007-08.
FUNCTIONAL CAPITAL SPENDING BY FINANCING SOURCE
2007-2008 THROUGH 2012-2013 (thousands of dollars)
Education 2007-2008 2008-2009 2009-2010 2010-2011 2011-2012 2012-2013
State Pay-As-You-Go 72,480 69,652 71,319 64,277 62,735 57,664Authority Bonds 1,987,575 2,035,794 1,842,893 1,362,577 1,439,487 1,576,241
Education Total 2,060,055 2,105,446 1,914,212 1,426,854 1,502,222 1,633,905
Education 2007-2008 2008-2009 2009-2010 2010-2011 2011-2012 2012-2013
State Pay-As-You-Go 3.52% 3.31% 3.73% 4.50% 4.18% 3.53%Authority Bonds
Education Total
96.48% 96.69% 96.27% 95.50%
100.00% 100.00% 100.00% 100.00%
95.82% 96.47%
100.00% 100.00%
PUBLIC PROTECTION
Spending for public protection of $2.0 billion is projected to average almost $399 million annually and will continue to focus on preserving and maintaining infrastructure investments at existing correctional facilities, and facilities operated and maintained by the Division of Military and Naval Affairs (DMNA) and the Division of State Police (DSP). The Plan recommends an additional $6 million in bond financing for critical rehabilitation at existing DSP facilities.

CAPITAL SPENDING
59
Spending increases of $82 million (26 percent) from 2007-08 to 2008-09 for public protection primarily reflect re-estimates and State Police costs for a new Troop G headquarters.
FUNCTIONAL CAPITAL SPENDING BY FINANCING SOURCE 2007-2008 THROUGH 2012-2013
(thousands of dollars)
Public Protection 2007-2008 2008-2009 2009-2010 2010-2011 2011-2012 2012-2013
State Pay-As-You-Go 13,271 26,203 17,225 14,280 13,800 13,800Federal Pay-As-You-Go 50,703 49,458 22,000 45,000 41,000 41,000Authority Bonds 249,310 319,807 344,780 347,000 344,000 344,000
Public Protection Total 313,284 395,468 384,005 406,280 398,800 398,800
Public Protection 2007-2008 2008-2009 2009-2010 2010-2011 2011-2012 2012-2013
State Pay-As-You-Go 4.24% 6.63% 4.49% 3.51% 3.46% 3.46%Federal Pay-As-You-Go 16.18% 12.51% 5.73% 11.08% 10.28% 10.28%Authority Bonds
Public Protection Total
79.58% 80.87% 89.79% 85.41%
100.00% 100.00% 100.00% 100.00%
86.26% 86.26%
100.00% 100.00%
MENTAL HYGIENE
Spending for mental hygiene capital projects of over $3.1 billion is projected to average $620 million annually. Department of Mental Hygiene spending will continue to support essential health and safety, rehabilitation and maintenance projects needed to preserve and maintain both institutional and community-based facilities operated and/or licensed by the Office of Mental Health (OMH), the Office of Mental Retardation and Developmental Disabilities (OMRDD), and the Office of Alcoholism and Substance Abuse Services (OASAS).
Mental hygiene capital spending will increase $196 million (48 percent) from 2007-08
to 2008-09 for continued critical rehabilitation projects at State facilities and the continued development of community residences.

CAPITAL SPENDING
60
FUNCTIONAL CAPITAL SPENDING BY FINANCING SOURCE 2007-2008 THROUGH 2012-2013
(thousands of dollars)
Mental Hygiene 2007-2008 2008-2009 2009-2010 2010-2011 2011-2012 2012-2013
State Pay-As-You-Go 97,925 107,276 108,788 109,520 108,751 110,551Authority Bonds 309,395 495,701 628,077 480,910 492,996 472,021
Mental Hygiene Total
Mental Hygiene
407,320 602,977 736,865 590,430
2007-2008 2008-2009 2009-2010 2010-2011
601,747 582,572
2011-2012 2012-2013
State Pay-As-You-Go 24.04% 17.79% 14.76% 18.55% 18.07% 18.98%Authority Bonds
Mental Hygiene Total
75.96% 82.21% 85.24% 81.45%
100.00% 100.00% 100.00% 100.00%
81.93% 81.02%
100.00% 100.00%
GENERAL GOVERNMENT
General government spending of $993 million is projected to average over $198 million annually and will continue to support plans for the construction, rehabilitation, consolidation and renovation of State office buildings to achieve space efficiencies and reduce operational costs. In addition to maintaining existing facilities, spending will continue to support the renovation of the State Capitol and the Empire State Plaza. Funding is increased for the Office for Technology primarily to support a statewide broadband initiative, develop interim data storage space, and purchase SWN related equipment. Spending is anticipated to conclude for the Department of State (DOS) for local public safety answering point equipment upgrades for wireless E-911 service.
General government spending increases by $25 million (20 percent) which primarily reflects increased spending for the Office for Technology for additional interim data center capacity and operations centers and radio equipment for the SWN offset by the anticipated conclusion of the Department of State’s wireless E-911 service project.
FUNCTIONAL CAPITAL SPENDING BY FINANCING SOURCE 2007-2008 THROUGH 2012-2013
(thousands of dollars)
General Government 2007-2008 2008-2009 2009-2010 2010-2011 2011-2012 2012-2013
State Pay-As-You-Go 51,509 67,786 124,893 208,663 175,380 173,501Authority Bonds 72,350 80,756 57,000 75,500 20,000 20,000
General Government Total 123,859 148,542 181,893 284,163 195,380 193,501
General Government 2007-2008 2008-2009 2009-2010 2010-2011 2011-2012 2012-2013
State Pay-As-You-Go 41.59% 45.63% 68.66% 73.43% 89.76% 89.66%Authority Bonds 58.41% 54.37% 31.34% 26.57% 10.24% 10.34%
General Government Total
100.00% 100.00% 100.00% 100.00% 100.00% 100.00%

CAPITAL SPENDING
61
OTHER
Spending in this category also supports capital investments for the Judiciary, statewide equipment, systems research, development, and upgrades, and capital spending financed with Federal funds for the World Trade Center site. Increased pay-as-you-go spending of approximately $280 million and $65 million in bond-financed spending is reflected for major information systems software research, development, and upgrades which were originally projected to be funded with State operating funds.
Spending for these projects of $939 million is projected to average over $187 million
annually over the Plan. Spending for the systems research is projected at $65 million in 2008-09, $104 million in 2009-10, $81 million in 2010-11, $57 million in 2011-12, and $40 million in 2012-13.
FUNCTIONAL CAPITAL SPENDING BY FINANCING SOURCE
2007-2008 THROUGH 2012-2013 (thousands of dollars)
Other 2007-2008 2008-2009 2009-2010 2010-2011 2011-2012 2012-2013
State Pay-As-You-Go 1,000 1,782 103,900 81,100 56,500 40,000Federal Pay-As-You-Go 50,000 70,000 70,000 35,000 32,500 20,000Authority Bonds 50,000 124,218 89,050 89,050 65,582 60,000
Other Total 101,000 196,000 262,950 205,150 154,582 120,000
Other 2006-2007 2007-2008 2008-2009 2009-2010 2010-2011 2011-2012
State Pay-As-You-Go 0.99% 0.91% 39.51% 39.53% 36.55% 33.33%Federal Pay-As-You-Go 49.50% 35.71% 26.62% 17.06% 21.02% 16.67%Authority Bonds 49.50% 63.38% 33.87% 43.41% 42.43% 50.00%
Other Total 100.00% 100.00% 100.00% 100.00% 100.00% 100.00%


AGENCY CAPITAL PROGRAM PLANS


AGENCY CAPITAL PROGRAM PLANS
The Capital Program Plan section provides a narrative description of the capital investment recommendations of agencies for the 2008-09 through 2012-13 period. This section of the Plan is organized programmatically. Each program area begins with a functional overview, followed by each agency’s narrative description which highlights accomplishments, new initiatives, and long-term financial requirements.
All State agencies and authorities with State-supported capital programs have capital
maintenance systems. Agencies are required to develop five-year maintenance plans, which include an assessment of assets with a replacement value of at least $5 million, and that reflect an asset’s age, condition, condition goals, maintenance activities, and remaining useful life. In addition, every five years, agencies are also required to perform an independent evaluation of their maintenance plans to ensure that the recommended maintenance activities are consistent with current capital needs.
The capital maintenance plan summaries are included in the agency narratives, since
the maintenance plans are a critical part of an agency’s Five-Year Capital Plan. The appropriations reflected in each agency’s Five-Year Capital Plan reflect a needs-assessment, which will continue to be refined as an agency implements an asset maintenance system.
The tables contained in this section provide five years of appropriation, commitment
and disbursement projections for each program. Commitment levels in these tables reflect the value of contracts expected to be entered into by each agency in a given year. Each agency narrative compares the Plan’s recommended commitment levels with last year’s levels. The reappropriation projections reflect the unexpended balance of the original appropriation, and any unused amounts continue to be shown until the project is completed.
This section also includes summary schedules of disbursements, which aggregate the
information presented in the individual agency tables. These summary tables reflect projections of disbursements for capital projects, and eliminate transactions which simply move moneys from one fund to another. This adjustment provides comparability between the Plan’s summary of disbursements and the State’s Financial Plan. Detailed agency tables are attached later in this document. These tables display the recommended individual reappropriations and new appropriations for each agency, as well as the anticipated future appropriations through State fiscal year 2012-13. The recommended appropriations represent the estimated project cost for the various agencies and the respective comprehensive construction programs. Further information on these detailed tables is provided at the beginning of that section.
65

AGENCY CAPITAL PROGRAM PLANS
66
TRANSPORTATION New York’s diverse transportation system plays a crucial role in our economy. The State’s over 240,000 lane miles of roads, 19,500 bridges, 4,000 railroad miles, 147 public use airports, 12 major ports, and over 70 mass transit systems are among our most valuable resources. These important assets are managed and maintained by an integrated network of State agencies, public authorities, local governments and private entities. The five-year State transportation plan enacted in State fiscal year 2005-06 provided over $35.9 billion for the State’s transportation systems through State fiscal year 2009-10. The adopted plan included over $17.9 billion for the Department of Transportation (DOT) capital program and over $17.9 billion for the Metropolitan Transportation Authority (MTA) capital program. The 2007-08 Budget increased DOT’s five-year capital program to over $18.7 billion, reflecting an increase of $827 million from additional Federal aid for investments in local highway and bridge projects, preventive maintenance (including the State’s Maintenance First initiative), State highway and bridge projects, and other needs. The 2008-09 Executive Budget increases the DOT five-year capital plan by an additional $587 million to a total of $19.4 billion. This includes an additional $287 million for the DOT’s new State and Local Bridge Preservation Program and $300 million in supplemental Federal funding for Projects of Statewide Significance contained in the State transportation plan memorandum of understanding (MOU). The State and Local Bridge Preservation Program, a component of the Upstate Revitalization Fund, will help stem the declining trend in average State and local bridge conditions through a program of preventive and corrective maintenance treatments that will provide a cost-effective means of maximizing the useful lives of our bridges. The $140 million annual program includes: the addition of 10 new DOT bridge maintenance crews as well as increased staffing for existing crews, an annual $50 million for maintenance contracts on State bridges, an annual $13 million for additional State bridge construction projects, additional under bridge inspection equipment, and an annual $60 million for local bridge improvement. The Program will be financed through a portion of an annual $20 surcharge on automobile insurance policies throughout the State. The five-year State transportation plan will also include an additional $300 million of Federal funding in 2009-10 to ensure that Projects of Statewide Significance that are contained in the State transportation plan MOU, such as the conversion of Route 17 to Interstate 86, are not delayed by funding shortfalls caused by construction cost inflation. The MTA’s five-year program includes funding for state-of-good-repair projects for subways, buses, commuter railroads, tunnels and bridges; system expansion projects; preventive maintenance programs; and important security and policing projects to protect the MTA network. The plan provides $2.5 billion to advance three major system expansion projects: East Side Access (ESA), Second Avenue Subway (SAS), and the JFK Rail Link to Lower Manhattan. Both ESA and SAS have been approved for significant Federal funding and have received their full funding grant agreements, bringing total

AGENCY CAPITAL PROGRAM PLANS
67
funding in the current five-year plan for each project to $4.1 billion and $3 billion, respectively. The $6.4 billion ESA project is scheduled to be complete in 2013; the $4 billion SAS project is scheduled to be complete in 2014. The 2005-06 to 2009-10 transportation plan is funded primarily by more than $4.5 billion in annual State revenues dedicated to transportation, including increases enacted in 2005 of various Department of Motor Vehicles (DMV) fees and an additional 1/8 cent sales tax levied in the MTA service district and dedicated to the MTA. Also enacted in 2005 was a five-cent increase in the mortgage recording tax collected in the MTA service district and paid directly to the MTA by the counties. The $2.9 billion Rebuild and Renew New York Transportation Bond Act of 2005 provided additional resources, with the DOT and MTA each receiving $1.45 billion for their capital programs. A restructuring of the Dedicated Highway and Bridge Trust Fund (DHBTF) bonds in 2005 provided additional capacity during the plan period for DOT capital projects. Significant portions of the State’s transportation capital programs are supported by Federal aid. The most recently authorized Act, the Safe, Accountable, Flexible, Efficient Transportation Equity Act: A Legacy for Users (SAFETEA-LU), for Federal fiscal years 2004-2009, is expected to provide over $1.7 billion annually in resources for DOT’s highway and bridge capital program. Additional resources will still be required to fully fund the capital and operating budgets of DOT and the MTA in the final two years of the 2005-06 through 2009-10 State transportation plan. The 2008-09 Executive Budget includes a cash transfer of up to $119 million from the General Fund to the Dedicated Highway and Bridge Trust Fund to address estimated funding shortfalls in the DOT Capital Plan for 2008-09. Legislation passed in July 2007 authorizing consideration of a congestion pricing plan for New York City also requires the DOT to submit a new five-year capital program by March 31, 2008 for state and local highway and bridge, rail and ports, aviation and non-MTA transit for State fiscal years 2009-10 through 2013-14. This five-year program is to include system-wide goals and objectives for capital spending, the amount of capital funding required for each year and an estimate of the sources of such capital funding. DEPARTMENT OF TRANSPORTATION The DOT is responsible for maintaining and rehabilitating the State’s system of highways and bridges, which includes over 40,000 State highway lane miles and over 7,500 bridges. Private contractors perform all major construction and repair work, while DOT provides seasonal maintenance and repair. The Department also oversees and funds programs that help defray local capital expenses associated with road and bridge projects, including the Consolidated Highway Improvement Program (CHIPs) and the Marchiselli Program. The 2005-06 Budget instituted a five-year transportation plan for the State fiscal years 2005-06 through 2009-10 period. The capital program plan presented here is a rolling plan that includes the last two years of the 2005-06 through 2009-10 transportation plan and a projection for State fiscal years 2010-11, 2011-12, and 2012-13. Major components of this capital program plan include $11.59 billion for highway and bridge construction and

AGENCY CAPITAL PROGRAM PLANS
68
preventive maintenance contracts, $4.01 billion for engineering, project inspection and program management, $1.84 billion for local capital programs, $1.26 billion for DOT preventive maintenance activities and $762 million for the new State and Local Bridge Preservation Program. Additional funding is also provided for other transportation modes including non-MTA transit systems, aviation facilities, and rail initiatives. The Executive Budget includes a total of 339 new positions to support the State and Local Bridge Preservation Program, including staff for additional bridge maintenance crews and State and local project oversight. Another 30 preventive maintenance positions will enhance the Department’s ability to maintain its heavy equipment and reduce reliance on outside repair work. The Budget also includes 25 new positions to replace consultant contracts for information technology and bridge inspections with State staff. A total of 22 positions will be eliminated due to administrative automation and efficiencies. Preventive maintenance continues to be a key component of DOT activities. Since preventive activities extend the life of a road or bridge, they are cost-effective alternatives to major reconstruction. For highways, the goal of keeping water and other materials away from the base of the highway is accomplished through activities such as crack sealing, pothole repair, joint repair and drainage repair. Painting, washing, joint repair and maintaining drainage are key elements to extending the life of State bridges. In addition to $1.05 billion in maintenance contracts, $1.26 billion will be available for preventive maintenance activities over the next five years, including $100 million for the Department’s federally-funded Maintenance First initiative. The Executive Budget further enhances funding for preventive maintenance activities by providing almost $140 million for the new State and Local Bridge Preservation Program in 2008-09 that includes $17 million in support of State bridge crews and program oversight, $50 million for bridge maintenance contracts, $13 million for capital contracts and related engineering, and $60 million to support bridge maintenance contracts for localities. A total of almost $762 million is provided through 2012-13. In addition, the Executive Budget includes a total of 339 new positions to support the State and Local Bridge Preservation Program, including staff for additional bridge maintenance crews and State and local project oversight. During the plan period, $1.79 billion will be available from the DHBTF for snow and ice control activities. This includes $67 million to support estimated Thruway Authority operating and maintenance costs associated with Interstate 84. The Department’s maintenance activities are supported by 313 sites around the State which encompass 60 maintenance headquarters, 125 maintenance sub-headquarters, 236 salt storage areas, 34 bridge crew facilities, 2 special crew facilities and 70 other storage and reload sites. The average age of the infrastructure is over 30 years. The total size of the infrastructure is approximately four million gross square feet. The Department’s maintenance facilities plan consists of an annual review of its overall needs and a prioritization of its projects. The program goal is to upgrade and repair its infrastructure based on evaluation of the condition, proposed use and corresponding health, safety and environmental concerns.

AGENCY CAPITAL PROGRAM PLANS
69
Financing the Plan The 2008 five-year capital program plan for DOT and the operating expenses of the Departments of Transportation and Motor Vehicles will be financed with approximately $10.8 billion of State revenues during the next five years. These revenues will provide for pay-as-you-go capital and operating needs and for debt service payments on bonds issued by the State and Thruway Authority. Federal aid will also support a significant portion of the plan. The 2008-09 Executive Budget includes a cash transfer of almost $119 million from the General Fund to the Dedicated Highway and Bridge Trust Fund to address a projected funding shortfall in 2008-09. In addition, Department of Motor Vehicle (DMV) fees are increased to support DMV’s Western Hemisphere Travel Initiative. Revenue from a portion of a $20 annual fee assessed on automobile insurance policies throughout the State will also be used to support the State and Local Bridge Preservation Program. Under current assumptions, additional resources of up to $212 million will also need to be identified for the 2009-10 fiscal year. As a placeholder for a successor plan, program levels are assumed to be relatively flat after 2009-10. Significant new resources will need to be identified to support program commitments in a successor five-year plan due to a combination of factors, including: growth in debt service attributable to a 2005 debt restructuring; projected nominal growth in transportation-related revenues; commodities-related inflationary pressures; and the non-recurring 2005 Transportation Bond Act. Legislation passed in July 2007 authorizing consideration of a congestion pricing plan for New York City also requires the Department of Transportation to submit a new five-year capital program by March 31, 2008 for state and local highway and bridge, rail and ports, aviation and non-MTA transit for State fiscal years 2009-10 through 2013-14. This five-year program is to include system-wide goals and objectives for capital spending, the amount of capital funding required for each year and an estimate of the sources of such capital funding. DEPARTMENT OF MOTOR VEHICLES The DMV issues drivers’ licenses and vehicle registrations, promotes highway safety, and collects revenues used for transportation purposes, including capital projects. The five-year plan recommends funding over $1.1 billion of the Department’s transportation-related cash expenses from the Dedicated Highway and Bridge Trust Fund. CANALS The New York State Canal Corporation maintains, operates, develops and makes capital improvements to the 524-mile navigable waterway that includes 57 locks, numerous dams, reservoirs and water control structures. Canal revenues are deposited into the Canal System Development Fund and, in accordance with the State Constitution, are used exclusively for the canals. Maintenance on the canals is conducted on an ongoing basis to ensure that canal facilities operate properly and that public safety is maintained.

AGENCY CAPITAL PROGRAM PLANS
70
The 2005 Transportation Bond Act provided $50 million from 2005-06 through 2009-10 to advance additional capital projects. These funds are appropriated through the DOT budget. The majority of Canal Corporation funding is provided by the Thruway Authority.

AGENCY CAPITAL PROGRAM PLANS
71
PARKS AND ENVIRONMENT The Department of Environmental Conservation (DEC) and the Office of Parks, Recreation and Historic Preservation (OPRHP) are the primary agencies responsible for preserving and protecting the State’s extensive environmental, historic and cultural resources, as well as providing recreational opportunities for its citizens. Each agency is responsible for the development and maintenance of a wide array of capital facilities. This category also includes recommended capital projects funding for the Environmental Facilities Corporation (EFC) and the Hudson River Park Trust. A major focus of these agencies will be the $110 million capital infusion recommended with the 2008-09 Executive Budget. This project would provide funds for improvements in the state parks system as well as DEC campgrounds, the State fairgrounds and the Walkway Over the Hudson River project. This initiative is a component of the $1 billion Upstate Revitalization Fund. This Budget also proposes expanding the Bottle Bill to include most non-carbonated beverages and redirecting all unclaimed deposits to the Environmental Protection Fund (EPF). DEC, OPRHP and other agencies will continue to clean up environmental hazards under the State Superfund and Brownfields program and implement the EPF. DEPARTMENT OF ENVIRONMENTAL CONSERVATION DEC is charged with protecting the State’s natural resources. Department responsibilities include cleaning up solid and hazardous waste disposal sites, enforcing air and water quality standards, maintaining hundreds of flood and coastal erosion projects and stewardship of over four million acres of State land. The Department also provides safe opportunities for outdoor recreation, including hunting, fishing, camping, hiking and other activities. DEC manages hundreds of facilities including dams, boat launch sites, campgrounds, fish hatcheries, wildlife management areas and a ski area. The DEC capital program enhances and maintains the infrastructure necessary to provide a safe environment. An estimated $540 million in capital disbursements will support these activities in 2008-09. The DEC capital plan directs resources to projects to ensure compliance with health and safety requirements and State and Federal environmental mandates. In 2008-09, new Capital Projects Fund appropriations of $31.9 million are recommended to address these needs, and to maintain and upgrade campgrounds, environmental centers and camps, fish hatcheries and other Department-owned buildings and facilities, maintain flood control structures, and fund shore protection projects for communities threatened by coastal erosion. This includes $8 million from the $110 million capital infusion specifically designated for parks and recreational facility improvements. Recommendations also include $10 million for the remediation of Onondaga Lake. A key element of the DEC capital program is the EPF, a dedicated fund supported by revenues from the Real Estate Transfer Tax and other sources. The Executive Budget includes new appropriations of $250 million for 2008-09 to fund a host of critical environmental and recreational activities including: municipal waste reduction and recycling; waterfront revitalization projects; non-point source water pollution control; smart growth; open space land acquisition; municipal park projects; Hudson River Estuary

AGENCY CAPITAL PROGRAM PLANS
72
Management; and water quality improvement projects. The Executive Budget also includes the addition of three new EPF accounts: farmland protection, environmental justice and renewable energy and additional monies dedicated to open space and the Catskill Interpretative Center. The Executive Budget contains a proposal to expand the Bottle Bill to most non-carbonated beverages and redirect all unclaimed deposits to the State to support future spending in the EPF. These modifications will provide approximately an additional $25 million in additional receipts to the EPF in SFY 2008-09. These unclaimed deposits are expected to total $100 million annually. Additional EPF appropriations of $1.45 billion through 2012-13 will continue funding for these important activities. The Department’s capital plan also reflects the State Superfund and Brownfields program enacted in 2003. This Budget proposes changes to the Brownfields program credits to reflect a new focus on environmental remediation. Appropriations provide for $120 million in annual support to be bond-financed for the remediation of hazardous waste and hazardous substances and for off-site contamination at Brownfield Cleanup Program sites. The debt service on these bonds will be supported equally by the State and industry. In addition, $25.3 million in General Fund support is provided for technical assistance grants, Brownfield Opportunity Area grants, State implementation of the Brownfield Cleanup Program, and non-bondable costs of the State Superfund and Brownfield Cleanup programs. These programs, which succeed the fully committed $1.1 billion 1986 Environmental Quality Bond Act, will maintain stringent environmental and public health standards, while spurring redevelopment of contaminated sites. The 2008-09 Executive Budget recommends new disbursements totaling more than $50 million from the 1996 Clean Water/Clean Air (CW/CA) Bond Act for projects to be administered by DEC. The CW/CA Bond Act funds such important activities as: water quality improvement projects, landfill closure and recycling projects, Brownfields projects, safe drinking water projects and air quality improvement projects. The total authorization of $1.75 billion has been made available from the Bond Act. In 2008-09, the level of contract commitments projected in the Department’s capital plan is $537 million. This is a $15 million increase over levels in the 2007-08 Capital Plan. Future year commitments are also consistent with appropriation levels recommended over the next five years. The DEC capital maintenance plan will focus on preservation and preventive maintenance of its various lands, facilities and other structures. The Department manages a vast array of assets that vary in age, condition, and useful life, including: approximately 4.4 million acres of land, over 300 boat launching and fishing access sites, 102 flood control structures, 52 campgrounds, 12 fish hatcheries, one game farm, four environmental education camps, five environmental education centers, one tree nursery, and the Belleayre Mountain Ski Center. The Department has recently developed a maintenance information management system to facilitate planning and preventive maintenance for these extensive resources.

AGENCY CAPITAL PROGRAM PLANS
73
ENVIRONMENTAL FACILITIES CORPORATION The EFC is charged with helping local governments, State agencies and private industry comply with State and Federal environmental laws. EFC’s responsibilities include administering the Clean Water (CWSRF) and Drinking Water (DWSRF) State Revolving Funds; assisting New York businesses finance environmental projects through the Industrial Finance Program; and helping municipalities, State agencies and businesses comply with environmental laws and regulations through the Technical Advisory Services Program, the Financial Assistance to Business Program and the Pipeline for Jobs program. EFC, in conjunction with the Department of Environmental Conservation (DEC), administers low-interest financings to recipients for water pollution control facilities via the CWSRF. As of June 30, 2007, the CWSRF has made 1,518 financings for approximately $13 billion to 477 recipients across the State since the program was initiated in 1990. DWSRF is a program administered by EFC, in conjunction with the Department of Health (DOH), that provides low-interest financings, including grants, to publicly and privately owned community water systems, and to nonprofit, non-community water systems for the construction of eligible safe drinking water projects. From its initiation in 1996 through June 30, 2007, the DWSRF has made 491 financings, 67 State Assistance Payments and 103 Federal Assistance Payments, worth approximately $2 billion, to 315 recipients across the State. In addition to appropriations to finance costs related to the administration of the 1996 Clean Water/Clean Air Bond Act, the EFC Capital Program includes the reappropriation of $5 million for the Pipeline for Jobs program. This program was created to provide recipients with financial assistance for the planning, design and construction of eligible projects that are intended to create, improve or extend water supply facilities for economic development. HUDSON RIVER PARK TRUST The Trust is responsible for designing, developing, constructing, and maintaining the 550-acre Hudson River Park in New York City, which extends for five miles along the Hudson River waterfront from Battery Park City to 59th Street. During 2008-09, the Trust will continue to refine the framework and scope of the Hudson River Park, develop detailed cost estimates, explore alternative sources of funding, and continue to oversee project design and construction. The 2008-09 Budget recommendations provide a capital advance appropriation of $25 million for New York City’s share of the project. The Budget also proposes funding for new obligations of $20 million to continue construction of the remaining segments of the Park. OFFICE OF PARKS, RECREATION AND HISTORIC PRESERVATION OPRHP operates 178 State parks and 35 historic sites that provide a place for visitors to relax and learn about New York’s natural, historic, and recreational treasures. Nearly 55 million people visit the State parks each year.

AGENCY CAPITAL PROGRAM PLANS
74
The State’s park system is one of the oldest and best developed in the nation, featuring 28 golf courses, 76 developed beaches, 53 water recreation facilities, and more than 5,000 buildings. Since more than 50 percent of facilities at State parks are at least 50 years old, a primary component of the capital program is devoted to maintenance and rehabilitation. For 2008-09, the capital plan supports nearly $104 million in disbursements from various sources. New appropriations of $144.2 million are recommended for capital projects from the State Park Infrastructure Fund (SPIF), a dedicated fund consisting of revenues generated from day use and camping fees at the parks, as well as other miscellaneous revenues. Support is also provided for OPRHP’s capital program from fiduciary funds and Federal resources. In addition, funding will be available from the Environmental Protection Fund and the 1996 Clean Water/Clean Air Bond Act to improve park facilities and protect the fragile natural resources at State parks. These funds are included in the DEC capital budget. The OPRHP capital plan reflects the priority needs of the various parks and historic sites. A total of $278 million over the course of the Financial Plan period, mainly from SPIF, is planned to be spent on projects to improve health and safety and preserve facilities. The $110 million capital infusion proposed with this Budget will provide over $90 million for actions to:
● Maintain and restore historic sites; ● Rehabilitate park utility, sanitary and water systems; ● Improve selected roads and bridges; ● Upgrade public comfort stations and campground wash houses; ● Maintain and improve park buildings, cabins and pool facilities; and ● Develop newly acquired park lands.
Portions of this investment will go to support the $1 billion upstate revitalization effort. The OPHRP capital maintenance plan for 2008-09 concentrates investments in preservation and protection of its many facilities. Physical assets consist of approximately 5,000 buildings which vary in age, condition, and useful life including: historic buildings, offices, cabins, comfort stations, maintenance/storage buildings, restaurants, visitor/nature centers, pump houses, and toll booths. Maintenance efforts in 2008-09 will focus on site restoration, roof repair and exterior construction projects. The level of contract commitments projected in the OPRHP capital plan is $124.6 million in 2008-09. Future year commitments reflect projected activity from both new appropriations and prior year appropriations.
AGENCY CAPITAL PROGRAM PLANS
75
ECONOMIC DEVELOPMENT AND GOVERNMENT OVERSIGHT
Economic Development and Government Oversight spending, including funds that will be spent directly from the sale of surplus property, of slightly over $5.0 billion is projected to average almost $1.0 billion annually over the five-year Capital Plan and will support: economic development projects; housing programs administered by the Division of Housing and Community Renewal (DHCR); the disposal of nuclear waste at the Western New York Nuclear Service Center at West Valley; and the preservation and improvement of State Fairground Buildings. The five-year Capital Plan includes support for new and existing programs that will promote upstate revitalization, Statewide infrastructure improvements and downstate regional initiatives to assist the State with enhancing the quality of life for New Yorkers while stimulating economic growth and job creation, including:
● $400 million for various economic development and regional initiatives including a statewide competitive grant program administered by the Empire State Development Corporation (ESDC), specific downstate regional initiatives and upstate city-by-city projects;
• $1.8 billion to support a targeted and comprehensive infrastructure and economic
development plan with statewide initiatives and programs targeted to upstate; and • Over $2.5 billion for continued support of an international computer chip research
and development center, capital improvements at Governor’s Island and Roosevelt Island in New York City, redevelopment initiatives at the Harriman Research and Technology Park and in Niagara Falls, and specific economic development, cultural facilities, university development, environmental, and energy projects administered by ESDC and Dormitory Authority of New York (DASNY), including $650 million for the development of a semiconductor manufacturing facility and $300 million for the Restore NY Communities Initiative.
Capital spending for housing will average $104.2 million annually over the Capital Plan and will continue to facilitate the construction and preservation of the State’s low and moderate income housing stock, including both the Homeless Housing Assistance Program and housing programs administered by DHCR. DEPARTMENT OF AGRICULTURE AND MARKETS The Department of Agriculture and Markets, in conjunction with the Industrial Exhibit Authority, is responsible for operating the New York State Fair and maintaining its buildings and grounds. The Fairgrounds include 20 major buildings and 107 other structures, the majority of which have a useful life of greater than 10 years and are in good or fair overall condition.
Condition Capital Asset Group Age Range Good Fair Poor Total Various State Fair Buildings 4 to 97 yrs. 66 43 18 127

AGENCY CAPITAL PROGRAM PLANS
76
The 2008-09 Capital Plan includes approximately $1.75 million in capital disbursements supported by a transfer from the General Fund and a total of $3.75 million in new appropriations to repair and rehabilitate the Fair’s facilities to ensure a safe and enjoyable experience for all Fair patrons and participants. In addition, $3.5 million in appropriations from the $110 million capital program for parks and recreational facilities will be provided to the Department for State Fair infrastructure capital projects. For 2008-09, the Capital Plan includes $1.5 million in disbursements for the Fredonia Vineyard Laboratory and $1 million for the Cornell Equine Drug Testing Laboratory. In addition, the 2008-09 Executive Budget recommends a Special Revenue funds appropriation (financed by revenues from public/private partnership agreements and year-round operation of the Fairgrounds) to complete needed improvements at various Fairgrounds buildings. The Department’s capital maintenance plan for the next five years prioritizes those projects that will preserve, rehabilitate, and improve the Fairgrounds’ buildings, land, and infrastructure for year-round use, and continue to protect the State’s investment in the facility. In addition, the Fairgrounds’ structures are upgraded continually to meet more stringent building code requirements, provide accessibility for the disabled, and ensure public safety. For 2008-09, the level of commitments projected in the Capital Plan is $42.75 million. Future year commitments are consistent with planned appropriation levels over the plan. ECONOMIC DEVELOPMENT AND FOUNDATION FOR SCIENCE, TECHNOLOGY AND INNOVATION For 2008-09, the Capital Plan focuses on upstate revitalization, statewide infrastructure improvements and downstate regional initiatives to assist the State with enhancing the quality of life for New Yorkers while stimulating economic growth and job creation. To meet this objective the Capital Plan includes $400 million for various economic development and regional initiatives including a statewide competitive grant program administered by ESDC, specific downstate regional initiatives and upstate city-by-city projects. The Capital Plan also includes $1.8 billion to support a targeted and comprehensive infrastructure and economic development plan with statewide initiatives and programs targeted to upstate, which will be funded by a combination of sources including the sale of property at the Jacob K. Javits Convention Center site and other surplus State-owned property; from the release of reserves held by SONYMA Mortgage Insurance Fund; and other sources. The Capital Plan continues State support of $350 million for regional economic development projects authorized in 2007-08 and administered by ESDC, including: $300 million for the development of an international computer chip research and development center; $20 million to Governor’s Island for projects that enhance heritage tourism attractions, and develop education, conference and cultural arts facilities; $15 million to the Roosevelt Island Operating Corporation for the modernization of the aerial tramway; $7.5 million to the Harriman Research Technology Development Corporation for projects to

AGENCY CAPITAL PROGRAM PLANS
77
transform Albany’s State Office Campus into a world class research and technology park; and $7.95 million to USA Niagara for projects that encourage growth and renewal of the tourism industry. In addition, the Capital Plan also continues support for over $2.3 billion for specific economic development, cultural facilities, university development, environmental, and energy projects authorized in 2006-07 and administered by ESDC and DASNY including $650 million for the development of a semiconductor manufacturing facility and $300 million for the RESTORE New York Communities initiative. The Capital Plan also continues the $1.45 billion Centers of Excellence/Empire Opportunity Fund/Gen*NY*sis/ RESTORE which are also administered by ESDC and DASNY. This program was established to foster collaboration between the academic research community and the business sector in order to develop and commercialize new products and technologies; to promote critical private sector investment in emerging high technology fields; and to create and expand technology related businesses and employment. In addition, the program also finances projects that create or retain jobs or increase business activity through the construction and rehabilitation of research and development facilities, incubators and industrial parks; downtown commercial revitalization; Brownfield redevelopment; as well as other types of activities. The Capital Plan also includes reappropriations for previously authorized environmental, higher education, cultural, and economic development projects, including: $224.6 million for the Technology and Development Program authorized in 2005-06; $82.5 million for the regional Economic Development Program authorized in 2005-06; $224.3 million for the New York State Economic Development Program authorized in 2005-06; $425 million for the Community Enhancement Facilities Assistance Program (CEFAP) authorized in 1997-98; $126.9 million for the Strategic Investment Program (SIP) authorized in 2000-01; $350 million for the Jacob K. Javits Convention Center Expansion authorized in 2005-06; $74.7 million and $44.7 million respectively for related infrastructure improvements associated with the construction of two new baseball stadiums in the Bronx and Queens authorized in 2005-06; $41.5 million for economic development projects in the Buffalo area authorized in 2000-01; $5.5 million for the Olympic Regional Development Authority (ORDA) to construct a ski bowl connection at Old Gore Mountain authorized in 2006-07; and $14.6 million for the New York State Foundation for Science, Technology and Innovation Capital Facilities Program authorized in 1999-2000. ENERGY RESEARCH AND DEVELOPMENT AUTHORITY The ERDA owns and manages the Western New York Nuclear Service Center at West Valley in Cattaraugus County, the site of a former nuclear fuel reprocessing facility and an inactive low-level radioactive waste disposal area. The Capital Plan includes $67.5 million in appropriations reflecting ERDA’s continuing role in a joint Federal-State Demonstration Project to treat and dispose of liquid nuclear waste at the Center and decommission the reprocessing facility. The Plan also includes ERDA’s ongoing maintenance costs at the disposal area to ensure its compliance with environmental laws. The 2008-09 commitment level for ongoing work at West Valley is $13.5 million.

AGENCY CAPITAL PROGRAM PLANS
78
The Western New York Service Center is approximately 40 years of age, in good condition, with a remaining useful life that will extend to the conclusion of the decommissioning of the site. The maintenance goal at the site is to preserve the facility in a state of good repair. DIVISION OF HOUSING AND COMMUNITY RENEWAL The State’s housing capital programs provide grants, low-interest loans and technical assistance to facilitate construction and preservation of the State’s low- and moderate-income housing stock. State capital funds are combined with Federal funds, low-cost mortgages and available private sector investments to finance activities that, absent the State’s involvement, would not be financially feasible. In addition to developing and maintaining low-cost housing, the housing capital programs foster economic growth across the State by creating additional construction jobs and encouraging new private sector investment in distressed areas. The State’s housing capital appropriations are made to the DHCR, the State agency charged with coordinating the State’s housing policies and programs. The individual housing programs are implemented through four public benefit corporations: the Housing Trust Fund Corporation (HTFC), the Affordable Housing Corporation (AHC), the Homeless Housing Assistance Corporation (HHAC), and Housing Finance Agency (HFA). DHCR staff performs the administrative functions generally associated with low-income housing programs, as well as oversees the State’s involvement in Federal capital programs. HFA staff provides administrative support for the State programs that generally target moderate-income households. The Capital Plan recommends $104.2 million in appropriations in 2008-09 to fund six housing capital programs:
● $29 million to the Low-Income Housing Trust Fund program to provide grants of up to $100,000 per unit to construct or renovate low-income apartment projects;
● $25 million to the Affordable Housing Corporation, which provides grants of up to
$40,000 per unit to low- and moderate-income households to assist in the acquisition or renovation of their homes;
● $12.8 million to the Public Housing Modernization Program to subsidize repairs at
74 State-supervised public housing projects across the State. A total of $400,000 from this appropriation will be reserved to fund capital activities aimed at reducing illegal drug activities at these projects;
● $7 million for the Homes for Working Families program to continue this award-
winning initiative which combines State funds with other available public and private sector moneys, Federal Low Income Tax Credit proceeds and non-State supported bond funds to construct affordable rental housing for low- and moderate-income households;

AGENCY CAPITAL PROGRAM PLANS
79
● $400,000 for the Housing Opportunities for the Elderly Program, which provides grants to low-income elderly homeowners for emergency home repairs; and
● $30 million to the Homeless Housing Assistance Program which is funded from the
Office of Temporary and Disability Assistance (OTDA) to not-for-profit corporations and municipalities to expand and improve the supply of permanent, transitional and emergency housing for homeless persons.
In addition to State-funded programs, HTFC also awards and disburses Federal moneys pursuant to the U.S. Department of Housing and Urban Development’s HOME program. This program provides grants to not-for-profit groups and local governments to partially fund the construction or rehabilitation of low- and moderate-income housing. The Executive Budget also includes a reappropriation of $10.6 million to continue programs funded from the State’s Housing Assistance Fund (HAF). The HAF was established in 1988 with a one-time appropriation to fund eight housing construction and development programs serving low- and moderate-income households with specific housing needs. The 2008-09 Capital Plan contemplates the commitment of State housing funds in the year in which funds are appropriated. Requests for funding from the State’s various housing programs are reviewed and evaluated on an annual basis by program staff. These applications are submitted by private and not-for-profit sponsors of proposed low- and moderate-income housing projects. The applications are scored and ranked on a competitive basis and the review process culminates in award notifications for the most effective projects in meeting the State’s housing needs. As part of the 2008-09 comprehensive infrastructure and economic development plan, a total of $400 million will be used for a new “Housing Opportunity Fund.” These resources will be targeted to the development of affordable, supportive and workforce housing initiatives across the state. The new Fund will be financed by the release of reserves held by the SONYMA Mortgage Insurance Fund, and the sale of property at the Jacob K. Javits Convention Center site, and will provide $300 million for Downstate housing efforts and $100 million will be provided for upstate housing efforts in support of the Upstate Revitalization Fund.

AGENCY CAPITAL PROGRAM PLANS
80
HEALTH AND SOCIAL WELFARE OFFICE OF CHILDREN AND FAMILY SERVICES OCFS operates 35 residential youth facilities and 8 non-residential programs which serve approximately 1,650 youth, ages 7 to 21. OCFS facilities operate at a variety of security levels, ranging from secure centers, primarily housing juvenile offenders who were tried as adults, to community-based residences. The OCFS Capital Plan reflects the State’s continued commitment to providing safe and functional housing and programming to the youth in its facilities. To improve operational efficiencies, eliminate significant excess capacity in its non-secure facilities, and allow for reinvestments that will better serve at-risk youth, OCFS has announced the closure of six facilities effective January 2009, along with the closure and re-use of one facility effective May 2008. The OCFS Capital Plan reflects cost avoidances resulting from this “right-sizing” effort. The OCFS capital planning process will continue to identify improvements to its remaining facilities to increase security, meet health and safety standards, and provide for program enhancements related to population needs. The agency’s capital program focuses on the need to properly maintain its youth facilities and initiate modifications to accommodate program changes. This year’s Capital Plan includes funding for facility preservation, environmental protection, health and safety, and security improvements. Section 529 of the Social Services Law requires OCFS to maintain the community house within the Tonawanda Indian Reservation. This year’s plan provides additional funding for this purpose. The OCFS capital program is funded from the Capital Projects Fund, the Youth Facilities Improvement Fund, and the Miscellaneous Capital Projects Fund. Disbursements from the Youth Facilities Improvement Fund are reimbursed with bond proceeds. OCFS’s Five-Year Capital Plan calls for disbursements of approximately $108 million, a $5 million reduction from its 2007-08 Five-Year Plan, reflecting the planned closure of seven facilities and changes in the agency’s capital project implementation schedule. The Plan will support capital maintenance and improvement activities, including $54 million for facility rehabilitation and security enhancements, $21 million for health and safety purposes, and $18 million for environmental compliance projects. The Capital Plan also projects $18 million in 2008-09 contract commitments, an increase of $4 million from 2007-08 projected levels related to security improvement projects. In 2008-09, the OCFS capital program will include additional security projects, health and safety related repairs, environmental compliance work and physical plant rehabilitation projects aimed at preserving the useful life of its facilities and infrastructure. Most of OCFS’s youth facilities are more than 30-years-old and in “fair” condition, indicating the need for repair and/or improvement. The following chart provides information regarding age and condition of OCFS youth facilities by security level.

AGENCY CAPITAL PROGRAM PLANS
81
Good
1
ConditionFair Poor
3 0 Total
4 Capital Asset Group Secure Facilities
Age Range 20-45
Limited Secure Facilities 10-100+ 2 6 1 9 Newer Non-Secure Facilities 10-15 7 0 0 7 Older Non-Secure Facilities 35-85 1 1 9 11 Group Homes 30-40 0 4 0 4 Total 11 14 10 35
DEPARTMENT OF HEALTH The focus of DOH’s capital program is to promote the efficient operation of health care facilities statewide, protect the health and safety of its patients, employees and visitors and maintain the Wadsworth Center for Laboratories and Research. A key component of the Department’s capital program is the investment of $1 billion to finance the Health Care Efficiency and Affordability Law for New Yorkers (HEAL NY). Established in 2005-06, HEAL NY will support health care projects to upgrade information systems and technology, enhance the efficiency of facility operations and support facility improvements, reconfiguration and consolidation. HEAL NY will also be used to implement the recommendations of the Commission on Health Care Facilities in the 21st Century, which were released in November 2006. Another integral part of the DOH capital program is to maintain and improve its capital assets which include five health care facilities: Helen Hayes Hospital in West Haverstraw and the Oxford, St. Albans, Batavia, and Montrose veterans’ nursing homes. The Department also maintains the Wadsworth Center for Laboratories and Research, which is comprised of three laboratories located in Albany County. In January 1999, pursuant to State statute and an operating agreement between the two parties, responsibility for operation of the Roswell Park Cancer Institute was transferred from the Department to the Roswell Park Cancer Institute Corporation. The Corporation is now responsible for the ongoing maintenance of Roswell’s capital assets. Over the next five years, the DOH’s capital program includes $388 million in new appropriations, including $250 million for the HEAL NY Program and $50 million to support capital improvements at Wadsworth Center for Laboratories and Research facilities. The Department’s capital program is financed by the State’s General Fund, the Health Care Reform Act (HCRA), DASNY bond proceeds and Federal funds. Total disbursements are estimated at $943 million over the five-year plan — including $800 million for the HEAL NY Program ($425 million for non-bondable projects and $375 million which will be bond financed); $50 million from Federal funds for Safe Drinking Water projects; $86 million from the General Fund for the laboratories and institutions; $5 million for the construction of an umbilical cord blood bank; and roughly $2 million for new construction at the Oxford facility. Debt service and non-bondable project costs for the HEAL NY Program will be financed from HCRA. Debt Service on outstanding institutional DASNY Bonds will continue to be supported by patient care revenues. For 2008-09 DOH’s Capital Program includes both ongoing and new projects to address major capital needs with estimated total disbursements of $295 million. Planned projects will avert potentially more costly future capital expenditures while minimizing

AGENCY CAPITAL PROGRAM PLANS
82
interruptions in clinical care services and laboratory functions. In addition, the Department will continue its participation in implementing the Safe Drinking Water Program, which will be financed through a $10 million Federal appropriation in 2008-09. Furthermore, a bond-financed State reappropriation of $21 million is recommended in 2008-09 for the State’s share of a new $66 million veterans’ nursing home at Oxford. DOH was awarded $43 million in Federal funds to finance the Federal share of the project costs. In addition, DOH will use $2 million in other funding to complete the project. Oxford is the oldest of the State’s four veterans’ homes and the proposed 242-bed home will replace the existing 25-year old facility. The Department’s goals are to ensure a safe environment, preserve infrastructure and related equipment and to promote energy efficiency. The Capital Asset Maintenance Plan preserves the useful life of DOH’s facilities. The following table identifies the capital asset group, age and condition of DOH’s facilities:
Capital Asset Group Helen Hayes Hospital
Age Range
26-75 % Good
77
Building Conditions % Fair % Poor
17 6 Total 100
Wadsworth Center for Laboratories 5-50 and Research Griffin Laboratory 25 50 25 100 David Axelrod Institute 100 0 0 100 Biggs Laboratory 0 70 30 100Veteran’s Nursing Homes Oxford 4-102 20 20 60 100 St. Albans 15 100 0 0 100 Batavia 13 100 0 0 100 Montrose 7 100 0 0 100
OFFICE OF TEMPORARY AND DISABILITY ASSISTANCE (OTDA) OTDA administers the Homeless Housing and Assistance Program (HHAP) which provides grants to not-for-profit corporations and municipalities to expand and improve the supply of permanent, transitional, and emergency housing for homeless persons. To date, over $662 million in HHAP funding has supported 559 capital projects statewide, creating approximately 12,800 housing units for the homeless. HHAP also links its projects to other State and Federal funding sources to deliver appropriate support services to help tenants move towards greater self-sufficiency and economic stability. The State Fiscal Year 2008-09 Capital Plan maintains the HHAP commitment level at $30 million, including up to $5 million for the development of housing for persons with HIV or AIDS.

AGENCY CAPITAL PROGRAM PLANS
83
EDUCATION Capital planning is vital to the teaching, research and public service missions of both the State University of New York (SUNY) and the City University of New York (CUNY). Capital plans ensure that facilities are appropriately designed and developed to meet both current and future needs, while providing a safe and healthy environment for students, faculty and staff. The State Education Department’s (SED) ongoing capital programs encompass the Department’s various administrative offices, the State Museum, Library and Archives and the rehabilitation of schools for the deaf, the blind and Native Americans. In the 2007-08 Executive Budget, the Governor called upon SUNY and CUNY to develop new five-year capital plans for 2008-09. In response to these plans, the 2008-09 Executive Budget provides a new five-year capital funding framework that will promote stability, predictability and greater discipline in the capital funding process, while ensuring campus priorities are balanced with available resources. STATE UNIVERSITY OF NEW YORK SUNY is the largest public university system in the nation, with 29 State-operated campuses, 5 statutory colleges and 30 community colleges serving more than 425,000 students. The goal of SUNY’s capital program is to both provide and preserve the physical infrastructure needed for the education of students. SUNY State-operated campuses include approximately 2,100 buildings, encompassing classrooms, dormitories, libraries, research laboratories, athletic and recreation facilities, hospitals and dining halls. Currently, 73 percent of SUNY’s facilities exceed 30 years of age and are in need of renovation, rehabilitation and repair. Accordingly, SUNY’s capital program continues to emphasize the preservation of its existing State-operated facilities. SUNY’s State-operated campus capital planning process starts with building condition surveys and the development of facility master plans for each campus to identify both new construction and rehabilitation projects. These plans are further developed into a system-wide, five-year University Master Capital Plan, approved by the SUNY Board of Trustees. The Trustees’ capital budget request is, in large part, based on priority projects from the Master Plan. Capital priorities at SUNY’s 30 community colleges include major rehabilitation as well as targeted new construction at various campuses to accommodate evolving academic needs. Community college master plans are developed by the same process as those of the State-operated campuses, and are then submitted to the local Boards of Trustees. The approved master plans inform the SUNY Board of Trustees’ capital budget request, and projects which receive local sponsor matching support are advanced for State funding. The 2008-09 Executive Budget includes a new $6.5 billion five-year capital investment program that will provide nearly $4.4 billion to respond to the critical maintenance needs and strategic priorities of SUNY State-operated campuses, as well as $526 million in community college support. In addition, $1.02 billion in appropriation authority is

AGENCY CAPITAL PROGRAM PLANS
84
recommended for self-supporting capital projects for SUNY’s Hospitals and Residence Halls programs, as well as $500 million in spending authority for Educational Facilities projects supported by non-State funds (i.e. grants and donations). A core component of the new five-year capital plan is funding for critical maintenance projects that address the health, safety, rehabilitation and preservation needs of SUNY’s educational facilities. To assist in the identification and prioritization of such projects, SUNY enlisted the services of a national consulting firm to determine the current backlog of deferred maintenance and the amount of annual renewal work required to keep State-operated facilities in a state of good repair. Based on these findings, the Executive Budget includes the initial $550 million of a planned annual investment to meet the critical maintenance needs of the State University. Critical maintenance projects supported in the new five-year plan focus on various needs including:
● Preservation and rehabilitation needs; ● Remediation of code violations; ● The meeting of accreditation standards; ● Access for the disabled; and ● Preserving the integrity of SUNY’s capital plant.
An additional appropriation of $1.6 billion will be provided for strategic initiatives that improve, enhance and advance the academic, research, recreational and community support priorities of the State University. Strategic initiative projects within appropriated funding levels that are advanced by the SUNY Board of Trustees will be subject to approval by a newly established University Capital Projects Review Board. The Board shall consist of five members: one appointed directly by the Governor, with the remaining members appointed by the President of the Senate, the Speaker of the Assembly, the Senate Minority Leader and the Assembly Minority Leader. Other components of the capital program for 2008-09 through 2012-13 include: $573 million for both new and renovated residence hall facilities, and $450 million for hospital projects that address local health care needs as affirmed by the New York State Department of Health. The 2008-09 Executive Budget also recommends $75 million in appropriation authority to support a pilot “Greening of SUNY” initiative. This self-supporting program will provide campuses the ability to fund projects that yield long-term operational savings through energy conservation. For 2008-09, contract commitments are expected to reach $688.0 million. This reflects activity levels consistent with the awarding of construction contracts for State-operated educational facilities as well as expected local sponsor support for community colleges. Total disbursements for both the State-operated and community colleges are estimated at $531.0 million in 2008-09 and are expected to increase to $738.0 million in 2012-13. These disbursements reflect anticipated commitment levels as well as estimated off-budget expenditures such as those for bonded community college projects and residence halls.

AGENCY CAPITAL PROGRAM PLANS
85
Accordingly, SUNY-related bond caps will be increased by $1.6 billion, for a total bonding authorization of $10.0 billion, to cover SUNY’s planned bond sales for the 2008-09 Capital Program. CITY UNIVERSITY OF NEW YORK The City University of New York is the nation’s largest urban public university. Its physical plant is comprised of 11 senior colleges, 6 community colleges, a graduate center, graduate school of journalism, law school and Central Administration. CUNY serves more than 232,000 full-time and part-time students in over 26 million gross square feet of leased and owned space. CUNY’s capital planning process begins with the development of a facility master plan for each campus, which details existing and anticipated facilities necessary to accommodate projected campus enrollment needs. The facility master plans provide the framework for development of the University’s capital budget request. CUNY’s rehabilitation projects are identified through building condition surveys, conducted jointly by DASNY and CUNY. New construction projects generally reflect the CUNY Board of Trustees’ policy to replace leased and temporary facilities with new, University-owned structures. Major projects at CUNY senior and community colleges are supported through bonds issued by DASNY. The State pays the full debt service on senior college projects, while the debt service for community colleges and Medgar Evers College is shared with the City of New York. Minor rehabilitation projects for health and safety and preservation purposes are primarily supported by State General Fund appropriations. The 2008-09 Executive Budget recommends a new $2.8 billion five-year capital investment program for CUNY that will provide nearly $2.58 billion for critical maintenance needs and strategic priorities of senior colleges and $260 million for community colleges. Funded projects encompass critical maintenance, health and safety, preservation and handicapped access projects as the plan’s main component, as well as the completion of ongoing projects at John Jay College and Medgar Evers College. As with SUNY, strategic initiative projects for senior colleges that are advanced by the CUNY Board of Trustees will be subject to approval by a newly established University Capital Projects Review Board. CUNY’s bond cap will increase by $210 million, for a total bonding authorization of $6.0 billion, to cover CUNY’s planned bond sales for the new five-year capital investment program. For 2008-09, contract commitments are projected to reach $411 million, reflecting activity levels that are consistent with the awarding of construction contracts for CUNY facilities. Total disbursements for both the senior and community colleges are estimated at $448.6 million in 2008-09, and are expected to be adjusted through 2012-13 to reflect anticipated commitment levels.

AGENCY CAPITAL PROGRAM PLANS
86
HIGHER EDUCATION FACILITIES CAPITAL MATCHING GRANTS PROGRAM The 2005-06 Budget included a new $150.0 million higher education facilities capital matching grant program for private colleges in New York. Under this program, $150.0 million will be awarded to private colleges based on enrollment and relative student financial need as measured by total awards provided through the Tuition Assistance Program. This program requires a three-to-one (non-State-to-State) match by institutions. Under this program, grants are awarded by the Higher Education Capital Matching Grant Board consisting of three members (one appointed directly by the Governor with the remaining members appointed upon the recommendation of the President of the Senate and the Speaker of the Assembly) serving one year terms. Grants may be used for the design, construction or acquisition of new facilities, rehabilitation and repair of existing facilities or for any projects for targeted priorities including economic development/high technology (including wet labs), critical academic facilities and urban renewal/historic preservation. The 2008-09 Executive Budget continues $150.0 million in reappropriation authority for grants to be determined by the Board in 2008-09. For 2008-09, commitments are projected to be $50.0 million and disbursements are projected to be $50.0 million, reflecting the continuation of this program. This program, once fully implemented, will leverage over $450.0 million in external funds to match the State’s $150.0 million investment, thereby providing for a combined capital program totaling $600.0 million. The State’s share of the program will be financed through the issuance of bonds. STATE EDUCATION DEPARTMENT (SED) The State Education Department’s capital program provides for the maintenance of administrative facilities in Albany, the School for the Blind in Batavia, the School for the Deaf in Rome, and the three Native American schools on the Onondaga, St. Regis Mohawk and Tuscarora reservations. The 2008-09 Capital Plan includes a Capital Projects Fund appropriation of $15 million for various maintenance projects, a $14 million appropriation to assist public libraries and library systems to enhance and improve their facilities, and a $12.6 million appropriation for the expansion of the State Records Center. The Capital Plan also partially replaces a previous state operations appropriation of $20 million for the State Museum Renewal project with a $15 million bonded appropriation for the bondable capital costs associated with the design and construction of three new galleries in the New York State Museum and the purchase of artwork and exhibits for these galleries. For fiscal year 2008-09, the total projected level of contract commitments is $57.9 million. Projects funded with prior-year appropriations are being designed and awarded as anticipated.

AGENCY CAPITAL PROGRAM PLANS
87
This Capital Plan will enable SED to maintain and preserve existing facilities, protect the health and safety of staff, students and the general public; and reduce dependence on leased space by maximizing the effective use of State-owned buildings. The Capital Plan continues to show the spending associated with the EXCEL Program. The bond proceeds for this program are administered by DASNY.

AGENCY CAPITAL PROGRAM PLANS
88
PUBLIC PROTECTION DEPARTMENT OF CORRECTIONAL SERVICES
As in past years, the primary focus of the 2008-09 capital projects recommendation is to preserve and maintain the State’s existing prison infrastructure which is comprised of 70 correctional institutions and two separate support buildings. The capital program ensures that all housing, medical, program, and support capacity remains functional, safe, and secure. To meet the future needs of the prison system, the Department’s capital program includes new appropriations of nearly $1.7 billion over the next five years, and $527 million in reappropriations. Nearly all of the capital program is financed by bonds issued by the Empire State Development Corporation. The 2008-09 budget reflects DOCS’s plan to close a medium security prison, two camps and a third camp located on the grounds of a medium security prison — reflecting a continuing downward trend in inmate population. These closures will allow the State to avoid substantial capital investments in these facilities, saving an estimated $30 million in maintenance costs over the next five years. As energy prices continue to rise, energy conservation projects are a major focus for the 2008-09 fiscal year. The Department plans to continue investing in energy efficiency projects by making upgrades at Lakeview, Albion and Orleans correctional facilities. These projects include upgrades to heating and lighting systems, water conservation measures, more energy efficient windows and insulation, and various other upgrades. For the last four years, the Department of Correctional Services, in cooperation with the Office of Mental Health, has been enhancing mental health services and expanding mental health treatment capacity within the prison system. Construction of a 100-bed Residential Mental Health Unit (RMHU) at the Marcy correctional facility is underway and scheduled to be completed in December 2008. Under the Five-Year Capital Plan, the creation of additional capacity for mental health services continues with additional RMHU capacity expected to open in 2009. Significant capital projects completed during 2007-08 include construction of a new Clinton correctional facility hospital, expansion of the Oneida Food Production Center and energy conservation projects and upgrades to emergency power and security systems. The Capital Asset Maintenance Plan is designed to preserve the useful life of the prison infrastructure. In evaluating assets, the Department has established a rating system to identify the condition of its physical plant, as a tool for prioritizing essential rehabilitation projects. The following table identifies the capital asset group, age and condition of the Department’s assets:

AGENCY CAPITAL PROGRAM PLANS
89
Good
7
ConditionFair Poor
9 0 Total
16 Capital Asset Group Minimum Security
Age Range 16 to 103 yrs.
Medium Security 17 to 119 yrs. 23 14 0 37 Maximum Security 8 to 191 yrs. 6 11 0 17 Support 73 to 88 yrs. 2 0 0 2 Total 38 34 0 72
DIVISION OF STATE POLICE The mission of the DSP, the only full-service law enforcement agency with statewide jurisdiction, is to serve, protect and defend the people of the State of New York. State Police employees strive to fulfill this mission each day, operating from more than 200 facilities across the State. These facilities, consisting of Troop Headquarters, Zone Headquarters, and Stations, are hubs for the activities of State Police uniformed, investigative and civilian staff. The central command and the agency’s administrative functions are housed at Division Headquarters in Albany. Agency activities are also conducted at specialized facilities such as the State Police Training Academy, and the Forensic Investigation Center. The Five-Year Capital Plan includes approximately $158 million in total new appropriations and reappropriations and nearly $129 million in projected disbursements for DSP. A major portion of the projected disbursements will be for construction of a Troop G Headquarters, for which appropriations have already been made. The plan includes new funding for facility improvements at Troop Headquarters to accommodate the consolidation of dispatch operations from multiple sites into a single site in each region, and for construction of evidence storage facilities at various Troop Headquarters. The DSP Capital Plan focuses on the maintenance and improvement of the Division’s State-owned facilities, ensuring that agency employees are provided with an environment which facilitates the safe and effective performance of their duties. Continued maintenance efforts have extended the useful life of these facilities, the conditions of which are detailed in the following table:
Good
1
Condition Fair Poor
0 0 Total
1 Capital Asset Group Forensic Investigation Center
Age Range 9 years
Troop Headquarters 28-49 years 8 1 0 9 Zone Headquarters 32-56 years 0 1 1 2 Stations 6-37 years 1 0 2 3 Total 10 2 3 15
DIVISION OF MILITARY AND NAVAL AFFAIRS DMNA operates 106 facilities that include 56 Army National Guard armories, six Air National Guard Bases, Camp Smith, five Local Training Areas and 11 ancillary buildings including Headquarters in Latham and the Military Museum in Saratoga Springs. Additionally, DMNA maintains 27 National Guard logistic facilities that support the operations and maintenance of military ground vehicles and aircraft, as well as warehousing programs and other miscellaneous activities. The total size of the infrastructure is approximately 5.6 million square feet. The average age of the infrastructure by square foot exceeds 73 years. An analysis conducted by the National Guard Bureau, Washington, D.C. has indicated that New York’s Army National Guard infrastructure is the oldest nationwide.

AGENCY CAPITAL PROGRAM PLANS
90
The highlight of the Division’s Capital Plan is the continuation of the Federal Military Construction program, which began in 2002-03. Under this program, the Federal government funds between 75 and 100 percent of the cost of replacing or expanding National Guard armories and equipment maintenance facilities across New York State. In the current year, DMNA has completed and now occupies new space at the Utica armory, and fully expects to complete and occupy new space by March 31, 2008 at the armories in Leeds, Latham and Auburn, as well as field maintenance shops in Utica and Auburn, and the Scotia Armed Forces Reserve Center. In 2008-09, DMNA will continue work on construction projects previously awarded for the Kingston and Queensbury armories, the Rochester Aviation Facility and the Camp Smith Readiness Center. Finally, under this plan DMNA expects to award contracts for a Queensbury field maintenance shop. The Division’s traditional capital program will continue its emphasis on maintenance and repair programs, technology upgrades, and energy efficiency projects. Infrastructure repair and upgrade projects are prioritized by the condition and proposed use of affected structures and corresponding health, safety and environmental concerns. Approximately $3 million in eligible capital projects will again be supported with bond proceeds.

AGENCY CAPITAL PROGRAM PLANS
91
MENTAL HYGIENE The Department of Mental Hygiene capital program is administered through the three agencies within the Department — the Office of Mental Health (OMH), the Office of Mental Retardation and Developmental Disabilities (OMRDD), and the Office of Alcoholism and Substance Abuse Services (OASAS). Capital projects for all mental hygiene agencies are supported by the General Fund and bonds by the Dormitory Authority (DASNY), although OMRDD’s non-profit sector primarily accesses private financing for its development purposes. These financing mechanisms support the maintenance and rehabilitation of facilities operated by both the State and not-for-profit agencies, as well as the development of new community services. OFFICE OF MENTAL HEALTH OMH provides high quality services to an inpatient population of approximately 5,200 persons on 21 separate, active campuses containing 27 institutions: 16 adult, six children and youth, three forensic and two research facilities. In addition, the Agency helps fund the capital construction of hundreds of community residential sites, various mental health-related general hospital projects, including psychiatric inpatient and specialized emergency rooms, and a number of non-residential community programs. State Operations In support of OMH’s mission, the Five-Year Capital Plan includes a total of $1.2 billion in new and future appropriations and $1.3 billion in disbursements for OMH State-operated institutions that will continue to fund projects necessary to meet health and life safety codes, Joint Commission accreditation standards, current Federal Medicaid certification requirements, and other projects that remediate environmental deficiencies, improve energy efficiency, preserve long-term facilities and consolidate campus facilities. New 2008-09 appropriations of $266 million, reappropriations of $639 million and $268 million in disbursements for OMH State-operated institutions support essential rehabilitation projects that preserve patient and staff health and safety, and ensure compliance with facility accreditation standards. OMH’s capital maintenance plan ensures that the investments in the OMH infrastructure are preserved, both to realize maximum useful building life and to prevent costly repairs in the future. A recent assessment report identifies OMH’s capital assets by group, age, and condition:
Good
67
Condition Fair Poor
43 1 Total
111 Capital Asset Group Residential/Hospital Buildings
Age Range 1-100+
Psychiatric Rehabilitation Buildings 1-100+ 43 41 7 91 Administrative Support Buildings 1-100+ 129 109 13 251 Total 239 193 21 453* *Excludes 765 sold, proposed, demolished or vacant buildings and those with non-OMH tenants.

AGENCY CAPITAL PROGRAM PLANS
92
Aid to Localities For OMH community programs, the Five-Year Capital Plan includes $231 million in new and future appropriations and $585 million in disbursements to support ongoing development. New 2008-09 appropriations of $181 million and reappropriations of $710 million will make funds available for the completion of 7,400 residential beds currently under development, for the preservation and maintenance of the community infrastructure, and to support the State’s contribution towards 2,100 new beds (of which 1,500 will be Supported Housing beds) being added to the community residential pipeline as part of the 2008-09 budget. A total of $99 million in disbursements, including $6 million financed from the General Fund, is recommended for 2008-09. OFFICE OF MENTAL RETARDATION AND DEVELOPMENTAL DISABILITIES OMRDD offers services in a variety of settings, ranging from homes and small facilities to campus-based centers. The Five-Year Capital Plan for OMRDD focuses on serving consumers in the most appropriate settings and keeping all programs safe for both consumers and staff. In support of this goal, the Capital Plan recommends a total of approximately $762 million in new and future appropriations, and almost $559 million in disbursements over the five-year period. For 2008-09, the Capital Plan recommends new appropriations of some $192 million and reappropriations of more than $296 million, as well as disbursements of approximately $133 million to fund the following:
● New investments to expand available community residential opportunities to support the deinstitutionalization of consumers residing in Developmental Centers;
● Projects necessary to maintain health and safety standards for existing facilities and
ensure conformance with all Federal and State certification standards. This includes $50 million in new bonded capital funds to support the ongoing reconstruction of the Bernard Fineson Developmental Center located in Queens;
● Minor rehabilitation projects for existing State- and voluntary-operated community
facilities; ● Environmental modifications to existing State- and voluntary-operated residential
and day program space to improve accessibility for individuals with disabilities; and
● Improvements to centers serving special populations in need of intensive treatment.
The majority of the OMRDD Capital Plan (79 percent) is dedicated to ensuring both quality care for consumers in State facilities, as well as continued Federal certification of those programs. The remainder of the plan supports similar activities in the not-for-profit sector. Based on a recent assessment of OMRDD facilities by DASNY, the following table identifies the capital asset group, age, and condition of OMRDD assets:

AGENCY CAPITAL PROGRAM PLANS
93
Good
71
Condition Fair Poor
188 89*Total
348Capital Asset Group Institutional
Age Range 1-75
Community 1-55 1,038 55** 0 1,093 Total 1,109 243 89 1,441 *84 buildings are vacant and classified as programmatically obsolete, meaning they are not scheduled for short- or long-term use. **According to agency estimates, at any point in time approximately five percent of State-operated community homes require minor maintenance work and are, therefore, rated as fair.
The Capital Plan for OMRDD will be financed through a mix of current resources and bond proceeds. Over the five years, 48 percent of the Plan will be financed with Capital Projects Fund appropriations. It should be noted, however, that bonded appropriations do not generally support community development or NYS-CARES. The majority of not-for-profit community development is accomplished through private financing rather than the use of State-supported bonds. OFFICE OF ALCOHOLISM AND SUBSTANCE ABUSE SERVICES OASAS supports a network of providers offering a continuum of services to treat and prevent chemical dependency and compulsive gambling. While the majority of this system is operated by voluntary not-for-profit organizations, the State operates 13 Addiction Treatment Centers (ATCs). The Five-Year Capital Plan recommends a total of more than $517 million in new and future appropriations and almost $671 million in disbursements over the next five years to support projects throughout the system, including new capital development for such high priority populations as adolescents, chemically dependent women with children, and veterans. These projects focus primarily on ensuring the health and safety of the system’s clients, and the preservation of both State and non-profit facilities. For 2008-09, the Capital Plan includes over $121 million in total new appropriations and reappropriations and about $103 million in disbursements to:
● Develop, over five fiscal years, 120 new Community Residential and/or Supportive Living beds outside New York City and Long Island for persons receiving chemical dependence outpatient treatment services;
● Support a multi-year effort to extensively renovate approximately 450 residential
and community-based programs that have aging physical plants; ● Fund critical maintenance projects at each of the 13 State ATCs, including a major
capital renovation of Kingsboro ATC; and ● Continue the development of a total of 108 beds for adolescents and women with
children, and other populations, including 100 beds to expand residential treatment services for veterans, and 100 beds on Long Island to support more appropriate clinical treatment.

AGENCY CAPITAL PROGRAM PLANS
94
While OASAS is responsible for all ATC maintenance, 12 of the 13 ATCs are considered fixed assets of other agencies — 11 are located on the grounds of OMH Psychiatric Centers, and one facility is located at the DOCS’ Willard Drug Treatment Campus. The following table presents the age and condition of the single OASAS capital asset.
Condition Capital Asset Group Age Range Good Fair Poor Kingsboro ATC 10 X

AGENCY CAPITAL PROGRAM PLANS
95
GENERAL GOVERNMENT OFFICE OF GENERAL SERVICES The OGS is responsible for the operation, maintenance, and renovation of 128 buildings located throughout the State. The estimated replacement value of these 128 buildings is over $5 billion. The 2008-09 Executive Budget emphasizes investments in the Office’s asset management program, which includes preservation of facilities and preventive maintenance components aimed at reducing the number of emergencies and avoiding costly out-year projects. Maintenance activities are undertaken by in-house staff and outside contractors to protect existing capital assets and prevent further deterioration of the infrastructure. The asset management program for 2008-09 will fund high priority projects that will preserve the integrity of buildings and maintain a safe and healthy environment for the State’s employees and the public. The Office will also have the flexibility to address critical infrastructure needs, while addressing significant customer-tenant issues. The Office continues to make significant capital investments in its facilities. Examples include upgrading the parking facilities at the A.C. Powell State Office Building in NYC and the Binghamton State Office Building, improvements in the Empire State Plaza’s structure and glass, and roof and facade repair at the Duryea State Office Building. The Office continues to undertake critical repairs at the State Capitol, including the restoration of the Senate and Assembly skylights and the statewide initiative to upgrade elevators and fire alarm systems. The OGS preventive maintenance program plan concentrates on projects intended to maximize the life expectancy of the State’s essential capital assets. To accomplish this, the Office has developed a facility condition assessment system that assesses the architectural, structural, mechanical, electrical and site components of each facility. This system identifies resource requirements and assures maintenance adequacy; while allowing managers to define, develop and prioritize cost estimates for capital repairs and replacement projects. The preventive maintenance program plan is focused on the goals of maximizing the useful life of facilities, improving the reliability of systems and equipment, and providing the means for determining equipment management and replacement needs. According to industry standards, the average building is constructed to last a minimum of 40 years, while parking lots can last more than 25 years with routine maintenance. However, since many of the assets managed by the Office, such as the State Capitol and the Empire State Plaza, are historically significant structures, their useful life can be considered indefinite. Over the long-term, maintenance efforts will continue to enhance these facilities by improving their appearance and upgrading their overall conditions as capital assets. In evaluating its assets, the Office has established the following rating categories: good (shows normal wear and tear), fair (requires considerable maintenance and some minor rehabilitation to prevent deterioration), and poor (displays definite deterioration and may have unusable portions). According to the most recent assessment of assets, 83 percent of

AGENCY CAPITAL PROGRAM PLANS
96
the Office’s buildings are rated in good condition, indicating success in the areas of preventive maintenance and capital improvement; 16 percent are rated in fair condition. There are two sites now rated as poor (Homer Folks and one parking services booth in Albany). The average age of office and support buildings is 37 years. The following table identifies the capital asset group, age and condition of the Office’s assets.
Good
37
Condition Fair Poor
0 0 Total
37 Capital Asset Group Empire State Plaza and Downtown
Age Range To 120 yrs.
Operations Upstate and Campus Region To 70 yrs. 37 17 1 55 Lease/Purchase To 50 yrs. 6 0 0 6Downstate Region To 70 yrs. 9 0 0 9 Parking Services To 40 yrs. 17 3 1 21 Total 106 20 2 128
To address the challenges that lie ahead, the Office has developed a strategic plan that provides for the orderly rehabilitation of building components and renovation of certain facilities. That plan, coupled with ongoing maintenance efforts, will ensure that the Office will achieve its long-term goals, while continuing to address the pressing needs of the State’s infrastructure. DEPARTMENT OF STATE The DOS 2008-09 budget submission includes $1.127 million in capital reappropriations to fund renovation of infrastructure and to complete construction of the training simulator and arson investigation buildings at the State’s Fire Training Academy located in Montour Falls. DOS will continue to administer a $100 million Local Expedited Deployment Funding capital program, enacted in 2003-04, to provide State-supported bond-financed funding for local public safety answering point equipment and technology upgrades associated with wireless 911 service. OFFICE FOR TECHNOLOGY Universal Broadband Access Initiative The 2008-09 Executive Budget includes another $15 million in funding for expansion of the Universal Broadband Initiative to ensure that every New Yorker has access to affordable, high-speed broadband service. The funding will support grants aimed at increasing access to underserved areas, making broadband services affordable for all persons and businesses, and improving digital literacy throughout the State. Up to $10 million of this new investment is expected to be reimbursed by bonds. New Consolidated Data Center The 2008-09 Executive Budget includes a $99.1 million reappropriation for the design and construction of a new Consolidated Data Center, which will replace the four separate locations the State currently operates in and around Albany. These data center facilities serve nearly thirty state agencies and offices, supporting critical State systems on a 24/7 basis. Replacement of these current facilities with a single Data Center building will
AGENCY CAPITAL PROGRAM PLANS
97
ensure that the OFT can cost-effectively provide uninterrupted service, respond to customer demands, and accommodate mainframe growth as well as the planned large-scale consolidation of agency servers. The new facility is expected to be operational within four to five years. During 2007-08, OFT has been working with EYP Mission Critical Facilities to conduct a detailed analysis to select a location for the Data Center. This analysis is currently underway, and no site has yet been selected. Interim Data Center Space While plans are formulated for the new Data Center, demands from customers for service expansions continue to grow each year. To provide the necessary space in the short-term, the 2008-09 Executive Budget includes a new $11 million appropriation for the rehabilitation of existing State-owned space. This will provide 25,000 square feet of additional data center capacity to accommodate State agency customers for data center services while the new consolidated center is being built. Statewide Wireless Network (SWN) For the first time, the 2008-09 Executive Budget reflects the construction and development costs for the Statewide Wireless Network (SWN) as a capital project. Capital appropriations will support system construction and implementation including costs associated with Systems Operation Centers development and radio equipment for participating State agencies. Once constructed and accepted, the SWN will replace the outdated State Police radio system and provide the opportunity to achieve real-time communication among all public safety agencies statewide.

AGENCY CAPITAL PROGRAM PLANS
98
OTHER JUDICIARY The 2008-09 Judiciary request continues to make substantial investments in court facilities from $80.9 million in reappropriations. This request reflects a total of $15 million in spending for on-going renovations to the Court of Appeals Centennial Hall Annex in Albany, New York ($23 million total cost) and the acquisition and construction of court officer training facilities located in Brooklyn, New York ($33.7 million total cost) and Saratoga, New York ($24.2 million total cost). These facilities will replace the Judiciary’s inadequate facility in lower Manhattan, reduce travel expenses by providing housing, and facilitate court officer recruitment both upstate and downstate. These projects are funded by authority bonds issued by DASNY. WORLD TRADE CENTER The 2008-09 World Trade Center budget includes Federal reappropriations of $448 million to facilitate the continuation of New York State’s and New York City’s efforts to revitalize the World Trade Center property and lower Manhattan, including reconstruction of Route 9A. STATEWIDE EQUIPMENT Statewide equipment represents bond-financed spending for major equipment purchases and information systems research, development, and upgrades across all State agencies.

DETAILED DATA

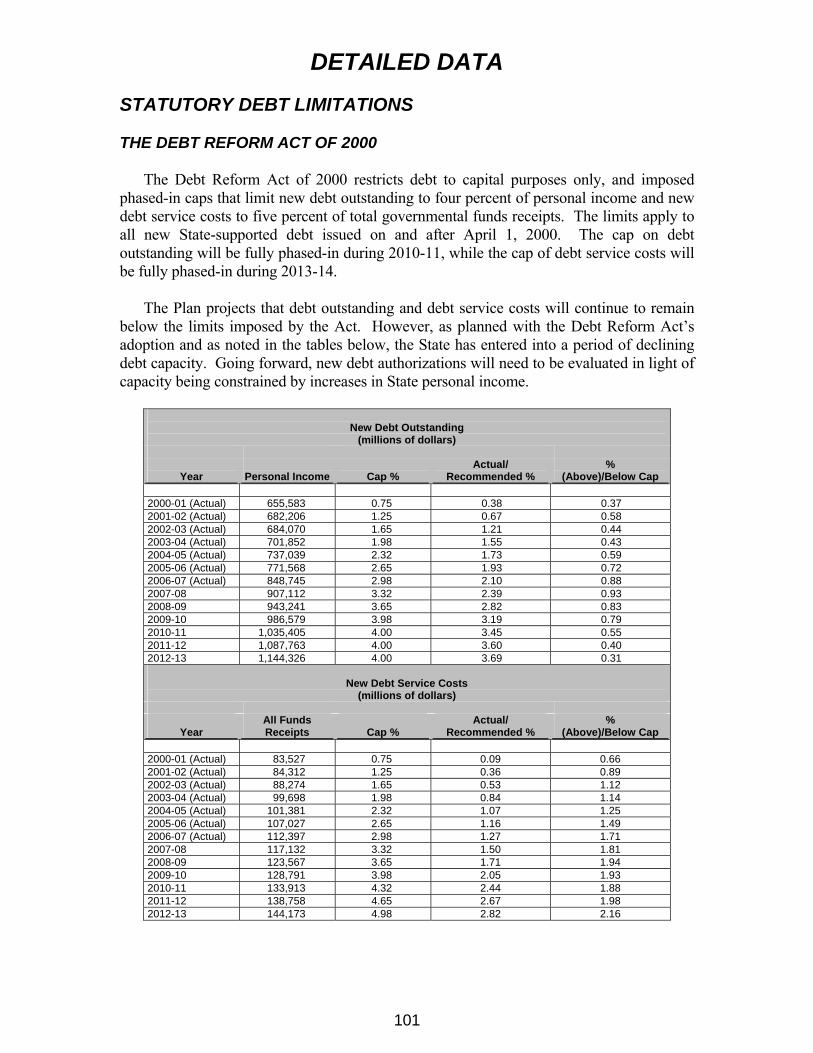
DETAILED DATA STATUTORY DEBT LIMITATIONS THE DEBT REFORM ACT OF 2000
The Debt Reform Act of 2000 restricts debt to capital purposes only, and imposed phased-in caps that limit new debt outstanding to four percent of personal income and new debt service costs to five percent of total governmental funds receipts. The limits apply to all new State-supported debt issued on and after April 1, 2000. The cap on debt outstanding will be fully phased-in during 2010-11, while the cap of debt service costs will be fully phased-in during 2013-14.
The Plan projects that debt outstanding and debt service costs will continue to remain
below the limits imposed by the Act. However, as planned with the Debt Reform Act’s adoption and as noted in the tables below, the State has entered into a period of declining debt capacity. Going forward, new debt authorizations will need to be evaluated in light of capacity being constrained by increases in State personal income.
Year
Personal Income
New Debt Outstanding
(millions of dollars) Actual/
Cap % Recommended %
%
(Above)/Below Cap 2000-01 (Actual) 655,583 0.75 0.38 0.37 2001-02 (Actual) 682,206 1.25 0.67 0.58 2002-03 (Actual) 684,070 1.65 1.21 0.44 2003-04 (Actual) 701,852 1.98 1.55 0.43 2004-05 (Actual) 737,039 2.32 1.73 0.59 2005-06 (Actual) 771,568 2.65 1.93 0.72 2006-07 (Actual) 848,745 2.98 2.10 0.88 2007-08 907,112 3.32 2.39 0.93 2008-09 943,241 3.65 2.82 0.83 2009-10 986,579 3.98 3.19 0.79 2010-11 1,035,405 4.00 3.45 0.55 2011-12 1,087,763 4.00 3.60 0.40 2012-13 1,144,326 4.00 3.69 0.31
Year
All Funds Receipts
New Debt Service Costs
(millions of dollars) Actual/
Cap % Recommended %
%
(Above)/Below Cap 2000-01 (Actual) 83,527 0.75 0.09 0.66 2001-02 (Actual) 84,312 1.25 0.36 0.89 2002-03 (Actual) 88,274 1.65 0.53 1.12 2003-04 (Actual) 99,698 1.98 0.84 1.14 2004-05 (Actual) 101,381 2.32 1.07 1.25 2005-06 (Actual) 107,027 2.65 1.16 1.49 2006-07 (Actual) 112,397 2.98 1.27 1.71 2007-08 117,132 3.32 1.50 1.81 2008-09 123,567 3.65 1.71 1.94 2009-10 128,791 3.98 2.05 1.93 2010-11 133,913 4.32 2.44 1.88 2011-12 138,758 4.65 2.67 1.98 2012-13 144,173 4.98 2.82 2.16
101

DETAILED DATA
102
INTEREST RATE EXCHANGE AGREEMENTS AND VARIABLE RATE EXPOSURE
Article 5-D of the State Finance Law authorizes the use of a limited amount of variable rate obligations and interest rate exchange agreements (“swaps”). The Statute was implemented as a debt management tool to minimize debt service costs, diversify the debt portfolio and match variable rate debt exposure to variable rate earnings on the State’s short-term investments. Issuers of State-supported bonds (“Authorized Issuers”) may enter into variable rate debt instruments that result in a maximum net variable rate exposure of 20 percent of State-supported debt. Issuers may also enter into interest rate exchange agreements in a total notional amount that does not exceed 20 percent of State-supported debt, subject to various criteria established in the statute to effectively minimize risk. Interest Rate Exchange Agreements (Swaps)
The statutory provisions include various criteria and limitations to ensure that swaps are prudently managed to effectively reduce the costs of State-supported debt. Those criteria include:
● The adoption of uniform interest rate exchange guidelines; ● Minimum counterparty ratings of AA, and collateral requirements should their
ratings fall; ● A finding by an independent financial advisor certifying that the terms and
conditions of all swaps reflect a fair market value; ● The use of standardized interest rate exchange agreements; and ● Monthly reporting requirements by the Authorized Issuers and DOB that monitor
and assess swap performance.
The following table shows the amount of outstanding interest exchange agreements which are subject to the statutory cap. The State’s swap exposure is expected to increase from about 15 percent in 2007-08 to 17 percent in 2012-13.
Interest Rate Exchange Caps (millions of dollars)
2007- 2008- 2009- 2010- 2011- 2012-08 09 10 11 12 13
Interest Rate Exchange Cap 8,970 9,708 10,395 10,958 11,320 11,614Notional Amounts of Interest Rate Exchange Agreements 6,711 7,437 8,150 8,837 9,502 9,645Percent of Interest Rate Exchange Agreements to Debt Outstanding 15.0 15.3 15.7 16.1 16.8 16.6

DETAILED DATA
103
New York State has used swaps to: ● Convert variable rate bonds to fixed rate obligations (synthetic fixed rate debt),
generating fixed rates 80 to 100 basis points below traditional fixed rate bonds ($6.0 billion);
● Convert fixed rate bonds to variable rate obligations (synthetic variable rate debt),
generating variable rates trading between 5-15 basis points below the Bond Market Association (BMA) average ($277 million); and
● Convert fixed rate bonds to variable rate obligations at a future date (synthetic
convertible bonds), generating variable rates trading between 5-15 basis points below the BMA average ($693 million).
Variable Rate Exposure
Consistent with the State’s efforts to reduce debt service costs and match variable rate
exposure to variable rate earnings on the State’s short-term investments, the State’s net variable rate exposure is projected to increase from about 10 percent of outstanding debt in 2007-08 to roughly 17 percent in 2012-13. The following table presents estimates for net variable rate exposure.
Variable Rate Exposure (millions of dollars)
2007-08
2008-09
2009-10
2010-11
2011-12
2012-13
Variable Rate Exposure Cap 8,970 9,708 10,395 10,958 11,320 11,614Current Unhedged Variable Rate Obligations 1,645 1,554 1,460 1,366 1,278 1,187Convertible Bonds — 664 664 1,178 1,066 1,908Synthetic Variable Rate Swaps 168 128 83 62 40 17Additional Planned Variable Rate Exposure 500 1,250 2,000 3,000 3,250 3,250Total Net Variable Rate Exposure 2,312 3,595 4,206 5,606 5,634 6,362Net Variable Rate Exposure to Debt Outstanding 5.2 7.4 8.1 10.2 10.0 11.0Current Policy Reserve for LIBOR Swaps 2,349 2,603 2,853 3,093 3,326 3,376Net Variable Rate Exposure (with Policy Reserve) 4,662 6,198 7,059 8,699 8,960 9,737Net Variable Rate Exposure (with Policy Reserve) to Debt Outstanding
10.4 12.8 13.6 15.9 15.8 16.8
The State’s current policy is to count 35 percent of the notional amount of outstanding
65 percent of London Inter-Bank Offered Rates (LIBOR) fixed rate swaps in its variable rate exposure. This policy reserve accounts for the potential that tax policy or market conditions could result in significant differences between payments owed on the bonds and the amount received by the State under their 65 percent of LIBOR swaps, and that the factors affecting such payments can be consistent with variable rate exposure.
The State and its Authorized Issuers will continue to evaluate market conditions, available support capacities and related costs, as well as alternative structures to help implement in the least costly manner the planned increase of variable rate debt, over the next two to five years.

DETAILED DATA
104
BOND AUTHORIZATIONS
The 2008-09 Executive Budget proposes to consolidate into a single provision of law all State-supported bond authorizations. This would ensure greater public knowledge about existing and proposed new bond authorization actions, permitting the public and elected officials to comprehensively understand the cumulative effect of the budget’s reliance on debt financings. This approach would also ensure that all State debt authorizations and practices are conducted on a consistent and streamlined basis, including moving all bond caps to a “net project cost” basis, eliminating conflicting legal interpretations of said laws, and standardizing provisions for new debt authorizations and refundings.
Consistent with the previously-authorized caps, the statute contains limits, or caps, on the amount of bonds that can be issued for each particular programmatic purpose. As the bond cap for that purpose is reached, subsequent legislative changes are required to raise the statutory caps to the level necessary to meet the bondable capital needs.
Bond caps provide authorizations to finance a single year’s appropriations or can be for
multi-year periods. To ensure that the State-supported issuance calendar can be effectively managed, and projects are advanced as scheduled, the bond caps included in the Executive Budget for programs that can be financed with State Personal Income Tax (PIT) Revenue Bonds are proposed to be issued by any Authorized Issuer (i.e., the Empire State Development Corporation (ESDC), the Dormitory Authority of the State of New York (DASNY), the Thruway Authority, the Environmental Facilities Corporation (EFC), or the Housing Finance Agency (HFA)).

DETAILED DATA
105
Bond Caps2008-09 Executive Budget
($ Thousands) Prior Type
of Cap Program Name
Gross or Net
Gross SUNY Educational Facilities Net SUNY Dormitory Facilities Net SUNY Upstate Community Colleges Gross CUNY Educational Facilities Gross Library for the Blind Net SUNY Athletic Facilities Net RESCUE Net University Facilities (Jobs 2000) Net School District Capital Outlay Grants Net Judicial Training Institute Net Transportation Transition Grants Net Public Broadcasting Facilities Net Higher Education Capital Matching Grants Net EXCEL Net Library Facilities Net Cultural Education Facilities
Education: Net Environmental Infrastructure Projects Net Hazardous Waste Remediation Net Riverbank State Park Net Water Pollution Control Net State Park Infrastructure Net Pipeline for Jobs (Jobs 2000) Net Western New York Nuclear Service Center Net Long Island Pine Barrens Net Pilgrim Sewage Plant Environment:Gross Empire State Plaza Net State Capital Projects (Attica)
State Facilities Net Division of State Police Facilities Net DMNA Net Alfred E. Smith Building Net Elk St. Parking Garage Net State Buildings and Other Facilities Net Judiciary Improvements Net OSC State Buildings Net Albany Parking Garage (East) n/a Aqusition of State Buildings and Other Facilities Net Equipment Acquisition (COPS) Net Food Laboratory Net OFT FacilitiesNet Courthouse ImprovementsGross Prison Facilities Net Homeland Security Gross Youth Facilities Net E-911 Program State Building/Equipment/Public Protection:Gross Housing Capital ProgramsGross Javits Convention CenterNet Community Enhancement Facilities (CEFAP)
University Technology Centers (incl. HEAT):Net Science and Technology Center (Syracuse)Net Super Computer Center (Cornell)Net Center for Telecommunications (Columbia)Net HEATNet Center for Industrial Innovation (City of Troy)Net Center for Advanced Materials (Clarkson)Net Center for Electro-Optic (Rochester)Net Center for Neural Sciences(NYU)Net Center for Incubator FacilitiesGross Onondaga Convention CenterNet Sports FacilitiesNet Child Care FacilitiesNet Bio-Tech FacilitiesNet Strategic Investment ProgramNet Regional Economic Development Net NYS Economic Development (2004)Net Regional Economic Development(2004) Net High Technology and DevelopmentNet Regional Economic Development/SPURNet Buffalo Inner HarborNet Jobs Now
Current Cap
7,461,000 800,000 301,000 5,904,000 16,000 22,000 195,000 47,500 140,000 16,105 80,000 15,000 150,000 2,600,000 28,000 60,000
Subtotal: 492,500 1,200,000 78,000 541,000 30,000 29,000 104,000 15,000 11,200
Subtotal: 133,000 200,000
102,100 15,000 89,000 25,000 83,300 37,600 51,700 40,910 140,000 293,000 40,000 99,500 77,900 5,185,000 25,000 328,515 100,000
Subtotal: 2,042,000 375,000 425,000Total: $248M 33,500 17,300 41,000 75,000 33,000 23,500 10,000 5,000 10,000 40,000 144,936 30,000 10,000 225,000 1,200,000 350,000 250,000 250,000 90,000 50,000 14,300
Current Cap Adjusted To Net
7,311,780 800,000 301,000 5,785,920 15,680 22,000 195,000 47,500 140,000 16,105 80,000 15,000 150,000 2,600,000 28,000 60,000 17,567,985 492,500 1,200,000 78,000 541,000 30,000 29,000 104,000 15,000 11,200 2,500,700 130,340 200,000
102,100 15,000 89,000 25,000 83,300 37,600 51,700 40,910 140,000 293,000 40,000 99,500 77,900 5,081,300 25,000 321,945 100,000 6,953,595 2,001,160 367,500 425,000
33,500 17,300 41,000 75,000 33,000 23,500 10,000 5,000 10,000 39,200 144,936 30,000 10,000 225,000 1,200,000 350,000 250,000 250,000 90,000 50,000 14,300
2008-09 Net Cap
Recommended Change
1,100,000 350,000 165,000 210,000
14,000 27,585 1,866,585 220,500
29,600
250,100
6,000
42,000
111,000
11,000
423,700
593,700 145,040
2008-09
Executive Budget Recommended
8,411,780 1,150,000 466,000 5,995,920 15,680 22,000 195,000 47,500 140,000 16,105 80,000 15,000 150,000 2,600,000 42,000 87,585 19,434,570
713,0001,200,000
78,000570,600
30,00029,000
104,00015,00011,200
2,750,800130,340200,000
108,10015,00089,00025,000
125,30037,60051,70040,910
140,000404,000
40,000110,500
77,9005,505,000
25,000321,945100,000
7,547,2952,146,200
367,500425,000
033,50017,30041,00075,00033,00023,50010,000
5,00010,00039,200
144,93630,00010,000
225,0001,200,000
350,000250,000250,000
90,00050,00014,300

DETAILED DATA
106
Bond Caps2008-09 Executive Budget
($ Thousands) Prior Type
of Cap Program Name
Gross or Net
Net Economic Development 2006 Net Convention Center Project (Javits/2006)Net Queens Stadium (Mets)Net Bronx Stadium (Yankees)Net NYS Ec Dev Stadium (06) ParkingNet State Modernization Projects (TRAM) Net Int. Computer Chip Research and Dev. Center Net 2008 Economic Development Initiatives Economic Development and Housing:Net Department of Health Facilities Gross Mental Health Facilities Net HEAL NY Capital Program Health/Mental Hygiene:Gross Consolidated Highway Improvement Program (CHIPS)Net Dedicated Highway & Bridge Trust Net High Speed Rail
Net Albany County Airport n/a MTA Transit and Communter projects
Current Cap
2,318,000 350,000 74,700 74,700 75,000 50,450 300,000
0Subtotal:
495,000 5,857,000 750,000
Subtotal: 5,745,000 16,500,000 22,000
40,000$165m annual DS
Current Cap Adjusted To Net
2,318,000 350,000 74,700 74,700 75,000 50,450 300,000
0 8,938,246 495,000 5,739,860 750,000 6,984,860 5,630,100 16,500,000 22,000
40,000 2,265,955
2008-09 Net Cap
Recommended Change
900,0001,045,040
1,470,000
1,470,000
2008-09
Executive Budget Recommended
2,318,000350,000
74,70074,70075,00050,450
300,000900,000
9,983,286495,000
7,209,860750,000
8,454,8605,630,100
16,500,00022,000
40,0002,265,955
Transportation: Subtotal: 24,458,055 0 24,458,055
Net Local Government Assistance Corporation 4,700,000 4,700,000 0 4,700,000
72,103,441 5,225,425 77,328,866

DETAILED DATA
107
STATE AND FEDERAL PAY-AS-YOU-GO (PAYGO) FINANCING Over 42 percent of total spending is supported by State and Federal PAYGO resources. State PAYGO resources include: General Fund taxes; other taxes and user fees set aside or dedicated for specific capital programs; repayments from local governments and public authorities for their share of projects; and transfers from other funds, including the General Fund. Over the Plan, State PAYGO resources of almost $10.5 billion will support approximately 22 percent of total spending. Federal PAYGO resources support spending financed by grants from the Federal Government, primarily for highways and bridges, drinking water and water pollution control facilities, public protection, and housing, and average roughly 20 percent of total spending.
Approximately $6.7 billion, or an average of over $1.3 billion annually, of State
PAYGO financing is in the Dedicated Highway and Bridge Trust Fund (DHBTF). The DHBTF receives receipts from the petroleum business tax, motor fuel tax, highway use tax, auto rental tax, motor vehicle and other transportation-related fees. Receipts deposited to the DHBTF are used to finance capital projects on a PAYGO basis, to pay operating expenses of transportation agencies and to pay debt service on DHBTF and Consolidated Highway Improvement Program (CHIPs) Bonds.
Capital spending supported by General Fund receipts is classified as a transfer to the
various Capital Projects Funds. The General Fund transfer, which is reflected in total State PAYGO spending, is projected at $366 million in 2008-09 and will average over $790 million annually over the Plan. The General Fund transfer primarily finances non-bond eligible capital spending, including minor rehabilitation projects of facilities operated by the Office of General Services (OGS), the Department of Environmental Conservation (DEC) and the Department of Mental Hygiene. The General Fund transfers also include $15 million annually to the Hazardous Waste Remedial Fund to support the State Superfund program and approximately $2.4 billion from 2008-09 to 2012-13 to the Dedicated Highway and Bridge Trust Fund.
State PAYGO resources, derived from statutorily dedicated revenues that finance projects for environmental and recreational purposes, are projected to average approximately $428 million annually. In addition to receipts that will be deposited annually into the Hazardous Waste Remedial Fund, the Environmental Protection Fund (EPF) will continue to receive increasing annual deposits from real estate transfer taxes for a total of $1.1 billion million over the five years of the Plan, as well as other miscellaneous receipts (approximately $5 million annually). These taxes and miscellaneous receipts will support the pay-as-you-go portions of projects advanced from the EPF.
The Executive Budget contains a proposal to expand the Bottle Bill to all non-carbonated beverages and redirect all unclaimed deposits to the State for EPF. These modifications would begin as of January 1, 2009 and will provide approximately $25 million in additional receipts to the EPF in SFY 2008-09 for critical environmental projects. These unclaimed deposits are expected to total $100 million annually.
The State Park Infrastructure Fund (SPIF), for which the pay-as-you-go components
continue to be supported by park fees and other miscellaneous revenues, will finance about $26 million annually in improvements to the State’s park system.

DETAILED DATA
108
Federal grants account for roughly 20 percent of total capital spending. The largest components of Federal PAYGO spending are for transportation ($8.7 billion) and the environment ($530 million), averaging a total of over $1.9 billion per year. In addition, $50 million will be spent over the life of the Plan for the Federal spending share of New York State Department of Health (DOH) Safe Drinking Water projects. The Plan assumes Federal aid levels for transportation will continue to approximate $1.9 billion annually.

DETAILED DATA
109
CAPITAL PROJECTS FINANCED BY STATE AND FEDERAL PAY-AS-YOU-GO RESOURCES CAPITAL PROGRAM AND FINANCING PLAN 2007-2008 THROUGH 2012-2013 (thousands of dollars)
2007-2008 2008-2009 2009-2010 2010-2011 2011-2012 2012-2013Transportation Department of Transportation 2,467,692 2,728,260 2,894,596 2,865,740 2,874,586 2,906,754
Department of Motor Vehicles 198,206 220,220 213,896 218,556 224,708 228,251
Thruway Authority 1,734 1,734 1,804 1,876 1,951 2,029
Parks and Environment Department of
Environmental Conservation 288,003 228,210 313,210 323,210 333,210 343,210
Office of Parks, Recreation
and Historic Preservation 30,850 22,850 32,850 32,850 32,850 32,850 Environmental Facilities Corporation 4,400 0 0 0 0 0
Hudson River Park Trust 20,000 20,682 15,000 10,000 0 0
Economic Development & Gov't. Oversight Division of Housing and
Community Renewal 3,697 3,575 3,575 3,575 3,575 3,575 Department of Agriculture and Markets 2,250 2,750 2,750 2,750 2,750 2,750
Health and Social Welfare Office of Children
and Family Services 2,660 2,660 2,000 2,000 2,000 2,000
Department of Health 165,388 195,188 115,096 118,480 106,480 25,480
Education State University of New York: 55,000 52,000 51,000 45,000 47,200 41,000
State Education Department 8,380 8,380 10,210 7,425 1,830 1,520
City University of New York 9,100 9,272 10,109 11,852 13,705 15,144
Public Protection Division of State Police 3,771 5,398 6,200 6,680 6,800 6,800
Division of Military
and Naval Affairs 46,000 63,290 32,900 52,600 48,000 48,000
Office of Homeland Security 14,203 6,973 125 0 0 0
Mental Hygiene Office of Mental Health 41,305 38,007 44,987 44,283 42,010 42,010
Office of Mental Retardation
and Developmental Disabilities 46,625 54,805 49,600 50,850 51,100 52,400
Office of Alcoholism and
Substance Abuse Services 9,995 14,464 14,201 14,387 15,641 16,141
General Government Office of General Services 49,645 28,850 48,500 56,500 52,250 52,250
Department of State 1,864 492 0 0 0 0
Office of Technology 0 38,444 76,393 152,163 123,130 121,251
Other Judiciary 1,000 1,782 0 0 0 0
Statewide Equipment 0 0 103,900 81,100 56,500 40,000 All State Agencies World Trade Center 50,000 70,000 70,000 35,000 32,500 20,000
Total State and FederalPay-As-You-Go Financing 3,521,768 3,818,286 4,112,902 4,136,877
4,072,776 4,003,415

DETAILED DATA
110
CAPITAL PROJECTS FINANCED BY STATE PAY-AS-YOU-GO RESOURCES
CAPITAL PROGRAM AND FINANCING PLAN 2007-2008 THROUGH 2012-2013
(thousands of dollars)
2007-2008 2008-2009 2009-2010 2010-2011 2011-2012 2012-2013Transportation Department of Transportation 829,259 993,876 1,107,314 1,133,513 1,172,695 1,194,603
Department of Motor Vehicles 198,206 220,220 213,896 218,556 224,708 228,251
Thruway Authority 1,734 1,734 1,804 1,876 1,951 2,029
Parks and Environment Department of
Environmental Conservation 185,503 125,710 210,710 220,710 230,710 240,710
Office of Parks, Recreation and Historic Preservation 27,250 19,250 29,250 29,250 29,250 29,250 Environmental Facilities Corporation 4,400 0 0 0 0 0
Hudson River Park Trust 20,000 20,682 15,000 10,000 0 0
Economic Development & Gov't. Oversight Division of Housing and
Community Renewal 697 575 575 575 575 575
Department of Agriculture and Markets 2,250 2,750 2,750 2,750 2,750 2,750
Health and Social Welfare Office of Children
and Family Services 2,660 2,660 2,000 2,000 2,000 2,000
Department of Health 128,576 185,208 105,116 108,500 96,500 15,500
Education State Education Department 8,380 8,380 10,210 7,425 1,830 1,520
City University of New York 9,100 9,272 10,109 11,852 13,705 15,144
State University of New York: 55,000 52,000 51,000 45,000 47,200 41,000
Public Protection Homeland Security 3,500 5,075 125 0 0 0
Division of State Police 3,771 5,398 6,200 6,680 6,800 6,800
Division of Military
and Naval Affairs 6,000 15,730 10,900 7,600 7,000 7,000
Mental Hygiene Office of Mental Health 41,305 38,007 44,987 44,283 42,010 42,010
Office of Mental Retardation
and Developmental Disabilities 46,625 54,805 49,600 50,850 51,100 52,400
Office of Alcoholism and
Substance Abuse Services 9,995 14,464 14,201 14,387 15,641 16,141
General Government Office of General Services 49,645 28,850 48,500 56,500 52,250 52,250
Department of State 1,864 492 0 0 0 0
Office of Technology 0 38,444 76,393 152,163 123,130 121,251
Other Statewide Equipment 0 0 103,900 81,100 56,500 40,000
Judiciary 1,000 1,782 0 0 0 0
2,111,184Total State Pay-As-You-Go Financing 1,636,720 1,845,364 2,114,540 2,205,570
2,178,305

DETAILED DATA
111
CAPITAL PROJECTS FINANCED BYFEDERAL GRANTS PAY-AS-YOU-GO RESOURCES
CAPITAL PROGRAM AND FINANCING PLAN2007-2008 THROUGH 2012-2013
(thousands of dollars)
2007-2008 2008-2009 2009-2010 2010-2011 2011-2012 2012-2013Transportation Department of Transportation 1,638,433 1,734,384 1,787,282 1,732,227 1,701,891 1,712,151
Parks and Environment Department of Environmental Conservation 102,500 102,500 102,500 102,500 102,500 102,500 Off ice of Parks, Recreation and Historic Preservation 3,600 3,600 3,600 3,600 3,600 3,600
Economic Development & Gov't. Oversight Division of Housing and Community Renew al 3,000 3,000 3,000 3,000 3,000 3,000
Health and Social Welfare Department of Health 36,812 9,980 9,980 9,980 9,980 9,980
Public Protection Division of Military and Naval Affairs 40,000 47,560 22,000 45,000 41,000 41,000 Homeland Security 10,703 1,898 0 0 0 0
Other All State Agencies World Trade Center 50,000 70,000 70,000 35,000 32,500 20,000
Total Federal Grants Pay-As-You-Go Financing 1,885,048 1,972,922 1,998,362 1,931,307 1,894,471 1,892,231

DETAILED DATA
112
GENERAL OBLIGATION BOND FINANCING
General obligation bond financing of capital projects is accomplished through the issuance of full faith and credit State bonds that have been authorized by the voters. General obligation financed spending ($2.7 billion) accounts for approximately 6 percent of total spending. The Plan assumes the continued implementation of nine previously authorized bond acts (five for transportation and four for environmental and recreational programs). The bulk of projected general obligation bond financed spending supports authorizations for the 2005 Rebuild and Renew New York Bond Act (Rebuild). Spending authorizations from the remaining seven bond acts will be virtually depleted by 2013.
CAPITAL PROJECTS FINANCED BY GENERAL OBLIGATION BONDS
CAPITAL PROGRAM AND FINANCING PLAN2007-2008 THROUGH 2012-2013
(thousands of dollars)
2007-2008 2008-2009 2009-2010 2010-2011 2011-2012 2012-2013
Transportation Department of Transportation Rebuild and Renew 2005 127,462 214,418 287,094 312,923 182,021 124,092 Action -1988 2,000 2,000 2,000 2,000 2,000 2,000 Infrastructure Renew al - 1983 4,000 4,000 4,000 4,000 4,000 4,000 Energy Conservation - 1979 100 75 50 25 0 0 Transportation Capital Facilities - 1967 300 300 300 300 300 300 Metropolitan Transportation Authority Rebuild and Renew 2005 93,700 188,550 258,700 278,922 262,600 262,600
Parks and Environment Department of Environmental Conservation Clean Water/Clean Air 1996 70,600 50,000 50,000 50,000 50,000 50,000 EQBA 1986 10,000 10,000 10,000 10,000 10,000 10,000 EQBA 1972 1,500 1,500 1,500 1,500 1,500 1,500 Pure Waters 1965 900 600 600 600 600 600 Environmental Facilities Corporation Clean Water/Clean Air 1996 343 343 343 343 343 343
Total General Obligation Bond Financing
310,905 471,786 614,587 660,613 513,364 455,435

DETAILED DATA
113
STATE REVENUE BOND FINANCING
In addition to State general obligation bonds, other State revenue credits, which include State Personal Income Tax Revenue Bonds (PIT), Dedicated Highway and Bridge Trust Fund Bonds (DHBTF), SUNY Dormitory Facilities Revenue Bonds, Mental Health Facilities Improvement Revenue Bonds and DOH Revenue Bonds, will be issued to support bond-financed capital projects over the Plan.
State PIT Revenue Bonds have successfully reduced borrowing costs. These bonds are issued under broad functional categories (e.g., Education, Transportation, Environment, Health Care, State Facilities and Equipment, and Economic Development and Housing) to support particular capital programs which are authorized to be financed with PIT Revenue Bonds, as summarized below.
● Education Revenue Bonds support SUNY and CUNY, EXCEL, New York State
Office of Science, Technology and Academic Research (NYSTAR), and the Higher Education Matching Grant Program (2008-09 issuance of $1.7 billion).
● Environmental Revenue Bonds support the State Revolving Fund, the State
Superfund Program, the Environmental Protection Fund (EPF), State Parks, West Valley and other environmental projects (2008-09 issuance of $345 million).
● Transportation Revenue Bonds support local transportation projects under the
CHIPs program (2008-09 issuance of $357 million). ● Economic Development and Housing Revenue Bonds support Housing, the
Strategic Investment Program (SIP), economic development projects for the Buffalo area, AMD, CEFAP, the Regional Economic Growth Program, Operation SPUR, the New York State Economic Development Program, high technology and other business investment programs, and $1.1 billion of new economic development initiatives, (2008-09 issuances of $1.1 billion).
● Health Care Revenue Bonds support the program for capital and equipment grants
to health care providers (2008-09 issuances of $94 million). ● State Facilities and Equipment Revenue Bonds support Correctional Facilities,
Youth Facilities, State Office Buildings, Elk Street Parking Garage, a new State Police headquarters, capital projects for DMNA and equipment bonds, including for software development (2008-09 issuance of $566 million).
The remaining issuances in 2008-09 of $1.8 billion will be financed by voter-approved
general obligation bonds or other revenue credits which are supported by dedicated streams of revenue, including transportation-related taxes and fees, student dormitory fees, and patient income. $457 million of general obligation bonds will be issued to implement projects financed primarily by the voter-approved CW/CA and all other environmental bond acts ($52 million), and the new Rebuild and Renew New York Transportation Bond Act of 2005 and other transportation purposes ($405 million).

DETAILED DATA
114
DHBTF Bonds, which are issued by the NYS Thruway Authority and supported by transportation-related taxes and fees, will total $708 million in 2008-09.
SUNY Dormitory Facilities Bonds, which are issued by the Dormitory Authority of the
State of New York (DASNY), are supported by dormitory fees and rents charged to students residing in housing facilities on campus. The bond issuances of $119 million in 2008-09 will support the expansion and renovation of SUNY Dormitory Facilities under the SUNY multi-year capital investment program enacted in 2003-04.
Mental Hygiene Bonds are issued by DASNY and supported by patient revenues.
These issuances of $519 million in 2008-09 will support capital projects to preserve and maintain both State and community-based facilities operated and/or licensed by OMH, OMRDD, and OASAS.
AUTHORITY BOND FINANCING
Authority bond-financed capital spending is reimbursed by the proceeds of bonds sold by State public authorities pursuant to contractual agreements with the State. Over the Plan, approximately 52 percent of total spending will be financed with authority bond proceeds. The largest component of spending (25 percent) financed by authority bonds is within the Dedicated Highway and Bridge Trust Fund (DHBTF). DHBTF Bonds are issued to support disbursements over the five-year DOT Capital Plan. These disbursements are projected to average $920 million annually through 2012-13.
The State expects to use State PIT Revenue Bonds as the financing vehicle for the vast
majority of new bond-financed spending for non-transportation programs. This includes the new bonding recommendations for the Environmental Protection Fund, the State Parks Infrastructure Fund, economic development, and the new statewide program for financing software research, development, and upgrades. Bond-financed spending across all non-transportation programs decreases from approximately $3.9 billion in 2008-09 to about $1.9 billion in 2012-13.

DETAILED DATA
115
CAPITAL PROJECTS FINANCED BY AUTHORITY BONDS RESOURCES
CAPITAL PROGRAM AND FINANCING PLAN 2007-2008 THROUGH 2012-2013
(thousands of dollars)
2007-2008 2008-2009 2009-2010 2010-11 2011-12 2012-13Transportation Department of Transportation 1,128,692 1,056,289 1,138,805 1,285,045 1,401,747 1,467,631
Parks and Environment Department of Environmental Conservation 151,907 249,500 174,500 162,000 159,688 152,000 Off ice of Parks, Recreation and Historic Preservation 2,500 79,000 35,000 0 0 0 Environmental Facilities Corporation 5,000 5,055 0 0 0 0
Economic Development & Gov't. Oversight Department of Agriculture and Markets 3,500 36,500 3,000 996 0 0 Division of Housing and Community Renew al 107,838 89,000 73,625 73,625 73,625 73,625 Urban Development Corporation 404,320 848,385 761,900 542,425 457,970 208,500 Econmic Development and Foundation for Science, Technology and Innovation 8,217 3,976 0 0 0 0 Energy Research and Development Authority 13,500 13,500 13,500 13,500 13,500 13,500 Olympic Regional Development Authority 5,500 0 0 0 0 0All State Departments and Agencies Regional Economic Development 258,425 118,870 59,880 41,380 35,027 27,500 Javits Convention Center 0 0 185,000 140,000 25,000 0 Upstate Economic Development Program 41,300 49,450 40,000 40,000 12,500 11,840 Strategic Investment Program 28,000 10,000 14,000 14,000 10,376 5,000 High Technology Development 52,485 41,810 33,600 33,050 21,050 20,000
Health and Social Welfare Off ice of Children and Family Services 18,950 19,000 20,000 20,000 19,000 19,000 Department of Health 73,500 99,600 118,817 163,933 0 0 Off ice of Temporary and Disability Assistance 31,600 31,600 30,390 30,000 30,000 30,000
Education State University of New York 645,000 747,000 831,000 907,000 893,000 910,000 City University of New York 311,400 439,294 387,008 404,877 515,987 666,241 State Education Department-EXCEL 1,000,000 750,000 554,000 0 0 0 State Education Department-All Other Programs 21,175 49,500 40,885 20,700 500 0 Higher Education Capital Matching Grants 10,000 50,000 30,000 30,000 30,000 0
Public Protection Department of Correctional Services 245,000 290,000 314,500 323,000 330,000 330,000 Division of Military and Naval Affairs 3,000 3,000 3,000 3,000 3,000 3,000 Division of State Police 1,310 26,807 27,280 21,000 11,000 11,000
Mental Hygiene Off ice of Mental Health 200,642 329,002 394,769 305,071 322,653 322,653 Off ice of Mental Retardation and Developmental Disabilities 67,794 78,530 90,100 60,325 38,400 32,600 Off ice of Alcoholism and Substance Abuse Services 40,959 88,169 143,208 115,514 131,943 116,768
General Government Off ice of General Services 21,300 52,000 20,000 20,000 20,000 20,000
Department of State 49,000 3,156 0 0 0 0
Office of Technology 2,050 25,600 37,000 55,500 0 0
Other Statew ide Equipment 50,000 111,000 60,000 60,000 60,000 60,000 Judiciary
Total Authority Bond Financing
0 13,218 29,050 29,050
5,003,864 5,807,811 5,663,817 4,914,991
5,582
4,621,548
0
4,500,858

DETAILED DATA
116
PERSONAL INCOME TAX REVENUE BOND PROGRAM Article 5-C of the State Finance Law established the Personal Income Tax (PIT) Revenue Bond Program which provides for the issuance of debt for a variety of purposes supported by a portion of the State’s Personal Income Tax. The chart below shows the projected coverage ratio for the PIT Revenue bonds based upon projections of PIT receipts into the Revenue Bond Tax Fund (RBTF) and new PIT debt issuances.
PROJECTED PIT REVENUE BOND COVERAGE RATIOS2008-09 THROUGH 2012-13
(thousands of dollars)
2007-08 2008-09 2009-10 2010-11 2011-12 2012-13
Projected RBTF Receipts 9,137,750 9,701,250 10,439,600 11,115,350 11,843,350 12,597,350
PIT Bonds Outstanding (1/10/07) 9,834,000 9,354,090 8,859,480 8,409,265 7,938,330 7,473,390
Max. Annual Debt Service (1/10/07) 949,293 949,293 943,562 877,985 877,985 850,190
Projected New PIT Bonds Outstanding 1,180,237 5,229,204 9,010,948 12,100,337 14,681,373 16,971,209
Projected Total PIT Bonds Outstanding 11,014,237 14,583,294 17,870,428 20,509,602 22,619,703 24,444,599
Projected Max. Annual Debt Service 1,085,743 1,471,559 1,834,702 2,095,085 2,343,810 2,578,721
Projected PIT Coverage Ratio 8.4 6.6 5.7 5.3 5.1 4.9

DETAILED DATA
117
DEDICATED HIGHWAY AND BRIDGE TRUST FUND SUMMARY PLAN (DHBTF)
The following tables provide projected receipt, disbursement, and transfer amounts for the DHBTF. Overall transportation-related capital spending represents 50 percent of total capital projects spending estimated over the five years of the Plan. Projected spending from this Fund will total over $13.1 billion, which represents almost 55 percent of the total transportation-related spending for capital projects estimated during that period. Any projected temporary deficit is caused by timing between disbursements and receipts.
DEDICATED HIGHWAY AND BRIDGE TRUST FUND
PREPARED ON THE CASH BASIS OF ACCOUNTING CAPITAL PROGRAM AND FINANCING PLAN
2007-2008 THROUGH 2012-2013(thousands of dollars)
2007-08 2008-09 2009-10 2010-11 2011-12 2012-13Opening Balance ($90,261) ($49,000) ($31,000) ($31,000) ($31,000) ($31,001)
Receipts: Detail on taxes Auto Rental Tax $49,100 $51,200 $53,300 $55,400 $57,600 $60,000 Corporation & Utiility Tax $17,000 $17,000 $17,000 $17,000 $17,000 $17,000 Highw ay Use Tax $147,500 $161,600 $178,100 $181,100 $187,800 $188,600 Motor Fuel Tax $404,689 $277,123 $0 $0 $0 $0 Motor Vehicle Fees $561,700 $552,665 $562,688 $549,700 $561,700 $549,700 Petroleum Business Taxes $625,100 $798,700 $1,100,707 $1,105,460 $1,110,201 $1,114,750 Total taxes $1,805,089 $1,858,288 $1,911,795 $1,908,660 $1,934,301 $1,930,050
Detail on miscellaneous receipts Authority Bond proceeds $771,442 $694,289 $788,805 $935,045 $1,051,747 $1,117,631 Miscellaneous receipts (Non-Coverage) $100,878 $178,770 $210,972 $200,973 $200,975 $200,978 Miscellaneous receipts (Coverage-Related) $21,622 $41,070 $41,569 $52,069 $52,569 $53,069 Total receipts $2,699,031 $2,772,417 $2,953,141 $3,096,747 $3,239,592 $3,301,728
Disbursements: Capital Projects Personal Service $1,000 $1,030 $1,061 $1,093 $1,126 $1,159 Non-Personal Service $12,000 $12,360 $12,731 $13,113 $13,506 $13,911 Capital Projects $627,204 $668,393 $764,218 $927,525 $1,036,213 $1,087,603
State Forces Engineering Personal Service $222,696 $228,736 $239,888 $240,811 $242,799 $254,653 Non-Personal Service $178,162 $179,714 $190,687 $190,971 $200,284 $211,231
Consultant Engineering $219,107 $232,422 $235,015 $233,215 $234,902 $235,685
State Operations Department of Transportation Personal Service $290,525 $305,958 $314,617 $319,602 $322,871 $327,273 Non-Personal Service $377,946 $426,490 $467,010 $490,172 $507,480 $520,306 Department of Motor Vehicles Personal Service $93,662 $94,599 $95,643 $96,527 $97,669 $98,825 Non-Personal Service $104,544 $125,621 $118,253 $122,029 $127,039 $129,426 Total spending $2,126,846 $2,275,323 $2,439,123 $2,635,057 $2,783,889 $2,880,073
Other Financing Sources: Transfers from Federal funds $291,144 $267,007 $262,927 $307,761 $313,236 $308,462 Transfers from General Fund $3,000 $118,500 $211,800 $586,100 $689,400 $789,600 Transfers from General Obligation Bond Funds $47,327 $104,580 $69,650 $42,318 $22,503 $32,126 Transfer to Engineering Services Fund ($10,832) ($2,749) ($1,869) ($836) $0 $0 Transfer for Dedicated Trust Fund Debt Service ($488,900) ($562,072) ($625,032) ($937,215) ($1,015,503) ($1,070,131) Transfer for Local Highw ay Debt Service ($372,663) ($404,360) ($431,494) ($459,818) ($465,340) ($481,712) Net other f inancing sources (uses) ($530,924) ($479,094) ($514,018) ($461,690) ($455,704) ($421,655)
Closing Balance ($49,000) ($31,000) ($31,000) ($31,000) ($31,001) ($31,001)
Est imat ed D ed icat ed F und B o nd s C o verag e R at io ( 1) 2.4 2.4 2.4 2.2 2.1 2.0
(1) The formula for this calculation for each State Fiscal Year is: (Total Taxes +Miscellaneous Receipts (Coverage-Related))/Dedicated Trust Fund Debt Service=Estimated Coverage This example is not intended to be used for any additional bonds test. The actual calculation requires that the amount of collections of Trust Fund Revenues for any 12 consecutive calendar months occurring not more than six months prior to the date of the calulation less Thruw ay Authority expenses related to the State's multi-year highway and bridge capital program for that State Fiscal Year shall be at least tw o times the sum of the amount calculated pursuant to the First General Bond Resolution and the Aggregate Debt Service less any accrued or capitalized interest on non-variable rate bonds.

DETAILED DATA
118
CAPITAL PROJECTS FUNDS FINANCIAL PLAN
The following table provides an explanation of the receipt, disbursement, transfer and general obligation bond amounts contained in the Plan and how they correspond to the applicable Governmental Funds financial plans.
CAPITAL PROJECTS FUNDS FINANCIAL PLANPREPARED ON THE CASH BASIS OF ACCOUNTING
CAPITAL PROGRAM AND FINANCING PLAN2007-2008 THROUGH 2012-2013
(thousands of dollars)
2007-2008 2008-2009 2009-2010 2010-2011 2011-2012 2012-2013
Opening fund balances
Receipts:
(431,421) (332,053) (234,450) (68,155) 106,110 269,644
Taxes 2,017,089 2,095,288 2,198,795 2,195,660 2,221,301 2,217,050 Miscellaneous receipts 5,402,945 6,128,243 6,005,728 5,246,475 4,948,609 4,822,500 Federal grants 1,858,902 2,010,179 2,043,995 1,989,262 1,945,422 1,941,350 Total receipts 9,328,936 10,344,710 10,308,518 9,491,397 9,175,332 9,040,900
Disbursements: Grants to local governments 602,853 615,145 647,257 618,113 638,335 630,947 Capital projects 8,233,684 9,482,738 9,744,049 9,094,368 8,569,353 8,328,761 Total disbursements 8,836,537 10,097,883 10,391,306 9,712,481 9,207,688 8,959,708
Other financing sources (uses): Transfers from other funds 251,990 607,083 784,066 1,219,465 1,245,091 1,248,641 Transfers to other funds (942,921) (1,213,407) (1,143,084) (1,479,217) (1,563,302) (1,633,548) Bond and note proceeds 297,900 457,100 608,100 655,100 514,100 456,100 Net other f inancing sources (uses) (393,031) (149,224) 249,082 395,348 195,889 71,193
Changes in fund balances 99,368 97,603 166,295 174,265 163,534 152,386
Closing fund balances (332,053) (234,450) (68,155) 106,110 269,644 422,030
DETAILED DATA
119
STATE DEBT DETAIL The tables that follow provide a comprehensive listing of all current and projected State debt outstanding, debt service costs, debt retirements, and new debt issuances. State-related debt levels reported in the tables are cash-basis amounts that are consistent with the GAAP-basis debt levels reported in the Comptroller’s “Comprehensive Annual Financial Report (CAFR).” Thus, it reflects all debt issued by the State (including blended component units) for Government activities and Business-type activities as defined in the CAFR published by the State Comptroller. The tables do not include debt that is issued by, or on behalf of, local governments that may be funded in part by State local assistance aid payments. However, such debt is reflected in the respective financial statements of the local governments responsible for the issuance of such debt.

DETAILED DATA
120
STATE DEBT OUTSTANDINGSUMMARIZED BY FUNCTION AND FINANCING PROGRAM
2007-2008 THROUGH 2012-2013(thousands of dollars)
2007-2008 2008-2009 2009-2010 2010-2011 2011-2012 2012-2013
GENERAL OBLIGATION BONDS Economic Development & Housing 120,741 105,526 90,240 77,497 65,364 55,259 Environment 1,879,698 1,733,963 1,606,498 1,487,853 1,377,311 1,271,573 Transportation 1,250,226 1,517,700 1,910,716 2,325,869 2,581,345 2,773,508
REVENUE BONDSPersonal Income Tax Economic Development & Housing 2,387,182 3,306,565 4,149,967 4,818,161 5,245,924 5,342,675 Education 4,332,365 5,842,632 7,382,029 8,461,868 9,544,209 10,727,650 Environment 675,275 983,300 1,159,809 1,277,551 1,384,904 1,471,277 Health Care 66,045 153,191 256,621 392,243 347,295 309,002 State Facilities & Equipment 1,908,085 2,376,165 2,738,986 3,130,025 3,436,306 3,718,253 Transportation 1,645,285 1,921,440 2,183,016 2,429,754 2,661,065 2,875,742Other Revenue Education
SUNY Dorms 873,355 964,725 1,032,870 1,075,981 1,124,986 1,162,641 Health & Mental Hygiene
Health Income 339,800 327,055 313,740 299,760 285,095 270,440Mental Health Services 3,920,705 4,267,222 4,601,516 4,835,826 5,081,234 5,307,549
Local Government AssistanceSales Tax 4,036,522 3,874,183 3,678,375 3,474,183 3,244,248 3,003,183
TransportationDedicated Highway 6,559,957 7,071,192 7,633,637 8,306,956 8,815,892 9,337,295
SERVICE CONTRACT & LEASE-PURCHASE BONDS Economic Development & Housing 1,260,130 1,167,544 1,075,626 969,328 868,850 801,075 Education 6,017,394 5,715,991 5,363,212 5,048,655 4,625,972 4,203,791 Environment 193,412 171,662 148,817 126,427 107,721 92,992 Health & Mental Hygiene 53,645 50,570 47,365 44,000 40,485 36,970 State Facilities & Equipment 3,395,470 3,226,003 3,045,236 2,852,018 2,652,271 2,437,247 Transportation 3,936,350 3,764,935 3,554,825 3,356,500 3,107,705 2,870,160
TOTAL STATE-SUPPORTED Economic Development & Housing 3,768,053 4,579,635 5,315,833 5,864,987 6,180,138 6,199,009 Education 11,223,114 12,523,347 13,778,110 14,586,504 15,295,167 16,094,082 Environment 2,748,385 2,888,925 2,915,124 2,891,831 2,869,936 2,835,842 Health & Mental Hygiene 4,380,195 4,798,039 5,219,242 5,571,830 5,754,109 5,923,961 LGAC 4,036,522 3,874,183 3,678,375 3,474,183 3,244,248 3,003,183 State Facilities & Equipment 5,303,555 5,602,168 5,784,222 5,982,043 6,088,577 6,155,500 Transportation 13,391,818 14,275,267 15,282,193 16,419,079 17,166,007 17,856,704
SUBTOTAL STATE-SUPPORTED 44,851,641 48,541,564 51,973,099 54,790,455 56,598,182 58,068,281
OTHER STATE DEBT OBLIGATIONS Tobacco 3,839,480 3,521,110 3,178,205 2,809,835 2,414,020 1,988,710 All Other 1,300,286 1,236,098 1,156,314 1,069,612 978,520 884,565
SUBTOTAL OTHER STATE 5,139,766 4,757,208 4,334,519 3,879,447 3,392,540 2,873,275
GRAND TOTAL STATE-RELATED 49,991,407 53,298,772 56,307,618 58,669,902 59,990,722 60,941,556

DETAILED DATA
121
STATE DEBT OUTSTANDING2007-2008 THROUGH 2012-2013
(thousands of dollars)
2007-2008 2008-2009 2009-2010 2010-2011 2011-2012 2012-2013
GENERAL OBLIGATION 3,250,665 3,357,189 3,607,454 3,891,220 4,024,019 4,100,339LOCAL GOVERNMENT ASSISTANCE CORPORATION 4,036,522 3,874,183 3,678,375 3,474,183 3,244,248 3,003,183OTHER LEASE-PURCHASE AND CONTRACTUAL-OBLIGATION FINANCING ARRANGEMENTS Transportation Metropolitan Trans Authority 2,218,820 2,169,325 2,117,340 2,062,790 2,005,455 1,945,135 Dormitory Authority Albany County Airport 28,030 25,745 23,340 20,810 18,160 15,425 Thruw ay Authority: Consolidated Local Highw ay Improvement 3,334,785 3,491,305 3,597,161 3,702,654 3,745,155 3,785,342 Dedicated Highw ay & Bridge 6,559,957 7,071,192 7,633,637 8,306,956 8,815,892 9,337,295 Education Dormitory Authority: SUNY Educational Facilities 4,774,917 5,170,991 5,667,087 6,213,101 6,666,623 7,108,947 SUNY Dormitory Facilities 873,355 964,725 1,032,870 1,075,981 1,124,986 1,162,641 SUNY Upstate Community Colleges 583,941 592,384 599,861 615,760 634,177 643,826 CUNY Educational Facilities 3,269,681 3,407,469 3,605,886 3,860,796 4,152,862 4,559,026 State Education Department 61,020 58,650 56,430 54,150 51,780 48,530 Library for the Blind 5,580 4,765 3,910 3,010 2,060 1,060 SUNY Athletic Facilities 21,250 20,165 19,020 17,810 16,550 15,225 RESCUE 124,895 110,475 95,425 79,675 63,065 53,650 University Facilities (Jobs 2000) 30,305 25,480 20,460 15,205 9,705 7,280 Judicial Training Institute 11,665 10,990 10,280 9,530 8,740 7,905 School District Capital Outlays 46,325 35,570 24,305 12,470 0 0 Transportation Transition Grants 30,355 17,000 0 0 0 0 Higher Ed Capital Matching Grants 0 56,312 79,379 99,692 117,124 131,524 Public Broadcasting Facilities 12,510 11,240 9,915 8,540 7,085 5,560 EXCEL School Construction 1,355,495 1,951,412 2,408,874 2,332,758 2,253,202 2,170,028 Library Facilities 12,185 26,862 31,080 35,033 32,761 30,372 Cultural Educ Storage Facilities 9,635 46,018 71,282 83,732 81,825 78,669 Judiciary Training Academies 0 12,840 42,045 69,261 72,622 69,838 Health DOH & Veterans' Home Facilites 393,445 377,625 361,105 343,760 325,580 307,410 Health Care Grants 66,045 153,191 256,621 392,243 347,295 309,002 Mental Hygiene Mental Health Facilities 3,920,705 4,267,222 4,601,516 4,835,826 5,081,234 5,307,549 Public Protection ESDC: Prison Facilities 4,292,726 4,457,880 4,627,665 4,769,248 4,890,518 4,986,539 Youth Facilities 180,899 179,021 178,082 175,791 177,942 178,471 Homeland Security 19,700 18,780 17,820 16,820 15,770 14,665 Environment EFC/ERDA: Riverbank Park 50,955 48,770 46,450 43,980 41,360 38,575 Pilgrim Sew age Treatment 6,100 5,500 4,900 4,200 3,400 2,600 State Park Infrastructure 5,920 4,715 3,445 2,115 715 0 Pipeline for Jobs (Jobs 2000) 21,160 17,338 13,329 9,108 5,792 3,936 Environmental Infrastructure 489,925 669,268 720,612 720,874 721,657 710,931 Hazardous Waste Remediation 293,320 410,529 523,612 628,369 725,356 814,915 West Valley 3,405 1,740 0 0 0 0 ESDC: Pine Barrens 9,256 8,456 7,631 6,686 5,700 4,666 State Buildings/Equipment ESDC: Empire State Plaza 19,885 12,724 6,110 0 0 0 State Buildings 11,354 11,354 11,354 11,354 11,354 11,354 State Capital Projects 185,900 175,850 165,230 154,005 142,145 129,605 ESDC / DA / OGS State Facilities 395,508 515,719 586,780 666,334 677,937 678,035 Equipment / Certif icates of Participation 125,295 188,482 171,028 177,137 161,557 145,478 E911 60,935 31,005 8,798 0 0 0 Housing Housing Finance Agency 1,530,704 1,582,634 1,614,781 1,639,261 1,659,069 1,658,445 Economic Development TBTA/ESDC Javits Center 152,445 118,125 270,020 370,456 348,967 343,200 ESDC/DA University Technology Centers 107,704 95,547 83,344 69,566 55,164 40,084 Onondaga Convention Center 32,535 31,980 31,385 28,875 26,240 23,475 Sports Facilities 160,495 213,468 229,158 212,571 195,200 176,997 Community Enhancement Facilities 152,658 151,534 134,890 107,515 89,739 79,261 Child Care Facilities 19,875 18,650 17,380 16,045 14,645 13,175 Buffalo Inner Harbor 23,613 40,839 57,941 52,683 47,151 41,331 Strategic Investment Program 17,340 24,319 33,365 39,573 42,844 41,232 Regional Economic Grow th 740,002 738,440 705,397 666,971 595,887 529,191 NYS Econ. Dev. Program 236,520 281,759 319,659 351,183 382,604 411,109 High Technology & Development 107,357 186,481 203,032 204,653 206,138 206,430 Regional Economic Development 45,496 55,005 72,410 85,531 91,787 97,404 Economic Development Initiatives 234,226 497,884 550,627 576,056 613,983 646,588 Semiconductor Manufacturing Facility 0 102,000 246,853 379,283 498,780 604,748 Other Economic Development 9,180 69,222 78,301 73,756 68,990 63,995 High Technology Projects 61,200 120,459 176,216 228,356 276,746 321,223 2008 Economic Development Initiatives 0 102,000 351,309 637,346 854,824 801,724 RIOC Tram, etc. 15,963 43,762 49,526 47,810 46,015 44,139
Total Other Financing Arrangements
SUBTOTAL STATE-SUPPORTED DEBT
37,564,454 41,310,191
44,851,641 48,541,564
44,687,271
51,973,099
47,425,052
54,790,455
49,329,915
56,598,182
50,964,758
58,068,281

DETAILED DATA
122
STATE DEBT OUTSTANDING2007-2008 THROUGH 2012-2013
(thousands of dollars)
2007-2008 2008-2009 2009-2010 2010-2011 2011-2012 2012-2013
SUBTOTAL STATE-SUPPORTED 44,851,641 48,541,564 51,973,100 54,790,455 56,598,182 58,068,281
OTHER STATE DEBT OBLIGATIONS
Contigent Contractual DASNY/MCFFA Secured Hospitals Program 748,970 716,845 670,300 618,150 562,800 504,945 Tobacco Settlement Financing Corp. 3,839,480 3,521,110 3,178,205 2,809,835 2,414,020 1,988,710
Moral Obligation Housing Finance Agency Moral Obligation Bonds 46,676 41,463 35,914 29,987 23,835 17,865 MCFFA Nursing Homes and Hospitals 3,605 3,255 2,880 2,480 2,035 1,560
State Guaranteed Debt Job Development Authority (JDA) 37,350 32,470 27,745 23,220 18,940 15,435
State Funded MBBA Prior Year School Aid Claims 463,685 442,065 419,475 395,775 370,910 344,760
SUBTOTAL OTHER STATE 5,139,766 4,757,208 4,334,519 3,879,447 3,392,540 2,873,275
60,941,556GRAND TOTAL STATE-RELATED
49,991,407 53,298,772 56,307,619 58,669,902 59,990,722
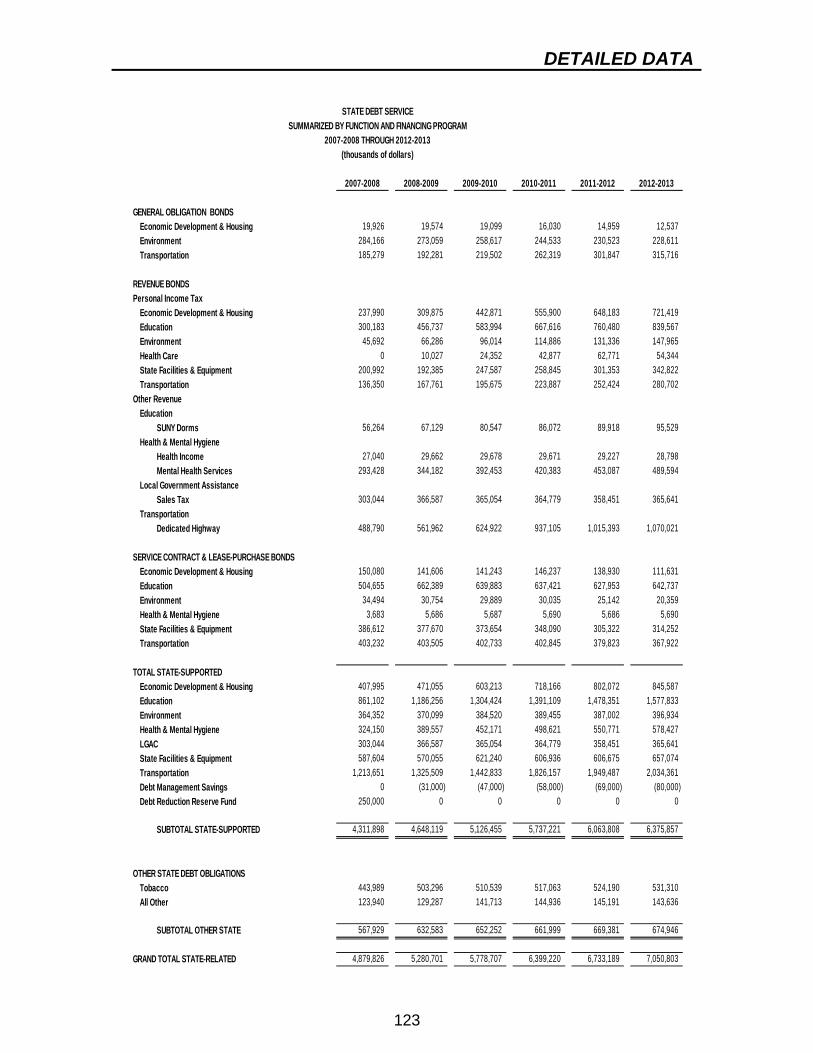
DETAILED DATA
123
STATE DEBT SERVICESUMMARIZED BY FUNCTION AND FINANCING PROGRAM
2007-2008 THROUGH 2012-2013(thousands of dollars)
2007-2008 2008-2009 2009-2010 2010-2011 2011-2012 2012-2013
GENERAL OBLIGATION BONDS Economic Development & Housing 19,926 19,574 19,099 16,030 14,959 12,537 Environment 284,166 273,059 258,617 244,533 230,523 228,611 Transportation 185,279 192,281 219,502 262,319 301,847 315,716
REVENUE BONDSPersonal Income Tax Economic Development & Housing 237,990 309,875 442,871 555,900 648,183 721,419 Education 300,183 456,737 583,994 667,616 760,480 839,567 Environment 45,692 66,286 96,014 114,886 131,336 147,965 Health Care 0 10,027 24,352 42,877 62,771 54,344 State Facilities & Equipment 200,992 192,385 247,587 258,845 301,353 342,822 Transportation 136,350 167,761 195,675 223,887 252,424 280,702Other Revenue Education
SUNY Dorms 56,264 67,129 80,547 86,072 89,918 95,529 Health & Mental Hygiene
Health Income 27,040 29,662 29,678 29,671 29,227 28,798Mental Health Services 293,428 344,182 392,453 420,383 453,087 489,594
Local Government AssistanceSales Tax 303,044 366,587 365,054 364,779 358,451 365,641
TransportationDedicated Highway 488,790 561,962 624,922 937,105 1,015,393 1,070,021
SERVICE CONTRACT & LEASE-PURCHASE BONDS Economic Development & Housing 150,080 141,606 141,243 146,237 138,930 111,631 Education 504,655 662,389 639,883 637,421 627,953 642,737 Environment 34,494 30,754 29,889 30,035 25,142 20,359 Health & Mental Hygiene 3,683 5,686 5,687 5,690 5,686 5,690 State Facilities & Equipment 386,612 377,670 373,654 348,090 305,322 314,252 Transportation 403,232 403,505 402,733 402,845 379,823 367,922
TOTAL STATE-SUPPORTED Economic Development & Housing 407,995 471,055 603,213 718,166 802,072 845,587 Education 861,102 1,186,256 1,304,424 1,391,109 1,478,351 1,577,833 Environment 364,352 370,099 384,520 389,455 387,002 396,934 Health & Mental Hygiene 324,150 389,557 452,171 498,621 550,771 578,427 LGAC 303,044 366,587 365,054 364,779 358,451 365,641 State Facilities & Equipment 587,604 570,055 621,240 606,936 606,675 657,074 Transportation 1,213,651 1,325,509 1,442,833 1,826,157 1,949,487 2,034,361 Debt Management Savings 0 (31,000) (47,000) (58,000) (69,000) (80,000) Debt Reduction Reserve Fund 250,000 0 0 0 0 0
6,375,857SUBTOTAL STATE-SUPPORTED 4,311,898 4,648,119 5,126,455 5,737,221 6,063,808
OTHER STATE DEBT OBLIGATIONS Tobacco 443,989 503,296 510,539 517,063 524,190 531,310 All Other 123,940 129,287 141,713 144,936 145,191 143,636
674,946
7,050,803
SUBTOTAL OTHER STATE 567,929 632,583 652,252
GRAND TOTAL STATE-RELATED 4,879,826 5,280,701 5,778,707
661,999
6,399,220
669,381
6,733,189

DETAILED DATA STATE DEBT SERVICE 2007-2008 THROUGH 2012-2013(thousands of dollars)
2007-2008 2008-2009 2009-2010 2010-2011 2011-2012 2012-2013
556,864GENERAL OBLIGATION 489,370 484,914 497,219 522,882 547,330LOCAL GOVERNMENT ASSISTANCE CORPORATION 303,044 366,587 365,054 364,779 358,451 365,641OTHER LEASE-PURCHASE AND CONTRACTUAL-OBLIGATION FINANCING ARRANGEMENTS Transportation Metropolitan Trans Authority 164,992 164,994 164,993 164,998 164,992 164,992 Dormitory Authority Albany County Airport 3,477 3,479 3,487 3,483 3,481 3,486 Thruw ay Authority: Consolidated Local Highw ay Improvement 371,113 402,794 429,928 458,252 463,773 480,146 Dedicated Highw ay & Bridge 488,790 561,962 624,922 937,105 1,015,393 1,070,021 Education Dormitory Authority: SUNY Educational Facilities 299,941 515,767 555,532 628,163 673,531 735,223 SUNY Dormitory Facilities 56,264 67,129 80,547 86,072 89,918 95,529 SUNY Upstate Community Colleges 41,450 48,641 50,531 48,685 55,223 57,771 CUNY Educational Facilities 327,687 339,496 346,385 353,856 387,661 429,344 State Education Department 5,234 4,983 4,962 4,968 5,757 5,772 Library for the Blind 1,071 1,083 1,082 1,083 1,081 1,092 SUNY Athletic Facilities 2,019 2,153 2,163 2,159 2,151 2,148 RESCUE 20,715 20,721 20,729 20,737 12,466 12,671 University Facilities (Jobs 2000) 6,240 6,251 6,240 6,247 6,245 2,903 Judicial Training Institute 1,411 1,250 1,251 1,250 1,251 1,249 School District Capital Outlays 13,183 13,178 13,171 13,160 13,151 0 Transportation Transition Grants 14,916 14,751 17,791 0 0 0 Higher Ed Capital Matching Grants 0 7,138 11,497 15,537 19,621 23,731 Public Broadcasting Facilities 1,872 1,879 1,879 1,871 1,882 1,879 EXCEL School Construction 66,929 135,058 178,852 191,318 191,306 191,319 Library Facilities 1,710 2,786 3,378 3,860 3,934 3,936 Cultural Educ Storage Facilities 462 3,120 5,379 6,736 6,994 7,011 Judiciary Training Academies 0 873 3,058 5,408 6,180 6,256 Health DOH & Veterans' Home Facilites 30,722 35,348 35,366 35,361 34,913 34,489 Health Care Grants 0 10,027 24,352 42,877 62,771 54,344 Mental Hygiene Mental Health Facilities 293,428 344,182 392,453 420,383 453,087 489,594 Public Protection ESDC: Prison Facilities 359,218 361,827 381,346 398,055 416,755 457,577 Youth Facilities 22,477 28,004 28,984 31,219 24,765 27,325 Homeland Security 1,960 1,960 1,957 1,956 1,958 1,959 Environment EFC/ERDA: Riverbank Park 4,657 4,617 4,622 4,618 4,619 4,795 Water Pollution Control 3,683 0 0 0 0 Pilgrim Sew age Treatment 254 706 684 761 832 801 State Park Infrastructure 1,504 1,501 1,506 1,502 1,506 751 Pipeline for Jobs (Jobs 2000) 4,236 4,870 4,908 4,911 3,781 2,154 Environmental Infrastructure 52,727 64,931 84,361 89,577 89,234 90,878 Hazardous Waste Remediation 10,504 18,325 28,588 42,236 55,194 67,632 West Valley 1,810 856 0 0 0 ESDC: Pine Barrens 811 1,234 1,234 1,317 1,312 1,312 State Buildings/Equipment ESDC: Empire State Plaza 34,425 34,429 34,425 34,430 0 0 State Buildings 13,867 8,917 8,969 9,004 8,915 10,666 State Capital Projects 20,259 20,314 20,313 20,308 20,307 20,315 ESDC / DA State Facilities 22,265 25,411 35,302 40,549 49,633 54,851 Equipment / Certif icates of Participation 85,822 56,655 86,438 62,304 84,342 84,380 E911 27,311 32,538 23,506 9,111 0 0 Housing Housing Finance Agency 120,764 132,285 141,128 151,055 155,268 178,858 Economic Development TBTA/ESDC Javits Center 41,879 41,845 41,842 55,520 64,590 23,461 ESDC/DA University Technology Centers 20,659 20,765 21,454 22,504 22,509 22,518 Onondaga Convention Center 2,094 2,117 2,136 4,025 4,027 4,034 Sports Facilities 11,659 15,499 22,141 27,366 27,132 27,132 Community Enhancement Facilities 13,464 32,111 43,780 48,174 34,928 33,723 Child Care Facilities 2,162 2,171 2,173 2,173 2,171 2,171 Buffalo Inner Harbor 0 3,232 5,738 8,457 8,278 8,278 Strategic Investment Program 29,554 1,186 6,197 9,420 12,637 15,866 Regional Economic Grow th 142,693 156,431 168,798 173,181 183,049 175,699 JOBS Now 3,143 0 0 0 0 NYS Econ. Dev. Program 0 8,191 13,259 17,891 22,205 26,891 High Technology & Development 0 8,696 17,443 19,584 20,702 22,053 Regional Economic Development 0 984 2,036 4,031 5,615 6,551 Economic Development Initiatives 0 18,973 48,153 54,560 60,079 67,784 Semiconductor Manufacturing Facility 0 0 13,978 34,540 54,902 75,446 Other Economic Development 0 744 7,401 8,366 8,260 8,260 High Technology Projects 0 4,957 11,513 17,943 24,461 31,043 2008 Economic Development Initiatives 0 0 11,314 39,310 72,319 99,303 RIOC Tram, etc. 0 1,293 3,633 4,037 3,980 3,980 Other State Purposes Debt Reduction Reserve Fund 250,000 0 0 0 0 Debt Management Savings 0 (31,000) (47,000) (58,000) (69,000) (80,000)
Total Other Financing Arrangements
SUBTOTAL STATE-SUPPORTED DEBT SERVICE
3,519,484 3,796,618 4,264,183
4,311,898 4,648,119 5,126,455
4,849,560
5,737,221
5,158,028
6,063,808
5,453,353
6,375,857
124
0
0
0
0

DETAILED DATA
125
STATE DEBT SERVICE2007-2008 THROUGH 2012-2013
(thousands of dollars)
2007-2008 2008-2009 2009-2010 2010-2011 2011-2012 2012-2013
SUBTOTAL STATE-SUPPORTED 4,311,898 4,648,119 5,126,455 5,737,221 6,063,808 6,375,857
OTHER STATE DEBT OBLIGATIONS
Contigent Contractual DASNY/MCFFA Secured Hospitals Program 62,704 68,443 81,216 84,790 85,653 85,644 Tobacco Settlement Financing Corp. 443,989 503,296 510,539 517,063 524,190 531,310
Moral Obligation Housing Finance Agency Moral Obligation Bonds 8,376 8,380 8,380 8,400 8,242 7,663 MCFFA Nursing Homes and Hospitals 640 640 637 632 645 639
State Guaranteed Debt Job Development Authority (JDA) 7,033 6,640 6,298 5,925 5,469 4,497
State Funded MBBA Prior Year School Aid Claims 45,186 45,184 45,182 45,189 45,182 45,192
SUBTOTAL OTHER STATE 567,929 632,583 652,252 661,999 669,381 674,946
GRAND TOTAL STATE-RELATED 4,879,826 5,280,701 5,778,707 6,399,220 6,733,189 7,050,803

DETAILED DATA
126
STATE DEBT ISSUANCESSUMMARIZED BY FUNCTION AND FINANCING PROGRAM
2007-2008 THROUGH 2012-2013(thousands of dollars)
2007-2008 2008-2009 2009-2010 2010-2011 2011-2012 2012-2013
GENERAL OBLIGATION BONDS Environment 77,429 52,100 62,100 62,100 62,100 62,100 Transportation 220,500 405,000 546,000 593,000 452,000 394,000
REVENUE BONDSPersonal Income Tax Economic Development & Housing 1,138,462 1,119,827 1,123,930 1,017,724 833,435 551,099 Education 1,062,170 1,701,360 1,780,815 1,337,220 1,373,925 1,494,300 Environment 168,810 344,760 227,460 179,010 179,010 168,810 Health Care 66,045 94,350 121,193 167,212 0 0 State Facilities & Equipment 351,290 565,590 491,436 512,550 451,860 451,860 Transportation 325,160 357,000 357,000 357,000 357,000 357,000Other Revenue Education
SUNY Dorms 145,405 119,340 99,960 77,520 84,660 76,500 Health & Mental Hygiene
Mental Health Services 372,850 518,871 540,332 453,448 488,153 488,153 Transportation
Dedicated Highway 765,452 708,175 804,581 953,746 1,072,782 1,139,984
TOTAL Economic Development & Housing 1,138,462 1,119,827 1,123,930 1,017,724 833,435 551,099 Education 1,207,575 1,820,700 1,880,775 1,414,740 1,458,585 1,570,800 Environment 246,239 396,860 289,560 241,110 241,110 230,910 Health & Mental Hygiene 438,895 613,221 661,525 620,660 488,153 488,153 State Facilities & Equipment 351,290 565,590 491,436 512,550 451,860 451,860 Transportation 1,311,112 1,470,175 1,707,581 1,903,746 1,881,782 1,890,984
SUBTOTAL STATE-SUPPORTED 4,693,572 5,986,373 6,154,807 5,710,530 5,354,924 5,183,805
OTHER STATE DEBT OBLIGATIONS Tobacco 0 0 0 0 0 0 All Other 0 0 0 0 0 0
SUBTOTAL OTHER STATE 0 0 0 0 0 0
GRAND TOTAL STATE-RELATED
4,693,572 5,986,373 6,154,807 5,710,530 5,354,924 5,183,805

DETAILED DATA
127
STATE DEBT ISSUANCES2007-2008 THROUGH 2012-2013
(thousands of dollars) 2007-2008 2008-2009 2009-2010 2010-2011 2011-2012 2012-2013
456,100GENERAL OBLIGATION 297,929 457,100 608,100 655,100 514,100OTHER LEASE-PURCHASE AND CONTRACTUAL-OBLIGATION FINANCING ARRANGEMENTS Transportation Thruw ay Authority: Consolidated Local Highw ay Improvement 325,160 357,000 357,000 357,000 357,000 357,000 Dedicated Highw ay & Bridge 765,452 708,175 804,581 953,746 1,072,782 1,139,984 Education Dormitory Authority: SUNY Educational Facilities 406,820 618,120 719,100 808,860 787,440 816,000 SUNY Dormitory Facilities 145,405 119,340 99,960 77,520 84,660 76,500 SUNY Upstate Community Colleges 26,040 24,480 28,560 38,760 38,760 35,700 CUNY Educational Facilities 0 280,500 408,000 408,000 510,000 612,000 Higher Ed Capital Matching Grants 0 61,200 30,600 30,600 30,600 30,600 EXCEL School Construction 619,540 649,740 530,295 0 0 0 Library Facilities 0 16,320 6,120 6,120 0 0 Cultural Educ Storage Facilities 9,770 37,740 27,540 15,300 1,107 0 Judiciary Training Academies 0 13,260 30,600 29,580 6,018 0 Health Health Care Grants 66,045 94,350 121,193 167,212 0 0 Mental Hygiene Mental Health Facilities 372,850 518,871 540,332 453,448 488,153 488,153 Public Protection ESDC: Prison Facilities 247,859 295,800 320,790 329,460 336,600 336,600 Youth Facilities 12,999 19,380 20,400 20,400 19,380 19,380 Environment EFC/ERDA: Pipeline for Jobs (Jobs 2000) 5,100 0 0 0 0 0 Environmental Infrastructure 56,610 222,360 105,060 56,610 56,610 46,410 Hazardous Waste Remediation 107,100 122,400 122,400 122,400 122,400 122,400 State Buildings/Equipment ESDC / DA State Facilities 18,379 137,190 89,046 101,490 34,680 34,680 Equipment / Certif icates of Participation 46,553 113,220 61,200 61,200 61,200 61,200 E911 25,500 0 0 0 0 0 Housing Housing Finance Agency 259,519 118,983 106,182 105,698 105,698 105,698 Economic Development TBTA/ESDC Javits Center 0 0 188,700 142,800 25,500 0 ESDC/DA Sports Facilities 34,170 61,200 28,458 0 0 0 Community Enhancement Facilities 83,591 31,875 21,675 21,945 13,433 13,433 Buffalo Inner Harbor 23,613 19,064 20,563 0 0 0 Strategic Investment Program 17,340 10,200 14,280 14,280 14,280 12,444 Regional Economic Grow th 190,750 112,302 91,802 91,799 70,013 70,013 NYS Econ. Dev. Program 89,403 48,858 44,421 40,800 43,360 43,360 High Technology & Development 107,357 82,528 24,715 11,524 12,483 12,483 Regional Economic Development 12,150 9,894 18,360 15,129 9,180 9,180 Economic Development Initiatives 234,226 271,085 75,633 53,550 70,288 70,288 Semiconductor Manufacturing Facility 0 102,000 153,000 153,000 153,000 153,000 Other Economic Development 9,180 60,333 12,750 0 0 0 High Technology Projects 61,200 61,200 61,200 61,200 61,200 61,200 2008 Economic Development Initiatives 0 102,000 255,000 306,000 255,000 0 RIOC Tram, etc. 15,963 28,305 7,191 0 0 0
Total Other Financing Arrangements
TOTAL ISSUANCES
4,395,643 5,529,273
4,693,572 5,986,373
5,546,707
6,154,807
5,055,430
5,710,530
4,840,824
5,354,924
4,727,705
5,183,805

DETAILED DATA
128
STATE DEBT RETIREMENTSSUMMARIZED BY FUNCTION AND FINANCING PROGRAM
2007-2008 THROUGH 2012-2013(thousands of dollars)
2007-2008 2008-2009 2009-2010 2010-2011 2011-2012 2012-2013
GENERAL OBLIGATION BONDS Economic Development & Housing 15,014 15,215 15,286 12,742 12,134 10,105 Environment 200,253 197,835 189,565 180,745 172,642 167,838 Transportation 134,433 137,526 152,985 177,846 196,525 201,837
REVENUE BONDSPersonal Income Tax Economic Development & Housing 167,025 200,444 280,527 349,531 405,672 454,348 Education 130,530 191,093 241,419 257,381 291,584 310,859 Environment 29,370 36,735 50,951 61,268 71,656 82,437 Health Care 0 7,204 17,764 31,589 44,948 38,292 State Facilities & Equipment 116,900 97,510 128,615 121,511 145,579 169,913 Transportation 67,220 80,845 95,424 110,262 125,688 142,324Other Revenue Education
SUNY Dorms 24,250 27,970 31,815 34,409 35,655 38,845 Health & Mental Hygiene
Health Income 11,795 12,745 13,315 13,980 14,665 14,655Mental Health Services 141,765 172,353 206,038 219,138 242,745 261,838
Local Government AssistanceSales Tax 150,719 162,339 195,808 204,192 229,935 241,065
TransportationDedicated Highway 188,760 196,940 242,136 280,427 563,846 618,581
SERVICE CONTRACT & LEASE-PURCHASE BONDS Economic Development & Housing 96,996 92,587 91,918 106,298 100,478 67,775 Education 334,113 301,403 352,779 314,556 422,683 422,181 Environment 28,981 21,750 22,845 22,390 18,706 14,729 Health & Mental Hygiene 1,150 3,075 3,205 3,365 3,515 3,515 State Facilities & Equipment 166,300 169,467 180,767 193,218 199,747 215,024 Transportation 229,785 171,415 210,110 198,325 248,795 237,545
TOTAL STATE-SUPPORTED Economic Development & Housing 279,035 308,246 387,731 468,571 518,284 532,228 Education 488,893 520,466 626,013 606,347 749,922 771,885 Environment 258,604 256,320 263,361 264,403 263,005 265,004 Health & Mental Hygiene 154,710 195,377 240,321 268,072 305,873 318,301 LGAC 150,719 162,339 195,808 204,192 229,935 241,065 State Facilities & Equipment 283,200 266,977 309,382 314,729 345,326 384,937 Transportation 620,198 586,726 700,655 766,860 1,134,854 1,200,287
SUBTOTAL STATE-SUPPORTED 2,235,360 2,296,450 2,723,271 2,893,174 3,547,198 3,713,706
OTHER STATE DEBT OBLIGATIONS Tobacco 244,350 318,370 342,905 368,370 395,815 425,310 All Other 56,955 64,188 79,784 86,702 91,092 93,955
SUBTOTAL OTHER STATE DEBT 301,305 382,558 422,689 455,072 486,907 519,265
GRAND TOTAL STATE-RELATED
2,536,665 2,679,008 3,145,960 3,348,246 4,034,105 4,232,971

DETAILED DATA
129
STATE DEBT RETIREMENTS2007-2008 THROUGH 2012-2013
(thousands of dollars)
2007-2008 2008-2009 2009-2010 2010-2011 2011-2012 2012-2013
379,780GENERAL OBLIGATION 349,701 350,576 357,836 371,334 381,301LOCAL GOVERNMENT ASSISTANCE CORPORATION 150,719 162,339 195,808 204,192 229,935 241,065OTHER LEASE-PURCHASE AND CONTRACTUAL-OBLIGATION FINANCING ARRANGEMENTS Transportation Metropolitan Trans Authority 47,135 49,495 51,985 54,550 57,335 60,320 Dormitory Authority Albany County Airport 2,015 2,285 2,405 2,530 2,650 2,735 Thruw ay Authority: Consolidated Local Highw ay Improvement 247,855 200,480 251,144 251,507 314,498 316,814 Dedicated Highw ay & Bridge 188,760 196,940 242,136 280,427 563,846 618,581 Education Dormitory Authority: SUNY Educational Facilities 201,715 222,046 223,004 262,846 333,918 373,676 SUNY Dormitory Facilities 24,250 27,970 31,815 34,409 35,655 38,845 SUNY Upstate Community Colleges 12,053 16,037 21,083 22,862 20,343 26,050 CUNY Educational Facilities 181,936 142,712 209,583 153,090 217,935 205,835 State Education Department 1,440 2,370 2,220 2,280 2,370 3,250 Library for the Blind 775 815 855 900 950 1,000 SUNY Athletic Facilities 1,050 1,085 1,145 1,210 1,260 1,325 RESCUE 13,750 14,420 15,050 15,750 16,610 9,415 University Facilities (Jobs 2000) 4,625 4,825 5,020 5,255 5,500 2,425 Judicial Training Institute 645 675 710 750 790 835 School District Capital Outlays 10,280 10,755 11,265 11,835 12,470 0 Transportation Transition Grants 12,730 13,355 17,000 0 0 0 Higher Ed Capital Matching Grants 0 4,888 7,533 10,287 13,168 16,200 Public Broadcasting Facilities 1,210 1,270 1,325 1,375 1,455 1,525 EXCEL School Construction 21,220 53,823 72,833 76,116 79,555 83,175 Library Facilities 1,080 1,643 1,902 2,168 2,272 2,388 Cultural Educ Storage Facilities 135 1,357 2,276 2,851 3,014 3,156 Judiciary Training Academies 0 420 1,395 2,364 2,657 2,784 Health DOH & Veterans' Home Facilites 12,945 15,820 16,520 17,345 18,180 18,170 Health Care Grants 0 7,204 17,764 31,589 44,948 38,292 Mental Hygiene Mental Health Facilities 141,765 172,353 206,038 219,138 242,745 261,838 Public Protection ESDC: Prison Facilities 132,258 130,646 151,004 187,877 215,330 240,580 Youth Facilities 14,245 21,258 21,339 22,692 17,228 18,851 Homeland Security 885 920 960 1,000 1,050 1,105 Environment EFC/ERDA: Riverbank Park 2,055 2,185 2,320 2,470 2,620 2,785 Water Pollution Control 3,705 0 0 0 0 0 Pilgrim Sew age Treatment 600 600 600 700 800 800 State Park Infrastructure 1,150 1,205 1,270 1,330 1,400 715 Pipeline for Jobs (Jobs 2000) 3,260 3,822 4,009 4,221 3,316 1,856 Environmental Infrastructure 38,965 43,017 53,716 56,348 55,828 57,136 Hazardous Waste Remediation 1,710 5,191 9,317 17,644 25,413 32,840 West Valley 5,795 1,665 1,740 0 0 0 ESDC: Pine Barrens 1,111 800 825 945 986 1,034 State Buildings/Equipment ESDC: Empire State Plaza 7,752 7,161 6,614 6,110 0 0 State Capital Projects 9,530 10,050 10,620 11,225 11,860 12,540 ESDC / DA / OGS State Facilities 15,771 16,979 17,985 21,936 23,077 34,582 Equipment / Certif icates of Participation 78,473 50,033 78,654 55,091 76,780 77,279 E911 24,285 29,930 22,207 8,798 0 0 Housing Housing Finance Agency 62,815 67,053 74,035 81,218 85,889 106,321 Economic Development TBTA/ESDC Javits Center 32,000 34,320 36,805 42,364 46,989 5,768 ESDC/DA University Technology Centers 11,056 12,157 12,203 13,778 14,403 15,080 Onondaga Convention Center 515 555 595 2,510 2,635 2,765 Sports Facilities 10,875 8,227 12,768 16,587 17,371 18,203 Community Enhancement Facilities 10,705 32,999 38,319 49,320 31,209 23,911 Child Care Facilities 1,180 1,225 1,270 1,335 1,400 1,470 Buffalo Inner Harbor 0 1,838 3,461 5,257 5,532 5,821 Strategic Investment Program 28,190 3,221 5,234 8,072 11,009 14,056 Regional Economic Grow th 103,685 113,864 124,846 130,225 141,097 136,709 JOBS Now 3,000 0 0 0 0 0 NYS Econ. Dev. Program 0 3,619 6,521 9,276 11,939 14,856 High Technology & Development 0 3,404 8,164 9,903 10,997 12,191 Regional Economic Development 0 385 955 2,008 2,925 3,563 Economic Development Initiatives 0 7,427 22,890 28,121 32,361 37,683 Semiconductor Manufacturing Facility 0 0 8,147 20,570 33,503 47,032 Other Economic Development 0 291 3,670 4,546 4,765 4,995 High Technology Projects 0 1,941 5,443 9,059 12,811 16,723 2008 Economic Development Initiatives 0 0 5,691 19,963 37,522 53,100 RIOC Tram, etc. 0 506 1,427 1,716 1,795 1,877
Total Other Financing Arrangements
SUBTOTAL STATE-SUPPORTED RETIREMENTS
1,734,940 1,783,536
2,235,360 2,296,450
2,169,627
2,723,271
2,317,649
2,893,174
2,935,962
3,547,198
3,092,861
3,713,706

DETAILED DATA
130
STATE DEBT RETIREMENTS2007-2008 THROUGH 2012-2013
(thousands of dollars)
2007-2008 2008-2009 2009-2010 2010-2011 2011-2012 2012-2013
SUBTOTAL STATE-SUPPORTED 2,235,360 2,296,450 2,723,271 2,893,174 3,547,198 3,713,706
OTHER STATE DEBT OBLIGATIONS
Contigent Contractual DASNY/MCFFA Secured Hospitals Program 25,905 32,125 46,545 52,150 55,350 57,855 Tobacco Settlement Financing Corp. 244,350 318,370 342,905 368,370 395,815 425,310
Moral Obligation Housing Finance Agency Moral Obligation Bonds 4,895 5,213 5,549 5,927 6,152 5,970 MCFFA Nursing Homes and Hospitals 325 350 375 400 445 475
State Guaranteed Debt Job Development Authority (JDA) 5,060 4,880 4,725 4,525 4,280 3,505
State Funded MBBA Prior Year School Aid Claims 20,770 21,620 22,590 23,700 24,865 26,150
SUBTOTAL OTHER STATE 301,305 382,558 422,689 455,072 486,907 519,265
GRAND TOTAL STATE-RELATED
2,536,665 2,679,008 3,145,960 3,348,246 4,034,105 4,232,971

DETAILED DATA
131
DEBT SERVICE FUNDS FINANCIAL PLAN
The following table provides an explanation of the receipt, disbursement, and transfer amounts contained in the Plan and how they correspond to the applicable Governmental Funds financial plans.
DEBT SERVICE FUNDS FINANCIAL PLAN
2007-2008 THROUGH 2012-2013(thousands of dollars )
2007-2008 2008-2009 2009-2010 2010-2011 2011-2012 2012-2013Opening fund balances 233,130 277,336 306,607 316,353 312,330 273,497
Receipts: Taxes 12,546,712 13,122,466 13,855,420 14,641,860 15,483,149 16,305,549 Miscellaneous Receipts 670,960 684,108 686,933 687,264 686,193 679,271 Total Receipts 13,217,672 13,806,574 14,542,353 15,329,124 16,169,342 16,984,820
Disbursements: Debt Service 4,291,999 4,628,094 5,106,458 5,737,221 6,063,808 6,375,857 State Operations 58,365 61,674 61,661 61,661 61,654 61,654 Total Disbursements 4,350,364 4,689,768 5,168,119 5,798,882 6,125,462 6,437,511
Other financing sources (uses): Transfers From Other Funds 5,680,354 5,764,382 5,896,827 6,326,899 6,428,068 6,514,112 Transfers To Other Funds (14,503,456) (14,851,917) (15,261,315) (15,861,164) (16,510,781) (17,139,424) Net other financing sources (uses) (8,823,102) (9,087,535) (9,364,488) (9,534,265) (10,082,713) (10,625,312)
Changes in fund balances
Closing fund balances
44,206 29,271 9,746
277,336 306,607 316,353
(4,023) (38,833) (78,003)
312,330 273,497 195,494

DETAILED DATA
132
SUMMARY AGENCY TABLES
The following tables provide a summary of projected appropriations, commitments and disbursements for each agency on both a comprehensive construction program and capital projects fund basis. All amounts are in thousands of dollars.
The projected appropriations and disbursements on these tables reflect recommended reappropriations and new appropriations which would be effective for State fiscal year 2008-09, and from appropriations anticipated to be recommended in future State fiscal years from 2009-10 through 2012-13. The various amounts cited in the summary tables reflect numbers discussed in a particular agency’s section in the Agency Capital Program Plans section. More detailed agency information can be found in the tables at the end of this document.

DETAILED DATA
133
TRANSPORTATION, DEPARTMENT OF SUMMARY OF
PROJECTED APPROPRIATIONS, COMMITMENTS, AND DISBURSEMENTS 2008-2009 THROUGH 2012-2013
(thousands of dollars)
APPROPRIATIONS Reappro- Total
priations 2008-2009 2009-2010 2010-2011 2011-2012 2012-2013 2008-2013Program Summary Aviation 92,798 18,000 14,000 14,000 14,000 14,000 74,000Highway Facilities 10,747,527 4,173,805 4,539,510 4,709,838 4,739,647 4,638,441 22,801,241Maintenance Facilities 29,561 17,685 18,165 18,165 18,165 18,165 90,345Mass Transportation and Rail Freight 361,433 91,072 92,072 93,072 93,072 93,072 462,360Ports and Waterways 723 0 0 0 0 0 0Transportation Bondable 3,602,671 337,000 232,000 0 0 0 569,000 Total 14,834,713 4,637,562 4,895,747 4,835,075 4,864,884 4,763,678 23,996,946Fund Summary Accelerated Capacity and Transportation
Improvements Fund 34,510 0 0 0 0 0 0Capital Projects Fund 3,000 0 0 0 0 0 0Capital Projects Fund - A.C. and T.I. Fund
(Bondable) 34,233 0 0 0 0 0 0Capital Projects Fund - Advances 21,681 0 0 0 0 0 0Capital Projects Fund - Authority Bonds 22,000 0 0 0 0 0 0Capital Projects Fund - Aviation (Bondable) 2,900 0 0 0 0 0 0Capital Projects Fund - Energy Conservation
(Bondable) 247 0 0 0 0 0 0Capital Projects Fund - Infrastructure Renewal
(Bondable) 28,261 0 0 0 0 0 0Capital Projects Fund - Rebuild Renew NY 2005
(Bondable 796,148 337,000 232,000 0 0 0 569,000Dedicated Highway and Bridge Trust Fund 3,495,020 2,085,396 2,365,705 2,560,746 2,589,947 2,613,115 12,214,909Dedicated Mass Transportation Fund 209,527 71,072 72,072 73,072 73,072 73,072 362,360Energy Conservation Improved Transportation
Bond Fund 262 0 0 0 0 0 0Engineering Services Fund 156,828 0 0 0 0 0 0Federal Capital Projects Fund 6,880,386 2,071,000 2,156,303 2,131,000 2,131,000 2,006,000 10,495,303Miscellaneous New York State Agency Fund 266,910 50,000 50,000 50,000 50,000 50,000 250,000NY Metro Transportation Council Account 32,062 19,094 19,667 20,257 20,865 21,491 101,374Rebuild and Renew NY Trans Bonds of 2005 Bond
Fund 2,806,523 0 0 0 0 0 0Regional Aviation Fund 11,845 4,000 0 0 0 0 4,000Transportation Capital Facilities Bond Fund 3,394 0 0 0 0 0 0Transportation Infrastructure Renewal Bond Fund 28,976 0 0 0 0 0 0 Total 14,834,713 4,637,562 4,895,747 4,835,075 4,864,884 4,763,678 23,996,946

DETAILED DATA
TRANSPORTATION, DEPARTMENT OF SUMMARY OF
PROJECTED APPROPRIATIONS, COMMITMENTS, AND DISBURSEMENTS 2008-2009 THROUGH 2012-2013
(thousands of dollars)
COMMITMENTS 2008-2009 2009-2010 2010-2011 2011-2012 2012-2013
Program Summary Aviation 18,000 14,000 14,000 14,000 14,000Highway Facilities 4,173,805 4,539,510 4,709,838 7 4,739,64 4,638,441Maintenance Facilities 17,685 18,165 18,165 18,165 18,165Mass Transportation and Rail Freight 91,072 92,072 93,072 93,072 93,072Transportation Bondable 337,000 232,000 0 0 0 Total 4,637,562 4,895,747 4,835,075 4,864,884 4,763,678Fund Summary Capital Projects Fund - Rebuild Renew NY 2005
(Bondable 337,000 232,000 0 0 0Dedicated Highway and Bridge Trust Fund 2,085,396 2,365,705 2,560,746 2,589,947 2,613,115Dedicated Mass Transportation Fund 71,072 72,072 73,072 73,072 73,072Federal Capital Projects Fund 2,071,000 2,156,303 2,131,000 2,131,000 2,006,000Miscellaneous New York State Agency Fund 50,000 50,000 50,000 50,000 50,000NY Metro Transportation Council Account 19,094 19,667 20,257 20,865 21,491Regional Aviation Fund 4,000 0 0 0 0 Total 4,637,562 4,895,747 4,835,075 4,864,884 4,763,678
DISBURSEMENTS
Estimated Total 2007-2008 2008-2009 2009-2010 2010-2011 2011-2012 2012-2013 2008-2013
Program Summary Aviation 17,050 10,300 8,869 15,993 14,870 18,220 68,252Highway Facilities 3,605,841 3,851,862 4,079,125 4,159,645 4,246,758 4,371,941 20,709,331Maintenance Facilities 13,342 16,208 17,497 17,989 18,145 17,159 86,998Mass Transportation and Rail Freight 91,228 101,175 94,381 97,386 110,590 94,235 497,767Ports and Waterways 0 300 0 34 0 100 434Transportation Bondable 80,135 109,838 217,444 270,605 159,518 91,966 849,371 Total 3,807,596 4,089,683 4,417,316 4,561,652 4,549,881 4,593,621 22,212,153Fund Summary Capital Projects Fund 3,000 0 0 0 0 0 0Capital Projects Fund - A.C. and T.I. Fund
(Bondable) 2,000 2,000 2,000 2,000 2,000 2,000 10,000Capital Projects Fund - Advances 200 200 200 200 200 200 1,000Capital Projects Fund - Authority Bonds 10,000 12,000 0 0 0 0 12,000Capital Projects Fund - Aviation (Bondable) 300 300 300 300 300 300 1,500Capital Projects Fund - Energy Conservation
(Bondable) 100 75 50 25 0 0 150Capital Projects Fund - Infrastructure Renewal
(Bondable) 4,000 4,000 4,000 4,000 4,000 4,000 20,000Capital Projects Fund - Rebuild Renew NY 2005
(Bondable 80,135 109,838 217,444 270,605 159,518 91,966 849,371Dedicated Highway and Bridge Trust Fund 1,928,640 2,055,103 2,225,227 2,416,501 2,559,181 2,651,822 11,907,834Dedicated Mass Transportation Fund 63,980 70,512 76,422 77,347 70,727 73,852 368,860Engineering Services Fund 9,539 7,460 4,656 2,833 963 0 15,912Federal Capital Projects Fund 1,343,082 1,462,666 1,521,568 1,422,469 1,387,692 1,403,689 7,198,084CHIPS (Direct Auth Bonds) 347,250 350,000 350,000 350,000 350,000 350,000 1,750,000NY Metro Transportation Council Account 13,370 13,829 14,049 14,272 14,500 14,992 71,642Regional Aviation Fund 2,000 1,700 1,400 1,100 800 800 5,800 Total 3,807,596 4,089,683 4,417,316 4,561,652 4,549,881 4,593,621 22,212,153
134

DETAILED DATA
135
MOTOR VEHICLES, DEPARTMENT OF SUMMARY OF
PROJECTED APPROPRIATIONS, COMMITMENTS, AND DISBURSEMENTS 2008-2009 THROUGH 2012-2013
(thousands of dollars)
APPROPRIATIONS Reappro- Total
priations 2008-2009 2009-2010 2010-2011 2011-2012 2012-2013 2008-2013Program Summary Transportation Support 2,500 221,453 217,000 223,500 228,417 236,400 1,126,770 Total 2,500 221,453 217,000 223,500 228,417 236,400 1,126,770Fund Summary Dedicated Highway and Bridge Trust Fund 2,500 221,453 217,000 223,500 228,417 236,400 1,126,770 Total 2,500 221,453 217,000 223,500 228,417 236,400 1,126,770
COMMITMENTS 2008-2009 2009-2010 2010-2011 2011-2012 2012-2013
Program Summary Transportation Support 222,929 214,834 221,246 227,595 234,347 Total 222,929 214,834 221,246 227,595 234,347Fund Summary Dedicated Highway and Bridge Trust Fund 222,929 214,834 221,246 227,595 234,347 Total 222,929 214,834 221,246 227,595 234,347
DISBURSEMENTS
Estimated Total 2007-2008 2008-2009 2009-2010 2010-2011 2011-2012 2012-2013 2008-2013
Program Summary Transportation Support 198,206 220,220 213,896 218,556 224,708 228,251 1,105,631 Total 198,206 220,220 213,896 218,556 224,708 228,251 1,105,631Fund Summary Dedicated Highway and Bridge Trust Fund 198,206 220,220 213,896 218,556 224,708 228,251 1,105,631 Total 198,206 220,220 213,896 218,556 224,708 228,251 1,105,631

DETAILED DATA
136
THRUWAY AUTHORITY, NEW YORK STATE SUMMARY OF
PROJECTED APPROPRIATIONS, COMMITMENTS, AND DISBURSEMENTS 2008-2009 THROUGH 2012-2013
(thousands of dollars)
APPROPRIATIONS Reappro- Total
priations 2008-2009 2009-2010 2010-2011 2011-2012 2012-2013 2008-2013Program Summary Canal Development Program 9,299 2,000 2,000 2,000 2,000 2,000 10,000 Total 9,299 2,000 2,000 2,000 2,000 2,000 10,000Fund Summary New York State Canal System Development Fund 9,299 2,000 2,000 2,000 2,000 2,000 10,000 Total 9,299 2,000 2,000 2,000 2,000 2,000 10,000
COMMITMENTS 2008-2009 2009-2010 2010-2011 2011-2012 2012-2013
Program Summary Canal Development Program 1,734 1,804 1,876 1,951 2,029 Total 1,734 1,804 1,876 1,951 2,029Fund Summary New York State Canal System Development Fund 1,734 1,804 1,876 1,951 2,029 Total 1,734 1,804 1,876 1,951 2,029
DISBURSEMENTS
Estimated Total 2007-2008 2008-2009 2009-2010 2010-2011 2011-2012 2012-2013 2008-2013
Program Summary Canal Development Program 1,734 1,734 1,804 1,876 1,951 2,029 9,394 Total 1,734 1,734 1,804 1,876 1,951 2,029 9,394Fund Summary New York State Canal System Development Fund 1,734 1,734 1,804 1,876 1,951 2,029 9,394 Total 1,734 1,734 1,804 1,876 1,951 2,029 9,394
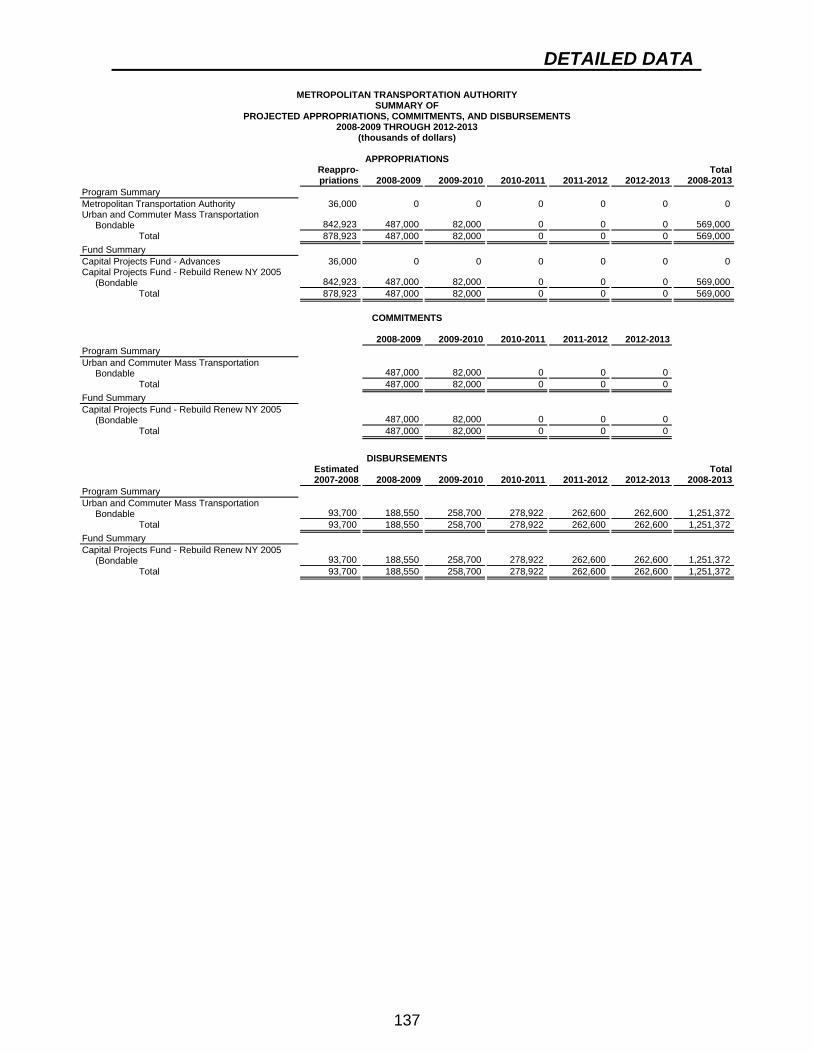
DETAILED DATA
137
METROPOLITAN TRANSPORTATION AUTHORITY SUMMARY OF
PROJECTED APPROPRIATIONS, COMMITMENTS, AND DISBURSEMENTS 2008-2009 THROUGH 2012-2013
(thousands of dollars)
APPROPRIATIONS Reappro- Total
priations 2008-2009 2009-2010 2010-2011 2011-2012 2012-2013 2008-2013Program Summary Metropolitan Transportation Authority 36,000 0 0 0 0 0 0Urban and Commuter Mass Transportation
Bondable 842,923 487,000 82,000 0 0 0 569,000 Total 878,923 487,000 82,000 0 0 0 569,000Fund Summary Capital Projects Fund - Advances 36,000 0 0 0 0 0 0Capital Projects Fund - Rebuild Renew NY 2005
(Bondable 842,923 487,000 82,000 0 0 0 569,000 Total 878,923 487,000 82,000 0 0 0 569,000
COMMITMENTS 2008-2009 2009-2010 2010-2011 2011-2012 2012-2013
Program Summary Urban and Commuter Mass Transportation
Bondable 487,000 82,000 0 0 0 Total 487,000 82,000 0 0 0Fund Summary Capital Projects Fund - Rebuild Renew NY 2005
(Bondable 487,000 82,000 0 0 0 Total 487,000 82,000 0 0 0
DISBURSEMENTS
Estimated Total 2007-2008 2008-2009 2009-2010 2010-2011 2011-2012 2012-2013 2008-2013
Program Summary Urban and Commuter Mass Transportation
Bondable 93,700 188,550 258,700 278,922 262,600 262,600 1,251,372 Total 93,700 188,550 258,700 278,922 262,600 262,600 1,251,372Fund Summary Capital Projects Fund - Rebuild Renew NY 2005
(Bondable 93,700 188,550 258,700 278,922 262,600 262,600 1,251,372 Total 93,700 188,550 258,700 278,922 262,600 262,600 1,251,372

DETAILED DATA
138
ENVIRONMENTAL CONSERVATION, DEPARTMENT OF SUMMARY OF
PROJECTED APPROPRIATIONS, COMMITMENTS, AND DISBURSEMENTS 2008-2009 THROUGH 2012-2013
(thousands of dollars)
APPROPRIATIONS Reappro- Total
priations 2008-2009 2009-2010 2010-2011 2011-2012 2012-2013 2008-2013Program Summary 96 Clean Water/Air Bond Act Fund 454,744 0 0 0 0 0 0Administration 8,709 4,100 4,000 4,000 4,000 4,000 20,100Air Resources 56,119 0 0 0 0 0 0Clean Water Clean Air Implementation 5,039 1,050 0 0 0 0 1,050Clean Water/Clean Air 96 144,416 0 0 0 0 0 0Environment and Recreation 697,522 250,000 300,000 300,000 300,000 300,000 1,450,000Environmental Protection and Enhancements 28,321 0 0 0 0 0 0Fish and Wildlife 7,321 1,000 1,500 1,500 1,500 1,500 7,000Lands and Forests 27,056 3,700 1,500 1,500 1,500 1,500 9,700Marine Resources 9,470 4,000 0 0 0 0 4,000Operations 129,674 33,350 27,000 29,000 27,000 27,000 143,350Recreation 8,244 1,500 1,325 1,325 1,325 0 5,475Solid and Hazardous Waste Management 708,276 155,275 135,000 135,000 135,000 135,000 695,275Solid Waste Management 201,857 50 675 675 675 675 2,750Water Resources 825,881 204,579 199,000 194,000 189,000 189,000 975,579 Total 3,312,649 658,604 670,000 667,000 660,000 658,675 3,314,279Fund Summary Cap Proj Fund - DEC Regular (Auth Bonds) 88,356 12,000 12,000 12,000 12,000 12,000 60,000Cap Proj Fund - Onondaga Lake (Auth Bonds) 31,917 10,000 10,000 5,000 0 0 25,000Cap Proj Fund - State Revolving Fund (Auth Bonds) 76,143 29,600 30,000 30,000 30,000 30,000 149,600Capital Projects Fund 120,096 31,884 32,000 32,000 32,000 30,675 158,559Capital Projects Fund - 1996 CWA (Bondable) 432,215 0 0 0 0 0 0Capital Projects Fund - Advances 66,440 10,000 1,000 1,000 1,000 1,000 14,000Capital Projects Fund - EQBA (Bondable) 28,211 327 0 0 0 0 327Capital Projects Fund - EQBA 86 (Bondable) 94,411 0 0 0 0 0 0Capital Projects Fund - PWBA (Bondable) 13,664 14,468 0 0 0 0 14,468Clean Air Fund 4,620 0 0 0 0 0 0Clean Water - Clean Air Bond Fund 454,744 0 0 0 0 0 0Clean Water Clean Air Implementation Fund 5,039 1,050 0 0 0 0 1,050Enterprise Fund 175 0 0 0 0 0 0Environmental Protection Fund 725,843 250,000 300,000 300,000 300,000 300,000 1,450,000Environmental Quality Bond Act Fund - 1986 104,178 0 0 0 0 0 0Environmental Quality Protection Bond Fund 33,794 0 0 0 0 0 0Federal Capital Projects Fund 433,071 154,000 150,000 150,000 150,000 150,000 754,000Financial Security Fund 1,221 0 0 2,000 0 0 2,000Forest Preserve Expansion Fund 110 0 0 0 0 0 0Hazardous Waste Remedial Fund - Cleanup 449,980 120,000 120,000 120,000 120,000 120,000 600,000Hazardous Waste Remedial Fund - Oversight &
Assessment 88,287 25,275 15,000 15,000 15,000 15,000 85,275Hudson River Habitat Restor. Fund 351 0 0 0 0 0 0Natural Resource Damages Fund 31,056 0 0 0 0 0 0Pure Waters Bond Fund 28,727 0 0 0 0 0 0 Total 3,312,649 658,604 670,000 667,000 660,000 658,675 3,314,279

DETAILED DATA
139
ENVIRONMENTAL CONSERVATION, DEPARTMENT OF SUMMARY OF
PROJECTED APPROPRIATIONS, COMMITMENTS, AND DISBURSEMENTS 2008-2009 THROUGH 2012-2013
(thousands of dollars)
COMMITMENTS 2008-2009 2009-2010 2010-2011 2011-2012 2012-2013
Program Summary Administration 2,000 2,000 2,000 2,000 2,000Air Resources 500 500 500 500 500Environment and Recreation 180,000 180,000 180,000 180,000 180,000Fish and Wildlife 1,500 1,500 1,500 1,500 1,500Lands and Forests 1,500 1,500 1,500 1,500 1,500Marine Resources 200 200 200 200 200Operations 15,000 15,000 15,000 15,000 15,000Recreation 1,325 1,325 1,325 1,325 1,325Solid and Hazardous Waste Management 135,000 135,000 135,000 135,000 135,000Solid Waste Management 650 650 650 650 650Water Resources 199,525 199,525 194,525 189,525 189,525 Total 537,200 537,200 532,200 527,200 527,200Fund Summary Cap Proj Fund - Onondaga Lake (Auth Bonds) 10,000 10,000 5,000 0 0Cap Proj Fund - State Revolving Fund (Auth Bonds) 30,000 30,000 30,000 30,000 30,000Capital Projects Fund 30,000 30,000 30,000 30,000 30,000Capital Projects Fund - Advances 1,000 1,000 1,000 1,000 1,000Environmental Protection Fund 180,000 180,000 180,000 180,000 180,000Federal Capital Projects Fund 150,000 150,000 150,000 150,000 150,000Financial Security Fund 200 200 200 200 200Hazardous Waste Remedial Fund - Cleanup 120,000 120,000 120,000 120,000 120,000Hazardous Waste Remedial Fund - Oversight &
Assessment 15,000 15,000 15,000 15,000 15,000Natural Resource Damages Fund 1,000 1,000 1,000 1,000 1,000 Total 537,200 537,200 532,200 527,200 527,200
DISBURSEMENTS
Estimated Total 2007-2008 2008-2009 2009-2010 2010-2011 2011-2012 2012-2013 2008-2013
Program Summary Administration 786 1,134 1,732 1,509 1,635 1,180 7,190Air Resources 8,928 8,602 5,287 4,154 6,374 8,198 32,615Clean Water/Clean Air 96 17,577 14,234 18,313 18,787 15,536 15,104 81,974Environment and Recreation 137,000 149,142 161,790 174,800 185,955 200,000 871,687Environmental Protection and Enhancements 13,000 10,858 8,210 5,200 4,045 0 28,313Fish and Wildlife 1,199 1,171 1,694 1,104 809 570 5,348Lands and Forests 1,610 1,590 3,310 3,459 2,023 2,545 12,927Marine Resources 525 475 250 250 1,675 1,000 3,650Operations 22,463 19,183 18,396 19,580 19,510 20,360 97,029Recreation 707 910 987 973 1,205 500 4,575Solid and Hazardous Waste Management 136,071 164,346 164,018 152,540 152,544 148,880 782,328Solid Waste Management 8,154 7,586 6,056 3,200 6,113 3,674 26,629Water Resources 174,890 160,579 159,767 161,754 157,574 155,299 794,973 Total 522,910 539,810 549,810 547,310 554,998 557,310 2,749,238Fund Summary Cap Proj Fund - DEC Regular (Auth Bonds) 12,000 24,500 24,500 12,000 12,000 12,000 85,000Cap Proj Fund - Onondaga Lake (Auth Bonds) 10,000 10,000 10,000 10,000 7,688 0 37,688Cap Proj Fund - State Revolving Fund (Auth Bonds) 20,000 20,000 20,000 20,000 20,000 20,000 100,000Capital Projects Fund 16,000 16,000 16,000 16,000 16,000 16,000 80,000Capital Projects Fund - 1996 CWA (Bondable) 70,600 50,000 50,000 50,000 50,000 50,000 250,000Capital Projects Fund - Advances 7,400 7,400 7,400 7,400 7,400 7,400 37,000Capital Projects Fund - EQBA (Bondable) 1,500 1,500 1,500 1,500 1,500 1,500 7,500Capital Projects Fund - EQBA 86 (Bondable) 10,000 10,000 10,000 10,000 10,000 10,000 50,000Capital Projects Fund - PWBA (Bondable) 900 600 600 600 600 600 3,000Environmental Protection Fund 150,000 160,000 170,000 180,000 190,000 200,000 900,000Federal Capital Projects Fund 102,500 102,500 102,500 102,500 102,500 102,500 512,500Financial Security Fund 1,000 200 200 200 200 200 1,000Forest Preserve Expansion Fund 10 10 10 10 10 10 50Hazardous Waste Remedial Fund - Cleanup 105,000 120,000 120,000 120,000 120,000 120,000 600,000Hazardous Waste Remedial Fund - Oversight &
Assessment 15,000 16,100 16,100 16,100 16,100 16,100 80,500Natural Resource Damages Fund 1,000 1,000 1,000 1,000 1,000 1,000 5,000 Total 522,910 539,810 549,810 547,310 554,998 557,310 2,749,238

DETAILED DATA
140
ENVIRONMENTAL FACILITIES CORPORATION SUMMARY OF
PROJECTED APPROPRIATIONS, COMMITMENTS, AND DISBURSEMENTS 2008-2009 THROUGH 2012-2013
(thousands of dollars)
APPROPRIATIONS Reappro- Total
priations 2008-2009 2009-2010 2010-2011 2011-2012 2012-2013 2008-2013Program Summary Clean Water - Clean Air Implementation 686 343 343 343 343 343 1,715Pipeline for Jobs Program 5,000 0 0 0 0 0 0 Total 5,686 343 343 343 343 343 1,715Fund Summary Capital Projects Fund - Authority Bonds 5,000 0 0 0 0 0 0Clean Water Clean Air Implementation Fund 686 343 343 343 343 343 1,715 Total 5,686 343 343 343 343 343 1,715
COMMITMENTS 2008-2009 2009-2010 2010-2011 2011-2012 2012-2013
Program Summary Clean Water - Clean Air Implementation 343 343 343 343 343 Total 343 343 343 343 343Fund Summary Clean Water Clean Air Implementation Fund 343 343 343 343 343 Total 343 343 343 343 343
DISBURSEMENTS
Estimated Total 2007-2008 2008-2009 2009-2010 2010-2011 2011-2012 2012-2013 2008-2013
Program Summary Air Resources 4,400 0 0 0 0 0 0Clean Water - Clean Air Implementation 343 343 343 343 343 343 1,715Pipeline for Jobs Program 5,000 5,055 0 0 0 0 5,055 Total 9,743 5,398 343 343 343 343 6,770Fund Summary Capital Projects Fund 4,400 0 0 0 0 0 0Capital Projects Fund - Authority Bonds 5,000 5,055 0 0 0 0 5,055Clean Water Clean Air Implementation Fund 343 343 343 343 343 343 1,715 Total 9,743 5,398 343 343 343 343 6,770

DETAILED DATA
141
Program Summary
HUDSON RIVER PARK TRUST SUMMARY OF
PROJECTED APPROPRIATIONS, COMMITMENTS, AND DISBURSEMENTS 2008-2009 THROUGH 2012-2013
(thousands of dollars)
APPROPRIATIONS Reappro- priations 2008-2009 2009-2010 2010-2011 2011-2012
32,124 25,000 0 0 0
2012-2013
0
Total2008-2013
25,000Regional Development Total Fund Summary
32,124 25,000 0 0 0 0 25,000
32,124 25,000 0 0
0 0 25,000Capital Projects Fund - Advances Total
Program Summary
32,124 25,000 0 0 0 0 25,000
Estimated 2007-2008
20,000
COMMITMENTS
2008-2009 2009-2010
15,000 10,000
2010-2011
0
2011-2012
0
2012-2013
0
Total2008-2013
45,682
Regional Development Total Fund Summary
15,000 10,000 0 0 0
15,000 10,000 0
0 0Capital Projects Fund - Advances Total
Program Summary
15,000 10,000 0 0 0
DISBURSEMENTS
2008-2009 2009-2010
20,682 15,000
2010-2011
10,000
2011-2012
0
2012-2013
0Regional Development Total Fund Summary
20,000 20,682 15,000 10,000 0 0 45,682
20,000 20,682 15,000 10,000
0 0 45,682Capital Projects Fund - Advances Total
20,000 20,682 15,000 10,000 0 0 45,682

DETAILED DATA
142
PARKS, RECREATION AND HISTORIC PRESERVATION, OFFICE OF SUMMARY OF
PROJECTED APPROPRIATIONS, COMMITMENTS, AND DISBURSEMENTS 2008-2009 THROUGH 2012-2013
(thousands of dollars)
APPROPRIATIONS Reappro- Total
priations 2008-2009 2009-2010 2010-2011 2011-2012 2012-2013 2008-2013Program Summary Federal Capital Projects Fund 14,842 4,000 5,000 5,000 5,000 5,000 24,000Maintenance and Improvement of Existing Facilities 137,286 158,000 37,105 37,105 37,105 36,805 306,120Natural Heritage Trust 300 0 0 0 0 0 0Outdoor Recreation 1,013 0 0 0 0 0 0Parks EQBA 3,737 0 0 0 0 0 0 Total 157,178 162,000 42,105 42,105 42,105 41,805 330,120Fund Summary Capital Projects Fund 347 0 0 0 0 0 0Capital Projects Fund - EQBA 86 (Bondable) 3,737 0 0 0 0 0 0Federal Capital Projects Fund 14,842 4,000 5,000 5,000 5,000 5,000 24,000Fiduciary Funds - Misc. Combined Expendable
Trust Fund 47,917 10,000 5,000 5,000 5,000 5,000 30,000Misc. Capital Projects 9,839 3,800 2,500 2,500 2,500 2,200 13,500Outdoor Recreation Development Bond Fund 230 0 0 0 0 0 0Parks and Recreation Land Acquisition Bond Fund 783 0 0 0 0 0 0State Parks Infrastructure Fund 79,483 144,200 29,605 29,605 29,605 29,605 262,620 Total 157,178 162,000 42,105 42,105 42,105 41,805 330,120
COMMITMENTS 2008-2009 2009-2010 2010-2011 2011-2012 2012-2013
Program Summary Federal Capital Projects Fund 2,500 2,500 2,500 2,500 2,500Maintenance and Improvement of Existing Facilities 122,105 52,105 32,105 32,105 32,105 Total 124,605 54,605 34,605 34,605 34,605Fund Summary Federal Capital Projects Fund 2,500 2,500 2,500 2,500 2,500Fiduciary Funds - Misc. Combined Expendable
Trust Fund 1,000 1,000 1,000 1,000 1,000Misc. Capital Projects 1,500 1,500 1,500 1,500 1,500State Parks Infrastructure Fund 119,605 49,605 29,605 29,605 29,605 Total 124,605 54,605 34,605 34,605 34,605
DISBURSEMENTS
Estimated Total 2007-2008 2008-2009 2009-2010 2010-2011 2011-2012 2012-2013 2008-2013
Program Summary Federal Capital Projects Fund 3,600 3,600 3,600 3,600 3,600 3,600 18,000Maintenance and Improvement of Existing Facilities 33,750 100,250 66,250 31,250 31,250 31,250 260,250 Total 37,350 103,850 69,850 34,850 34,850 34,850 278,250Fund Summary Federal Capital Projects Fund 3,600 3,600 3,600 3,600 3,600 3,600 18,000Fiduciary Funds - Misc. Combined Expendable
Trust Fund 4,000 2,000 2,000 2,000 2,000 2,000 10,000Misc. Capital Projects 1,750 1,750 1,750 1,750 1,750 1,750 8,750State Parks Infrastructure Fund 28,000 96,500 62,500 27,500 27,500 27,500 241,500 Total 37,350 103,850 69,850 34,850 34,850 34,850 278,250

DETAILED DATA
143
AGRICULTURE AND MARKETS, DEPARTMENT OF SUMMARY OF
PROJECTED APPROPRIATIONS, COMMITMENTS, AND DISBURSEMENTS 2008-2009 THROUGH 2012-2013
(thousands of dollars)
APPROPRIATIONS Reappro- Total
priations 2008-2009 2009-2010 2010-2011 2011-2012 2012-2013 2008-2013Program Summary New Facilities 43,664 0 0 0 0 0 0State Fair 1,167 3,750 3,750 3,750 3,750 3,750 18,750 Total 44,831 3,750 3,750 3,750 3,750 3,750 18,750Fund Summary Capital Projects Fund 1,167 1,750 1,750 1,750 1,750 1,750 8,750Capital Projects Fund - Authority Bonds 43,664 0 0 0 0 0 0Misc. Capital Projects 0 2,000 2,000 2,000 2,000 2,000 10,000 Total 44,831 3,750 3,750 3,750 3,750 3,750 18,750
COMMITMENTS 2008-2009 2009-2010 2010-2011 2011-2012 2012-2013
Program Summary New Facilities 36,500 3,996 0 0 0 State Fair 2,750 2,750 2,750 2,750 2,750 Total 39,250 6,746 2,750 2,750 2,750Fund Summary Capital Projects Fund 1,750 1,750 1,750 1,750 1,750 Capital Projects Fund - Authority Bonds 36,500 3,996 0 0 0 Misc. Capital Projects 1,000 1,000 1,000 1,000 1,000 Total 39,250 6,746 2,750 2,750 2,750
DISBURSEMENTS
Estimated Total 2007-2008 2008-2009 2009-2010 2010-2011 2011-2012 2012-2013 2008-2013
Program Summary New Facilities 3,500 36,500 3,000 996 0 0 40,496State Fair 2,250 2,750 2,750 2,750 2,750 2,750 13,750 Total 5,750 39,250 5,750 3,746 2,750 2,750 54,246Fund Summary Capital Projects Fund 1,250 1,750 1,750 1,750 1,750 1,750 8,750Capital Projects Fund - Authority Bonds 3,500 36,500 3,000 996 0 0 40,496Misc. Capital Projects 1,000 1,000 1,000 1,000 1,000 1,000 5,000 Total 5,750 39,250 5,750 3,746 2,750 2,750 54,246

DETAILED DATA
144
EMPIRE STATE DEVELOPMENT CORPORATION SUMMARY OF
PROJECTED APPROPRIATIONS, COMMITMENTS, AND DISBURSEMENTS 2008-2009 THROUGH 2012-2013
(thousands of dollars)
APPROPRIATIONS Reappro- Total
priations 2008-2009 2009-2010 2010-2011 2011-2012 2012-2013 2008-2013Program Summary Economic Development 1,311,240 900,000 0 0 0 0 900,000Regional Development 1,750,543 0 0 0 0 0 0 Total 3,061,783 900,000 0 0 0 0 900,000Fund Summary AMD Direct (Direct Auth Bonds) 650,000 0 0 0 0 0 0Cap Proj Fund - CEFAP (Direct Auth Bonds) 425,000 0 0 0 0 0 0Cap Proj Fund - Downtown Buffalo (Auth Bonds) 41,450 0 0 0 0 0 0Cap Proj Fund - Stadium (Auth Bonds) 119,400 0 0 0 0 0 0Capital Projects Fund - Authority Bonds 1,825,933 900,000 0 0 0 0 900,000 Total 3,061,783 900,000 0 0 0 0 900,000
COMMITMENTS 2008-2009 2009-2010 2010-2011 2011-2012 2012-2013
Program Summary Economic Development 639,235 455,000 242,425 182,970 58,500 Regional Development 159,150 181,900 150,000 150,000 100,000 Total 798,385 636,900 392,425 332,970 158,500Fund Summary AMD Direct (Direct Auth Bonds) 100,000 150,000 150,000 150,000 100,000 Cap Proj Fund - CEFAP (Direct Auth Bonds) 26,935 21,250 21,515 16,770 13,000 Cap Proj Fund - Downtown Buffalo (Auth Bonds) 9,150 0 0 0 0 Cap Proj Fund - Stadium (Auth Bonds) 50,000 31,900 0 0 0 Capital Projects Fund - Authority Bonds 612,300 433,750 220,910 166,200 45,500 Total 798,385 636,900 392,425 332,970 158,500
DISBURSEMENTS
Estimated Total 2007-2008 2008-2009 2009-2010 2010-2011 2011-2012 2012-2013 2008-2013
Program Summary Economic Development 135,315 366,150 476,100 480,000 385,000 90,000 1,797,250Regional Development 269,005 482,235 285,800 62,425 72,970 118,500 1,021,930 Total 404,320 848,385 761,900 542,425 457,970 208,500 2,819,180Fund Summary AMD Direct (Direct Auth Bonds) 0 100,000 150,000 150,000 150,000 100,000 650,000Cap Proj Fund - CEFAP (Direct Auth Bonds) 31,800 26,935 21,250 21,515 16,770 13,000 99,470Cap Proj Fund - Downtown Buffalo (Auth Bonds) 9,700 9,150 0 0 0 0 9,150Cap Proj Fund - Stadium (Auth Bonds) 37,500 50,000 31,900 0 0 0 81,900Capital Projects Fund - Authority Bonds 325,320 662,300 558,750 370,910 291,200 95,500 1,978,660 Total 404,320 848,385 761,900 542,425 457,970 208,500 2,819,180

DETAILED DATA
145
ECONOMIC DEVELOPMENT PROGRAM, NEW YORK STATE SUMMARY OF
PROJECTED APPROPRIATIONS, COMMITMENTS, AND DISBURSEMENTS 2008-2009 THROUGH 2012-2013
(thousands of dollars)
APPROPRIATIONS Reappro- Total
priations 2008-2009 2009-2010 2010-2011 2011-2012 2012-2013 2008-2013Program Summary New York State Economic Development Program 224,325 0 0 0 0 0 0 Total 224,325 0 0 0 0 0 0Fund Summary Capital Projects Fund - Authority Bonds 224,325 0 0 0 0 0 0 Total 224,325 0 0 0 0 0 0
COMMITMENTS 2008-2009 2009-2010 2010-2011 2011-2012 2012-2013
Program Summary New York State Economic Development Program 49,450 40,000 40,000 12,500 11,840 Total 49,450 40,000 40,000 12,500 11,840Fund Summary Capital Projects Fund - Authority Bonds 49,450 40,000 40,000 12,500 11,840 Total 49,450 40,000 40,000 12,500 11,840
DISBURSEMENTS
Estimated Total 2007-2008 2008-2009 2009-2010 2010-2011 2011-2012 2012-2013 2008-2013
Program Summary New York State Economic Development Program 41,300 49,450 40,000 40,000 12,500 11,840 153,790 Total 41,300 49,450 40,000 40,000 12,500 11,840 153,790Fund Summary Capital Projects Fund - Authority Bonds 41,300 49,450 40,000 40,000 12,500 11,840 153,790 Total 41,300 49,450 40,000 40,000 12,500 11,840 153,790

DETAILED DATA
146
STRATEGIC INVESTMENT PROGRAM SUMMARY OF
PROJECTED APPROPRIATIONS, COMMITMENTS, AND DISBURSEMENTS 2008-2009 THROUGH 2012-2013
(thousands of dollars)
APPROPRIATIONS Reappro- Total
priations 2008-2009 2009-2010 2010-2011 2011-2012 2012-2013 2008-2013Program Summary Strategic Investment Program 126,914 0 0 0 0 0 0 Total 126,914 0 0 0 0 0 0Fund Summary Capital Projects Fund - Authority Bonds 126,914 0 0 0 0 0 0 Total 126,914 0 0 0 0 0 0
COMMITMENTS 2008-2009 2009-2010 2010-2011 2011-2012 2012-2013
Program Summary Strategic Investment Program 10,000 14,000 14,000 10,376 5,000 Total 10,000 14,000 14,000 10,376 5,000Fund Summary Capital Projects Fund - Authority Bonds 10,000 14,000 14,000 10,376 5,000 Total 10,000 14,000 14,000 10,376 5,000
DISBURSEMENTS
Estimated Total 2007-2008 2008-2009 2009-2010 2010-2011 2011-2012 2012-2013 2008-2013
Program Summary Strategic Investment Program 28,000 10,000 14,000 14,000 10,376 5,000 53,376 Total 28,000 10,000 14,000 14,000 10,376 5,000 53,376Fund Summary Capital Projects Fund - Authority Bonds 28,000 10,000 14,000 14,000 10,376 5,000 53,376 Total 28,000 10,000 14,000 14,000 10,376 5,000 53,376

DETAILED DATA
147
SCIENCE, TECHNOLOGY AND INNOVATION, NYS FOUNDATION FOR SUMMARY OF
PROJECTED APPROPRIATIONS, COMMITMENTS, AND DISBURSEMENTS 2008-2009 THROUGH 2012-2013
(thousands of dollars)
APPROPRIATIONS Reappro- Total
priations 2008-2009 2009-2010 2010-2011 2011-2012 2012-2013 2008-2013Program Summary Research Facilities 14,641 0 0 0 0 0 0 Total 14,641 0 0 0 0 0 0Fund Summary Capital Projects Fund - Authority Bonds 14,641 0 0 0 0 0 0 Total 14,641 0 0 0 0 0 0
COMMITMENTS 2008-2009 2009-2010 2010-2011 2011-2012 2012-2013
Program Summary Research Facilities 3,976 0 0 0 0 Total 3,976 0 0 0 0Fund Summary Capital Projects Fund - Authority Bonds 3,976 0 0 0 0 Total 3,976 0 0 0 0
DISBURSEMENTS
Estimated Total 2007-2008 2008-2009 2009-2010 2010-2011 2011-2012 2012-2013 2008-2013
Program Summary Research Facilities 8,217 3,976 0 0 0 0 3,976 Total 8,217 3,976 0 0 0 0 3,976Fund Summary Capital Projects Fund - Authority Bonds 8,217 3,976 0 0 0 0 3,976 Total 8,217 3,976 0 0 0 0 3,976

DETAILED DATA
148
ECONOMIC DEVELOPMENT CAPITAL SUMMARY OF
PROJECTED APPROPRIATIONS, COMMITMENTS, AND DISBURSEMENTS 2008-2009 THROUGH 2012-2013
(thousands of dollars)
APPROPRIATIONS Reappro- Total
priations 2008-2009 2009-2010 2010-2011 2011-2012 2012-2013 2008-2013Program Summary Regional Development 1,416,018 0 0 0 0 0 0 Total 1,416,018 0 0 0 0 0 0Fund Summary Cap Proj Fund - Reg Econ Dev (Direct Auth Bonds) 1,200,000 0 0 0 0 0 0Capital Projects Fund - Authority Bonds 216,018 0 0 0 0 0 0 Total 1,416,018 0 0 0 0 0 0
COMMITMENTS 2008-2009 2009-2010 2010-2011 2011-2012 2012-2013
Program Summary Regional Development 106,725 48,500 30,000 27,500 27,500 Total 106,725 48,500 30,000 27,500 27,500Fund Summary Cap Proj Fund - Reg Econ Dev (Direct Auth Bonds) 96,725 33,500 15,377 15,500 15,500 Capital Projects Fund - Authority Bonds 10,000 15,000 14,623 12,000 12,000 Total 106,725 48,500 30,000 27,500 27,500
DISBURSEMENTS
Estimated Total 2007-2008 2008-2009 2009-2010 2010-2011 2011-2012 2012-2013 2008-2013
Program Summary Regional Development 218,200 106,725 48,500 30,000 27,500 27,500 240,225 Total 218,200 106,725 48,500 30,000 27,500 27,500 240,225Fund Summary Cap Proj Fund - Reg Econ Dev (Direct Auth Bonds) 208,200 96,725 33,500 15,377 15,500 15,500 176,602Capital Projects Fund - Authority Bonds 10,000 10,000 15,000 14,623 12,000 12,000 63,623 Total 218,200 106,725 48,500 30,000 27,500 27,500 240,225

DETAILED DATA
149
JACOB JAVITS CONVENTION CENTER SUMMARY OF
PROJECTED APPROPRIATIONS, COMMITMENTS, AND DISBURSEMENTS 2008-2009 THROUGH 2012-2013
(thousands of dollars)
APPROPRIATIONS Reappro- Total
priations 2008-2009 2009-2010 2010-2011 2011-2012 2012-2013 2008-2013Program Summary Jacob Javits Convention Center 350,000 0 0 0 0 0 0 Total 350,000 0 0 0 0 0 0Fund Summary Capital Projects Fund - Authority Bonds 350,000 0 0 0 0 0 0 Total 350,000 0 0 0 0 0 0
COMMITMENTS 2008-2009 2009-2010 2010-2011 2011-2012 2012-2013
Program Summary Jacob Javits Convention Center 0 185,000 140,000 25,000 0 Total 0 185,000 140,000 25,000 0Fund Summary Capital Projects Fund - Authority Bonds 0 185,000 140,000 25,000 0 Total 0 185,000 140,000 25,000 0
DISBURSEMENTS
Estimated Total 2007-2008 2008-2009 2009-2010 2010-2011 2011-2012 2012-2013 2008-2013
Program Summary Jacob Javits Convention Center 0 0 185,000 140,000 25,000 0 350,000 Total 0 0 185,000 140,000 25,000 0 350,000Fund Summary Capital Projects Fund - Authority Bonds 0 0 185,000 140,000 25,000 0 350,000 Total 0 0 185,000 140,000 25,000 0 350,000

DETAILED DATA
150
HIGH TECHNOLOGY AND DEVELOPMENT PROGRAM SUMMARY OF
PROJECTED APPROPRIATIONS, COMMITMENTS, AND DISBURSEMENTS 2008-2009 THROUGH 2012-2013
(thousands of dollars)
APPROPRIATIONS Reappro- Total
priations 2008-2009 2009-2010 2010-2011 2011-2012 2012-2013 2008-2013Program Summary Technology and Development 224,641 0 0 0 0 0 0 Total 224,641 0 0 0 0 0 0Fund Summary Capital Projects Fund - Authority Bonds 224,641 0 0 0 0 0 0 Total 224,641 0 0 0 0 0 0
COMMITMENTS 2008-2009 2009-2010 2010-2011 2011-2012 2012-2013
Program Summary Technology and Development 41,810 33,600 33,050 21,050 20,000 Total 41,810 33,600 33,050 21,050 20,000Fund Summary Capital Projects Fund - Authority Bonds 41,810 33,600 33,050 21,050 20,000 Total 41,810 33,600 33,050 21,050 20,000
DISBURSEMENTS
Estimated Total 2007-2008 2008-2009 2009-2010 2010-2011 2011-2012 2012-2013 2008-2013
Program Summary Technology and Development 52,485 41,810 33,600 33,050 21,050 20,000 149,510 Total 52,485 41,810 33,600 33,050 21,050 20,000 149,510Fund Summary Capital Projects Fund - Authority Bonds 52,485 41,810 33,600 33,050 21,050 20,000 149,510 Total 52,485 41,810 33,600 33,050 21,050 20,000 149,510

DETAILED DATA
151
REGIONAL ECONOMIC DEVELOPMENT PROGRAM SUMMARY OF
PROJECTED APPROPRIATIONS, COMMITMENTS, AND DISBURSEMENTS 2008-2009 THROUGH 2012-2013
(thousands of dollars)
APPROPRIATIONS Reappro- Total
priations 2008-2009 2009-2010 2010-2011 2011-2012 2012-2013 2008-2013Program Summary Regional Economic Development 82,473 0 0 0 0 0 0 Total 82,473 0 0 0 0 0 0Fund Summary Capital Projects Fund - Authority Bonds 82,473 0 0 0 0 0 0 Total 82,473 0 0 0 0 0 0
COMMITMENTS 2008-2009 2009-2010 2010-2011 2011-2012 2012-2013
Program Summary Regional Economic Development 12,145 11,380 11,380 7,527 0 Total 12,145 11,380 11,380 7,527 0Fund Summary Capital Projects Fund - Authority Bonds 12,145 11,380 11,380 7,527 0 Total 12,145 11,380 11,380 7,527 0
DISBURSEMENTS
Estimated Total 2007-2008 2008-2009 2009-2010 2010-2011 2011-2012 2012-2013 2008-2013
Program Summary Regional Economic Development 40,225 12,145 11,380 11,380 7,527 0 42,432 Total 40,225 12,145 11,380 11,380 7,527 0 42,432Fund Summary Capital Projects Fund - Authority Bonds 40,225 12,145 11,380 11,380 7,527 0 42,432 Total 40,225 12,145 11,380 11,380 7,527 0 42,432

DETAILED DATA
152
Program Summary
OLYMPIC REGIONAL DEVELOPMENT AUTHORITY SUMMARY OF
PROJECTED APPROPRIATIONS, COMMITMENTS, AND DISBURSEMENTS 2008-2009 THROUGH 2012-2013
(thousands of dollars)
APPROPRIATIONS Reappro- priations 2008-2009 2009-2010 2010-2011 2011-2012
5,500 0 0 0 0
2012-2013
0
Total2008-2013
0Recreation Total Fund Summary
5,500 0 0 0 0 0 0
5,500 0 0 0
0 0 0Capital Projects Fund Total
Program Summary
5,500 0 0 0 0 0 0
Estimated 2007-2008
5,500
DISBURSEMENTS
2008-2009 2009-2010
0 0
2010-2011
0
2011-2012
0
2012-2013
0
Total2008-2013
0Recreation Total Fund Summary
5,500 0 0 0 0 0 0
5,500 0 0 0
0 0 0Capital Projects Fund Total
5,500 0 0 0 0 0 0

DETAILED DATA
153
ENERGY RESEARCH AND DEVELOPMENT AUTHORITY, NEW YORK STATE SUMMARY OF
PROJECTED APPROPRIATIONS, COMMITMENTS, AND DISBURSEMENTS 2008-2009 THROUGH 2012-2013
(thousands of dollars)
APPROPRIATIONS Reappro- Total
priations 2008-2009 2009-2010 2010-2011 2011-2012 2012-2013 2008-2013Program Summary Western New York Nuclear Service Center
Program 0 13,500 13,500 13,500 13,500 13,500 67,500 Total 0 13,500 13,500 13,500 13,500 13,500 67,500Fund Summary Capital Projects Fund - Authority Bonds 0 13,500 13,500 13,500 13,500 13,500 67,500 Total 0 13,500 13,500 13,500 13,500 13,500 67,500
COMMITMENTS 2008-2009 2009-2010 2010-2011 2011-2012 2012-2013
Program Summary Western New York Nuclear Service Center
Program 13,500 13,500 13,500 13,500 13,500 Total 13,500 13,500 13,500 13,500 13,500Fund Summary Capital Projects Fund - Authority Bonds 13,500 13,500 13,500 13,500 13,500 Total 13,500 13,500 13,500 13,500 13,500
DISBURSEMENTS
Estimated Total 2007-2008 2008-2009 2009-2010 2010-2011 2011-2012 2012-2013 2008-2013
Program Summary Western New York Nuclear Service Center
Program 13,500 13,500 13,500 13,500 13,500 13,500 67,500 Total 13,500 13,500 13,500 13,500 13,500 13,500 67,500Fund Summary Capital Projects Fund - Authority Bonds 13,500 13,500 13,500 13,500 13,500 13,500 67,500 Total 13,500 13,500 13,500 13,500 13,500 13,500 67,500

DETAILED DATA
154
HOUSING AND COMMUNITY RENEWAL, DIVISION OF SUMMARY OF
PROJECTED APPROPRIATIONS, COMMITMENTS, AND DISBURSEMENTS 2008-2009 THROUGH 2012-2013
(thousands of dollars)
APPROPRIATIONS Reappro- Total
priations 2008-2009 2009-2010 2010-2011 2011-2012 2012-2013 2008-2013Program Summary Affordable Housing Corporation 85,513 25,000 25,000 25,000 25,000 25,000 125,000Homes for Working Families Program 25,800 7,000 7,000 7,000 7,000 7,000 35,000Housing Assistance Fund 13,086 0 0 0 0 0 0Housing Opportunity Program For Elderly 0 400 400 400 400 400 2,000Housing Program Capital Improvement 19,720 0 0 0 0 0 0Low Income Housing Trust Fund 125,851 29,000 29,000 29,000 29,000 29,000 145,000Maintenance and Improvements of Existing
Facilities 4,025 0 0 0 0 0 0New Facilities 28,556 0 0 0 0 0 0Public Housing Modernization Program 65,186 12,800 12,800 12,800 12,800 12,800 64,000Rural Revitalization Program 2,750 0 0 0 0 0 0State Housing Bond Fund 7,344 0 0 0 0 0 0Urban Initiatives Program 2,375 0 0 0 0 0 0 Total 380,206 74,200 74,200 74,200 74,200 74,200 371,000Fund Summary Capital Projects Fund 19,842 0 0 0 0 0 0Federal Capital Projects Fund 28,434 0 0 0 0 0 0Housing Assistance Fund 13,086 0 0 0 0 0 0Housing Program Fund 311,500 74,200 74,200 74,200 74,200 74,200 371,000State Housing Bond Fund 7,344 0 0 0 0 0 0 Total 380,206 74,200 74,200 74,200 74,200 74,200 371,000
COMMITMENTS 2008-2009 2009-2010 2010-2011 2011-2012 2012-2013
Program Summary Affordable Housing Corporation 25,000 25,000 25,000 25,000 25,000Homes for Working Families Program 7,000 7,000 7,000 7,000 7,000Housing Opportunity Program For Elderly 400 400 400 400 400Low Income Housing Trust Fund 29,000 29,000 29,000 29,000 29,000Public Housing Modernization Program 12,800 12,800 12,800 12,800 12,800 Total 74,200 74,200 74,200 74,200 74,200Fund Summary Housing Program Fund 74,200 74,200 74,200 74,200 74,200 Total 74,200 74,200 74,200 74,200 74,200
DISBURSEMENTS
Estimated Total 2007-2008 2008-2009 2009-2010 2010-2011 2011-2012 2012-2013 2008-2013
Program Summary Affordable Housing Corporation 41,062 25,000 25,000 25,000 25,000 25,000 125,000Homes for Working Families Program 7,000 7,000 7,000 7,000 7,000 7,000 35,000Housing Assistance Fund 12,086 1,000 0 0 0 0 1,000Housing Opportunity Program For Elderly 400 400 400 400 400 400 2,000Low Income Housing Trust Fund 40,965 39,000 29,000 29,000 29,000 29,000 155,000New Facilities 3,122 3,000 3,000 3,000 3,000 3,000 15,000Public Housing Modernization Program 5,400 12,800 12,800 12,800 12,800 12,800 64,000Rural Revitalization Program 1,000 2,250 0 0 0 0 2,250Urban Initiatives Program 500 2,125 0 0 0 0 2,125 Total 111,535 92,575 77,200 77,200 77,200 77,200 401,375Fund Summary Capital Projects Fund 122 0 0 0 0 0 0Federal Capital Projects Fund 3,000 3,000 3,000 3,000 3,000 3,000 15,000Housing Assistance Fund 12,086 1,000 0 0 0 0 1,000Housing Program Fund 96,327 88,575 74,200 74,200 74,200 74,200 385,375 Total 111,535 92,575 77,200 77,200 77,200 77,200 401,375

DETAILED DATA
155
CHILDREN AND FAMILY SERVICES OFFICE OF SUMMARY OF
PROJECTED APPROPRIATIONS, COMMITMENTS, AND DISBURSEMENTS 2008-2009 THROUGH 2012-2013
(thousands of dollars)
APPROPRIATIONS Reappro- Total
priations 2008-2009 2009-2010 2010-2011 2011-2012 2012-2013 2008-2013Program Summary Design and Construction Supervision 11,693 7,000 7,000 7,000 7,000 7,000 35,000Executive Direction and Administrative Services 2,720 0 0 0 0 0 0Maintenance and Improvement of Facilities 79,125 17,648 17,648 17,648 17,648 17,648 88,240Program Improvement or Program Change 29,674 13,840 13,840 13,840 13,840 13,840 69,200Youth Center 5,338 0 0 0 0 0 0 Total 128,550 38,488 38,488 38,488 38,488 38,488 192,440Fund Summary Capital Projects Fund 12,412 1,825 1,825 1,825 1,825 1,825 9,125Misc. Capital Projects 2,720 0 0 0 0 0 0Youth Facilities Improvement Fund 113,418 36,663 36,663 36,663 36,663 36,663 183,315 Total 128,550 38,488 38,488 38,488 38,488 38,488 192,440
COMMITMENTS 2008-2009 2009-2010 2010-2011 2011-2012 2012-2013
Program Summary Design and Construction Supervision 1,500 1,500 1,500 1,500 1,500Maintenance and Improvement of Facilities 16,000 14,700 15,500 15,500 16,000Program Improvement or Program Change 1,000 1,800 1,000 1,000 1,000 Total 18,500 18,000 18,000 18,000 18,500Fund Summary Capital Projects Fund 2,000 1,500 1,500 1,500 2,000Youth Facilities Improvement Fund 16,500 16,500 16,500 16,500 16,500 Total 18,500 18,000 18,000 18,000 18,500
DISBURSEMENTS
Estimated Total 2007-2008 2008-2009 2009-2010 2010-2011 2011-2012 2012-2013 2008-2013
Program Summary Design and Construction Supervision 2,000 2,500 2,515 4,000 2,813 0 11,828Executive Direction and Administrative Services 660 660 0 0 0 0 660Maintenance and Improvement of Facilities 12,880 16,700 14,650 15,722 16,544 13,000 76,616Program Improvement or Program Change 6,070 1,800 4,835 2,278 1,643 8,000 18,556 Total 21,610 21,660 22,000 22,000 21,000 21,000 107,660Fund Summary Capital Projects Fund 2,000 2,000 2,000 2,000 2,000 2,000 10,000Misc. Capital Projects 660 660 0 0 0 0 660Youth Facilities Improvement Fund 18,950 19,000 20,000 20,000 19,000 19,000 97,000 Total 21,610 21,660 22,000 22,000 21,000 21,000 107,660

DETAILED DATA
156
HEALTH, DEPARTMENT OF SUMMARY OF
PROJECTED APPROPRIATIONS, COMMITMENTS, AND DISBURSEMENTS 2008-2009 THROUGH 2012-2013
(thousands of dollars)
APPROPRIATIONS Reappro- Total
priations 2008-2009 2009-2010 2010-2011 2011-2012 2012-2013 2008-2013rogram Summary P ealth Care Efficiency and Affordability Law for H
New Yorkers 680,227 250,000 0 0 0 0 250,000aboratories and Research L 27,380 10,000 10,000 10,000 10,000 10,000 50,000aintenance and Improvements of Existing M
Institutions 24,934 7,600 7,600 7,600 7,600 7,600 38,000ew Institution ConstructionN 21,000 0 0 0 0 0 0ater Resources W 106,973 9,980 9,980 9,980 9,980 9,980 49,900
Total 860,514 277,580 27,580 27,580 27,580 27,580 387,900und SummaryF ap Proj Fund - DOH (Direct Auth Bonds) C 21,000 0 0 0 0 0 0apital Projects Fund C 380,612 182,600 17,600 17,600 17,600 17,600 253,000apital Projects Fund - Advances C 346,929 85,000 0 0 0 0 85,000apital Projects Fund - Authority Bonds C 5,000 0 0 0 0 0 0ederal Capital Projects Fund F 106,973 9,980 9,980 9,980 9,980 9,980 49,900
Total 860,514 277,580 27,580 27,580 27,580 27,580 387,900
COMMITMENTS 2008-2009 2009-2010 2010-2011 2011-2012 2012-2013
rogram Summary P ealth Care Efficiency and Affordability Law for H
New Yorkers 253,908 208,433 256,933 81,000 0Laboratories and Research 18,300 10,000 10,000 10,000 10,000
aintenance and Improvements of Existing MInstitutions 5,500 5,500 5,500 5,500 5,500
ater Resources W 9,980 9,980 9,980 9,980 9,980 Total 287,688 233,913 282,413 106,480 25,480
und SummaryF apital Projects Fund C 185,208 105,116 108,500 96,500 15,500apital Projects Fund - Advances C 92,500 118,817 163,933 0 0ederal Capital Projects Fund F 9,980 9,980 9,980 9,980 9,980
Total 287,688 233,913 282,413 106,480 25,480
DISBURSEMENTS Estimated Total
2007-2008 2008-2009 2009-2010 2010-2011 2011-2012 2012-2013 2008-2013rogram Summary P ealth Care Efficiency and Affordability Law for H
New Yorkers 174,726 253,908 208,433 256,933 81,000 0 800,274aboratories and Research L 10,000 23,300 10,000 10,000 10,000 10,000 63,300aintenance and Improvements of Existing M
Institutions 8,600 5,500 5,500 5,500 5,500 5,500 27,500ew Institution ConstructionN 8,750 2,100 0 0 0 0 2,100ater Resources W 36,812 9,980 9,980 9,980 9,980 9,980 49,900
Total 238,888 294,788 233,913 282,413 106,480 25,480 943,074und SummaryF ap Proj Fund - DOH (Direct Auth Bonds) C 8,750 2,100 0 0 0 0 2,100apital Projects Fund C 128,576 185,208 105,116 108,500 96,500 15,500 510,824apital Projects Fund - Advances C 64,750 92,500 118,817 163,933 0 0 375,250apital Projects Fund - Authority Bonds C 0 5,000 0 0 0 0 5,000ederal Capital Projects Fund F 36,812 9,980 9,980 9,980 9,980 9,980 49,900
Total 238,888 294,788 233,913 282,413 106,480 25,480 943,074
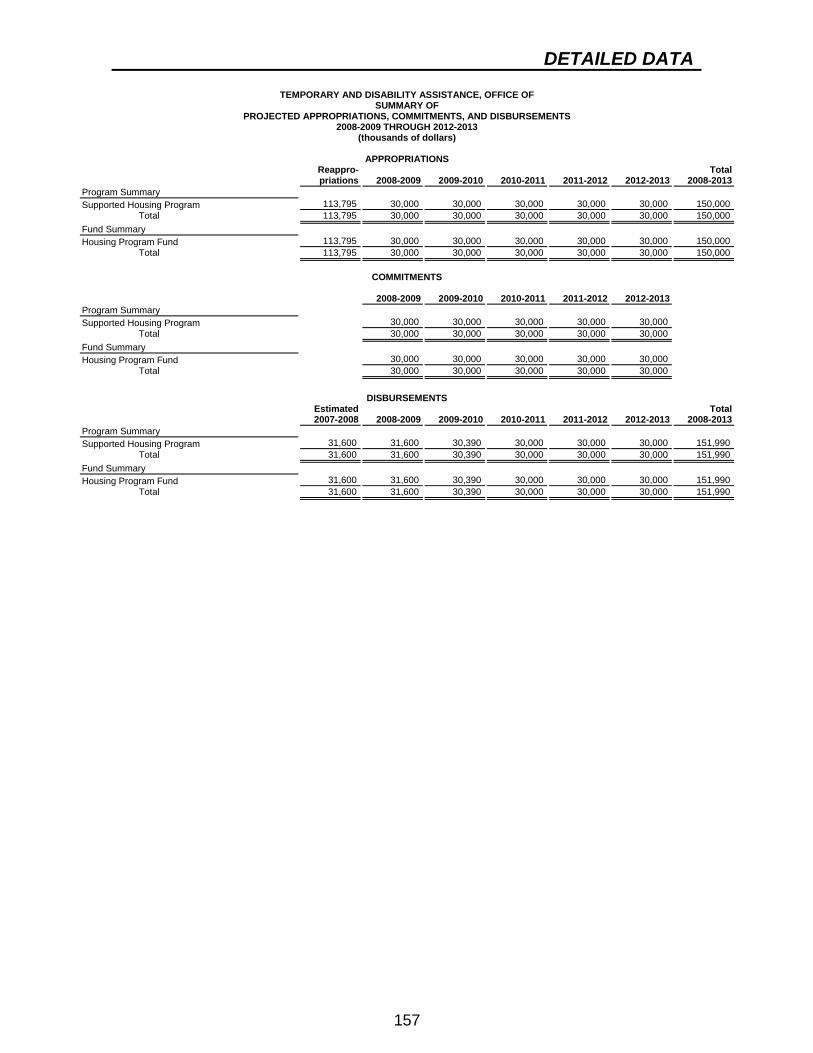
DETAILED DATA
157
Program Summary
TEMPORARY AND DISABILITY ASSISTANCE, OFFICE OF SUMMARY OF
PROJECTED APPROPRIATIONS, COMMITMENTS, AND DISBURSEMENTS 2008-2009 THROUGH 2012-2013
(thousands of dollars)
APPROPRIATIONS Reappro- priations 2008-2009 2009-2010 2010-2011 2011-2012
113,795 30,000 30,000 30,000 30,000
2012-2013
30,000
Total2008-2013
150,000Supported Housing Program Total Fund Summary
113,795 30,000 30,000 30,000 30,000 30,000 150,000
113,795 30,000 30,000 30,000
30,000 30,000 150,000Housing Program Fund Total
Program Summary
113,795 30,000 30,000 30,000 30,000 30,000 150,000
Estimated 2007-2008
31,600
COMMITMENTS
2008-2009 2009-2010
30,000 30,000
2010-2011
30,000
2011-2012
30,000
2012-2013
30,000
Total2008-2013
151,990
Supported Housing Program Total Fund Summary
30,000 30,000 30,000 30,000 30,000
30,000 30,000 30,000
30,000 30,000Housing Program Fund Total
Program Summary
30,000 30,000 30,000 30,000 30,000
DISBURSEMENTS
2008-2009 2009-2010
31,600 30,390
2010-2011
30,000
2011-2012
30,000
2012-2013
30,000Supported Housing Program Total Fund Summary
31,600 31,600 30,390 30,000 30,000 30,000 151,990
31,600 31,600 30,390 30,000
30,000 30,000 151,990Housing Program Fund Total
31,600 31,600 30,390 30,000 30,000 30,000 151,990

DETAILED DATA
158
EDUCATION DEPARTMENT, STATE SUMMARY OF
PROJECTED APPROPRIATIONS, COMMITMENTS, AND DISBURSEMENTS 2008-2009 THROUGH 2012-2013
(thousands of dollars)
APPROPRIATIONS Reappro- Total
priations 2008-2009 2009-2010 2010-2011 2011-2012 2012-2013 2008-2013Program Summary Administration 7,829 1,000 0 0 0 0 1,000Cultural Education Center 6,919 36,660 0 0 0 0 36,660Cultural Education Storage Facility 60,000 0 0 0 0 0 0Education Building 2,166 2,000 0 0 0 0 2,000Library Construction 15,344 14,000 0 0 0 0 14,000Public Broadcasting Facilities 527 0 0 0 0 0 0School for the Blind 1,475 2,330 0 0 0 0 2,330School for the Deaf 8,145 650 0 0 0 0 650Schools For Native American Reservations 942 0 0 0 0 0 0 Total 103,347 56,640 0 0 0 0 56,640Fund Summary Cap Proj Fund - Cultrual Education Storage Facility 60,000 0 0 0 0 0 0Capital Projects Fund 24,866 15,055 0 0 0 0 15,055Capital Projects Fund - Advances 2,610 0 0 0 0 0 0Capital Projects Fund - Authority Bonds 527 27,585 0 0 0 0 27,585Library Aid (Auth Bonds) 15,344 14,000 0 0 0 0 14,000 Total 103,347 56,640 0 0 0 0 56,640
COMMITMENTS 2008-2009 2009-2010 2010-2011 2011-2012 2012-2013
Program Summary Administration 3,147 2,200 1,370 127 534Cultural Education Center 10,583 15,370 14,193 1,980 0Cultural Education Storage Facility 25,000 24,000 10,000 0 0Education Building 550 1,093 1,000 5 970Library Construction 14,000 6,000 1,000 0 0School for the Blind 517 1,630 200 202 0School for the Deaf 700 802 0 0 0Schools For Native American Reservations 500 0 362 16 16Washington Avenue Armory 2,883 0 0 0 0 Total 57,880 51,095 28,125 2,330 1,520Fund Summary Cap Proj Fund - Cultrual Education Storage Facility 25,000 24,000 10,000 0 0Capital Projects Fund 8,380 10,210 7,425 1,830 1,520Capital Projects Fund - Advances 4,000 0 0 0 0Capital Projects Fund - Authority Bonds 6,500 10,885 9,700 500 0Library Aid (Auth Bonds) 14,000 6,000 1,000 0 0 Total 57,880 51,095 28,125 2,330 1,520
DISBURSEMENTS
Estimated Total 2007-2008 2008-2009 2009-2010 2010-2011 2011-2012 2012-2013 2008-2013
Program Summary Administration 1,200 3,147 2,200 1,370 127 534 7,378Cultural Education Center 303 10,583 15,370 14,193 1,980 0 42,126Cultural Education Storage Facility 1,000 25,000 24,000 10,000 0 0 59,000EXCEL Direct Authority Bonds 1,000,000 750,000 554,000 0 0 0 1,304,000Education Building 1,600 550 1,093 1,000 5 970 3,618Library Construction 17,886 14,000 6,000 1,000 0 0 21,000Public Broadcasting Facilities 1,079 0 0 0 0 0 0School for the Blind 1,835 517 1,630 200 202 0 2,549School for the Deaf 4,147 700 802 0 0 0 1,502Schools For Native American Reservations 505 500 0 362 16 16 894Washington Avenue Armory 0 2,883 0 0 0 0 2,883 Total 1,029,555 807,880 605,095 28,125 2,330 1,520 1,444,950Fund Summary Cap Proj Fund – Cultrual Education Storage Facility 1,000 25,000 24,000 10,000 0 0 59,000Capital Projects Fund 8,380 8,380 10,210 7,425 1,830 1,520 29,365Capital EXCEL Direct Authority Bonds 1,000,000 750,000 554,000 0 0 0 1,304,000Capital Projects Fund - Advances 1,210 4,000 0 0 0 0 4,000Capital Projects Fund - Authority Bonds 1,079 6,500 10,885 9,700 500 0 27,585Library Aid (Auth Bonds) 17,886 14,000 6,000 1,000 0 0 21,000 Total 1,029,555 807,880 605,095 28,125 2,330 1,520 1,444,950

DETAILED DATA
159
STATE UNIVERSITY OF NEW YORK SUMMARY OF
PROJECTED APPROPRIATIONS, COMMITMENTS, AND DISBURSEMENTS 2008-2009 THROUGH 2012-2013
(thousands of dollars)
APPROPRIATIONS Reappro- Total
priations 2008-2009 2009-2010 2010-2011 2011-2012 2012-2013 2008-2013Program Summary Maintenance and Improvements 3,395,039 4,285,595 550,000 550,000 550,000 550,000 6,485,595 Total 3,395,039 4,285,595 550,000 550,000 550,000 550,000 6,485,595Fund Summary Cap Proj Fund - SUNY CC (Direct Auth Bonds) 148,500 505,595 0 0 0 0 505,595Capital Projects Fund 47,692 20,000 0 0 0 0 20,000Capital Projects Fund - Advances 2,852,936 2,687,000 550,000 550,000 550,000 550,000 4,887,000State University Capital Projects Fund 168,949 500,000 0 0 0 0 500,000State University Residence Hall Rehabilitation Fund 19,017 123,000 0 0 0 0 123,000SUNY Dorms (Direct Auth Bonds) 157,945 450,000 0 0 0 0 450,000 Total 3,395,039 4,285,595 550,000 550,000 550,000 550,000 6,485,595
COMMITMENTS 2008-2009 2009-2010 2010-2011 2011-2012 2012-2013
Program Summary Maintenance and Improvements 969,000 1,157,000 1,227,000 1,154,000 1,196,000 Total 969,000 1,157,000 1,227,000 1,154,000 1,196,000Fund Summary Cap Proj Fund - SUNY CC (Direct Auth Bonds) 35,000 50,000 50,000 40,000 30,000Capital Projects Fund 10,000 10,000 8,000 7,000 5,000Capital Projects Fund - Advances 759,000 937,000 1,019,000 962,000 1,036,000State University Capital Projects Fund 15,000 15,000 15,000 15,000 15,000State University Residence Hall Rehabilitation Fund 40,000 40,000 35,000 35,000 30,000SUNY Dorms (Direct Auth Bonds) 110,000 105,000 100,000 95,000 80,000 Total 969,000 1,157,000 1,227,000 1,154,000 1,196,000
DISBURSEMENTS
Estimated Total 2007-2008 2008-2009 2009-2010 2010-2011 2011-2012 2012-2013 2008-2013
Program Summary Maintenance and Improvements 700,000 799,000 882,000 952,000 940,200 951,000 4,524,200 Total 700,000 799,000 882,000 952,000 940,200 951,000 4,524,200Fund Summary Cap Proj Fund - SUNY CC (Direct Auth Bonds) 35,000 24,000 28,000 38,000 38,000 35,000 163,000Capital Projects Fund 8,000 8,000 8,000 8,000 5,200 5,000 34,200Capital Projects Fund - Advances 510,000 606,000 705,000 793,000 772,000 800,000 3,676,000State University Capital Projects Fund 12,000 12,000 12,000 12,000 12,000 12,000 60,000State University Residence Hall Rehabilitation Fund 35,000 32,000 31,000 25,000 30,000 24,000 142,000SUNY Dorms (Direct Auth Bonds) 100,000 117,000 98,000 76,000 83,000 75,000 449,000 Total 700,000 799,000 882,000 952,000 940,200 951,000 4,524,200

DETAILED DATA
160
CITY UNIVERSITY OF NEW YORK SUMMARY OF
PROJECTED APPROPRIATIONS, COMMITMENTS, AND DISBURSEMENTS 2008-2009 THROUGH 2012-2013
(thousands of dollars)
APPROPRIATIONS Reappro- Total
priations 2008-2009 2009-2010 2010-2011 2011-2012 2012-2013 2008-2013Program Summary Maintenance and Improvements 2,267,733 1,699,602 284,220 284,220 284,220 284,220 2,836,482New Facilities 352,300 0 0 0 0 0 0Program Changes and Expansion 1,584 0 0 0 0 0 0 Total 2,621,617 1,699,602 284,220 284,220 284,220 284,220 2,836,482Fund Summary Cap Proj Fund - CUNY (Direct Auth Bonds) 2,568,772 1,673,620 284,220 284,220 284,220 284,220 2,810,500Capital Projects Fund 52,845 25,982 0 0 0 0 25,982 Total 2,621,617 1,699,602 284,220 284,220 284,220 284,220 2,836,482
COMMITMENTS 2008-2009 2009-2010 2010-2011 2011-2012 2012-2013
Program Summary Maintenance and Improvements 410,967 394,851 526,489 626,424 739,463 Total 410,967 394,851 526,489 626,424 739,463Fund Summary Cap Proj Fund - CUNY (Direct Auth Bonds) 401,573 383,414 513,666 612,043 725,427 Capital Projects Fund 9,394 11,437 12,823 14,381 14,036 Total 410,967 394,851 526,489 626,424 739,463
DISBURSEMENTS
Estimated Total 2007-2008 2008-2009 2009-2010 2010-2011 2011-2012 2012-2013 2008-2013
Program Summary Maintenance and Improvements 289,836 432,855 395,918 416,361 529,692 679,384 2,454,210New Facilities 30,576 15,711 0 0 0 2,000 17,711Program Changes and Expansion 88 0 1,199 368 0 1 1,568 Total 320,500 448,566 397,117 416,729 529,692 681,385 2,473,489Fund Summary Cap Proj Fund - CUNY (Direct Auth Bonds) 311,400 439,294 387,008 404,877 515,987 666,241 2,413,407Capital Projects Fund 9,100 9,272 10,109 11,852 13,705 15,144 60,082 Total 320,500 448,566 397,117 416,729 529,692 681,385 2,473,489

DETAILED DATA
161
HIGHER EDUCATION FACILITIES CAPITAL MATCHING GRANTS PROGRAM SUMMARY OF
PROJECTED APPROPRIATIONS, COMMITMENTS, AND DISBURSEMENTS 2008-2009 THROUGH 2012-2013
(thousands of dollars)
APPROPRIATIONS Reappro- Total
priations 2008-2009 2009-2010 2010-2011 2011-2012 2012-2013 2008-2013Program Summary Higher Education Capital Matching Grants 150,000 0 0 0 0 0 0 Total 150,000 0 0 0 0 0 0Fund Summary Capital Projects Fund - Authority Bonds 150,000 0 0 0 0 0 0 Total 150,000 0 0 0 0 0 0
COMMITMENTS 2008-2009 2009-2010 2010-2011 2011-2012 2012-2013
Program Summary Higher Education Capital Matching Grants 50,000 30,000 30,000 30,000 0 Total 50,000 30,000 30,000 30,000 0Fund Summary Capital Projects Fund - Authority Bonds 50,000 30,000 30,000 30,000 0 Total 50,000 30,000 30,000 30,000 0
DISBURSEMENTS
Estimated Total 2007-2008 2008-2009 2009-2010 2010-2011 2011-2012 2012-2013 2008-2013
Program Summary Higher Education Capital Matching Grants 10,000 50,000 30,000 30,000 30,000 0 140,000 Total 10,000 50,000 30,000 30,000 30,000 0 140,000Fund Summary Capital Projects Fund - Authority Bonds 10,000 50,000 30,000 30,000 30,000 0 140,000 Total 10,000 50,000 30,000 30,000 30,000 0 140,000

DETAILED DATA
162
CORRECTIONAL SERVICES, DEPARTMENT OF SUMMARY OF
PROJECTED APPROPRIATIONS, COMMITMENTS, AND DISBURSEMENTS 2008-2009 THROUGH 2012-2013
(thousands of dollars)
APPROPRIATIONS Reappro- Total
priations 2008-2009 2009-2010 2010-2011 2011-2012 2012-2013 2008-2013Program Summary Maintenance and Improvement of Existing Facilities 525,276 320,000 310,000 330,000 350,000 350,000 1,660,000Medical Facilities 1,619 0 0 0 0 0 0 Total 526,895 320,000 310,000 330,000 350,000 350,000 1,660,000Fund Summary Correctional Facilities Capital Improvement Fund 523,895 320,000 310,000 330,000 350,000 350,000 1,660,000Special Conservation Activities Account 3,000 0 0 0 0 0 0 Total 526,895 320,000 310,000 330,000 350,000 350,000 1,660,000
COMMITMENTS 2008-2009 2009-2010 2010-2011 2011-2012 2012-2013
Program Summary Maintenance and Improvement of Existing Facilities 290,000 310,000 330,000 350,000 350,000 Total 290,000 310,000 330,000 350,000 350,000Fund Summary Correctional Facilities Capital Improvement Fund 290,000 310,000 330,000 350,000 350,000 Total 290,000 310,000 330,000 350,000 350,000
DISBURSEMENTS
Estimated Total 2007-2008 2008-2009 2009-2010 2010-2011 2011-2012 2012-2013 2008-2013
Program Summary Maintenance and Improvement of Existing Facilities 245,560 289,394 315,500 323,000 330,000 330,000 1,587,894Medical Facilities 440 1,606 0 0 0 0 1,606 Total 246,000 291,000 315,500 323,000 330,000 330,000 1,589,500Fund Summary Correctional Facilities Capital Improvement Fund 245,000 290,000 314,500 323,000 330,000 330,000 1,587,500Special Conservation Activities Account 1,000 1,000 1,000 0 0 0 2,000 Total 246,000 291,000 315,500 323,000 330,000 330,000 1,589,500

DETAILED DATA
STATE POLICE, DIVISION OF SUMMARY OF
PROJECTED APPROPRIATIONS, COMMITMENTS, AND DISBURSEMENTS 2008-2009 THROUGH 2012-2013
(thousands of dollars)
APPROPRIATIONS Reappro- Total
priations 2008-2009 2009-2010 2010-2011 2011-2012 2012-2013 2008-2013Program Summary Maintenance and Improvement of Existing Facilities 13,414 11,500 9,500 8,000 10,500 11,500 51,000New Facilities 73,415 0 6,000 6,000 4,000 4,000 20,000 Total 86,829 11,500 15,500 14,000 14,500 15,500 71,000Fund Summary Capital Projects Fund 13,414 5,500 5,500 8,000 10,500 11,500 41,000Capital Projects Fund - Authority Bonds 73,415 6,000 10,000 6,000 4,000 4,000 30,000 Total 86,829 11,500 15,500 14,000 14,500 15,500 71,000
COMMITMENTS 2008-2009 2009-2010 2010-2011 2011-2012 2012-2013
Program Summary Maintenance and Improvement of Existing Facilities 5,800 3,900 4,800 5,700 5,700 New Facilities 5,000 8,800 5,000 3,000 3,000 Total 10,800 12,700 9,800 8,700 8,700Fund Summary Capital Projects Fund 5,800 3,900 4,800 5,700 5,700 Capital Projects Fund - Authority Bonds 5,000 8,800 5,000 3,000 3,000 Total 10,800 12,700 9,800 8,700 8,700
DISBURSEMENTS
Estimated Total 2007-2008 2008-2009 2009-2010 2010-2011 2011-2012 2012-2013 2008-2013
Program Summary Maintenance and Improvement of Existing Facilities 3,771 7,398 10,200 10,680 6,800 6,800 41,878New Facilities 1,310 24,807 23,280 17,000 11,000 11,000 87,087 Total 5,081 32,205 33,480 27,680 17,800 17,800 128,965Fund Summary Capital Projects Fund 3,771 5,398 6,200 6,680 6,800 6,800 31,878Capital Projects Fund - Authority Bonds 1,310 26,807 27,280 21,000 11,000 11,000 97,087 Total 5,081 32,205 33,480 27,680 17,800 17,800 128,965
163

DETAILED DATA
164
Program Summary
MILITARY AND NAVAL AFFAIRS, DIVISION OF SUMMARY OF
PROJECTED APPROPRIATIONS, COMMITMENTS, AND DISBURSEMENTS 2008-2009 THROUGH 2012-2013
(thousands of dollars)
APPROPRIATIONS Reappro- priations 2008-2009 2009-2010 2010-2011 2011-2012
21,596 8,100 18,000 10,500 26,000 89,762 22,600 24,000 32,000 35,000
2012-2013
25,00033,000
Total2008-2013
87,600146,600
Design and Construction Supervision Maintenance and Improvements Total Fund Summary
111,358 30,700 42,000 42,500 61,000 58,000 234,200
32,31579,043
13,100 23,00017,600 19,000
13,00029,500
13,000 48,000
5,00053,000
67,100167,100
Capital Projects Fund Federal Capital Projects Fund Total
Program Summary
111,358 30,700 42,000 42,500 61,000 58,000 234,200
Estimated 2007-2008
9,13639,864
COMMITMENTS
2008-2009 2009-2010
11,000 15,00051,500 27,000
2010-2011
10,00025,000
2011-2012
16,000 20,000
2012-2013
16,00020,000
Total2008-2013
80,868178,922
Design and Construction Supervision Maintenance and Improvements Total Fund Summary
62,500 42,000 35,000 36,000 36,000
15,000 12,00047,500 30,000
10,00025,000
9,000
27,000 9,000
27,000Capital Projects Fund Federal Capital Projects Fund Total
Program Summary
62,500 42,000 35,000 36,000 36,000
DISBURSEMENTS
2008-2009 2009-2010
14,197 9,74052,093 26,160
2010-2011
15,53140,069
2011-2012
22,100 28,900
2012-2013
19,30031,700
Design and Construction Supervision Maintenance and Improvements Total Fund Summary
49,000 66,290 35,900 55,600 51,000 51,000 259,790
9,00040,000
18,73047,560
13,90022,000
10,60045,000
10,000 41,000
10,00041,000
63,230196,560
Capital Projects Fund Federal Capital Projects Fund Total
49,000 66,290 35,900 55,600 51,000 51,000 259,790

DETAILED DATA
165
Program Summary
HOMELAND SECURITY - MISCELLANEOUS SUMMARY OF
PROJECTED APPROPRIATIONS, COMMITMENTS, AND DISBURSEMENTS 2008-2009 THROUGH 2012-2013
(thousands of dollars)
APPROPRIATIONS Reappro- priations 2008-2009 2009-2010 2010-2011 2011-2012
19,672 0 0 0 0
2012-2013
0
Total2008-2013
0Homeland Security Total Fund Summary
19,672 0 0 0 0 0 0
9,15810,514
0 00 0
00
0 0
00
00
Capital Projects Fund Federal Capital Projects Fund Total
Program Summary
19,672 0 0 0 0 0 0
Estimated 2007-2008
14,203
DISBURSEMENTS
2008-2009 2009-2010
6,973 125
2010-2011
0
2011-2012
0
2012-2013
0
Total2008-2013
7,098Homeland Security Total Fund Summary
14,203 6,973 125 0 0 0 7,098
3,50010,703
5,0751,898
1250
00
0 0
00
5,2001,898
Capital Projects Fund Federal Capital Projects Fund Total
14,203 6,973 125 0 0 0 7,098

DETAILED DATA
166
MENTAL HEALTH, OFFICE OF SUMMARY OF
PROJECTED APPROPRIATIONS, COMMITMENTS, AND DISBURSEMENTS 2008-2009 THROUGH 2012-2013
(thousands of dollars)
APPROPRIATIONS Reappro- Total
priations 2008-2009 2009-2010 2010-2011 2011-2012 2012-2013 2008-2013Program Summary Administration 8,589 3,717 3,717 3,717 3,717 3,717 18,585Design and Construction Supervision 21,052 14,000 14,000 14,000 14,000 14,000 70,000Maintenance and Improvements of State Facilities 601,560 248,550 217,510 217,510 217,510 217,510 1,118,590Non-Bondable Projects 8,000 1,000 1,000 1,000 1,000 1,000 5,000Voluntary Facilities 710,407 179,555 11,555 11,555 11,555 11,555 225,775 Total 1,349,608 446,822 247,782 247,782 247,782 247,782 1,437,950Fund Summary Capital Projects Fund 98,018 43,010 43,010 43,010 43,010 43,010 215,050MH Capital Improvements - Authority Bonds 1,251,590 403,812 204,772 204,772 204,772 204,772 1,222,900 Total 1,349,608 446,822 247,782 247,782 247,782 247,782 1,437,950
COMMITMENTS 2008-2009 2009-2010 2010-2011 2011-2012 2012-2013
Program Summary Administration 3,717 3,717 3,717 3,717 3,717 Design and Construction Supervision 14,000 14,000 14,000 14,000 14,000 Maintenance and Improvements of State Facilities 217,010 217,010 217,010 217,010 217,000 Non-Bondable Projects 1,000 1,000 1,000 1,000 1,000 Voluntary Facilities 55,000 85,000 124,000 45,555 39,555 Total 290,727 320,727 359,727 281,282 275,272Fund Summary Capital Projects Fund 42,010 42,010 42,010 42,010 42,010 MH Capital Improvements - Authority Bonds 248,717 278,717 317,717 239,272 233,262 Total 290,727 320,727 359,727 281,282 275,272
DISBURSEMENTS
Estimated Total 2007-2008 2008-2009 2009-2010 2010-2011 2011-2012 2012-2013 2008-2013
Program Summary Administration 4,145 3,717 3,717 3,717 3,717 3,717 18,585Design and Construction Supervision 3,200 9,200 14,000 14,000 14,000 14,000 65,200Maintenance and Improvements of State Facilities 164,347 254,956 306,409 220,201 217,510 217,510 1,216,586Non-Bondable Projects 1,000 1,000 1,000 1,000 1,000 1,000 5,000Voluntary Facilities 69,255 98,136 114,630 110,436 128,436 128,436 580,074 Total 241,947 367,009 439,756 349,354 364,663 364,663 1,885,445Fund Summary Capital Projects Fund 41,305 38,007 44,987 44,283 42,010 42,010 211,297Capital OMH – Direct Auth Bonds 85,759 185,866 235,139 149,635 149,217 149,217 869,074MH Capital Improvements - Authority Bonds 114,883 143,136 159,630 155,436 173,436 173,436 805,074
367,009 439,756 349,354 364,663 364,663 1,885,445 241,947

DETAILED DATA
167
MENTAL RETARDATION AND DEVELOPMENTAL DISABILITIES, OFFICE OF SUMMARY OF
PROJECTED APPROPRIATIONS, COMMITMENTS, AND DISBURSEMENTS 2008-2009 THROUGH 2012-2013
(thousands of dollars)
APPROPRIATIONS Reappro- Total
priations 2008-2009 2009-2010 2010-2011 2011-2012 2012-2013 2008-2013Program Summary Community Services Program 62,030 48,560 39,320 46,580 30,435 31,455 196,350Design and Construction Supervision 1,000 14,460 9,000 9,000 9,000 9,000 50,460Institutional Services Program 203,325 98,600 89,170 51,800 54,390 56,565 350,525Non-Bondable Projects 0 1,000 1,000 1,000 1,000 1,000 5,000Voluntary Facilities 29,890 29,800 30,490 31,710 33,000 34,320 159,320 Total 296,245 192,420 168,980 140,090 127,825 132,340 761,655Fund Summary Capital Projects Fund 75,215 69,965 69,705 71,955 74,970 77,730 364,325MH Capital Improvements - Authority Bonds 221,030 122,455 99,275 68,135 52,855 54,610 397,330 Total 296,245 192,420 168,980 140,090 127,825 132,340 761,655
COMMITMENTS 2008-2009 2009-2010 2010-2011 2011-2012 2012-2013
Program Summary Community Services Program 16,995 17,100 17,438 17,783 18,135Design and Construction Supervision 12,460 7,000 7,000 7,000 7,000Institutional Services Program 47,003 47,400 49,330 51,339 53,430
Voluntary Facilities 18,866 19,000 19,600 20,219 20,858 Total 95,324 90,500 93,368 96,341 99,423Fund Summary Capital Projects Fund 35,544 33,700 35,668 36,541 37,710 MH Capital Improvements - Authority Bonds 59,780 56,800 57,700 59,800 61,713 Total 95,324 90,500 93,368 96,341 99,423
DISBURSEMENTS
Estimated Total 2007-2008 2008-2009 2009-2010 2010-2011 2011-2012 2012-2013 2008-2013
Program Summary Community Services Program 26,825 30,800 29,405 31,875 29,300 23,750 145,130Design and Construction Supervision 7,000 11,735 7,725 7,000 7,000 7,000 40,460Institutional Services Program 61,744 69,490 82,920 52,100 32,200 32,750 269,460Voluntary Facilities 18,850 21,310 19,650 20,200 21,000 21,500 103,660 Total 114,419 133,335 139,700 111,175 89,500 85,000 558,710Fund Summary Capital Projects Fund 46,625 54,805 49,600 50,850 51,100 52,400 258,755Capital OMRDD – Direct Authority Bonds 49,584 57,100 69,300 38,500 19,700 19,800 204,400MH Capital Improvements - Authority Bonds 18,210 21,430 20,800 21,825 18,700 12,800 95,555 Total 114,419 133,335 139,700 111,175 89,500 85,000 558,710

DETAILED DATA
168
ALCOHOLISM AND SUBSTANCE ABUSE SERVICES, OFFICE OF SUMMARY OF
PROJECTED APPROPRIATIONS, COMMITMENTS, AND DISBURSEMENTS 2008-2009 THROUGH 2012-2013
(thousands of dollars)
APPROPRIATIONS Reappro- Total
priations 2008-2009 2009-2010 2010-2011 2011-2012 2012-2013 2008-2013Program Summary Administration 840 1,230 1,277 1,328 1,394 1,464 6,693Community Alcoholism and Substance Abuse
Facilities 242,644 113,356 89,356 89,356 89,356 89,356 470,780Design and Construction Supervision 4,903 2,500 3,500 3,500 3,500 3,500 16,500Institutional Services Program 20,822 3,500 4,000 4,000 4,000 4,000 19,500Non-Bondable Projects 750 750 750 750 750 750 3,750 Total 269,959 121,336 98,883 98,934 99,000 99,070 517,223Fund Summary Capital Projects Fund 31,191 9,290 10,837 10,888 10,954 11,024 52,993MH Capital Improvements - Authority Bonds 238,768 112,046 88,046 88,046 88,046 88,046 464,230 Total 269,959 121,336 98,883 98,934 99,000 99,070 517,223
COMMITMENTS 2008-2009 2009-2010 2010-2011 2011-2012 2012-2013
Program Summary Administration 1,230 1,277 1,328 1,394 1,464 Community Alcoholism and Substance Abuse
Facilities 99,829 105,530 115,298 120,999 123,433 Design and Construction Supervision 7,403 3,500 3,500 3,500 3,500Institutional Services Program 7,827 7,548 7,116 6,837 7,163 Non-Bondable Projects 750 750 750 750 750 Total 117,039 118,605 127,992 133,480 136,310Fund Summary Capital Projects Fund 17,742 14,304 14,235 14,220 14,648 MH Capital Improvements - Authority Bonds 99,297 104,301 113,757 119,260 121,662 Total 117,039 118,605 127,992 133,480 136,310
DISBURSEMENTS
Estimated Total 2007-2008 2008-2009 2009-2010 2010-2011 2011-2012 2012-2013 2008-2013
Program Summary Administration 1,200 1,230 1,277 1,328 1,394 1,464 6,693Community Alcoholism and Substance Abuse
Facilities 41,770 90,678 142,782 115,177 137,940 124,020 610,597Design and Construction Supervision 3,415 1,539 3,106 5,750 3,500 3,675 17,570Institutional Services Program 4,215 9,186 9,494 6,896 4,000 3,000 32,576Non-Bondable Projects 354 0 750 750 750 750 3,000 Total 50,954 102,633 157,409 129,901 147,584 132,909 670,436Fund Summary Capital Projects Fund 8,891 13,318 13,451 13,637 14,891 15,391 70,688Capital – OASAS Direct Authority Bonds 2,879 7,548 8,339 5,896 3,000 3,000 27,783MH Capital Improvements - Authority Bonds 39,184 81,767 135,619 110,368 129,693 114,518 571,965 Total 50,954 102,633 157,409 129,901 147,584 132,909 670,436

DETAILED DATA
169
GENERAL SERVICES, OFFICE OF SUMMARY OF
PROJECTED APPROPRIATIONS, COMMITMENTS, AND DISBURSEMENTS 2008-2009 THROUGH 2012-2013
(thousands of dollars)
APPROPRIATIONS Reappro- Total
priations 2008-2009 2009-2010 2010-2011 2011-2012 2012-2013 2008-2013Program Summary Design and Construction Supervision 17,640 12,600 12,600 12,600 12,600 12,600 63,000Maintenance and Improvement of Real Property
Facilities 233,674 67,400 67,400 67,400 67,400 67,400 337,000 Total 251,314 80,000 80,000 80,000 80,000 80,000 400,000Fund Summary Capital Projects Fund 215,237 70,000 70,000 70,000 70,000 70,000 350,000Capital Projects Fund - Advances 5,409 0 0 0 0 0 0Capital Projects Fund - Authority Bonds 30,668 10,000 10,000 10,000 10,000 10,000 50,000 Total 251,314 80,000 80,000 80,000 80,000 80,000 400,000
COMMITMENTS 2008-2009 2009-2010 2010-2011 2011-2012 2012-2013
Program Summary Design and Construction Supervision 11,000 11,000 11,000 7,905 7,905Maintenance and Improvement of Real Property
Facilities 57,850 55,500 63,500 62,345 60,595 Total 68,850 66,500 74,500 70,250 68,500Fund Summary Capital Projects Fund 56,500 56,500 64,500 60,250 58,500 Capital Projects Fund - Advances 2,350 0 0 0 0 Capital Projects Fund - Authority Bonds 10,000 10,000 10,000 10,000 10,000 Total 68,850 66,500 74,500 70,250 68,500
DISBURSEMENTS
Estimated Total 2007-2008 2008-2009 2009-2010 2010-2011 2011-2012 2012-2013 2008-2013
Program Summary Design and Construction Supervision 10,700 9,928 11,000 11,000 11,000 11,000 53,928Maintenance and Improvement of Real Property
Facilities 60,245 70,922 57,500 65,500 61,250 61,250 316,422 Total 70,945 80,850 68,500 76,500 72,250 72,250 370,350Fund Summary Capital Projects Fund 56,995 58,500 58,500 66,500 62,250 62,250 308,000Capital Projects Fund - Advances 2,650 2,350 0 0 0 0 2,350Capital Projects Fund - Authority Bonds 11,300 20,000 10,000 10,000 10,000 10,000 60,000 Total 70,945 80,850 68,500 76,500 72,250 72,250 370,350

DETAILED DATA
170
STATE, DEPARTMENT OF SUMMARY OF
PROJECTED APPROPRIATIONS, COMMITMENTS, AND DISBURSEMENTS 2008-2009 THROUGH 2012-2013
(thousands of dollars)
APPROPRIATIONS Reappro- Total
priations 2008-2009 2009-2010 2010-2011 2011-2012 2012-2013 2008-2013Program Summary Local Government and Community Services 38,177 0 0 0 0 0 0Office of Fire Prevention 1,127 0 0 0 0 0 0 Total 39,304 0 0 0 0 0 0Fund Summary Capital Projects Fund 1,127 0 0 0 0 0 0Capital Projects Fund - Authority Bonds 38,177 0 0 0 0 0 0 Total 39,304 0 0 0 0 0 0
DISBURSEMENTS
Estimated Total 2007-2008 2008-2009 2009-2010 2010-2011 2011-2012 2012-2013 2008-2013
Program Summary Local Government and Community Services 49,000 3,156 0 0 0 0 3,156Office of Fire Prevention 1,864 492 0 0 0 0 492 Total 50,864 3,648 0 0 0 0 3,648Fund Summary Capital Projects Fund 1,864 492 0 0 0 0 492Capital Projects Fund - Authority Bonds 49,000 3,156 0 0 0 0 3,156 Total 50,864 3,648 0 0 0 0 3,648

DETAILED DATA
171
TECHNOLOGY, OFFICE FOR SUMMARY OF
PROJECTED APPROPRIATIONS, COMMITMENTS, AND DISBURSEMENTS 2008-2009 THROUGH 2012-2013
(thousands of dollars)
APPROPRIATIONS Reappro- Total
priations 2008-2009 2009-2010 2010-2011 2011-2012 2012-2013 2008-2013Program Summary Economic Development 0 10,000 0 0 0 0 10,000Maintenance and Improvement of Facilities 0 51,000 80,000 155,000 125,000 122,000 533,000New Facilities 99,100 0 0 0 0 0 0 Total 99,100 61,000 80,000 155,000 125,000 122,000 543,000Fund Summary Capital Projects Fund 0 40,000 80,000 155,000 125,000 122,000 522,000Capital Projects Fund - Authority Bonds 99,100 21,000 0 0 0 0 21,000 Total 99,100 61,000 80,000 155,000 125,000 122,000 543,000
COMMITMENTS 2008-2009 2009-2010 2010-2011 2011-2012 2012-2013
Program Summary Economic Development 10,000 0 0 0 0 Maintenance and Improvement of Facilities 51,000 80,000 155,000 125,000 122,000 New Facilities 11,600 30,000 55,500 0 0 Total 72,600 110,000 210,500 125,000 122,000Fund Summary Capital Projects Fund 40,000 80,000 155,000 125,000 122,000 Capital Projects Fund - Authority Bonds 32,600 30,000 55,500 0 0 Total 72,600 110,000 210,500 125,000 122,000
DISBURSEMENTS
Estimated Total 2007-2008 2008-2009 2009-2010 2010-2011 2011-2012 2012-2013 2008-2013
Program Summary Economic Development 0 10,000 0 0 0 0 10,000Maintenance and Improvement of Facilities 0 42,444 83,393 152,163 123,130 121,251 522,381New Facilities 2,050 11,600 30,000 55,500 0 0 97,100 Total 2,050 64,044 113,393 207,663 123,130 121,251 629,481Fund Summary Capital Projects Fund 0 38,444 76,393 152,163 123,130 121,251 511,381Capital Projects Fund - Authority Bonds 2,050 25,600 37,000 55,500 0 0 118,100 Total 2,050 64,044 113,393 207,663 123,130 121,251 629,481

DETAILED DATA
172
JUDICIARY SUMMARY OF
PROJECTED APPROPRIATIONS, COMMITMENTS, AND DISBURSEMENTS 2008-2009 THROUGH 2012-2013
(thousands of dollars)
APPROPRIATIONS Reappro- Total
priations 2008-2009 2009-2010 2010-2011 2011-2012 2012-2013 2008-2013Program Summary Courthouse Improvements 80,865 0 0 0 0 0 0 Total 80,865 0 0 0 0 0 0Fund Summary Capital Projects Fund 2,965 0 0 0 0 0 0Capital Projects Fund - Authority Bonds 77,900 0 0 0 0 0 0 Total 80,865 0 0 0 0 0 0
COMMITMENTS 2008-2009 2009-2010 2010-2011 2011-2012 2012-2013
Program Summary Courthouse Improvements 20,000 40,000 15,000 0 0 Total 20,000 40,000 15,000 0 0Fund Summary Capital Projects Fund - Authority Bonds 20,000 40,000 15,000 0 0 Total 20,000 40,000 15,000 0 0
DISBURSEMENTS
Estimated Total 2007-2008 2008-2009 2009-2010 2010-2011 2011-2012 2012-2013 2008-2013
Program Summary Courthouse Improvements 1,000 15,000 29,050 29,050 5,582 0 78,682 Total 1,000 15,000 29,050 29,050 5,582 0 78,682Fund Summary Capital Projects Fund 1,000 1,782 0 0 0 0 1,782Capital Projects Fund - Authority Bonds 0 13,218 29,050 29,050 5,582 0 76,900 Total 1,000 15,000 29,050 29,050 5,582 0 78,682

DETAILED DATA
173
Program Summary
WORLD TRADE CENTER SUMMARY OF
PROJECTED APPROPRIATIONS, COMMITMENTS, AND DISBURSEMENTS 2008-2009 THROUGH 2012-2013
(thousands of dollars)
APPROPRIATIONS Reappro- priations 2008-2009 2009-2010 2010-2011 2011-2012
448,091 0 0 0 0
2012-2013
0
Total2008-2013
0World Trade Center Total Fund Summary
448,091 0 0 0 0 0 0
448,091 0 0 0
0 0 0Federal Capital Projects Fund Total
Program Summary
448,091 0 0 0 0 0 0
Estimated 2007-2008
50,000
DISBURSEMENTS
2008-2009 2009-2010
70,000 70,000
2010-2011
35,000
2011-2012
32,500
2012-2013
20,000
Total2008-2013
227,500World Trade Center Total Fund Summary
50,000 70,000 70,000 35,000 32,500 20,000 227,500
50,000 70,000 70,000 35,000
32,500 20,000 227,500Federal Capital Projects Fund Total
50,000 70,000 70,000 35,000 32,500 20,000 227,500

DETAILED DATA
174
STATE EQUIPMENT FINANCE PROGRAM SUMMARY OF
PROJECTED APPROPRIATIONS, COMMITMENTS, AND DISBURSEMENTS 2008-2009 THROUGH 2012-2013
(thousands of dollars)
APPROPRIATIONS Reappro- Total
priations 2008-2009 2009-2010 2010-2011 2011-2012 2012-2013 2008-2013Program Summary Program Changes and Expansion 111,398 111,000 164,000 150,000 120,000 110,000 655,000 Total 111,398 111,000 164,000 150,000 120,000 110,000 655,000Fund Summary Capital Projects Fund 0 0 104,000 90,000 60,000 50,000 304,000Capital Projects Fund - Authority Bonds 111,398 111,000 60,000 60,000 60,000 60,000 351,000 Total 111,398 111,000 164,000 150,000 120,000 110,000 655,000
COMMITMENTS 2008-2009 2009-2010 2010-2011 2011-2012 2012-2013
Program Summary Program Changes and Expansion 111,000 164,000 150,000 120,000 110,000 Total 111,000 164,000 150,000 120,000 110,000Fund Summary Capital Projects Fund 0 104,000 90,000 60,000 50,000 Capital Projects Fund - Authority Bonds 111,000 60,000 60,000 60,000 60,000 Total 111,000 164,000 150,000 120,000 110,000
DISBURSEMENTS
Estimated Total 2007-2008 2008-2009 2009-2010 2010-2011 2011-2012 2012-2013 2008-2013
Program Summary Program Changes and Expansion 50,000 111,000 163,900 141,100 116,500 100,000 632,500 Total 50,000 111,000 163,900 141,100 116,500 100,000 632,500Fund Summary Capital Projects Fund 0 0 103,900 81,100 56,500 40,000 281,500Capital Projects Fund - Authority Bonds 50,000 111,000 60,000 60,000 60,000 60,000 351,000 Total 50,000 111,000 163,900 141,100 116,500 100,000 632,500

DETAILED DATA
175
SUMMARY OF PROJECTED APPROPRIATIONS, ALL FUNDS, ALL PROGRAMS
BY FUND TYPE, AND MAJOR FUND, 2008-2009 THROUGH 2012-2013 (thousands of dollars)
APPROPRIATIONS
Reappro-priations 2008-2009 2009-2010 2010-2011
Capital Projects Funds Type
2011-2012
2012-2013
Total2008-2013
Capital Projects Fund 1,146,119 529,961 459,227 515,028 460,609 442,114 2,406,939 Capital Projects Fund - Advances 3,364,129 2,807,000 551,000 551,000 551,000 551,000 5,011,000 Capital Projects Fund - A.C.T.I. Fund (Bondable) 34,233 0 0 0 0 0 0 Capital Projects Fund - EQBA (Bondable) 28,211 327 0 0 0 0 327 Capital Projects Fund - PWBA (Bondable) 13,664 14,468 0 0 0 0 14,468 Capital Projects Fund - Infrast Renewal (Bondable) 28,261 0 0 0 0 0 0 Capital Projects Fund - Aviation (Bondable) 2,900 0 0 0 0 0 0 Capital Projects Fund - Energy Conserv (Bondable) 247 0 0 0 0 0 0 Capital Projects Fund - EQBA 86 (Bondable) 98,148 0 0 0 0 0 0 Capital Projects Fund - 1996 CWA (Bondable) 432,215 0 0 0 0 0 0 Capital Projects Fund - Reb/Renew NY (Bondable) 1,639,071 824,000 314,000 0 0 0 1,138,000 Capital Projects Fund - Authority Bonds 3,721,794 1,089,085 93,500 89,500 87,500 87,500 1,447,085 Cap Proj Fund - State Revolving Fund (Auth Bonds) 76,143 29,600 30,000 30,000 30,000 30,000 149,600 Cap Proj Fund - Onondaga Lake (Auth Bonds) 31,917 10,000 10,000 5,000 0 0 25,000 Cap Proj Fund - DEC Regular (Auth Bonds) 88,356 12,000 12,000 12,000 12,000 12,000 60,000 Cap Proj Fund - Stadium (Auth Bonds) 119,400 0 0 0 0 0 0 Cap Proj Fund - Downtown Buffalo (Auth Bonds) 41,450 0 0 0 0 0 0 Cap Proj Fund - Library Aid (Auth Bonds) 15,344 14,000 0 0 0 0 14,000 Cap Proj Fund - Cultrual Education Storage Facility 60,000 0 0 0 0 0 0 Cap Proj Fund - DOH (Direct Auth Bonds) 21,000 0 0 0 0 0 0 Cap Proj Fund - CEFAP (Direct Auth Bonds) 425,000 0 0 0 0 0 0 Cap Proj Fund - SUNY CC (Direct Auth Bonds) 148,500 505,595 0 0 0 0 505,595 Cap Proj Fund - CUNY (Direct Auth Bonds) 2,568,772 1,673,620 284,220 284,220 284,220 284,220 2,810,500 Cap Proj Fund - Reg Econ Dev (Direct Auth Bonds) 1,200,000 0 0 0 0 0 0 AMD Direct (Direct Auth Bonds) 650,000 0 0 0 0 0 0 Dedicated Highway and Bridge Trust Fund 3,497,520 2,306,8499 2,582,705 2,784,246 2,818,364 2,849,515 13,341,679 State University Residence Hall Rehabilitation Fund 19,017 123,000 0 0 0 0 123,000 SUNY Dorms (Direct Auth Bonds) 157,945 450,000 0 0 0 0 450,000 State Parks Infrastructure Fund 79,483 144,200 29,605 29,605 29,605 29,605 262,620 Environmental Protection Fund 725,843 250,000 300,000 300,000 300,000 300,000 1,450,000 Energy Conserv Improved Transp Bond Fund 262 0 0 0 0 0 0 Pure Waters Bond Fund 28,727 0 0 0 0 0 0 Transportation Capital Facilities Bond Fund 3,394 0 0 0 0 0 0 Environmental Quality Protection Bond Fund 33,794 0 0 0 0 0 0 State Housing Bond Fund 7,344 0 0 0 0 0 0 Rebuild/Renew NY Trans Bonds 2005 Bond Fund 2,806,523 0 0 0 0 0 0 Transportation Infrastructure Renewal Bond Fund 28,976 0 0 0 0 0 0 Environmental Quality Bond Act Fund - 1986 104,178 0 0 0 0 0 0 Accelerated Cap Transp Improvements Bond Fund 34,510 0 0 0 0 0 0 Clean Water - Clean Air Bond Fund 454,744 0 0 0 0 0 0 Federal Capital Projects Fund 8,001,354 2,256,580 2,340,283 2,325,480 2,343,980 2,223,980 11,490,303 Haz Waste Remed Fund - Oversight & Assessment 88,287 25,275 15,000 15,000 15,000 15,000 85,275 Hazardous Waste Remedial Fund - Cleanup 449,980 120,000 120,000 120,000 120,000 120,000 600,000 Youth Facilities Improvement Fund 113,418 36,663 36,663 36,663 36,663 36,663 183,315 Housing Program Fund 425,295 104,200 104,200 104,200 104,200 104,200 521,000 Engineering Services Fund 156,828 0 0 0 0 0 0 MH Capital Improvements - Authority Bonds 1,711,388 638,313 392,093 360,953 345,673 347,428 2,084,460 Correctional Facilities Capital Improvement Fund 523,895 320,000 310,000 330,000 350,000 350,000 1,660,000 Other Funds 255,389 513,193 6,843 8,843 6,843 6,543 542,265 Eliminations* 0 0 0 0 Type Subtotal 35,662,968 14,797,929 8,000,339 7,910,738
0 0 0 7,904,657 7,789,768 46,376,431
Fiduciary Fund Type 266,910 50,000 50,000 50,000 50,000 50,000 250,000 Special Revenue Fund Type 297,126 100,166 96,739 98,329 98,937 99,563 493,734 Eliminations* 0 0 0 0 Total (All Fund Types) 36,227,004 14,948,095 8,147,078 8,059,067
0 0 0 8,053,594 7,939,331 47,120,165
* Reflects eliminations for ‘netting out’ of transfers between funds which are not capital program disbursements.

DETAILED DATA
176
SUMMARY OF PROJECTED APPROPRIATIONS, ALL FUNDS, ALL PROGRAMS
BY FUND TYPE, AND MAJOR FUND, 2008-2009 THROUGH 2012-2013 (thousands of dollars)
DISBURSEMENTS
Estimated Total 2007-2008 2008-2009 2009-2010 2010-2011 2011-2012 2012-2013 2008-2013
Capital Projects Funds Type Capital Projects Fund 359,279 465,161 520,241 581,340 503,666 407,016 2,477,424 Capital Projects Fund - Advances 606,210 733,132 846,417 974,533 779,600 807,600 4,141,282 Capital Projects Fund - A.C.T.I. Fund (Bondable) 2,000 2,000 2,000 2,000 2,000 2,000 10,000 Capital Projects Fund - EQBA (Bondable) 1,500 1,500 1,500 1,500 1,500 1,500 7,500 Capital Projects Fund - PWBA (Bondable) 900 600 600 600 600 600 3,000 Capital Projects Fund - Infrast Renewal (Bondable) 4,000 4,000 4,000 4,000 4,000 4,000 20,000 Capital Projects Fund - Aviation (Bondable) 300 300 300 300 300 300 1,500 Capital Projects Fund - Energy Conserv (Bondable) 100 75 50 25 0 0 150 Capital Projects Fund - EQBA 86 (Bondable) 10,000 10,000 10,000 10,000 10,000 10,000 50,000 Capital Projects Fund - 1996 CWA (Bondable) 70,600 50,000 50,000 50,000 50,000 50,000 250,000 Capital Projects Fund - Rebuild/Ren NY (Bondable) 173,835 298,388 476,144 549,527 422,118 354,566 2,100,743 Capital Projects Fund - Authority Bonds 662,286 1,118,017 1,078,445 853,709 510,235 238,840 3,799,246 Cap Proj Fund - State Revolving Fund (Auth Bonds) 20,000 20,000 20,000 20,000 20,000 20,000 100,000 Cap Proj Fund - Onondaga Lake (Auth Bonds) 10,000 10,000 10,000 10,000 7,688 0 37,688 Cap Proj Fund - DEC Regular (Auth Bonds) 12,000 24,500 24,500 12,000 12,000 12,000 85,000 Cap Proj Fund - Stadium (Auth Bonds) 37,500 50,000 31,900 0 0 0 81,900 Cap Proj Fund - Downtown Buffalo (Auth Bonds) 9,700 9,150 0 0 0 0 9,150 Cap Proj Fund - Library Aid (Auth Bonds) 17,886 14,000 6,000 1,000 0 0 21,000 Cap Proj Fund - Cultrual Education Storage Facility 1,000 25,000 24,000 10,000 0 0 59,000 Cap Proj Fund - DOH (Direct Auth Bonds) 8,750 2,100 0 0 0 0 2,100 Cap Proj Fund - CEFAP (Direct Auth Bonds) 31,800 26,935 21,250 21,515 16,770 13,000 99,470 Cap Proj Fund - SUNY CC (Direct Auth Bonds) 35,000 24,000 28,000 38,000 38,000 35,000 163,000 Cap Proj Fund - CUNY (Direct Auth Bonds) 311,400 439,294 387,008 404,877 515,987 666,241 2,413,407 Cap Proj Fund - Reg Econ Dev (Direct Auth Bonds) 208,200 96,725 33,500 15,377 15,500 15,500 176,602 AMD Direct (Direct Auth Bonds) 0 100,000 150,000 150,000 150,000 100,000 650,000 Dedicated Highway and Bridge Trust Fund 2,126,846 2,275,323 2,439,123 2,635,057 2,783,889 2,880,073 13,013,465 CHIPS (Direct Auth Bonds) 347,250 350,000 350,000 350,000 350,000 350,000 1,750,000 EXCEL (Direct Auth Bonds) 1,000,000 750,000 554,000 0 0 0 1,304,000 State University Residence Hall Rehabilitation Fund 35,000 32,000 31,000 25,000 30,000 24,000 142,000 SUNY Dorms (Direct Auth Bonds) 100,000 117,000 98,000 76,000 83,000 75,000 449,000 State Parks Infrastructure Fund 28,000 96,500 62,500 27,500 27,500 27,500 241,500 Environmental Protection Fund 150,000 160,000 170,000 180,000 190,000 200,000 900,000 Energy Conserv Improved Transp Bond Fund 0 0 0 0 0 0 0 Pure Waters Bond Fund 0 0 0 0 0 0 0 Transportation Capital Facilities Bond Fund 0 0 0 0 0 0 0 Environmental Quality Protection Bond Fund 0 0 0 0 0 0 0 State Housing Bond Fund 0 0 0 0 0 0 0 Rebuild/Renew NY Trans Bonds 2005 Bond Fund 0 0 0 0 0 0 0 Transportation Infrastructure Renewal Bond Fund 0 0 0 0 0 0 0 Environmental Quality Bond Act Fund - 1986 0 0 0 0 0 0 0 Accelerated Cap Transp Improvements Bond Fund 0 0 0 0 0 0 0 Clean Water - Clean Air Bond Fund 0 0 0 0 0 0 0 Federal Capital Projects Fund 1,589,697 1,701,204 1,732,648 1,621,549 1,580,272 1,583,769 8,219,442 Haz Waste Remed Fund - Oversight & Assessment 15,000 16,100 16,100 16,100 16,100 16,100 80,500 Hazardous Waste Remedial Fund - Cleanup 105,000 120,000 120,000 120,000 120,000 120,000 600,000 Youth Facilities Improvement Fund 18,950 19,000 20,000 20,000 19,000 19,000 97,000 Housing Program Fund 127,927 120,175 104,590 104,200 104,200 104,200 537,365 Engineering Services Fund 9,539 7,460 4,656 2,833 963 0 15,912 MH Capital Improvements - Authority Bonds 310,499 496,847 628,827 481,660 493,746 472,771 2,573,851 Correctional Facilities Capital Improvement Fund 245,000 290,000 314,500 323,000 330,000 330,000 1,587,500 Other Funds 33,583 21,397 19,507 19,279 19,054 19,132 98,369 Eliminations* 0 0 0 0 0 0 0 Type Subtotal 8,836,287 10,097,883 10,391,306 9,712,481 9,207,688 8,959,708 48,369,066 Fiduciary Fund Type 0 0 0 0 0 0 0 Special Revenue Fund Type 82,350 87,341 93,471 93,619 87,227 90,844 452,502 Eliminations* 0 0 0 0 Total (All Fund Types) 8,918,887 10,185,174 10,484,777 9,806,100
0 0 0 9,294,915 9,050,552 48,821,568
* Reflects eliminations for ‘netting out’ of transfers between funds which are not capital program disbursements.

DETAILED DATA
177
DETAILED AGENCY TABLES
The following tables provide detailed projected disbursements for each agency on a comprehensive construction program basis. The projected disbursements on these tables reflect recommended spending from reappropriations and new appropriations which would be effective for State fiscal year 2008-09, and appropriations anticipated to be recommended in future State fiscal years from 2009-10 through 2012-13. All amounts are in thousands of dollars.
The program totals for these comprehensive construction programs will match these
same totals on the agency summary tables which were provided previously in the Capital Program Plan. For example, the program sub-total of $92,798 for the DOT’s Aviation program on the recommended reappropriations table for fiscal year 2008-09 in this section provides the components that are included in the summary of the recommended 2008-09 appropriations listed for the Aviation program appropriations on the summary table for DOT in the Detailed Date Section. Similarly, the program sub-total of $17,050 for DOT’s Aviation program on the recommended disbursements table for fiscal year 2008-09 in this section provides the components that are included in the summary of the disbursements that are listed for the Aviation program appropriations on the summary table for DOT in the Detailed Data Section.
The recommended reappropriations and appropriations represent the estimated costs for
the various agencies and the respective comprehensive construction programs. Each of the recommended reappropriations, new appropriations, and future appropriations are identified by a reference number, as required by section 22-c of the State Finance Law. These individual eight-character reference numbers are included at the end of the text for each enacted appropriation, and the fifth and sixth characters identify the State fiscal year in which it was originally enacted. Reference numbers for recommended new appropriations for State fiscal year 2008-09 will display the 08 as the fifth and sixth characters. As a further example, an appropriation enacted in State fiscal year 2001-02 would display those characters as 01.
The estimates displayed below reflect various methodologies that are employed to
develop accurate bottom-line disbursement projections. For large capital programs with numerous projects (such as DOT and DEC), the highest level of accuracy is obtained by conducting analysis at the fund and program level rather than by individual appropriation. This allows analysts to integrate statistical trends and categorical spending patterns across numerous appropriations, to account for situational project aberrations and to gain overall accuracy. Therefore, for these large programs, the line-by-line appropriation estimates should be viewed as a means to populate reliable bottom-line fund/program totals, rather than as individually focused estimates.

DETAILED DATA
Transportation, Department of PROJECTED APPROPRIATIONS AND DISBURSEMENTS BY PROGRAM
2008-2009 THROUGH 2012-2013 (thousands of dollars)
APPROPRIATIONS Reappro-
priations 2008-2009 2009-2010 2010-2011 2011-2012 Aviation
2012-2013Total
2008-2013
02412614 Acq + Develop Republic Airport 900 0 0 0 0 0 003025510 Aviation Cap Proj Bond Expend 3,394 0 0 0 0 0 017158514 State Share Federal Aviation Improv 726 0 0 0 0 0 017168714 State Share Fed.Aviation Improvemen 191 0 0 0 0 0 017178414 State Share Federal Aviation Improv 313 0 0 0 0 0 017229314 Aviation 2,902 0 0 0 0 0 017230014 Statewide Aviation 836 0 0 0 0 0 017230114 Statewide Aviation 301 0 0 0 0 0 017230214 Statewide Aviaiton 952 0 0 0 0 0 017230314 Statewide Aviation 1,455 0 0 0 0 0 017230414 Statewide Aviation 8,000 0 0 0 0 0 017230514 Statewide Aviation 8,000 0 0 0 0 0 017230614 Statewide Aviation 8,000 0 0 0 0 0 017230714 Statewide Aviation 8,000 0 0 0 0 0 017230814 Statewide Aviation 0 8,000 0 0 0 0 8,00017230914 Statewide Aviation 0 0 8,000 0 0 0 8,00017231014 Statewide Aviation 0 0 0 8,000 0 0 8,00017231114 Statewide Aviation 0 0 0 0 8,000 0 8,00017231214 Statewide Aviation 0 0 0 0 0 8,000 8,00017238614 State Share Fed.Aviation Improvemen 110 0 0 0 0 0 017238814 State Share Fed.Aviation Improvemen 197 0 0 0 0 0 017238914 State Share Fed.Aviation Improvemen 35 0 0 0 0 0 017239014 Aviation Improvements 21 0 0 0 0 0 017239214 Statewide Aviation Development 477 0 0 0 0 0 017239314 State Share Aviation Improvements 132 0 0 0 0 0 017239514 Statewide Aviation D 398 0 0 0 0 0 017239814 Statewide Aviation 874 0 0 0 0 0 017239914 Statewide Aviation 629 0 0 0 0 0 017249714 Aviation State Match 520 0 0 0 0 0 017439114 Const Reconst & Imp Of Airports 827 0 0 0 0 0 017520014 Federal Airport Or Aviation 1,180 0 0 0 0 0 017520414 Republic Airport 6,000 0 0 0 0 0 017520514 Republic Airport 6,000 0 0 0 0 0 017520614 Republic Airport 6,000 0 0 0 0 0 017520714 Republic Airport 6,000 0 0 0 0 0 017520814 Republic Airport 0 6,000 0 0 0 0 6,00017520914 Republic Airport 0 0 6,000 0 0 0 6,00017521014 Republic Airport 0 0 0 6,000 0 0 6,00017521114 Republic Airport 0 0 0 0 6,000 0 6,00017521214 Republic Airport 0 0 0 0 0 6,000 6,00017529114 Federal Airport Or Aviation 7,449 0 0 0 0 0 017A18614 State Share Fed.Aviation Imps 134 0 0 0 0 0 017RA0614 Stewart Airport 4,730 0 0 0 0 0 017RA0814 Stewart Airport 0 4,000 0 0 0 0 4,00017RA9914 Reg Aviation Fund - Stewart 3,188 0 0 0 0 0 017RB9914 Reg Aviation Fund - Republic 2,339 0 0 0 0 0 017RD9914 Reg Aviation Fund - Mou 1,500 0 0 0 0 0 017RE9914 Reg Aviation Fund - Airp 88 0 0 0 0 Subtotal 92,798 18,000 14,000 14,000 14,000 Highway Facilities 03334811 Hwy-Rr Grade Cross Eliminations 3,615 0 0 0 0
0 014,000 74,000
0 0170102SN Snow & Ice Control 321 0 0 0 0 0 0170103PT Bus Inspection 451 0 0 0 0 0 0170103SN Snow & Ice Control 4,820 0 0 0 0 0 0170104SN Snow & Ice Control 617 0 0 0 0 0 0170105PT Bus Inspection 74 0 0 0 0 0 0170106PT Bus Inspection 1,284 0 0 0 0 0 0170107PT Bus Inspection 4,821 0 0 0 0 0 0170108BI Bridge Initiative 0 139,820 0 0 0 0 139,820170108PT Bus Inspection 0 7,741 0 0 0 0 7,741170109BI Bridge Initiative 0 0 147,070 0 0 0 147,070170109PT Bus Inspection 0 0 8,012 0 0 0 8,012170110BI Bridge Initiative 0 0 0 152,990 0 0 152,990170110PT Bus Inspection 0 0 0 8,292 0 0 8,292170111BI Bridge Initiative 0 0 0 0 157,860 0 157,860170111PT Bus Inspection 0 0 0 0 8,603 0 8,603170112BI Bridge Initiative 0 0 0 0 0 164,170 164,170170112PT Bus Inspection 0 0 0 0 0 8,926 8,926170194TA Other Highway Aid 0 0 0 0 0 0 017020022 Nfa Hwy, Eng, Row 10,801 0 0 0 0 0 017020122 Nfa Hwy, Eng, Row 19,967 0 0 0 0 0 017020222 Nfa Hwy, Eng, Row 41,681 0 0 0 0 0 017020322 NFA Highway, ROW 49,157 0 0 0 0 0 017020422 NFA Highway, ROW 81,751 0 0 0 0 0 017020522 NFA Highway, ROW 115,547 0 0 0 0 0 017020622 NFA Highway, ROW 294,083 0 0 0 0 0 0
178

DETAILED DATA
Transportation, Department of PROJECTED APPROPRIATIONS AND DISBURSEMENTS BY PROGRAM
2008-2009 THROUGH 2012-2013 (thousands of dollars)
APPROPRIATIONS Reappro-
priations 2008-2009 2009-2010 2010-2011 2011-2012 17020722 NFA Highway, ROW 479,271 0 0 0 0
2012-2013Total
2008-20130 0
17020822 NFA Highway, ROW 0 539,352 0 0 0 0 539,35217020922 NFA Highway, ROW 0 0 787,693 0 0 0 787,69317021022 NFA Highway, ROW 0 0 0 943,264 0 0 943,26417021122 NFA Highway, ROW 0 0 0 0 943,264 0 943,26417021222 NFA Highway, ROW 0 0 0 0 0 943,264 943,26417028420 Infrastructure Renewal Bond 1,970 0 0 0 0 0 017028520 Infrastructure Renewal Bond 1,210 0 0 0 0 0 017028720 Infrastructure Renewal Bond 1,136 0 0 0 0 0 017028820 Infrastructure Renewal Bond 2,768 0 0 0 0 0 017029222 Non-Federal Aided Highway 42,206 0 0 0 0 0 017029322 Non Federally Aided Highways 5,144 0 0 0 0 0 017029422 Non Federally Aided Highways 189,783 0 0 0 0 0 0170294TA Other Highway Aid 0 0 0 0 0 0 017029522 Non Federally Aided Highway 22,685 0 0 0 0 0 017029622 Dedicated Fund 4,539 0 0 0 0 0 017029722 Dedicated Fund 8,852 0 0 0 0 0 017029822 Dedicated Fund 16,522 0 0 0 0 0 017029922 Nfa Hwy, Eng, Row 10,744 0 0 0 0 0 017030020 Transportation Aid 350,206 0 0 0 0 0 017030120 Transportation Aid 304,502 0 0 0 0 0 017030220 Transportation Aid 227,383 0 0 0 0 0 017030320 Transportation Aid 286,188 0 0 0 0 0 017030420 Transportation Aid 332,862 0 0 0 0 0 017030520 Transportation Aid 581,845 0 0 0 0 0 017030620 Transportation Aid 1,051,656 0 0 0 0 0 017030720 Transportation Aid 1,943,983 0 0 0 0 0 017030820 Transportation Aid 0 2,015,000 0 0 0 0 2,015,00017030920 Transportation Aid 0 0 2,100,303 0 0 0 2,100,30317031020 Federal Aid Highways 0 0 0 2,125,000 0 0 2,125,00017031120 Federal Aid Highways 0 0 0 0 2,125,000 0 2,125,00017031220 Federal Aid Highways 0 0 0 0 0 2,000,000 2,000,00017038679 Industrial Access 0 0 0 0 0 0 017039120 Fed Share Of Highway Projects 173,101 0 0 0 0 0 017039220 Fed Share Of Highway Projects 115,596 0 0 0 0 0 017039320 Transportation Aid 259,663 0 0 0 0 0 017039420 Transportation Aid 378,036 0 0 0 0 0 017039520 Transportation Aid 259,600 0 0 0 0 0 017039620 Transportation Aid 124,509 0 0 0 0 0 017039720 Trnsportation Aid 156,912 0 0 0 0 0 017039820 Transportation Aid 89,597 0 0 0 0 0 017039920 Transportation Aid 142,542 0 0 0 0 0 017039922 Nfa Hwy, Eng, Row 1 0 0 0 0 0 017040022 Preventive Maintenance 1,466 0 0 0 0 0 017040122 Preventive Maintenance 37,054 0 0 0 0 0 017040222 Preventive Maintenance 27,162 0 0 0 0 0 017040322 Preventive Maintenance 4,736 0 0 0 0 0 017040422 Preventive Maintenance 14,757 0 0 0 0 0 0170405HM Preventive Maintenance 8,801 0 0 0 0 0 0170406HM Preventive Maintenance 27,188 0 0 0 0 0 0170407HM Preventive Maintenance 427,961 0 0 0 0 0 0170408HM Preventive Maintenance 0 579,791 0 0 0 0 579,791170409HM Preventive Maintenance 0 0 597,291 0 0 0 597,291170410HM Preventive Maintenance 0 0 0 612,079 0 0 612,079170411HM Preventive Maintenance 0 0 0 0 621,788 0 621,788170412HM Preventive Maintenance 0 0 0 0 0 632,529 632,529170493PM Preventive Maintenance 213 0 0 0 0 0 017049522 Preventive Maintenance 154 0 0 0 0 0 017049622 Preventive Maintenance 877 0 0 0 0 0 017049722 Preventive Maintenance 2,400 0 0 0 0 0 017049822 Preventive Maintenance 3,234 0 0 0 0 0 017049922 Preventive Maintenance 884 0 0 0 0 0 017058523 Rebuild New York 346 0 0 0 0 0 017058779 Industrial Access/Stewart Air Settl 0 0 0 0 0 0 017059379 Industrial Access 0 0 0 0 0 0 0170594PM Preventive Maintenance 8,688 0 0 0 0 0 017059822 Multi-Modal 6,380 0 0 0 0 0 017060079 Industrial Access 477 0 0 0 0 0 017060279 Industrial Access 1,280 0 0 0 0 0 017060379 Industrial Access 5,189 0 0 0 0 0 017060479 Industrial Access 8,266 0 0 0 0 0 017060579 Industrial Access 9,000 0 0 0 0 0 017060679 Industrial Access 9,000 0 0 0 0 0 017068623 Rebuild New York 429 0 0 0 0 0 017068711 Other Highway Systems 9,489 0 0 0 0 0 017068823 Rebuild New York 1,305 0 0 0 0 0 017069479 Industrial Access 227 0 0 0 0 0 0
179

DETAILED DATA
Transportation, Department of PROJECTED APPROPRIATIONS AND DISBURSEMENTS BY PROGRAM
2008-2009 THROUGH 2012-2013 (thousands of dollars)
APPROPRIATIONS Reappro-
priations 2008-2009 2009-2010 2010-2011 2011-2012 17069579 Industrial Access 0 0 0 0 0
2012-2013Total
2008-20130 0
17069679 Industrial Access 7 0 0 0 0 0 017069779 Industrial Access 0 0 0 0 0 0 017069879 Industrial Access 245 0 0 0 0 0 017069979 Industrial Access 1,935 0 0 0 0 0 017070079 Industrial Access 10,000 0 0 0 0 0 017070279 Industrial Access 6,000 0 0 0 0 0 017078723 Rebuild New York 429 0 0 0 0 0 017079979 Industrial Access - Mou 1,663 0 0 0 0 0 0170807HM Diesel Retrofit 3,000 0 0 0 0 0 017088723 Grade Crossing Eliminations 1,119 0 0 0 0 0 0171594TA Other Highway Aid 0 0 0 0 0 0 0171694TA Other Highway Aid 0 0 0 0 0 0 017249279 Industrial Access 23 0 0 0 0 0 017278423 Rebuild New York 315 0 0 0 0 0 017288424 State & Local Construction 8,830 0 0 0 0 0 017309322 Bonding Guarantee 3,500 0 0 0 0 0 0173293MT Bonding Guarantee 3,500 0 0 0 0 0 0173393MT Working Capital Loans 1,500 0 0 0 0 0 017348590 Southern Tier Expressway 2,860 0 0 0 0 0 017369321 I95 Sound Barriers 1,150 0 0 0 0 0 017428620 Infrastructure Renewal Bond 391 0 0 0 0 0 017428823 Grade Crossing Eliminations 3,320 0 0 0 0 0 017438621 Other Highway Aid 2,806 0 0 0 0 0 017440720 Maintenance Aid 50,000 0 0 0 0 0 017440820 Maintenance Aid 0 50,000 0 0 0 0 50,00017440920 Maintenance Aid 0 0 50,000 0 0 0 50,00017459121 Noise Barriers -- I-684 0 0 0 0 0 0 017469121 Rt 303 Safety Study 0 0 0 0 0 0 017500022 NYS Agency Fund-Local Projects 21,153 0 0 0 0 0 017500122 NYS Agency Fund-Local Projects 22,327 0 0 0 0 0 017500211 Border Crossings 2,000 0 0 0 0 0 017500222 NYS Agency Fund-Local Projects 17,319 0 0 0 0 0 017500322 NYS Agency Fund-Local Projects 37,757 0 0 0 0 0 017500422 NYS Agency Fund-Local Projects 18,442 0 0 0 0 0 017500522 NYS Agency Fund-Local Projects 40,377 0 0 0 0 0 017500622 NYS Agency Fund-Local Projects 43,522 0 0 0 0 0 017500722 NYS Agency Fund-Local Projects 49,485 0 0 0 0 0 017500822 NYS Agency Fund-Local Projects 0 50,000 0 0 0 0 50,00017500922 NYS Agency Fund-Local Projects 0 0 50,000 0 0 0 50,00017501022 NYS Agency Fund - Local 0 0 0 50,000 0 0 50,00017501122 NYS Agency Fund - Local 0 0 0 0 50,000 0 50,00017501222 NYS Agency Fund - Local 0 0 0 0 0 50,000 50,00017509922 NYS Agency Fund-Local Project Costs 14,528 0 0 0 0 0 017658811 State Highway Capital Projects 2,073 0 0 0 0 0 017A38879 Industrial Access 73 0 0 0 0 0 017B18611 State Gateway Information Centers 656 0 0 0 0 0 017E18920 Federal Aid Match 30 0 0 0 0 0 017E19020 Federal Aid Match 188 0 0 0 0 0 017F18911 Non-Federal Aided Highway 4,275 0 0 0 0 0 017F19022 Non-Federal Aided Highway 3,384 0 0 0 0 0 017F19122 Non-Federal Aided Highway 14,089 0 0 0 0 0 017F19222 Non-Federal Aided Highway 10,194 0 0 0 0 0 017H10030 Engineering Services 10,737 0 0 0 0 0 017H10130 Engineering Service 16,182 0 0 0 0 0 017H10230 Engineering Service 16,257 0 0 0 0 0 017H10330 Engineering Services 36,438 0 0 0 0 0 017H10430 Engineering Services 32,007 0 0 0 0 0 017H10530 Engineering Services 62,868 0 0 0 0 0 017H10630 Engineering Services 168,198 0 0 0 0 0 017H10730 Engineering Services 530,435 0 0 0 0 0 017H10830 Engineering Services 0 671,887 0 0 0 0 671,88717H10930 Engineering Services 0 0 769,474 0 0 0 769,47417H11030 Engineering Services 0 0 0 797,956 0 0 797,95617H11130 Engineering Services 0 0 0 0 812,267 0 812,26717H11230 Engineering Services 0 0 0 0 0 818,061 818,06117H19230 D.O.T.Engineering Services 18,542 0 0 0 0 0 017H19330 Engineering Services 5,828 0 0 0 0 0 017H19430 Design And Construction 22,455 0 0 0 0 0 017H19530 Engineering Services 20,932 0 0 0 0 0 017H19630 Design And Construction 4,033 0 0 0 0 0 017H19730 Engineering Services 8,179 0 0 0 0 0 017H19830 Engineering Services 25,426 0 0 0 0 0 017H19930 Engineering Services 6,158 0 0 0 0 0 017H20030 Engineering Services 0 0 0 0 0 0 017H20130 Engineering Service 334 0 0 0 0 0 017H20230 Engineering Service 527 0 0 0 0 0 0
180

DETAILED DATA
181
Transportation, Department of PROJECTED APPROPRIATIONS AND DISBURSEMENTS BY PROGRAM
2008-2009 THROUGH 2012-2013 (thousands of dollars)
APPROPRIATIONS Reappro-
priations 2008-2009 2009-2010 2010-2011 2011-2012 17H20330 Engineering Services 910 0 0 0 0
2012-2013Total
2008-20130 0
17H20430 Engineering Services Mgmt. 785 0 0 0 0 0 017H20530 Engineering Services Mgmt. 744 0 0 0 0 0 017H20630 Engineering Services Mgmt. 579 0 0 0 0 0 017H20730 Engineering Services 37,673 0 0 0 0 0 017H20830 Engineering Services 0 66,310 0 0 0 0 66,31017H29530 ESF Capital Projects Management 0 0 0 0 0 0 017H29630 Office Of Policy And Program Mgmnt. 993 0 0 0 0 0 017H29830 Engineering Services 0 0 0 0 0 0 017H30030 Engineering Services 0 0 0 0 0 0 017H30230 Engineering Service 245 0 0 0 0 0 017H30330 Engineering Services 296 0 0 0 0 0 017H30430 Engineering Services ROW 493 0 0 0 0 0 017H30530 Engineering Services ROW 334 0 0 0 0 0 017H30630 Engineering Services ROW 60 0 0 0 0 0 017H30730 Engineering Services 12,981 0 0 0 0 0 017H30830 Engineering Services 0 19,810 0 0 0 0 19,81017H39530 ESF Real Estate Services 0 0 0 0 0 0 017H39630 Real Estate 0 0 0 0 0 0 017H40730 Engineering Services 15,000 0 0 0 0 0 017H40830 Engineering Services 0 15,000 0 0 0 0 15,00017H40930 Engineering Services 0 0 10,000 0 0 0 10,00017M100MR Local Projects 49,220 0 0 0 0 0 017MM05MR Multi-Modal 130,700 0 0 0 0 0 017MM06MR Multi-Modal 200,000 0 0 0 0 0 017NY0030 NY Metro Trans Council 760 0 0 0 0 0 017NY0130 NY Metro Trans Council 2,125 0 0 0 0 0 017NY0230 NY Metro Trans Council 1,508 0 0 0 0 0 017NY0330 NY Metro Trans Council 2,183 0 0 0 0 0 017NY0430 NY Metro Trans Council 455 0 0 0 0 0 017NY0530 NY Metro Trans Council 2,889 0 0 0 0 0 017NY0630 NY Metro Trans Council 8,490 0 0 0 0 0 017NY0730 NY Metro Trans Council 13,501 0 0 0 0 0 017NY0830 NY Metro Trans Council 0 19,094 0 0 0 0 19,09417NY0930 Metro Trans Council 0 0 19,667 0 0 0 19,66717NY1030 Metro Trans Council 0 0 0 20,257 0 0 20,25717NY1130 Metro Trans Council 0 0 0 0 20,865 0 20,86517NY1230 Metro Trans Council 0 0 0 0 0 21,491 21,49117NY9630 NY Metro Trans Council 0 0 0 0 0 0 017NY9730 NY Metro Trans Council 0 0 0 0 0 0 017NY9830 NY Metro Trans Council 0 0 0 0 0 0 017NY9930 NY Metro Trans Council 151 0 0 0 0 0 071119310 Trans Infrastructure Renewal Bond F 638 0 0 0 0 0 071258910 Accel. Capacity & Trans. Impts Fund 34,510 0 0 0 0 0 071A58810 Construction Programs 25,538 0 0 0 0 0 071A58910 Construction Programs 2,800 0 0 0 0 Subtotal 10,747,527 4,173,805 4,539,510 4,709,838 4,739,647
0 04,638,441 22,801,241
Maintenance Facilities 17250013 Highway Maintenance 141 0 0 0 0 0 017250113 Highway Maintenance 264 0 0 0 0 0 017250213 Highway Maintenance 0 0 0 0 0 0 017250313 Highway Maintenance 136 0 0 0 0 0 017250413 Highway Maintenance 551 0 0 0 0 0 017250513 Highway Maintenance 1,646 0 0 0 0 0 017250613 Highway Maintenance 7,551 0 0 0 0 0 017250713 Highway Maintenance 14,863 0 0 0 0 0 017250813 Highway Maintenance 0 15,485 0 0 0 0 15,48517250913 Highway Maintenance 0 0 15,965 0 0 0 15,96517251013 Highway Maintenance 0 0 0 15,965 0 0 15,96517251113 Highway Maintenance 0 0 0 0 15,965 0 15,96517251213 Highway Maintenance 0 0 0 0 0 15,965 15,96517259813 Highway Maintenance 127 0 0 0 0 0 017259913 Highway Maintenance 95 0 0 0 0 0 017260118 Equipment Management 45 0 0 0 0 0 017260218 Equipment Management 265 0 0 0 0 0 017260318 Equipment Management 474 0 0 0 0 0 017260418 Equipment Management 709 0 0 0 0 0 017260518 Equipment Management 279 0 0 0 0 0 017269818 Equipment Management 115 0 0 0 0 0 017269918 Equipment Management 102 0 0 0 0 0 017D10330 Design And Construction 54 0 0 0 0 0 017D10430 Design And Construction 0 0 0 0 0 0 017D10530 Design And Construction 104 0 0 0 0 0 017D10630 Design And Construction 150 0 0 0 0 0 017D10730 Design and Construction 1,890 0 0 0 0 0 017D10830 Design and Construction 0 2,200 0 0 0 0 2,20017D10930 Design and Construction 0 0 2,200 0 0 0 2,200

DETAILED DATA
Transportation, Department of PROJECTED APPROPRIATIONS AND DISBURSEMENTS BY PROGRAM
2008-2009 THROUGH 2012-2013 (thousands of dollars)
APPROPRIATIONS Reappro-
priations 2008-2009 2009-2010 2010-2011 2011-2012 17D11030 Design and Construction 0 0 0 2,200 0
2012-2013Total
2008-20132,2000
17D11130 Design and Construction 0 0 0 0 2,200 0 2,20017D11230 Design and Construction 0 0 0 0 0 Subtotal 29,561 17,685 18,165 18,165 18,165 Mass Transportation and Rail Freight 01371210 Rail Pres Energy Cons Pay CCf 15 0 0 0 0
2,200 2,20018,165 90,345
0 001371310 Rail Pres-Energy Cons Pay Laf 247 0 0 0 0 0 001393212 Fi-Imp&Rehab All Railroad Ser 7,265 0 0 0 0 0 001395012 Rail & Rapid Transit Projects 247 0 0 0 0 0 003064812 Rail & Rapid Trans(Bond) 178 0 0 0 0 0 017010529 Non-MTA Capital CNYRTA 142 0 0 0 0 0 017020729 Statewide Supplemental 0 0 0 0 0 0 017020829 Statewide Supplemental 0 30,072 0 0 0 0 30,07217020929 Statewide Supplemental 0 0 30,072 0 0 0 30,07217021029 Statewide Supplemental 0 0 0 30,072 0 0 30,07217021129 Statewide Supplemental 0 0 0 0 30,072 0 30,07217021229 Statewide Supplemental 0 0 0 0 0 30,072 30,07217108626 Municipal Hwy Rr Crossing Alteratio 1,125 0 0 0 0 0 017108826 Municipal Hwy Rr Crossing Alteratio 443 0 0 0 0 0 017148440 Rebuild New York 930 0 0 0 0 0 017148541 Rail 769 0 0 0 0 0 017150041 Rail Freight 7,029 0 0 0 0 0 017150241 Railroads 7,362 0 0 0 0 0 017150341 Railroads 10,400 0 0 0 0 0 017150441 Railroads 11,157 0 0 0 0 0 017150541 Railroads 11,804 0 0 0 0 0 017150641 Railroads 15,908 0 0 0 0 0 017150741 Railroads 20,000 0 0 0 0 0 017150841 Railroads 0 20,000 0 0 0 0 20,00017150941 Railroads 0 0 20,000 0 0 0 20,00017151041 Railroads 0 0 0 20,000 0 0 20,00017151141 Railroads 0 0 0 0 20,000 0 20,00017151241 Railroads 0 0 0 0 0 20,000 20,00017158441 Rail 343 0 0 0 0 0 017158626 Hwy/Rail Crossing Alterations 214 0 0 0 0 0 017159441 Rail 89 0 0 0 0 0 017159941 Rail Freight 4,492 0 0 0 0 0 017170029 Omnibus 8,133 0 0 0 0 0 017170129 Omnibus 2,400 0 0 0 0 0 017170229 Omnibus 4,178 0 0 0 0 0 017170329 Omnibus 4,104 0 0 0 0 0 017170429 Omnibus 6,391 0 0 0 0 0 017170529 Omnibus 14,439 0 0 0 0 0 017170629 Omnibus 18,000 0 0 0 0 0 017170729 Omnibus 19,000 0 0 0 0 0 017170829 Omnibus 0 20,000 0 0 0 0 20,00017170929 Omnibus 0 0 21,000 0 0 0 21,00017171029 Omnibus 0 0 0 22,000 0 0 22,00017171129 Omnibus 0 0 0 0 22,000 0 22,00017171229 Omnibus 0 0 0 0 0 22,000 22,00017179329 Omnibus 1,022 0 0 0 0 0 017179429 Omnibus 1,774 0 0 0 0 0 017179629 Omnibus 303 0 0 0 0 0 017179729 Omnibus 1,492 0 0 0 0 0 017179829 Omnibus 1,084 0 0 0 0 0 017179929 Omnibus 1,182 0 0 0 0 0 017180529 Omnibus 15,263 0 0 0 0 0 0171892A2 Oak Point Link State Share 1,351 0 0 0 0 0 017198640 Omnibus & Transit 409 0 0 0 0 0 017198840 Omnibus 860 0 0 0 0 0 017199040 Omnibus 19 0 0 0 0 0 017228526 Highway/Rail Crossing Alterations 81 0 0 0 0 0 017270641 High Speed Rail 22,000 0 0 0 0 0 017298841 Tarrytown-1983 Infra. Bondable 0 0 0 0 0 0 017359441 Special Rail 37 0 0 0 0 0 017359541 Special Rail 303 0 0 0 0 0 017359641 Special Rail 4,461 0 0 0 0 0 017360029 Non-Mta Capital 1,331 0 0 0 0 0 017360129 Non-Mta Capital 2,241 0 0 0 0 0 017360229 Non-Mta Capital 5,051 0 0 0 0 0 017360329 Non - Mta Capital 3,631 0 0 0 0 0 017360429 Non - MTA Capital 10,954 0 0 0 0 0 017360529 Non - MTA Capital 15,961 0 0 0 0 0 017360629 Non - MTA Capital 16,000 0 0 0 0 0 017360729 Non - MTA Capital 16,000 0 0 0 0 0 017360829 Non - MTA Capital 0 21,000 0 0 0 0 21,00017360929 Non-MTA Capital 0 0 21,000 0 0 0 21,000
182

DETAILED DATA
183
Transportation, Department of PROJECTED APPROPRIATIONS AND DISBURSEMENTS BY PROGRAM
2008-2009 THROUGH 2012-2013 (thousands of dollars)
APPROPRIATIONS Reappro-
priations 2008-2009 2009-2010 2010-2011 2011-2012 17361029 Non-MTA Capital 0 0 0 21,000 0
2012-2013Total
2008-201321,0000
17361129 Non-MTA Capital 0 0 0 0 21,000 0 21,00017361229 Non-MTA Capital 0 0 0 0 0 21,000 21,00017369629 Non-Mta Capital 6 0 0 0 0 0 017369729 Non-Mta Capital 125 0 0 0 0 0 017369829 Non Mta Capital 5,390 0 0 0 0 0 017369929 Non-Mta Capital 3,956 0 0 0 0 0 017379541 Special Rail 519 0 0 0 0 0 017419312 Rail And Rapid Transit 12,311 0 0 0 0 0 017428629 Omnibus 622 0 0 0 0 0 017429512 High Speed Rail--State Share 4 0 0 0 0 0 017500729 Non -MTA Clean Air 17,500 0 0 0 0 0 017779212 Oak Point Link Advance - Port Autho 17,422 0 0 0 0 0 017789212 Oak Point Link Advance - NYC 3,928 0 0 0 0 0 017K49026 Alterations 36 0 0 0 0 Subtotal 361,433 91,072 92,072 93,072 93,072 Ports and Waterways 17198515 Port Development 4 0 0 0 0 17208716 Canals & Waterways 326 0 0 0 0 17278615 Port Development 5 0 0 0 0 17278815 Port Project Infrastructure Renewal 48 0 0 0 0 17328816 Canals & Waterways 159 0 0 0 0 173685A1 Marine Projects 181 0 0 0 0 Subtotal 723 0 0 0 0 Transportation Bondable 17010510 Rebuild & Renew NY Bond Proceeds 2,806,523 0 0 0 0
0 093,072 462,360
000000
000000
0 0
0 017010511 CON ENG ROW 138,975 0 0 0 0 0 017010611 CON ENG ROW 191,512 0 0 0 0 0 017010711 CON ENG ROW 290,000 0 0 0 0 0 017010811 CON ENG ROW 0 275,000 0 0 0 0 275,00017010816 Canals and Waterways 0 10,000 0 0 0 0 10,00017010911 CON ENG ROW 0 0 168,600 0 0 0 168,60017010916 Canals and Waterways 0 0 10,000 0 0 0 10,00017020516 Canals and Waterways 10,000 0 0 0 0 0 017020616 Canals and Waterways 10,000 0 0 0 0 0 017020716 Canals and Waterways 10,000 0 0 0 0 0 017030514 Aviation 13,919 0 0 0 0 0 017030614 Aviation 14,697 0 0 0 0 0 017030714 Aviation 15,000 0 0 0 0 0 017030814 Aviation 0 15,000 0 0 0 0 15,00017030914 Aviation 0 0 16,400 0 0 0 16,40017040515 Rail and Port 21,178 0 0 0 0 0 017040615 Rail and Port 27,000 0 0 0 0 0 017040715 Rail and Port 27,000 0 0 0 0 0 017040815 Rail and Port 0 27,000 0 0 0 0 27,00017040915 Rail and Port 0 0 27,000 0 0 0 27,000170505MT Mass Transit 8,447 0 0 0 0 0 0170506MT Mass Transit 8,420 0 0 0 0 0 0170507MT Mass Transit 10,000 0 0 0 0 0 0170508MT Mass Transit 0 10,000 0 0 0 0 10,000170509MT Mass Transit 0 0 10,000 0 0 Subtotal 3,602,671 337,000 232,000 0 0 Total 14,834,713 4,637,562 4,895,747 4,835,075 4,864,884
0 10,0000 569,000
4,763,678 23,996,946

DETAILED DATA
Transportation, Department of PROJECTED APPROPRIATIONS AND DISBURSEMENTS BY PROGRAM
2008-2009 THROUGH 2012-2013 (thousands of dollars)
DISBURSEMENTS Estimated
2007-2008 2008-2009 2009-2010 2010-2011 2011-2012 Aviation 02412614 Acq + Develop Republic Airport 135 0 0 0 0 03025510 Aviation Cap Proj Bond Expend 0 0 0 0 0 17158514 State Share Federal Aviation Improv 0 300 300 0 0 17168714 State Share Fed.Aviation Improvemen 0 190 0 0 0 17178414 State Share Federal Aviation Improv 165 0 0 0 0 17229314 Aviation 1,000 750 500 250 0 17230014 Statewide Aviation 420 360 55 0 0 17230114 Statewide Aviation 324 0 0 0 0 17230214 Statewide Aviaiton 800 332 0 0 0 17230314 Statewide Aviation 1,280 0 0 0 0 17230414 Statewide Aviation 2,320 1,280 800 640 560 17230514 Statewide Aviation 960 2,320 1,280 800 640 17230614 Statewide Aviation 720 960 2,320 1,280 800 17230714 Statewide Aviation 80 720 960 2,320 1,280 17230814 Statewide Aviation 0 80 720 960 2,320 17230914 Statewide Aviation 0 0 80 720 960 17231014 Statewide Aviation 0 0 0 80 720 17231114 Statewide Aviation 0 0 0 0 80 17231214 Statewide Aviation 0 0 0 0 0 17238614 State Share Fed.Aviation Improvemen 0 100 0 10 0 17238814 State Share Fed.Aviation Improvemen 0 0 0 1 0 17238914 State Share Fed.Aviation Improvemen 0 0 0 0 0 17239014 Aviation Improvements 0 0 0 0 0 17239214 Statewide Aviation Development 200 100 0 0 0 17239314 State Share Aviation Improvements 100 74 0 0 0 17239514 Statewide Aviation D 100 75 50 25 25 17239814 Statewide Aviation 90 0 0 0 0 17239914 Statewide Aviation 270 90 0 0 0 17249714 Aviation State Match 86 69 24 7 0 17439114 Const Reconst & Imp Of Airports 0 0 0 300 300 17520014 Federal Airport Or Aviation 0 800 380 0 0 17520414 Republic Airport 6,000 0 0 0 0 17520514 Republic Airport 0 0 0 0 6,000 17520614 Republic Airport 0 0 0 0 385 17520714 Republic Airport 0 0 0 0 0 17520814 Republic Airport 0 0 0 0 0 17520914 Republic Airport 0 0 0 0 0 17521014 Republic Airport 0 0 0 0 0 17521114 Republic Airport 0 0 0 0 0 17521214 Republic Airport 0 0 0 0 0 17529114 Federal Airport Or Aviation 0 0 0 7,500 0 17A18614 State Share Fed.Aviation Imps 0 0 0 0 0 17RA0614 Stewart Airport 0 0 0 1,100 800 17RA0814 Stewart Airport 0 0 0 0 0 17RA9914 Reg Aviation Fund - Stewart 2,000 1,700 1,300 0 0 17RB9914 Reg Aviation Fund - Republic 0 0 100 0 0 17RD9914 Reg Aviation Fund - Mou 0 0 0 0 0 17RE9914 Reg Aviation Fund - Airp 0 0 0 0 0 Subtotal 17,050 10,300 8,869 15,993 14,870 Highway Facilities 03334811 Hwy-Rr Grade Cross Eliminations 2,000 0 0 0 0
2012-2013
300000000000
480560640800
2,2802,3202,960
720800
198362100
2500000000
6,00000000000
8000000
Total2008-2013
3000
600190
01,500
4150
3320
3,7605,6006,0006,0806,3604,0803,760
80080
1101993621
10074
2000
90100600
1,1800
6,000385
6,00000000
7,5000
1,900800
3,000100
00
18,220 68,252
0 0170102SN Snow & Ice Control 0 0 0 0 0 0 0170103PT Bus Inspection 0 0 0 0 0 0 0170103SN Snow & Ice Control 0 0 0 0 0 0 0170104SN Snow & Ice Control 618 0 0 0 0 0 0170105PT Bus Inspection 0 0 0 0 0 0 0170106PT Bus Inspection 300 0 0 0 0 0 0170107PT Bus Inspection 7,170 305 0 0 0 0 305170108BI Bridge Initiative 0 50,335 60,122 15,000 6,991 6,991 139,439170108PT Bus Inspection 0 7,276 310 0 0 0 7,586170109BI Bridge Initiative 0 0 21,560 63,240 19,707 8,353 112,860170109PT Bus Inspection 0 0 7,531 320 0 0 7,851170110BI Bridge Initiative 0 0 0 55,076 70,785 17,299 143,160170110PT Bus Inspection 0 0 0 7,794 331 0 8,125170111BI Bridge Initiative 0 0 0 0 56,830 67,879 124,709170111PT Bus Inspection 0 0 0 0 8,087 444 8,531170112BI Bridge Initiative 0 0 0 0 0 59,101 59,101170112PT Bus Inspection 0 0 0 0 0 8,390 8,390170194TA Other Highway Aid 0 0 0 0 0 0 017020022 Nfa Hwy, Eng, Row 9,438 0 0 0 0 0 017020122 Nfa Hwy, Eng, Row 10,697 10,697 0 0 0 0 10,69717020222 Nfa Hwy, Eng, Row 20,762 10,380 10,380 4,157 0 0 24,91717020322 NFA Highway, ROW 11,100 7,400 3,700 3,700 0 0 14,80017020422 NFA Highway, ROW 30,400 11,400 7,600 3,800 3,800 0 26,60017020522 NFA Highway, ROW 102,701 47,034 0 0 0 0 47,03417020622 NFA Highway, ROW 193,575 113,475 63,400 25,025 13,350 6,675 221,925
184

DETAILED DATA
Transportation, Department of PROJECTED APPROPRIATIONS AND DISBURSEMENTS BY PROGRAM
2008-2009 THROUGH 2012-2013 (thousands of dollars)
DISBURSEMENTS Estimated Total
2007-2008 2008-2009 2009-2010 2010-2011 2011-2012 17020722 NFA Highway, ROW 150,946 202,996 98,485 41,640 15,615
2012-201310,410
2008-2013369,146
17020822 NFA Highway, ROW 0 156,412 210,347 109,671 46,510 16,180 539,12017020922 NFA Highway, ROW 0 0 238,430 307,200 143,907 63,015 752,55217021022 NFA Highway, ROW 0 0 0 273,546 367,872 165,354 806,77217021122 NFA Highway, ROW 0 0 0 0 283,547 372,873 656,42017021222 NFA Highway, ROW 0 0 0 0 0 283,547 283,54717028420 Infrastructure Renewal Bond 0 0 969 0 0 200 1,16917028520 Infrastructure Renewal Bond 400 0 810 0 0 0 81017028720 Infrastructure Renewal Bond 0 0 0 150 0 0 15017028820 Infrastructure Renewal Bond 0 268 0 0 0 2,500 2,76817029222 Non-Federal Aided Highway 5,000 4,000 3,000 2,000 1,000 500 10,50017029322 Non Federally Aided Highways 2,000 1,500 1,000 500 0 0 3,00017029422 Non Federally Aided Highways 6,000 5,000 4,000 3,000 2,000 1,000 15,000170294TA Other Highway Aid 0 0 0 0 0 0 017029522 Non Federally Aided Highway 3,500 4,205 2,500 2,000 1,500 1,000 11,20517029622 Dedicated Fund 660 550 440 330 220 110 1,65017029722 Dedicated Fund 1,000 800 600 400 200 0 2,00017029822 Dedicated Fund 6,000 4,000 2,000 1,000 500 250 7,75017029922 Nfa Hwy, Eng, Row 0 0 0 0 0 0 017030020 Transportation Aid 8,600 176,000 100,000 411 0 0 276,41117030120 Transportation Aid 313 70 150,000 100,000 0 0 250,07017030220 Transportation Aid 15,000 0 24,000 100,000 0 0 124,00017030320 Transportation Aid 1,000 0 100 56,000 0 0 56,10017030420 Transportation Aid 0 0 23 24,857 100,000 0 124,88017030520 Transportation Aid 35,593 0 0 0 100,000 0 100,00017030620 Transportation Aid 380,837 0 0 0 15,000 0 15,00017030720 Transportation Aid 741,365 174,593 0 0 0 999,999 1,174,59217030820 Transportation Aid 0 981,612 126,769 0 0 387,689 1,496,07017030920 Transportation Aid 0 0 988,549 146,836 0 0 1,135,38517031020 Federal Aid Highways 0 0 0 933,461 0 0 933,46117031120 Federal Aid Highways 0 0 0 0 0 0 017031220 Federal Aid Highways 0 0 0 0 0 0 017038679 Industrial Access 0 0 0 0 0 0 017039120 Fed Share Of Highway Projects 0 46,985 93,165 400 12,596 0 153,14617039220 Fed Share Of Highway Projects 0 0 0 11,500 38,000 0 49,50017039320 Transportation Aid 93,274 0 0 12,046 150,886 0 162,93217039420 Transportation Aid 0 75,766 0 0 302,300 0 378,06617039520 Transportation Aid 0 0 0 0 260,835 0 260,83517039620 Transportation Aid 11,100 6,840 38,582 0 68,881 0 114,30317039720 Trnsportation Aid 0 0 0 29,448 131,331 0 160,77917039820 Transportation Aid 0 0 0 10 89,640 0 89,65017039920 Transportation Aid 50,000 0 0 0 92,235 0 92,23517039922 Nfa Hwy, Eng, Row 0 0 0 0 0 0 017040022 Preventive Maintenance 0 0 0 0 0 0 017040122 Preventive Maintenance 0 0 0 0 0 0 017040222 Preventive Maintenance 0 0 0 0 0 0 017040322 Preventive Maintenance 0 0 0 0 0 0 017040422 Preventive Maintenance 3,312 0 0 0 0 0 0170405HM Preventive Maintenance 4,800 4,800 0 0 0 0 4,800170406HM Preventive Maintenance 68,655 5,281 5,281 0 0 0 10,562170407HM Preventive Maintenance 480,755 74,402 5,723 5,723 0 0 85,848170408HM Preventive Maintenance 0 487,024 75,372 5,797 5,797 0 573,990170409HM Preventive Maintenance 0 0 501,724 77,647 5,973 5,973 591,317170410HM Preventive Maintenance 0 0 0 514,146 79,570 6,120 599,836170411HM Preventive Maintenance 0 0 0 0 523,950 85,832 609,782170412HM Preventive Maintenance 0 0 0 0 0 541,324 541,324170493PM Preventive Maintenance 0 0 0 0 0 0 017049522 Preventive Maintenance 80 40 20 10 4 0 7417049622 Preventive Maintenance 60 50 40 30 20 10 15017049722 Preventive Maintenance 666 333 0 0 0 0 33317049822 Preventive Maintenance 600 500 400 300 200 100 1,50017049922 Preventive Maintenance 0 0 0 0 0 0 017058523 Rebuild New York 300 0 46 0 0 0 4617058779 Industrial Access/Stewart Air Settl 0 0 0 0 0 0 017059379 Industrial Access 0 0 0 0 0 0 0170594PM Preventive Maintenance 2,000 1,000 500 0 0 0 1,50017059822 Multi-Modal 1,000 850 700 550 400 250 2,75017060079 Industrial Access 486 0 0 0 0 0 017060279 Industrial Access 1,170 112 0 0 0 0 11217060379 Industrial Access 1,440 1,170 900 900 900 218 4,08817060479 Industrial Access 2,070 1,440 1,170 900 900 900 5,31017060579 Industrial Access 450 2,070 1,440 1,170 900 900 6,48017060679 Industrial Access 450 450 2,070 1,440 1,170 900 6,03017068623 Rebuild New York 0 300 2 127 0 0 42917068711 Other Highway Systems 3,000 2,500 1,000 500 250 125 4,37517068823 Rebuild New York 0 700 0 604 0 0 1,30417069479 Industrial Access 150 77 0 0 0 0 77
185

DETAILED DATA
Transportation, Department of PROJECTED APPROPRIATIONS AND DISBURSEMENTS BY PROGRAM
2008-2009 THROUGH 2012-2013 (thousands of dollars)
DISBURSEMENTS Estimated Total
2007-2008 2008-2009 2009-2010 2010-2011 2011-2012 17069579 Industrial Access 0 0 0 0 0
2012-2013 2008-20130 0
17069679 Industrial Access 6 0 0 0 0 0 017069779 Industrial Access 0 0 0 0 0 0 017069879 Industrial Access 244 0 0 0 0 0 017069979 Industrial Access 1,500 434 0 0 0 0 43417070079 Industrial Access 1,000 1,000 700 0 0 0 1,70017070279 Industrial Access 780 600 600 600 420 0 2,22017078723 Rebuild New York 0 400 0 29 0 0 42917079979 Industrial Access - Mou 1,000 703 0 0 0 0 703170807HM Diesel Retrofit 3,000 0 0 0 0 0 017088723 Grade Crossing Eliminations 0 100 0 18 0 0 118171594TA Other Highway Aid 0 0 0 0 0 0 0171694TA Other Highway Aid 0 0 0 0 0 0 017249279 Industrial Access 22 0 0 0 0 0 017278423 Rebuild New York 200 0 114 0 0 0 11417288424 State & Local Construction 562 550 952 2,183 4,000 0 7,68517309322 Bonding Guarantee 500 400 300 200 100 50 1,050173293MT Bonding Guarantee 0 0 1,878 0 0 0 1,878173393MT Working Capital Loans 0 0 0 0 0 0 017348590 Southern Tier Expressway 2,000 500 0 0 0 0 50017369321 I95 Sound Barriers 100 100 100 100 100 100 50017428620 Infrastructure Renewal Bond 0 390 0 0 0 0 39017428823 Grade Crossing Eliminations 2,174 284 0 0 0 802 1,08617438621 Other Highway Aid 800 600 400 200 100 50 1,35017440720 Maintenance Aid 0 0 0 0 0 1 117440820 Maintenance Aid 0 0 0 0 0 10,000 10,00017440920 Maintenance Aid 0 0 0 0 0 0 017459121 Noise Barriers -- I-684 0 0 0 0 0 0 017469121 Rt 303 Safety Study 0 0 0 0 0 0 017500022 NYS Agency Fund-Local Projects 0 0 0 0 0 0 017500122 NYS Agency Fund-Local Projects 0 0 0 0 0 0 017500211 Border Crossings 0 0 0 0 0 0 017500222 NYS Agency Fund-Local Projects 0 0 0 0 0 0 017500322 NYS Agency Fund-Local Projects 0 0 0 0 0 0 017500422 NYS Agency Fund-Local Projects 0 0 0 0 0 0 017500522 NYS Agency Fund-Local Projects 0 0 0 0 0 0 017500622 NYS Agency Fund-Local Projects 0 0 0 0 0 0 017500722 NYS Agency Fund-Local Projects 0 0 0 0 0 0 017500822 NYS Agency Fund-Local Projects 0 0 0 0 0 0 017500922 NYS Agency Fund-Local Projects 0 0 0 0 0 0 017501022 NYS Agency Fund - Local 0 0 0 0 0 0 017501122 NYS Agency Fund - Local 0 0 0 0 0 0 017501222 NYS Agency Fund - Local 0 0 0 0 0 0 017509922 NYS Agency Fund-Local Project Costs 0 0 0 0 0 0 017658811 State Highway Capital Projects 0 0 0 2,000 0 0 2,00017A38879 Industrial Access 72 0 0 0 0 0 017B18611 State Gateway Information Centers 150 100 50 0 0 0 15017E18920 Federal Aid Match 0 0 0 0 0 0 017E19020 Federal Aid Match 0 0 0 0 0 0 017F18911 Non-Federal Aided Highway 0 2,000 0 0 0 0 2,00017F19022 Non-Federal Aided Highway 0 0 0 0 0 0 017F19122 Non-Federal Aided Highway 2,000 0 0 0 2,000 0 2,00017F19222 Non-Federal Aided Highway 0 0 2,000 0 0 2,000 4,00017H10030 Engineering Services 0 0 0 0 0 0 017H10130 Engineering Service 0 0 0 0 0 0 017H10230 Engineering Service 0 3,772 1,063 0 0 0 4,83517H10330 Engineering Services 5,125 5,125 5,125 5,125 0 0 15,37517H10430 Engineering Services 15,420 5,140 5,140 5,140 5,140 0 20,56017H10530 Engineering Services 38,106 16,331 5,443 5,443 5,443 5,443 38,10317H10630 Engineering Services 117,179 45,569 29,529 16,510 6,510 6,510 104,62817H10730 Engineering Services 445,090 120,978 57,047 20,163 6,721 6,721 211,63017H10830 Engineering Services 0 456,883 130,939 47,032 25,156 6,718 666,72817H10930 Engineering Services 0 0 533,242 138,505 58,863 24,084 754,69417H11030 Engineering Services 0 0 0 542,610 149,565 60,856 753,03117H11130 Engineering Services 0 0 0 0 552,342 156,208 708,55017H11230 Engineering Services 0 0 0 0 0 566,281 566,28117H19230 D.O.T.Engineering Services 3,516 0 0 0 0 0 017H19330 Engineering Services 5,781 0 0 0 0 0 017H19430 Design And Construction 0 3,688 0 2,833 0 0 6,52117H19530 Engineering Services 0 0 3,593 0 963 0 4,55617H19630 Design And Construction 0 0 0 0 0 0 017H19730 Engineering Services 242 0 0 0 0 0 017H19830 Engineering Services 0 0 0 0 0 0 017H19930 Engineering Services 0 0 0 0 0 0 017H20030 Engineering Services 0 0 0 0 0 0 017H20130 Engineering Service 0 0 0 0 0 0 017H20230 Engineering Service 0 0 0 0 0 0 0
186

DETAILED DATA
Transportation, Department of PROJECTED APPROPRIATIONS AND DISBURSEMENTS BY PROGRAM
2008-2009 THROUGH 2012-2013 (thousands of dollars)
DISBURSEMENTS Estimated Total
2007-2008 2008-2009 2009-2010 2010-2011 2011-2012 17H20330 Engineering Services 0 0 0 0 0
2012-2013 2008-20130 0
17H20430 Engineering Services Mgmt. 784 0 0 0 0 0 017H20530 Engineering Services Mgmt. 3,910 1,676 559 559 558 558 3,91017H20630 Engineering Services Mgmt. 3,346 0 0 0 0 0 017H20730 Engineering Services 38,818 10,275 3,996 1,712 570 570 17,12317H20830 Engineering Services 0 45,090 11,935 4,641 1,989 663 64,31817H29530 ESF Capital Projects Management 0 0 0 0 0 0 017H29630 Office Of Policy And Program Mgmnt. 0 0 0 0 0 0 017H29830 Engineering Services 0 0 0 0 0 0 017H30030 Engineering Services 0 0 0 0 0 0 017H30230 Engineering Service 0 0 0 0 0 0 017H30330 Engineering Services 0 0 0 0 0 0 017H30430 Engineering Services ROW 423 70 0 0 0 0 7017H30530 Engineering Services ROW 992 425 142 142 141 141 99117H30630 Engineering Services ROW 886 0 0 0 0 0 017H30730 Engineering Services 11,000 3,482 1,354 580 193 193 5,80217H30830 Engineering Services 0 13,470 3,565 1,386 594 198 19,21317H39530 ESF Real Estate Services 0 0 0 0 0 0 017H39630 Real Estate 0 0 0 0 0 0 017H40730 Engineering Services 10,200 2,700 1,050 450 150 150 4,50017H40830 Engineering Services 0 10,200 2,700 1,050 450 150 14,55017H40930 Engineering Services 0 0 6,800 1,800 700 300 9,60017M100MR Local Projects 15,000 15,000 15,000 5,000 0 0 35,00017MM05MR Multi-Modal 16,500 15,000 15,000 25,000 15,000 15,000 85,00017MM06MR Multi-Modal 24,000 22,000 20,000 20,000 20,000 20,791 102,79117NY0030 NY Metro Trans Council 0 447 312 0 0 0 75917NY0130 NY Metro Trans Council 1,940 0 0 0 0 0 017NY0230 NY Metro Trans Council 203 0 935 0 0 0 93517NY0330 NY Metro Trans Council 0 0 62 0 0 0 6217NY0430 NY Metro Trans Council 454 0 1 0 0 0 117NY0530 NY Metro Trans Council 0 0 0 0 0 0 017NY0630 NY Metro Trans Council 0 119 682 0 0 0 80117NY0730 NY Metro Trans Council 9,500 1,108 1,057 0 0 0 2,16517NY0830 NY Metro Trans Council 0 12,000 1,000 7 0 0 13,00717NY0930 Metro Trans Council 0 0 10,000 0 0 0 10,00017NY1030 Metro Trans Council 0 0 0 14,265 0 0 14,26517NY1130 Metro Trans Council 0 0 0 0 14,500 0 14,50017NY1230 Metro Trans Council 0 0 0 0 0 14,992 14,99217NY9630 NY Metro Trans Council 100 0 0 0 0 0 017NY9730 NY Metro Trans Council 167 0 0 0 0 0 017NY9830 NY Metro Trans Council 1,000 0 0 0 0 0 017NY9930 NY Metro Trans Council 6 155 0 0 0 0 15571119310 Trans Infrastructure Renewal Bond F 0 0 0 0 0 0 071258910 Accel. Capacity & Trans. Impts Fund 0 0 0 0 0 0 071A58810 Construction Programs 0 0 0 0 0 0 071A58910 Construction Programs 0 0 0 0 0 Subtotal 3,258,591 3,501,862 3,729,125 3,809,645 3,896,758
0 04,021,941 18,959,331
Maintenance Facilities 17250013 Highway Maintenance 0 0 0 0 0 0 017250113 Highway Maintenance 0 0 0 0 0 0 017250213 Highway Maintenance 0 0 0 0 0 0 017250313 Highway Maintenance 107 0 0 0 0 0 017250413 Highway Maintenance 214 107 0 0 0 0 10717250513 Highway Maintenance 1,819 214 107 0 0 0 32117250613 Highway Maintenance 6,420 1,819 214 107 0 0 2,14017250713 Highway Maintenance 3,010 9,030 2,558 300 150 0 12,03817250813 Highway Maintenance 0 3,097 9,291 2,632 309 154 15,48317250913 Highway Maintenance 0 0 3,193 9,579 2,714 319 15,80517251013 Highway Maintenance 0 0 0 3,193 9,579 2,714 15,48617251113 Highway Maintenance 0 0 0 0 3,193 8,579 11,77217251213 Highway Maintenance 0 0 0 0 0 3,193 3,19317259813 Highway Maintenance 0 0 0 0 0 0 017259913 Highway Maintenance 0 0 0 0 0 0 017260118 Equipment Management 0 0 0 0 0 0 017260218 Equipment Management 0 0 0 0 0 0 017260318 Equipment Management 181 0 0 0 0 0 017260418 Equipment Management 362 181 0 0 0 0 18117260518 Equipment Management 279 0 0 0 0 0 017269818 Equipment Management 0 0 0 0 0 0 017269918 Equipment Management 0 0 0 0 0 0 017D10330 Design And Construction 53 0 0 0 0 0 017D10430 Design And Construction 0 0 0 0 0 0 017D10530 Design And Construction 144 0 0 0 0 0 017D10630 Design And Construction 313 0 0 0 0 0 017D10730 Design and Construction 440 1,320 374 44 22 0 1,76017D10830 Design and Construction 0 440 1,320 374 44 22 2,20017D10930 Design and Construction 0 0 440 1,320 374 44 2,178
187

DETAILED DATA
188
Transportation, Department of PROJECTED APPROPRIATIONS AND DISBURSEMENTS BY PROGRAM
2008-2009 THROUGH 2012-2013 (thousands of dollars)
DISBURSEMENTS Estimated Total
2007-2008 2008-2009 2009-2010 2010-2011 2011-2012 17D11030 Design and Construction 0 0 0 440 1,320 17D11130 Design and Construction 0 0 0 0 440 17D11230 Design and Construction 0 0 0 0 0 Subtotal 13,342 16,208 17,497 17,989 18,145 Mass Transportation and Rail Freight 01371210 Rail Pres Energy Cons Pay CCf 0 0 0 0 0
2012-2013 2008-20132,1341,760
440
3741,320
44017,159 86,998
0 001371310 Rail Pres-Energy Cons Pay Laf 0 0 0 0 0 0 001393212 Fi-Imp&Rehab All Railroad Ser 0 0 0 0 7,264 0 7,26401395012 Rail & Rapid Transit Projects 100 75 50 25 0 0 15003064812 Rail & Rapid Trans(Bond) 0 0 178 0 0 0 17817010529 Non-MTA Capital CNYRTA 465 0 0 0 0 0 017020729 Statewide Supplemental 29,100 0 0 0 0 0 017020829 Statewide Supplemental 0 30,072 0 0 0 0 30,07217020929 Statewide Supplemental 0 0 30,072 0 0 0 30,07217021029 Statewide Supplemental 0 0 0 30,072 0 0 30,07217021129 Statewide Supplemental 0 0 0 0 30,072 0 30,07217021229 Statewide Supplemental 0 0 0 0 0 30,072 30,07217108626 Municipal Hwy Rr Crossing Alteratio 400 300 200 100 0 0 60017108826 Municipal Hwy Rr Crossing Alteratio 100 90 80 70 60 40 34017148440 Rebuild New York 0 1 929 0 0 0 93017148541 Rail 0 0 0 0 0 0 017150041 Rail Freight 700 600 600 0 0 0 1,20017150241 Railroads 2,000 1,600 1,400 1,200 1,200 0 5,40017150341 Railroads 2,200 2,000 1,600 1,400 1,200 1,200 7,40017150441 Railroads 2,600 2,200 2,000 1,600 1,400 1,200 8,40017150541 Railroads 2,200 2,600 2,200 2,000 1,600 1,400 9,80017150641 Railroads 4,400 2,200 2,600 2,200 2,000 1,600 10,60017150741 Railroads 1,200 4,400 2,200 2,600 2,200 2,000 13,40017150841 Railroads 0 1,200 4,400 2,200 2,600 2,200 12,60017150941 Railroads 0 0 1,200 4,400 2,200 2,600 10,40017151041 Railroads 0 0 0 1,200 4,400 2,200 7,80017151141 Railroads 0 0 0 0 1,200 4,400 5,60017151241 Railroads 0 0 0 0 0 1,200 1,20017158441 Rail 364 1 0 0 0 0 117158626 Hwy/Rail Crossing Alterations 0 0 0 0 0 0 017159441 Rail 0 16 0 0 0 125 14117159941 Rail Freight 780 780 0 0 0 0 78017170029 Omnibus 1,000 700 200 1,000 2,000 0 3,90017170129 Omnibus 1,000 64 0 1,000 0 0 1,06417170229 Omnibus 1,955 550 300 1,150 0 0 2,00017170329 Omnibus 2,000 1,000 500 0 500 0 2,00017170429 Omnibus 3,000 1,500 1,750 800 0 0 4,05017170529 Omnibus 3,400 3,250 1,550 2,040 1,360 0 8,20017170629 Omnibus 1,080 3,600 4,500 2,700 2,160 0 12,96017170729 Omnibus 0 2,140 3,800 3,750 2,850 3,000 15,54017170829 Omnibus 0 0 2,200 5,000 5,000 5,000 17,20017170929 Omnibus 0 0 0 1,260 4,200 4,000 9,46017171029 Omnibus 0 0 0 0 1,260 2,000 3,26017171129 Omnibus 0 0 0 0 0 5,000 5,00017171229 Omnibus 0 0 0 0 0 780 78017179329 Omnibus 300 1,250 2,376 24 760 0 4,41017179429 Omnibus 0 1,000 2,030 3,000 2,440 0 8,47017179629 Omnibus 115 375 0 0 100 0 47517179729 Omnibus 750 236 400 0 0 0 63617179829 Omnibus 200 175 175 50 0 0 40017179929 Omnibus 175 150 150 50 0 0 35017180529 Omnibus 4,000 3,579 1,500 2,000 0 0 7,079171892A2 Oak Point Link State Share 300 500 152 0 300 0 95217198640 Omnibus & Transit 0 400 0 9 0 0 40917198840 Omnibus 0 0 0 835 0 0 83517199040 Omnibus 0 0 0 0 0 18 1817228526 Highway/Rail Crossing Alterations 0 0 0 0 0 0 017270641 High Speed Rail 10,000 12,000 0 0 0 0 12,00017298841 Tarrytown-1983 Infra. Bondable 0 0 0 0 0 0 017359441 Special Rail 30 13 0 0 0 0 1317359541 Special Rail 60 173 50 12 0 0 23517359641 Special Rail 1,000 800 1,661 1,000 0 0 3,46117360029 Non-Mta Capital 750 535 0 0 0 0 53517360129 Non-Mta Capital 1,000 275 71 1,000 0 0 1,34617360229 Non-Mta Capital 1,500 1,500 1,000 933 0 0 3,43317360329 Non - Mta Capital 2,500 1,500 761 387 0 0 2,64817360429 Non - MTA Capital 3,500 2,000 2,500 2,000 1,000 0 7,50017360529 Non - MTA Capital 2,400 5,000 2,400 2,600 800 1,000 11,80017360629 Non - MTA Capital 0 3,400 5,000 3,400 1,600 1,000 14,40017360729 Non - MTA Capital 0 1,000 2,400 3,000 2,400 3,000 11,80017360829 Non - MTA Capital 0 0 0 3,150 5,250 4,000 12,40017360929 Non-MTA Capital 0 0 0 0 3,150 3,000 6,150
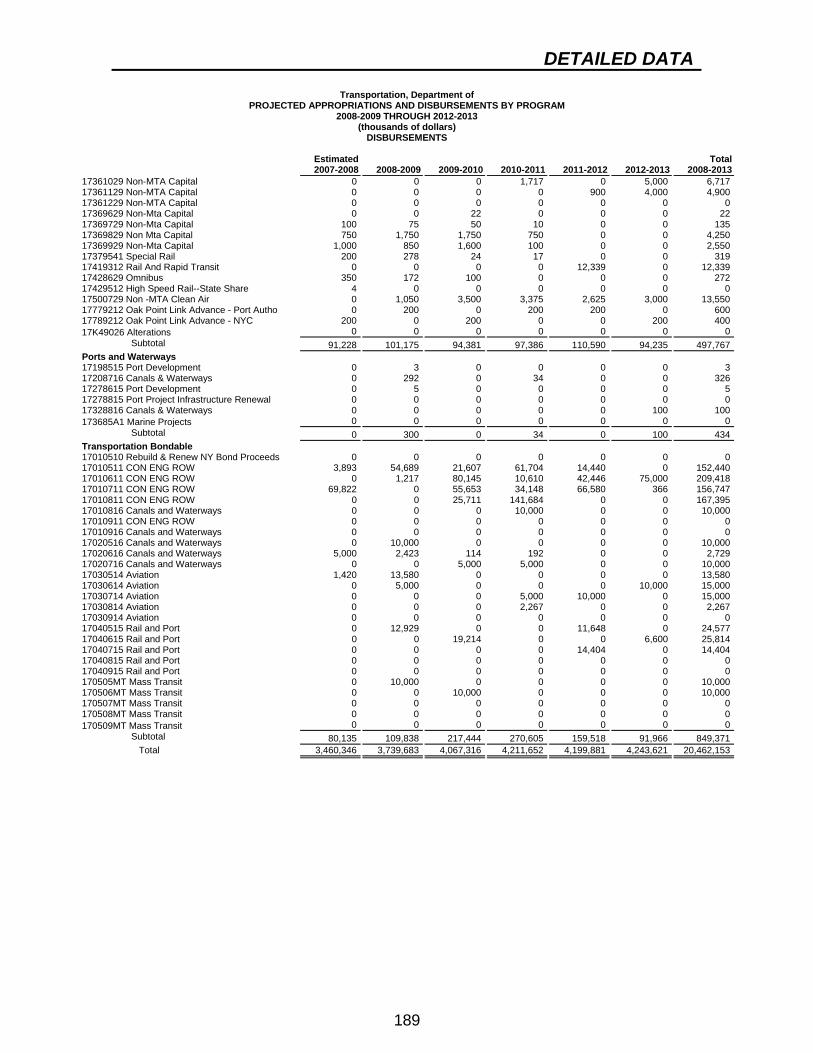
DETAILED DATA
189
Transportation, Department of PROJECTED APPROPRIATIONS AND DISBURSEMENTS BY PROGRAM
2008-2009 THROUGH 2012-2013 (thousands of dollars)
DISBURSEMENTS Estimated Total
2007-2008 2008-2009 2009-2010 2010-2011 2011-2012 17361029 Non-MTA Capital 0 0 0 1,717 0
2012-20135,000
2008-20136,717
17361129 Non-MTA Capital 0 0 0 0 900 4,000 4,90017361229 Non-MTA Capital 0 0 0 0 0 0 017369629 Non-Mta Capital 0 0 22 0 0 0 2217369729 Non-Mta Capital 100 75 50 10 0 0 13517369829 Non Mta Capital 750 1,750 1,750 750 0 0 4,25017369929 Non-Mta Capital 1,000 850 1,600 100 0 0 2,55017379541 Special Rail 200 278 24 17 0 0 31917419312 Rail And Rapid Transit 0 0 0 0 12,339 0 12,33917428629 Omnibus 350 172 100 0 0 0 27217429512 High Speed Rail--State Share 4 0 0 0 0 0 017500729 Non -MTA Clean Air 0 1,050 3,500 3,375 2,625 3,000 13,55017779212 Oak Point Link Advance - Port Autho 0 200 0 200 200 0 60017789212 Oak Point Link Advance - NYC 200 0 200 0 0 200 40017K49026 Alterations 0 0 0 0 0 Subtotal 91,228 101,175 94,381 97,386 110,590 Ports and Waterways 17198515 Port Development 0 3 0 0 0 17208716 Canals & Waterways 0 292 0 34 0 17278615 Port Development 0 5 0 0 0 17278815 Port Project Infrastructure Renewal 0 0 0 0 0 17328816 Canals & Waterways 0 0 0 0 0 173685A1 Marine Projects 0 0 0 0 0 Subtotal 0 300 0 34 0 Transportation Bondable 17010510 Rebuild & Renew NY Bond Proceeds 0 0 0 0 0
0 094,235 497,767
0000
1000
3326
50
1000
100 434
0 017010511 CON ENG ROW 3,893 54,689 21,607 61,704 14,440 0 152,44017010611 CON ENG ROW 0 1,217 80,145 10,610 42,446 75,000 209,41817010711 CON ENG ROW 69,822 0 55,653 34,148 66,580 366 156,74717010811 CON ENG ROW 0 0 25,711 141,684 0 0 167,39517010816 Canals and Waterways 0 0 0 10,000 0 0 10,00017010911 CON ENG ROW 0 0 0 0 0 0 017010916 Canals and Waterways 0 0 0 0 0 0 017020516 Canals and Waterways 0 10,000 0 0 0 0 10,00017020616 Canals and Waterways 5,000 2,423 114 192 0 0 2,72917020716 Canals and Waterways 0 0 5,000 5,000 0 0 10,00017030514 Aviation 1,420 13,580 0 0 0 0 13,58017030614 Aviation 0 5,000 0 0 0 10,000 15,00017030714 Aviation 0 0 0 5,000 10,000 0 15,00017030814 Aviation 0 0 0 2,267 0 0 2,26717030914 Aviation 0 0 0 0 0 0 017040515 Rail and Port 0 12,929 0 0 11,648 0 24,57717040615 Rail and Port 0 0 19,214 0 0 6,600 25,81417040715 Rail and Port 0 0 0 0 14,404 0 14,40417040815 Rail and Port 0 0 0 0 0 0 017040915 Rail and Port 0 0 0 0 0 0 0170505MT Mass Transit 0 10,000 0 0 0 0 10,000170506MT Mass Transit 0 0 10,000 0 0 0 10,000170507MT Mass Transit 0 0 0 0 0 0 0170508MT Mass Transit 0 0 0 0 0 0 0170509MT Mass Transit 0 0 0 0 0 Subtotal 80,135 109,838 217,444 270,605 159,518 Total 3,460,346 3,739,683 4,067,316 4,211,652 4,199,881
0 091,966 849,371
4,243,621 20,462,153

DETAILED DATA
190
Motor Vehicles, Department of PROJECTED APPROPRIATIONS AND DISBURSEMENTS BY PROGRAM
2008-2009 THROUGH 2012-2013 (thousands of dollars)
APPROPRIATIONS
Transportation Support 230103TS DMV Expenses
Reappro- priations 2008-2009 2009-2010 2010-2011 2011-2012
2,500 0 0 0 0
2012-2013
0
Total2008-2013
0230105TS DMV Expenses 0 0 0 0 0 0 0230107TS DMV Expenses 0 0 0 0 0 0 0230108TS DMV Expenses 0 221,453 0 0 0 0 221,453230109TS DMV Expenses 0 0 217,000 0 0 0 217,000230110TS DMV Expenses 0 0 0 223,500 0 0 223,500230111TS DMV expenses 0 0 0 0 228,417 0 228,417230112TS DMV expenses Subtotal Total
0 0 0 0 0 236,400 236,4002,500 221,453 217,000 223,500 228,417 236,400 1,126,770
1,126,7702,500 221,453 217,000 223,500 228,417 236,400
Motor Vehicles, Department of
PROJECTED APPROPRIATIONS AND DISBURSEMENTS BY PROGRAM 2008-2009 THROUGH 2012-2013
(thousands of dollars) DISBURSEMENTS
Estimated Total
2007-2008 2008-2009 2009-2010 2010-2011 2011-2012 2012-2013 2008-2013Transportation Support 230103TS DMV Expenses
0 0 0 0 0 0 0
230105TS DMV Expenses 13,906 0 0 0 0 0 0230107TS DMV Expenses 184,300 6,171 0 0 0 0 6,171230108TS DMV Expenses 0 214,049 1,562 0 0 0 215,611230109TS DMV Expenses 0 0 212,334 1,222 0 0 213,556230110TS DMV Expenses 0 0 0 217,334 2,163 0 219,497230111TS DMV expenses 0 0 0 0 222,545 0 222,545230112TS DMV expenses Subtotal Total
0 0 0 0 0 228,251 228,251198,206 220,220 213,896 218,556 224,708 228,251 1,105,631
1,105,631198,206 220,220 213,896 218,556 224,708 228,251

DETAILED DATA
191
Thruway Authority, New York State PROJECTED APPROPRIATIONS AND DISBURSEMENTS BY PROGRAM
2008-2009 THROUGH 2012-2013 (thousands of dollars)
APPROPRIATIONS
Canal Development Program 55010516 Canal Development
Reappro- priations 2008-2009 2009-2010 2010-2011 2011-2012
3,299 0 0 0 0
2012-2013
0
Total2008-2013
055010616 Canal Development 4,000 0 0 0 0 0 055010716 Canal Development 2,000 0 0 0 0 0 055010816 Canal Development 0 2,000 0 0 0 0 2,00055010916 Canal Development 0 0 2,000 0 0 0 2,00055011016 Canal Development 0 0 0 2,000 0 0 2,00055011116 Canal Development 0 0 0 0 2,000 0 2,00055011216 Canal Development Subtotal Total
0 0 0 0 0 2,000 2,0009,299 2,000 2,000 2,000 2,000 2,000 10,0009,299 2,000 2,000 2,000 2,000 2,000 10,000
Thruway Authority, New York State
PROJECTED APPROPRIATIONS AND DISBURSEMENTS BY PROGRAM 2008-2009 THROUGH 2012-2013
(thousands of dollars) DISBURSEMENTS
Estimated Total
2007-2008 2008-2009 2009-2010 2010-2011 2011-2012 2012-2013 2008-2013Canal Development Program 55010516 Canal Development
0 0 0 0 0 0 0
55010616 Canal Development 0 0 0 0 0 0 055010716 Canal Development 1,734 0 0 0 0 29 2955010816 Canal Development 0 1,734 0 0 0 0 1,73455010916 Canal Development 0 0 1,804 0 0 0 1,80455011016 Canal Development 0 0 0 1,876 0 0 1,87655011116 Canal Development 0 0 0 0 1,951 0 1,95155011216 Canal Development Subtotal Total
0 0 0 0 0 2,000 2,0001,734 1,734 1,804 1,876 1,951 2,029 9,3941,734 1,734 1,804 1,876 1,951 2,029 9,394

DETAILED DATA
192
Metropolitan Transportation Authority PROJECTED APPROPRIATIONS AND DISBURSEMENTS BY PROGRAM
2008-2009 THROUGH 2012-2013 (thousands of dollars)
APPROPRIATIONS Reappro-
priations 2008-2009 2009-2010 2010-2011 2011-2012 Metropolitan Transportation Authority 03310912 Fi-Adv Triborough Bridge Auth 36,000 0 0 0 0
2012-2013
0
Total2008-2013
0 Subtotal 36,000 0 0 0 0 0 0Urban and Commuter Mass Transportation
Bondable 26BA05MT 2005 GO Bond Act 193,923 0 0 0 0 0 026BA06MT 2005 GO Bond Act 297,000 0 0 0 0 0 026BA07MT 2005 GO Bond Act 352,000 0 0 0 0 0 026BA08MT 2005 GO Bond Act 0 487,000 0 0 0 0 487,00026BA09MT 2005 GO Bond Act 0 0 82,000 0 0 0 82,000 Subtotal 842,923 487,000 82,000 0 0 0 569,000 Total 878,923 487,000 82,000 0 0 0 569,000
Metropolitan Transportation Authority
PROJECTED APPROPRIATIONS AND DISBURSEMENTS BY PROGRAM 2008-2009 THROUGH 2012-2013
(thousands of dollars) DISBURSEMENTS
Estimated
2007-2008 2008-2009 2009-2010 2010-2011 2011-2012 Metropolitan Transportation Authority 03310912 Fi-Adv Triborough Bridge Auth 0 0 0 0 0
2012-2013
0
Total2008-2013
0 Subtotal 0 0 0 0 0 0 0Urban and Commuter Mass Transportation
Bondable 26BA05MT 2005 GO Bond Act 46,400 69,600 46,400 8,322 0 0 124,32226BA06MT 2005 GO Bond Act 29,700 59,400 89,100 59,400 29,700 29,000 266,60026BA07MT 2005 GO Bond Act 17,600 35,200 70,400 105,600 70,400 50,000 331,60026BA08MT 2005 GO Bond Act 0 24,350 48,700 97,400 146,100 150,000 466,55026BA09MT 2005 GO Bond Act 0 0 4,100 8,200 16,400 33,600 62,300 Subtotal 93,700 188,550 258,700 278,922 262,600 262,600 1,251,372
1,251,372 Total 93,700 188,550 258,700 278,922 262,600 262,600

DETAILED DATA
Environmental Conservation, Department of PROJECTED APPROPRIATIONS AND DISBURSEMENTS BY PROGRAM
2008-2009 THROUGH 2012-2013 (thousands of dollars)
APPROPRIATIONS Reappro-
priations 2008-2009 2009-2010 2010-2011 2011-2012 96 Clean Water/Air Bond Act Fund 09019710 96 Clean Water Clean Air Bond Act F 454,744 0 0 0 0
2012-2013
0
Total2008-2013
0 Subtotal 454,744 0 0 0 0 0 0Administration 096291H4 Hudson River Interpretive Center 140 0 0 0 0 0 0096293H4 Hudson River Interpretive Center 35 0 0 0 0 0 0096391H4 Hudson River Interpretive Center 140 0 0 0 0 0 0096393H4 Hudson River Interpretive Center 35 0 0 0 0 0 009CS0450 Information Systems 0 0 0 0 0 0 009CS0550 Information Systems 2,670 0 0 0 0 0 009CS0650 Information System 3,000 0 0 0 0 0 009CS0750 Information System 2,000 0 0 0 0 0 009CS0850 Information System 0 3,500 0 0 0 0 3,50009CS0950 Information System - Future 0 0 2,000 0 0 0 2,00009CS1050 Information System - Future 0 0 0 2,000 0 0 2,00009CS1150 Information System - Future 0 0 0 0 2,000 0 2,00009CS1250 Information System - Future 0 0 0 0 0 2,000 2,00009ED0250 Education Camps And Centers Improve 0 0 0 0 0 0 009ED0350 Education Camps and Centers Improve 0 0 0 0 0 0 009ED0450 Education Camps and Centers Improve 0 0 0 0 0 0 009ED0550 Education Camps and Centers Improve 0 0 0 0 0 0 009ED0650 Education Camps and Centers Improve 101 0 0 0 0 0 009ED0750 Education Camps and Centers Improve 588 0 0 0 0 0 009ED0850 Education Camps and Centers Improve 0 600 0 0 0 0 60009ED0950 Admin Future 0 0 2,000 0 0 0 2,00009ED1050 Admin Future 0 0 0 2,000 0 0 2,00009ED1150 Admin Future 0 0 0 0 2,000 0 2,00009ED1250 Admin Future 0 0 0 0 0 2,000 2,000 Subtotal 8,709 4,100 4,000 4,000 4,000 4,000 20,100Air Resources 00319055 St Shar-Municpal Air Qualty Im 342 0 0 0 0 0 000319455 St Shar Municpal Air Qualty Im 1 0 0 0 0 0 000320655 St Shar-Municpal Air Qualty Im 2 0 0 0 0 0 000333755 Air Quality Improvement 2 0 0 0 0 0 002878655 Air Quality Impr Project 8 0 0 0 0 0 009029255 Delmar Incinerator 168 0 0 0 0 0 009048955 Air Quality Improvement Projects 456 0 0 0 0 0 009078455 Municipal Air Quality 2,149 0 0 0 0 0 009159555 Modernize Air Quality Equip 55 0 0 0 0 0 009308455 State Share 833 0 0 0 0 0 009720255 EQBA State Facility Air Quality 5,810 0 0 0 0 0 009A18755 Air Quaility Improvement Proj (EQBA 528 0 0 0 0 0 009BA0055 96 Bond Act - Air Quality 2,793 0 0 0 0 0 009BA0155 96 Bond Act - Air Quality 3,902 0 0 0 0 0 009BA0255 96 Bond Act - Air Quality 4,839 0 0 0 0 0 009BA9755 96 Bond Act - Air Quality 21,297 0 0 0 0 0 009BA9855 96 Bond Act - Air Quality 3,121 0 0 0 0 0 009BA9955 96 Bond Act - Air Quality 5,193 0 0 0 0 0 009MO0055 Clean Air-Mobile Source 336 0 0 0 0 0 009MO0155 Clean Air-Mobile 370 0 0 0 0 0 009MO0255 Clean Air - Mobile Source 2,648 0 0 0 0 0 009MO9955 Clean Air - Mobile Source 266 0 0 0 0 0 009OP9855 Operating Permit - New 1,000 0 0 0 0 0 0 Subtotal 56,119 0 0 0 0 0 0Clean Water Clean Air Implementation 09BA04WI Bond Act Implementation Staffing 1,591 0 0 0 0 09BA05WI Bond Act Implementation Staffing 1,348 0 0 0 0 09BA06WI Bond Act Implementation Staffing 1,050 0 0 0 0 09BA07WI Bond Act Implementation Staffing 1,050 0 0 0 0 09BA08WI Bond Act Implementation Staffing 0 1,050 0 0 0
00000
0000
1,050 Subtotal 5,039 1,050 0 0 0 0 1,050Clean Water/Clean Air 96 09BA00W5 96 Bond Act - Env Restoration 5,653 0 0 0 0 0 009BA01W5 96 Bond Act - Env Restoration 23,152 0 0 0 0 0 009BA02W5 96 Bond Act - Environmental Restora 68,960 0 0 0 0 0 009BA96W5 96 Bond Act-Environmental Restorati 11,876 0 0 0 0 0 009BA97W5 96 Bond Act - Environmental Restora 20,000 0 0 0 0 0 009BA98W5 96 Bond Act - Environmental Restora 9,469 0 0 0 0 0 009BA99W5 96 Bond Act Env Restoration 5,306 0 0 0 0 0 0 Subtotal 144,416 0 0 0 0 0 0Environment and Recreation 09AN07ER Non-Point Source - Agricultural 12,833 0 0 0 0 0 009AN08ER Non-Point Source - Agricultural 0 13,000 0 0 0 0 13,00009AP07ER Albany Pine Bush Preserve Commissio 2,000 0 0 0 0 0 009AP08ER Albany Pine Bush Preserve Commissio 0 2,000 0 0 0 0 2,000
193

DETAILED DATA
194
Environmental Conservation, Department of PROJECTED APPROPRIATIONS AND DISBURSEMENTS BY PROGRAM
2008-2009 THROUGH 2012-2013 (thousands of dollars)
APPROPRIATIONS Reappro-
priations 2008-2009 2009-2010 2010-2011 2011-2012 09AQ08ER Environmental Justice Air Quality 0 3,000 0 0 0
2012-2013Total
2008-20130 3,000
09AW08ER Agricultural Waste Management 0 350 0 0 0 0 35009BC07ER BCERF 450 0 0 0 0 0 009BD07ER Biodiversity Stewardship 1,500 0 0 0 0 0 009BD08ER Biodiversity Stewardship 0 1,500 0 0 0 0 1,50009CC08ER Catskill Interpretive Center 0 1,000 0 0 0 0 1,00009E200ER Solid Waste 00 4,064 0 0 0 0 0 009E202ER EPF Solid Waste 2,020 0 0 0 0 0 009E203ER EPF - Solid Waste 5,108 0 0 0 0 0 009E204ER EPF - Solid Waste 9,449 0 0 0 0 0 009E205ER EPF - Solid Waste 15,395 0 0 0 0 0 009E206ER EPF - Solid Waste 23,173 0 0 0 0 0 009E296ER Solid & Hazardous Materials 718 0 0 0 0 0 009E297ER Solid & Hazardous Materials 2,377 0 0 0 0 0 009E298ER Solid Waste Account 2,974 0 0 0 0 0 009E299ER Solid Waste 99 2,263 0 0 0 0 0 009E300ER Parks 00 11,000 0 0 0 0 0 009E302ER EPF Parks 14,072 0 0 0 0 0 009E303ER EPF - Parks and Rec 20,312 0 0 0 0 0 009E304ER EPF - Parks and Rec 25,914 0 0 0 0 0 009E305ER EPF - Parks and Rec 33,106 0 0 0 0 0 009E306ER EPF - Parks & Rec 70,281 0 0 0 0 0 009E396ER Parks, Rec & Historic Preservation 2,397 0 0 0 0 0 009E397ER Parks, Rec, & Historic Preservation 12,715 0 0 0 0 0 009E398ER Parks Account 4,204 0 0 0 0 0 009E399ER Parks 99 11,500 0 0 0 0 0 009E400ER Open Space 00 3,484 0 0 0 0 0 009E402ER EPF Open Space 9,420 0 0 0 0 0 009E496ER Open Space Account 362 0 0 0 0 0 009E497ER Open Space Account 365 0 0 0 0 0 009E498ER Open Space Account 415 0 0 0 0 0 009E499ER Open Space 99 2,609 0 0 0 0 0 009E603ER EPF - Land Acquisition 13,060 0 0 0 0 0 009E604ER EPF - Open Space 26,376 0 0 0 0 0 009E605ER EPF - Land Acquisition & Open Space 32,694 0 0 0 0 0 009E606ER EPF - Land Acquisition 83,029 0 0 0 0 0 009EP09ER EPF - Future 0 0 300,000 0 0 0 300,00009EP10ER EPF - Future 0 0 0 300,000 0 0 300,00009EP11ER EPF - Future 0 0 0 0 300,000 0 300,00009EP12ER EPF - Future 0 0 0 0 0 300,000 300,00009FL07ER Finger Lakes/Lake Ontario Watershed 2,300 0 0 0 0 0 009FL08ER Finger Lakes/Lake Ontario Watershed 0 2,300 0 0 0 0 2,30009FP07ER County Agriculture/Farmland Protect 28,000 0 0 0 0 0 009FP08ER County Agriculture/Farmland Protect 0 30,000 0 0 0 0 30,00009GL07ER Oceans and Great Lakes Initiative 4,000 0 0 0 0 0 009GL08ER Oceans and Great Lakes Initiative 0 4,000 0 0 0 0 4,00009HE07ER Hudson River Estuary Management Pla 4,668 0 0 0 0 0 009HE08ER Hudson River Estuary Management Pla 0 6,500 0 0 0 0 6,50009HR07ER Hudson River Park 5,000 0 0 0 0 0 009IS07ER Invasive Species 4,995 0 0 0 0 0 009IS08ER Invasive Species 0 4,000 0 0 0 0 4,00009LA07ER Land Acquisition 55,000 0 0 0 0 0 009LA08ER Land Acquisition 0 66,000 0 0 0 0 66,00009LC07ER Non-hazardous landfill closure 3,000 0 0 0 0 0 009LC08ER Non-hazardous landfill closure 0 2,000 0 0 0 0 2,00009LP07ER Long Island Central Pine Barrens 1,100 0 0 0 0 0 009LP08ER Long Island Central Pine Barrens 0 1,100 0 0 0 0 1,10009MP07ER Municipal Parks 21,225 0 0 0 0 0 009MP08ER Municipal Parks 0 21,225 0 0 0 0 21,22509MR07ER Municipal waste reduction/recycling 9,825 0 0 0 0 0 009MR08ER Municipal waste reduction/recycling 0 10,825 0 0 0 0 10,82509NP07ER Non-Point Source - Non-Agricultural 6,417 0 0 0 0 0 009NP08ER Non-Point Source - Non-Agricultural 0 6,500 0 0 0 0 6,50009NR08ER Niagara River Greenway Commission 0 150 0 0 0 0 15009PD07ER Pesticides program 2,025 0 0 0 0 0 009PD08ER Pesticides program 0 2,025 0 0 0 0 2,02509PP07ER Pollution Prevention Institute 2,000 0 0 0 0 0 009PP08ER Pollution Prevention Institute 0 4,000 0 0 0 0 4,00009QC08ER Hud-Ful-Champ Quad Commission 0 3,000 0 0 0 0 3,00009RD07ER Natural Resource Damages 1,300 0 0 0 0 0 009RD08ER Natural Resource Damages 0 1,500 0 0 0 0 1,50009SE07ER Long Island South Shore Estuary Res 900 0 0 0 0 0 009SE08ER Long Island South Shore Estuary Res 0 900 0 0 0 0 90009SG07ER Smart Growth 2,000 0 0 0 0 0 009SG08ER Smart Growth 0 2,500 0 0 0 0 2,50009SM07ER Secondary materials marketing 8,750 0 0 0 0 0 009SM08ER Secondary materials marketing 0 8,750 0 0 0 0 8,750

DETAILED DATA
195
Environmental Conservation, Department of PROJECTED APPROPRIATIONS AND DISBURSEMENTS BY PROGRAM
2008-2009 THROUGH 2012-2013 (thousands of dollars)
APPROPRIATIONS Reappro-
priations 2008-2009 2009-2010 2010-2011 2011-2012 09SO08ER Renewable Energy - Solar Initiative 0 2,000 0 0 0
2012-2013Total
2008-20130 2,000
09ST07ER Public Access & Stewardship 22,247 0 0 0 0 0 009ST08ER Public Access & Stewardship 0 5,000 0 0 0 0 5,00009SW07ER Soil and Water Conservation Distric 3,000 0 0 0 0 0 009SW08ER Soil and Water Conservation Distric 0 3,000 0 0 0 0 3,00009WQ07ER Water Quality Improvement Projects 10,000 0 0 0 0 0 009WQ08ER Water Quality Improvement Projects 0 10,000 0 0 0 0 10,00009WR07ER Local Waterfront Revitalization 26,625 0 0 0 0 0 009WR08ER Local Waterfront Revitalization 0 23,375 0 0 0 0 23,37509ZB07ER Zoos, Botanical Gardens, Aquaria 8,000 0 0 0 0 0 009ZB08ER Zoos, Botanical Gardens, Aquaria 0 8,500 0 0 0 0 8,50071E294ER Solid Waste Account 1,629 0 0 0 0 0 071E295ER Solid Waste Account 852 0 0 0 0 0 071E394ER Parks, Recreation & Historic Pres A 250 0 0 0 0 0 071E395ER Parks, Rec, & Hist Pres Account 581 0 0 0 0 0 071E494ER Open Space Account 19 0 0 0 0 0 071E495ER Open Space Account 175 0 0 0 0 Subtotal 697,522 250,000 300,000 300,000 300,000 Environmental Protection and Enhancements
0 0300,000 1,450,000
09E500EA Environmental Protection & Enhancem 2,111 0 0 0 0 0 009E502EA Epf Supplemental - Solid Waste 1,118 0 0 0 0 0 009E599EA Environmental Prot And Enhancements 49 0 0 0 0 0 009E602EA Epf Supplemental - Parks 9,129 0 0 0 0 0 009E699EA Environmental Prot And Enhancements 7,771 0 0 0 0 0 009E702EA Epf Supplemental - Open Space 8,095 0 0 0 0 0 009E799EA Environmental Prot And Enhancements 48 0 0 0 0 Subtotal 28,321 0 0 0 0 Fish and Wildlife
0 00 0
09039154 Modernization Of Fish Hatcheries 0 0 0 0 0 0 009169654 Clean Vessel 0 0 0 0 0 0 009199754 Wetlands 1,069 0 0 0 0 0 009CV0154 Clean Vessel Act Pumpout Grant 0 0 0 0 0 0 009CV0254 Clean Vessel Pump Out Grant 225 0 0 0 0 0 009CV0354 Clean Vessel Pump Out Grant 0 0 0 0 0 0 009CV0454 Federal - Clean Vessel 600 0 0 0 0 0 009CV0554 Federal - Clean Vessel 600 0 0 0 0 0 009CV0754 Federal - Clean Vessel 600 0 0 0 0 0 009CV9954 Clean Vessel Act Pump Out Grant 0 0 0 0 0 0 009FA0354 Fishing Access 409 0 0 0 0 0 009FA0454 Fishing Access 48 0 0 0 0 0 009FW0954 Fish and Wildlife - Future 0 0 1,500 0 0 0 1,50009FW1054 Fish and Wildlife - Future 0 0 0 1,500 0 0 1,50009FW1154 Fish and Wildlife - Future 0 0 0 0 1,500 0 1,50009FW1254 Fish and Wildlife - Future 0 0 0 0 0 1,500 1,50009HE0054 Replacement Of Hatchery Equip 0 0 0 0 0 0 009HE0254 Fish Hatchery Maintenance 80 0 0 0 0 0 009HE0354 Fish Hatchery Improvements and Eq 267 0 0 0 0 0 009HE0454 Fish Hatchery Improvements 403 0 0 0 0 0 009HE0554 Fish Hatchery Improvements 293 0 0 0 0 0 009HE0654 Fish Hatchery Improvements 976 0 0 0 0 0 009HE0754 Fish Hatchery Improvements 1,000 0 0 0 0 0 009HE0854 Fish Hatchery Improvements 0 1,000 0 0 0 0 1,00009HR9454 Hudson River Habitat Resoration Fun 351 0 0 0 0 0 009WL0054 Wetlands - Federal 0 0 0 0 0 0 009WL9854 Federal Wetlands Grant 400 0 0 0 0 Subtotal 7,321 1,000 1,500 1,500 1,500 Lands and Forests
0 01,500 7,000
00319153 Land Acq&Develop-Preserv&Resto 0 0 0 0 0 0 000319553 Land Acq&Develop-Preserv&Resto 0 0 0 0 0 0 000320753 Land Acq&Develop Preserv&Resto 0 0 0 0 0 0 001386153 Land Preservation & Improvemen 0 0 0 0 0 0 001386953 Land Preservation & Improvemen 0 0 0 0 0 0 002345153 Lands Pres & Imp 0 0 0 0 0 0 009038553 Land Acquisition(EQBA) 0 0 0 0 0 0 009168953 Edgewood Demolition 891 0 0 0 0 0 009668753 Edgewood Property Demolition Of The 2,246 0 0 0 0 0 009708753 1986 EQBA Land Preservation And Imp 0 0 0 0 0 0 009720253 EQBA Land Preservation 28 0 0 0 0 0 009999153 Acquisition Of Forest Preserve Land 0 0 0 0 0 0 009999353 Acquisition Of Forest Preserve Land 90 0 0 0 0 0 009999653 Acquisition Of Forest Preserve Land 20 0 0 0 0 0 009A88753 Land Acquisition(EQBA) 321 0 0 0 0 0 009AA0053 Court Of Claims 1,000 0 0 0 0 0 009AA0753 Court of Claims 4,300 0 0 0 0 0 009AA9353 Court Of Claims 2,792 0 0 0 0 0 009AA9453 Court Of Claims 0 0 0 0 0 0 0

DETAILED DATA
196
Environmental Conservation, Department of PROJECTED APPROPRIATIONS AND DISBURSEMENTS BY PROGRAM
2008-2009 THROUGH 2012-2013 (thousands of dollars)
APPROPRIATIONS Reappro-
priations 2008-2009 2009-2010 2010-2011 2011-2012 09AA9953 Court Of Claims 4,700 0 0 0 0
2012-2013Total
2008-20130 0
09FL0353 Federal - Forest Legacy Land Acq. 0 0 0 0 0 0 009FL0453 Federal - Forest Legacy Land Acq. 0 0 0 0 0 0 009FL0553 Federal - Forest Legacy Land Acq. 2,000 0 0 0 0 0 009FL0653 Federal - Forest Legacy Land Acq. 1,000 0 0 0 0 0 009FL0753 Federal - Forest Legacy Land Acq. 2,000 0 0 0 0 0 009FL0853 Federal - Forest Legacy Land Acq. 0 2,000 0 0 0 0 2,00009GC0453 Green Certification 91 0 0 0 0 0 009GC0653 Green Certification 51 0 0 0 0 0 009IS0753 Invasive Species 100 0 0 0 0 0 009IS0853 Invasive Species 0 50 0 0 0 0 5009IT0153 State Share Of Istea 1,943 0 0 0 0 0 009IT9453 State Share Istea 224 0 0 0 0 0 009LF0953 Lands and Forests - Future 0 0 1,500 0 0 0 1,50009LF1053 Lands and Forests - Future 0 0 0 1,500 0 0 1,50009LF1153 Lands and Forests - Future 0 0 0 0 1,500 0 1,50009LF1253 Lands and Forests - Future 0 0 0 0 0 1,500 1,50009MP0353 Unit Management Plans 0 0 0 0 0 0 009MP0653 Unit Management Plans 80 0 0 0 0 0 009MP0753 Unit Management Plans 228 0 0 0 0 0 009MP0853 Unit Management Plans 0 350 0 0 0 0 35009PS0353 Public Safety Equipment 0 0 0 0 0 0 009PS0453 Public Safety Equipment 0 0 0 0 0 0 009PS0553 Public Safety Equipment 625 0 0 0 0 0 009PS0653 Public Safety Equipment 728 0 0 0 0 0 009PS0753 Public Safety Equipment 100 0 0 0 0 0 009PS0853 Public Safety Equipment 0 400 0 0 0 0 40009SW0153 Stewardship 0 0 0 0 0 0 009SW0353 Stewardship 0 0 0 0 0 0 009SW0453 Stewardship 151 0 0 0 0 0 009SW0553 Stewardship 227 0 0 0 0 0 009SW0653 Stewardship 520 0 0 0 0 0 009SW0753 Stewardship 600 0 0 0 0 0 009SW0853 Stewardship 0 900 0 0 0 Subtotal 27,056 3,700 1,500 1,500 1,500 Marine Resources
0 9001,500 9,700
09MR00A1 Misc Marine - Federal 528 0 0 0 0 0 009MR01A1 Misc Marine - Federal 0 0 0 0 0 0 009MR02A1 Marine Resources Federal 1,650 0 0 0 0 0 009MR03A1 Federal Marine Resources 3,000 0 0 0 0 0 009MR04A1 Federal - Marine Resources 3,750 0 0 0 0 0 009MR08A1 Federal - Marine Resources 0 4,000 0 0 0 0 4,00009MR95A1 Marine Grants 0 0 0 0 0 0 009MR97A1 Misc Marine 542 0 0 0 0 Subtotal 9,470 4,000 0 0 0 Operations 09431051 Financial Security Projects 0 0 0 2,000 0
0 00 4,000
0 2,00009439451 Financial Security Projects 1,221 0 0 0 0 0 009440751 Natural Resource Damages 26,000 0 0 0 0 0 009449451 Natural Resource Damages 5,056 0 0 0 0 0 009DF0651 DEC New Facilities 574 0 0 0 0 0 009DF0751 DEC New Facilities 250 0 0 0 0 0 009DF0851 DEC New Facilities 0 450 0 0 0 0 45009DS0351 Dam Safety - Demo of Unsafe Structu 0 0 0 0 0 0 009DS0451 Dam Safety - Demo of Unsafe Structu 0 0 0 0 0 0 009DS0651 Dam Safety 0 0 0 0 0 0 009DS0751 Dam Safety 2,000 0 0 0 0 0 009DS0851 Dam Safety 0 2,000 0 0 0 0 2,00009EC0051 Environmental Compliance 0 0 0 0 0 0 009EC0151 Environmental Compliance 0 0 0 0 0 0 009EC0251 Environmental Compliance 0 0 0 0 0 0 009EQ0451 Equipment Large/Small 0 0 0 0 0 0 009EQ0551 Equipment Large/Small 0 0 0 0 0 0 009EQ0651 Equipment Large/Small 1,549 0 0 0 0 0 009EQ0751 Equipment Large/Small 4,850 0 0 0 0 0 009EQ0851 Equipment Large/Small 0 4,500 0 0 0 0 4,50009GB0351 Green Building Exec Order #111 0 0 0 0 0 0 009GB0451 Green Building Exec Order #111 0 0 0 0 0 0 009GB0551 Green Building Exec Order #111 0 0 0 0 0 0 009HD0351 GF Capital Bonding 11,000 0 0 0 0 0 009HD0451 GF Capital Bonding 10,729 0 0 0 0 0 009HD0551 GF Capital Bonding 11,000 0 0 0 0 0 009HD0651 GF Capital Bonding 12,000 0 0 0 0 0 009HD0751 GF Capital Bonding 12,000 0 0 0 0 0 009HD0851 GF Capital Bonding 0 12,000 0 0 0 0 12,00009HD0951 GF Capital Bonding - Future 0 0 12,000 0 0 0 12,000

DETAILED DATA
197
Environmental Conservation, Department of PROJECTED APPROPRIATIONS AND DISBURSEMENTS BY PROGRAM
2008-2009 THROUGH 2012-2013 (thousands of dollars)
APPROPRIATIONS Reappro-
priations 2008-2009 2009-2010 2010-2011 2011-2012 09HD1051 GF Capital Bonding - Future 0 0 0 12,000 0
2012-2013Total
2008-201312,0000
09HD1151 GF Capital Bonding - Future 0 0 0 0 12,000 0 12,00009HD1251 GF Capital Bonding - Future 0 0 0 0 0 12,000 12,00009R30051 Region 3 Offices 0 0 0 0 0 0 009R30103 Region 3 Offices 1,436 0 0 0 0 0 009R30203 Region 3 Office Building 2,133 0 0 0 0 0 009R50303 Region 5 Office Improvements 0 0 0 0 0 0 009RI0351 Rehabilitation And Improvements 0 0 0 0 0 0 009RI0451 Rehabilitation And Improvements 0 0 0 0 0 0 009RI0551 Rehabilitation and Improvements 1,307 0 0 0 0 0 009RI0651 Rehabilitation and Improvements 6,269 0 0 0 0 0 009RI0751 Rehabilitation and Improvements 10,986 0 0 0 0 0 009RI0851 Rehabilitation and Improvements 0 11,400 0 0 0 0 11,40009RI0951 Operations - Future 0 0 15,000 0 0 0 15,00009RI1051 Operations - Future 0 0 0 15,000 0 0 15,00009RI1151 Operations - Future 0 0 0 0 15,000 0 15,00009RI1251 Operations - Future 0 0 0 0 0 15,000 15,00009SF0451 State/Federal Compliance 0 0 0 0 0 0 009SF0551 State/Federal Compliance 4,658 0 0 0 0 0 009SF0651 State/Fed Comp, Exec Ord 111, Env D 1,656 0 0 0 0 0 009SF0751 State/Fed Comp, Exec Ord 111, Env D 3,000 0 0 0 0 0 009SF0851 State/Fed Comp, Exec Ord 111, Env D 0 3,000 0 0 0 Subtotal 129,674 33,350 27,000 29,000 27,000 Recreation
0 3,00027,000 143,350
09BL0652 Belleayre Mtn - new lodge 5,427 0 0 0 0 0 009CM0252 Campground Maintenance 0 0 0 0 0 0 009CM0352 Campground Maintenance 192 0 0 0 0 0 009CM0452 Campground Maintenance 139 0 0 0 0 0 009CM0552 Campground Maintenance 193 0 0 0 0 0 009CM0652 Campground Maintenance 793 0 0 0 0 0 009CM0752 Campground Maintenance 1,000 0 0 0 0 0 009CM0852 Campground Maintenance 0 1,000 0 0 0 0 1,00009LS0652 Lift and Trail Safety 0 0 0 0 0 0 009LS0752 Lift and Trail Safety 500 0 0 0 0 0 009LS0852 Lift and Trail Safety 0 500 0 0 0 0 50009RE0952 Recreation - Future 0 0 1,325 0 0 0 1,32509RE1052 Recreation - Future 0 0 0 1,325 0 0 1,32509RE1152 Recreation - Future 0 0 0 0 1,325 Subtotal 8,244 1,500 1,325 1,325 1,325 Solid and Hazardous Waste Management 090387F7 Hazardous Site Remediation Through 0 0 0 0 0
0 1,3250 5,475
0 009079606 Remedial Activities At State Facili 0 0 0 0 0 0 009079706 Remedial Activities 0 0 0 0 0 0 0091691F7 Remedial Activities At Various Site 7,603 0 0 0 0 0 0091895F7 Haz Waste Remediation Advance 2,401 0 0 0 0 0 009279156 Landfill Closure Grant Program 4,401 0 0 0 0 0 0094388F7 Remedial Projects Settlements 1,192 0 0 0 0 0 0095390F7 Remedial Activities At Various Site 9,355 0 0 0 0 0 0095489F7 Remedial Actions Statewide 2,308 0 0 0 0 0 009578756 Landfill Closures-Loans 0 0 0 0 0 0 0095887F7 1986 Solid Waste Environmental Qual 2,901 0 0 0 0 0 009928856 Local Solid Waste Grants 0 0 0 0 0 0 009AD04F7 Hazardous Waste - Advance 24,991 0 0 0 0 0 009AD08F7 Hazardous Waste - Advance 0 10,000 0 0 0 0 10,00009AD98F7 Hazardous Waste Advance 4,393 0 0 0 0 0 009AD99F7 Hazardous Waste Advance 16,120 0 0 0 0 0 009BA07F7 HWRF - Oversight and Assessment - B 12,750 0 0 0 0 0 009BA08F7 HWRF - Oversight and Assessment - B 0 12,750 0 0 0 0 12,75009BC05F7 Brownfields - Oversight & Assessmen 2,072 0 0 0 0 0 009BC06F7 HWRF - Oversight and Assesment 3,709 0 0 0 0 0 009BC07F7 HWRF - Oversight and Assessment 8,352 0 0 0 0 0 009BC08F7 HWRF - Oversight and Assessment 0 10,275 0 0 0 0 10,27509HB03F7 HWRF - Cleanup 32,451 0 0 0 0 0 009HB04F7 HWRF - Cleanup 110,300 0 0 0 0 0 009HB05F7 HWRF - Cleanup 85,767 0 0 0 0 0 009HB06F7 HWRF - Cleanup 103,820 0 0 0 0 0 009HB07F7 HWRF - Cleanup 117,642 0 0 0 0 0 009HB08F7 HWRF - Cleanup 0 120,000 0 0 0 0 120,00009HB09F7 HWRF - Cleanup 0 0 120,000 0 0 0 120,00009HB10F7 HWRF - Cleanup 0 0 0 120,000 0 0 120,00009HB11F7 HWRF - Cleanup 0 0 0 0 120,000 0 120,00009HB12F7 HWRF - Cleanup 0 0 0 0 0 120,000 120,00009HT03F7 HWRF - Oversight and Assesment 14,175 0 0 0 0 0 009HT04F7 HWRF - Oversight and Assesment 14,979 0 0 0 0 0 009HT05F7 HWRF - Oversight and Assesment 15,000 0 0 0 0 0 009HT06F7 HWRF - Oversight and Assesment 15,000 0 0 0 0 0 0

DETAILED DATA
198
Environmental Conservation, Department of PROJECTED APPROPRIATIONS AND DISBURSEMENTS BY PROGRAM
2008-2009 THROUGH 2012-2013 (thousands of dollars)
APPROPRIATIONS Reappro-
priations 2008-2009 2009-2010 2010-2011 2011-2012 09HT09F7 HWRF - Oversight and Assessment 0 0 15,000 0 0
2012-2013Total
2008-201315,0000
09HT10F7 HWRF - Oversight and Assesment 0 0 0 15,000 0 0 15,00009HT11F7 HWRF - Oversight and Assessment 0 0 0 0 15,000 0 15,00009HT12F7 HWRF - Oversight and Assessment 0 0 0 0 0 15,000 15,00009HW92F7 Remedial Activities At Various Site 23,792 0 0 0 0 0 009HW93F7 Remedial Activities At Various Site 14,230 0 0 0 0 0 009HW94F7 Remedial Activities At Various Site 11,129 0 0 0 0 0 009HW95F7 Haz Waste Remediation 1,208 0 0 0 0 0 009HW96F7 Remedial Activities 10,245 0 0 0 0 0 009HW97F7 Remedial Activities 1,211 0 0 0 0 0 009HW98F7 Remedial Activities 2,390 0 0 0 0 0 009HW99F7 Haz Waste Remediation 3,638 0 0 0 0 0 009KP06F7 Smithtown/Kings Park Psychiatric Ce 25,000 0 0 0 0 0 009RS0456 Remediate State Owned Facilities 1,501 0 0 0 0 0 009TG07F7 HWRF - Oversight and Assessment - T 2,250 0 0 0 0 0 009TG08F7 HWRF - Oversight and Assessment - T 0 2,250 0 0 0 Subtotal 708,276 155,275 135,000 135,000 135,000 Solid Waste Management 00319256 St Shar-Municpal Solid Waste M 910 0 0 0 0
0 2,250135,000 695,275
0 000319656 St Shar-Municpal Solid Waste 0 0 0 0 0 0 000320856 St Share Municpal Solid Waste 3,675 0 0 0 0 0 000324956 Fi Municipal Solid Waste 0 0 0 0 0 0 000330956 Solid Waste Management 352 0 0 0 0 0 000333856 Solid Waste Management 0 0 0 0 0 0 001371610 Pay CCf-Environment Qual Projs 1,269 0 0 0 0 0 0028789F7 Fed Share Clean Up Haz Wst. 8,229 0 0 0 0 0 0090486F7 Remedial Action At Selected Sites W 9,577 0 0 0 0 0 009108556 Resource Recovery Projects 2,625 0 0 0 0 0 0091884F7 State Settlements 1,271 0 0 0 0 0 009720256 EQBA Solid Waste 1,481 0 0 0 0 0 009728856 Resource Recovery Projects 15 0 0 0 0 0 009A58956 Resource Recovery Brookhaven 1,142 0 0 0 0 0 009BA0056 96 Bond Act - Solid Waste 1,215 0 0 0 0 0 009BA0156 96 Bond Act - Solid Waste 2,198 0 0 0 0 0 009BA9656 96 Bond Act-Solid Waste 4,621 0 0 0 0 0 009BA9756 96 Bond Act - Solid Waste 1,928 0 0 0 0 0 009BA9856 96 Bond Act - Solid Waste 1,678 0 0 0 0 0 009BA9956 96 Bond Act - Solid Waste 3,059 0 0 0 0 0 009D18656 Low Tech Project 469 0 0 0 0 0 009EX0256 Essex County - Future 0 0 0 0 0 0 009EX0356 Adirondack Landfills 279 0 0 0 0 0 009EX0456 Adirondack Landfills 489 0 0 0 0 0 009EX0556 Essex County 495 0 0 0 0 0 009EX0656 Essex County 495 0 0 0 0 0 009EX0756 Essex County 400 0 0 0 0 0 009EX0956 Essex County - Future 0 0 300 0 0 0 30009EX1056 Essex County - Future 0 0 0 300 0 0 30009EX1156 Essex County - Future 0 0 0 0 300 0 30009EX1256 Essex County - Future 0 0 0 0 0 300 30009FS04F7 Federal - Hazardous Waste 9,348 0 0 0 0 0 009FS99F7 Fed Share Hazardous Waste 7,063 0 0 0 0 0 009MT0001 Mohawk Tire 0 0 0 0 0 0 009RL0356 Rush Landfill Post Closure 0 0 0 0 0 0 009RL0556 Rush Landfill 201 0 0 0 0 0 009RL0656 Rush Landfill 320 0 0 0 0 0 009RL0756 Rush Landfill 350 0 0 0 0 0 009RL0856 Rush Landfill 0 50 0 0 0 0 5009RL0956 Rush Landfill - Future 0 0 375 0 0 0 37509RL1056 Rush Landfill - Future 0 0 0 375 0 0 37509RL1156 Rush Landfill - Future 0 0 0 0 375 0 37509RL1256 Rush Landfill - Future 0 0 0 0 0 375 37571059210 Pay CCf -Environmental Quality Proj 32,525 0 0 0 0 0 071109210 Environmental Quality Bond Act Fund 104,178 0 0 0 0 0 071109310 Environmental Quality Bond Act Fund 0 0 0 0 0 Subtotal 201,857 50 675 675 675 Water Resources
0 0675 2,750
00318957 Constr Water Quality Imp Proj 0 0 0 0 0 0 000319357 Const Water Quality Imp Proj 0 0 0 0 0 0 000320557 Const Water Quality Imp Proj 460 0 0 0 0 0 001354910 Pure Waters Bond Fund 28,727 0 0 0 0 0 001385057 Pure Waters Sewage Treat Works 630 0 0 0 0 0 001385157 Pure Waters Sewage Treat Works 0 0 0 0 0 0 001385357 Pure Waters Sewage Treat Works 1,100 0 0 0 0 0 001385557 Water Quality Improvements 346 0 0 0 0 0 001385757 Fi Water Quality Improvements 415 0 0 0 0 0 001385957 Fi Water Quality Improvements 550 0 0 0 0 0 0

DETAILED DATA
199
Environmental Conservation, Department of PROJECTED APPROPRIATIONS AND DISBURSEMENTS BY PROGRAM
2008-2009 THROUGH 2012-2013 (thousands of dollars)
APPROPRIATIONS Reappro-
priations 2008-2009 2009-2010 2010-2011 2011-2012 01386257 Pure Waters 0 0 0 0 0
2012-2013Total
2008-20130 0
01386357 Water Quality Improvements 0 0 0 0 0 0 001387057 Water Quality Improvements 604 0 0 0 0 0 002403057 Water Quality Improvements Project 0 0 0 0 0 0 009009763 Dam Safety Projects 12 0 0 0 0 0 009019057 Partial Match Ffy 90 Grants 1,466 0 0 0 0 0 009019463 Shore Protection-Jones Inlet 328 0 0 0 0 0 009070163 Shore Protection Advance 932 0 0 0 0 0 009070963 Shore Protection - Advance Future 0 0 1,000 0 0 0 1,00009071063 Shore Protection Advance - Future 0 0 0 1,000 0 0 1,00009071163 Shore Protection Advance - Future 0 0 0 0 1,000 0 1,00009071263 Shore Protection Advance - Future 0 0 0 0 0 1,000 1,00009088957 Ffy 89 & 90 New Construction Grants 0 0 0 0 0 0 009089363 Coney Island Shore Protection 85 0 0 0 0 0 009099363 Coney Island Project Advance 280 0 0 0 0 0 009099763 Long Beach Storm 7,600 0 0 0 0 0 009109063 Westhampton Beach Interim Project-S 288 0 0 0 0 0 009168457 Water Quality Improvements Pwba 0 0 0 0 0 0 009168557 Harbor Drift Removal 3,272 0 0 0 0 0 009178457 Statewide Reserve 913 0 0 0 0 0 0091A9063 Westhampton Beach Interim Project L 318 0 0 0 0 0 009538757 EQBA Water Quality Improvement Proj 0 0 0 0 0 0 009539463 Jones Inlet 611 0 0 0 0 0 009548757 EQBA Water Quality Improvement Proj 0 0 0 0 0 0 009650257 PWBA Li CCmp 1,670 0 0 0 0 0 009650357 65 PWBA Water Quality 7,168 0 0 0 0 0 009650757 65 PWBA Water Quality 0 0 0 0 0 0 009650857 65 PWBA Water Quality 0 14,468 0 0 0 0 14,46809720257 72 EQBA Water Quality 4,244 0 0 0 0 0 009720357 72 EQBA Water Quality 275 0 0 0 0 0 009720757 72 EQBA Water Quality 0 0 0 0 0 0 009720857 72 EQBA Water Quality 0 327 0 0 0 0 32709799763 Flood Damage/Rehab 1,022 0 0 0 0 0 009A10063 Shore Protection - Advance 755 0 0 0 0 0 009A19463 I.I. So. Shore Inlets 680 0 0 0 0 0 009A19863 L.I North Shore Advance 0 0 0 0 0 0 009A29863 Jones Inlet Advance 210 0 0 0 0 0 009A29963 Various Shore Protection 783 0 0 0 0 0 009A39863 Various Shore Protection Advances 0 0 0 0 0 0 009A39963 Rockaway Beach Nourishment 63 0 0 0 0 0 009A49463 Evacuation Routes 1,072 0 0 0 0 0 009A49863 Shinnecock Advance 2,013 0 0 0 0 0 009A69463 Shore Monitoring 389 0 0 0 0 0 009A79463 Sand Bypass Asharoken, Lilco 366 0 0 0 0 0 009AD0263 Shore Protection Advance 1,310 0 0 0 0 0 009AD0363 Shore Protection Advance 830 0 0 0 0 0 009B20057 96 Bond Act - Add Clean Water 3,610 0 0 0 0 0 009B29757 96 Bond Act-Additional Clean Water 847 0 0 0 0 0 009B29857 96 Bond Act -Clean Water Other 3,324 0 0 0 0 0 009B29957 96 Bond Act- Additional Clean Water 4,348 0 0 0 0 0 009BA0057 96 Bond Act - Water Resources 42,362 0 0 0 0 0 009BA0157 96 Bond Act - Water Resources 56,406 0 0 0 0 0 009BA0257 96 Bond Act - Water Resources 37,338 0 0 0 0 0 009BA9657 96 Bond Act - Clean Water 6,852 0 0 0 0 0 009BA9757 96 Bond Act - Clean Water 12,608 0 0 0 0 0 009BA9857 96 Bond Act - Clean Water 17,917 0 0 0 0 0 009BA9957 96 Bond Act - Clean Water 46,343 0 0 0 0 0 009BC0657 Bristol/Canandaigua Public Water Sy 1,200 0 0 0 0 0 009DA0657 Dam Safety - Advance 300 0 0 0 0 0 009DA0757 Dam Safety - Advance 350 0 0 0 0 0 009DS0163 Dam Safety 0 0 0 0 0 0 009EQ8857 EQBA Sewage Treatment Grants -
Lump 0 0 0 0 0 0 009FC0163 Flood Control - Federal Proj 748 0 0 0 0 0 009FC0263 Flood Control - Fed Projects 1,850 0 0 0 0 0 009FC0363 Flood Control - Fed Projects 2,359 0 0 0 0 0 009FD0763 Flood Control - Dam Safety 300 0 0 0 0 0 009FL0063 Flood Control 0 0 0 0 0 0 009FL0163 Various Flood Control 71 0 0 0 0 0 009FL0263 Various Flood Control 637 0 0 0 0 0 009FL0363 Various Flood Control 698 0 0 0 0 0 009FL0463 Flood Control 374 0 0 0 0 0 009FL0563 Flood Control 402 0 0 0 0 0 009FL0663 Flood Control 728 0 0 0 0 0 009FL0763 Flood Control 200 0 0 0 0 0 009FL0863 Flood Control 0 800 0 0 0 0 80009FP0563 Flood Plain Mapping 128 0 0 0 0 0 0

DETAILED DATA
200
Environmental Conservation, Department of PROJECTED APPROPRIATIONS AND DISBURSEMENTS BY PROGRAM
2008-2009 THROUGH 2012-2013 (thousands of dollars)
APPROPRIATIONS Reappro-
priations 2008-2009 2009-2010 2010-2011 2011-2012 2012-2013Total
2008-201309FP0663 Flood Plain Mapping 834 0 0 0 0 0 009FP0763 Flood Plain Mapping 834 0 0 0 0 0 009FP0863 Flood Plain Mapping 0 834 0 0 0 0 83409LB9763 Long Beach Storm Damage Protection 7,581 0 0 0 0 0 009LK0457 Onondaga Lake 1,917 0 0 0 0 0 009LK0557 Onondaga Lake 10,000 0 0 0 0 0 009LK0657 Onondaga Lake 10,000 0 0 0 0 0 009LK0757 Onondaga Lake 10,000 0 0 0 0 0 009LK0857 Onondaga Lake 0 10,000 0 0 0 0 10,00009LK0957 Onondaga Lake - Future 0 0 10,000 0 0 0 10,00009LK1057 Onondaga Lake - Future 0 0 0 5,000 0 0 5,00009NG0663 USGS Network Gages 0 0 0 0 0 0 009NG0763 USGS Network Gages 500 0 0 0 0 0 009NG0863 USGS Network Gages 0 500 0 0 0 0 50009P18857 NYS Priority List - 4 Projects 0 0 0 0 0 0 009P28857 Statewide Reserve Replacement 717 0 0 0 0 0 009RF0557 SRF State Match 16,943 0 0 0 0 0 009RF0657 SRF State Match 29,600 0 0 0 0 0 009RF0757 SRF State Match 29,600 0 0 0 0 0 009RF0857 SRF State Match 0 29,600 0 0 0 0 29,60009RF0957 SRF State Match - Future 0 0 30,000 0 0 0 30,00009RF1057 SRF State Match - Future 0 0 0 30,000 0 0 30,00009RF1157 SRF State Match - Future 0 0 0 0 30,000 0 30,00009RF1257 SRF State Match - Future 0 0 0 0 0 30,000 30,00009SF0557 SRF Federal 84,715 0 0 0 0 0 009SF0657 SRF Federal 148,000 0 0 0 0 0 009SF0757 SRF Federal 148,000 0 0 0 0 0 009SF0857 SRF Federal 0 148,000 0 0 0 0 148,00009SF0957 SRF Federal 0 0 150,000 0 0 0 150,00009SF1057 SRF Federal 0 0 0 150,000 0 0 150,00009SF1157 SRF Federal 0 0 0 0 150,000 0 150,00009SF1257 SRF Federal 0 0 0 0 0 150,000 150,00009W10063 Various Shore Projects 923 0 0 0 0 0 009W10163 Various Shore Protection 1,775 0 0 0 0 0 009W10263 Various Shore Protection 2,385 0 0 0 0 0 009W10363 Various Shore Protection 1,860 0 0 0 0 0 009W10463 Various Shore Protection 1,000 0 0 0 0 0 009W10563 Various Shore Protection 800 0 0 0 0 0 009W10663 Various Shore Protection 797 0 0 0 0 0 009W10863 Various Shore Protection 0 50 0 0 0 0 5009W19963 Various Shore Projects 74 0 0 0 0 0 009W29963 Rockaway Beach Nourishment 147 0 0 0 0 0 009W39863 Jones Inlet 490 0 0 0 0 0 009W49863 Shinnecock/L Construction 2,183 0 0 0 0 0 009W59863 Various Other Shore Protection Proj 119 0 0 0 0 0 009WA0963 Water - Future 0 0 8,000 0 0 0 8,00009WA1063 Water Resources - Future 0 0 0 8,000 0 0 8,00009WA1163 Water Resources - Future 0 0 0 0 8,000 0 8,00009WA1263 Water Resources - Future 0 0 0 0 0 8,000 8,00071139310 Pure Waters Bond Fund 0 0 0 0 0 0 0 Subtotal 825,881 204,579 199,000 194,000 189,000 189,000 975,579 Total 3,312,649 658,604 670,000 667,000 660,000
658,675 3,314,279

DETAILED DATA
201
Environmental Conservation, Department of PROJECTED APPROPRIATIONS AND DISBURSEMENTS BY PROGRAM
2008-2009 THROUGH 2012-2013 (thousands of dollars)
DISBURSEMENTS Estimated Total
2007-2008 2008-2009 2009-2010 2010-2011 2011-2012 2012-2013 2008-201396 Clean Water/Air Bond Act Fund 09019710 96 Clean Water Clean Air Bond Act F 0 0 0 0 0 Subtotal 0 0 0 0 0 Administration
0 00 0
096291H4 Hudson River Interpretive Center 0 0 0 0 0 0 0096293H4 Hudson River Interpretive Center 0 0 0 0 0 0 0096391H4 Hudson River Interpretive Center 0 0 0 0 0 0 0096393H4 Hudson River Interpretive Center 0 0 0 0 0 0 009CS0450 Information Systems 368 0 0 0 0 0 009CS0550 Information Systems 0 0 0 0 0 100 10009CS0650 Information System 50 100 100 100 25 50 37509CS0750 Information System 100 459 427 329 100 50 1,36509CS0850 Information System 0 300 200 200 100 250 1,05009CS0950 Information System - Future 0 0 300 200 200 200 90009CS1050 Information System - Future 0 0 0 300 200 100 60009CS1150 Information System - Future 0 0 0 0 300 0 30009CS1250 Information System - Future 0 0 0 0 0 0 009ED0250 Education Camps And Centers Improve 0 0 0 0 0 0 009ED0350 Education Camps and Centers Improve 20 0 0 0 0 0 009ED0450 Education Camps and Centers Improve 46 0 0 0 0 0 009ED0550 Education Camps and Centers Improve 33 0 0 0 0 0 009ED0650 Education Camps and Centers Improve 75 75 75 50 50 0 25009ED0750 Education Camps and Centers Improve 94 100 100 100 0 150 45009ED0850 Education Camps and Centers Improve 0 100 130 180 110 80 60009ED0950 Admin Future 0 0 400 0 0 200 60009ED1050 Admin Future 0 0 0 50 50 0 10009ED1150 Admin Future 0 0 0 0 500 0 50009ED1250 Admin Future 0 0 0 0 0 Subtotal 786 1,134 1,732 1,509 1,635 Air Resources
0 01,180 7,190
00319055 St Shar-Municpal Air Qualty Im 0 0 0 0 0 0 000319455 St Shar Municpal Air Qualty Im 0 0 0 0 0 0 000320655 St Shar-Municpal Air Qualty Im 0 0 0 0 0 0 000333755 Air Quality Improvement 0 0 0 0 0 0 002878655 Air Quality Impr Project 0 0 0 0 0 0 009029255 Delmar Incinerator 0 0 0 0 0 0 009048955 Air Quality Improvement Projects 0 0 0 0 0 0 009078455 Municipal Air Quality 0 0 0 0 0 0 009159555 Modernize Air Quality Equip 0 0 55 0 0 0 5509308455 State Share 0 0 0 0 0 0 009720255 EQBA State Facility Air Quality 0 0 0 0 0 0 009A18755 Air Quaility Improvement Proj (EQBA 0 0 0 0 0 0 009BA0055 96 Bond Act - Air Quality 1,000 102 0 0 691 1,000 1,79309BA0155 96 Bond Act - Air Quality 1,000 1,000 0 0 902 1,000 2,90209BA0255 96 Bond Act - Air Quality 1,000 2,000 0 0 1,818 21 3,83909BA9755 96 Bond Act - Air Quality 4,026 4,008 4,100 3,154 1,375 4,634 17,27109BA9855 96 Bond Act - Air Quality 902 992 32 0 0 1,000 2,02409BA9955 96 Bond Act - Air Quality 1,000 500 1,100 1,000 1,588 543 4,73109MO0055 Clean Air-Mobile Source 0 0 0 0 0 0 009MO0155 Clean Air-Mobile 0 0 0 0 0 0 009MO0255 Clean Air - Mobile Source 0 0 0 0 0 0 009MO9955 Clean Air - Mobile Source 0 0 0 0 0 0 009OP9855 Operating Permit - New 0 0 0 0 0 Subtotal 8,928 8,602 5,287 4,154 6,374 Clean Water Clean Air Implementation 09BA04WI Bond Act Implementation Staffing 0 0 0 0 0 09BA05WI Bond Act Implementation Staffing 0 0 0 0 0 09BA06WI Bond Act Implementation Staffing 0 0 0 0 0 09BA07WI Bond Act Implementation Staffing 0 0 0 0 0 09BA08WI Bond Act Implementation Staffing 0 0 0 0 0 Subtotal 0 0 0 0 0 Clean Water/Clean Air 96 09BA00W5 96 Bond Act - Env Restoration 1,000 660 1,200 2,200 1,063
0 08,198 32,615
00000
00000
0 0
0 5,12309BA01W5 96 Bond Act - Env Restoration 5,000 2,500 2,500 1,000 2,500 5,000 13,50009BA02W5 96 Bond Act - Environmental Restora 0 0 5,000 10,000 10,000 1,104 26,10409BA96W5 96 Bond Act-Environmental Restorati 4,077 3,574 3,366 1,560 1,460 1,000 10,96009BA97W5 96 Bond Act - Environmental Restora 4,000 4,000 2,973 3,027 0 5,000 15,00009BA98W5 96 Bond Act - Environmental Restora 1,500 2,500 1,774 0 0 3,000 7,27409BA99W5 96 Bond Act Env Restoration 2,000 1,000 1,500 1,000 513 Subtotal 17,577 14,234 18,313 18,787 15,536 Environment and Recreation
0 4,01315,104 81,974
09AN07ER Non-Point Source - Agricultural 2,000 2,000 2,000 2,000 2,000 2,000 10,00009AN08ER Non-Point Source - Agricultural 0 1,500 2,500 2,500 2,500 1,500 10,50009AP07ER Albany Pine Bush Preserve Commissio 1,450 0 0 0 0 0 009AP08ER Albany Pine Bush Preserve Commissio 0 500 500 500 500 0 2,000

DETAILED DATA
202
Environmental Conservation, Department of PROJECTED APPROPRIATIONS AND DISBURSEMENTS BY PROGRAM
2008-2009 THROUGH 2012-2013 (thousands of dollars)
DISBURSEMENTS Estimated Total
2007-2008 2008-2009 2009-2010 2010-2011 2011-2012 09AQ08ER Environmental Justice Air Quality 0 0 1,000 1,000 1,000
2012-2013 2008-20130 3,000
09AW08ER Agricultural Waste Management 0 350 0 0 0 0 35009BC07ER BCERF 0 0 0 0 0 0 009BD07ER Biodiversity Stewardship 750 750 0 0 0 0 75009BD08ER Biodiversity Stewardship 0 500 500 500 0 0 1,50009CC08ER Catskill Interpretive Center 0 500 500 0 0 0 1,00009E200ER Solid Waste 00 900 900 900 900 869 0 3,56909E202ER EPF Solid Waste 1,800 903 0 0 0 0 90309E203ER EPF - Solid Waste 5,000 1,056 0 0 0 0 1,05609E204ER EPF - Solid Waste 2,000 2,000 2,000 4,597 0 0 8,59709E205ER EPF - Solid Waste 5,000 2,500 2,857 3,500 316 0 9,17309E206ER EPF - Solid Waste 2,000 2,000 2,000 4,000 5,000 4,000 17,00009E296ER Solid & Hazardous Materials 1,600 0 1,156 0 1,597 0 2,75309E297ER Solid & Hazardous Materials 1,500 500 1,655 0 0 0 2,15509E298ER Solid Waste Account 1,000 498 1,003 0 501 0 2,00209E299ER Solid Waste 99 1,300 1,300 1,266 0 0 0 2,56609E300ER Parks 00 3,500 3,500 3,500 3,500 3,505 0 14,00509E302ER EPF Parks 4,799 4,601 3,693 2,183 0 0 10,47709E303ER EPF - Parks and Rec 8,200 7,066 3,602 3,000 0 0 13,66809E304ER EPF - Parks and Rec 6,000 4,500 6,000 8,000 2,893 0 21,39309E305ER EPF - Parks and Rec 9,000 8,000 7,788 8,000 0 0 23,78809E306ER EPF - Parks & Rec 10,000 10,000 10,000 10,000 10,000 10,700 50,70009E396ER Parks, Rec & Historic Preservation 1,000 0 406 0 999 0 1,40509E397ER Parks, Rec, & Historic Preservation 2,000 500 2,200 2,000 3,000 0 7,70009E398ER Parks Account 1,400 800 1,078 1,000 218 0 3,09609E399ER Parks 99 4,096 3,500 4,262 4,035 5,422 0 17,21909E400ER Open Space 00 2,000 1,705 51 0 0 0 1,75609E402ER EPF Open Space 4,000 5,724 0 0 0 0 5,72409E496ER Open Space Account 348 0 0 0 75 0 7509E497ER Open Space Account 125 125 125 125 112 0 48709E498ER Open Space Account 665 0 0 0 0 0 009E499ER Open Space 99 0 1,300 1,313 0 0 0 2,61309E603ER EPF - Land Acquisition 6,500 6,000 3,061 0 0 0 9,06109E604ER EPF - Open Space 15,000 12,727 415 0 0 0 13,14209E605ER EPF - Land Acquisition & Open Space 13,000 16,000 10,959 0 0 0 26,95909E606ER EPF - Land Acquisition 15,000 15,000 15,000 15,000 15,000 10,000 70,00009EP09ER EPF - Future 0 0 28,000 25,000 30,000 28,000 111,00009EP10ER EPF - Future 0 0 0 27,077 28,000 28,000 83,07709EP11ER EPF - Future 0 0 0 0 28,000 28,000 56,00009EP12ER EPF - Future 0 0 0 0 0 27,000 27,00009FL07ER Finger Lakes/Lake Ontario Watershed 500 500 500 500 0 300 1,80009FL08ER Finger Lakes/Lake Ontario Watershed 0 500 500 500 500 300 2,30009FP07ER County Agriculture/Farmland Protect 1,300 5,000 5,000 6,000 5,000 5,000 26,00009FP08ER County Agriculture/Farmland Protect 0 0 0 5,000 5,000 5,000 15,00009GL07ER Oceans and Great Lakes Initiative 0 1,000 1,000 1,000 0 1,000 4,00009GL08ER Oceans and Great Lakes Initiative 0 1,000 1,000 1,000 1,000 0 4,00009HE07ER Hudson River Estuary Management Pla 0 2,000 2,000 1,500 0 0 5,50009HE08ER Hudson River Estuary Management Pla 0 2,000 2,000 2,500 0 0 6,50009HR07ER Hudson River Park 0 0 5,000 0 0 0 5,00009IS07ER Invasive Species 1,000 1,000 1,000 1,000 1,000 0 4,00009IS08ER Invasive Species 0 2,000 2,000 0 0 0 4,00009LA07ER Land Acquisition 0 1,800 1,800 7,900 5,900 7,000 24,40009LA08ER Land Acquisition 0 0 0 10,000 10,000 10,000 30,00009LC07ER Non-hazardous landfill closure 0 0 850 1,150 1,000 0 3,00009LC08ER Non-hazardous landfill closure 0 1,000 0 0 0 0 1,00009LP07ER Long Island Central Pine Barrens 0 1,100 0 0 0 0 1,10009LP08ER Long Island Central Pine Barrens 0 1,100 0 0 0 0 1,10009MP07ER Municipal Parks 0 3,000 0 4,000 4,100 5,000 16,10009MP08ER Municipal Parks 0 1,037 0 1,500 2,000 2,000 6,53709MR07ER Municipal waste reduction/recycling 0 0 3,000 1,858 0 2,000 6,85809MR08ER Municipal waste reduction/recycling 0 0 0 0 2,000 2,000 4,00009NP07ER Non-Point Source - Non-Agricultural 0 0 1,100 975 1,000 2,000 5,07509NP08ER Non-Point Source - Non-Agricultural 0 0 0 0 2,000 1,000 3,00009NR08ER Niagara River Greenway Commission 0 150 0 0 0 0 15009PD07ER Pesticides program 0 0 0 0 0 0 009PD08ER Pesticides program 0 0 0 0 2,025 0 2,02509PP07ER Pollution Prevention Institute 0 0 0 0 0 0 009PP08ER Pollution Prevention Institute 0 0 0 0 1,500 1,000 2,50009QC08ER Hud-Ful-Champ Quad Commission 0 1,500 1,500 0 0 0 3,00009RD07ER Natural Resource Damages 0 0 0 0 0 0 009RD08ER Natural Resource Damages 0 0 0 0 423 1,000 1,42309SE07ER Long Island South Shore Estuary Res 0 0 0 0 0 0 009SE08ER Long Island South Shore Estuary Res 0 900 0 0 0 0 90009SG07ER Smart Growth 0 0 0 0 0 0 009SG08ER Smart Growth 0 0 0 0 0 1,000 1,00009SM07ER Secondary materials marketing 0 0 0 0 0 0 009SM08ER Secondary materials marketing 0 0 0 0 0 1,000 1,000

DETAILED DATA
Environmental Conservation, Department of PROJECTED APPROPRIATIONS AND DISBURSEMENTS BY PROGRAM
2008-2009 THROUGH 2012-2013 (thousands of dollars)
DISBURSEMENTS Estimated Total
2007-2008 2008-2009 2009-2010 2010-2011 2011-2012 09SO08ER Renewable Energy - Solar Initiative 0 0 0 0 0
2012-2013 2008-20131,000 1,000
09ST07ER Public Access & Stewardship 0 0 0 0 0 2,500 2,50009ST08ER Public Access & Stewardship 0 0 0 0 0 1,000 1,00009SW07ER Soil and Water Conservation Distric 0 0 0 0 0 0 009SW08ER Soil and Water Conservation Distric 0 0 0 0 0 1,100 1,10009WQ07ER Water Quality Improvement Projects 0 0 0 0 0 2,000 2,00009WQ08ER Water Quality Improvement Projects 0 0 0 0 0 100 10009WR07ER Local Waterfront Revitalization 0 0 0 0 0 5,000 5,00009WR08ER Local Waterfront Revitalization 0 0 0 0 0 1,000 1,00009ZB07ER Zoos, Botanical Gardens, Aquaria 0 3,750 3,750 0 0 500 8,00009ZB08ER Zoos, Botanical Gardens, Aquaria 0 0 8,500 0 0 0 8,50071E294ER Solid Waste Account 1,000 0 0 0 0 0 071E295ER Solid Waste Account 0 0 0 0 0 0 071E394ER Parks, Recreation & Historic Pres A 210 0 0 0 0 0 071E395ER Parks, Rec, & Hist Pres Account 0 0 0 0 0 0 071E494ER Open Space Account 57 0 0 0 0 0 071E495ER Open Space Account 0 0 0 0 0 Subtotal 137,000 149,142 161,790 174,800 185,955 Environmental Protection and Enhancements
0 0200,000 871,687
09E500EA Environmental Protection & Enhancem 0 800 1,875 0 0 0 2,67509E502EA Epf Supplemental - Solid Waste 0 800 789 0 0 0 1,58909E599EA Environmental Prot And Enhancements 500 500 500 500 1,045 0 2,54509E602EA Epf Supplemental - Parks 2,500 3,001 2,498 2,200 0 0 7,69909E699EA Environmental Prot And Enhancements 2,500 2,501 2,500 2,500 3,000 0 10,50109E702EA Epf Supplemental - Open Space 7,500 3,256 0 0 0 0 3,25609E799EA Environmental Prot And Enhancements 0 0 48 0 0 Subtotal 13,000 10,858 8,210 5,200 4,045 Fish and Wildlife
0 480 28,313
09039154 Modernization Of Fish Hatcheries 0 110 0 0 0 0 11009169654 Clean Vessel 0 0 0 0 0 0 009199754 Wetlands 0 0 0 0 0 0 009CV0154 Clean Vessel Act Pumpout Grant 50 31 0 0 0 0 3109CV0254 Clean Vessel Pump Out Grant 50 50 50 50 50 0 20009CV0354 Clean Vessel Pump Out Grant 50 50 0 0 0 0 5009CV0454 Federal - Clean Vessel 0 0 0 0 0 0 009CV0554 Federal - Clean Vessel 0 0 0 0 0 0 009CV0754 Federal - Clean Vessel 0 0 600 0 0 0 60009CV9954 Clean Vessel Act Pump Out Grant 0 0 0 0 0 0 009FA0354 Fishing Access 100 100 100 100 9 0 30909FA0454 Fishing Access 50 50 44 0 0 0 9409FW0954 Fish and Wildlife - Future 0 0 210 300 300 270 1,08009FW1054 Fish and Wildlife - Future 0 0 0 100 100 0 20009FW1154 Fish and Wildlife - Future 0 0 0 0 75 0 7509FW1254 Fish and Wildlife - Future 0 0 0 0 0 0 009HE0054 Replacement Of Hatchery Equip 24 0 0 0 0 0 009HE0254 Fish Hatchery Maintenance 50 50 50 50 50 0 20009HE0354 Fish Hatchery Improvements and Eq 100 100 100 29 0 0 22909HE0454 Fish Hatchery Improvements 75 75 75 75 75 0 30009HE0554 Fish Hatchery Improvements 0 55 65 0 0 50 17009HE0654 Fish Hatchery Improvements 50 200 200 200 50 50 70009HE0754 Fish Hatchery Improvements 500 100 100 100 0 100 40009HE0854 Fish Hatchery Improvements 0 100 100 100 100 100 50009HR9454 Hudson River Habitat Resoration Fun 0 0 0 0 0 0 009WL0054 Wetlands - Federal 100 100 0 0 0 0 10009WL9854 Federal Wetlands Grant 0 0 0 0 0 Subtotal 1,199 1,171 1,694 1,104 809 Lands and Forests
0 0570 5,348
00319153 Land Acq&Develop-Preserv&Resto 0 0 0 0 0 0 000319553 Land Acq&Develop-Preserv&Resto 0 0 0 0 0 0 000320753 Land Acq&Develop Preserv&Resto 0 0 0 0 0 0 001386153 Land Preservation & Improvemen 0 0 0 0 0 0 001386953 Land Preservation & Improvemen 0 0 0 0 0 0 002345153 Lands Pres & Imp 0 0 0 0 0 0 009038553 Land Acquisition(EQBA) 0 0 0 0 0 0 009168953 Edgewood Demolition 0 291 200 200 200 0 89109668753 Edgewood Property Demolition Of The 0 0 0 0 0 0 009708753 1986 EQBA Land Preservation And Imp 0 6 0 0 0 0 609720253 EQBA Land Preservation 0 0 0 0 0 0 009999153 Acquisition Of Forest Preserve Land 0 0 0 0 0 0 009999353 Acquisition Of Forest Preserve Land 10 10 10 10 10 10 5009999653 Acquisition Of Forest Preserve Land 0 0 0 0 0 0 009A88753 Land Acquisition(EQBA) 0 0 0 0 0 0 009AA0053 Court Of Claims 0 0 200 0 0 206 40609AA0753 Court of Claims 0 0 0 0 0 50 5009AA9353 Court Of Claims 793 500 500 500 499 0 1,99909AA9453 Court Of Claims 0 0 0 0 0 0 0
203

DETAILED DATA
204
Environmental Conservation, Department of PROJECTED APPROPRIATIONS AND DISBURSEMENTS BY PROGRAM
2008-2009 THROUGH 2012-2013 (thousands of dollars)
DISBURSEMENTS Estimated Total
2007-2008 2008-2009 2009-2010 2010-2011 2011-2012 09AA9953 Court Of Claims 70 0 0 222 0
2012-2013 2008-2013500 722
09FL0353 Federal - Forest Legacy Land Acq. 0 0 0 0 0 0 009FL0453 Federal - Forest Legacy Land Acq. 0 0 0 0 0 0 009FL0553 Federal - Forest Legacy Land Acq. 0 0 0 0 0 0 009FL0653 Federal - Forest Legacy Land Acq. 0 0 0 0 0 0 009FL0753 Federal - Forest Legacy Land Acq. 0 0 1,000 1,000 0 0 2,00009FL0853 Federal - Forest Legacy Land Acq. 0 0 375 425 500 500 1,80009GC0453 Green Certification 0 0 0 0 0 0 009GC0653 Green Certification 25 25 25 9 0 0 5909IS0753 Invasive Species 50 50 0 0 0 0 5009IS0853 Invasive Species 0 10 10 10 10 10 5009IT0153 State Share Of Istea 150 150 150 150 150 494 1,09409IT9453 State Share Istea 0 0 100 124 0 0 22409LF0953 Lands and Forests - Future 0 0 225 300 300 300 1,12509LF1053 Lands and Forests - Future 0 0 0 29 29 0 5809LF1153 Lands and Forests - Future 0 0 0 0 100 0 10009LF1253 Lands and Forests - Future 0 0 0 0 0 0 009MP0353 Unit Management Plans 74 0 0 0 0 0 009MP0653 Unit Management Plans 0 0 0 0 0 0 009MP0753 Unit Management Plans 100 100 100 25 0 25 25009MP0853 Unit Management Plans 0 25 50 100 0 100 27509PS0353 Public Safety Equipment 20 15 0 0 0 0 1509PS0453 Public Safety Equipment 0 0 0 0 0 0 009PS0553 Public Safety Equipment 75 75 75 75 75 50 35009PS0653 Public Safety Equipment 0 0 0 0 0 50 5009PS0753 Public Safety Equipment 25 25 25 15 10 0 7509PS0853 Public Safety Equipment 0 25 25 25 0 25 10009SW0153 Stewardship 0 0 0 0 0 0 009SW0353 Stewardship 53 43 0 0 0 0 4309SW0453 Stewardship 25 25 25 25 25 0 10009SW0553 Stewardship 40 40 40 40 40 50 21009SW0653 Stewardship 0 75 75 75 75 75 37509SW0753 Stewardship 100 100 100 100 0 100 40009SW0853 Stewardship 0 0 0 0 0 Subtotal 1,610 1,590 3,310 3,459 2,023 Marine Resources
0 02,545 12,927
09MR00A1 Misc Marine - Federal 100 100 100 100 100 0 40009MR01A1 Misc Marine - Federal 250 200 0 0 0 0 20009MR02A1 Marine Resources Federal 50 50 50 50 50 0 20009MR03A1 Federal Marine Resources 100 100 100 100 100 0 40009MR04A1 Federal - Marine Resources 0 0 0 0 0 0 009MR08A1 Federal - Marine Resources 0 0 0 0 1,425 1,000 2,42509MR95A1 Marine Grants 25 25 0 0 0 0 2509MR97A1 Misc Marine 0 0 0 0 0 Subtotal 525 475 250 250 1,675 Operations 09431051 Financial Security Projects 0 0 0 200 200
0 01,000 3,650
200 60009439451 Financial Security Projects 1,000 200 200 0 0 0 40009440751 Natural Resource Damages 0 0 0 0 1,000 1,000 2,00009449451 Natural Resource Damages 1,000 1,000 1,000 1,000 0 0 3,00009DF0651 DEC New Facilities 0 0 0 0 0 100 10009DF0751 DEC New Facilities 50 100 0 0 0 100 20009DF0851 DEC New Facilities 0 50 100 150 100 50 45009DS0351 Dam Safety - Demo of Unsafe Structu 75 73 0 0 0 0 7309DS0451 Dam Safety - Demo of Unsafe Structu 27 0 0 0 0 0 009DS0651 Dam Safety 59 0 0 0 0 0 009DS0751 Dam Safety 100 600 600 300 100 100 1,70009DS0851 Dam Safety 0 200 300 400 300 200 1,40009EC0051 Environmental Compliance 166 0 0 0 0 0 009EC0151 Environmental Compliance 87 0 0 0 0 0 009EC0251 Environmental Compliance 121 0 0 0 0 0 009EQ0451 Equipment Large/Small 75 0 0 0 0 0 009EQ0551 Equipment Large/Small 0 0 0 0 0 0 009EQ0651 Equipment Large/Small 250 424 294 250 250 250 1,46809EQ0751 Equipment Large/Small 1,000 1,000 1,000 1,000 300 300 3,60009EQ0851 Equipment Large/Small 0 200 200 200 200 200 1,00009GB0351 Green Building Exec Order #111 100 100 0 0 0 0 10009GB0451 Green Building Exec Order #111 0 0 0 0 0 0 009GB0551 Green Building Exec Order #111 0 0 0 0 0 0 009HD0351 GF Capital Bonding 0 0 0 0 0 0 009HD0451 GF Capital Bonding 0 0 0 0 0 0 009HD0551 GF Capital Bonding 0 0 0 0 0 0 009HD0651 GF Capital Bonding 0 0 0 0 0 0 009HD0751 GF Capital Bonding 12,000 0 0 0 0 0 009HD0851 GF Capital Bonding 0 12,000 0 0 0 0 12,00009HD0951 GF Capital Bonding - Future 0 0 12,000 0 0 0 12,000

DETAILED DATA
205
Environmental Conservation, Department of PROJECTED APPROPRIATIONS AND DISBURSEMENTS BY PROGRAM
2008-2009 THROUGH 2012-2013 (thousands of dollars)
DISBURSEMENTS Estimated Total
2007-2008 2008-2009 2009-2010 2010-2011 2011-2012 09HD1051 GF Capital Bonding - Future 0 0 0 12,000 0 09HD1151 GF Capital Bonding - Future 0 0 0 0 12,000 09HD1251 GF Capital Bonding - Future 0 0 0 0 0 09R30051 Region 3 Offices 124 0 0 0 0 09R30103 Region 3 Offices 120 120 120 120 120 09R30203 Region 3 Office Building 0 0 0 0 0 09R50303 Region 5 Office Improvements 54 28 0 0 0 09RI0351 Rehabilitation And Improvements 555 0 0 0 0 09RI0451 Rehabilitation And Improvements 0 0 0 0 0 09RI0551 Rehabilitation and Improvements 0 0 0 0 0 09RI0651 Rehabilitation and Improvements 1,000 0 0 0 1,000 09RI0751 Rehabilitation and Improvements 4,000 1,500 1,500 1,500 500 09RI0851 Rehabilitation and Improvements 0 888 582 600 440 09RI0951 Operations - Future 0 0 0 1,000 1,000 09RI1051 Operations - Future 0 0 0 0 1,000 09RI1151 Operations - Future 0 0 0 0 500 09RI1251 Operations - Future 0 0 0 0 0 09SF0451 State/Federal Compliance 0 200 0 0 0 09SF0551 State/Federal Compliance 0 0 0 0 0 09SF0651 State/Fed Comp, Exec Ord 111, Env D 0 0 0 0 0 09SF0751 State/Fed Comp, Exec Ord 111, Env D 500 500 500 500 500 09SF0851 State/Fed Comp, Exec Ord 111, Env D 0 0 0 360 0 Subtotal 22,463 19,183 18,396 19,580 19,510 Recreation
2012-2013 2008-201312,00012,00012,000
098010028000
2,0005,5253,1102,0001,000
5000
2001,5001,0252,500
470
00
12,0000
500100
0000
1,000525600
00000
1,5001,025
500110
20,360 97,029
09BL0652 Belleayre Mtn - new lodge 0 0 0 0 0 0 009CM0252 Campground Maintenance 49 0 0 0 0 0 009CM0352 Campground Maintenance 0 0 0 0 0 0 009CM0452 Campground Maintenance 263 0 0 0 0 0 009CM0552 Campground Maintenance 125 125 125 23 0 0 27309CM0652 Campground Maintenance 45 100 100 100 50 50 40009CM0752 Campground Maintenance 50 300 300 300 0 50 95009CM0852 Campground Maintenance 0 200 0 0 0 0 20009LS0652 Lift and Trail Safety 75 75 75 75 75 0 30009LS0752 Lift and Trail Safety 100 100 100 100 0 100 40009LS0852 Lift and Trail Safety 0 10 75 150 5 100 34009RE0952 Recreation - Future 0 0 212 225 225 200 86209RE1052 Recreation - Future 0 0 0 0 700 0 70009RE1152 Recreation - Future 0 0 0 0 150 Subtotal 707 910 987 973 1,205 Solid and Hazardous Waste Management 090387F7 Hazardous Site Remediation Through 248 200 0 0 0
0 150500 4,575
0 20009079606 Remedial Activities At State Facili 50 0 0 0 0 0 009079706 Remedial Activities 23 0 0 0 0 0 0091691F7 Remedial Activities At Various Site 1,000 1,000 1,000 1,000 1,000 2,097 6,097091895F7 Haz Waste Remediation Advance 775 602 600 200 10 429 1,84109279156 Landfill Closure Grant Program 1,000 1,000 1,000 1,000 559 53 3,612094388F7 Remedial Projects Settlements 295 500 475 0 0 0 975095390F7 Remedial Activities At Various Site 2,000 3,000 3,000 1,099 0 97 7,196095489F7 Remedial Actions Statewide 2,000 473 0 0 0 108 58109578756 Landfill Closures-Loans 0 260 0 0 0 0 260095887F7 1986 Solid Waste Environmental Qual 550 2,323 0 0 0 228 2,55109928856 Local Solid Waste Grants 0 50 0 0 0 0 5009AD04F7 Hazardous Waste - Advance 250 250 250 1,000 1,022 2,101 4,62309AD08F7 Hazardous Waste - Advance 0 250 250 250 250 250 1,25009AD98F7 Hazardous Waste Advance 742 0 200 1,590 1,861 0 3,65109AD99F7 Hazardous Waste Advance 3,688 3,500 3,243 3,000 3,000 0 12,74309BA07F7 HWRF - Oversight and Assessment - B 0 6,375 6,375 0 0 0 12,75009BA08F7 HWRF - Oversight and Assessment - B 0 0 4,500 4,500 0 0 9,00009BC05F7 Brownfields - Oversight & Assessmen 0 0 0 0 0 0 009BC06F7 HWRF - Oversight and Assesment 0 1,100 1,100 1,100 1,100 0 4,40009BC07F7 HWRF - Oversight and Assessment 0 0 1,500 0 0 0 1,50009BC08F7 HWRF - Oversight and Assessment 0 0 1,500 1,500 1,500 1,500 6,00009HB03F7 HWRF - Cleanup 1,543 0 0 0 0 0 009HB04F7 HWRF - Cleanup 1,543 5,958 0 0 0 0 5,95809HB05F7 HWRF - Cleanup 93,914 0 0 0 0 0 009HB06F7 HWRF - Cleanup 8,000 106,042 0 0 0 0 106,04209HB07F7 HWRF - Cleanup 0 8,000 112,000 0 0 0 120,00009HB08F7 HWRF - Cleanup 0 0 8,000 112,000 0 0 120,00009HB09F7 HWRF - Cleanup 0 0 0 8,000 112,000 0 120,00009HB10F7 HWRF - Cleanup 0 0 0 0 8,000 112,000 120,00009HB11F7 HWRF - Cleanup 0 0 0 0 0 8,000 8,00009HB12F7 HWRF - Cleanup 0 0 0 0 0 0 009HT03F7 HWRF - Oversight and Assesment 0 0 0 0 0 0 009HT04F7 HWRF - Oversight and Assesment 0 0 0 0 0 0 009HT05F7 HWRF - Oversight and Assesment 7,500 0 0 0 0 0 009HT06F7 HWRF - Oversight and Assesment 7,500 7,500 0 0 0 0 7,500

DETAILED DATA
206
Environmental Conservation, Department of PROJECTED APPROPRIATIONS AND DISBURSEMENTS BY PROGRAM
2008-2009 THROUGH 2012-2013 (thousands of dollars)
DISBURSEMENTS Estimated Total
2007-2008 2008-2009 2009-2010 2010-2011 2011-2012 09HT09F7 HWRF - Oversight and Assessment 0 0 0 7,500 6,000
2012-2013 2008-201313,5000
09HT10F7 HWRF - Oversight and Assesment 0 0 0 0 7,500 7,100 14,60009HT11F7 HWRF - Oversight and Assessment 0 0 0 0 0 7,500 7,50009HT12F7 HWRF - Oversight and Assessment 0 0 0 0 0 0 009HW92F7 Remedial Activities At Various Site 0 1,000 1,000 1,000 1,000 1,890 5,89009HW93F7 Remedial Activities At Various Site 1,000 938 1,000 1,000 1,000 1,000 4,93809HW94F7 Remedial Activities At Various Site 0 0 1,000 1,000 1,441 1,585 5,02609HW95F7 Haz Waste Remediation 0 0 1,000 192 0 42 1,23409HW96F7 Remedial Activities 250 0 1,000 1,000 2,000 2,000 6,00009HW97F7 Remedial Activities 2,200 0 0 1,162 0 100 1,26209HW98F7 Remedial Activities 0 0 0 1,000 1,000 300 2,30009HW99F7 Haz Waste Remediation 0 0 0 547 2,000 500 3,04709KP06F7 Smithtown/Kings Park Psychiatric Ce 0 12,500 12,500 0 0 0 25,00009RS0456 Remediate State Owned Facilities 0 400 400 400 301 0 1,50109TG07F7 HWRF - Oversight and Assessment - T 0 1,125 1,125 0 0 0 2,25009TG08F7 HWRF - Oversight and Assessment - T 0 0 0 1,500 0 Subtotal 136,071 164,346 164,018 152,540 152,544 Solid Waste Management 00319256 St Shar-Municpal Solid Waste M 0 0 0 0 0
0 1,500148,880 782,328
0 000319656 St Shar-Municpal Solid Waste 0 0 0 0 0 0 000320856 St Share Municpal Solid Waste 500 500 500 500 500 500 2,50000324956 Fi Municipal Solid Waste 0 0 0 0 0 0 000330956 Solid Waste Management 0 0 0 0 0 0 000333856 Solid Waste Management 0 0 0 0 0 0 001371610 Pay CCf-Environment Qual Projs 0 0 0 0 0 0 0028789F7 Fed Share Clean Up Haz Wst. 425 369 500 400 400 0 1,669090486F7 Remedial Action At Selected Sites W 700 825 725 775 775 0 3,10009108556 Resource Recovery Projects 500 500 500 500 43 300 1,843091884F7 State Settlements 200 580 500 0 0 0 1,08009720256 EQBA Solid Waste 500 500 0 0 0 0 50009728856 Resource Recovery Projects 0 0 0 0 0 0 009A58956 Resource Recovery Brookhaven 0 0 0 0 0 0 009BA0056 96 Bond Act - Solid Waste 87 0 0 0 1,014 320 1,33409BA0156 96 Bond Act - Solid Waste 0 0 0 0 1,500 719 2,21909BA9656 96 Bond Act-Solid Waste 1,653 1,600 1,600 0 0 0 3,20009BA9756 96 Bond Act - Solid Waste 446 1,082 0 0 0 500 1,58209BA9856 96 Bond Act - Solid Waste 1,000 0 0 0 218 489 70709BA9956 96 Bond Act - Solid Waste 800 605 606 0 594 691 2,49609D18656 Low Tech Project 0 0 0 0 0 0 009EX0256 Essex County - Future 40 0 0 0 0 0 009EX0356 Adirondack Landfills 80 80 80 80 55 0 29509EX0456 Adirondack Landfills 0 0 0 0 0 0 009EX0556 Essex County 0 145 150 0 0 0 29509EX0656 Essex County 0 0 0 0 0 50 5009EX0756 Essex County 50 50 100 100 100 0 35009EX0956 Essex County - Future 0 0 30 30 30 30 12009EX1056 Essex County - Future 0 0 0 25 25 0 5009EX1156 Essex County - Future 0 0 0 0 50 0 5009EX1256 Essex County - Future 0 0 0 0 0 0 009FS04F7 Federal - Hazardous Waste 0 0 0 0 0 0 009FS99F7 Fed Share Hazardous Waste 600 600 600 600 600 0 2,40009MT0001 Mohawk Tire 98 0 0 0 0 0 009RL0356 Rush Landfill Post Closure 0 0 0 0 0 0 009RL0556 Rush Landfill 50 50 50 50 0 0 15009RL0656 Rush Landfill 75 75 75 75 75 75 37509RL0756 Rush Landfill 350 0 0 0 0 0 009RL0856 Rush Landfill 0 25 0 25 0 0 5009RL0956 Rush Landfill - Future 0 0 40 40 40 0 12009RL1056 Rush Landfill - Future 0 0 0 0 75 0 7509RL1156 Rush Landfill - Future 0 0 0 0 19 0 1909RL1256 Rush Landfill - Future 0 0 0 0 0 0 071059210 Pay CCf -Environmental Quality Proj 0 0 0 0 0 0 071109210 Environmental Quality Bond Act Fund 0 0 0 0 0 0 071109310 Environmental Quality Bond Act Fund 0 0 0 0 0 Subtotal 8,154 7,586 6,056 3,200 6,113 Water Resources
0 03,674 26,629
00318957 Constr Water Quality Imp Proj 0 0 0 0 0 0 000319357 Const Water Quality Imp Proj 0 0 0 0 0 0 000320557 Const Water Quality Imp Proj 0 0 0 0 0 0 001354910 Pure Waters Bond Fund 0 0 0 0 0 0 001385057 Pure Waters Sewage Treat Works 0 0 0 0 0 0 001385157 Pure Waters Sewage Treat Works 0 0 0 0 0 0 001385357 Pure Waters Sewage Treat Works 0 0 0 0 0 0 001385557 Water Quality Improvements 0 0 0 0 0 0 001385757 Fi Water Quality Improvements 0 0 0 0 0 0 001385957 Fi Water Quality Improvements 0 0 0 0 0 0 0

DETAILED DATA
207
Environmental Conservation, Department of PROJECTED APPROPRIATIONS AND DISBURSEMENTS BY PROGRAM
2008-2009 THROUGH 2012-2013 (thousands of dollars)
DISBURSEMENTS Estimated Total
2007-2008 2008-2009 2009-2010 2010-2011 2011-2012 01386257 Pure Waters 0 0 0 0 0
2012-2013 2008-20130 0
01386357 Water Quality Improvements 0 0 0 0 0 0 001387057 Water Quality Improvements 0 0 0 0 0 0 002403057 Water Quality Improvements Project 0 0 0 0 0 0 009009763 Dam Safety Projects 25 0 47 0 0 0 4709019057 Partial Match Ffy 90 Grants 0 0 0 0 0 0 009019463 Shore Protection-Jones Inlet 0 100 100 57 76 0 33309070163 Shore Protection Advance 232 0 0 0 0 700 70009070963 Shore Protection - Advance Future 0 0 250 250 250 250 1,00009071063 Shore Protection Advance - Future 0 0 0 450 259 291 1,00009071163 Shore Protection Advance - Future 0 0 0 0 250 350 60009071263 Shore Protection Advance - Future 0 0 0 0 0 300 30009088957 Ffy 89 & 90 New Construction Grants 0 0 0 0 0 0 009089363 Coney Island Shore Protection 0 45 40 0 0 0 8509099363 Coney Island Project Advance 0 280 0 0 0 0 28009099763 Long Beach Storm 0 273 521 0 22 500 1,31609109063 Westhampton Beach Interim Project-S 0 150 138 0 0 0 28809168457 Water Quality Improvements Pwba 0 0 0 0 0 0 009168557 Harbor Drift Removal 0 0 0 0 0 0 009178457 Statewide Reserve 0 0 0 0 0 0 0091A9063 Westhampton Beach Interim Project L 0 200 118 0 0 0 31809538757 EQBA Water Quality Improvement Proj 0 0 0 0 0 0 009539463 Jones Inlet 0 311 300 0 0 0 61109548757 EQBA Water Quality Improvement Proj 0 0 0 0 0 0 009650257 PWBA Li CCmp 600 600 470 0 0 0 1,07009650357 65 PWBA Water Quality 300 0 130 600 600 300 1,63009650757 65 PWBA Water Quality 0 0 0 0 0 0 009650857 65 PWBA Water Quality 0 0 0 0 0 300 30009720257 72 EQBA Water Quality 0 0 500 500 500 500 2,00009720357 72 EQBA Water Quality 0 0 0 0 457 0 45709720757 72 EQBA Water Quality 0 0 0 0 0 0 009720857 72 EQBA Water Quality 0 0 0 0 0 200 20009799763 Flood Damage/Rehab 400 401 412 358 0 0 1,17109A10063 Shore Protection - Advance 120 200 0 0 0 435 63509A19463 I.I. So. Shore Inlets 0 330 350 0 0 0 68009A19863 L.I North Shore Advance 0 0 0 0 0 0 009A29863 Jones Inlet Advance 0 0 210 0 0 0 21009A29963 Various Shore Protection 280 0 0 203 300 0 50309A39863 Various Shore Protection Advances 0 0 0 0 0 0 009A39963 Rockaway Beach Nourishment 0 0 0 0 0 63 6309A49463 Evacuation Routes 0 300 300 272 200 0 1,07209A49863 Shinnecock Advance 0 0 383 0 0 731 1,11409A69463 Shore Monitoring 0 300 200 200 200 0 90009A79463 Sand Bypass Asharoken, Lilco 0 103 100 100 63 0 36609AD0263 Shore Protection Advance 245 165 0 0 0 900 1,06509AD0363 Shore Protection Advance 175 200 200 300 0 0 70009B20057 96 Bond Act - Add Clean Water 1,000 1,000 1,000 0 770 534 3,30409B29757 96 Bond Act-Additional Clean Water 0 0 0 0 387 460 84709B29857 96 Bond Act -Clean Water Other 750 750 760 614 0 450 2,57409B29957 96 Bond Act- Additional Clean Water 1,000 1,000 1,000 98 250 1,000 3,34809BA0057 96 Bond Act - Water Resources 5,000 2,500 5,000 5,000 6,000 5,000 23,50009BA0157 96 Bond Act - Water Resources 7,500 2,500 2,718 5,000 6,000 5,000 21,21809BA0257 96 Bond Act - Water Resources 7,559 2,500 2,500 7,292 5,157 2,000 19,44909BA9657 96 Bond Act - Clean Water 1,200 1,059 1,065 1,200 1,200 1,357 5,88109BA9757 96 Bond Act - Clean Water 3,600 4,000 3,888 2,855 0 1,178 11,92109BA9857 96 Bond Act - Clean Water 7,500 3,568 1,318 0 0 2,000 6,88609BA9957 96 Bond Act - Clean Water 5,000 5,000 5,000 5,000 5,000 5,000 25,00009BC0657 Bristol/Canandaigua Public Water Sy 0 0 0 0 0 0 009DA0657 Dam Safety - Advance 50 50 50 50 50 50 25009DA0757 Dam Safety - Advance 100 50 50 50 50 50 25009DS0163 Dam Safety 0 0 0 0 0 0 009EQ8857 EQBA Sewage Treatment Grants -
Lump 0 0 0 0 0 0 009FC0163 Flood Control - Federal Proj 0 0 0 0 0 0 009FC0263 Flood Control - Fed Projects 0 0 0 0 0 500 50009FC0363 Flood Control - Fed Projects 0 0 0 0 0 1,500 1,50009FD0763 Flood Control - Dam Safety 100 100 0 0 0 0 10009FL0063 Flood Control 57 0 0 0 0 0 009FL0163 Various Flood Control 122 0 0 0 0 0 009FL0263 Various Flood Control 320 321 244 0 0 0 56509FL0363 Various Flood Control 100 100 100 100 100 400 80009FL0463 Flood Control 100 100 100 100 100 100 50009FL0563 Flood Control 0 50 50 50 0 50 20009FL0663 Flood Control 50 200 200 200 50 50 70009FL0763 Flood Control 100 100 0 0 0 0 10009FL0863 Flood Control 0 0 0 0 0 0 009FP0563 Flood Plain Mapping 200 139 0 0 0 0 139

DETAILED DATA
208
Environmental Conservation, Department of PROJECTED APPROPRIATIONS AND DISBURSEMENTS BY PROGRAM
2008-2009 THROUGH 2012-2013 (thousands of dollars)
DISBURSEMENTS Estimated Total
2007-2008 2008-2009 2009-2010 2010-2011 2011-2012 2012-2013 2008-201309FP0663 Flood Plain Mapping 50 200 200 200 50 50 70009FP0763 Flood Plain Mapping 100 200 200 200 0 0 60009FP0863 Flood Plain Mapping 0 0 0 0 0 0 009LB9763 Long Beach Storm Damage Protection 0 400 600 700 500 500 2,70009LK0457 Onondaga Lake 0 0 0 0 0 0 009LK0557 Onondaga Lake 2,688 0 0 0 0 0 009LK0657 Onondaga Lake 7,312 2,688 0 0 0 0 2,68809LK0757 Onondaga Lake 0 7,312 2,688 0 0 0 10,00009LK0857 Onondaga Lake 0 0 7,312 2,688 0 0 10,00009LK0957 Onondaga Lake - Future 0 0 0 7,312 2,688 0 10,00009LK1057 Onondaga Lake - Future 0 0 0 0 5,000 0 5,00009NG0663 USGS Network Gages 0 0 0 0 0 0 009NG0763 USGS Network Gages 300 200 0 0 0 0 20009NG0863 USGS Network Gages 0 25 25 25 0 25 10009P18857 NYS Priority List - 4 Projects 0 0 0 0 0 0 009P28857 Statewide Reserve Replacement 0 0 0 0 0 0 009RF0557 SRF State Match 13,900 0 0 0 0 0 009RF0657 SRF State Match 6,100 20,000 3,500 0 0 0 23,50009RF0757 SRF State Match 0 0 4,500 0 0 0 4,50009RF0857 SRF State Match 0 0 10,000 10,000 0 0 20,00009RF0957 SRF State Match - Future 0 0 2,000 10,000 10,000 0 22,00009RF1057 SRF State Match - Future 0 0 0 0 10,000 10,000 20,00009RF1157 SRF State Match - Future 0 0 0 0 0 10,000 10,00009RF1257 SRF State Match - Future 0 0 0 0 0 0 009SF0557 SRF Federal 69,500 0 0 0 0 0 009SF0657 SRF Federal 30,500 40,000 39,000 38,000 0 0 117,00009SF0757 SRF Federal 0 10,000 7,595 0 0 0 17,59509SF0857 SRF Federal 0 50,000 38,000 37,000 23,000 0 148,00009SF0957 SRF Federal 0 0 13,805 11,000 45,500 28,000 98,30509SF1057 SRF Federal 0 0 0 13,000 30,000 30,000 73,00009SF1157 SRF Federal 0 0 0 0 0 30,000 30,00009SF1257 SRF Federal 0 0 0 0 0 13,000 13,00009W10063 Various Shore Projects 100 100 100 100 100 0 40009W10163 Various Shore Protection 5 5 5 5 5 0 2009W10263 Various Shore Protection 0 0 0 0 0 200 20009W10363 Various Shore Protection 75 75 75 75 75 100 40009W10463 Various Shore Protection 0 0 0 0 0 100 10009W10563 Various Shore Protection 25 100 100 100 100 100 50009W10663 Various Shore Protection 0 0 0 0 0 125 12509W10863 Various Shore Protection 0 0 0 0 0 0 009W19963 Various Shore Projects 0 0 0 0 0 100 10009W29963 Rockaway Beach Nourishment 0 0 0 0 0 0 009W39863 Jones Inlet 200 90 0 200 0 0 29009W49863 Shinnecock/L Construction 200 89 200 200 165 500 1,15409W59863 Various Other Shore Protection Proj 50 50 50 50 50 0 20009WA0963 Water - Future 0 0 0 0 1,000 0 1,00009WA1063 Water Resources - Future 0 0 0 0 850 0 85009WA1163 Water Resources - Future 0 0 0 0 200 0 20009WA1263 Water Resources - Future 0 0 0 0 0 0 071139310 Pure Waters Bond Fund 0 0 0 0 0 0 0 Subtotal 174,890 160,579 159,767 161,754 157,574 155,299 794,973 Total 522,910 539,810 549,810 547,310 554,998 557,310 2,749,238

DETAILED DATA
209
Environmental Facilities Corporation PROJECTED APPROPRIATIONS AND DISBURSEMENTS BY PROGRAM
2008-2009 THROUGH 2012-2013 (thousands of dollars)
APPROPRIATIONS Reappro-
priations 2008-2009 2009-2010 2010-2011 2011-2012 Air Resources
2012-2013Total
2008-2013
75EF0706 EFARM 0 0 0 0 0 0 0 Subtotal 0 0 0 0 0 0 0Clean Water - Clean Air Implementation 75BA06WI Bond Act Implementation Staff 343 0 0 0 0 75BA07WI Bond Act Implementation Staff 343 0 0 0 0 75BA08WI Bond Act Implementation Staff 0 343 0 0 0 75BA09WI Bond Act Implementation Staff 0 0 343 0 0 75BA10WI Bond Act Implementation Staff 0 0 0 343 0 75BA11WI Bond Act Implementation Staff 0 0 0 0 343 75BA12WI Bond Act Implementation Staff 0 0 0 0 0
000000
343
00
343343343343343
Subtotal 686 343 343 343 343 343 1,715Pipeline for Jobs Program 75J205JK Pipeline for Jobs 0 0 0 0 0 75J206JK Pipeline for Jobs 5,000 0 0 0 0 75J299JK Pipeline For Jobs 0 0 0 0 0
000
000
Subtotal 5,000 0 0 0 0 0 0 Total 5,686 343 343 343 343 343 1,715
Environmental Facilities Corporation
PROJECTED APPROPRIATIONS AND DISBURSEMENTS BY PROGRAM 2008-2009 THROUGH 2012-2013
(thousands of dollars) DISBURSEMENTS
Estimated Total
2007-2008 2008-2009 2009-2010 2010-2011 2011-2012 2012-2013 2008-2013Air Resources 75EF0706 EFARM 4,400 0 0 0 0 0 0 Subtotal 4,400 0 0 0 0 0 0Clean Water - Clean Air Implementation 75BA06WI Bond Act Implementation Staff 0 0 0 0 0 75BA07WI Bond Act Implementation Staff 343 0 0 0 0 75BA08WI Bond Act Implementation Staff 0 343 0 0 0 75BA09WI Bond Act Implementation Staff 0 0 343 0 0 75BA10WI Bond Act Implementation Staff 0 0 0 343 0 75BA11WI Bond Act Implementation Staff 0 0 0 0 343 75BA12WI Bond Act Implementation Staff 0 0 0 0 0
000000
343
00
343343343343343
Subtotal 343 343 343 343 343 343 1,715Pipeline for Jobs Program 75J205JK Pipeline for Jobs 5,000 1,250 0 0 0 75J206JK Pipeline for Jobs 0 3,750 0 0 0 75J299JK Pipeline For Jobs 0 55 0 0 0
000
1,2503,750
55 Subtotal 5,000 5,055 0 0 0 0 5,055 Total 9,743 5,398 343 343 343 343 6,770

DETAILED DATA
210
Hudson River Park Trust PROJECTED APPROPRIATIONS AND DISBURSEMENTS BY PROGRAM
2008-2009 THROUGH 2012-2013 (thousands of dollars)
APPROPRIATIONS
Regional Development 29NY00A3 NYC Advance
Reappro- priations 2008-2009 2009-2010 2010-2011 2011-2012
254 0 0 0 0
2012-2013
0
Total2008-2013
029NY02A3 NYC Advance 3,401 0 0 0 0 0 029NY03A3 NYC Advance 1,535 0 0 0 0 0 029NY05A3 NYC Advance 934 0 0 0 0 0 029NY06A3 Hudson River Park Trust 26,000 0 0 0 0 0 029NY08A3 Hudson River Park Trust Subtotal Total
0 25,000 0 0 0 0 25,00032,124 25,000 0 0 0 0 25,00032,124 25,000 0 0 0 0 25,000
Hudson River Park Trust
PROJECTED APPROPRIATIONS AND DISBURSEMENTS BY PROGRAM 2008-2009 THROUGH 2012-2013
(thousands of dollars) DISBURSEMENTS
Estimated Total
2007-2008 2008-2009 2009-2010 2010-2011 2011-2012 2012-2013 2008-2013Regional Development 29NY00A3 NYC Advance
0 0 0 0 0 0 0
29NY02A3 NYC Advance 3,268 0 0 0 0 0 029NY03A3 NYC Advance 6,414 0 0 0 0 0 029NY05A3 NYC Advance 5,000 0 0 0 0 0 029NY06A3 Hudson River Park Trust 5,318 20,682 0 0 0 0 20,68229NY08A3 Hudson River Park Trust Subtotal Total
0 0 15,000 10,000 0 0 25,00020,000 20,682 15,000 10,000 0 0 45,68220,000 20,682 15,000 10,000 0 0 45,682

DETAILED DATA
211
Parks, Recreation and Historic Preservation, Office of PROJECTED APPROPRIATIONS AND DISBURSEMENTS BY PROGRAM
2008-2009 THROUGH 2012-2013 (thousands of dollars)
APPROPRIATIONS Reappro-
priations 2008-2009 2009-2010 2010-2011 2011-2012 Federal Capital Projects Fund 49FE0203 LWCF, TEA21, NRTA 0 0 0 0 0
2012-2013
0
Total2008-2013
049FE0303 LWCF, TEA21, NRTA 1,774 0 0 0 0 0 049FE0403 Parks Federal 1,583 0 0 0 0 0 049FE0503 Parks Federal 3,485 0 0 0 0 0 049FE0603 Parks Federal 4,000 0 0 0 0 0 049FE0703 Parks Federal 4,000 0 0 0 0 0 049FE0803 Parks - Federal 0 4,000 0 0 0 0 4,00049FE0903 Parks - Federal 0 0 5,000 0 0 0 5,00049FE1003 Parks - Federal 0 0 0 5,000 0 0 5,00049FE1103 Parks - Federal 0 0 0 0 5,000 0 5,00049FE1203 Parks - Federal 0 0 0 0 0 Subtotal 14,842 4,000 5,000 5,000 5,000 Maintenance and Improvement of Existing
Facilities
5,000 5,0005,000 24,000
49010301 Health & Safety 0 0 0 0 0 0 049010401 Health & Safety 2,130 0 0 0 0 0 049010501 Health & Safety 2,034 0 0 0 0 0 049010601 Health & Safety 2,749 0 0 0 0 0 049010701 Health and Safety 3,684 0 0 0 0 0 049010801 Health and Safety 0 4,625 0 0 0 0 4,62549010901 SPIF Health and Safety - Future 0 0 4,065 0 0 0 4,06549011001 SPIF Health & Safety - Future 0 0 0 4,065 0 0 4,06549011101 SPIF Health & Safety - Future 0 0 0 0 4,065 0 4,06549011201 SPIF Health & Safety - Future 0 0 0 0 0 4,065 4,06549030203 Preservation Of Facilities 0 0 0 0 0 0 049030303 Preservation Of Facilities 3,780 0 0 0 0 0 049030403 Preservation Of Facilities 6,085 0 0 0 0 0 049030503 Preservation Of Facilities 11,019 0 0 0 0 0 049030603 Preservation Of Facilities 16,039 0 0 0 0 0 049030703 Preservation of Facilities 21,663 0 0 0 0 0 049030803 Preservation of Facilities 0 20,317 0 0 0 0 20,31749030903 SPIF Perservation of Facilities - F 0 0 17,263 0 0 0 17,26349031003 SPIF Preservation of Facilities - F 0 0 0 17,263 0 0 17,26349031103 SPIF Preservation of Facilities Fut 0 0 0 0 17,263 0 17,26349031203 SPIF Preservation of Facilities Fut 0 0 0 0 0 17,263 17,26349040304 Facilities For The Physically Disab 0 0 0 0 0 0 049040404 Facilities For The Physically Disab 460 0 0 0 0 0 049040504 Facilities For The Physically Disab 380 0 0 0 0 0 049040604 Facilities For The Physically Disab 360 0 0 0 0 0 049040704 Facilities for the Physically Disab 355 0 0 0 0 0 049040804 Facilities for the Physically Disab 0 707 0 0 0 0 70749040904 SPIF Fac. for Phy Disabled - Future 0 0 370 0 0 0 37049041004 SPIF Fac. for Phy Disable - Future 0 0 0 370 0 0 37049041104 SPIF Fac for Phy Disable - Future 0 0 0 0 370 0 37049041204 SPIF Fac for Phy Disable - Future 0 0 0 0 0 370 370490606ES Engineering Services 0 0 0 0 0 0 0490607ES Engineering Services 0 0 0 0 0 0 0490608ES Engineering Services 0 3,800 0 0 0 0 3,800490609ES SPIF Engineering Services - Future 0 0 3,800 0 0 0 3,800490610ES SPIF Engineering Services - Future 0 0 0 3,800 0 0 3,800490611ES SPIF Engineering Services - Future 0 0 0 0 3,800 0 3,800490612ES SPIF Engineering Services - Future 0 0 0 0 0 3,800 3,80049BT0603 Brentwood State Park Athletic Compl 6,378 0 0 0 0 0 049EC0305 Energy Conservation 0 0 0 0 0 0 049EC0405 Energy Conservation 356 0 0 0 0 0 049EC0505 Energy Conservation 246 0 0 0 0 0 049EC0605 Energy Conservation 461 0 0 0 0 0 049EC0705 Energy Conservation 420 0 0 0 0 0 049EC0805 Energy Conservation 0 751 0 0 0 0 75149EC0905 SPIF Energy Conservation - Future 0 0 107 0 0 0 10749EC1005 SPIF Energy Conservation - Future 0 0 0 107 0 0 10749EC1105 SPIF Energy Conservation - Future 0 0 0 0 107 0 10749EC1205 SPIF Energy Conservation - Future 0 0 0 0 0 107 10749GI0103 Miscellaneous Gifts 1,054 0 0 0 0 0 049GI0203 Miscellaneous Gifts 700 0 0 0 0 0 049GI0303 Miscellaneous Gifts 224 0 0 0 0 0 049GI0403 Miscellaneous Gifts 939 0 0 0 0 0 049GI0503 Miscellaneous Gifts 25,000 0 0 0 0 0 049GI0603 Miscellaneous Gifts 10,000 0 0 0 0 0 049GI0703 Miscellaneous Gifts 10,000 0 0 0 0 0 049GI0803 Miscellaneous Gifts 0 10,000 0 0 0 0 10,00049GI0903 Misc Capital Projects - Future 0 0 5,000 0 0 0 5,00049GI1003 Misc Capital Projects - Future 0 0 0 5,000 0 0 5,00049GI1103 Misc Capital Projects - Future 0 0 0 0 5,000 0 5,00049GI1203 Misc Capital Projects - Future 0 0 0 0 0 5,000 5,00049HT0003 Heritage Trails 47 0 0 0 0 0 0

DETAILED DATA
212
Parks, Recreation and Historic Preservation, Office of PROJECTED APPROPRIATIONS AND DISBURSEMENTS BY PROGRAM
2008-2009 THROUGH 2012-2013 (thousands of dollars)
APPROPRIATIONS Reappro-
priations 2008-2009 2009-2010 2010-2011 2011-2012 2012-2013Total
2008-201349LV0403 I Love NY Water 0 0 0 0 0 0 049LV0603 I Love NY Water Account 2,266 0 0 0 0 0 049LV0703 I Love NY Water Account 1,300 0 0 0 0 0 049LV0803 I Love NY Water Account 0 1,300 0 0 0 0 1,30049LV0903 I Love NY Water Account - Future 0 0 1,300 0 0 0 1,30049LV1003 I Love NY Water Account - Future 0 0 0 1,300 0 0 1,30049LV1103 I Love NY Water Account - Future 0 0 0 0 1,300 0 1,30049LV1203 I Love NY Water Account - Future 0 0 0 0 0 1,300 1,30049NR0203 Resource Account 0 0 0 0 0 0 049NR0303 Resource Account 412 0 0 0 0 0 049NR0403 Resource Account 69 0 0 0 0 0 049NR0503 Resource Account 390 0 0 0 0 0 049NR0603 Resource Account 730 0 0 0 0 0 049NR0703 Resource Account 1,000 0 0 0 0 0 049NR0803 Resource Account 0 1,500 0 0 0 0 1,50049NR0903 Resource Account - Future 0 0 500 0 0 0 50049NR1003 Resource Account - Future 0 0 0 500 0 0 50049NR1103 Resource Account - Future 0 0 0 0 500 0 50049NR1203 Resource Account - Future 0 0 0 0 0 200 20049PA0603 Minekill State Park 243 0 0 0 0 0 049PA0703 Minekill State Park 500 0 0 0 0 0 049PA0803 Minekill 0 500 0 0 0 0 50049PA0903 Minekill - Future 0 0 200 0 0 0 20049PA1003 Minekill - Future 0 0 0 200 0 0 20049PA1103 Minekill - Future 0 0 0 0 200 0 20049PA1203 Minekill - Future 0 0 0 0 0 200 20049PC0803 State Parks Capital Initiative 0 110,000 0 0 0 0 110,00049PS0503 Preservation of Facilities 0 0 0 0 0 0 049RR0203 Parks Capital Investment 272 0 0 0 0 0 049RR0303 Parks Capital Investment 483 0 0 0 0 0 049RR0403 Parks Capital Investment 428 0 0 0 0 0 049RR0503 Parks Capital Investment 746 0 0 0 0 0 049RR0603 Parks Capital Investment 500 0 0 0 0 0 049RR0703 Parks Capital Investment 500 0 0 0 0 0 049RR0803 Parks Capital Investment 0 500 0 0 0 0 50049RR0903 Parks Capital Investment - Future 0 0 500 0 0 0 50049RR1003 Parks Capital Investment - Future 0 0 0 500 0 0 50049RR1103 Parks Capital Investment - Future 0 0 0 0 500 0 50049RR1203 Parks Capital Investment - Future 0 0 0 0 0 500 50049TS0503 SPIF - Tioga State Park 884 0 0 0 0 0 049ZZ06PM Preventive Maintenance - Staff 0 0 0 0 0 0 049ZZ07PM Preventive Maintenance 0 0 0 0 0 0 049ZZ08PM SPIF Preventive Maintenance - Futur 0 4,000 0 0 0 0 4,00049ZZ09PM SPIF Preventive Maintenance - Futur 0 0 4,000 0 0 0 4,00049ZZ10PM SPIF Preventive Maintenance - Futur 0 0 0 4,000 0 0 4,00049ZZ11PM SPIF Preventive Maintenance - Futur 0 0 0 0 4,000 0 4,00049ZZ12PM SPIF Preventive Maintenance - Futur 0 0 0 0 0 4,000 4,000 Subtotal 137,286 158,000 37,105 37,105 37,105 36,805 306,120Natural Heritage Trust 20039408 Museum Of Ceramic Art At Alfred 300 0 0 0 0 0 0 Subtotal 300 0 0 0 0 0 0Outdoor Recreation 01377107 Park And Recreation Land Acq B 783 0 0 0 0 01377210 Outdoor Rec Dev Bond Fund 230 0 0 0 0
00
00
Subtotal 1,013 0 0 0 0 0 0Parks EQBA 49EQ8707 Municipal Grants Under 1986 EQBA 1,081 0 0 0 0 0 049EQ8807 Municipal Grants Under 1986 EQBA 1,139 0 0 0 0 0 049EQ8907 Environmental Quality Bond Act 1,445 0 0 0 0 0 049EQ9007 1986 EQBA Mun Parks, Hist Pres 72 0 0 0 0 0 0 Subtotal 3,737 0 0 0 0 0 0 Total 157,178 162,000 42,105 42,105 42,105 41,805 330,120

DETAILED DATA
213
Parks, Recreation and Historic Preservation, Office of PROJECTED APPROPRIATIONS AND DISBURSEMENTS BY PROGRAM
2008-2009 THROUGH 2012-2013 (thousands of dollars)
DISBURSEMENTS Estimated Total
2007-2008 2008-2009 2009-2010 2010-2011 2011-2012 2012-2013 2008-2013Federal Capital Projects Fund 49FE0203 LWCF, TEA21, NRTA 500 478 0 0 0 0 47849FE0303 LWCF, TEA21, NRTA 1,000 994 0 0 0 0 99449FE0403 Parks Federal 1,000 601 500 0 0 0 1,10149FE0503 Parks Federal 700 800 1,100 1,082 0 0 2,98249FE0603 Parks Federal 200 327 1,100 1,200 1,173 0 3,80049FE0703 Parks Federal 200 200 300 418 727 1,000 2,64549FE0803 Parks - Federal 0 200 300 300 700 1,000 2,50049FE0903 Parks - Federal 0 0 300 300 400 500 1,50049FE1003 Parks - Federal 0 0 0 300 300 500 1,10049FE1103 Parks - Federal 0 0 0 0 300 300 60049FE1203 Parks - Federal 0 0 0 0 0 Subtotal 3,600 3,600 3,600 3,600 3,600 Maintenance and Improvement of Existing
Facilities
300 3003,600 18,000
49010301 Health & Safety 1,000 0 0 0 0 0 049010401 Health & Safety 700 300 300 300 300 358 1,55849010501 Health & Safety 650 450 450 450 0 80 1,43049010601 Health & Safety 300 300 300 300 300 500 1,70049010701 Health and Safety 400 200 200 200 200 200 1,00049010801 Health and Safety 0 500 500 1,500 1,500 500 4,50049010901 SPIF Health and Safety - Future 0 0 500 1,500 1,500 500 4,00049011001 SPIF Health & Safety - Future 0 0 0 700 700 865 2,26549011101 SPIF Health & Safety - Future 0 0 0 0 894 0 89449011201 SPIF Health & Safety - Future 0 0 0 0 0 0 049030203 Preservation Of Facilities 1,000 500 0 0 0 0 50049030303 Preservation Of Facilities 2,000 500 500 500 0 1,166 2,66649030403 Preservation Of Facilities 1,380 2,274 2,928 0 0 0 5,20249030503 Preservation Of Facilities 3,750 500 1,500 1,941 1,000 1,592 6,53349030603 Preservation Of Facilities 2,000 1,000 3,000 3,000 3,000 3,000 13,00049030703 Preservation of Facilities 1,896 1,000 3,000 3,000 3,000 3,000 13,00049030803 Preservation of Facilities 0 1,000 3,000 3,000 3,000 4,000 14,00049030903 SPIF Perservation of Facilities - F 0 0 2,500 1,500 1,500 2,500 8,00049031003 SPIF Preservation of Facilities - F 0 0 0 1,000 1,000 750 2,75049031103 SPIF Preservation of Facilities Fut 0 0 0 0 1,000 0 1,00049031203 SPIF Preservation of Facilities Fut 0 0 0 0 0 0 049040304 Facilities For The Physically Disab 195 0 0 0 0 0 049040404 Facilities For The Physically Disab 150 50 50 50 50 129 32949040504 Facilities For The Physically Disab 0 301 80 0 0 0 38149040604 Facilities For The Physically Disab 0 0 0 0 0 0 049040704 Facilities for the Physically Disab 83 120 112 0 0 40 27249040804 Facilities for the Physically Disab 0 100 130 340 0 0 57049040904 SPIF Fac. for Phy Disabled - Future 0 0 50 50 50 50 20049041004 SPIF Fac. for Phy Disable - Future 0 0 0 100 270 0 37049041104 SPIF Fac for Phy Disable - Future 0 0 0 0 100 0 10049041204 SPIF Fac for Phy Disable - Future 0 0 0 0 0 192 192490606ES Engineering Services 696 0 0 0 0 0 0490607ES Engineering Services 3,800 0 0 0 0 0 0490608ES Engineering Services 0 3,800 0 0 0 0 3,800490609ES SPIF Engineering Services - Future 0 0 3,800 0 0 0 3,800490610ES SPIF Engineering Services - Future 0 0 0 3,800 0 0 3,800490611ES SPIF Engineering Services - Future 0 0 0 0 3,800 0 3,800490612ES SPIF Engineering Services - Future 0 0 0 0 0 3,800 3,80049BT0603 Brentwood State Park Athletic Compl 2,500 4,000 0 0 0 0 4,00049EC0305 Energy Conservation 20 0 0 0 0 0 049EC0405 Energy Conservation 135 35 35 35 35 84 22449EC0505 Energy Conservation 50 50 50 50 42 10 20249EC0605 Energy Conservation 20 20 20 20 20 20 10049EC0705 Energy Conservation 50 50 50 50 50 50 25049EC0805 Energy Conservation 0 50 25 32 0 0 10749EC0905 SPIF Energy Conservation - Future 0 0 0 25 82 0 10749EC1005 SPIF Energy Conservation - Future 0 0 0 57 50 0 10749EC1105 SPIF Energy Conservation - Future 0 0 0 0 57 0 5749EC1205 SPIF Energy Conservation - Future 0 0 0 0 0 50 5049GI0103 Miscellaneous Gifts 500 370 0 0 0 0 37049GI0203 Miscellaneous Gifts 100 345 0 0 0 0 34549GI0303 Miscellaneous Gifts 0 0 0 0 0 0 049GI0403 Miscellaneous Gifts 1,035 604 0 0 0 0 60449GI0503 Miscellaneous Gifts 2,365 681 1,730 1,000 1,000 1,000 5,41149GI0603 Miscellaneous Gifts 0 0 270 0 0 0 27049GI0703 Miscellaneous Gifts 0 0 0 0 0 0 049GI0803 Miscellaneous Gifts 0 0 0 0 500 500 1,00049GI0903 Misc Capital Projects - Future 0 0 0 0 500 500 1,00049GI1003 Misc Capital Projects - Future 0 0 0 1,000 0 0 1,00049GI1103 Misc Capital Projects - Future 0 0 0 0 0 0 049GI1203 Misc Capital Projects - Future 0 0 0 0 0 0 049HT0003 Heritage Trails 0 0 0 0 0 0 0

DETAILED DATA
214
Parks, Recreation and Historic Preservation, Office of PROJECTED APPROPRIATIONS AND DISBURSEMENTS BY PROGRAM
2008-2009 THROUGH 2012-2013 (thousands of dollars)
DISBURSEMENTS Estimated Total
2007-2008 2008-2009 2009-2010 2010-2011 2011-2012 2012-2013 2008-201349LV0403 I Love NY Water 50 0 0 0 0 0 049LV0603 I Love NY Water Account 100 100 100 100 100 100 50049LV0703 I Love NY Water Account 100 210 250 50 50 50 61049LV0803 I Love NY Water Account 0 150 110 100 100 100 56049LV0903 I Love NY Water Account - Future 0 0 100 60 60 60 28049LV1003 I Love NY Water Account - Future 0 0 0 214 100 100 41449LV1103 I Love NY Water Account - Future 0 0 0 0 60 60 12049LV1203 I Love NY Water Account - Future 0 0 0 0 0 50 5049NR0203 Resource Account 96 0 0 0 0 0 049NR0303 Resource Account 50 50 50 50 50 50 25049NR0403 Resource Account 91 0 0 0 0 0 049NR0503 Resource Account 288 0 0 0 0 0 049NR0603 Resource Account 50 100 100 75 100 100 47549NR0703 Resource Account 150 210 100 100 59 50 51949NR0803 Resource Account 0 150 110 50 50 50 41049NR0903 Resource Account - Future 0 0 0 50 50 50 15049NR1003 Resource Account - Future 0 0 0 100 50 100 25049NR1103 Resource Account - Future 0 0 0 0 60 60 12049NR1203 Resource Account - Future 0 0 0 0 0 50 5049PA0603 Minekill State Park 252 0 0 0 0 0 049PA0703 Minekill State Park 150 110 80 80 80 0 35049PA0803 Minekill 0 0 100 50 50 0 20049PA0903 Minekill - Future 0 0 0 50 50 50 15049PA1003 Minekill - Future 0 0 0 50 50 50 15049PA1103 Minekill - Future 0 0 0 0 50 50 10049PA1203 Minekill - Future 0 0 0 0 0 50 5049PC0803 State Parks Capital Initiative 0 75,000 35,000 0 0 0 110,00049PS0503 Preservation of Facilities 0 400 0 0 0 0 40049RR0203 Parks Capital Investment 0 100 100 0 0 0 20049RR0303 Parks Capital Investment 50 50 50 50 50 50 25049RR0403 Parks Capital Investment 0 100 100 91 100 100 49149RR0503 Parks Capital Investment 73 100 100 100 100 100 50049RR0603 Parks Capital Investment 100 210 75 50 50 15 40049RR0703 Parks Capital Investment 150 110 80 80 80 0 35049RR0803 Parks Capital Investment 0 0 145 100 0 0 24549RR0903 Parks Capital Investment - Future 0 0 0 100 50 50 20049RR1003 Parks Capital Investment - Future 0 0 0 0 51 55 10649RR1103 Parks Capital Investment - Future 0 0 0 0 100 100 20049RR1203 Parks Capital Investment - Future 0 0 0 0 0 50 5049TS0503 SPIF - Tioga State Park 400 0 420 0 0 64 48449ZZ06PM Preventive Maintenance - Staff 825 0 0 0 0 0 049ZZ07PM Preventive Maintenance 4,000 0 0 0 0 0 049ZZ08PM SPIF Preventive Maintenance - Futur 0 4,000 0 0 0 0 4,00049ZZ09PM SPIF Preventive Maintenance - Futur 0 0 4,000 0 0 0 4,00049ZZ10PM SPIF Preventive Maintenance - Futur 0 0 0 4,000 0 0 4,00049ZZ11PM SPIF Preventive Maintenance - Futur 0 0 0 0 4,000 0 4,00049ZZ12PM SPIF Preventive Maintenance - Futur 0 0 0 0 0 4,000 4,000 Subtotal 33,750 100,250 66,250 31,250 31,250 31,250 260,250Natural Heritage Trust 20039408 Museum Of Ceramic Art At Alfred 0 0 0 0 0 0 0 Subtotal 0 0 0 0 0 0 0Outdoor Recreation 01377107 Park And Recreation Land Acq B 0 0 0 0 0 01377210 Outdoor Rec Dev Bond Fund 0 0 0 0 0
00
00
Subtotal 0 0 0 0 0 0 0Parks EQBA 49EQ8707 Municipal Grants Under 1986 EQBA 0 0 0 0 0 0 049EQ8807 Municipal Grants Under 1986 EQBA 0 0 0 0 0 0 049EQ8907 Environmental Quality Bond Act 0 0 0 0 0 0 049EQ9007 1986 EQBA Mun Parks, Hist Pres 0 0 0 0 0 0 0 Subtotal 0 0 0 0 0 0 0 Total 37,350 103,850 69,850 34,850 34,850 34,850 278,250

DETAILED DATA
215
Agriculture and Markets, Department of PROJECTED APPROPRIATIONS AND DISBURSEMENTS BY PROGRAM
2008-2009 THROUGH 2012-2013 (thousands of dollars)
APPROPRIATIONS Reappro-
priations 2008-2009 2009-2010 2010-2011 2011-2012 New Facilities
2012-2013Total
2008-2013
60010607 Food Laboratory 39,964 0 0 0 0 0 060020607 Cornell Equine Drug Testing Lab 2,000 0 0 0 0 0 060030607 Fredonia Vineyard Lab 1,700 0 0 0 0 0 0 Subtotal 43,664 0 0 0 0 0 0State Fair 60MN0503 Maintenance 0 0 0 0 0 0 060MN0603 Maintenance 0 0 0 0 0 0 060MN0703 Maintenance 1,167 0 0 0 0 0 060MN0803 Maintenance 0 1,750 0 0 0 0 1,75060MN0903 Maintenance 0 0 1,750 0 0 0 1,75060MN1003 State Fair Capital 0 0 0 1,750 0 0 1,75060MN1103 State Fair Capital 0 0 0 0 1,750 0 1,75060MN1203 State Fair Maintenance 0 0 0 0 0 1,750 1,75060RI0503 Revenue Funds 0 0 0 0 0 0 060RI0603 Revenue Funds 0 0 0 0 0 0 060RI0703 Revenue Funds 0 0 0 0 0 0 060RI0803 Revenue Funds 0 2,000 0 0 0 0 2,00060RI0903 Revenue Funds 0 0 2,000 0 0 0 2,00060RI1003 Revenue Funds 0 0 0 2,000 0 0 2,00060RI1103 Revenue Funds 0 0 0 0 2,000 0 2,00060RI1203 State Fair Capital 0 0 0 0 0 2,000 2,000 Subtotal 1,167 3,750 3,750 3,750 3,750 3,750 18,750 Total 44,831 3,750 3,750 3,750 3,750 3,750 18,750
Agriculture and Markets, Department of
PROJECTED APPROPRIATIONS AND DISBURSEMENTS BY PROGRAM 2008-2009 THROUGH 2012-2013
(thousands of dollars) DISBURSEMENTS
Estimated Total
2007-2008 2008-2009 2009-2010 2010-2011 2011-2012 2012-2013 2008-2013New Facilities 60010607 Food Laboratory 2,000 34,000 3,000 996 0 0 37,99660020607 Cornell Equine Drug Testing Lab 500 1,500 0 0 0 0 1,50060030607 Fredonia Vineyard Lab 1,000 1,000 0 0 0 0 1,000 Subtotal 3,500 36,500 3,000 996 0 0 40,496State Fair 60MN0503 Maintenance 0 0 0 0 0 0 060MN0603 Maintenance 0 0 0 0 0 0 060MN0703 Maintenance 1,250 500 0 0 0 0 50060MN0803 Maintenance 0 1,250 0 0 0 0 1,25060MN0903 Maintenance 0 0 1,750 0 0 0 1,75060MN1003 State Fair Capital 0 0 0 1,750 0 0 1,75060MN1103 State Fair Capital 0 0 0 0 1,750 0 1,75060MN1203 State Fair Maintenance 0 0 0 0 0 1,750 1,75060RI0503 Revenue Funds 250 0 0 0 0 0 060RI0603 Revenue Funds 750 0 0 0 0 0 060RI0703 Revenue Funds 0 0 0 0 0 0 060RI0803 Revenue Funds 0 1,000 0 0 0 0 1,00060RI0903 Revenue Funds 0 0 1,000 0 0 0 1,00060RI1003 Revenue Funds 0 0 0 1,000 0 0 1,00060RI1103 Revenue Funds 0 0 0 0 1,000 0 1,00060RI1203 State Fair Capital 0 0 0 0 0 1,000 1,000 Subtotal 2,250 2,750 2,750 2,750 2,750 2,750 13,750 Total 5,750 39,250 5,750 3,746 2,750 2,750 54,246

DETAILED DATA
216
Empire State Development Corporation PROJECTED APPROPRIATIONS AND DISBURSEMENTS BY PROGRAM
2008-2009 THROUGH 2012-2013 (thousands of dollars)
APPROPRIATIONS Reappro-
priations 2008-2009 2009-2010 2010-2011 2011-2012 Economic Development 91000607 Construction of new Shea Stadium 44,700 0 0 0 0
2012-2013
0
Total2008-2013
091010607 Construction of new Yankee Stadium 74,700 0 0 0 0 0 091010709 Roosevelt Island Operating Corporat 15,000 0 0 0 0 0 091010809 Downstate Revitalization Fund 0 200,000 0 0 0 0 200,00091020709 Governor’s Island 20,000 0 0 0 0 0 091020809 Upstate Regional Blueprint Fund 0 250,000 0 0 0 0 250,00091030709 Harriman Research and Technology Pa 7,465 0 0 0 0 0 091030809 Upstate Agribusiness Fund 0 50,000 0 0 0 0 50,00091040709 USA Niagara 7,950 0 0 0 0 0 091040809 Investment and Opportunity Fund 0 150,000 0 0 0 0 150,00091050809 Arts and Cultural Program 0 40,000 0 0 0 0 40,000910706A3 Semiconductor Manufacturing Facilit 500,000 0 0 0 0 0 091070809 Economic Development Projects 0 60,000 0 0 0 0 60,00091080709 Development of a Chip Fab R&D Facil 300,000 0 0 0 0 0 091090809 Downstate Regional Initiatives 0 35,000 0 0 0 0 35,00091100809 Upstate City-by-City 0 115,000 0 0 0 0 115,000911106A3 RESTORE NY Communities Initiative 299,975 0 0 0 0 0 091AD00A3 Downtown Buffalo 41,450 0 0 0 0 0 0 Subtotal 1,311,240 900,000 0 0 0 Regional Development 910106A3 Economic Development Projects 212,008 0 0 0 0
0 900,000
0 0910206A3 University Development Projects 197,444 0 0 0 0 0 0910306A3 Cultural Facilities Project 129,327 0 0 0 0 0 0910406A3 Energy projects 29,757 0 0 0 0 0 0910506A3 Enivironmental Projects 20,000 0 0 0 0 0 0910606A3 Economic Development / Other Projec 557,007 0 0 0 0 0 091080609 Semiconductor R&D Acitivities 150,000 0 0 0 0 0 0910906A3 Photovoltaic Technology Advancement 15,000 0 0 0 0 0 0911006A3 NY Investment in Conservation and E 15,000 0 0 0 0 0 091CF97A3 Community Enhancement Facility Assi 425,000 0 0 0 0 0 0 Subtotal 1,750,543 0 0 0 0 Total 3,061,783 900,000 0 0 0
0 00 900,000

DETAILED DATA
217
Empire State Development Corporation PROJECTED APPROPRIATIONS AND DISBURSEMENTS BY PROGRAM
2008-2009 THROUGH 2012-2013 (thousands of dollars)
DISBURSEMENTS Estimated Total
2007-2008 2008-2009 2009-2010 2010-2011 2011-2012 2012-2013 2008-2013Economic Development 91000607 Construction of new Shea Stadium 30,000 20,000 4,700 0 0 0 24,70091010607 Construction of new Yankee Stadium 7,500 30,000 27,200 0 0 0 57,20091010709 Roosevelt Island Operating Corporat 5,000 10,000 0 0 0 0 10,00091010809 Downstate Revitalization Fund 0 20,000 50,000 60,000 50,000 20,000 200,00091020709 Governor’s Island 6,000 10,000 4,000 0 0 0 14,00091020809 Upstate Regional Blueprint Fund 0 25,000 62,500 75,000 62,500 25,000 250,00091030709 Harriman Research and Technology Pa 2,250 3,750 1,500 0 0 0 5,25091030809 Upstate Agribusiness Fund 0 5,000 12,500 15,000 12,500 5,000 50,00091040709 USA Niagara 2,400 3,500 1,550 0 0 0 5,05091040809 Investment and Opportunity Fund 0 15,000 37,500 45,000 37,500 15,000 150,00091050809 Arts and Cultural Program 0 4,000 10,000 12,000 10,000 4,000 40,000910706A3 Semiconductor Manufacturing Facilit 0 100,000 150,000 150,000 100,000 0 500,00091070809 Economic Development Projects 0 6,000 15,000 18,000 15,000 6,000 60,00091080709 Development of a Chip Fab R&D Facil 60,000 60,000 60,000 60,000 60,000 0 240,00091090809 Downstate Regional Initiatives 0 3,500 8,750 10,500 8,750 3,500 35,00091100809 Upstate City-by-City 0 11,500 28,750 34,500 28,750 11,500 115,000911106A3 RESTORE NY Communities Initiative 12,465 29,750 2,150 0 0 0 31,90091AD00A3 Downtown Buffalo 9,700 9,150 0 0 0 0 9,150 Subtotal 135,315 366,150 476,100 480,000 385,000 90,000 1,797,250
120,250Regional Development 910106A3 Economic Development Projects 40,205 45,000 53,550 10,000 6,200 5,500910206A3 University Development Projects 25,000 30,500 45,000 20,000 0 0 95,500910306A3 Cultural Facilities Project 30,000 32,800 45,000 5,000 0 0 82,800910406A3 Energy projects 15,000 14,000 1,000 0 0 0 15,000910506A3 Enivironmental Projects 8,000 12,000 0 0 0 0 12,000910606A3 Economic Development / Other Projec 110,000 300,000 120,000 5,910 0 0 425,91091080609 Semiconductor R&D Acitivities 0 0 0 0 50,000 100,000 150,000910906A3 Photovoltaic Technology Advancement 4,500 10,500 0 0 0 0 10,500911006A3 NY Investment in Conservation and E 4,500 10,500 0 0 0 0 10,50091CF97A3 Community Enhancement Facility Assi 31,800 26,935 21,250 21,515 16,770 13,000 99,470 Subtotal 269,005 482,235 285,800 62,425 72,970 118,500 1,021,930
2,819,180 Total 404,320 848,385 761,900 542,425 457,970 208,500

DETAILED DATA
218
Economic Development Capital PROJECTED APPROPRIATIONS AND DISBURSEMENTS BY PROGRAM
2008-2009 THROUGH 2012-2013 (thousands of dollars)
APPROPRIATIONS Reappro-
priations 2008-2009 2009-2010 2010-2011 2011-2012 Regional Development 71E102A3 Regional Development Capital Progra 600,000 0 0 0 0
2012-2013
0
Total2008-2013
071E202A3 Regional Development Capital Progra 300,000 0 0 0 0 0 071E302A3 Regional Development Capital Progra 300,000 0 0 0 0 0 071E404A3 $250M Regional Dev. 216,018 0 0 0 0 0 0 Subtotal 1,416,018 0 0 0 0 Total 1,416,018 0 0 0 0
0 00 0
Economic Development Capital
PROJECTED APPROPRIATIONS AND DISBURSEMENTS BY PROGRAM 2008-2009 THROUGH 2012-2013
(thousands of dollars) DISBURSEMENTS
Estimated Total
2007-2008 2008-2009 2009-2010 2010-2011 2011-2012 2012-2013 2008-2013Regional Development 71E102A3 Regional Development Capital Progra 139,385 50,000 15,000 10,000 10,000 10,000 95,00071E202A3 Regional Development Capital Progra 58,467 33,847 13,500 4,000 4,000 4,000 59,34771E302A3 Regional Development Capital Progra 10,348 12,878 5,000 1,377 1,500 1,500 22,25571E404A3 $250M Regional Dev. 10,000 10,000 15,000 14,623 12,000 12,000 63,623 Subtotal 218,200 106,725 48,500 30,000 27,500 27,500 240,225 Total 218,200 106,725 48,500 30,000 27,500 27,500 240,225

DETAILED DATA
219
Strategic Investment Program PROJECTED APPROPRIATIONS AND DISBURSEMENTS BY PROGRAM
2008-2009 THROUGH 2012-2013 (thousands of dollars)
APPROPRIATIONS
Strategic Investment Program 71SI00SI Strategic Investment Program Subtotal Total
Reappro- priations 2008-2009 2009-2010 2010-2011 2011-2012
126,914 0 0 0 0
2012-2013
0
Total2008-2013
0126,914 0 0 0 0 0 0126,914 0 0 0 0 0 0
Strategic Investment Program
PROJECTED APPROPRIATIONS AND DISBURSEMENTS BY PROGRAM 2008-2009 THROUGH 2012-2013
(thousands of dollars) DISBURSEMENTS
Estimated Total
2007-2008 2008-2009 2009-2010 2010-2011 2011-2012 2012-2013 2008-2013Strategic Investment Program 71SI00SI Strategic Investment Program Subtotal Total
28,000 10,000 14,000 14,000 10,376 5,000 53,37628,000 10,000 14,000 14,000 10,376 5,000 53,37628,000 10,000 14,000 14,000 10,376 5,000 53,376

DETAILED DATA
220
Science, Technology and Innovation, NYS Foundation for PROJECTED APPROPRIATIONS AND DISBURSEMENTS BY PROGRAM
2008-2009 THROUGH 2012-2013 (thousands of dollars)
APPROPRIATIONS
Research Facilities
Reappro- priations 2008-2009 2009-2010 2010-2011 2011-2012
2012-2013
Total2008-2013
000199RF R&D New Facilities 14,624 0 0 0 0 0 0000299RR R&D Facils Rehab Subtotal Total
17 0 0 0 0 0 014,641 0 0 0 0 0 014,641 0 0 0 0 0 0
Science, Technology and Innovation, NYS Foundation for
PROJECTED APPROPRIATIONS AND DISBURSEMENTS BY PROGRAM 2008-2009 THROUGH 2012-2013
(thousands of dollars) DISBURSEMENTS
Estimated Total
2007-2008 2008-2009 2009-2010 2010-2011 2011-2012 2012-2013 2008-2013Research Facilities 000199RF R&D New Facilities 8,200 3,976 0 0 0 0 3,976000299RR R&D Facils Rehab Subtotal Total
17 0 0 0 0 0 08,217 3,976 0 0 0 0 3,9768,217 3,976 0 0 0 0 3,976

DETAILED DATA
221
Economic Development Program, New York State PROJECTED APPROPRIATIONS AND DISBURSEMENTS BY PROGRAM
2008-2009 THROUGH 2012-2013 (thousands of dollars)
APPROPRIATIONS Reappro-
priations 2008-2009 2009-2010 2010-2011 2011-2012 New York State Economic Development
Program DP000509 NYS Economic Development Program 75,000 0 0 0 0 DP010409 NYS Economic Development Program 149,325 0 0 0 0
2012-2013
00
Total2008-2013
00
Subtotal 224,325 0 0 0 0 0 0 Total 224,325 0 0 0 0 0 0
Economic Development Program, New York State
PROJECTED APPROPRIATIONS AND DISBURSEMENTS BY PROGRAM 2008-2009 THROUGH 2012-2013
(thousands of dollars) DISBURSEMENTS
Estimated Total
2007-2008 2008-2009 2009-2010 2010-2011 2011-2012 2012-2013 2008-2013New York State Economic Development
Program DP000509 NYS Economic Development Program 11,300 7,450 5,000 7,000 5,000 8,840 33,290DP010409 NYS Economic Development Program 30,000 42,000 35,000 33,000 7,500 3,000 120,500 Subtotal 41,300 49,450 40,000 40,000 12,500 11,840 153,790 Total 41,300 49,450 40,000 40,000 12,500 11,840 153,790

DETAILED DATA
222
Jacob Javits Convention Center PROJECTED APPROPRIATIONS AND DISBURSEMENTS BY PROGRAM
2008-2009 THROUGH 2012-2013 (thousands of dollars)
APPROPRIATIONS Reappro-
priations 2008-2009 2009-2010 2010-2011 2011-2012 Jacob Javits Convention Center
2012-2013Total
2008-2013
CC000509 Javits Convention Center expansion 350,000 0 0 0 0 0 0 Subtotal 350,000 0 0 0 0 0 0 Total 350,000 0 0 0 0 0 0
Jacob Javits Convention Center
PROJECTED APPROPRIATIONS AND DISBURSEMENTS BY PROGRAM 2008-2009 THROUGH 2012-2013
(thousands of dollars) DISBURSEMENTS
Estimated
2007-2008 2008-2009 2009-2010 2010-2011 2011-2012 Jacob Javits Convention Center CC000509 Javits Convention Center expansion 0 0 185,000 140,000 25,000
2012-2013
0
Total2008-2013
350,000 Subtotal 0 0 185,000 140,000 25,000 0 350,000 Total 0 0 185,000 140,000 25,000 0 350,000
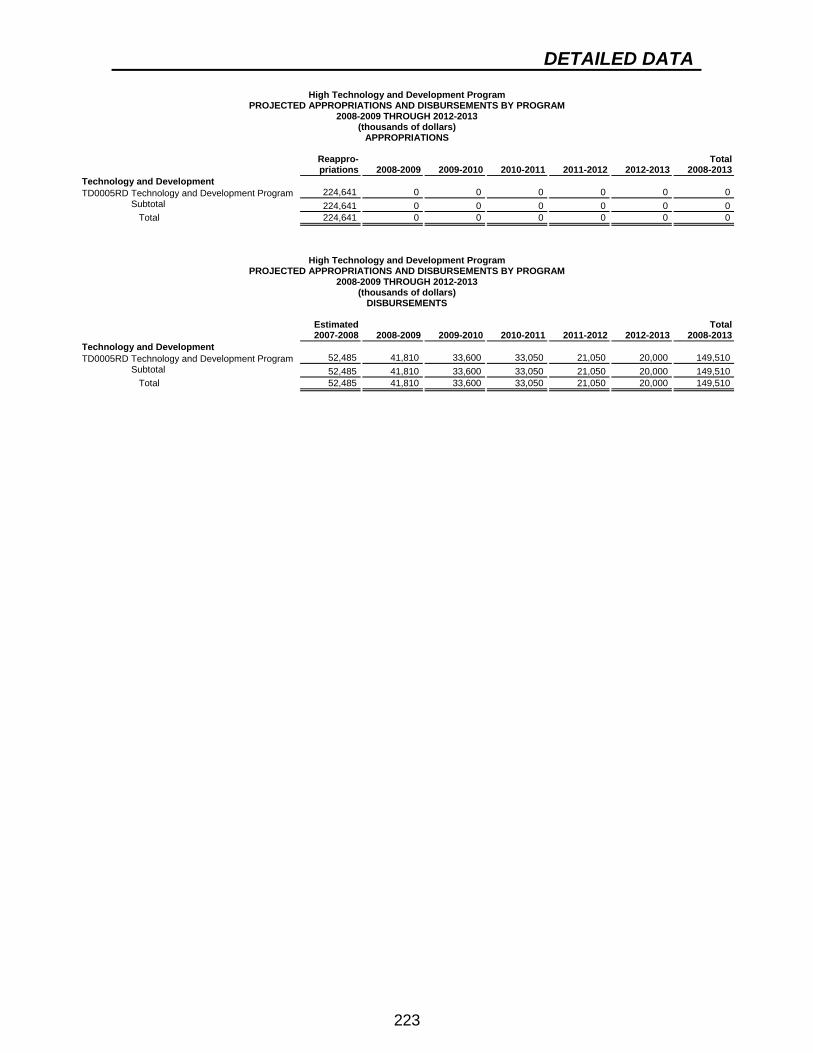
DETAILED DATA
223
High Technology and Development Program PROJECTED APPROPRIATIONS AND DISBURSEMENTS BY PROGRAM
2008-2009 THROUGH 2012-2013 (thousands of dollars)
APPROPRIATIONS Reappro-
priations 2008-2009 2009-2010 2010-2011 2011-2012 Technology and Development TD0005RD Technology and Development Program 224,641 0 0 0 0
2012-2013
0
Total2008-2013
0 Subtotal 224,641 0 0 0 0 0 0 Total 224,641 0 0 0 0 0 0
High Technology and Development Program
PROJECTED APPROPRIATIONS AND DISBURSEMENTS BY PROGRAM 2008-2009 THROUGH 2012-2013
(thousands of dollars) DISBURSEMENTS
Estimated Total
2007-2008 2008-2009 2009-2010 2010-2011 2011-2012 2012-2013 2008-2013Technology and Development TD0005RD Technology and Development Program 52,485 41,810 33,600 33,050 21,050 20,000 149,510 Subtotal 52,485 41,810 33,600 33,050 21,050 20,000 149,510 Total 52,485 41,810 33,600 33,050 21,050 20,000 149,510

DETAILED DATA
224
Regional Economic Development Program PROJECTED APPROPRIATIONS AND DISBURSEMENTS BY PROGRAM
2008-2009 THROUGH 2012-2013 (thousands of dollars)
APPROPRIATIONS Reappro-
priations 2008-2009 2009-2010 2010-2011 2011-2012 Regional Economic Development ED0005RE Regional Economic Development Progr 82,473 0 0 0 0
2012-2013
0
Total2008-2013
0 Subtotal 82,473 0 0 0 0 0 0 Total 82,473 0 0 0 0 0 0
Regional Economic Development Program
PROJECTED APPROPRIATIONS AND DISBURSEMENTS BY PROGRAM 2008-2009 THROUGH 2012-2013
(thousands of dollars) DISBURSEMENTS
Estimated Total
2007-2008 2008-2009 2009-2010 2010-2011 2011-2012 2012-2013 2008-2013Regional Economic Development ED0005RE Regional Economic Development Progr 40,225 12,145 11,380 11,380 7,527 0 42,432 Subtotal 40,225 12,145 11,380 11,380 7,527 0 42,432 Total 40,225 12,145 11,380 11,380 7,527 0 42,432

DETAILED DATA
225
Olympic Regional Development Authority PROJECTED APPROPRIATIONS AND DISBURSEMENTS BY PROGRAM
2008-2009 THROUGH 2012-2013 (thousands of dollars)
APPROPRIATIONS Reappro-
priations 2008-2009 2009-2010 2010-2011 2011-2012 Recreation
2012-2013Total
2008-2013
20010609 Old Gore Mtn Ski Bowl Connection 5,500 0 0 0 0 0 0 Subtotal 5,500 0 0 0 0 0 0 Total 5,500 0 0 0 0 0 0
Olympic Regional Development Authority
PROJECTED APPROPRIATIONS AND DISBURSEMENTS BY PROGRAM 2008-2009 THROUGH 2012-2013
(thousands of dollars) DISBURSEMENTS
Estimated Total
2007-2008 2008-2009 2009-2010 2010-2011 2011-2012 2012-2013 2008-2013Recreation 20010609 Old Gore Mtn Ski Bowl Connection 5,500 0 0 0 0 0 0 Subtotal 5,500 0 0 0 0 0 0 Total 5,500 0 0 0 0 0 0

DETAILED DATA
226
Energy Research and Development Authority, New York State PROJECTED APPROPRIATIONS AND DISBURSEMENTS BY PROGRAM
2008-2009 THROUGH 2012-2013 (thousands of dollars)
APPROPRIATIONS Reappro-
priations 2008-2009 2009-2010 2010-2011 2011-2012 Western New York Nuclear Service Center
2012-2013Total
2008-2013
Program 03WV07G6 West Valley 0 0 0 0 0 0 003WV08G6 West Valley 0 13,500 0 0 0 0 13,50003WV09G6 WV funding 0 0 13,500 0 0 0 13,50003WV1006 WV funding 0 0 0 13,500 0 0 13,50003WV11G6 WV Nuclear Service Center 0 0 0 0 13,500 0 13,50003WV12G6 Radioactive Waste Management 0 0 0 0 0 13,500 13,500 Subtotal 0 13,500 13,500 13,500 13,500 13,500 67,500 Total 0 13,500 13,500 13,500 13,500 13,500 67,500
Energy Research and Development Authority, New York State
PROJECTED APPROPRIATIONS AND DISBURSEMENTS BY PROGRAM 2008-2009 THROUGH 2012-2013
(thousands of dollars) DISBURSEMENTS
Estimated
2007-2008 2008-2009 2009-2010 2010-2011 2011-2012 Western New York Nuclear Service Center
Program 03WV07G6 West Valley 13,500 0 0 0 0 03WV08G6 West Valley 0 13,500 0 0 0 03WV09G6 WV funding 0 0 13,500 0 0 03WV1006 WV funding 0 0 0 13,500 0 03WV11G6 WV Nuclear Service Center 0 0 0 0 13,500 03WV12G6 Radioactive Waste Management 0 0 0 0 0
2012-2013
00000
13,500
Total2008-2013
013,50013,50013,50013,50013,500
Subtotal 13,500 13,500 13,500 13,500 13,500 13,500 67,500 Total 13,500 13,500 13,500 13,500 13,500 13,500 67,500

DETAILED DATA
227
Housing and Community Renewal, Division of PROJECTED APPROPRIATIONS AND DISBURSEMENTS BY PROGRAM
2008-2009 THROUGH 2012-2013 (thousands of dollars)
APPROPRIATIONS Reappro-
priations 2008-2009 2009-2010 2010-2011 2011-2012 Affordable Housing Corporation 08010507 Affordable Housing Corporation 20,788 0 0 0 0
2012-2013
0
Total2008-2013
008010607 Affordable Housing Corporation 24,725 0 0 0 0 0 008010707 Afford Housing Corp 25,000 0 0 0 0 0 008010807 Afford Housing Corp 0 25,000 0 0 0 0 25,00008010907 AHC 0 0 25,000 0 0 0 25,00008011007 AHC 0 0 0 25,000 0 0 25,00008011107 Affordable Housing Corporation 0 0 0 0 25,000 0 25,00008021207 Affordable Housing Corporation 0 0 0 0 0 25,000 25,00008A10407 Affordable Housing Corporation 0 0 0 0 0 0 008L20507 Affordable Housing Corporation 10,000 0 0 0 0 0 008L20607 Affordable Housing Corporation 5,000 0 0 0 0 Subtotal 85,513 25,000 25,000 25,000 25,000 Homes for Working Families Program 080211WF Homes for Working Families 0 0 0 0 7,000
0 025,000 125,000
0 7,000080305WF Homes For Working Families 7,000 0 0 0 0 0 0080406WF Homes For Working Families 7,000 0 0 0 0 0 0080507WF HWF 7,000 0 0 0 0 0 0080508WF HWF 0 7,000 0 0 0 0 7,000080509WF HWF 0 0 7,000 0 0 0 7,000080510WF HWF 0 0 0 7,000 0 0 7,000080612WF Homes for Working Families 0 0 0 0 0 7,000 7,00098L203WF Homes For Working Families 0 0 0 0 0 0 098L204WF Homes For Working Families 4,800 0 0 0 0 Subtotal 25,800 7,000 7,000 7,000 7,000 Housing Assistance Fund 08L10507 Housing Assistance Fund 1,500 0 0 0 0 08L10603 Adirondack Community Housing Trust 1,000 0 0 0 0 71068807 Housing Assistance Fund 10,586 0 0 0 0 Subtotal 13,086 0 0 0 0 Housing Opportunity Program For Elderly 080307H3 HOPE 0 0 0 0 0
0 07,000 35,000
000
000
0 0
0 0080308H3 HOPE 0 400 0 0 0 0 400080309H3 HOPE 0 0 400 0 0 0 400080310H3 HOPE 0 0 0 400 0 0 400080311H3 HOPE 0 0 0 0 400 0 40008051201 HOPE 0 0 0 0 0 Subtotal 0 400 400 400 400 Housing Program Capital Improvement 71259050 For Transfer To Housing Program Fu 19,720 0 0 0 0 Subtotal 19,720 0 0 0 0 Low Income Housing Trust Fund
400 400400 2,000
0 00 0
08011207 Housing Trust Fund 0 0 0 0 0 29,000 29,00008020607 Housing Trust Fund 29,000 0 0 0 0 0 008020707 Low Income Housing Trust Fund 29,000 0 0 0 0 0 008020807 Low Income Housing Trust Fund 0 29,000 0 0 0 0 29,00008020907 HTF 0 0 29,000 0 0 0 29,00008021007 HTF 0 0 0 29,000 0 0 29,00008040507 Housing Trust Fund 29,000 0 0 0 0 0 008041107 Low Income Housing Trust Fund 0 0 0 0 29,000 0 29,00008110307 Housing Trust Fund 0 0 0 0 0 0 008110407 Housing Trust Fund 18,851 0 0 0 0 0 008L30507 Housing Trust Fund 10,000 0 0 0 0 0 008L40607 Housing Trust Fund 10,000 0 0 0 0 Subtotal 125,851 29,000 29,000 29,000 29,000 Maintenance and Improvements of Existing
Facilities
0 029,000 145,000
08A19903 Housing Project Repair Program 1,082 0 0 0 0 0 021A18603 Deposit Housing Proj Repair Fund 185 0 0 0 0 0 021A19303 Preservation Of Facilities 88 0 0 0 0 0 021A38803 Preservation Of Facilities 159 0 0 0 0 0 021A48903 Preservation Of Facilities 71 0 0 0 0 0 021A49203 Preservation Of Facilities 1,387 0 0 0 0 0 021A59003 Preservation Of Facilities 15 0 0 0 0 0 021A69103 Preservation Of Facilities 1,038 0 0 0 0 Subtotal 4,025 0 0 0 0 New Facilities 08019107 New Facilities 28,434 0 0 0 0 08019607 Construction/Redevelopment Projects 122 0 0 0 0 Subtotal 28,556 0 0 0 0 Public Housing Modernization Program 080102PH Public Housing Modernization 786 0 0 0 0 080103PH Public Housing Modernization 12,800 0 0 0 0 080104PH Public Housing Modernization 12,800 0 0 0 0
0 00 0
00
00
0 0
000
000

DETAILED DATA
228
Housing and Community Renewal, Division of PROJECTED APPROPRIATIONS AND DISBURSEMENTS BY PROGRAM
2008-2009 THROUGH 2012-2013 (thousands of dollars)
APPROPRIATIONS Reappro-
priations 2008-2009 2009-2010 2010-2011 2011-2012 2012-2013Total
2008-2013080406PH Public Housing Modernization 12,800 0 0 0 0 0 0080407PH PHM 12,800 0 0 0 0 0 0080408PH PHM 0 12,800 0 0 0 0 12,800080409PH PHM 0 0 12,800 0 0 0 12,800080410PH PHM 0 0 0 12,800 0 0 12,80008041203 Public Housing Mod 0 0 0 0 0 12,800 12,800080505PH Public Housing Modernization 12,800 0 0 0 0 0 0080511PH PHM 0 0 0 0 12,800 0 12,80098L100PH Public Housing Modernization 400 0 0 0 0 0 0 Subtotal 65,186 12,800 12,800 12,800 12,800 12,800 64,000Rural Revitalization Program 08L306G7 Rural Area Revitalization 2,500 0 0 0 0 0 008L505G7 Rural Area Revitalization 250 0 0 0 0 0 0 Subtotal 2,750 0 0 0 0 0 0State Housing Bond Fund 01347407 Low Rent Housing 50 0 0 0 0 01347607 Low Rent Housing 7,294 0 0 0 0
00
00
Subtotal 7,344 0 0 0 0 0 0Urban Initiatives Program 08L405G8 Urban Initiatives 875 0 0 0 0 0 008L606G8 Urban Initiatives 1,500 0 0 0 0 0 0 Subtotal 2,375 0 0 0 0 0 0 Total 380,206 74,200 74,200 74,200 74,200 74,200 371,000

DETAILED DATA
229
Housing and Community Renewal, Division of PROJECTED APPROPRIATIONS AND DISBURSEMENTS BY PROGRAM
2008-2009 THROUGH 2012-2013 (thousands of dollars)
DISBURSEMENTS Estimated
2007-2008 2008-2009 2009-2010 2010-2011 2011-2012 Affordable Housing Corporation 08010507 Affordable Housing Corporation 15,775 0 8,950 0 0 08010607 Affordable Housing Corporation 8,950 15,775 0 0 0 08010707 Afford Housing Corp 275 0 15,775 8,950 0 08010807 Afford Housing Corp 0 4,225 0 15,775 5,000 08010907 AHC 0 0 275 0 19,725 08011007 AHC 0 0 0 275 0 08011107 Affordable Housing Corporation 0 0 0 0 275 08021207 Affordable Housing Corporation 0 0 0 0 0 08A10407 Affordable Housing Corporation 6,062 0 0 0 0 08L20507 Affordable Housing Corporation 10,000 0 0 0 0 08L20607 Affordable Housing Corporation 0 5,000 0 0 0 Subtotal 41,062 25,000 25,000 25,000 25,000 Homes for Working Families Program 080211WF Homes for Working Families 0 0 0 0 0
2012-2013
0000000
25,000000
Total2008-2013
8,95015,77524,72525,00020,000
275275
25,00000
5,00025,000 125,000
0 0080305WF Homes For Working Families 2,200 4,800 0 0 0 0 4,800080406WF Homes For Working Families 0 2,200 4,800 0 0 0 7,000080507WF HWF 0 0 2,200 4,800 0 0 7,000080508WF HWF 0 0 0 2,200 4,800 0 7,000080509WF HWF 0 0 0 0 2,200 0 2,200080510WF HWF 0 0 0 0 0 0 0080612WF Homes for Working Families 0 0 0 0 0 7,000 7,00098L203WF Homes For Working Families 0 0 0 0 0 0 098L204WF Homes For Working Families 4,800 0 0 0 0 Subtotal 7,000 7,000 7,000 7,000 7,000 Housing Assistance Fund 08L10507 Housing Assistance Fund 500 1,000 0 0 0 08L10603 Adirondack Community Housing Trust 1,000 0 0 0 0 71068807 Housing Assistance Fund 10,586 0 0 0 0 Subtotal 12,086 1,000 0 0 0 Housing Opportunity Program For Elderly 080307H3 HOPE 400 0 0 0 0
0 07,000 35,000
000
1,00000
0 1,000
0 0080308H3 HOPE 0 400 0 0 0 0 400080309H3 HOPE 0 0 400 0 0 0 400080310H3 HOPE 0 0 0 400 0 0 400080311H3 HOPE 0 0 0 0 400 0 40008051201 HOPE 0 0 0 0 0 Subtotal 400 400 400 400 400 Housing Program Capital Improvement 71259050 For Transfer To Housing Program Fu 0 0 0 0 0 Subtotal 0 0 0 0 0 Low Income Housing Trust Fund
400 400400 2,000
0 00 0
08011207 Housing Trust Fund 0 0 0 0 0 29,000 29,00008020607 Housing Trust Fund 0 0 27,046 1,954 0 0 29,00008020707 Low Income Housing Trust Fund 0 0 0 27,046 1,954 0 29,00008020807 Low Income Housing Trust Fund 0 0 0 0 27,046 0 27,04608020907 HTF 0 0 0 0 0 0 008021007 HTF 0 0 0 0 0 0 008040507 Housing Trust Fund 0 27,046 1,954 0 0 0 29,00008041107 Low Income Housing Trust Fund 0 0 0 0 0 0 008110307 Housing Trust Fund 3,919 0 0 0 0 0 008110407 Housing Trust Fund 27,046 1,954 0 0 0 0 1,95408L30507 Housing Trust Fund 10,000 0 0 0 0 0 008L40607 Housing Trust Fund 0 10,000 0 0 0 Subtotal 40,965 39,000 29,000 29,000 29,000 Maintenance and Improvements of Existing
Facilities
0 10,00029,000 155,000
08A19903 Housing Project Repair Program 0 0 0 0 0 0 021A18603 Deposit Housing Proj Repair Fund 0 0 0 0 0 0 021A19303 Preservation Of Facilities 0 0 0 0 0 0 021A38803 Preservation Of Facilities 0 0 0 0 0 0 021A48903 Preservation Of Facilities 0 0 0 0 0 0 021A49203 Preservation Of Facilities 0 0 0 0 0 0 021A59003 Preservation Of Facilities 0 0 0 0 0 0 021A69103 Preservation Of Facilities 0 0 0 0 0 Subtotal 0 0 0 0 0 New Facilities 08019107 New Facilities 3,000 3,000 3,000 3,000 3,000 08019607 Construction/Redevelopment Projects 122 0 0 0 0 Subtotal 3,122 3,000 3,000 3,000 3,000 Public Housing Modernization Program 080102PH Public Housing Modernization 3,485 0 0 0 0 080103PH Public Housing Modernization 1,515 11,285 0 0 0 080104PH Public Housing Modernization 0 1,515 11,285 0 0
0 00 0
3,0000
15,0000
3,000 15,000
000
011,28512,800

DETAILED DATA
230
Housing and Community Renewal, Division of PROJECTED APPROPRIATIONS AND DISBURSEMENTS BY PROGRAM
2008-2009 THROUGH 2012-2013 (thousands of dollars)
DISBURSEMENTS Estimated Total
2007-2008 2008-2009 2009-2010 2010-2011 2011-2012 080406PH Public Housing Modernization 0 0 0 1,515 11,285
2012-20130
2008-201312,800
080407PH PHM 0 0 0 0 1,515 0 1,515080408PH PHM 0 0 0 0 0 0 0080409PH PHM 0 0 0 0 0 0 0080410PH PHM 0 0 0 0 0 0 008041203 Public Housing Mod 0 0 0 0 0 12,800 12,800080505PH Public Housing Modernization 0 0 1,515 11,285 0 0 12,800080511PH PHM 0 0 0 0 0 0 098L100PH Public Housing Modernization 400 0 0 0 0 Subtotal 5,400 12,800 12,800 12,800 12,800 Rural Revitalization Program 08L306G7 Rural Area Revitalization 250 2,250 0 0 0
012,800
0
064,000
2,25008L505G7 Rural Area Revitalization 750 0 0 0 0 Subtotal 1,000 2,250 0 0 0 State Housing Bond Fund 01347407 Low Rent Housing 0 0 0 0 0 01347607 Low Rent Housing 0 0 0 0 0 Subtotal 0 0 0 0 0 Urban Initiatives Program 08L405G8 Urban Initiatives 500 625 0 0 0
00
000
0
02,250
000
62508L606G8 Urban Initiatives 0 1,500 0 0 0 Subtotal 500 2,125 0 0 0 Total 111,535 92,575 77,200 77,200 77,200
00
77,200
1,5002,125
401,375

DETAILED DATA
231
Children and Family Services Office of PROJECTED APPROPRIATIONS AND DISBURSEMENTS BY PROGRAM
2008-2009 THROUGH 2012-2013 (thousands of dollars)
APPROPRIATIONS Reappro-
priations 2008-2009 2009-2010 2010-2011 2011-2012 Child Care Facilities Development Program 250100DC Child Care Centers 0 0 0 0 0 Subtotal 0 0 0 0 0 Design and Construction Supervision
2012-2013
0
Total2008-2013
00 0
25GS0530 D&C Fees, Consultant Svcs 531 0 0 0 0 0 025GS0630 D&C Fees Consultant 4,162 0 0 0 0 0 025GS0730 Consultant/OGS Design Construction 7,000 0 0 0 0 0 025GS0830 Consultant/OGS Design 0 7,000 0 0 0 0 7,00025GS0930 Consultant/OGS Design 0 0 7,000 0 0 0 7,00025GS1030 OGS S/C Consutant 0 0 0 7,000 0 0 7,00025GS1130 Consultant/OGS Design 0 0 0 0 7,000 0 7,00025GS1230 Consultant / OGS Design 0 0 0 0 0 Subtotal 11,693 7,000 7,000 7,000 7,000 Executive Direction and Administrative Services
7,000 7,0007,000 35,000
25MS0008 Local Share Of Ocfs Capital Project 2,720 0 0 0 0 Subtotal 2,720 0 0 0 0 Maintenance and Improvement of Facilities 25010001 Health And Safety 431 0 0 0 0
0 00 0
0 025010101 Health And Safety 1,089 0 0 0 0 0 025010201 Health And Safety 899 0 0 0 0 0 025010301 Health And Safety 1,475 0 0 0 0 0 025010401 For Projects Related To Health & Sa 4,600 0 0 0 0 0 025010501 Health And Safety 5,115 0 0 0 0 0 025010601 Youth Facility Health And Safety 5,000 0 0 0 0 0 025010701 Health and Safety 5,000 0 0 0 0 0 025010801 Health Safety 0 5,000 0 0 0 0 5,00025010901 Health and Safety 0 0 5,000 0 0 0 5,00025011001 Health & Safety 0 0 0 5,000 0 0 5,00025011101 Health and Safety 0 0 0 0 5,000 0 5,00025011201 Health & Safety 0 0 0 0 0 5,000 5,00025030003 Preservation Of Facilities 222 0 0 0 0 0 025030103 Preservation Of Facilities 365 0 0 0 0 0 025030203 Preservation Of Facilities 1,545 0 0 0 0 0 025030303 Preservation Of Facilities 2,412 0 0 0 0 0 025030403 For Preservation Of Facilities 3,984 0 0 0 0 0 025030503 Preservation Of Facilities 5,000 0 0 0 0 0 025030603 Preservation Of Facilities 6,000 0 0 0 0 0 025030703 Preservation of Facilities 6,000 0 0 0 0 0 025030803 Preservation of Facilities 0 6,000 0 0 0 0 6,00025030903 Preservation of Facilities 0 0 6,000 0 0 0 6,00025031003 Preservation of Facilities 0 0 0 6,000 0 0 6,00025031103 Preservation of Facilities 0 0 0 0 6,000 0 6,00025031203 Preservation of Facilities 0 0 0 0 0 6,000 6,00025039903 Preservation Of Facilities 0 0 0 0 0 0 025069906 Water And Sewer Renovations 282 0 0 0 0 0 025A10201 Health And Safety 1,318 0 0 0 0 0 025EN0006 Environmental Protections Projects 0 0 0 0 0 0 025EN0106 YF Environmental Projects 514 0 0 0 0 0 025EN0206 Environmental Projects 2,743 0 0 0 0 0 025EN0306 Environmental Improvement 3,854 0 0 0 0 0 025EN0406 Environmental Improvement 2,485 0 0 0 0 0 025EN0506 Environmental Improvement 4,000 0 0 0 0 0 025EN0606 Environ Prot & Impr 4,000 0 0 0 0 0 025EN0706 Environ Prot & Impr 4,000 0 0 0 0 0 025EN0806 Environ Prot & Impr 0 4,000 0 0 0 0 4,00025EN0906 Environmental Improvement 0 0 4,000 0 0 0 4,00025EN1006 Environ Prot & Impr 0 0 0 4,000 0 0 4,00025EN1106 Environ Prot & Impr 0 0 0 0 4,000 0 4,00025EN1206 Environ Prot & Impr 0 0 0 0 0 4,000 4,00025GM0303 General Maintenance 0 0 0 0 0 0 025GM0403 General Maintenance Projects 308 0 0 0 0 0 025GM0503 General Maintenance 884 0 0 0 0 0 025GM0603 General Maintenance 1,500 0 0 0 0 0 025GM0703 General Maintenance 1,500 0 0 0 0 0 025GM0803 General Maintenance 0 1,500 0 0 0 0 1,50025GM0903 General Maintenance 0 0 1,500 0 0 0 1,50025GM1003 General Maintenance 0 0 0 1,500 0 0 1,50025GM1103 General Maintenance 0 0 0 0 1,500 0 1,50025GM1203 General Maintenance 0 0 0 0 0 1,500 1,50025ST0750 Admin 0 0 0 0 0 0 025ST0850 Admin 0 823 0 0 0 0 82325ST0950 Admin 0 0 823 0 0 0 82325ST1050 Admin 0 0 0 823 0 0 82325ST1150 Admin 0 0 0 0 823 0 82325ST1250 Admin 0 0 0 0 0 823 82325T30203 Tonawanda Improvement 346 0 0 0 0 0 0

DETAILED DATA
232
Children and Family Services Office of PROJECTED APPROPRIATIONS AND DISBURSEMENTS BY PROGRAM
2008-2009 THROUGH 2012-2013 (thousands of dollars)
APPROPRIATIONS Reappro-
priations 2008-2009 2009-2010 2010-2011 2011-2012 2012-2013Total
2008-201325T30303 Improve Tonawanda 954 0 0 0 0 0 025T30403 Tonawanda Improvement 325 0 0 0 0 0 025T30503 Tonawanda Improvement 325 0 0 0 0 0 025T30603 Tonawanda Improvement 325 0 0 0 0 0 025T30703 Tonawanda Improvement 325 0 0 0 0 0 025T30803 Tonawanda Improvement 0 325 0 0 0 0 32525T30903 Tonawanda Improvement 0 0 325 0 0 0 32525T31003 Tonawanda Improvement 0 0 0 325 0 0 32525T31103 Tonawanda Improvement 0 0 0 0 325 0 32525T31203 Tonawanda Improvement 0 0 0 0 0 325 325 Subtotal 79,125 17,648 17,648 17,648 17,648 17,648 88,240Program Improvement or Program Change 25080008 Program Improvement Or Program Chan 445 0 0 0 0 25080308 Program Improvement Or Program Chan 1,054 0 0 0 0 25080708 Program Improvement 13,840 0 0 0 0 25080908 Program Improvement 0 0 13,840 0 0 25081008 Program & Security Imprv or Chng 0 0 0 13,840 0 25081108 Program Improvement 0 0 0 0 13,840 25081208 Program Improvement 0 0 0 0 0 25089808 Program Improvement Or Program Chan 0 0 0 0 0 25089908 Program Improvemntntor Program Chan 0 0 0 0 0 25A80508 Program Improvement or Program Chan 527 0 0 0 0 25A80608 Program & Security Imprv or Change 8,000 0 0 0 0 25A80808 Program Improvement 0 13,840 0 0 0 25OC0608 Ohel Camp for the Disabled 2,500 0 0 0 0 25UW0608 United Way 211 3,308 0 0 0 0 48219407 NYC 25-Bed Dfy Facility/Youth Cente 0 0 0 0 0
000000
13,84000000000
000
13,84013,84013,84013,840
0000
13,840000
Subtotal 29,674 13,840 13,840 13,840 13,840 13,840 69,200Youth Center 48519008 Youth Center Development And Rehab 5,338 0 0 0 0 0 0 Subtotal 5,338 0 0 0 0 0 0 Total 128,550 38,488 38,488 38,488 38,488 38,488 192,440

DETAILED DATA
233
Children and Family Services Office of PROJECTED APPROPRIATIONS AND DISBURSEMENTS BY PROGRAM
2008-2009 THROUGH 2012-2013 (thousands of dollars)
DISBURSEMENTS Estimated Total
2007-2008 2008-2009 2009-2010 2010-2011 2011-2012 2012-2013 2008-2013Child Care Facilities Development Program 250100DC Child Care Centers 0 0 0 0 0 Subtotal 0 0 0 0 0 Design and Construction Supervision
0 00 0
25GS0530 D&C Fees, Consultant Svcs 1,000 0 15 0 0 0 1525GS0630 D&C Fees Consultant 0 500 1,000 2,000 1,813 0 5,31325GS0730 Consultant/OGS Design Construction 1,000 1,000 0 0 1,000 0 2,00025GS0830 Consultant/OGS Design 0 1,000 0 0 0 0 1,00025GS0930 Consultant/OGS Design 0 0 1,500 0 0 0 1,50025GS1030 OGS S/C Consutant 0 0 0 2,000 0 0 2,00025GS1130 Consultant/OGS Design 0 0 0 0 0 0 025GS1230 Consultant / OGS Design 0 0 0 0 0 Subtotal 2,000 2,500 2,515 4,000 2,813 Executive Direction and Administrative Services 25MS0008 Local Share Of Ocfs Capital Project 660 660 0 0 0 Subtotal 660 660 0 0 0 Maintenance and Improvement of Facilities 25010001 Health And Safety 95 0 0 0 0
0 00 11,828
0 6600 660
0 025010101 Health And Safety 200 0 0 1,000 0 0 1,00025010201 Health And Safety 0 1,163 0 0 0 0 1,16325010301 Health And Safety 250 270 500 628 0 0 1,39825010401 For Projects Related To Health & Sa 1,000 400 600 0 1,000 0 2,00025010501 Health And Safety 410 1,180 1,800 0 110 1,000 4,09025010601 Youth Facility Health And Safety 500 900 1,400 500 1,000 0 3,80025010701 Health and Safety 380 500 500 500 1,000 1,000 3,50025010801 Health Safety 0 500 515 0 685 0 1,70025010901 Health and Safety 0 0 0 0 0 0 025011001 Health & Safety 0 0 0 1,000 0 0 1,00025011101 Health and Safety 0 0 0 0 0 0 025011201 Health & Safety 0 0 0 0 0 0 025030003 Preservation Of Facilities 50 0 0 0 0 0 025030103 Preservation Of Facilities 0 87 0 0 0 0 8725030203 Preservation Of Facilities 250 0 1,000 0 0 0 1,00025030303 Preservation Of Facilities 250 250 700 1,000 0 0 1,95025030403 For Preservation Of Facilities 815 1,000 0 1,000 985 0 2,98525030503 Preservation Of Facilities 793 1,100 500 500 207 1,000 3,30725030603 Preservation Of Facilities 500 1,500 1,000 0 2,000 0 4,50025030703 Preservation of Facilities 369 0 1,400 0 500 2,000 3,90025030803 Preservation of Facilities 0 315 300 0 685 2,000 3,30025030903 Preservation of Facilities 0 0 0 1,000 500 500 2,00025031003 Preservation of Facilities 0 0 0 1,315 685 0 2,00025031103 Preservation of Facilities 0 0 0 0 0 0 025031203 Preservation of Facilities 0 0 0 0 0 0 025039903 Preservation Of Facilities 157 0 0 0 0 0 025069906 Water And Sewer Renovations 88 0 0 0 0 0 025A10201 Health And Safety 0 500 300 0 400 0 1,20025EN0006 Environmental Protections Projects 15 0 0 0 0 0 025EN0106 YF Environmental Projects 500 0 0 0 0 0 025EN0206 Environmental Projects 1,000 1,250 0 94 0 0 1,34425EN0306 Environmental Improvement 0 1,000 500 0 687 0 2,18725EN0406 Environmental Improvement 1,331 1,000 0 0 500 0 1,50025EN0506 Environmental Improvement 1,330 1,100 500 0 415 0 2,01525EN0606 Environ Prot & Impr 0 0 0 2,000 1,000 0 3,00025EN0706 Environ Prot & Impr 0 0 0 0 1,000 2,000 3,00025EN0806 Environ Prot & Impr 0 0 0 0 0 1,000 1,00025EN0906 Environmental Improvement 0 0 450 500 500 500 1,95025EN1006 Environ Prot & Impr 0 0 0 2,000 0 0 2,00025EN1106 Environ Prot & Impr 0 0 0 0 0 0 025EN1206 Environ Prot & Impr 0 0 0 0 0 0 025GM0303 General Maintenance 276 0 0 0 0 0 025GM0403 General Maintenance Projects 251 300 0 0 0 0 30025GM0503 General Maintenance 635 150 200 0 0 0 35025GM0603 General Maintenance 200 950 100 150 100 0 1,30025GM0703 General Maintenance 0 400 300 150 600 0 1,45025GM0803 General Maintenance 0 0 500 100 150 600 1,35025GM0903 General Maintenance 0 0 300 0 500 300 1,10025GM1003 General Maintenance 0 0 0 1,250 0 150 1,40025GM1103 General Maintenance 0 0 0 0 250 500 75025GM1203 General Maintenance 0 0 0 0 0 0 025ST0750 Admin 685 0 0 0 0 0 025ST0850 Admin 0 685 0 0 0 0 68525ST0950 Admin 0 0 685 0 0 0 68525ST1050 Admin 0 0 0 685 0 0 68525ST1150 Admin 0 0 0 0 685 0 68525ST1250 Admin 0 0 0 0 0 0 025T30203 Tonawanda Improvement 250 0 0 0 0 0 0

DETAILED DATA
234
Children and Family Services Office of PROJECTED APPROPRIATIONS AND DISBURSEMENTS BY PROGRAM
2008-2009 THROUGH 2012-2013 (thousands of dollars)
DISBURSEMENTS Estimated Total
2007-2008 2008-2009 2009-2010 2010-2011 2011-2012 2012-2013 2008-201325T30303 Improve Tonawanda 150 0 350 0 350 25T30403 Tonawanda Improvement 0 200 0 0 0 25T30503 Tonawanda Improvement 150 0 150 0 0 25T30603 Tonawanda Improvement 0 0 0 0 50 25T30703 Tonawanda Improvement 0 0 0 0 0 25T30803 Tonawanda Improvement 0 0 0 0 0 25T30903 Tonawanda Improvement 0 0 100 50 0 25T31003 Tonawanda Improvement 0 0 0 300 0 25T31103 Tonawanda Improvement 0 0 0 0 0 25T31203 Tonawanda Improvement 0 0 0 0 0
0000
250100
00
1000
70020015050
250100150300100
0 Subtotal 12,880 16,700 14,650 15,722 16,544 13,000 76,616Program Improvement or Program Change 25080008 Program Improvement Or Program Chan 250 0 0 0 0 25080308 Program Improvement Or Program Chan 0 500 0 0 500 25080708 Program Improvement 370 300 2,000 0 500 25080908 Program Improvement 0 0 0 1,000 0 25081008 Program & Security Imprv or Chng 0 0 0 1,000 0 25081108 Program Improvement 0 0 0 0 263 25081208 Program Improvement 0 0 0 0 0 25089808 Program Improvement Or Program Chan 380 0 0 0 0 25089908 Program Improvemntntor Program Chan 500 0 0 0 0 25A80508 Program Improvement or Program Chan 0 0 0 278 0 25A80608 Program & Security Imprv or Change 620 1,000 2,285 0 380 25A80808 Program Improvement 0 0 550 0 0 25OC0608 Ohel Camp for the Disabled 1,650 0 0 0 0 25UW0608 United Way 211 2,300 0 0 0 0 48219407 NYC 25-Bed Dfy Facility/Youth Cente 0 0 0 0 0
00
4,0000000000
2,0002,000
000
01,0006,8001,0001,000
263000
2785,6652,550
000
Subtotal 6,070 1,800 4,835 2,278 1,643 8,000 18,556Youth Center 48519008 Youth Center Development And Rehab 0 0 0 0 0 0 0 Subtotal 0 0 0 0 0 0 0 Total 21,610 21,660 22,000 22,000 21,000 21,000 107,660

DETAILED DATA
235
Health, Department of PROJECTED APPROPRIATIONS AND DISBURSEMENTS BY PROGRAM
2008-2009 THROUGH 2012-2013 (thousands of dollars)
APPROPRIATIONS Reappro-
priations 2008-2009 2009-2010 2010-2011 2011-2012 Health Care Efficiency and Affordability Law for
New Yorkers
2012-2013Total
2008-2013
12BD05CH HEAL NY Bonded for Community Health 10,000 0 0 0 0 0 0
12BD05HE HEAL NY Initiative Bonded 171,001 0 0 0 0 0 012BD06HE HEAL NY Bond Program 80,928 0 0 0 0 0 012BD07HE HEAL NY Bond Program 85,000 0 0 0 0 0 012BD08HE HEAL NY Bond Program 0 85,000 0 0 0 0 85,00012HE05HE HEAL NY Initiative 47,048 0 0 0 0 0 012HE06HE HEAL NY Grant Program 140,000 0 0 0 0 0 012HE07HE HEAL NY Grant Program 140,000 0 0 0 0 0 012HE08HE HEAL NY Grant Program 0 140,000 0 0 0 0 140,00012RP07HE HEAL/HCRA for Roswell Park Cancer I 6,250 0 0 0 0 0 012RP08HE HEAl/HCRA for Roswell Park Cancer I 0 25,000 0 0 0 0 25,000 Subtotal 680,227 250,000 0 0 0 0 250,000Laboratories and Research 12590203 Laboratories And Reasearch 0 0 0 0 0 0 012590303 Laboratories And Research 1,988 0 0 0 0 0 012590403 Laboratories And Research 2,190 0 0 0 0 0 012590503 Maint.&Improve. Of Labs 2,397 0 0 0 0 0 012590603 Preservation of Facilities Labs 7,359 0 0 0 0 0 0125906BB Umbilical Blood Bank Ctr. in Syracu 5,000 0 0 0 0 0 012590703 Preservation of facilities 8,446 0 0 0 0 0 012590803 Preservation of Facilities 0 10,000 0 0 0 0 10,00012590903 Preservation of facilities 0 0 10,000 0 0 0 10,00012591003 Preservation of Facilities 0 0 0 10,000 0 0 10,00012591103 Capital Funding for Labs 0 0 0 0 10,000 0 10,00012591203 Preservation of Laboratories 0 0 0 0 0 10,000 10,000 Subtotal 27,380 10,000 10,000 10,000 10,000 10,000 50,000Maintenance and Improvements of Existing
Institutions 12600203 Institutional Management 0 0 0 0 0 0 012600303 Institutional Management 5,090 0 0 0 0 0 012600403 Institutional Management 4,983 0 0 0 0 0 012600503 Maint.&Improve. Of Facilities 4,119 0 0 0 0 0 012600603 Preservation of instutional facilit 3,684 0 0 0 0 0 012600703 Institutional Management 7,058 0 0 0 0 0 012600803 Institutional Management 0 7,600 0 0 0 0 7,60012600903 Institutional Management 0 0 7,600 0 0 0 7,60012601003 Preservation of Facilities 0 0 0 7,600 0 0 7,60012601103 Capital funding for all DOH institu 0 0 0 0 7,600 0 7,60012IM1203 Preservation on Institutions 0 0 0 0 0 7,600 7,600 Subtotal 24,934 7,600 7,600 7,600 7,600 7,600 38,000New Institution Construction 12VH0407 Rebuilding Oxford Veterans Home 21,000 0 0 0 0 0 0 Subtotal 21,000 0 0 0 0 0 0Water Resources 12010557 Federal Grants 33,374 0 0 0 0 0 012020357 Federal Capital - Safe Drinking Wat 3,224 0 0 0 0 0 012020457 Federal Grants 626 0 0 0 0 0 012020657 Feeral Grants 32,937 0 0 0 0 0 012020757 Statewide Safe Drinking Water Progr 36,812 0 0 0 0 0 012020857 Safe Drinking Water Program 0 9,980 0 0 0 0 9,98012020957 Sae Drinking Water Program 0 0 9,980 0 0 0 9,98012021057 Safe drinking water Fed. grants 0 0 0 9,980 0 0 9,98012021157 Safe Drinking Water Projects 0 0 0 0 9,980 0 9,98012021257 Safe Drinking Water Program 0 0 0 0 0 9,980 9,980 Subtotal 106,973 9,980 9,980 9,980 9,980 9,980 49,900 Total 860,514 277,580 27,580 27,580 27,580 27,580 387,900

DETAILED DATA
236
Health, Department of PROJECTED APPROPRIATIONS AND DISBURSEMENTS BY PROGRAM
2008-2009 THROUGH 2012-2013 (thousands of dollars)
DISBURSEMENTS Estimated Total
2007-2008 2008-2009 2009-2010 2010-2011 2011-2012 2012-2013 2008-2013Health Care Efficiency and Affordability Law for
New Yorkers 12BD05CH HEAL NY Bonded for Community
Health 5,000 2,500 2,500 0 0 0 5,00012BD05HE HEAL NY Initiative Bonded 41,250 43,750 43,750 46,250 0 0 133,75012BD06HE HEAL NY Bond Program 18,500 27,750 36,250 2,500 0 0 66,50012BD07HE HEAL NY Bond Program 0 18,500 36,317 30,183 0 0 85,00012BD08HE HEAL NY Bond Program 0 0 0 85,000 0 0 85,00012HE05HE HEAL NY Initiative 53,000 12,000 0 0 0 0 12,00012HE06HE HEAL NY Grant Program 29,600 85,400 25,000 0 0 0 110,40012HE07HE HEAL NY Grant Program 2,376 38,624 43,000 56,000 0 0 137,62412HE08HE HEAL NY Grant Program 0 384 21,616 37,000 81,000 0 140,00012RP07HE HEAL/HCRA for Roswell Park Cancer I 25,000 0 0 0 0 0 012RP08HE HEAl/HCRA for Roswell Park Cancer I 0 25,000 0 0 0 0 25,000 Subtotal 174,726 253,908 208,433 256,933 81,000 0 800,274Laboratories and Research 12590203 Laboratories And Reasearch 0 0 0 0 0 0 012590303 Laboratories And Research 0 0 0 0 0 0 012590403 Laboratories And Research 0 0 0 0 0 0 012590503 Maint.&Improve. Of Labs 0 935 0 0 0 0 93512590603 Preservation of Facilities Labs 0 7,365 0 0 0 0 7,365125906BB Umbilical Blood Bank Ctr. in Syracu 0 5,000 0 0 0 0 5,00012590703 Preservation of facilities 10,000 0 0 0 0 0 012590803 Preservation of Facilities 0 10,000 0 0 0 0 10,00012590903 Preservation of facilities 0 0 10,000 0 0 0 10,00012591003 Preservation of Facilities 0 0 0 10,000 0 0 10,00012591103 Capital Funding for Labs 0 0 0 0 10,000 0 10,00012591203 Preservation of Laboratories 0 0 0 0 0 10,000 10,000 Subtotal 10,000 23,300 10,000 10,000 10,000 10,000 63,300Maintenance and Improvements of Existing
Institutions 12600203 Institutional Management 0 0 0 0 0 0 012600303 Institutional Management 0 0 0 0 0 0 012600403 Institutional Management 0 0 0 0 0 0 012600503 Maint.&Improve. Of Facilities 0 0 0 0 0 0 012600603 Preservation of instutional facilit 3,100 0 0 0 0 0 012600703 Institutional Management 5,500 0 0 0 0 0 012600803 Institutional Management 0 5,500 0 0 0 0 5,50012600903 Institutional Management 0 0 5,500 0 0 0 5,50012601003 Preservation of Facilities 0 0 0 5,500 0 0 5,50012601103 Capital funding for all DOH institu 0 0 0 0 5,500 0 5,50012IM1203 Preservation on Institutions 0 0 0 0 0 5,500 5,500 Subtotal 8,600 5,500 5,500 5,500 5,500 5,500 27,500New Institution Construction 12VH0407 Rebuilding Oxford Veterans Home 8,750 2,100 0 0 0 0 2,100 Subtotal 8,750 2,100 0 0 0 0 2,100Water Resources 12010557 Federal Grants 13,445 0 0 0 0 0 012020357 Federal Capital - Safe Drinking Wat 762 0 0 0 0 0 012020457 Federal Grants 626 0 0 0 0 0 012020657 Feeral Grants 21,979 0 0 0 0 0 012020757 Statewide Safe Drinking Water Progr 0 0 0 0 0 0 012020857 Safe Drinking Water Program 0 9,980 0 0 0 0 9,98012020957 Sae Drinking Water Program 0 0 9,980 0 0 0 9,98012021057 Safe drinking water Fed. grants 0 0 0 9,980 0 0 9,98012021157 Safe Drinking Water Projects 0 0 0 0 9,980 0 9,98012021257 Safe Drinking Water Program 0 0 0 0 0 9,980 9,980 Subtotal 36,812 9,980 9,980 9,980 9,980 9,980 49,900 Total 238,888 294,788 233,913 282,413 106,480 25,480 943,074

DETAILED DATA
237
Temporary and Disability Assistance, Office of PROJECTED APPROPRIATIONS AND DISBURSEMENTS BY PROGRAM
2008-2009 THROUGH 2012-2013 (thousands of dollars)
APPROPRIATIONS Reappro-
priations 2008-2009 2009-2010 2010-2011 2011-2012 Supported Housing Program 270303G5 Homeless Housing Program 0 0 0 0 0
2012-2013
0
Total2008-2013
0270304G5 Homeless Housing Program 23,586 0 0 0 0 0 0270305G5 Homeless Housing Program 23,515 0 0 0 0 0 0270306G5 Homeless Housing Program 23,441 0 0 0 0 0 0270307G5 Homeless Housing Pogram 23,253 0 0 0 0 0 0270308G5 Homeless Housing Program 0 25,000 0 0 0 0 25,000270309G5 Homeless Housing Program 0 0 25,000 0 0 0 25,000270310G5 Homeless Housing Program 0 0 0 25,000 0 0 25,000270311G5 Homeless Housing Program 0 0 0 0 25,000 0 25,000270312G5 Homeless Housing Program 0 0 0 0 0 25,000 25,000270804G5 Homeless Housing Program -AIDS 5,000 0 0 0 0 0 0270805G5 Homeless Housing Program - AIDS 5,000 0 0 0 0 0 0270806G5 Homeless Housing Program - AIDS 5,000 0 0 0 0 0 0270807G5 Homeless Housing Program - AIDS 5,000 0 0 0 0 0 0270808G5 Homeless Housing Program - AIDS 0 5,000 0 0 0 0 5,000270809G5 Homeless Housing Program - AIDS 0 0 5,000 0 0 0 5,000270810G5 Homeless Housing Program - AIDS 0 0 0 5,000 0 0 5,000270811G5 Homeless Housing Program - AIDS 0 0 0 0 5,000 0 5,000270812G5 Homeless Housing Program - AIDS 0 0 0 0 0 5,000 5,000 Subtotal 113,795 30,000 30,000 30,000 30,000 30,000 150,000 Total 113,795 30,000 30,000 30,000 30,000 30,000 150,000
Temporary and Disability Assistance, Office of
PROJECTED APPROPRIATIONS AND DISBURSEMENTS BY PROGRAM 2008-2009 THROUGH 2012-2013
(thousands of dollars) DISBURSEMENTS
Estimated
2007-2008 2008-2009 2009-2010 2010-2011 2011-2012 Supported Housing Program 270303G5 Homeless Housing Program 22,648 0 0 0 0 270304G5 Homeless Housing Program 2,204 21,382 0 0 0 270305G5 Homeless Housing Program 0 3,418 20,097 0 0 270306G5 Homeless Housing Program 0 0 3,493 19,948 0 270307G5 Homeless Housing Pogram 1,748 0 0 3,252 20,000 270308G5 Homeless Housing Program 0 1,800 0 0 3,200 270309G5 Homeless Housing Program 0 0 1,800 0 0 270310G5 Homeless Housing Program 0 0 0 1,800 0 270311G5 Homeless Housing Program 0 0 0 0 1,800 270312G5 Homeless Housing Program 0 0 0 0 0 270804G5 Homeless Housing Program -AIDS 5,000 0 0 0 0 270805G5 Homeless Housing Program - AIDS 0 5,000 0 0 0 270806G5 Homeless Housing Program - AIDS 0 0 5,000 0 0 270807G5 Homeless Housing Program - AIDS 0 0 0 5,000 0 270808G5 Homeless Housing Program - AIDS 0 0 0 0 5,000 270809G5 Homeless Housing Program - AIDS 0 0 0 0 0 270810G5 Homeless Housing Program - AIDS 0 0 0 0 0 270811G5 Homeless Housing Program - AIDS 0 0 0 0 0 270812G5 Homeless Housing Program - AIDS 0 0 0 0 0
2012-2013
00000
20,0003,200
00
1,80000000
5,000000
Total2008-2013
021,38223,51523,44123,25225,000
5,0001,8001,8001,800
05,0005,0005,0005,0005,000
000
Subtotal 31,600 31,600 30,390 30,000 30,000 30,000 151,990 Total 31,600 31,600 30,390 30,000 30,000 30,000 151,990

DETAILED DATA
238
Education Department, State PROJECTED APPROPRIATIONS AND DISBURSEMENTS BY PROGRAM
2008-2009 THROUGH 2012-2013 (thousands of dollars)
APPROPRIATIONS Reappro-
priations 2008-2009 2009-2010 2010-2011 2011-2012 Administration
2012-2013Total
2008-2013
11010101 Minor Rehabilitation Sed 31 0 0 0 0 0 011010201 Minor Rehabilitation Sed Various Bl 0 0 0 0 0 0 011010403 Minor maintenance of State Ed Build 175 0 0 0 0 0 011010703 Minor rehabiliation projects 4,900 0 0 0 0 0 011020503 Main Office Preservation of Facilit 213 0 0 0 0 0 011020603 Minor Rehabilitation projects 1,950 0 0 0 0 0 011080303 various minor rehab.& safety projec 560 0 0 0 0 0 011090803 Maintenance Fund 0 1,000 0 0 0 0 1,000 Subtotal 7,829 1,000 0 0 0 0 1,000Cultural Education Center 11010801 Emergency Exit Construction 0 2,250 0 0 0 0 2,25011020403 Minor Preservation of Archives/Muse 107 0 0 0 0 0 011020808 Museum Renewal 0 15,000 0 0 0 0 15,00011030203 Museum Collections And Exhibits 4,502 0 0 0 0 0 011030801 Fire Sys. Upgrades & Museum Upgrade 0 2,500 0 0 0 0 2,50011039501 Repair Elevators/Bsmnt Tile Floor: 160 0 0 0 0 0 011059803 Cec Renovation 450 0 0 0 0 0 011060808 Collection Preservation & Stewardsh 0 4,325 0 0 0 0 4,32511070808 Records Center Expansion 0 12,585 0 0 0 0 12,58511109401 Rennovate Cec, Museum, Terrace, 3Rd 500 0 0 0 0 0 011B19601 Health/Safety Project(S): Cult Ed C 1,000 0 0 0 0 0 011W59703 Cec Renovation 200 0 0 0 0 0 0 Subtotal 6,919 36,660 0 0 0 0 36,660Cultural Education Storage Facility 11010707 Cult Ed Storage Facility 60,000 0 0 0 0 0 0 Subtotal 60,000 0 0 0 0 0 0Education Building 11010601 Computer Room Renovation 1,586 0 0 0 0 0 011019601 Emergency Power And Lighting /Eb-EB 1 0 0 0 0 0 011020801 Mechanical System Upgrade - EBA 0 2,000 0 0 0 0 2,00011030603 Roof replacement 404 0 0 0 0 0 011070201 Minor Maintenance Exterior Sed Buil 75 0 0 0 0 0 011B19801 Health/Safety Project(S):Ed Bldg 100 0 0 0 0 0 0 Subtotal 2,166 2,000 0 0 0 0 2,000Library Construction 110206LC Library construction 1,344 0 0 0 0 110307LC Libraby Construction 14,000 0 0 0 0 11080808 Public Library Construction 0 14,000 0 0 0
000
00
14,000 Subtotal 15,344 14,000 0 0 0 0 14,000Public Broadcasting Facilities 11PB05PB Public Broadcasting Facilities 527 0 0 0 0 0 0 Subtotal 527 0 0 0 0 0 0School for the Blind 11030501 Batavia Health and Safety 1,275 0 0 0 0 0 011050801 Security, Parking, Restrooms, and R 0 2,330 0 0 0 0 2,33011079803 Various Projects - Batavia School 200 0 0 0 0 0 011159008 Asbestos Abatement-Batavia School 0 0 0 0 0 0 0 Subtotal 1,475 2,330 0 0 0 0 2,330School for the Deaf 11040601 Renovation of Dormitories 7,250 0 0 0 0 0 011040801 Health & Safety and Environ. Contro 0 650 0 0 0 0 65011050403 Minor renovation of Rome School 895 0 0 0 0 0 011070301 Landscaping & Campus Security 0 0 0 0 0 0 011119008 Asbestos Abatement-Rome School 0 0 0 0 0 0 0 Subtotal 8,145 650 0 0 0 0 650Schools For Native American Reservations 11010301 St Regis Mohawk Elementary School 16 0 0 0 0 0 011020301 Tuscarora Elementary School 55 0 0 0 0 0 011030403 Minor renovation of Tuscarora Schoo 11 0 0 0 0 0 011040403 Renovation of St. Regis Indian Scho 860 0 0 0 0 0 0 Subtotal 942 0 0 0 0 0 0Washington Avenue Armory 11179208 Rehab Washington Ave. Armory 0 0 0 0 0 0 0 Subtotal 0 0 0 0 0 0 0 Total 103,347 56,640 0 0 0 0 56,640

DETAILED DATA
239
Education Department, State PROJECTED APPROPRIATIONS AND DISBURSEMENTS BY PROGRAM
2008-2009 THROUGH 2012-2013 (thousands of dollars)
DISBURSEMENTS Estimated Total
2007-2008 2008-2009 2009-2010 2010-2011 2011-2012 2012-2013 2008-2013Administration 11010101 Minor Rehabilitation Sed 0 0 0 0 37 0 3711010201 Minor Rehabilitation Sed Various Bl 0 0 0 0 0 0 011010403 Minor maintenance of State Ed Build 0 219 0 0 0 0 21911010703 Minor rehabiliation projects 1,000 1,000 2,000 900 0 0 3,90011020503 Main Office Preservation of Facilit 0 0 0 270 90 0 36011020603 Minor Rehabilitation projects 200 300 200 200 0 533 1,23311080303 various minor rehab.& safety projec 0 628 0 0 0 1 62911090803 Maintenance Fund 0 1,000 0 0 0 0 1,000 Subtotal 1,200 3,147 2,200 1,370 127 534 7,378Cultural Education Center 11010801 Emergency Exit Construction 0 1,000 1,250 0 0 0 2,25011020403 Minor Preservation of Archives/Muse 0 63 0 44 0 0 10711020808 Museum Renewal 0 5,000 5,000 5,000 0 0 15,00011030203 Museum Collections And Exhibits 303 620 735 1,424 1,480 0 4,25911030801 Fire Sys. Upgrades & Museum Upgrade 0 500 1,500 500 0 0 2,50011039501 Repair Elevators/Bsmnt Tile Floor: 0 0 0 0 0 0 011059803 Cec Renovation 0 150 0 0 0 0 15011060808 Collection Preservation & Stewardsh 0 800 1,000 2,525 0 0 4,32511070808 Records Center Expansion 0 1,500 5,885 4,700 500 0 12,58511109401 Rennovate Cec, Museum, Terrace, 3Rd 0 550 0 0 0 0 55011B19601 Health/Safety Project(S): Cult Ed C 0 200 0 0 0 0 20011W59703 Cec Renovation 0 200 0 0 0 0 200 Subtotal 303 10,583 15,370 14,193 1,980 0 42,126Cultural Education Storage Facility 11010707 Cult Ed Storage Facility 1,000 25,000 24,000 10,000 0 0 59,000 Subtotal 1,000 25,000 24,000 10,000 0 0 59,000Education Building 11010601 Computer Room Renovation 330 300 0 0 0 970 1,27011019601 Emergency Power And Lighting /Eb-EB 0 0 0 0 5 0 511020801 Mechanical System Upgrade - EBA 0 250 750 1,000 0 0 2,00011030603 Roof replacement 1,270 0 0 0 0 0 011070201 Minor Maintenance Exterior Sed Buil 0 0 343 0 0 0 34311B19801 Health/Safety Project(S):Ed Bldg 0 0 0 0 0 0 0 Subtotal 1,600 550 1,093 1,000 5 970 3,618Library Construction 110206LC Library construction 10,886 0 0 0 0 110307LC Libraby Construction 7,000 7,000 0 0 0 11080808 Public Library Construction 0 7,000 6,000 1,000 0
000
07,000
14,000 Subtotal 17,886 14,000 6,000 1,000 0 0 21,000Public Broadcasting Facilities 11PB05PB Public Broadcasting Facilities 1,079 0 0 0 0 0 0 Subtotal 1,079 0 0 0 0 0 0School for the Blind 11030501 Batavia Health and Safety 800 0 0 0 202 0 20211050801 Security, Parking, Restrooms, and R 0 500 1,630 200 0 0 2,33011079803 Various Projects - Batavia School 133 17 0 0 0 0 1711159008 Asbestos Abatement-Batavia School 902 0 0 0 0 0 0 Subtotal 1,835 517 1,630 200 202 0 2,549School for the Deaf 11040601 Renovation of Dormitories 3,756 0 0 0 0 0 011040801 Health & Safety and Environ. Contro 0 200 450 0 0 0 65011050403 Minor renovation of Rome School 200 500 352 0 0 0 85211070301 Landscaping & Campus Security 16 0 0 0 0 0 011119008 Asbestos Abatement-Rome School 175 0 0 0 0 0 0 Subtotal 4,147 700 802 0 0 0 1,502Schools For Native American Reservations 11010301 St Regis Mohawk Elementary School 0 0 0 0 16 16 3211020301 Tuscarora Elementary School 55 0 0 0 0 0 011030403 Minor renovation of Tuscarora Schoo 50 0 0 0 0 0 011040403 Renovation of St. Regis Indian Scho 400 500 0 362 0 0 862 Subtotal 505 500 0 362 16 16 894Washington Avenue Armory 11179208 Rehab Washington Ave. Armory 0 2,883 0 0 0 0 2,883 Subtotal 0 2,883 0 0 0 0 2,883 Total 29,555 57,880 51,095 28,125 2,330 1,520 140,950

DETAILED DATA
240
State University of New York PROJECTED APPROPRIATIONS AND DISBURSEMENTS BY PROGRAM
2008-2009 THROUGH 2012-2013 (thousands of dollars)
APPROPRIATIONS Reappro-
priations 2008-2009 2009-2010 2010-2011 2011-2012 Maintenance and Improvements 28080450 State University Capital Proj Fund 150,000 0 0 0 0
2012-2013
0
Total2008-2013
028C10250 SUNY Cap Proj Fund -384 18,949 0 0 0 0 0 028C10850 SU Capital Projects Fund-384 0 500,000 0 0 0 0 500,00028CC0808 Advance Prog Imp./Change CC (CC) 0 505,595 0 0 0 0 505,59528D30103 SUNY Residence Hall Rehab Fund - 07 0 0 0 0 0 0 028D30203 SUNY Residence Hall Rehab Fund - 07 0 0 0 0 0 0 028D30303 Residence Hall Rehab-074 Hard Dolla 19,017 0 0 0 0 0 028D30803 Residence Hall Rehab HD 0 123,000 0 0 0 0 123,00028DB0803 Residence Hall Rehab Bonded 0 450,000 0 0 0 0 450,00028DC0603 Dormitory - Bonded 157,945 0 0 0 0 0 028F10508 High Priority Projects 143,000 0 0 0 0 0 028F10608 Prgram Improvement/Change 44,000 0 0 0 0 0 028F10708 State Op Advance-Prog Imp & Prog Ch 379,322 0 0 0 0 0 028F10803 Critical Maintenance 0 550,000 0 0 0 0 550,00028F10903 Critical Maintenance 0 0 550,000 0 0 0 550,00028F11003 Critical Maintenance 0 0 0 550,000 0 0 550,00028F11103 Critical Maintenance 0 0 0 0 550,000 0 550,00028F11203 Critical Maintenance 0 0 0 0 0 550,000 550,00028F198C1 Hospitals-Advance 10,595 0 0 0 0 0 028F20508 Alterations and improvements 275,000 0 0 0 0 0 028F20608 Advance- Program Improvement LA 427,000 0 0 0 0 0 028F20808 Strategic Initiatives 0 1,612,000 0 0 0 0 1,612,00028F39603 Preservation-Advance 0 0 0 0 0 0 028F39703 Preservation - Advance 0 0 0 0 0 0 028F398C1 Campus Improvements-Advance 15,000 0 0 0 0 0 028F498C1 Systemwide-Advance 20,000 0 0 0 0 0 028F598C1 Campus Matching Program-Advance 10,000 0 0 0 0 0 028F698C1 Technology Related-Advance 22,000 0 0 0 0 0 028F80408 Program Improvement-Advance 1,130,000 0 0 0 0 0 028F898C1 Core Programs-Advance 85,000 0 0 0 0 0 028FC0308 CC Program Improvement Advance
(CC) 85,000 0 0 0 0 0 028FC0508 CC Program Improvement-Advance
(CC) 18,000 0 0 0 0 0 028FC0607 Advance Program Improvement CC LA ( 33,000 0 0 0 0 0 028FC0650 Community College Program
Improveme 24,000 0 0 0 0 0 028FH0308 Hospital - Advance 210,000 0 0 0 0 0 028FH0508 Hospital Program Improvements 48,019 0 0 0 0 0 028FH0808 Advance Hospitals 0 450,000 0 0 0 0 450,00028FR98C1 Research Facilities 16,000 0 0 0 0 0 028GR0805 Advance Greening of SUNY 0 75,000 0 0 0 0 75,00028NF98C1 CC Preservation/New Fac-Advance (CC 6,500 0 0 0 0 0 028PR98C1 CC Preservation Plus-Hard (CC) 7,288 0 0 0 0 0 028R80408 Program Improvement-Hard Dollar 10,000 0 0 0 0 0 028R80801 Health & Safety HD-CC (CC) 0 20,000 0 0 0 0 20,00028R89808 Program Improvement-Hard Dollar 5,404 0 0 0 0 0 028RC0308 CC Program Improvement-Hard Dollar 19,000 0 0 0 0 0 028RT0308 CC Technology Improvement-Hard Doll 6,000 0 0 0 0 0 0 Subtotal 3,395,039 4,285,595 550,000 550,000 550,000 Total 3,395,039 4,285,595 550,000 550,000 550,000
550,000 6,485,5956,485,595550,000

DETAILED DATA
241
State University of New York PROJECTED APPROPRIATIONS AND DISBURSEMENTS BY PROGRAM
2008-2009 THROUGH 2012-2013 (thousands of dollars)
DISBURSEMENTS Estimated Total
2007-2008 2008-2009 2009-2010 2010-2011 2011-2012 2012-2013 2008-2013Maintenance and Improvements 28080450 State University Capital Proj Fund 0 6,000 6,000 6,000 6,000 0 24,00028C10250 SUNY Cap Proj Fund -384 12,000 6,000 0 0 0 0 6,00028C10850 SU Capital Projects Fund-384 0 0 6,000 6,000 6,000 12,000 30,00028CC0808 Advance Prog Imp./Change CC (CC) 0 4,000 8,000 18,000 28,000 35,000 93,00028D30103 SUNY Residence Hall Rehab Fund - 07 3,000 0 0 0 0 0 028D30203 SUNY Residence Hall Rehab Fund - 07 3,000 0 0 0 0 0 028D30303 Residence Hall Rehab-074 Hard Dolla 29,000 15,000 12,000 0 0 0 27,00028D30803 Residence Hall Rehab HD 0 17,000 19,000 25,000 30,000 24,000 115,00028DB0803 Residence Hall Rehab Bonded 0 42,000 33,000 26,000 43,000 55,000 199,00028DC0603 Dormitory - Bonded 100,000 75,000 65,000 50,000 40,000 20,000 250,00028F10508 High Priority Projects 55,000 24,400 44,000 25,000 50 0 93,45028F10608 Prgram Improvement/Change 20,000 0 0 5,000 10,000 10,000 25,00028F10708 State Op Advance-Prog Imp & Prog Ch 0 41,000 60,000 71,000 98,526 80,000 350,52628F10803 Critical Maintenance 0 3,000 19,000 52,000 86,000 113,000 273,00028F10903 Critical Maintenance 0 0 3,000 19,000 52,000 86,000 160,00028F11003 Critical Maintenance 0 0 0 3,000 19,000 52,000 74,00028F11103 Critical Maintenance 0 0 0 0 3,000 19,000 22,00028F11203 Critical Maintenance 0 0 0 0 0 3,000 3,00028F198C1 Hospitals-Advance 0 0 0 0 0 0 028F20508 Alterations and improvements 50,000 37,600 20,000 12,000 25,000 0 94,60028F20608 Advance- Program Improvement LA 69,000 10,000 76,000 58,000 60,000 30,000 234,00028F20808 Strategic Initiatives 0 16,000 40,000 93,000 211,000 310,000 670,00028F39603 Preservation-Advance 0 0 0 0 0 0 028F39703 Preservation - Advance 0 0 0 0 0 0 028F398C1 Campus Improvements-Advance 0 0 0 0 0 0 028F498C1 Systemwide-Advance 0 0 0 0 0 0 028F598C1 Campus Matching Program-Advance 0 0 0 0 0 0 028F698C1 Technology Related-Advance 0 0 0 0 0 0 028F80408 Program Improvement-Advance 146,000 356,000 350,000 325,000 50,000 0 1,081,00028F898C1 Core Programs-Advance 39,000 0 0 0 20,000 0 20,00028FC0308 CC Program Improvement Advance
(CC) 20,000 20,000 20,000 0 0 0 40,00028FC0508 CC Program Improvement-Advance
(CC) 0 0 5,000 26,000 10,000 1,000 42,00028FC0607 Advance Program Improvement CC LA ( 0 0 0 20,000 0 0 20,00028FC0650 Community College Program
Improveme 0 0 0 0 10,000 0 10,00028FH0308 Hospital - Advance 111,000 84,000 34,000 0 4,344 0 122,34428FH0508 Hospital Program Improvements 20,000 23,000 0 3,000 838 0 26,83828FH0808 Advance Hospitals 0 6,000 34,000 62,000 97,000 91,000 290,00028FR98C1 Research Facilities 0 0 0 4,000 15,242 0 19,24228GR0805 Advance Greening of SUNY 0 5,000 20,000 35,000 10,000 5,000 75,00028NF98C1 CC Preservation/New Fac-Advance (CC 15,000 0 0 0 0 0 028PR98C1 CC Preservation Plus-Hard (CC) 1,000 1,000 1,000 1,000 0 0 3,00028R80408 Program Improvement-Hard Dollar 0 2,600 3,500 2,500 2,500 2,500 13,60028R80801 Health & Safety HD-CC (CC) 0 2,000 2,000 2,500 1,200 1,000 8,70028R89808 Program Improvement-Hard Dollar 4,500 900 0 0 0 0 90028RC0308 CC Program Improvement-Hard Dollar 1,500 1,000 1,000 1,000 500 500 4,00028RT0308 CC Technology Improvement-Hard Doll 1,000 500 500 1,000 1,000 1,000 4,000 Subtotal 700,000 799,000 882,000 952,000 940,200 951,000 4,524,200
4,524,200 Total 700,000 799,000 882,000 952,000 940,200 951,000

DETAILED DATA
242
City University of New York PROJECTED APPROPRIATIONS AND DISBURSEMENTS BY PROGRAM
2008-2009 THROUGH 2012-2013 (thousands of dollars)
APPROPRIATIONS Reappro-
priations 2008-2009 2009-2010 2010-2011 2011-2012 Maintenance and Improvements 30018701 Health & Safety 1,566 0 0 0 0
2012-2013
0
Total2008-2013
030020350 hard dollar lump sum--community col 5,000 0 0 0 0 0 030020903 Senior - Critical Maintenance 09-10 0 0 284,220 0 0 0 284,22030029301 Health And Safety-Cond. Surveys 960 0 0 0 0 0 030030450 bonded lump sum-senior colleges gen 1,095,000 0 0 0 0 0 030031003 Senior - Critical Maintenance 10-11 0 0 0 284,220 0 0 284,22030039403 Roof Projects 357 0 0 0 0 0 030039703 Minor Repairs/Brooklyn-Reroof Bldg. 2,285 0 0 0 0 0 030041103 Senior - Critical Maintenance 11-12 0 0 0 0 284,220 0 284,22030048704 Facilities For Physically Disabled 429 0 0 0 0 0 030050350 bonded lump sum--comm. colleges 50,000 0 0 0 0 0 030051203 Senior - Critical Maintenance 12-13 0 0 0 0 0 284,220 284,22030060450 Hard dollar lump sum--senior colleg 14,257 0 0 0 0 0 030060850 Senior - Lump Sum 0 1,415,920 0 0 0 0 1,415,92030080850 Senior - Hard Dollar/Minor Rehab 0 23,232 0 0 0 0 23,23230089508 Program Improvement/Change 414 0 0 0 0 0 030090850 Comm. - Lump Sum 0 257,700 0 0 0 0 257,70030110850 Comm. - Hard Dollar/Minor Rehab 0 2,750 0 0 0 0 2,750301197C1 Pres. - Lump Sum Repair 500 0 0 0 0 0 0301198C1 Lump Sum - Hard Dollar 5,000 0 0 0 0 0 030149504 Facilities For Disabled 827 0 0 0 0 0 0301596C1 Hard Dollar Lump Sum 2,340 0 0 0 0 0 030169408 Hunter Language Lab - Matching Proj 0 0 0 0 0 0 0302198C1 Lump Sum - Hard Dollar Senior 6,777 0 0 0 0 0 030239503 Preservation Of Facilities 3,696 0 0 0 0 0 030289508 Program Improvement/Change 1,306 0 0 0 0 0 030299603 Brooklyn Roofs 300 0 0 0 0 0 0303198C1 Lump Sum - Administration 109,700 0 0 0 0 0 030389408 Planning Funds 398 0 0 0 0 0 030389508 Equipment 257 0 0 0 0 0 030560550 Senior College Bonded Appropriation 69,000 0 0 0 0 0 030570550 Lump sum 20,000 0 0 0 0 0 030580550 Legis. add. 153,097 0 0 0 0 0 030590550 Legis. Add 105,849 0 0 0 0 0 0306090C1 Alterations & Improvements 4,037 0 0 0 0 0 030660650 2006 CC Executive & Leg Adds (bonde 75,349 0 0 0 0 0 030660750 Community College Bonded 40,800 0 0 0 0 0 030670650 2006 SC Exec & Leg Adds (bonded) 261,731 0 0 0 0 0 030670750 Senior College Bonded 225,000 0 0 0 0 0 030839403 Various Preservation Of Facilities 6,909 0 0 0 0 0 030A18801 Health And Safety 352 0 0 0 0 0 030A18901 Health & Safety 348 0 0 0 0 0 030A29201 Health And Safety-Access For Disabl 222 0 0 0 0 0 030A38803 Preservation Of Facilities 766 0 0 0 0 0 030A39003 Preservation Of Facilities 1,917 0 0 0 0 0 030A58805 Energy Conservation 987 0 0 0 0 0 030D18908 Program Improvement Or Program Chan 0 0 0 0 0 0 030D19408 Cuny Matching Projects 0 0 0 0 0 0 0 Subtotal 2,267,733 1,699,602 284,220 284,220 284,220 New Facilities
284,220 2,836,482
30679807 Advance For John Jay Phase II 352,300 0 0 0 0 0 0 Subtotal 352,300 0 0 0 0 0 0Program Changes and Expansion 30A89008 Program Improvement Or Change 599 0 0 0 0 30A98808 Program Improvement Or Change 985 0 0 0 0
00
00
Subtotal 1,584 0 0 0 0 0 0 Total 2,621,617 1,699,602 284,220 284,220 284,220
284,220 2,836,482

DETAILED DATA
243
City University of New York PROJECTED APPROPRIATIONS AND DISBURSEMENTS BY PROGRAM
2008-2009 THROUGH 2012-2013 (thousands of dollars)
DISBURSEMENTS Estimated
2007-2008 2008-2009 2009-2010 2010-2011 2011-2012 Maintenance and Improvements 30018701 Health & Safety 0 0 1,200 350 0 30020350 hard dollar lump sum--community col 500 0 1,100 150 1,000 30020903 Senior - Critical Maintenance 09-10 0 0 1,677 9,777 26,688 30029301 Health And Safety-Cond. Surveys 0 0 0 959 0 30030450 bonded lump sum-senior colleges gen 130,000 234,162 168,172 140,000 115,000 30031003 Senior - Critical Maintenance 10-11 0 0 0 1,677 9,777 30039403 Roof Projects 0 0 0 357 0 30039703 Minor Repairs/Brooklyn-Reroof Bldg. 0 0 0 700 500 30041103 Senior - Critical Maintenance 11-12 0 0 0 0 1,677 30048704 Facilities For Physically Disabled 0 0 281 125 0 30050350 bonded lump sum--comm. colleges 11,476 0 0 0 0 30051203 Senior - Critical Maintenance 12-13 0 0 0 0 0 30060450 Hard dollar lump sum--senior colleg 4,382 7,500 2,596 959 71 30060850 Senior - Lump Sum 0 24,149 54,734 117,939 228,935 30080850 Senior - Hard Dollar/Minor Rehab 0 154 902 2,461 4,118 30089508 Program Improvement/Change 0 0 0 0 400 30090850 Comm. - Lump Sum 0 3,195 11,245 28,022 45,852 30110850 Comm. - Hard Dollar/Minor Rehab 0 18 107 291 487 301197C1 Pres. - Lump Sum Repair 0 0 0 200 300 301198C1 Lump Sum - Hard Dollar 500 0 0 550 1,100 30149504 Facilities For Disabled 0 0 0 1,055 0 301596C1 Hard Dollar Lump Sum 300 0 0 0 1,100 30169408 Hunter Language Lab - Matching Proj 0 0 0 0 0 302198C1 Lump Sum - Hard Dollar Senior 1,900 600 1,093 127 1,583 30239503 Preservation Of Facilities 0 0 0 1,200 2,496 30289508 Program Improvement/Change 0 0 0 550 500 30299603 Brooklyn Roofs 0 0 0 250 50 303198C1 Lump Sum - Administration 14,769 0 0 0 0 30389408 Planning Funds 0 0 0 350 0 30389508 Equipment 150 0 0 0 0 30560550 Senior College Bonded Appropriation 30,000 19,000 0 0 0 30570550 Lump sum 5,000 5,000 0 0 0 30580550 Legis. add. 33,540 17,518 7,703 0 0 30590550 Legis. Add 24,577 15,239 2,561 0 9,550 306090C1 Alterations & Improvements 0 0 0 0 0 30660650 2006 CC Executive & Leg Adds (bonde 11,302 18,837 15,070 11,302 7,535 30660750 Community College Bonded 900 9,700 10,650 9,400 7,700 30670650 2006 SC Exec & Leg Adds (bonded) 9,260 25,433 52,346 39,260 26,173 30670750 Senior College Bonded 10,000 51,350 62,850 47,500 37,100 30839403 Various Preservation Of Facilities 0 0 0 0 0 30A18801 Health And Safety 0 0 352 0 0 30A18901 Health & Safety 348 0 0 0 0 30A29201 Health And Safety-Access For Disabl 0 0 0 225 0 30A38803 Preservation Of Facilities 485 0 0 450 0 30A39003 Preservation Of Facilities 447 1,000 479 0 0 30A58805 Energy Conservation 0 0 800 175 0 30D18908 Program Improvement Or Program Chan 0 0 0 0 0 30D19408 Cuny Matching Projects 0 0 0 0 0
2012-2013
162,250
44,6511
115,00026,688
0918
9,77723
1,4471,677
1320,695
5,40414
59,695640
02,850
0940
01,613
0256
00
48107
10,0005,0007,7039,550
07,5352,450
26,17316,200
000
1235
015
00
Total2008-2013
1,5664,500
82,793960
772,33438,142
3572,118
11,454429
1,4471,677
11,127746,452
13,039414
148,0091,543
5004,5001,0552,040
05,0163,6961,306
3000
398107
29,00010,00032,92436,900
060,27939,900
169,385215,000
0352
0237485
1,479990
00
Subtotal 289,836 432,855 395,918 416,361 529,692 679,384 2,454,210New Facilities 30679807 Advance For John Jay Phase II 30,576 15,711 0 0 0 2,000 17,711 Subtotal 30,576 15,711 0 0 0 2,000 17,711Program Changes and Expansion 30A89008 Program Improvement Or Change 0 0 598 0 0 30A98808 Program Improvement Or Change 88 0 601 368 0
10
599969
Subtotal 88 0 1,199 368 0 1 1,568 Total 320,500 448,566 397,117 416,729 529,692 681,385 2,473,489
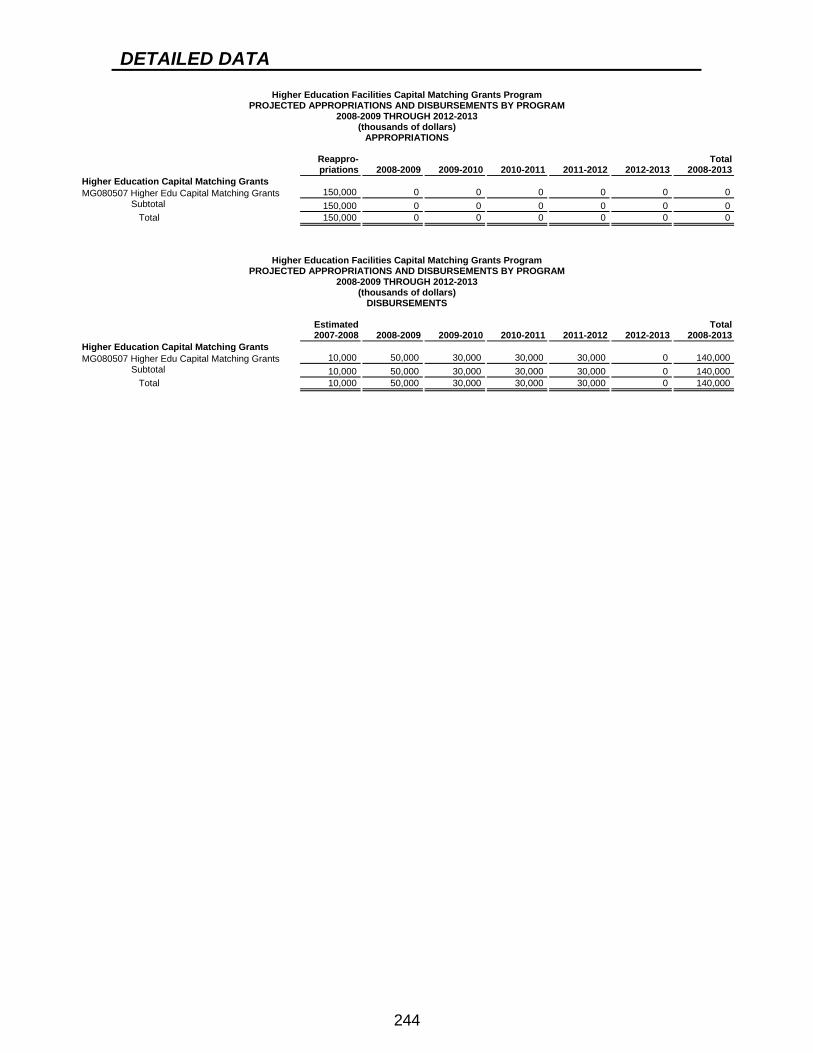
DETAILED DATA
244
Higher Education Facilities Capital Matching Grants Program PROJECTED APPROPRIATIONS AND DISBURSEMENTS BY PROGRAM
2008-2009 THROUGH 2012-2013 (thousands of dollars)
APPROPRIATIONS Reappro-
priations 2008-2009 2009-2010 2010-2011 2011-2012 Higher Education Capital Matching Grants MG080507 Higher Edu Capital Matching Grants 150,000 0 0 0 0
2012-2013
0
Total2008-2013
0 Subtotal 150,000 0 0 0 0 0 0 Total 150,000 0 0 0 0 0 0
Higher Education Facilities Capital Matching Grants Program
PROJECTED APPROPRIATIONS AND DISBURSEMENTS BY PROGRAM 2008-2009 THROUGH 2012-2013
(thousands of dollars) DISBURSEMENTS
Estimated Total
2007-2008 2008-2009 2009-2010 2010-2011 2011-2012 2012-2013 2008-2013Higher Education Capital Matching Grants MG080507 Higher Edu Capital Matching Grants 10,000 50,000 30,000 30,000 30,000 0 140,000 Subtotal 10,000 50,000 30,000 30,000 30,000 0 140,000 Total 10,000 50,000 30,000 30,000 30,000 0 140,000

DETAILED DATA
245
Correctional Services, Department of PROJECTED APPROPRIATIONS AND DISBURSEMENTS BY PROGRAM
2008-2009 THROUGH 2012-2013 (thousands of dollars)
APPROPRIATIONS Reappro-
priations 2008-2009 2009-2010 2010-2011 2011-2012 Maintenance and Improvement of Existing
Facilities
2012-2013Total
2008-2013
10010001 Heath And Safety 0 0 0 0 0 0 010010101 Health And Safety 0 0 0 0 0 0 010010201 Health And Safety 0 0 0 0 0 0 010010301 Health And Safety 1,232 0 0 0 0 0 010010401 Health And Safety 4,345 0 0 0 0 0 010010501 Health And Safety 5,407 0 0 0 0 0 010010601 Health And Safety 6,868 0 0 0 0 0 010010605 Energy Conservation 3,000 0 0 0 0 0 010010701 Health And Safety 19,500 0 0 0 0 0 010010801 Health And Safety 0 10,000 0 0 0 0 10,00010010901 Health and Safety 0 0 20,000 0 0 0 20,00010011001 Health and Safety 0 0 0 20,000 0 0 20,00010011101 Health and Safety 0 0 0 0 20,000 0 20,00010030003 Preservation Of Facilites 0 0 0 0 0 0 010030103 Preservation Of Facilities 0 0 0 0 0 0 010030203 Preservation Of Facilities 2,907 0 0 0 0 0 010030303 Preservation Of Facilities 4,923 0 0 0 0 0 010030403 Preservation Of Facilities 10,908 0 0 0 0 0 010030503 Preservation Of Facilitiies 22,152 0 0 0 0 0 010030603 Preservation Of Facilities 80,100 0 0 0 0 0 010030703 Preservation Of Facilities 144,838 0 0 0 0 0 010030803 Preservation Of Facilities 0 170,000 0 0 0 0 170,00010030903 Preservation of Facilities 0 0 147,000 0 0 0 147,00010031003 Preservation 0 0 0 157,000 0 0 157,00010031103 Preservation of Facilities 0 0 0 0 167,000 0 167,00010031206 Environmental Protection or Improve 0 0 0 0 0 16,000 16,00010060106 Environmental Protection Or Imp 0 0 0 0 0 0 010060206 Environmental Protection Or Improve 0 0 0 0 0 0 010060306 Environmental Protection Or Improve 740 0 0 0 0 0 010060406 Environmental Protection Or Improve 431 0 0 0 0 0 010060506 Environmental Protection Or Improve 2,314 0 0 0 0 0 010060606 Environmental Protection Or Improve 7,479 0 0 0 0 0 010060706 Environmental Protection Or Improve 16,000 0 0 0 0 0 010060806 Environmental Protection Or Improve 0 25,000 0 0 0 0 25,00010060906 Environmental Protection or Imp 0 0 16,000 0 0 0 16,00010061006 Enviornmental 0 0 0 16,000 0 0 16,00010061106 Environmental Protection or Improve 0 0 0 0 16,000 0 16,00010080008 Program Improvement Or Change 0 0 0 0 0 0 010080108 Program Improvement Or Change 0 0 0 0 0 0 010080208 Program Improvement Or Program Chan 879 0 0 0 0 0 010080308 Program Improvement Or Program Chan 1,660 0 0 0 0 0 010080408 Program Improvement Or Change 3,209 0 0 0 0 0 010080508 Program Improvement Or Change 12,158 0 0 0 0 0 010080608 Program Improvementor Change 26,422 0 0 0 0 0 010080708 Program Improvement Or Change 86,880 0 0 0 0 0 010080808 Program Improvement Or Change 0 85,000 0 0 0 0 85,00010080908 Program Improvement or Change 0 0 97,000 0 0 0 97,00010081008 Program Improvement 0 0 0 107,000 0 0 107,00010081108 Program Improvement or Change 0 0 0 0 117,000 0 117,000101H1201 Health and Safety 0 0 0 0 0 20,000 20,00010500550 Administration 0 0 0 0 0 0 010500650 Administration 10,463 0 0 0 0 0 010500750 Administration 15,000 0 0 0 0 0 010500850 Administration 0 15,000 0 0 0 0 15,00010500950 Administration 0 0 15,000 0 0 0 15,00010501050 Administration 0 0 0 15,000 0 0 15,00010501150 Administration 0 0 0 0 15,000 0 15,00010A11250 Administration 0 0 0 0 0 15,000 15,00010A40004 Physically Disabled 1,441 0 0 0 0 0 010A49804 Physically Disabled 0 0 0 0 0 0 010A49904 Physically Disabled 264 0 0 0 0 0 010EH0603 Rehab Employee Housing Units 1,205 0 0 0 0 0 010M30003 Asset Maintenance 0 0 0 0 0 0 010M30103 Asset Maintenance 0 0 0 0 0 0 010M30203 Asset Maintenance 352 0 0 0 0 0 010M30303 Asset Maintenance 1,360 0 0 0 0 0 010M30403 Asset Maintenance 1,675 0 0 0 0 0 010M30503 Asset Maintenance 7,439 0 0 0 0 0 010M30603 Asset Maintenance 6,725 0 0 0 0 0 010M30703 Asset Maintenance 15,000 0 0 0 0 0 010M30803 Asset Maintenance 0 15,000 0 0 0 0 15,00010M30903 Asset Maintenance 0 0 15,000 0 0 0 15,00010M31003 Asset Maintenance 0 0 0 15,000 0 0 15,00010M31103 Asset Maintenance 0 0 0 0 15,000 0 15,00010M31203 Asset Maintenance 0 0 0 0 0 15,000 15,000

DETAILED DATA
246
Correctional Services, Department of PROJECTED APPROPRIATIONS AND DISBURSEMENTS BY PROGRAM
2008-2009 THROUGH 2012-2013 (thousands of dollars)
APPROPRIATIONS Reappro-
priations 2008-2009 2009-2010 2010-2011 2011-2012 10P11203 Preservation of Facilities 0 0 0 0 0 10P21208 Program Improvement or Change 0 0 0 0 0 Subtotal 525,276 320,000 310,000 330,000 350,000 Medical Facilities
2012-2013167,000117,000350,000
Total2008-2013
167,000117,000
1,660,000
10M200MC Medical Facilities 1,436 0 0 0 0 0 010M298MC Medical Facilities 0 0 0 0 0 0 010M299MC Medical Facilities 183 0 0 0 0 Subtotal 1,619 0 0 0 0 Total 526,895 320,000 310,000 330,000 350,000
00
350,000
00
1,660,000

DETAILED DATA
247
Correctional Services, Department of PROJECTED APPROPRIATIONS AND DISBURSEMENTS BY PROGRAM
2008-2009 THROUGH 2012-2013 (thousands of dollars)
DISBURSEMENTS Estimated Total
2007-2008 2008-2009 2009-2010 2010-2011 2011-2012 2012-2013 2008-2013Maintenance and Improvement of Existing
Facilities 10010001 Heath And Safety 10010101 Health And Safety
2280
00
00
00
0 0
00
00
10010201 Health And Safety 10010301 Health And Safety 10010401 Health And Safety 10010501 Health And Safety 10010601 Health And Safety 10010605 Energy Conservation 10010701 Health And Safety 10010801 Health And Safety 10010901 Health and Safety 10011001 Health and Safety 10011101 Health and Safety 10030003 Preservation Of Facilites
0700
3,2194,306
10,6491,0005,500
0000
390
0731
1,4001,5011,0001,0004,0002,028
0000
00
1,4451,2181,0001,0005,0001,9208,000
000
000
864350
03,0002,4105,000
13,00000
0 0 0 0
56 0
2,000 1,920 4,000 5,000 8,000
0
000000
5001,7223,0002,0005,000
0
0731
2,8453,5832,4062,000
14,50010,00020,00020,00013,000
010030103 Preservation Of Facilities 337 0 0 0 0 0 010030203 Preservation Of Facilities 1,745 1,225 0 0 0 0 1,22510030303 Preservation Of Facilities 2,705 3,345 0 0 0 0 3,34510030403 Preservation Of Facilities 6,000 3,700 3,530 0 0 0 7,23010030503 Preservation Of Facilitiies 15,371 9,000 6,024 2,647 0 0 17,67110030603 Preservation Of Facilities 61,400 30,548 17,754 0 0 0 48,30210030703 Preservation Of Facilities 21,697 70,000 30,000 15,000 9,000 1,303 125,30310030803 Preservation Of Facilities 0 49,080 41,350 26,180 37,560 14,830 169,00010030903 Preservation of Facilities 0 0 64,000 44,000 5,000 30,000 143,00010031003 Preservation 0 0 0 68,347 30,000 58,653 157,00010031103 Preservation of Facilities 0 0 0 0 77,000 33,756 110,75610031206 Environmental Protection or Improve 10060106 Environmental Protection Or Imp
0298
00
00
00
0 0
3,0000
3,0000
10060206 Environmental Protection Or Improve 10060306 Environmental Protection Or Improve 10060406 Environmental Protection Or Improve 10060506 Environmental Protection Or Improve 10060606 Environmental Protection Or Improve 10060706 Environmental Protection Or Improve 10060806 Environmental Protection Or Improve 10060906 Environmental Protection or Imp 10061006 Enviornmental
607571431
1,6827,5165,007
000
0385
050
2,5006,0005,332
00
000
1,5821,5002,0005,4906,000
0
000
21500
1,5006,8604,0006,000
0 0 0 0
291 800
5,490 4,000 4,000
00000
6931,8282,0003,000
0385
01,6534,791
10,99325,00016,00013,000
10061106 Environmental Protection or Improve 10080008 Program Improvement Or Change 10080108 Program Improvement Or Change 10080208 Program Improvement Or Program Chan
033
461525
000
673
0000
0000
6,000 0 0 0
4,000000
10,00000
67310080308 Program Improvement Or Program Chan 10080408 Program Improvement Or Change 10080508 Program Improvement Or Change 10080608 Program Improvementor Change 10080708 Program Improvement Or Change 10080808 Program Improvement Or Change 10080908 Program Improvement or Change 10081008 Program Improvement 10081108 Program Improvement or Change 101H1201 Health and Safety 10500550 Administration
1,0533,059
15,49227,40010,129
00000
46
1,1331,5002,0008,000
38,00022,307
00000
0660
1,9001,500
35,00020,57037,000
0000
00
1,046500
014,46020,00057,006
000
0 0 0
65 0
4,083 15,000 18,994 56,000
0 0
0000
3,87122,58025,00031,000
8,0002,000
0
1,1332,1604,946
10,06576,87184,00097,000
107,00064,0002,000
010500650 Administration 11,476 0 0 0 0 0 010500750 Administration 9,000 6,000 0 0 0 0 6,00010500850 Administration 0 1,030 1,200 1,500 1,200 10,070 15,00010500950 Administration 0 0 5,000 5,000 5,000 0 15,00010501050 Administration 0 0 0 7,000 5,000 3,000 15,00010501150 Administration 0 0 0 0 5,000 4,000 9,00010A11250 Administration 0 0 0 0 0 4,000 4,00010A40004 Physically Disabled 10A49804 Physically Disabled 10A49904 Physically Disabled 10EH0603 Rehab Employee Housing Units 10M30003 Asset Maintenance
15230350
900170
1,00000
3000
000
570
00000
0 0 0 0 0
00000
1,00000
3570
10M30103 Asset Maintenance 79 0 0 0 0 0 010M30203 Asset Maintenance 108 312 0 0 0 0 31210M30303 Asset Maintenance 620 914 0 0 0 0 91410M30403 Asset Maintenance 1,267 400 300 0 0 0 70010M30503 Asset Maintenance 3,339 3,000 1,500 809 0 0 5,30910M30603 Asset Maintenance 5,539 3,000 500 500 41 0 4,04110M30703 Asset Maintenance 3,000 4,000 3,500 2,500 1,500 500 12,00010M30803 Asset Maintenance 0 3,000 3,000 3,000 3,000 3,000 15,00010M30903 Asset Maintenance 0 0 5,000 5,000 5,000 0 15,00010M31003 Asset Maintenance 0 0 0 5,000 5,000 5,000 15,00010M31103 Asset Maintenance 0 0 0 0 5,000 3,000 8,00010M31203 Asset Maintenance 0 0 0 0 0 2,000 2,000

DETAILED DATA
248
Correctional Services, Department of PROJECTED APPROPRIATIONS AND DISBURSEMENTS BY PROGRAM
2008-2009 THROUGH 2012-2013 (thousands of dollars)
DISBURSEMENTS Estimated Total
2007-2008 2008-2009 2009-2010 2010-2011 2011-2012 2012-2013 2008-201310P11203 Preservation of Facilities 0 0 0 0 0 10P21208 Program Improvement or Change 0 0 0 0 0
26,00011,694
26,00011,694
Subtotal 245,560 289,394 315,500 323,000 330,000 330,000 1,587,894Medical Facilities 10M200MC Medical Facilities 84 1,382 0 0 0 0 1,38210M298MC Medical Facilities 356 0 0 0 0 0 010M299MC Medical Facilities 0 224 0 0 0 0 224 Subtotal 440 1,606 0 0 0 0 1,606 Total 246,000 291,000 315,500 323,000 330,000 330,000 1,589,500

DETAILED DATA
249
State Police, Division of PROJECTED APPROPRIATIONS AND DISBURSEMENTS BY PROGRAM
2008-2009 THROUGH 2012-2013 (thousands of dollars)
APPROPRIATIONS Reappro-
priations 2008-2009 2009-2010 2010-2011 2011-2012 Maintenance and Improvement of Existing
Facilities
2012-2013Total
2008-2013
06010401 Health And Safety 0 0 0 0 0 0 006010403 Preservation Of Facilities 196 0 0 0 0 0 006010501 Health & Safety 190 0 0 0 0 0 006010503 Preservation Of Facilities 1,202 0 0 0 0 0 006030303 Preservation Of Facilities 243 0 0 0 0 0 006HS0601 Health and Safety 1,705 0 0 0 0 0 006HS0701 Health and Safety 2,000 0 0 0 0 0 006HS0801 Health and Safety 0 2,000 0 0 0 0 2,00006HS0901 Health and Safety 0 0 2,000 0 0 0 2,00006HS1001 Health and Safety 0 0 0 1,000 0 0 1,00006HS1101 Health and Safety 0 0 0 0 1,000 0 1,00006HS1201 Health and Safety 0 0 0 0 0 2,000 2,00006PD0803 Consolidated Dispatch Centers 0 6,000 0 0 0 0 6,00006PD0903 Consolidated Dispatch Centers 0 0 4,000 0 0 0 4,00006PF0603 Preservation of Existing Facilities 3,398 0 0 0 0 0 006PF0703 Preservation of Existing Facilities 4,198 0 0 0 0 0 006PF0803 Preservation of Existing Facilities 0 3,500 0 0 0 0 3,50006PF0903 Preservation of Existing Facilities 0 0 3,500 0 0 0 3,50006PF1003 Preservation of Existing Facilities 0 0 0 7,000 0 0 7,00006PF1103 Preservation of Existing Facilities 0 0 0 0 9,500 0 9,50006PF1203 Preservation of Facilities 0 0 0 0 0 9,500 9,50006PR0103 Preservation Of Facilities 282 0 0 0 0 0 0 Subtotal 13,414 11,500 9,500 8,000 10,500 11,500 51,000New Facilities 06060507 Troop G Headquarters 5,097 0 0 0 0 0 006EV0607 Evidence Storage Facilities 8,342 0 0 0 0 0 006EV0707 Evidence Storage Facility 6,000 0 0 0 0 0 006EV0907 Evidence Storage Facility 0 0 6,000 0 0 0 6,00006EV1007 Evidence Storage Facility 0 0 0 6,000 0 0 6,00006NF0607 Troop L 3,976 0 0 0 0 0 006NF0707 Troop G Headquarters 50,000 0 0 0 0 0 006NF1107 New Zone Headquarters 0 0 0 0 4,000 0 4,00006NF1207 New Zone Headquarters 0 0 0 0 0 4,000 4,000 Subtotal 73,415 0 6,000 6,000 4,000 4,000 20,000 Total 86,829 11,500 15,500 14,000 14,500 15,500 71,000

DETAILED DATA
250
State Police, Division of PROJECTED APPROPRIATIONS AND DISBURSEMENTS BY PROGRAM
2008-2009 THROUGH 2012-2013 (thousands of dollars)
DISBURSEMENTS Estimated Total
2007-2008 2008-2009 2009-2010 2010-2011 2011-2012 2012-2013 2008-2013Maintenance and Improvement of Existing
Facilities 06010401 Health And Safety 32 0 0 0 0 0 006010403 Preservation Of Facilities 110 120 0 0 0 0 12006010501 Health & Safety 417 0 0 0 0 0 006010503 Preservation Of Facilities 658 774 100 0 0 0 87406030303 Preservation Of Facilities 63 200 0 0 0 0 20006HS0601 Health and Safety 450 639 450 350 0 0 1,43906HS0701 Health and Safety 0 232 832 400 500 0 1,96406HS0801 Health and Safety 0 314 500 1,098 88 0 2,00006HS0901 Health and Safety 0 0 502 500 398 0 1,40006HS1001 Health and Safety 0 0 0 332 500 168 1,00006HS1101 Health and Safety 0 0 0 0 514 486 1,00006HS1201 Health and Safety 0 0 0 0 0 0 006PD0803 Consolidated Dispatch Centers 0 2,000 4,000 0 0 0 6,00006PD0903 Consolidated Dispatch Centers 0 0 0 4,000 0 0 4,00006PF0603 Preservation of Existing Facilities 1,866 1,335 950 0 0 0 2,28506PF0703 Preservation of Existing Facilities 160 1,310 1,730 1,000 0 0 4,04006PF0803 Preservation of Existing Facilities 0 200 900 1,500 900 0 3,50006PF0903 Preservation of Existing Facilities 0 0 236 900 1,500 864 3,50006PF1003 Preservation of Existing Facilities 0 0 0 600 1,800 4,600 7,00006PF1103 Preservation of Existing Facilities 0 0 0 0 600 682 1,28206PF1203 Preservation of Facilities 0 0 0 0 0 0 006PR0103 Preservation Of Facilities 15 274 0 0 0 0 274 Subtotal 3,771 7,398 10,200 10,680 6,800 6,800 41,878New Facilities 06060507 Troop G Headquarters 1,000 4,247 0 0 0 0 4,24706EV0607 Evidence Storage Facilities 300 6,370 1,680 0 0 0 8,05006EV0707 Evidence Storage Facility 0 2,400 1,400 1,200 0 0 5,00006EV0907 Evidence Storage Facility 0 0 0 0 3,220 780 4,00006EV1007 Evidence Storage Facility 0 0 0 600 2,400 3,000 6,00006NF0607 Troop L 10 1,790 780 0 0 0 2,57006NF0707 Troop G Headquarters 0 10,000 19,420 15,200 5,380 0 50,00006NF1107 New Zone Headquarters 0 0 0 0 0 4,000 4,00006NF1207 New Zone Headquarters 0 0 0 0 0 3,220 3,220 Subtotal 1,310 24,807 23,280 17,000 11,000 11,000 87,087 Total 5,081 32,205 33,480 27,680 17,800 17,800 128,965

DETAILED DATA
251
Military and Naval Affairs, Division of PROJECTED APPROPRIATIONS AND DISBURSEMENTS BY PROGRAM
2008-2009 THROUGH 2012-2013 (thousands of dollars)
APPROPRIATIONS Reappro-
priations 2008-2009 2009-2010 2010-2011 2011-2012 Design and Construction Supervision 070F0430 Design & Construction 0 0 0 0 0
2012-2013
0
Total2008-2013
007F10307 Fed MILCON D&C 0 0 0 0 0 0 007F10907 Milcon design 0 0 10,000 0 0 0 10,00007F11003 Presv. Des. 0 0 0 2,500 0 0 2,50007F20703 Fed D&C 2,500 0 0 0 0 0 007FN0807 D&C Federal New Facilities 0 1,100 0 0 0 0 1,10007FN1007 D&C Federal New Facilities 0 0 0 5,000 0 0 5,00007FN1107 D&C Federal New Facilities 0 0 0 0 12,000 0 12,00007FN1207 D&C Federal New Facilities 0 0 0 0 0 12,000 12,00007FP0803 D&C Federal Preservation of Facilit 0 2,500 0 0 0 0 2,50007FP1103 D&C Federal Preservation of Facilit 0 0 0 0 9,000 0 9,00007FP1203 D&C Federal Preservation of Facilit 0 0 0 0 0 8,000 8,00007M10230 Federal Design And Construction 0 0 0 0 0 0 007M10307 State MILCON D&C 2,052 0 0 0 0 0 007M10507 Milcon D&C 1,379 0 0 0 0 0 007M20230 Federal Design And Construction 0 0 0 0 0 0 007M40707 Milcon D&C 4,858 0 0 0 0 0 007M50607 Milcon D&C 3,000 0 0 0 0 0 007N90430 Federal D & C Preservation 0 0 0 0 0 0 007P10603 Preservation M&I 2,607 0 0 0 0 0 007P10903 Presv D&C 0 0 3,000 0 0 0 3,00007P20603 Preservation Design 700 0 0 0 0 0 007P30903 PresvD&C 0 0 3,000 0 0 0 3,00007P40703 Pres. Des. 2,500 0 0 0 0 0 007R20503 Presv. D&C 0 0 0 0 0 0 007S10707 Milcon design 2,000 0 0 0 0 0 007SF1103 D&C State Preservation of Facilitie 0 0 0 0 5,000 0 5,00007SF1203 D&C Preservation of Facilities 0 0 0 0 0 5,000 5,00007SN0807 D&C State New Facilities 0 2,000 0 0 0 0 2,00007SN0907 D&C State New Facilities 0 0 2,000 0 0 0 2,00007SN1007 D&C State New Facilities 0 0 0 3,000 0 0 3,00007SP0803 D&C State Preservation 0 2,500 0 0 0 0 2,500 Subtotal 21,596 8,100 18,000 10,500 26,000 25,000 87,600Maintenance and Improvements 07040303 Non-Milcon M&I 0 0 0 0 0 0 007F10703 Fed M&I 8,422 0 0 0 0 0 007F10707 Milcon construct 10,000 0 0 0 0 0 007F11107 Milcon constr 0 0 0 0 20,000 0 20,00007F21003 Presv. Constr. 0 0 0 7,000 0 0 7,00007F21103 Presv. Constr. 0 0 0 0 7,000 0 7,00007F30403 Maintenance & Improvement 1,166 0 0 0 0 07FF0807 M&I Federal New Facilities 0 2,000 0 0 0
00
02,000
07FF1207 M&I Federal New Facilities 0 0 0 0 0 25,000 25,00007FO0803 M&I Federal Preservation of Facilti 0 12,000 0 0 0 0 12,00007FO1203 M&I Federal Preservation of Facilit 0 0 0 0 0 8,000 8,00007G50503 Maintenance & Improvement 606 0 0 0 0 07M00307 Fed MILCON Maint&Imprvmt 8,835 0 0 0 0 07M10407 Fed MILCON M&I 11,226 0 0 0 0
000
000
07M20307 MILCON M&I 5,400 0 0 0 0 0 007M20507 Milcon M&I 1,000 0 0 0 0 0 007M20607 Milcon M&I 3,500 0 0 0 0 0 007M31007 Milcon M&I 0 0 0 15,000 0 0 15,00007M40207 Fed Mainenance And Improvement 0 0 0 0 0 07MI0507 Milcon M&I 4,269 0 0 0 0
00
00
07MI0607 Milcon M&I 23,273 0 0 0 0 0 007N80403 Reg M&I 0 0 0 0 0 07P00503 Regular M&I 436 0 0 0 0 07P11003 Preservation D&C 0 0 0 10,000 0
000
00
10,00007P20903 Presv M&I 0 0 10,000 0 0 0 10,00007P30603 Presv. M&I 4,791 0 0 0 0 0 007P50903 PresvM&I 0 0 6,000 0 0 0 6,00007P70603 Fed Presv M&I 1,238 0 0 0 0 0 007S10703 State M&I 5,600 0 0 0 0 0 007S11103 Presv. Constr. 0 0 0 0 8,000 0 8,00007SF0807 M&I State New Facilities 0 1,000 0 0 0 0 1,00007SF0907 M&I State New Facilities 0 0 3,000 0 0 0 3,00007SO0803 M&I State Preservation of Facilitie 0 7,600 0 0 0 0 7,60007SO0903 M&I State Preservation of Facilitie 0 0 5,000 0 0 0 5,000 Subtotal 89,762 22,600 24,000 32,000 35,000 33,000 146,600 Total 111,358 30,700 42,000 42,500 61,000 58,000 234,200

DETAILED DATA
252
Military and Naval Affairs, Division of PROJECTED APPROPRIATIONS AND DISBURSEMENTS BY PROGRAM
2008-2009 THROUGH 2012-2013 (thousands of dollars)
DISBURSEMENTS Estimated Total
2007-2008 2008-2009 2009-2010 2010-2011 2011-2012 2012-2013 2008-2013Design and Construction Supervision 070F0430 Design & Construction 0 0 0 0 0 0 007F10307 Fed MILCON D&C 203 0 0 0 0 0 007F10907 Milcon design 0 0 1,500 5,000 1,000 1,000 8,50007F11003 Presv. Des. 0 0 0 2,000 0 0 2,00007F20703 Fed D&C 1,000 1,500 0 0 0 0 1,50007FN0807 D&C Federal New Facilities 0 100 1,000 0 0 0 1,10007FN1007 D&C Federal New Facilities 0 0 0 2,000 2,000 1,000 5,00007FN1107 D&C Federal New Facilities 0 0 0 0 12,000 0 12,00007FN1207 D&C Federal New Facilities 0 0 0 0 0 6,000 6,00007FP0803 D&C Federal Preservation of Facilit 0 200 300 2,000 0 0 2,50007FP1103 D&C Federal Preservation of Facilit 0 0 0 0 6,100 2,900 9,00007FP1203 D&C Federal Preservation of Facilit 0 0 0 0 0 5,100 5,10007M10230 Federal Design And Construction 79 0 0 0 0 0 007M10307 State MILCON D&C 586 1,000 374 0 0 0 1,37407M10507 Milcon D&C 2,200 500 0 0 0 0 50007M20230 Federal Design And Construction 6 0 0 0 0 0 007M40707 Milcon D&C 720 2,840 1,440 0 0 0 4,28007M50607 Milcon D&C 200 1,800 1,000 0 0 0 2,80007N90430 Federal D & C Preservation 66 0 0 0 0 0 007P10603 Preservation M&I 925 2,037 0 0 0 0 2,03707P10903 Presv D&C 0 0 1,000 2,000 0 0 3,00007P20603 Preservation Design 1,200 0 0 0 0 0 007P30903 PresvD&C 0 0 1,200 1,500 300 0 3,00007P40703 Pres. Des. 0 1,500 1,000 0 0 0 2,50007R20503 Presv. D&C 128 0 0 0 0 0 007S10707 Milcon design 1,823 177 0 0 0 0 17707SF1103 D&C State Preservation of Facilitie 0 0 0 0 0 0 007SF1203 D&C Preservation of Facilities 0 0 0 0 0 0 007SN0807 D&C State New Facilities 0 1,043 676 281 0 0 2,00007SN0907 D&C State New Facilities 0 0 0 0 700 1,300 2,00007SN1007 D&C State New Facilities 0 0 0 0 0 2,000 2,00007SP0803 D&C State Preservation 0 1,500 250 750 0 0 2,500 Subtotal 9,136 14,197 9,740 15,531 22,100 19,300 80,868Maintenance and Improvements 07040303 Non-Milcon M&I 0 0 0 0 0 0 007F10703 Fed M&I 700 6,800 1,000 0 0 0 7,80007F10707 Milcon construct 500 7,000 2,500 0 0 0 9,50007F11107 Milcon constr 0 0 0 0 11,000 9,000 20,00007F21003 Presv. Constr. 0 0 0 4,500 1,600 900 7,00007F21103 Presv. Constr. 0 0 0 0 6,000 0 6,00007F30403 Maintenance & Improvement 1,500 283 0 0 0 0 28307FF0807 M&I Federal New Facilities 0 0 1,000 1,000 0 0 2,00007FF1207 M&I Federal New Facilities 0 0 0 0 0 11,200 11,20007FO0803 M&I Federal Preservation of Facilti 0 1,000 1,000 10,000 0 0 12,00007FO1203 M&I Federal Preservation of Facilit 0 0 0 0 0 3,900 3,90007G50503 Maintenance & Improvement 600 107 0 0 0 0 10707M00307 Fed MILCON Maint&Imprvmt 5,703 5,043 0 0 0 0 5,04307M10407 Fed MILCON M&I 14,800 6,422 1,014 0 0 0 7,43607M20307 MILCON M&I 561 1,000 900 1,000 1,789 0 4,68907M20507 Milcon M&I 480 520 0 0 0 0 52007M20607 Milcon M&I 500 1,700 1,300 0 0 0 3,00007M31007 Milcon M&I 0 0 0 14,000 1,000 0 15,00007M40207 Fed Mainenance And Improvement 30 0 0 0 0 0 007MI0507 Milcon M&I 3,800 3,282 0 0 0 0 3,28207MI0607 Milcon M&I 6,900 10,000 6,598 0 0 0 16,59807N80403 Reg M&I 240 0 0 0 0 0 007P00503 Regular M&I 1,100 436 0 0 0 0 43607P11003 Preservation D&C 0 0 0 0 1,000 2,000 3,00007P20903 Presv M&I 0 0 0 1,819 6,181 2,000 10,00007P30603 Presv. M&I 1,550 2,000 2,050 0 0 0 4,05007P50903 PresvM&I 0 0 3,000 3,000 0 0 6,00007P70603 Fed Presv M&I 900 400 448 0 0 0 84807S10703 State M&I 0 1,500 4,100 0 0 0 5,60007S11103 Presv. Constr. 0 0 0 0 0 30 3007SF0807 M&I State New Facilities 0 1,000 0 0 0 0 1,00007SF0907 M&I State New Facilities 0 0 0 1,000 330 1,670 3,00007SO0803 M&I State Preservation of Facilitie 0 3,600 1,250 2,750 0 0 7,60007SO0903 M&I State Preservation of Facilitie 0 0 0 1,000 0 1,000 2,000 Subtotal 39,864 52,093 26,160 40,069 28,900 31,700 178,922 Total 49,000 66,290 35,900 55,600 51,000 51,000 259,790

DETAILED DATA
253
Homeland Security - Miscellaneous PROJECTED APPROPRIATIONS AND DISBURSEMENTS BY PROGRAM
2008-2009 THROUGH 2012-2013 (thousands of dollars)
APPROPRIATIONS Reappro-
priations 2008-2009 2009-2010 2010-2011 2011-2012 Homeland Security LS010201 Homeland Security Projects 422 0 0 0 0
2012-2013
0
Total2008-2013
0LS010301 Homeland Security Projects 6,256 0 0 0 0 0 0LS010401 Homeland Security Projects 2,389 0 0 0 0 0 0LS010601 Homeland Security Projects 2,703 0 0 0 0 0 0LS020301 Homeland Security Projects 1,673 0 0 0 0 0 0LS070101 World Trade Center Related Costs 6,138 0 0 0 0 0 0LSDQ0501 AESOB Security 91 0 0 0 0 0 0 Subtotal 19,672 0 0 0 0 0 0 Total 19,672 0 0 0 0 0 0
Homeland Security - Miscellaneous
PROJECTED APPROPRIATIONS AND DISBURSEMENTS BY PROGRAM 2008-2009 THROUGH 2012-2013
(thousands of dollars) DISBURSEMENTS
Estimated Total
2007-2008 2008-2009 2009-2010 2010-2011 2011-2012 2012-2013 2008-2013Homeland Security LS010201 Homeland Security Projects 1,000 365 0 0 0 0 365LS010301 Homeland Security Projects 1,450 3,836 0 0 0 0 3,836LS010401 Homeland Security Projects 1,025 849 125 0 0 0 974LS010601 Homeland Security Projects 2,703 0 0 0 0 0 0LS020301 Homeland Security Projects 0 398 0 0 0 0 398LS070101 World Trade Center Related Costs 8,000 1,500 0 0 0 0 1,500LSDQ0501 AESOB Security 25 25 0 0 0 0 25 Subtotal 14,203 6,973 125 0 0 0 7,098 Total 14,203 6,973 125 0 0 0 7,098

DETAILED DATA
254
Mental Health, Office of PROJECTED APPROPRIATIONS AND DISBURSEMENTS BY PROGRAM
2008-2009 THROUGH 2012-2013 (thousands of dollars)
APPROPRIATIONS Reappro-
priations 2008-2009 2009-2010 2010-2011 2011-2012 Administration
2012-2013Total
2008-2013
00638103 Payment Of Claims 2,445 0 0 0 0 0 050990450 Administration 428 0 0 0 0 0 050990550 Administration 0 0 0 0 0 0 050990650 Administration 2,169 0 0 0 0 0 050990750 Administration 3,547 0 0 0 0 0 050990850 Administration 0 3,717 0 0 0 0 3,71750990950 Administration 0 0 3,717 0 0 0 3,71750991050 Administration 0 0 0 3,717 0 0 3,71750991150 Administration 0 0 0 0 3,717 0 3,71750991250 Administration 0 0 0 0 0 Subtotal 8,589 3,717 3,717 3,717 3,717 Design and Construction Supervision 50310330 Preparation of Plans 300 0 0 0 0 50310430 Preparation of Plans 2,635 0 0 0 0 50310530 Preparation of Plans 2,000 0 0 0 0 50310630 Preparation of Plans 2,000 0 0 0 0 50310730 Preparation of Plans 12,000 0 0 0 0 50310830 Preparation of Plans 0 12,000 0 0 0 50310930 Preparation of Plans 0 0 12,000 0 0 50311030 Preparation of Plans 0 0 0 12,000 0 50311130 Preparation of Plans 0 0 0 0 12,000 50311230 Preparation of Plans 0 0 0 0 0 50DC0630 Preparation of Plans HD 117 0 0 0 0 50DC0730 Preparation of Plans HD 2,000 0 0 0 0 50DC0830 Preparation of Plans HD 0 2,000 0 0 0 50DC0930 Preparation of Plans HD 0 0 2,000 0 0 50DC1030 Preparation of Plans HD 0 0 0 2,000 0 50DC1130 Preparation of Plans HD 0 0 0 0 2,000 50DC1230 Preparation of Plans HD 0 0 0 0 0 Subtotal 21,052 14,000 14,000 14,000 14,000 Maintenance and Improvements of State
Facilities
3,717 3,7173,717 18,585
000000000
12,000000000
2,000
00000
12,00012,00012,00012,00012,000
00
2,0002,0002,0002,0002,000
14,000 70,000
50010001 Health and Safety 0 0 0 0 0 0 050010101 Health and Safety 509 0 0 0 0 0 050010201 Health and Safety 6,027 0 0 0 0 0 050010301 Health and Safety 2,193 0 0 0 0 0 050010401 Health and Safety 3,519 0 0 0 0 0 050010501 Health and Safety 11,820 0 0 0 0 0 050010601 Health and Safety 6,423 0 0 0 0 0 050010701 Health and Safety 28,757 0 0 0 0 0 050010801 Health and Safety 0 60,276 0 0 0 0 60,27650010901 Health and Safety 0 0 45,000 0 0 0 45,00050011001 Health and Safety 0 0 0 45,000 0 0 45,00050011101 Health and Safety 0 0 0 0 45,000 0 45,00050011201 Health and Safety 0 0 0 0 0 45,000 45,00050030003 Preservation of Facilities 0 0 0 0 0 0 050030103 Preservation of Facilities 9,859 0 0 0 0 0 050030203 Preservation of Facilities 2,100 0 0 0 0 0 050030303 Preservation of Facilities 2,749 0 0 0 0 0 050030403 Preservation of Facilities 10,136 0 0 0 0 0 050030503 Preservation of Facilities 9,954 0 0 0 0 0 050030603 Preservation of Facilities 16,434 0 0 0 0 0 050030703 Preservation of Facilities 34,946 0 0 0 0 0 050030803 Preservation of Facilities 0 24,688 0 0 0 0 24,68850030903 Preservation of Facilities 0 0 70,000 0 0 0 70,00050031003 Preservation of Facilities 0 0 0 70,000 0 0 70,00050031103 Preservation of Facilities 0 0 0 0 70,000 0 70,00050031203 Preservation of Facilities 0 0 0 0 0 70,000 70,00050050505 Energy HD 0 0 0 0 0 0 050050605 Energy HD 1,383 0 0 0 0 0 050050705 Energy HD 4,200 0 0 0 0 0 050050805 Energy HD 0 4,500 0 0 0 0 4,50050050905 Energy HD 0 0 4,200 0 0 0 4,20050051005 Energy HD 0 0 0 4,200 0 0 4,20050051105 Energy HD 0 0 0 0 4,200 0 4,20050051205 Energy HD 0 0 0 0 0 4,200 4,20050060302 Accreditation 1,672 0 0 0 0 0 050060402 Accreditation 4,189 0 0 0 0 0 050060406 Environmental Protection 0 0 0 0 0 0 050060502 Accreditation 32,699 0 0 0 0 0 050060506 Environmental Protection 288 0 0 0 0 0 050060602 Accreditation 61,474 0 0 0 0 0 050060606 Environmental Protection 500 0 0 0 0 0 050060702 Accreditation 163,659 0 0 0 0 0 050060706 Environmental Protection 500 0 0 0 0 0 0

DETAILED DATA
255
Mental Health, Office of PROJECTED APPROPRIATIONS AND DISBURSEMENTS BY PROGRAM
2008-2009 THROUGH 2012-2013 (thousands of dollars)
APPROPRIATIONS Reappro-
priations 2008-2009 2009-2010 2010-2011 2011-2012 50060802 Accreditation 0 95,624 0 0 0
2012-2013Total
2008-20130 95,624
50060806 Environmental Protection 0 1,000 0 0 0 0 1,00050060902 Accreditation 0 0 45,000 0 0 0 45,00050060906 Environmental Protection 0 0 1,000 0 0 0 1,00050061002 Accreditation 0 0 0 45,000 0 0 45,00050061006 Environmental Protection 0 0 0 1,000 0 0 1,00050061102 Accreditation 0 0 0 0 45,000 0 45,00050061106 Environmental Protection 0 0 0 0 1,000 0 1,00050061202 Accreditation 0 0 0 0 0 45,000 45,00050061206 Environmental Protection 0 0 0 0 0 1,000 1,00050080008 Program Improvement or Change 0 0 0 0 0 0 050080108 Program Improvement or Change 6,776 0 0 0 0 0 050080208 Program Improvement or Change 2,000 0 0 0 0 0 050080308 Program Improvement or Change 2,862 0 0 0 0 0 050080408 Program Improvement or Change 1,647 0 0 0 0 0 050080508 Program Improvement or Change 5,145 0 0 0 0 0 050080608 Program Improvement or Change 69,675 0 0 0 0 0 050080708 Program Improvement or Change 46,208 0 0 0 0 0 050080808 Program Improvement or Change 0 32,952 0 0 0 0 32,95250080908 Program Improvement or Change 0 0 22,500 0 0 0 22,50050081008 Program Improvement or Change 0 0 0 22,500 0 0 22,50050081108 Program Improvement or Change 0 0 0 0 22,500 0 22,50050081208 Program Improvement or Change 0 0 0 0 0 22,500 22,50050160306 Environmental Protection 688 0 0 0 0 0 050380789 Minor Rehabilitation HD 4,000 0 0 0 0 0 050380989 Minor Rehabilitation HD 0 0 4,000 0 0 0 4,00050381089 Minor Rehabilitation HD 0 0 0 4,000 0 0 4,00050381189 Minor Rehabilitation HD 0 0 0 0 4,000 0 4,00050381289 Minor Rehabilitation HD 0 0 0 0 0 4,000 4,00050EP0006 Environmental Protection HD 360 0 0 0 0 0 050EP0106 Environmental Protection HD 369 0 0 0 0 0 050EP0206 Environmental Protection HD 222 0 0 0 0 0 050EP0306 Environmental Protection HD 113 0 0 0 0 0 050EP0406 Environmental Protection HD 341 0 0 0 0 0 050EP0506 Environmental Protection HD 3,538 0 0 0 0 0 050EP0606 Environmental Protection HD 4,330 0 0 0 0 0 050EP0706 Environmental Protection HD 8,010 0 0 0 0 0 050EP0806 Environmental Protection HD 0 4,100 0 0 0 0 4,10050EP0906 Environmental Protection HD 0 0 5,010 0 0 0 5,01050EP1006 Environmental Protection HD 0 0 0 5,010 0 0 5,01050EP1106 Environmental Protection HD 0 0 0 0 5,010 0 5,01050EP1206 Environmental Protection HD 0 0 0 0 0 5,010 5,01050HS0501 Health and Safety HD 0 0 0 0 0 0 050HS0601 Health and Safety HD 1,430 0 0 0 0 0 050HS0701 Health and Safety HD 3,577 0 0 0 0 0 050HS0801 Health and Safety HD 0 7,010 0 0 0 0 7,01050HS0901 Health and Safety HD 0 0 4,000 0 0 0 4,00050HS1001 Health and Safety HD 0 0 0 4,000 0 0 4,00050HS1101 Health and Safety HD 0 0 0 0 4,000 0 4,00050HS1201 Health and Safety HD 0 0 0 0 0 4,000 4,00050PF0503 Preservation of Facilities HD 0 0 0 0 0 0 050PF0603 Preservation of Facilities HD 5,514 0 0 0 0 0 050PF0703 Preservation of Facilities HD 13,765 0 0 0 0 0 050PF0803 Preservation of Facilities HD 0 18,400 0 0 0 0 18,40050PF0903 Preservation of Facilities HD 0 0 16,800 0 0 0 16,80050PF1003 Preservation of Facilities HD 0 0 0 16,800 0 0 16,80050PF1103 Preservation of Facilities HD 0 0 0 0 16,800 0 16,80050PF1203 Preservation of Facilities HD 0 0 0 0 0 16,800 16,80050SL0603 Preservation for St. Lawrence PC 5,000 0 0 0 0 Subtotal 601,560 248,550 217,510 217,510 217,510 Non-Bondable Projects
0 0217,510 1,118,590
502907NB Non-Bondable Fallout 0 0 0 0 0 0 0502908NB Non-Bondable Fallout 0 1,000 0 0 0 0 1,000502909NB Non-Bondable Fallout 0 0 1,000 0 0 0 1,000502910NB Non Bondable Fallout 0 0 0 1,000 0 0 1,000502911NB Non-Bondable Fallout 0 0 0 0 1,000 0 1,000502912NB Non-Bondable Fallout 0 0 0 0 0 1,000 1,00050FO00NB Non-Bondable Fallout 8,000 0 0 0 0 Subtotal 8,000 1,000 1,000 1,000 1,000 Voluntary Facilities 50100189 Community MH Facilities 0 0 0 0 0 50100289 Community MH Facilities 1,199 0 0 0 0 50100389 Community MH Facilities 4,007 0 0 0 0 50100489 Community MH Facilities 3,551 0 0 0 0 50100589 Community MH Services 4,525 0 0 0 0 50100689 Community MH Facilities 6,000 0 0 0 0
0 01,000 5,000
000000
000000

DETAILED DATA
256
Mental Health, Office of PROJECTED APPROPRIATIONS AND DISBURSEMENTS BY PROGRAM
2008-2009 THROUGH 2012-2013 (thousands of dollars)
APPROPRIATIONS Reappro-
priations 2008-2009 2009-2010 2010-2011 2011-2012 2012-2013Total
2008-201350100789 Community MH Facilities 6,000 0 0 0 0 0 050100889 Community MH Facilities 0 6,000 0 0 0 0 6,00050100989 Community MH Facilities 0 0 6,000 0 0 0 6,00050101089 Community MH Facilities 0 0 0 6,000 0 0 6,00050101189 Community MH Facilities 0 0 0 0 6,000 0 6,00050101289 Community MH Facilities 0 0 0 0 0 6,000 6,00050109007 Community MH Facilities 2,338 0 0 0 0 0 050120750 Local Administration 0 0 0 0 0 0 050120850 Local Administration 0 555 0 0 0 0 55550120950 Local Administration 0 0 555 0 0 0 55550121050 Local Administration 0 0 0 555 0 0 55550121150 Local Administration 0 0 0 0 555 0 55550121250 Local Administration 0 0 0 0 0 555 55550139307 Supported Housing 1,978 0 0 0 0 0 050139807 Supported Hsg 3,062 0 0 0 0 0 050149307 Community Residences 1,701 0 0 0 0 0 050159307 Community MH Facilities 0 0 0 0 0 0 050230103 Community MH Facilities 666 0 0 0 0 0 050230203 Community MH Facilities 0 0 0 0 0 0 050230303 Community MH Facilities 651 0 0 0 0 0 050230403 Community MH Facilities 0 0 0 0 0 0 050230603 Community MH Facilities 13,513 0 0 0 0 0 050230703 Community MH Facilities 112,000 0 0 0 0 0 050230803 Community MH Facilities 0 28,000 0 0 0 0 28,00050230903 Community MH Facilities 0 0 5,000 0 0 0 5,00050231003 Community MH Facilities 0 0 0 5,000 0 0 5,00050231103 Community MH Facilities 0 0 0 0 5,000 0 5,00050231203 Community MH Facilities 0 0 0 0 0 5,000 5,00050239407 Reinvestment 960 0 0 0 0 0 050279807 Homeless Housing 3,747 0 0 0 0 0 050VY0307 Com Residential Housing 42,033 0 0 0 0 0 050VY0507 Community Residential Housing 65,956 0 0 0 0 0 050VY0607 Community MH Facilities (NYNY III) 211,000 0 0 0 0 0 050VY0707 Community Residential Housing 200,000 0 0 0 0 0 050VY0807 Community Residential Housing 0 145,000 0 0 0 0 145,00050VY9907 Comm. Residential Housing 25,520 0 0 0 0 0 0 Subtotal 710,407 179,555 11,555 11,555 11,555 11,555 225,775 Total 1,349,608 446,822 247,782 247,782 247,782
247,782 1,437,950

DETAILED DATA
257
Mental Health, Office of PROJECTED APPROPRIATIONS AND DISBURSEMENTS BY PROGRAM
2008-2009 THROUGH 2012-2013 (thousands of dollars)
DISBURSEMENTS Estimated Total
2007-2008 2008-2009 2009-2010 2010-2011 2011-2012 2012-2013 2008-2013Administration 00638103 Payment Of Claims 0 0 0 0 0 0 050990450 Administration 0 0 0 0 0 0 050990550 Administration 0 0 0 0 0 0 050990650 Administration 800 0 0 0 0 0 050990750 Administration 3,345 372 0 0 0 0 37250990850 Administration 0 3,345 372 0 0 0 3,71750990950 Administration 0 0 3,345 372 0 0 3,71750991050 Administration 0 0 0 3,345 372 0 3,71750991150 Administration 0 0 0 0 3,345 372 3,71750991250 Administration 0 0 0 0 0 Subtotal 4,145 3,717 3,717 3,717 3,717 Design and Construction Supervision 50310330 Preparation of Plans 0 0 0 0 0 50310430 Preparation of Plans 0 0 0 0 0 50310530 Preparation of Plans 0 0 0 0 0 50310630 Preparation of Plans 0 0 0 0 0 50310730 Preparation of Plans 1,200 6,000 4,800 0 0 50310830 Preparation of Plans 0 1,200 6,000 4,800 0 50310930 Preparation of Plans 0 0 1,200 6,000 4,800 50311030 Preparation of Plans 0 0 0 1,200 6,000 50311130 Preparation of Plans 0 0 0 0 1,200 50311230 Preparation of Plans 0 0 0 0 0 50DC0630 Preparation of Plans HD 0 0 0 0 0 50DC0730 Preparation of Plans HD 2,000 0 0 0 0 50DC0830 Preparation of Plans HD 0 2,000 0 0 0 50DC0930 Preparation of Plans HD 0 0 2,000 0 0 50DC1030 Preparation of Plans HD 0 0 0 2,000 0 50DC1130 Preparation of Plans HD 0 0 0 0 2,000 50DC1230 Preparation of Plans HD 0 0 0 0 0 Subtotal 3,200 9,200 14,000 14,000 14,000 Maintenance and Improvements of State
Facilities
3,345 3,3453,717 18,585
0000000
4,8006,0001,200
000000
2,000
0000
10,80012,00012,00012,0007,2001,200
00
2,0002,0002,0002,0002,000
14,000 65,200
50010001 Health and Safety 2,000 0 0 0 0 0 050010101 Health and Safety 345 0 0 0 0 0 050010201 Health and Safety 4,000 7,000 0 0 0 0 7,00050010301 Health and Safety 0 4,200 0 0 0 0 4,20050010401 Health and Safety 0 0 0 0 0 0 050010501 Health and Safety 7,837 7,909 330 0 0 0 8,23950010601 Health and Safety 0 3,800 8,509 0 0 0 12,30950010701 Health and Safety 2,896 14,482 11,585 0 0 0 26,06750010801 Health and Safety 0 3,216 16,079 12,862 0 0 32,15750010901 Health and Safety 0 0 4,500 22,500 18,000 0 45,00050011001 Health and Safety 0 0 0 4,500 22,500 18,000 45,00050011101 Health and Safety 0 0 0 0 4,500 22,500 27,00050011201 Health and Safety 0 0 0 0 0 4,500 4,50050030003 Preservation of Facilities 0 0 0 0 0 0 050030103 Preservation of Facilities 5,500 5,500 0 0 0 0 5,50050030203 Preservation of Facilities 3,000 0 0 0 0 0 050030303 Preservation of Facilities 3,000 3,000 0 0 0 0 3,00050030403 Preservation of Facilities 5,000 5,000 0 0 0 0 5,00050030503 Preservation of Facilities 11,762 2,500 2,500 0 0 0 5,00050030603 Preservation of Facilities 0 9,200 0 0 0 0 9,20050030703 Preservation of Facilities 3,495 17,473 13,978 0 0 0 31,45150030803 Preservation of Facilities 0 2,469 12,344 9,875 0 0 24,68850030903 Preservation of Facilities 0 0 7,000 35,000 28,000 0 70,00050031003 Preservation of Facilities 0 0 0 7,000 35,000 28,000 70,00050031103 Preservation of Facilities 0 0 0 0 7,000 35,000 42,00050031203 Preservation of Facilities 0 0 0 0 0 7,000 7,00050050505 Energy HD 0 0 0 0 0 0 050050605 Energy HD 0 0 0 2,500 0 0 2,50050050705 Energy HD 2,100 2,100 0 0 0 0 2,10050050805 Energy HD 0 2,250 2,250 0 0 0 4,50050050905 Energy HD 0 0 2,100 2,100 0 0 4,20050051005 Energy HD 0 0 0 2,100 2,100 0 4,20050051105 Energy HD 0 0 0 0 2,100 2,100 4,20050051205 Energy HD 0 0 0 0 0 2,100 2,10050060302 Accreditation 355 0 0 0 0 0 050060402 Accreditation 0 0 0 0 0 0 050060406 Environmental Protection 0 0 0 0 0 0 050060502 Accreditation 66 5,000 13,161 0 0 0 18,16150060506 Environmental Protection 0 0 0 0 0 0 050060602 Accreditation 15,000 15,450 18,391 0 0 0 33,84150060606 Environmental Protection 0 0 0 0 0 0 050060702 Accreditation 16,415 82,076 65,661 0 0 0 147,73750060706 Environmental Protection 50 250 200 0 0 0 450

DETAILED DATA
258
Mental Health, Office of PROJECTED APPROPRIATIONS AND DISBURSEMENTS BY PROGRAM
2008-2009 THROUGH 2012-2013 (thousands of dollars)
DISBURSEMENTS Estimated Total
2007-2008 2008-2009 2009-2010 2010-2011 2011-2012 50060802 Accreditation 0 9,375 46,875 37,500 0
2012-2013 2008-201393,7500
50060806 Environmental Protection 0 100 500 400 0 0 1,00050060902 Accreditation 0 0 4,500 22,500 18,000 0 45,00050060906 Environmental Protection 0 0 100 500 400 0 1,00050061002 Accreditation 0 0 0 4,500 22,500 18,000 45,00050061006 Environmental Protection 0 0 0 100 500 400 1,00050061102 Accreditation 0 0 0 0 4,500 22,500 27,00050061106 Environmental Protection 0 0 0 0 100 500 60050061202 Accreditation 0 0 0 0 0 4,500 4,50050061206 Environmental Protection 0 0 0 0 0 100 10050080008 Program Improvement or Change 1,200 0 0 0 0 0 050080108 Program Improvement or Change 7,000 0 0 0 0 0 050080208 Program Improvement or Change 2,500 0 0 0 0 0 050080308 Program Improvement or Change 0 0 0 0 0 0 050080408 Program Improvement or Change 0 0 0 0 0 0 050080508 Program Improvement or Change 0 0 0 0 0 0 050080608 Program Improvement or Change 35,000 550 6,000 0 0 0 6,55050080708 Program Improvement or Change 4,621 23,104 18,483 0 0 0 41,58750080808 Program Improvement or Change 0 3,295 16,476 13,181 0 0 32,95250080908 Program Improvement or Change 0 0 2,250 11,250 9,000 0 22,50050081008 Program Improvement or Change 0 0 0 2,250 11,250 9,000 22,50050081108 Program Improvement or Change 0 0 0 0 2,250 11,250 13,50050081208 Program Improvement or Change 0 0 0 0 0 2,250 2,25050160306 Environmental Protection 0 0 0 0 0 0 050380789 Minor Rehabilitation HD 4,000 0 0 0 0 0 050380989 Minor Rehabilitation HD 0 0 4,000 0 0 0 4,00050381089 Minor Rehabilitation HD 0 0 0 4,000 0 0 4,00050381189 Minor Rehabilitation HD 0 0 0 0 4,000 0 4,00050381289 Minor Rehabilitation HD 0 0 0 0 0 4,000 4,00050EP0006 Environmental Protection HD 0 0 0 0 0 0 050EP0106 Environmental Protection HD 0 0 0 0 0 0 050EP0206 Environmental Protection HD 0 0 0 0 0 0 050EP0306 Environmental Protection HD 0 0 0 0 0 0 050EP0406 Environmental Protection HD 0 0 0 0 0 0 050EP0506 Environmental Protection HD 3,000 0 0 0 0 0 050EP0606 Environmental Protection HD 4,300 0 0 0 0 0 050EP0706 Environmental Protection HD 4,005 2,002 2,002 0 0 0 4,00450EP0806 Environmental Protection HD 0 2,050 1,025 1,025 0 0 4,10050EP0906 Environmental Protection HD 0 0 2,505 1,253 1,252 0 5,01050EP1006 Environmental Protection HD 0 0 0 2,505 1,253 1,252 5,01050EP1106 Environmental Protection HD 0 0 0 0 2,505 1,253 3,75850EP1206 Environmental Protection HD 0 0 0 0 0 2,505 2,50550HS0501 Health and Safety HD 0 0 0 0 0 0 050HS0601 Health and Safety HD 0 0 0 0 0 0 050HS0701 Health and Safety HD 2,000 2,000 0 0 0 0 2,00050HS0801 Health and Safety HD 0 3,505 3,505 0 0 0 7,01050HS0901 Health and Safety HD 0 0 2,000 2,000 0 0 4,00050HS1001 Health and Safety HD 0 0 0 2,000 2,000 0 4,00050HS1101 Health and Safety HD 0 0 0 0 2,000 2,000 4,00050HS1201 Health and Safety HD 0 0 0 0 0 2,000 2,00050PF0503 Preservation of Facilities HD 0 0 0 0 0 0 050PF0603 Preservation of Facilities HD 7,000 0 0 0 0 0 050PF0703 Preservation of Facilities HD 6,900 6,900 0 0 0 0 6,90050PF0803 Preservation of Facilities HD 0 9,200 9,200 0 0 0 18,40050PF0903 Preservation of Facilities HD 0 0 8,400 8,400 0 0 16,80050PF1003 Preservation of Facilities HD 0 0 0 8,400 8,400 0 16,80050PF1103 Preservation of Facilities HD 0 0 0 0 8,400 8,400 16,80050PF1203 Preservation of Facilities HD 0 0 0 0 0 8,400 8,40050SL0603 Preservation for St. Lawrence PC 0 0 0 0 0 Subtotal 164,347 254,956 306,409 220,201 217,510 Non-Bondable Projects
0 0217,510 1,216,586
502907NB Non-Bondable Fallout 1,000 0 0 0 0 0 0502908NB Non-Bondable Fallout 0 1,000 0 0 0 0 1,000502909NB Non-Bondable Fallout 0 0 1,000 0 0 0 1,000502910NB Non Bondable Fallout 0 0 0 1,000 0 0 1,000502911NB Non-Bondable Fallout 0 0 0 0 1,000 0 1,000502912NB Non-Bondable Fallout 0 0 0 0 0 1,000 1,00050FO00NB Non-Bondable Fallout 0 0 0 0 0 Subtotal 1,000 1,000 1,000 1,000 1,000 Voluntary Facilities 50100189 Community MH Facilities 0 0 0 0 0 50100289 Community MH Facilities 0 0 0 0 0 50100389 Community MH Facilities 0 0 0 0 0 50100489 Community MH Facilities 0 0 0 0 0 50100589 Community MH Services 0 0 0 0 0 50100689 Community MH Facilities 0 0 0 0 0
0 01,000 5,000
000000
000000

DETAILED DATA
259
Mental Health, Office of PROJECTED APPROPRIATIONS AND DISBURSEMENTS BY PROGRAM
2008-2009 THROUGH 2012-2013 (thousands of dollars)
DISBURSEMENTS Estimated Total
2007-2008 2008-2009 2009-2010 2010-2011 2011-2012 2012-2013 2008-201350100789 Community MH Facilities 5,000 0 0 0 0 0 050100889 Community MH Facilities 0 5,000 0 0 0 0 5,00050100989 Community MH Facilities 0 0 5,000 0 0 0 5,00050101089 Community MH Facilities 0 0 0 5,000 0 0 5,00050101189 Community MH Facilities 0 0 0 0 5,000 0 5,00050101289 Community MH Facilities 0 0 0 0 0 5,000 5,00050109007 Community MH Facilities 2,062 0 0 0 0 0 050120750 Local Administration 555 0 0 0 0 0 050120850 Local Administration 0 555 0 0 0 0 55550120950 Local Administration 0 0 555 0 0 0 55550121050 Local Administration 0 0 0 555 0 0 55550121150 Local Administration 0 0 0 0 555 0 55550121250 Local Administration 0 0 0 0 0 555 55550139307 Supported Housing 1,978 0 0 0 0 0 050139807 Supported Hsg 0 0 0 0 0 0 050149307 Community Residences 1,770 0 0 0 0 0 050159307 Community MH Facilities 0 0 0 0 0 0 050230103 Community MH Facilities 0 0 0 0 0 0 050230203 Community MH Facilities 0 0 0 0 0 0 050230303 Community MH Facilities 0 0 0 0 0 0 050230403 Community MH Facilities 0 0 0 0 0 0 050230603 Community MH Facilities 0 10,000 0 0 0 0 10,00050230703 Community MH Facilities 9,060 11,305 15,006 16,881 21,881 20,000 85,07350230803 Community MH Facilities 0 5,000 0 0 0 0 5,00050230903 Community MH Facilities 0 0 5,000 0 0 0 5,00050231003 Community MH Facilities 0 0 0 5,000 0 0 5,00050231103 Community MH Facilities 0 0 0 0 5,000 0 5,00050231203 Community MH Facilities 0 0 0 0 0 5,000 5,00050239407 Reinvestment 0 0 0 0 0 0 050279807 Homeless Housing 3,570 0 0 0 0 0 050VY0307 Com Residential Housing 13,260 10,000 3,669 0 0 0 13,66950VY0507 Community Residential Housing 15,000 25,000 19,400 0 0 0 44,40050VY0607 Community MH Facilities (NYNY III) 5,000 14,000 39,000 45,000 40,000 40,000 178,00050VY0707 Community Residential Housing 0 7,000 27,000 38,000 56,000 57,881 185,88150VY0807 Community Residential Housing 0 0 0 0 0 0 050VY9907 Comm. Residential Housing 12,000 10,276 0 0 0 0 10,276 Subtotal 69,255 98,136 114,630 110,436 128,436 128,436 580,074 Total 241,947 367,009 439,756 349,354 364,663 364,663 1,885,445

DETAILED DATA
260
Mental Retardation and Developmental Disabilities, Office of PROJECTED APPROPRIATIONS AND DISBURSEMENTS BY PROGRAM
2008-2009 THROUGH 2012-2013 (thousands of dollars)
APPROPRIATIONS Reappro-
priations 2008-2009 2009-2010 2010-2011 2011-2012 Community Services Program 51A107C1 Capital Administration 0 0 0 0 0
2012-2013
0
Total2008-2013
051A108C1 Capital Administration 0 2,515 0 0 0 0 2,51551A109C1 Capital Administration 0 0 2,665 0 0 0 2,66551A110C1 Capital Administration 0 0 0 2,750 0 0 2,75051A111C1 Capital Administration 0 0 0 0 2,900 0 2,90051A112C1 Capital Administration 0 0 0 0 0 3,050 3,05051L10507 Leased Space 1,400 0 0 0 0 0 051L10607 Leased Space 830 0 0 0 0 0 051L10707 Leased Space 780 0 0 0 0 0 051L10807 Leased Space 0 2,000 0 0 0 0 2,00051L10907 Leased Space 0 0 1,600 0 0 0 1,60051L11007 Leased Space 0 0 0 1,800 0 0 1,80051L11107 Leased Space 0 0 0 0 1,900 0 1,90051L11207 Leased Space 0 0 0 0 0 2,100 2,10051M10603 Community Minor Maintenance 0 0 0 0 0 0 051M10703 Community Minor Maintenance 12,680 0 0 0 0 0 051M10803 Community Minor Maintenance 0 18,470 0 0 0 0 18,47051M10903 Community Minor Maintenance 0 0 19,380 0 0 0 19,38051M11003 Community Minor Maintenance 0 0 0 19,705 0 0 19,70551M11103 Community Minor Maintenance 0 0 0 0 20,635 0 20,63551M11203 Community Minor Maintenance 0 0 0 0 0 21,305 21,30551PR0303 Community Preservation 0 0 0 0 0 0 051PR0503 Community Preservation 310 0 0 0 0 0 051PR0603 Community Preservation 1,000 0 0 0 0 0 051PR0703 Community Preservation 1,000 0 0 0 0 0 051PR0803 Community Preservation 0 1,000 0 0 0 0 1,00051PR0903 Community Preservation 0 0 1,000 0 0 0 1,00051PR1003 Community Preservation 0 0 0 1,000 0 0 1,00051PR1103 Community Preservation 0 0 0 0 1,000 0 1,00051PR1203 Community Preservation 0 0 0 0 0 1,000 1,00051R10407 Community Development 1,000 0 0 0 0 0 051R10507 Community Development 1,250 0 0 0 0 0 051R10607 Community Development 18,880 0 0 0 0 0 051R10707 Community Development 22,200 0 0 0 0 0 051R10807 Community Development 0 24,575 0 0 0 0 24,57551R10907 Community Development 0 0 14,675 0 0 0 14,67551R11007 Community Development 0 0 0 21,325 0 0 21,32551R11107 Community Development 0 0 0 0 4,000 0 4,00051R11207 Community Development 0 0 0 0 0 4,000 4,00051R29907 100 NYScares Beds - Leg Add 700 0 0 0 0 Subtotal 62,030 48,560 39,320 46,580 30,435 Design and Construction Supervision 51F10630 DASNY Chargeback 0 0 0 0 0 51F10730 DASNY Chargeback 1,000 0 0 0 0 51F10830 DASNY Chargeback 0 7,280 0 0 0 51F10930 DASNY Chargeback 0 0 4,000 0 0 51F11030 DASNY Chargeback 0 0 0 4,000 0 51F11103 DASNY Chargeback 0 0 0 0 4,000 51F11230 DASNY Chargeback 0 0 0 0 0 51F20730 DASNY Chargeback 0 0 0 0 0 51F20830 DASNY Chargeback 0 5,180 0 0 0 51F20930 DASNY Chargeback 0 0 3,000 0 0 51F21030 DASNY Chargeback 0 0 0 3,000 0 51F21130 DASNY Chargeback 0 0 0 0 3,000 51F21230 DASNY Chargeback 0 0 0 0 0 51WC0630 Preparation of Plans 0 0 0 0 0 51WC0730 Worker’s Compensation 0 0 0 0 0 51WC0830 Worker’s Compensation 0 2,000 0 0 0 51WC0930 Worker’s Compensation 0 0 2,000 0 0 51WC1030 Worker’s Compensation 0 0 0 2,000 0 51WC1130 Worker’s Compensation 0 0 0 0 2,000 51WC1230 Preparation of Plans (Workers Comp. 0 0 0 0 0 Subtotal 1,000 14,460 9,000 9,000 9,000 Institutional Services Program 51BF0501 B. Fineson DC Renovation/Relocation 26,840 0 0 0 0 51BF0601 B.Fineson DC Renovation/Relocation 12,500 0 0 0 0 51BF0701 B. Fineson DC Renovation/Relocation 11,000 0 0 0 0 51BF0801 B. Fineson DC Renovation/Relocation 0 50,000 0 0 0 51BF0901 Health and Safety (Fineson) 0 0 39,000 0 0 51DC0003 DC Closure/Sale 0 0 0 0 0 51H10301 Health & Safety 0 0 0 0 0 51H10401 Health & Safety 1,170 0 0 0 0 51H10501 Health & Safety 6,050 0 0 0 0 51H10601 Health & Safety 3,320 0 0 0 0 51H10701 Health & Safety 7,325 0 0 0 0
0 031,455 196,350
000000
4,00000000
3,000000000
2,000
00
7,2804,0004,0004,0004,000
05,1803,0003,0003,0003,000
00
2,0002,0002,0002,0002,000
9,000 50,460
00000000000
000
50,00039,000
000000

DETAILED DATA
261
Mental Retardation and Developmental Disabilities, Office of PROJECTED APPROPRIATIONS AND DISBURSEMENTS BY PROGRAM
2008-2009 THROUGH 2012-2013 (thousands of dollars)
APPROPRIATIONS Reappro-
priations 2008-2009 2009-2010 2010-2011 2011-2012 2012-2013Total
2008-201351H10801 Health & Safety 0 6,400 0 0 0 0 6,40051H10901 Health & Safety 0 0 7,500 0 0 0 7,50051H11001 Inst. Health and Safety 0 0 0 7,600 0 0 7,60051H11101 Inst. Health and Safety 0 0 0 0 7,700 0 7,70051H11201 Inst. Health and Safety 0 0 0 0 0 7,800 7,80051H30001 Health & Safety 830 0 0 0 0 0 051H30101 Health & Safety 2,180 0 0 0 0 0 051H30201 Health & Safety 5,000 0 0 0 0 0 051H30301 Health & Safety 19,000 0 0 0 0 0 051H30401 Health & Safety 11,210 0 0 0 0 0 051H30601 Health & Safety 30,950 0 0 0 0 0 051H30701 Health & Safety 32,290 0 0 0 0 0 051H30801 Health & Safety 0 33,200 0 0 0 0 33,20051H30901 Health & Safety 0 0 34,150 0 0 0 34,15051H31001 Inst. Health and Safety 0 0 0 35,100 0 0 35,10051H31101 Inst. Health and Safety 0 0 0 0 36,855 0 36,85551H31201 Inst. Health and Safety 0 0 0 0 0 38,330 38,33051H39901 Health & Safety 3,610 0 0 0 0 0 051IB0101 IBR Rehab 6,010 0 0 0 0 0 051M20303 Former DC Maintenance 1,340 0 0 0 0 0 051M20403 Former DC Maintenance 1,350 0 0 0 0 0 051M20503 Former DC Maintenance 1,130 0 0 0 0 0 051M20603 Former DC Maintenance 1,470 0 0 0 0 0 051M20703 Former DC Maintenance 2,750 0 0 0 0 0 051M20803 Former DC Maintenance 0 1,400 0 0 0 0 1,40051M20903 Former DC Maintenance 0 0 4,100 0 0 0 4,10051M21003 Former DC Maintenance 0 0 0 4,500 0 0 4,50051M21103 Former DC Maintenance 0 0 0 0 5,000 0 5,00051M21203 Former DC Maintenance 0 0 0 0 0 5,400 5,40051P10203 Preservation 0 0 0 0 0 0 051P10303 Preservation 1,110 0 0 0 0 0 051P10403 Preservation 1,740 0 0 0 0 0 051P10503 Preservation 2,070 0 0 0 0 0 051P10603 Preservation 7,590 0 0 0 0 0 051P10703 Preservation 3,490 0 0 0 0 0 051P10803 Preservation 0 7,600 0 0 0 0 7,60051P10903 Preservation 0 0 4,420 0 0 0 4,42051P11003 Inst. Preservation 0 0 0 4,600 0 0 4,60051P11103 Inst. Preservation 0 0 0 0 4,835 0 4,83551P11203 Inst. Preservation 0 0 0 0 0 5,035 5,035 Subtotal 203,325 98,600 89,170 51,800 54,390 56,565 350,525Non-Bondable Projects 51FL07NB Non-Bondable 0 0 0 0 0 0 051FL08NB Non-Bondable 0 1,000 0 0 0 0 1,00051FL09NB Non-Bondable 0 0 1,000 0 0 0 1,00051FL10NB Non-Bondable 0 0 0 1,000 0 0 1,00051FL11NB Non-Bondable 0 0 0 0 1,000 0 1,00051FL12NB Non-Bondable 0 0 0 0 0 1,000 1,000 Subtotal 0 1,000 1,000 1,000 1,000 1,000 5,000Voluntary Facilities 51200603 Community Minor Maintenance 0 0 0 0 0 0 051200703 Community Minor Maintenance 16,000 0 0 0 0 0 051200803 Community Minor Maintenance 0 19,400 0 0 0 0 19,40051200903 Community Minor Maintenance 0 0 19,665 0 0 0 19,66551201003 Comm. Minor Maintenance 0 0 0 19,930 0 0 19,93051201103 Community Minor Maintenance 0 0 0 0 20,630 0 20,63051201203 Community Minor Maintenance 0 0 0 0 0 21,300 21,300513206H2 Bonded Community Development 5,920 0 0 0 0 0 0513207H2 Bonded Community Development 6,350 0 0 0 0 0 0513208H2 Bonded Community Development 0 6,400 0 0 0 0 6,400513209H2 Bonded Community Development 0 0 6,450 0 0 0 6,450513210H2 Bonded Comm. Dev. 0 0 0 6,710 0 0 6,710513211H2 Bonded Community Development 0 0 0 0 7,000 0 7,000513212H2 Bonded Community Development 0 0 0 0 0 7,280 7,28051B10607 Capital Community Development 0 0 0 0 0 0 051B10707 Capital Community Development 1,620 0 0 0 0 0 051B10807 Capital Community Development 0 4,000 0 0 0 0 4,00051B10907 Community Capital Development 0 0 4,375 0 0 0 4,37551B11007 Community Cap. Dev. 0 0 0 5,070 0 0 5,07051B11107 Community Capital Development 0 0 0 0 5,370 0 5,37051B11207 Community Cap. Development 0 0 0 0 0 5,740 5,740 Subtotal 29,890 29,800 30,490 31,710 33,000 34,320 159,320 Total 296,245 192,420 168,980 140,090 127,825
132,340 761,655

DETAILED DATA
262
Mental Retardation and Developmental Disabilities, Office of PROJECTED APPROPRIATIONS AND DISBURSEMENTS BY PROGRAM
2008-2009 THROUGH 2012-2013 (thousands of dollars)
DISBURSEMENTS Estimated Total
2007-2008 2008-2009 2009-2010 2010-2011 2011-2012 2012-2013 2008-2013Community Services Program 51A107C1 Capital Administration 2,425 0 0 0 0 0 051A108C1 Capital Administration 0 2,425 0 0 0 0 2,42551A109C1 Capital Administration 0 0 2,520 0 0 0 2,52051A110C1 Capital Administration 0 0 0 2,750 0 0 2,75051A111C1 Capital Administration 0 0 0 0 2,900 0 2,90051A112C1 Capital Administration 0 0 0 0 0 3,050 3,05051L10507 Leased Space 700 0 0 0 0 0 051L10607 Leased Space 0 0 0 0 0 0 051L10707 Leased Space 1,200 0 0 0 0 0 051L10807 Leased Space 0 1,300 0 0 0 0 1,30051L10907 Leased Space 0 0 1,500 0 0 0 1,50051L11007 Leased Space 0 0 0 1,800 0 0 1,80051L11107 Leased Space 0 0 0 0 1,900 0 1,90051L11207 Leased Space 0 0 0 0 0 2,000 2,00051M10603 Community Minor Maintenance 0 0 0 0 0 0 051M10703 Community Minor Maintenance 11,000 0 0 0 0 0 051M10803 Community Minor Maintenance 0 15,000 0 0 0 0 15,00051M10903 Community Minor Maintenance 0 0 12,210 0 0 0 12,21051M11003 Community Minor Maintenance 0 0 0 12,500 0 0 12,50051M11103 Community Minor Maintenance 0 0 0 0 13,000 0 13,00051M11203 Community Minor Maintenance 0 0 0 0 0 13,200 13,20051PR0303 Community Preservation 0 0 0 0 0 0 051PR0503 Community Preservation 0 0 0 0 0 0 051PR0603 Community Preservation 0 0 0 0 0 0 051PR0703 Community Preservation 500 0 0 0 0 0 051PR0803 Community Preservation 0 500 0 0 0 0 50051PR0903 Community Preservation 0 0 500 0 0 0 50051PR1003 Community Preservation 0 0 0 500 0 0 50051PR1103 Community Preservation 0 0 0 0 500 0 50051PR1203 Community Preservation 0 0 0 0 0 500 50051R10407 Community Development 0 0 0 0 0 0 051R10507 Community Development 0 0 0 0 0 0 051R10607 Community Development 5,000 4,000 0 0 0 0 4,00051R10707 Community Development 6,000 5,000 4,000 0 0 0 9,00051R10807 Community Development 0 2,575 7,000 6,000 0 0 15,57551R10907 Community Development 0 0 1,675 6,000 3,000 0 10,67551R11007 Community Development 0 0 0 2,325 8,000 5,000 15,32551R11107 Community Development 0 0 0 0 0 0 051R11207 Community Development 0 0 0 0 0 0 051R29907 100 NYScares Beds - Leg Add 0 0 0 0 0 Subtotal 26,825 30,800 29,405 31,875 29,300 Design and Construction Supervision 51F10630 DASNY Chargeback 0 0 0 0 0 51F10730 DASNY Chargeback 4,000 0 0 0 0 51F10830 DASNY Chargeback 0 6,555 725 0 0 51F10930 DASNY Chargeback 0 0 4,000 0 0 51F11030 DASNY Chargeback 0 0 0 4,000 0 51F11103 DASNY Chargeback 0 0 0 0 4,000 51F11230 DASNY Chargeback 0 0 0 0 0 51F20730 DASNY Chargeback 3,000 0 0 0 0 51F20830 DASNY Chargeback 0 5,180 0 0 0 51F20930 DASNY Chargeback 0 0 3,000 0 0 51F21030 DASNY Chargeback 0 0 0 3,000 0 51F21130 DASNY Chargeback 0 0 0 0 3,000 51F21230 DASNY Chargeback 0 0 0 0 0 51WC0630 Preparation of Plans 0 0 0 0 0 51WC0730 Worker’s Compensation 0 0 0 0 0 51WC0830 Worker’s Compensation 0 0 0 0 0 51WC0930 Worker’s Compensation 0 0 0 0 0 51WC1030 Worker’s Compensation 0 0 0 0 0 51WC1130 Worker’s Compensation 0 0 0 0 0 51WC1230 Preparation of Plans (Workers Comp. 0 0 0 0 0 Subtotal 7,000 11,735 7,725 7,000 7,000 Institutional Services Program 51BF0501 B. Fineson DC Renovation/Relocation 21,000 2,000 0 0 0 51BF0601 B.Fineson DC Renovation/Relocation 5,000 5,000 5,000 0 0 51BF0701 B. Fineson DC Renovation/Relocation 5,000 6,000 0 0 0 51BF0801 B. Fineson DC Renovation/Relocation 0 25,000 25,000 0 0 51BF0901 Health and Safety (Fineson) 0 0 20,000 19,000 0 51DC0003 DC Closure/Sale 0 0 0 0 0 51H10301 Health & Safety 596 0 0 0 0 51H10401 Health & Safety 0 0 0 0 0 51H10501 Health & Safety 1,150 1,000 0 0 0 51H10601 Health & Safety 1,292 500 500 0 0 51H10701 Health & Safety 869 2,000 1,500 0 0
0 023,750 145,130
000000
4,00000000
3,0000000000
00
7,2804,0004,0004,0004,000
05,1803,0003,0003,0003,000
0000000
7,000 40,460
00000000000
2,00010,000
6,00050,00039,000
000
1,0001,0003,500

DETAILED DATA
263
Mental Retardation and Developmental Disabilities, Office of PROJECTED APPROPRIATIONS AND DISBURSEMENTS BY PROGRAM
2008-2009 THROUGH 2012-2013 (thousands of dollars)
DISBURSEMENTS Estimated Total
2007-2008 2008-2009 2009-2010 2010-2011 2011-2012 51H10801 Health & Safety 0 1,638 1,500 0 0
2012-20130
2008-20133,138
51H10901 Health & Safety 0 0 400 0 0 0 40051H11001 Inst. Health and Safety 0 0 0 3,600 0 0 3,60051H11101 Inst. Health and Safety 0 0 0 0 3,800 0 3,80051H11201 Inst. Health and Safety 0 0 0 0 0 3,900 3,90051H30001 Health & Safety 0 0 0 0 0 0 051H30101 Health & Safety 0 0 0 0 0 0 051H30201 Health & Safety 0 0 0 0 0 0 051H30301 Health & Safety 0 0 0 0 0 0 051H30401 Health & Safety 0 0 0 0 0 0 051H30601 Health & Safety 0 0 0 0 0 0 051H30701 Health & Safety 18,584 0 0 0 0 0 051H30801 Health & Safety 0 19,100 0 0 0 0 19,10051H30901 Health & Safety 0 0 19,300 0 0 0 19,30051H31001 Inst. Health and Safety 0 0 0 19,500 0 0 19,50051H31101 Inst. Health and Safety 0 0 0 0 19,700 0 19,70051H31201 Inst. Health and Safety 0 0 0 0 0 19,800 19,80051H39901 Health & Safety 0 0 0 0 0 0 051IB0101 IBR Rehab 0 0 0 0 0 0 051M20303 Former DC Maintenance 0 0 0 0 0 0 051M20403 Former DC Maintenance 0 0 0 0 0 0 051M20503 Former DC Maintenance 1,000 323 0 0 0 0 32351M20603 Former DC Maintenance 800 250 0 0 0 0 25051M20703 Former DC Maintenance 250 1,250 1,800 0 0 0 3,05051M20803 Former DC Maintenance 0 1,400 0 0 0 0 1,40051M20903 Former DC Maintenance 0 0 410 0 0 0 41051M21003 Former DC Maintenance 0 0 0 4,000 0 0 4,00051M21103 Former DC Maintenance 0 0 0 0 4,500 0 4,50051M21203 Former DC Maintenance 0 0 0 0 0 4,750 4,75051P10203 Preservation 0 0 0 0 0 0 051P10303 Preservation 1,287 126 0 0 0 0 12651P10403 Preservation 0 0 0 0 0 0 051P10503 Preservation 2,520 0 0 0 0 0 051P10603 Preservation 1,266 384 1,000 0 0 0 1,38451P10703 Preservation 1,130 1,339 1,500 0 0 0 2,83951P10803 Preservation 0 2,180 3,100 0 0 0 5,28051P10903 Preservation 0 0 1,910 2,000 0 0 3,91051P11003 Inst. Preservation 0 0 0 4,000 0 0 4,00051P11103 Inst. Preservation 0 0 0 0 4,200 0 4,20051P11203 Inst. Preservation 0 0 0 0 0 Subtotal 61,744 69,490 82,920 52,100 32,200 Non-Bondable Projects
4,30032,750
4,300269,460
51FL07NB Non-Bondable 0 0 0 0 0 0 051FL08NB Non-Bondable 0 0 0 0 0 0 051FL09NB Non-Bondable 0 0 0 0 0 0 051FL10NB Non-Bondable 0 0 0 0 0 0 051FL11NB Non-Bondable 0 0 0 0 0 0 051FL12NB Non-Bondable 0 0 0 0 0 Subtotal 0 0 0 0 0 Voluntary Facilities 51200603 Community Minor Maintenance 0 0 0 0 0
00
0
00
051200703 Community Minor Maintenance 12,395 0 0 0 0 0 051200803 Community Minor Maintenance 0 14,610 0 0 0 0 14,61051200903 Community Minor Maintenance 0 0 12,550 0 0 0 12,55051201003 Comm. Minor Maintenance 0 0 0 12,700 0 0 12,70051201103 Community Minor Maintenance 0 0 0 0 13,000 0 13,00051201203 Community Minor Maintenance 0 0 0 0 0 13,200 13,200513206H2 Bonded Community Development 0 0 0 0 0 0 0513207H2 Bonded Community Development 2,710 0 0 0 0 0 0513208H2 Bonded Community Development 0 2,800 0 0 0 0 2,800513209H2 Bonded Community Development 0 0 2,900 0 0 0 2,900513210H2 Bonded Comm. Dev. 0 0 0 3,000 0 0 3,000513211H2 Bonded Community Development 0 0 0 0 3,200 0 3,200513212H2 Bonded Community Development 0 0 0 0 0 3,300 3,30051B10607 Capital Community Development 0 0 0 0 0 0 051B10707 Capital Community Development 3,745 0 0 0 0 0 051B10807 Capital Community Development 0 3,900 0 0 0 0 3,90051B10907 Community Capital Development 0 0 4,200 0 0 0 4,20051B11007 Community Cap. Dev. 0 0 0 4,500 0 0 4,50051B11107 Community Capital Development 0 0 0 0 4,800 0 4,80051B11207 Community Cap. Development 0 0 0 0 0 Subtotal 18,850 21,310 19,650 20,200 21,000 Total 114,419 133,335 139,700 111,175 89,500
5,00021,50085,000
5,000103,660558,710

DETAILED DATA
264
Alcoholism and Substance Abuse Services, Office of PROJECTED APPROPRIATIONS AND DISBURSEMENTS BY PROGRAM
2008-2009 THROUGH 2012-2013 (thousands of dollars)
APPROPRIATIONS Reappro-
priations 2008-2009 2009-2010 2010-2011 2011-2012 Administration
2012-2013Total
2008-2013
53A10750 Administration 840 0 0 0 0 0 053A10850 Administration 0 1,230 0 0 0 0 1,23053A10950 Administration 0 0 1,277 0 0 0 1,27753A11050 Administration 0 0 0 1,328 0 0 1,32853A11150 Administration 0 0 0 0 1,394 0 1,39453A11250 Admin 0 0 0 0 0 Subtotal 840 1,230 1,277 1,328 1,394 Community Alcoholism and Substance Abuse
Facilities
1,464 1,4641,464 6,693
53010607 108 Adolescent and Women/Children B 24,900 0 0 0 0 0 053010707 Long Island Residential Expansion 26,600 0 0 0 0 0 053020707 Residential Capacity Expansion-Vete 25,400 0 0 0 0 0 053030003 Preservation 6,111 0 0 0 0 0 053030089 Minor Rehabilitation 0 0 0 0 0 0 053030103 Preservation 4,698 0 0 0 0 0 053030189 Minor Rehabilitation 211 0 0 0 0 0 053030203 Preservation 0 0 0 0 0 0 053030289 Minor Rehabilitation 0 0 0 0 0 0 053030303 Preservation 3,696 0 0 0 0 0 053030389 Minor Rehabilitation 2,965 0 0 0 0 0 053030403 Pres of Facilities 4,901 0 0 0 0 0 053030489 Minor Rehab Purpose 5,310 0 0 0 0 0 053030503 Preservation 9,243 0 0 0 0 0 053030589 Minor Rehab 5,310 0 0 0 0 0 053030603 Pres Of Facilities 16,339 0 0 0 0 0 053030689 Minor Rehab 4,810 0 0 0 0 0 053030703 Pres Of Facilities 27,423 0 0 0 0 0 053030789 Minor Rehab 4,810 0 0 0 0 0 053030803 Pres of Facilities 0 42,273 0 0 0 0 42,27353030889 Minor Rehab 0 4,810 0 0 0 0 4,81053030903 Pres of Facilities 0 0 42,273 0 0 0 42,27353030989 Minor Rehab 0 0 4,810 0 0 0 4,81053031003 Preservation of Facilities 0 0 0 42,273 0 0 42,27353031089 Minor Rehab 0 0 0 4,810 0 0 4,81053031103 Preservation of Facilities 0 0 0 0 42,273 0 42,27353031189 Minor Rehab 0 0 0 0 4,810 0 4,81053031203 Pres of Facilities 0 0 0 0 0 42,273 42,27353031289 Minor rehab 0 0 0 0 0 4,810 4,81053039903 Preservation 0 0 0 0 0 0 053AA0107 Community Bed Development 0 0 0 0 0 0 053AA0207 Community Bed Development 0 0 0 0 0 0 053AA0307 Community Bed Development 5,039 0 0 0 0 0 053AA0407 Community Bed Development 10,983 0 0 0 0 0 053AA0507 Community Bed Development 12,986 0 0 0 0 0 053AA0607 New Facilities 16,836 0 0 0 0 0 053AA0707 New Facilities 24,073 0 0 0 0 0 053AA0807 New Facilities 0 66,273 0 0 0 0 66,27353AA0907 New Facilities 0 0 42,273 0 0 0 42,27353AA1007 New Facilities 0 0 0 42,273 0 0 42,27353AA1107 New Facilities 0 0 0 0 42,273 0 42,27353AA1207 New Facilities 0 0 0 0 0 Subtotal 242,644 113,356 89,356 89,356 89,356 Design and Construction Supervision 53060630 Prep Of Plans 0 0 0 0 0 53060730 Preparation of Plans 500 0 0 0 0 53060830 Prep of Plans 0 500 0 0 0 53060930 Prep of Plans 0 0 500 0 0 53061030 Preparation of Plans 0 0 0 500 0 53061130 Preparation of Plans 0 0 0 0 500 53061230 Prep of Plans 0 0 0 0 0 53A60530 Preparation of Plans 0 0 0 0 0 53A60630 Prep Of Plans 403 0 0 0 0 53A60730 Prep of Plans 2,000 0 0 0 0 53A60830 Design and Construction 0 2,000 0 0 0 53A60930 Prep of Plans 0 0 3,000 0 0 53A61030 Preparation of Plans 0 0 0 3,000 0 53A61130 Preparation of Plans 0 0 0 0 3,000 53A61230 Prep of Plans 0 0 0 0 0 53WC0730 Preparation of Plans 2,000 0 0 0 0 Subtotal 4,903 2,500 3,500 3,500 3,500 Institutional Services Program 53019807 New Facilities 1,638 0 0 0 0
42,273 42,27389,356 470,780
000000
5000000000
3,0000
00
500500500500500
000
2,0003,0003,0003,0003,000
03,500 16,500
0 053A20403 Preservation 899 0 0 0 0 0 053A20503 Preservation 2,607 0 0 0 0 0 053A20603 Pres Of Facilities 7,800 0 0 0 0 0 0

DETAILED DATA
265
Alcoholism and Substance Abuse Services, Office of PROJECTED APPROPRIATIONS AND DISBURSEMENTS BY PROGRAM
2008-2009 THROUGH 2012-2013 (thousands of dollars)
APPROPRIATIONS
53A20703 Pres of Facilities
Reappro- priations 2008-2009 2009-2010 2010-2011 2011-2012 2012-2013
Total2008-2013
1,000 0 0 0 0 0 053A20803 Institutional Services 0 3,000 0 0 0 0 3,00053A20903 Pres of Facilities 0 0 3,000 0 0 0 3,00053A21003 Preservation of Facilities 0 0 0 3,000 0 0 3,00053A21103 Preservation of Facilities 0 0 0 0 3,000 0 3,00053A21203 Pres of Facilities 0 0 0 0 0 3,000 3,00053HD0189 Minor Rehab 38 0 0 0 0 0 053HD0289 Minor Rehab 154 0 0 0 0 0 053HD0389 Minor Rehab 126 0 0 0 0 0 053HD0489 Minor Rehab 421 0 0 0 0 0 053HD0589 Minor Rehabilitation 324 0 0 0 0 0 053HD0689 Minor Rehabilitation 500 0 0 0 0 0 053HD0789 Minor Rehab 500 0 0 0 0 0 053HD0889 Minor Rehab 0 500 0 0 0 0 50053HD0989 Minor Rehab 0 0 1,000 0 0 0 1,00053HD1089 Minor Rehab 0 0 0 1,000 0 0 1,00053HD1189 Minor Rehab 0 0 0 0 1,000 0 1,00053HD1289 Minor Rehab 690 0 0 0 0 1,000 1,00053HD9989 Minor Rehab 409 0 0 0 0 0 053LL9903 Claims & Litigation 0 0 0 0 0 0 053PR0003 Preservation 786 0 0 0 0 0 053PR0103 Preservation 1,339 0 0 0 0 0 053PR0203 Preservation 1,971 0 0 0 0 0 053PR0303 Preservation Subtotal Non-Bondable Projects 53NB07NB Non-Bondable
1,000 0 0 0 0 0 020,822 3,500 4,000 4,000 4,000 4,000 19,500
750 0 0 0 0 0 0
53NB08NB Non-Bondable 0 750 0 0 0 0 75053NB09NB Non-Bondable 0 0 750 0 0 0 75053NB10NB Non-Bondable 0 0 0 750 0 0 75053NB11NB Non-Bondable 0 0 0 0 750 0 75053NB12NB Non-Bondable Subtotal Total
0 0 0 0 0 750 750750 750 750 750 750 750 3,750
269,959 121,336 98,883 98,934 99,000 99,070 517,223

DETAILED DATA
266
Alcoholism and Substance Abuse Services, Office of PROJECTED APPROPRIATIONS AND DISBURSEMENTS BY PROGRAM
2008-2009 THROUGH 2012-2013 (thousands of dollars)
DISBURSEMENTS Estimated Total
2007-2008 2008-2009 2009-2010 2010-2011 2011-2012 2012-2013 2008-2013Administration 53A10750 Administration 1,200 0 0 0 0 0 053A10850 Administration 0 1,230 0 0 0 0 1,23053A10950 Administration 0 0 1,277 0 0 0 1,27753A11050 Administration 0 0 0 1,328 0 0 1,32853A11150 Administration 0 0 0 0 1,394 0 1,39453A11250 Admin 0 0 0 0 0 Subtotal 1,200 1,230 1,277 1,328 1,394 Community Alcoholism and Substance Abuse
Facilities
1,464 1,4641,464 6,693
53010607 108 Adolescent and Women/Children B 2,000 9,000 9,000 4,900 0 0 22,90053010707 Long Island Residential Expansion 1,600 1,600 6,800 3,000 7,500 3,263 22,16353020707 Residential Capacity Expansion-Vete 3,079 4,119 4,498 4,798 2,497 5,000 20,91253030003 Preservation 4,300 1,078 0 0 0 0 1,07853030089 Minor Rehabilitation 0 0 0 0 0 0 053030103 Preservation 567 0 0 0 0 0 053030189 Minor Rehabilitation 0 0 0 0 0 0 053030203 Preservation 1,052 0 0 0 0 0 053030289 Minor Rehabilitation 364 0 0 0 0 0 053030303 Preservation 1,361 1,232 1,207 0 0 0 2,43953030389 Minor Rehabilitation 2,950 15 0 0 0 0 1553030403 Pres of Facilities 1,270 2,000 5,000 631 0 0 7,63153030489 Minor Rehab Purpose 500 3,655 0 400 706 0 4,76153030503 Preservation 4,544 5,452 0 0 0 0 5,45253030589 Minor Rehab 0 5,150 144 0 0 0 5,29453030603 Pres Of Facilities 1,200 1,700 4,400 5,400 4,292 0 15,79253030689 Minor Rehab 200 0 4,604 0 0 0 4,60453030703 Pres Of Facilities 3,293 7,500 15,000 1,430 200 0 24,13053030789 Minor Rehab 0 1,162 0 82 481 3,002 4,72753030803 Pres of Facilities 0 10,593 10,593 13,823 7,264 0 42,27353030889 Minor Rehab 0 200 1,500 1,750 1,360 0 4,81053030903 Pres of Facilities 0 0 14,373 13,950 13,950 0 42,27353030989 Minor Rehab 0 0 1,411 817 2,550 0 4,77853031003 Preservation of Facilities 0 0 0 14,272 19,680 8,000 41,95253031089 Minor Rehab 0 0 0 2,260 2,550 0 4,81053031103 Preservation of Facilities 0 0 0 0 14,272 28,000 42,27253031189 Minor Rehab 0 0 0 0 1,100 1,737 2,83753031203 Pres of Facilities 0 0 0 0 0 6,000 6,00053031289 Minor rehab 0 0 0 0 0 4,263 4,26353039903 Preservation 288 0 0 0 0 0 053AA0107 Community Bed Development 500 509 0 0 0 0 50953AA0207 Community Bed Development 143 0 0 0 0 0 053AA0307 Community Bed Development 3,038 1,280 735 0 0 0 2,01553AA0407 Community Bed Development 3,681 4,555 2,747 0 0 0 7,30253AA0507 Community Bed Development 1,413 6,238 5,474 0 0 0 11,71253AA0607 New Facilities 1,662 4,547 4,207 3,207 3,207 0 15,16853AA0707 New Facilities 3,493 7,500 15,000 1,430 0 0 23,93053AA0807 New Facilities 0 11,593 21,716 14,805 14,159 4,000 66,27353AA0907 New Facilities 0 0 14,373 13,950 13,950 0 42,27353AA1007 New Facilities 0 0 0 14,272 13,950 14,000 42,22253AA1107 New Facilities 0 0 0 0 14,272 6,755 21,02753AA1207 New Facilities 0 0 0 0 0 Subtotal 41,770 90,678 142,782 115,177 137,940 Design and Construction Supervision 53060630 Prep Of Plans 500 0 0 0 0 53060730 Preparation of Plans 0 500 0 0 0 53060830 Prep of Plans 0 0 500 0 0 53060930 Prep of Plans 0 0 0 500 0 53061030 Preparation of Plans 0 0 0 0 500 53061130 Preparation of Plans 0 0 0 0 0 53061230 Prep of Plans 0 0 0 0 0 53A60530 Preparation of Plans 0 0 0 0 0 53A60630 Prep Of Plans 1,398 0 0 0 0 53A60730 Prep of Plans 500 957 106 400 0 53A60830 Design and Construction 0 0 1,000 1,000 0 53A60930 Prep of Plans 0 0 1,500 1,500 0 53A61030 Preparation of Plans 0 0 0 1,500 1,500 53A61130 Preparation of Plans 0 0 0 0 1,500 53A61230 Prep of Plans 0 0 0 0 0 53WC0730 Preparation of Plans 1,017 82 0 850 0 Subtotal 3,415 1,539 3,106 5,750 3,500 Institutional Services Program 53019807 New Facilities 0 0 0 2,609 0
40,000 40,000124,020 610,597
000000
500000000
1,5001,675
0
0500500500500
0500
00
1,4632,0003,0003,0003,0001,675
9323,675 17,570
0 2,60953A20403 Preservation 0 1,000 0 0 0 0 1,00053A20503 Preservation 0 1,500 1,200 0 0 0 2,70053A20603 Pres Of Facilities 0 2,316 4,697 787 0 0 7,800
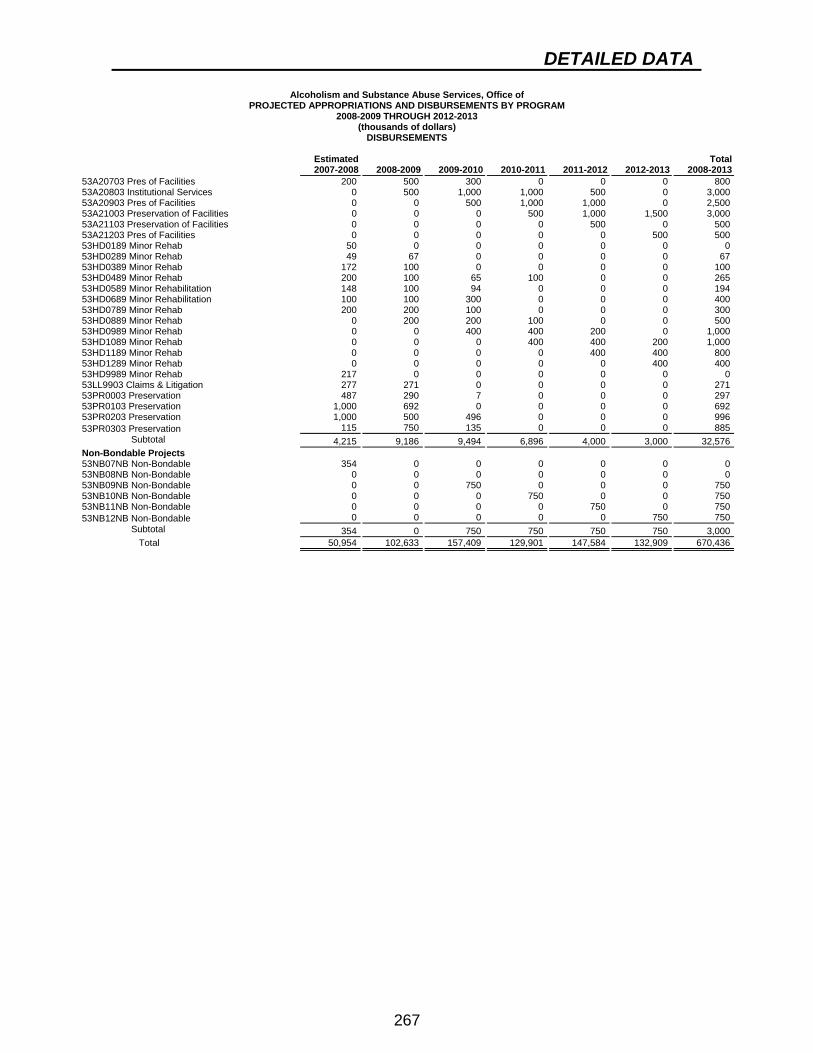
DETAILED DATA
267
Alcoholism and Substance Abuse Services, Office of PROJECTED APPROPRIATIONS AND DISBURSEMENTS BY PROGRAM
2008-2009 THROUGH 2012-2013 (thousands of dollars)
DISBURSEMENTS Estimated Total
53A20703 Pres of Facilities 2007-2008 2008-2009 2009-2010 2010-2011 2011-2012 2012-2013 2008-2013
200 500 300 0 0 0 80053A20803 Institutional Services 0 500 1,000 1,000 500 0 3,00053A20903 Pres of Facilities 0 0 500 1,000 1,000 0 2,50053A21003 Preservation of Facilities 0 0 0 500 1,000 1,500 3,00053A21103 Preservation of Facilities 0 0 0 0 500 0 50053A21203 Pres of Facilities 0 0 0 0 0 500 50053HD0189 Minor Rehab 50 0 0 0 0 0 053HD0289 Minor Rehab 49 67 0 0 0 0 6753HD0389 Minor Rehab 172 100 0 0 0 0 10053HD0489 Minor Rehab 200 100 65 100 0 0 26553HD0589 Minor Rehabilitation 148 100 94 0 0 0 19453HD0689 Minor Rehabilitation 100 100 300 0 0 0 40053HD0789 Minor Rehab 200 200 100 0 0 0 30053HD0889 Minor Rehab 0 200 200 100 0 0 50053HD0989 Minor Rehab 0 0 400 400 200 0 1,00053HD1089 Minor Rehab 0 0 0 400 400 200 1,00053HD1189 Minor Rehab 0 0 0 0 400 400 80053HD1289 Minor Rehab 0 0 0 0 0 400 40053HD9989 Minor Rehab 217 0 0 0 0 0 053LL9903 Claims & Litigation 277 271 0 0 0 0 27153PR0003 Preservation 487 290 7 0 0 0 29753PR0103 Preservation 1,000 692 0 0 0 0 69253PR0203 Preservation 1,000 500 496 0 0 0 99653PR0303 Preservation Subtotal Non-Bondable Projects 53NB07NB Non-Bondable
115 750 135 0 0 0 8854,215 9,186 9,494 6,896 4,000 3,000 32,576
354 0 0 0 0 0 0
53NB08NB Non-Bondable 0 0 0 0 0 0 053NB09NB Non-Bondable 0 0 750 0 0 0 75053NB10NB Non-Bondable 0 0 0 750 0 0 75053NB11NB Non-Bondable 0 0 0 0 750 0 75053NB12NB Non-Bondable Subtotal Total
0 0 0 0 0 750 750354 0 750 750 750 750 3,000
50,954 102,633 157,409 129,901 147,584 132,909 670,436

DETAILED DATA
268
General Services, Office of PROJECTED APPROPRIATIONS AND DISBURSEMENTS BY PROGRAM
2008-2009 THROUGH 2012-2013 (thousands of dollars)
APPROPRIATIONS Reappro-
priations 2008-2009 2009-2010 2010-2011 2011-2012 Design and Construction Supervision 05010530 Various D&C Projects 0 0 0 0 0
2012-2013
0
Total2008-2013
005011230 D&C services for various projects 0 0 0 0 0 12,600 12,60005020630 D&C for various projects 5,040 0 0 0 0 0 005021130 D & C for various projects 0 0 0 0 12,600 0 12,60005050330 D&C For Various Projects 0 0 0 0 0 0 005050430 D&C for Various Projects 0 0 0 0 0 0 005060730 D&C services for various projects 12,600 0 0 0 0 0 005060830 D&C for various projects 0 12,600 0 0 0 0 12,60005060930 D&C for various projects 0 0 12,600 0 0 0 12,60005061030 D&C for various projects 0 0 0 12,600 0 Subtotal 17,640 12,600 12,600 12,600 12,600 Maintenance and Improvement of Real Property
Facilities
0 12,60012,600 63,000
05020503 Preservation of Various Facilities 20,719 0 0 0 0 0 005021203 Preserve Facilites @ Various sites 0 0 0 0 0 47,400 47,40005030603 Capitol Repairs 26,000 0 0 0 0 0 005031203 Empire State Plaza reconstruct & re 0 0 0 0 0 10,000 10,00005040401 Health & Safety @ Various Sites 0 0 0 0 0 0 005040503 Capitol Repairs 3,853 0 0 0 0 0 005050303 Capitol Repairs 0 0 0 0 0 0 005060601 Health & Safety @ various sites 10,700 0 0 0 0 0 005060603 Preservation of various facilities 5,840 0 0 0 0 0 005060605 Energy conservation projects 0 0 0 0 0 0 005060609 Harriman Campus demolition & site p 5,985 0 0 0 0 0 005060701 Various Health & Safety projects 10,700 0 0 0 0 0 005060703 Preservation of various facilities 20,000 0 0 0 0 0 005060705 Energy conservation projects 2,446 0 0 0 0 0 005060801 Various Health & Safety projects 0 10,700 0 0 0 0 10,70005060803 Preservation of various facilities 0 20,000 0 0 0 0 20,00005060805 Energy conservation projects 0 3,000 0 0 0 0 3,000050608PM Prev Maintenance @ various sites 0 8,700 0 0 0 0 8,70005060901 Various Health & Safety projects 0 0 10,700 0 0 0 10,70005060903 Preservation of various facilities 0 0 20,000 0 0 0 20,00005060905 Energy conservation projects 0 0 3,000 0 0 0 3,000050609PM Prev maintenance @ various sites 0 0 8,700 0 0 0 8,70005061001 Various Health & Safety projects 0 0 0 10,700 0 0 10,70005061003 Preservation of various facilities 0 0 0 20,000 0 0 20,00005061005 Energy conservation projects 0 0 0 3,000 0 0 3,000050610PM Prev Maintenance @ various sites 0 0 0 8,700 0 0 8,70005061101 Health & Safety at various sits 0 0 0 0 10,700 0 10,70005061103 Preservation of various facilities 0 0 0 0 20,000 0 20,00005061105 Energy conservation projects 0 0 0 0 3,000 0 3,000050611PM Preventative Maintenance at various 0 0 0 0 8,700 0 8,70005070501 Health & Safety existing facilities 22,070 0 0 0 0 0 0050907PM Prev Maintenance @ Various Sites 4,707 0 0 0 0 0 005210301 Healt & Safety @ Various Sites 0 0 0 0 0 0 005220303 Preserve Facit @ Various Sites 30,000 0 0 0 0 0 005430403 Preserv Facil @ Various Sites 0 0 0 0 0 0 0056606PM Preventative Maintenance @ Various 0 0 0 0 0 0 005730303 Pres. Of Facil. @ Various Sites 0 0 0 0 0 0 005880203 Preserv Facil @ Various Sites 0 0 0 0 0 0 005AA0607 State facilities 11,000 0 0 0 0 0 005AA0707 New Facilities 10,000 0 0 0 0 0 005AA0807 New Facilities 0 10,000 0 0 0 0 10,00005AA0907 New Facilities 0 0 10,000 0 0 0 10,00005AA1007 New Facilities 0 0 0 10,000 0 0 10,00005AA1107 New Facilities 0 0 0 0 10,000 0 10,00005AA1207 NewFacility 0 0 0 0 0 10,000 10,00005BL0603 BSOB parking lot rehab 5,409 0 0 0 0 0 005BP0603 BSOB Parking lot rehab 5,882 0 0 0 0 0 005CR0703 State Capitol Bldg rehab & repair 5,000 0 0 0 0 0 005CR0803 State Capitol bldg rehab & repairs 0 5,000 0 0 0 0 5,00005CR0903 State Capitol Bldg rehab & repairs 0 0 5,000 0 0 0 5,00005CR1003 State Capitol Bldg rehab & repairs 0 0 0 5,000 0 0 5,00005CR1103 State Capitol Bldg rehab & repairs 0 0 0 0 5,000 0 5,00005LA0703 LOB Hearing Room A Rehab 1,050 0 0 0 0 0 005LB0703 LOB Hearing Room B Rehab 1,000 0 0 0 0 0 005LC0703 LOB Hearing Room C Rehab 300 0 0 0 0 0 005LL0603 LOB Meeting Room Rehab 1,645 0 0 0 0 0 005NR0603 Empire State Plaza reconstruct & re 19,368 0 0 0 0 0 005NR0703 Empire State Plaza reconstruct & re 10,000 0 0 0 0 0 005NR0803 Empire State Plaza reconstruct & re 0 10,000 0 0 0 0 10,000
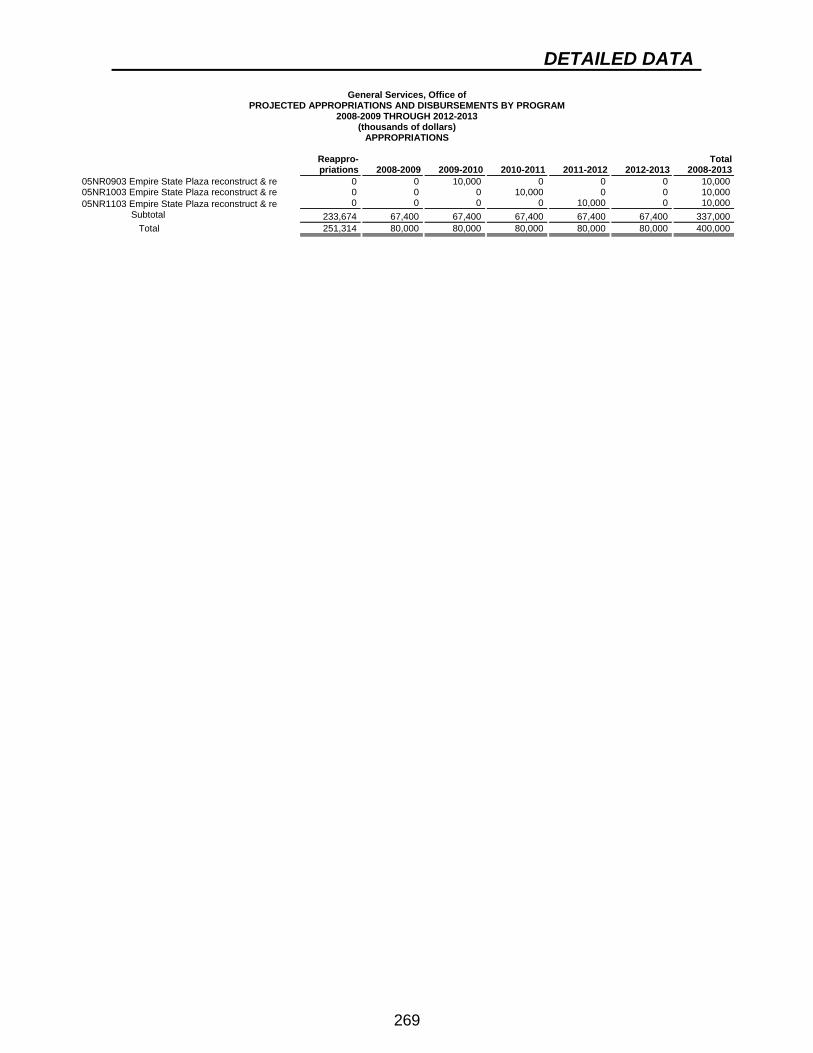
DETAILED DATA
269
General Services, Office of PROJECTED APPROPRIATIONS AND DISBURSEMENTS BY PROGRAM
2008-2009 THROUGH 2012-2013 (thousands of dollars)
APPROPRIATIONS Reappro-
priations 2008-2009 2009-2010 2010-2011 2011-2012 05NR0903 Empire State Plaza reconstruct & re 0 0 10,000 0 0
2012-20130
Total2008-2013
10,00005NR1003 Empire State Plaza reconstruct & re 0 0 0 10,000 0 0 10,00005NR1103 Empire State Plaza reconstruct & re 0 0 0 0 10,000 Subtotal 233,674 67,400 67,400 67,400 67,400 Total 251,314 80,000 80,000 80,000 80,000
067,40080,000
10,000337,000400,000

DETAILED DATA
270
General Services, Office of PROJECTED APPROPRIATIONS AND DISBURSEMENTS BY PROGRAM
2008-2009 THROUGH 2012-2013 (thousands of dollars)
DISBURSEMENTS Estimated
2007-2008 2008-2009 2009-2010 2010-2011 2011-2012 Design and Construction Supervision 05010530 Various D&C Projects 4,000 1,197 0 0 0 05011230 D&C services for various projects 0 0 0 0 0 05020630 D&C for various projects 5,000 4,398 0 0 0 05021130 D & C for various projects 0 0 0 0 0 05050330 D&C For Various Projects 1,000 0 0 0 0 05050430 D&C for Various Projects 700 233 0 0 0 05060730 D&C services for various projects 0 4,100 8,500 0 0 05060830 D&C for various projects 0 0 2,500 7,500 2,500 05060930 D&C for various projects 0 0 0 3,500 5,400 05061030 D&C for various projects 0 0 0 0 3,100 Subtotal 10,700 9,928 11,000 11,000 11,000 Maintenance and Improvement of Real Property
Facilities
2012-2013
000
3,1000000
3,5004,400
Total2008-2013
1,1970
4,3983,100
0233
12,60012,50012,400
7,50011,000 53,928
05020503 Preservation of Various Facilities 1,200 4,500 12,700 0 0 4,000 21,20005021203 Preserve Facilites @ Various sites 0 0 0 0 0 400 40005030603 Capitol Repairs 3,050 4,250 5,250 11,750 0 0 21,25005031203 Empire State Plaza reconstruct & re 0 0 0 0 0 5,000 5,00005040401 Health & Safety @ Various Sites 842 0 0 0 0 0 005040503 Capitol Repairs 4,850 1,079 0 0 0 0 1,07905050303 Capitol Repairs 600 0 0 0 0 0 005060601 Health & Safety @ various sites 1,000 3,191 3,000 3,000 0 0 9,19105060603 Preservation of various facilities 2,000 3,000 1,000 0 0 0 4,00005060605 Energy conservation projects 800 0 0 0 0 0 005060609 Harriman Campus demolition & site p 5,000 2,103 0 0 0 0 2,10305060701 Various Health & Safety projects 0 2,000 4,000 4,000 0 0 10,00005060703 Preservation of various facilities 0 2,900 3,700 6,900 6,500 0 20,00005060705 Energy conservation projects 0 2,000 1,000 0 0 0 3,00005060801 Various Health & Safety projects 0 0 0 3,000 7,700 0 10,70005060803 Preservation of various facilities 0 0 0 2,800 17,200 0 20,00005060805 Energy conservation projects 0 0 0 2,000 1,000 0 3,000050608PM Prev Maintenance @ various sites 0 0 0 1,750 6,950 0 8,70005060901 Various Health & Safety projects 0 0 0 0 1,000 3,700 4,70005060903 Preservation of various facilities 0 0 0 1,000 1,000 8,000 10,00005060905 Energy conservation projects 0 0 0 0 2,000 1,000 3,000050609PM Prev maintenance @ various sites 0 0 0 0 0 5,000 5,00005061001 Various Health & Safety projects 0 0 0 0 0 1,700 1,70005061003 Preservation of various facilities 0 0 0 0 0 3,000 3,00005061005 Energy conservation projects 0 0 0 0 0 2,000 2,000050610PM Prev Maintenance @ various sites 0 0 0 0 1,700 2,000 3,70005061101 Health & Safety at various sits 0 0 0 0 0 1,000 1,00005061103 Preservation of various facilities 0 0 0 0 0 3,000 3,00005061105 Energy conservation projects 0 0 0 0 0 0 0050611PM Preventative Maintenance at various 0 0 0 0 0 1,700 1,70005070501 Health & Safety existing facilities 2,503 5,355 7,645 9,300 0 3,000 25,300050907PM Prev Maintenance @ Various Sites 0 1,500 2,205 2,000 1,700 0 7,40505210301 Healt & Safety @ Various Sites 2,100 0 0 0 0 0 005220303 Preserve Facit @ Various Sites 7,500 7,601 4,000 2,500 0 0 14,10105430403 Preserv Facil @ Various Sites 3,000 0 0 0 0 0 0056606PM Preventative Maintenance @ Various 1,000 2,948 0 0 0 0 2,94805730303 Pres. Of Facil. @ Various Sites 4,000 1,000 0 0 0 0 1,00005880203 Preserv Facil @ Various Sites 2,000 0 0 0 0 0 005AA0607 State facilities 0 0 0 0 0 0 005AA0707 New Facilities 0 0 0 0 0 0 005AA0807 New Facilities 0 2,000 2,000 2,000 2,000 2,000 10,00005AA0907 New Facilities 0 0 0 0 0 0 005AA1007 New Facilities 0 0 0 0 0 0 005AA1107 New Facilities 0 0 0 0 0 0 005AA1207 NewFacility 0 0 0 0 0 0 005BL0603 BSOB parking lot rehab 2,650 2,350 0 0 0 0 2,35005BP0603 BSOB Parking lot rehab 2,800 2,500 0 0 0 0 2,50005CR0703 State Capitol Bldg rehab & repair 0 0 1,000 3,000 1,000 0 5,00005CR0803 State Capitol bldg rehab & repairs 0 0 0 0 0 5,000 5,00005CR0903 State Capitol Bldg rehab & repairs 0 0 0 500 750 3,000 4,25005CR1003 State Capitol Bldg rehab & repairs 0 0 0 0 250 1,000 1,25005CR1103 State Capitol Bldg rehab & repairs 0 0 0 0 500 750 1,25005LA0703 LOB Hearing Room A Rehab 1,050 0 0 0 0 0 005LB0703 LOB Hearing Room B Rehab 1,000 0 0 0 0 0 005LC0703 LOB Hearing Room C Rehab 300 0 0 0 0 0 005LL0603 LOB Meeting Room Rehab 1,000 645 0 0 0 0 64505NR0603 Empire State Plaza reconstruct & re 5,000 10,000 0 0 0 0 10,00005NR0703 Empire State Plaza reconstruct & re 5,000 5,000 0 0 0 0 5,00005NR0803 Empire State Plaza reconstruct & re 0 5,000 5,000 0 0 0 10,000

DETAILED DATA
271
General Services, Office of PROJECTED APPROPRIATIONS AND DISBURSEMENTS BY PROGRAM
2008-2009 THROUGH 2012-2013 (thousands of dollars)
DISBURSEMENTS Estimated Total
2007-2008 2008-2009 2009-2010 2010-2011 2011-2012 05NR0903 Empire State Plaza reconstruct & re 0 0 5,000 5,000 0 05NR1003 Empire State Plaza reconstruct & re 0 0 0 5,000 5,000 05NR1103 Empire State Plaza reconstruct & re 0 0 0 0 5,000 Subtotal 60,245 70,922 57,500 65,500 61,250 Total 70,945 80,850 68,500 76,500 72,250
2012-201300
5,00061,25072,250
2008-201310,00010,00010,000
316,422370,350

DETAILED DATA
272
State, Department of PROJECTED APPROPRIATIONS AND DISBURSEMENTS BY PROGRAM
2008-2009 THROUGH 2012-2013 (thousands of dollars)
APPROPRIATIONS Reappro-
priations 2008-2009 2009-2010 2010-2011 2011-2012 Local Government and Community Services 190103E9 New E-911 Program 38,177 0 0 0 0
2012-2013
0
Total2008-2013
0 Subtotal 38,177 0 0 0 0 0 0Office of Fire Prevention 19FA0507 NYS Fire Academy buildings 369 0 0 0 0 19FA0607 Bridge and Burn Building 758 0 0 0 0
00
00
Subtotal 1,127 0 0 0 0 0 0 Total 39,304 0 0 0 0 0 0
State, Department of
PROJECTED APPROPRIATIONS AND DISBURSEMENTS BY PROGRAM 2008-2009 THROUGH 2012-2013
(thousands of dollars) DISBURSEMENTS
Estimated Total
2007-2008 2008-2009 2009-2010 2010-2011 2011-2012 2012-2013 2008-2013Local Government and Community Services 190103E9 New E-911 Program 49,000 3,156 0 0 0 0 3,156 Subtotal 49,000 3,156 0 0 0 0 3,156Office of Fire Prevention 19FA0507 NYS Fire Academy buildings 1,443 0 0 0 0 19FA0607 Bridge and Burn Building 421 492 0 0 0
00
0492
Subtotal 1,864 492 0 0 0 0 492 Total 50,864 3,648 0 0 0 0 3,648

DETAILED DATA
273
Technology, Office for PROJECTED APPROPRIATIONS AND DISBURSEMENTS BY PROGRAM
2008-2009 THROUGH 2012-2013 (thousands of dollars)
APPROPRIATIONS Reappro-
priations 2008-2009 2009-2010 2010-2011 2011-2012 Economic Development 00BI0809 Universal Broadband Initiative 0 10,000 0 0 0
2012-2013
0
Total2008-2013
10,000 Subtotal 0 10,000 0 0 0 0 10,000Maintenance and Improvement of Facilities 00020803 Rehab of Data Center Facilities 0 11,000 0 0 0 0 11,00000SW0808 Statewide Wireless Network 0 40,000 0 0 0 0 40,00000SW0908 Statewide Wireless Network 0 0 80,000 0 0 0 80,00000SW1008 Statewide Wireless Network 0 0 0 155,000 0 0 155,00000SW1108 Statewide Wireless Network 0 0 0 0 125,000 0 125,00000SW1208 Statewide Wireless Network 0 0 0 0 0 122,000 122,000 Subtotal 0 51,000 80,000 155,000 125,000 122,000 533,000New Facilities 00DC0607 Consolidated Data Center 99,100 0 0 0 0 0 0 Subtotal 99,100 0 0 0 0 0 0 Total 99,100 61,000 80,000 155,000 125,000 122,000 543,000
Technology, Office for
PROJECTED APPROPRIATIONS AND DISBURSEMENTS BY PROGRAM 2008-2009 THROUGH 2012-2013
(thousands of dollars) DISBURSEMENTS
Estimated Total
2007-2008 2008-2009 2009-2010 2010-2011 2011-2012 2012-2013 2008-2013Economic Development 00BI0809 Universal Broadband Initiative 0 10,000 0 0 0 0 10,000 Subtotal 0 10,000 0 0 0 0 10,000Maintenance and Improvement of Facilities 00020803 Rehab of Data Center Facilities 0 4,000 7,000 0 0 0 11,00000SW0808 Statewide Wireless Network 0 38,444 0 0 0 0 38,44400SW0908 Statewide Wireless Network 0 0 76,393 0 0 0 76,39300SW1008 Statewide Wireless Network 0 0 0 152,163 0 0 152,16300SW1108 Statewide Wireless Network 0 0 0 0 123,130 0 123,13000SW1208 Statewide Wireless Network 0 0 0 0 0 121,251 121,251 Subtotal 0 42,444 83,393 152,163 123,130 121,251 522,381New Facilities 00DC0607 Consolidated Data Center 2,050 11,600 30,000 55,500 0 0 97,100 Subtotal 2,050 11,600 30,000 55,500 0 0 97,100 Total 2,050 64,044 113,393 207,663 123,130 121,251 629,481

DETAILED DATA
274
Judiciary PROJECTED APPROPRIATIONS AND DISBURSEMENTS BY PROGRAM
2008-2009 THROUGH 2012-2013 (thousands of dollars)
APPROPRIATIONS Reappro-
priations 2008-2009 2009-2010 2010-2011 2011-2012 Courthouse Improvements 52010603 Improvements in Court of Appeals An 2,965 0 0 0 0
2012-2013
0
Total2008-2013
052J10707 Court of Appeals Centennial Hall An 20,000 0 0 0 0 0 052J20707 Brooklyn Court Officer Training 33,700 0 0 0 0 0 052J30707 Saratoga Multi-Purpose Training Fac 24,200 0 0 0 0 0 0 Subtotal 80,865 0 0 0 0 0 0 Total 80,865 0 0 0 0 0 0
Judiciary
PROJECTED APPROPRIATIONS AND DISBURSEMENTS BY PROGRAM 2008-2009 THROUGH 2012-2013
(thousands of dollars) DISBURSEMENTS
Estimated
2007-2008 2008-2009 2009-2010 2010-2011 2011-2012 Courthouse Improvements 52010603 Improvements in Court of Appeals An 1,000 1,782 0 0 0 52J10707 Court of Appeals Centennial Hall An 0 2,218 8,000 8,000 1,782 52J20707 Brooklyn Court Officer Training 0 6,600 13,050 13,050 0 52J30707 Saratoga Multi-Purpose Training Fac 0 4,400 8,000 8,000 3,800
2012-2013
0000
Total2008-2013
1,78220,00032,70024,200
Subtotal 1,000 15,000 29,050 29,050 5,582 0 78,682 Total 1,000 15,000 29,050 29,050 5,582 0 78,682

DETAILED DATA
275
World Trade Center PROJECTED APPROPRIATIONS AND DISBURSEMENTS BY PROGRAM
2008-2009 THROUGH 2012-2013 (thousands of dollars)
APPROPRIATIONS
World Trade Center
Reappro- priations 2008-2009 2009-2010 2010-2011 2011-2012
2012-2013
Total2008-2013
17WT0220 WTC Rebuilding 192,557 0 0 0 0 0 02CWT0620 WTC Rebuilding Subtotal Total
255,534 0 0 0 0 0 0448,091 0 0 0 0 0 0448,091 0 0 0 0 0 0
World Trade Center
PROJECTED APPROPRIATIONS AND DISBURSEMENTS BY PROGRAM 2008-2009 THROUGH 2012-2013
(thousands of dollars) DISBURSEMENTS
Estimated Total
2007-2008 2008-2009 2009-2010 2010-2011 2011-2012 2012-2013 2008-2013World Trade Center 17WT0220 WTC Rebuilding 2CWT0620 WTC Rebuilding Subtotal Total
20,000 30,000 20,000 15,000 12,500 30,000 40,000 50,000 20,000 20,000
020,000
77,500150,000
50,000 70,000 70,000 35,000 32,500 20,000 227,50050,000 70,000 70,000 35,000 32,500 20,000 227,500

DETAILED DATA
276
State Equipment Finance Program PROJECTED APPROPRIATIONS AND DISBURSEMENTS BY PROGRAM
2008-2009 THROUGH 2012-2013 (thousands of dollars)
APPROPRIATIONS Reappro-
priations 2008-2009 2009-2010 2010-2011 2011-2012 Program Changes and Expansion 2P060608 Equipment Finance 91,398 0 0 0 0
2012-2013
0
Total2008-2013
02P070708 Equipment Finance 20,000 0 0 0 0 0 02P080808 Equipment Finance/Systems Develop 0 111,000 0 0 0 0 111,0002P090908 Equipment Finance 0 0 60,000 0 0 0 60,0002P101008 Equipment Finance 0 0 0 60,000 0 0 60,0002P111108 Equipment Finance 0 0 0 0 60,000 0 60,0002P121208 Equipment Finance 0 0 0 0 0 60,000 60,0002PHD0908 Non-Bonded Systems Development 0 0 104,000 0 0 0 104,0002PHD1008 Non-Bonded Systems Development 0 0 0 90,000 0 0 90,0002PHD1108 Non-Bonded Systems Development 0 0 0 0 60,000 0 60,0002PHD1208 Non-Bonded Systems Development 0 0 0 0 0 50,000 50,000 Subtotal 111,398 111,000 164,000 150,000 120,000 110,000 655,000 Total 111,398 111,000 164,000 150,000 120,000 110,000 655,000
State Equipment Finance Program
PROJECTED APPROPRIATIONS AND DISBURSEMENTS BY PROGRAM 2008-2009 THROUGH 2012-2013
(thousands of dollars) DISBURSEMENTS
Estimated
2007-2008 2008-2009 2009-2010 2010-2011 2011-2012 Program Changes and Expansion 2P060608 Equipment Finance 50,000 33,000 14,000 0 0 2P070708 Equipment Finance 0 13,000 7,000 0 0 2P080808 Equipment Finance/Systems Develop 0 65,000 39,000 7,000 0 2P090908 Equipment Finance 0 0 0 53,000 7,000 2P101008 Equipment Finance 0 0 0 0 53,000 2P111108 Equipment Finance 0 0 0 0 0 2P121208 Equipment Finance 0 0 0 0 0 2PHD0908 Non-Bonded Systems Development 0 0 103,900 0 0 2PHD1008 Non-Bonded Systems Development 0 0 0 81,100 0 2PHD1108 Non-Bonded Systems Development 0 0 0 0 56,500 2PHD1208 Non-Bonded Systems Development 0 0 0 0 0
2012-2013
0000
7,00053,000
0000
40,000
Total2008-2013
47,00020,000
111,00060,00060,00053,000
0103,90081,10056,50040,000
Subtotal 50,000 111,000 163,900 141,100 116,500 100,000 632,500 Total 50,000 111,000 163,900 141,100 116,500 100,000 632,500

DETAILED DATA
277
DEDICATED HIGHWAY AND BRIDGE TRUST FUND DETAIL
This section is provided to comply with the requirements of the amendment to Section 22-c of the State Finance Law as added by Chapter 62 of the Laws of 2006 and amended by Chapter 61 of the Laws of 2006. Information included in this section may be duplicative of information contained in previous sections.
The following table provides projected receipt, disbursement, and transfer amounts for
the Dedicated Highway and Bridge Trust Fund (DHBTF). Projected spending from this Fund will total almost $13 billion over the next five fiscal years, which represents almost 57 percent of the total transportation-related spending for capital projects estimated during that period. Any projected negative fund closing balance is caused by temporary timing differences between disbursements and receipts.
DEDICATED HIGHWAY AND BRIDGE TRUST FUND
PREPARED ON THE CASH BASIS OF ACCOUNTING CAPITAL PROGRAM AND FINANCING PLAN
2007-2008 THROUGH 2012-2013(thousands of dollars)
2007-08 2008-09 2009-10 2010-11 2011-12 2012-13Opening Balance ($90,261) ($49,000) ($31,000) ($31,000) ($31,000) ($31,001)
Receipts: Detail on taxes Auto Rental Tax $49,100 $51,200 $53,300 $55,400 $57,600 $60,000 Corporation & Utiility Tax $17,000 $17,000 $17,000 $17,000 $17,000 $17,000 Highw ay Use Tax $147,500 $161,600 $178,100 $181,100 $187,800 $188,600 Motor Fuel Tax $404,689 $277,123 $0 $0 $0 $0 Motor Vehicle Fees $561,700 $552,665 $562,688 $549,700 $561,700 $549,700 Petroleum Business Taxes $625,100 $798,700 $1,100,707 $1,105,460 $1,110,201 $1,114,750 Total taxes $1,805,089 $1,858,288 $1,911,795 $1,908,660 $1,934,301 $1,930,050
Detail on miscellaneous receipts Authority Bond proceeds $771,442 $694,289 $788,805 $935,045 $1,051,747 $1,117,631 Miscellaneous receipts (Non-Coverage) $100,878 $178,770 $210,972 $200,973 $200,975 $200,978 Miscellaneous receipts (Coverage-Related) $21,622 $41,070 $41,569 $52,069 $52,569 $53,069 Total receipts $2,699,031 $2,772,417 $2,953,141 $3,096,747 $3,239,592 $3,301,728
Disbursements: Capital Projects Personal Service $1,000 $1,030 $1,061 $1,093 $1,126 $1,159 Non-Personal Service $12,000 $12,360 $12,731 $13,113 $13,506 $13,911 Capital Projects $627,204 $668,393 $764,218 $927,525 $1,036,213 $1,087,603
State Forces Engineering Personal Service $222,696 $228,736 $239,888 $240,811 $242,799 $254,653 Non-Personal Service $178,162 $179,714 $190,687 $190,971 $200,284 $211,231
Consultant Engineering $219,107 $232,422 $235,015 $233,215 $234,902 $235,685
State Operations Department of Transportation Personal Service $290,525 $305,958 $314,617 $319,602 $322,871 $327,273 Non-Personal Service $377,946 $426,490 $467,010 $490,172 $507,480 $520,306 Department of Motor Vehicles Personal Service $93,662 $94,599 $95,643 $96,527 $97,669 $98,825 Non-Personal Service $104,544 $125,621 $118,253 $122,029 $127,039 $129,426 Total spending $2,126,846 $2,275,323 $2,439,123 $2,635,057 $2,783,889 $2,880,073
Other Financing Sources: Transfers from Federal funds $291,144 $267,007 $262,927 $307,761 $313,236 $308,462 Transfers from General Fund $3,000 $118,500 $211,800 $586,100 $689,400 $789,600 Transfers from General Obligation Bond Funds $47,327 $104,580 $69,650 $42,318 $22,503 $32,126 Transfer to Engineering Services Fund ($10,832) ($2,749) ($1,869) ($836) $0 $0 Transfer for Dedicated Trust Fund Debt Service ($488,900) ($562,072) ($625,032) ($937,215) ($1,015,503) ($1,070,131) Transfer for Local Highw ay Debt Service ($372,663) ($404,360) ($431,494) ($459,818) ($465,340) ($481,712) Net other f inancing sources (uses) ($530,924) ($479,094) ($514,018) ($461,690) ($455,704) ($421,655)
Closing Balance ($49,000) ($31,000) ($31,000) ($31,000) ($31,001) ($31,001)
Est imat ed D ed icat ed F und B o nd s C o verag e R at io ( 1) 2.4 2.4 2.4 2.2 2.1 2.0
(1) The formula for this calculation for each State Fiscal Year is: (Total Taxes +Miscellaneous Receipts (Coverage-Related))/Dedicated Trust Fund Debt Service=Estimated Coverage This example is not intended to be used for any additional bonds test. The actual calculation requires that the amount of collections of Trust Fund Revenues for any 12 consecutive calendar months occurring not more than six months prior to the date of the calulation less Thruw ay Authority expenses related to the State's multi-year highw ay and bridge capital program for that State Fiscal Year shall be at least two times the sum of the amount calculated pursuant to the First General Bond Resolution and the Aggregate Debt Service less any accrued or capitalized interest on non-variable rate bonds.

DETAILED DATA
278
The DHBTF is projected to have a financing gap, or deficit, of $119 million in 2008-09, and another $212 million in 2009-10, for an aggregate gap of $330 million through the five-year State Transportation Plan period ending in 2009-10. This deficit is reflected in the preceding table as being funded by revenues transferred from the General Fund. For the five-year rolling capital program plan period through 2012-13, the estimated gap is projected to grow an additional $2.1 billion. These projections are based upon estimates of revenues, bond proceeds, transfers, debt service, and program disbursements from the current State Transportation Plan, as well as programmatic assumptions for a successor plan. These gap estimates are the result of an imbalance in the DHBTF between projected revenues and expenditures.
The following table provides actual receipts and disbursements information for the last-completed State fiscal year and the first three quarters of the current State fiscal year.
DEDICATED HIGHWAY AND BRIDGE TRUST FUND PREPARED ON THE CASH BASIS OF ACCOUNTING
CAPITAL PROGRAM AND FINANCING PLAN(thousands of dollars)
Apr-DecActuals Actuals Projected2006-07 2007-08 2007-08
Opening Balance ($158,030) ($90,261) ($90,261)
Receipts: Detail on taxes Auto Rental Tax $45,495 $28,834 $49,100 Corporation & Utiility Tax $17,098 $5,381 $17,000 Highway Use Tax $152,670 $109,027 $147,500 Motor Fuel Tax $405,792 $306,181 $404,689 Motor Vehicle Fees $556,365 $412,045 $561,700 Petroleum Business Taxes $603,897 $477,905 $625,100 Total taxes $1,781,317 $1,339,373 $1,805,089
Detail on miscellaneous receipts Authority Bond proceeds $725,947 $374,053 $771,442 Miscellaneous receipts (Non-Coverage) $1,971 $31,825 $100,878 Miscellaneous receipts (Coverage-Related) $101,178 $8,500 $21,622 Total receipts $2,610,413 $1,753,751 $2,699,031
Disbursements: State Operations $1,324,892 $890,880 $1,499,642 Capital Projects $744,839 $665,378 $627,204 Total spending $2,069,731 $1,556,258 $2,126,846
Other Financing Sources: Transfers from Federal funds $272,439 $119,691 $291,144 Transfers from General Fund $0 $0 $3,000 Transfers from General Obligation Bond Funds $8,979 $4,610 $47,327 Transfer to Engineering Services Fund ($12,986) $9,481 ($10,832) Transfer for Dedicated Trust Fund Debt Service ($440,297) ($410,296) ($488,900) Transfer for Local Highway Debt Service ($301,048) ($148,533) ($372,663) Net other financing sources (uses) ($472,913) ($425,047) ($530,924)
Closing Balance ($90,261) ($317,815) ($49,000)

DETAILED DATA
279
The following table provides Dedicated Highway and Bridge Trust Fund bond coverage ratios for prior periods.
DEDICATED HIGHWAY AND BRIDGE TRUST FUND BOND COVERAGE RATIOS FOR PRIOR PERIODS
2003-04 2004-05 2005-06 2006-07 2007-08 (to date) 2.3 2.3 2.7 2.7 2.6
The following table provides recent Dedicated Highway and Bridge Trust Fund appropriations for debt service.
DEDICATED HIGHWAY AND BRIDGE TRUST FUND
DEBT SERVICE APPROPRIATIONS
Enacted Enacted Recommended 2006-07 2007-08 2008-09 $475,150,000 $505,200,000 $580,200,000

DETAILED DATA
280
Transportation, Department of PROJECTED APPROPRIATIONS AND DISBURSEMENTS BY FUND
2008-2009 THROUGH 2012-2013 (thousands of dollars)
APPROPRIATIONS Reappro-
priations 2008-2009 2009-2010 2010-2011Dedicated Highway and Bridge Trust Fund 03334811 Hwy-Rr Grade Cross Eliminations 3,615 0 0 0
2011-2012
0
2012-2013
0
Total2008-2013
0170102SN Snow & Ice Control 321 0 0 0 0 0 0170103PT Bus Inspection 451 0 0 0 0 0 0170103SN Snow & Ice Control 4,820 0 0 0 0 0 0170104SN Snow & Ice Control 617 0 0 0 0 0 0170105PT Bus Inspection 74 0 0 0 0 0 0170106PT Bus Inspection 1,284 0 0 0 0 0 0170107PT Bus Inspection 4,821 0 0 0 0 0 0170108BI Bridge Initiative 0 139,820 0 0 0 0 139,820170108PT Bus Inspection 0 7,741 0 0 0 0 7,741170109BI Bridge Initiative 0 0 147,070 0 0 0 147,070170109PT Bus Inspection 0 0 8,012 0 0 0 8,012170110BI Bridge Initiative 0 0 0 152,990 0 0 152,990170110PT Bus Inspection 0 0 0 8,292 0 0 8,292170111BI Bridge Initiative 0 0 0 0 157,860 0 157,860170111PT Bus Inspection 0 0 0 0 8,603 0 8,603170112BI Bridge Initiative 0 0 0 0 0 164,170 164,170170112PT Bus Inspection 0 0 0 0 0 8,926 8,926170194TA Other Highway Aid 0 0 0 0 0 0 017020022 Nfa Hwy, Eng, Row 10,801 0 0 0 0 0 017020122 Nfa Hwy, Eng, Row 19,967 0 0 0 0 0 017020222 Nfa Hwy, Eng, Row 41,681 0 0 0 0 0 017020322 NFA Highway, ROW 49,157 0 0 0 0 0 017020422 NFA Highway, ROW 81,751 0 0 0 0 0 017020522 NFA Highway, ROW 115,547 0 0 0 0 0 017020622 NFA Highway, ROW 294,083 0 0 0 0 0 017020722 NFA Highway, ROW 479,271 0 0 0 0 0 017020822 NFA Highway, ROW 0 539,352 0 0 0 0 539,35217020922 NFA Highway, ROW 0 0 787,693 0 0 0 787,69317021022 NFA Highway, ROW 0 0 0 943,264 0 0 943,26417021122 NFA Highway, ROW 0 0 0 0 943,264 0 943,26417021222 NFA Highway, ROW 0 0 0 0 0 943,264 943,26417029222 Non-Federal Aided Highway 42,206 0 0 0 0 0 017029322 Non Federally Aided Highways 5,144 0 0 0 0 0 017029422 Non Federally Aided Highways 189,783 0 0 0 0 0 0170294TA Other Highway Aid 0 0 0 0 0 0 017029522 Non Federally Aided Highway 22,685 0 0 0 0 0 017029622 Dedicated Fund 4,539 0 0 0 0 0 017029722 Dedicated Fund 8,852 0 0 0 0 0 017029822 Dedicated Fund 16,522 0 0 0 0 0 017029922 Nfa Hwy, Eng, Row 10,744 0 0 0 0 0 017038679 Industrial Access 0 0 0 0 0 0 017039922 Nfa Hwy, Eng, Row 1 0 0 0 0 0 017040022 Preventive Maintenance 1,466 0 0 0 0 0 017040122 Preventive Maintenance 37,054 0 0 0 0 0 017040222 Preventive Maintenance 27,162 0 0 0 0 0 017040322 Preventive Maintenance 4,736 0 0 0 0 0 017040422 Preventive Maintenance 14,757 0 0 0 0 0 0170405HM Preventive Maintenance 8,801 0 0 0 0 0 0170406HM Preventive Maintenance 27,188 0 0 0 0 0 0170407HM Preventive Maintenance 427,961 0 0 0 0 0 0170408HM Preventive Maintenance 0 579,791 0 0 0 0 579,791170409HM Preventive Maintenance 0 0 597,291 0 0 0 597,291170410HM Preventive Maintenance 0 0 0 612,079 0 0 612,079170411HM Preventive Maintenance 0 0 0 0 621,788 0 621,788170412HM Preventive Maintenance 0 0 0 0 0 632,529 632,529170493PM Preventive Maintenance 213 0 0 0 0 0 017049522 Preventive Maintenance 154 0 0 0 0 0 017049622 Preventive Maintenance 877 0 0 0 0 0 017049722 Preventive Maintenance 2,400 0 0 0 0 0 017049822 Preventive Maintenance 3,234 0 0 0 0 0 017049922 Preventive Maintenance 884 0 0 0 0 0 017058779 Industrial Access/Stewart Air Settl 0 0 0 0 0 0 017059379 Industrial Access 0 0 0 0 0 0 0170594PM Preventive Maintenance 8,688 0 0 0 0 0 017059822 Multi-Modal 6,380 0 0 0 0 0 017060079 Industrial Access 477 0 0 0 0 0 017060279 Industrial Access 1,280 0 0 0 0 0 017060379 Industrial Access 5,189 0 0 0 0 0 017060479 Industrial Access 8,266 0 0 0 0 0 017060579 Industrial Access 9,000 0 0 0 0 0 017060679 Industrial Access 9,000 0 0 0 0 0 017068711 Other Highway Systems 9,489 0 0 0 0 0 017069479 Industrial Access 227 0 0 0 0 0 017069579 Industrial Access 0 0 0 0 0 0 017069679 Industrial Access 7 0 0 0 0 0 0

DETAILED DATA
281
Transportation, Department of PROJECTED APPROPRIATIONS AND DISBURSEMENTS BY FUND
2008-2009 THROUGH 2012-2013 (thousands of dollars)
APPROPRIATIONS Reappro-
priations 2008-2009 2009-2010 2010-201117069779 Industrial Access 0 0 0 0
2011-2012 2012-2013
Total2008-2013
0 0 017069879 Industrial Access 245 0 0 0 0 0 017069979 Industrial Access 1,935 0 0 0 0 0 017070079 Industrial Access 10,000 0 0 0 0 0 017070279 Industrial Access 6,000 0 0 0 0 0 017079979 Industrial Access - Mou 1,663 0 0 0 0 0 017108626 Municipal Hwy Rr Crossing Alteratio 1,125 0 0 0 0 0 017108826 Municipal Hwy Rr Crossing Alteratio 443 0 0 0 0 0 017150041 Rail Freight 7,029 0 0 0 0 0 017150241 Railroads 7,362 0 0 0 0 0 017150341 Railroads 10,400 0 0 0 0 0 017150441 Railroads 11,157 0 0 0 0 0 017150541 Railroads 11,804 0 0 0 0 0 017150641 Railroads 15,908 0 0 0 0 0 017150741 Railroads 20,000 0 0 0 0 0 017150841 Railroads 0 20,000 0 0 0 0 20,00017150941 Railroads 0 0 20,000 0 0 0 20,00017151041 Railroads 0 0 0 20,000 0 0 20,00017151141 Railroads 0 0 0 0 20,000 0 20,00017151241 Railroads 0 0 0 0 0 20,000 20,000171594TA Other Highway Aid 0 0 0 0 0 0 017159941 Rail Freight 4,492 0 0 0 0 0 0171694TA Other Highway Aid 0 0 0 0 0 0 017229314 Aviation 2,902 0 0 0 0 0 017230014 Statewide Aviation 836 0 0 0 0 0 017230114 Statewide Aviation 301 0 0 0 0 0 017230214 Statewide Aviaiton 952 0 0 0 0 0 017230314 Statewide Aviation 1,455 0 0 0 0 0 017230414 Statewide Aviation 8,000 0 0 0 0 0 017230514 Statewide Aviation 8,000 0 0 0 0 0 017230614 Statewide Aviation 8,000 0 0 0 0 0 017230714 Statewide Aviation 8,000 0 0 0 0 0 017230814 Statewide Aviation 0 8,000 0 0 0 0 8,00017230914 Statewide Aviation 0 0 8,000 0 0 0 8,00017231014 Statewide Aviation 0 0 0 8,000 0 0 8,00017231114 Statewide Aviation 0 0 0 0 8,000 0 8,00017231214 Statewide Aviation 0 0 0 0 0 8,000 8,00017239214 Statewide Aviation Development 477 0 0 0 0 0 017239314 State Share Aviation Improvements 132 0 0 0 0 0 017239514 Statewide Aviation D 398 0 0 0 0 0 017239814 Statewide Aviation 874 0 0 0 0 0 017239914 Statewide Aviation 629 0 0 0 0 0 017249279 Industrial Access 23 0 0 0 0 0 017249714 Aviation State Match 520 0 0 0 0 0 017250013 Highway Maintenance 141 0 0 0 0 0 017250113 Highway Maintenance 264 0 0 0 0 0 017250213 Highway Maintenance 0 0 0 0 0 0 017250313 Highway Maintenance 136 0 0 0 0 0 017250413 Highway Maintenance 551 0 0 0 0 0 017250513 Highway Maintenance 1,646 0 0 0 0 0 017250613 Highway Maintenance 7,551 0 0 0 0 0 017250713 Highway Maintenance 14,863 0 0 0 0 0 017250813 Highway Maintenance 0 15,485 0 0 0 0 15,48517250913 Highway Maintenance 0 0 15,965 0 0 0 15,96517251013 Highway Maintenance 0 0 0 15,965 0 0 15,96517251113 Highway Maintenance 0 0 0 0 15,965 0 15,96517251213 Highway Maintenance 0 0 0 0 0 15,965 15,96517259813 Highway Maintenance 127 0 0 0 0 0 017259913 Highway Maintenance 95 0 0 0 0 0 017260118 Equipment Management 45 0 0 0 0 0 017260218 Equipment Management 265 0 0 0 0 0 017260318 Equipment Management 474 0 0 0 0 0 017260418 Equipment Management 709 0 0 0 0 0 017260518 Equipment Management 279 0 0 0 0 0 017269818 Equipment Management 115 0 0 0 0 0 017269918 Equipment Management 102 0 0 0 0 0 017309322 Bonding Guarantee 3,500 0 0 0 0 0 017348590 Southern Tier Expressway 2,860 0 0 0 0 0 017369321 I95 Sound Barriers 1,150 0 0 0 0 0 017429512 High Speed Rail--State Share 4 0 0 0 0 0 017438621 Other Highway Aid 2,806 0 0 0 0 0 017459121 Noise Barriers -- I-684 0 0 0 0 0 0 017469121 Rt 303 Safety Study 0 0 0 0 0 0 017A38879 Industrial Access 73 0 0 0 0 0 017B18611 State Gateway Information Centers 656 0 0 0 0 0 017D10330 Design And Construction 54 0 0 0 0 0 017D10430 Design And Construction 0 0 0 0 0 0 0

DETAILED DATA
282
Transportation, Department of PROJECTED APPROPRIATIONS AND DISBURSEMENTS BY FUND
2008-2009 THROUGH 2012-2013 (thousands of dollars)
APPROPRIATIONS
17D10530 Design And Construction
Reappro-priations 2008-2009 2009-2010 2010-2011
104 0 0 0
2011-2012 2012-2013
Total2008-2013
0 0 017D10630 Design And Construction 150 0 0 0 0 0 017D10730 Design and Construction 1,890 0 0 0 0 0 017D10830 Design and Construction 0 2,200 0 0 0 0 2,20017D10930 Design and Construction 0 0 2,200 0 0 0 2,20017D11030 Design and Construction 0 0 0 2,200 0 0 2,20017D11130 Design and Construction 0 0 0 0 2,200 0 2,20017D11230 Design and Construction 0 0 0 0 0 2,200 2,20017H10330 Engineering Services 36,438 0 0 0 0 0 017H10430 Engineering Services 32,007 0 0 0 0 0 017H10530 Engineering Services 62,868 0 0 0 0 0 017H10630 Engineering Services 168,198 0 0 0 0 0 017H10730 Engineering Services 530,435 0 0 0 0 0 017H10830 Engineering Services 0 671,887 0 0 0 0 671,88717H10930 Engineering Services 0 0 769,474 0 0 0 769,47417H11030 Engineering Services 0 0 0 797,956 0 0 797,95617H11130 Engineering Services 0 0 0 0 812,267 0 812,26717H11230 Engineering Services 0 0 0 0 0 818,061 818,06117H20330 Engineering Services 910 0 0 0 0 0 017H20430 Engineering Services Mgmt. 785 0 0 0 0 0 017H20530 Engineering Services Mgmt. 744 0 0 0 0 0 017H20630 Engineering Services Mgmt. 579 0 0 0 0 0 017H20730 Engineering Services 37,673 0 0 0 0 0 017H20830 Engineering Services 0 66,310 0 0 0 0 66,31017H30330 Engineering Services 296 0 0 0 0 0 017H30430 Engineering Services ROW 493 0 0 0 0 0 017H30530 Engineering Services ROW 334 0 0 0 0 0 017H30630 Engineering Services ROW 60 0 0 0 0 0 017H30730 Engineering Services 12,981 0 0 0 0 0 017H30830 Engineering Services 0 19,810 0 0 0 0 19,81017H40730 Engineering Services 15,000 0 0 0 0 0 017H40830 Engineering Services 0 15,000 0 0 0 0 15,00017H40930 Engineering Services 0 0 10,000 0 0 0 10,00017M100MR Local Projects 49,220 0 0 0 0 0 017MM05MR Multi-Modal 130,700 0 0 0 0 0 017MM06MR Multi-Modal Subtotal
200,000 0 0 03,495,020 2,085,396 2,365,705 2,560,746
0 0 02,589,947 2,613,115 12,214,909

DETAILED DATA
283
Transportation, Department of PROJECTED APPROPRIATIONS AND DISBURSEMENTS BY FUND
2008-2009 THROUGH 2012-2013 (thousands of dollars)
DISBURSEMENTS Estimated Total
2007-2008 2008-2009 2009-2010 2010-2011 2011-2012 2012-2013 2008-2013Dedicated Highway and Bridge Trust Fund 03334811 Hwy-Rr Grade Cross Eliminations 170102SN Snow & Ice Control
2,0000
00
00
00
0 0
00
00
170103PT Bus Inspection 0 0 0 0 0 0 0170103SN Snow & Ice Control 0 0 0 0 0 0 0170104SN Snow & Ice Control 618 0 0 0 0 0 0170105PT Bus Inspection 170106PT Bus Inspection 170107PT Bus Inspection 170108BI Bridge Initiative 170108PT Bus Inspection 170109BI Bridge Initiative 170109PT Bus Inspection 170110BI Bridge Initiative 170110PT Bus Inspection 170111BI Bridge Initiative
0300
7,1700000000
00
30550,335
7,27600000
000
60,122310
21,5607,531
000
000
15,0000
63,240320
55,0767,794
0
0 0 0
6,991 0
19,707 0
70,785 331
56,830
000
6,9910
8,3530
17,2990
67,879
00
305139,439
7,586112,860
7,851143,160
8,125124,709
170111PT Bus Inspection 170112BI Bridge Initiative 170112PT Bus Inspection 170194TA Other Highway Aid 17020022 Nfa Hwy, Eng, Row 17020122 Nfa Hwy, Eng, Row 17020222 Nfa Hwy, Eng, Row 17020322 NFA Highway, ROW 17020422 NFA Highway, ROW 17020522 NFA Highway, ROW 17020622 NFA Highway, ROW 17020722 NFA Highway, ROW 17020822 NFA Highway, ROW
0000
9,43810,69720,76211,10030,400
102,701193,575150,946
0
00000
10,69710,380
7,40011,40047,034
113,475202,996156,412
000000
10,3803,7007,600
063,40098,485
210,347
000000
4,1573,7003,800
025,02541,640
109,671
8,087 0 0 0 0 0 0 0
3,800 0
13,350 15,615 46,510
44459,1018,390
0000000
6,67510,41016,180
8,53159,1018,390
00
10,69724,91714,80026,60047,034
221,925369,146539,120
17020922 NFA Highway, ROW 17021022 NFA Highway, ROW 17021122 NFA Highway, ROW 17021222 NFA Highway, ROW 17029222 Non-Federal Aided Highway 17029322 Non Federally Aided Highways 17029422 Non Federally Aided Highways 170294TA Other Highway Aid 17029522 Non Federally Aided Highway 17029622 Dedicated Fund
0000
5,0002,0006,000
03,500
660
0000
4,0001,5005,000
04,205
550
238,430000
3,0001,0004,000
02,500
440
307,200273,546
00
2,000500
3,0000
2,000330
143,907 367,872 283,547
0 1,000
0 2,000
0 1,500
220
63,015165,354372,873283,547
5000
1,0000
1,000110
752,552806,772656,420283,54710,500
3,00015,000
011,205
1,65017029722 Dedicated Fund 1,000 800 600 400 200 0 2,00017029822 Dedicated Fund 6,000 4,000 2,000 1,000 500 250 7,75017029922 Nfa Hwy, Eng, Row 0 0 0 0 0 0 017038679 Industrial Access 0 0 0 0 0 0 017039922 Nfa Hwy, Eng, Row 17040022 Preventive Maintenance
00
00
00
00
0 0
00
00
17040122 Preventive Maintenance 0 0 0 0 0 0 017040222 Preventive Maintenance 0 0 0 0 0 0 017040322 Preventive Maintenance 0 0 0 0 0 0 017040422 Preventive Maintenance 3,312 0 0 0 0 0 0170405HM Preventive Maintenance 4,800 4,800 0 0 0 0 4,800170406HM Preventive Maintenance 68,655 5,281 5,281 0 0 0 10,562170407HM Preventive Maintenance 480,755 74,402 5,723 5,723 0 0 85,848170408HM Preventive Maintenance 0 487,024 75,372 5,797 5,797 0 573,990170409HM Preventive Maintenance 0 0 501,724 77,647 5,973 5,973 591,317170410HM Preventive Maintenance 0 0 0 514,146 79,570 6,120 599,836170411HM Preventive Maintenance 0 0 0 0 523,950 85,832 609,782170412HM Preventive Maintenance 0 0 0 0 0 541,324 541,324170493PM Preventive Maintenance 0 0 0 0 0 0 017049522 Preventive Maintenance 80 40 20 10 4 0 7417049622 Preventive Maintenance 60 50 40 30 20 10 15017049722 Preventive Maintenance 666 333 0 0 0 0 33317049822 Preventive Maintenance 600 500 400 300 200 100 1,50017049922 Preventive Maintenance 0 0 0 0 0 0 017058779 Industrial Access/Stewart Air Settl 17059379 Industrial Access
00
00
00
00
0 0
00
00
170594PM Preventive Maintenance 2,000 1,000 500 0 0 0 1,50017059822 Multi-Modal 1,000 850 700 550 400 250 2,75017060079 Industrial Access 486 0 0 0 0 0 017060279 Industrial Access 1,170 112 0 0 0 0 11217060379 Industrial Access 1,440 1,170 900 900 900 218 4,08817060479 Industrial Access 2,070 1,440 1,170 900 900 900 5,31017060579 Industrial Access 450 2,070 1,440 1,170 900 900 6,48017060679 Industrial Access 450 450 2,070 1,440 1,170 900 6,03017068711 Other Highway Systems 17069479 Industrial Access
3,000150
2,50077
1,0000
5000
250 0
1250
4,37577
17069579 Industrial Access 0 0 0 0 0 0 017069679 Industrial Access 6 0 0 0 0 0 0

DETAILED DATA
284
Transportation, Department of PROJECTED APPROPRIATIONS AND DISBURSEMENTS BY FUND
2008-2009 THROUGH 2012-2013 (thousands of dollars)
DISBURSEMENTS Estimated Total
2007-2008 2008-2009 2009-2010 2010-201117069779 Industrial Access 0 0 0 0
2011-2012 2012-2013 2008-20130 0 0
17069879 Industrial Access 244 0 0 0 0 0 017069979 Industrial Access 1,500 434 0 0 0 0 43417070079 Industrial Access 1,000 1,000 700 0 0 0 1,70017070279 Industrial Access 780 600 600 600 420 0 2,22017079979 Industrial Access - Mou 1,000 703 0 0 0 0 70317108626 Municipal Hwy Rr Crossing Alteratio 400 300 200 100 0 0 60017108826 Municipal Hwy Rr Crossing Alteratio 100 90 80 70 60 40 34017150041 Rail Freight 700 600 600 0 0 0 1,20017150241 Railroads 2,000 1,600 1,400 1,200 1,200 0 5,40017150341 Railroads 2,200 2,000 1,600 1,400 1,200 1,200 7,40017150441 Railroads 2,600 2,200 2,000 1,600 1,400 1,200 8,40017150541 Railroads 2,200 2,600 2,200 2,000 1,600 1,400 9,80017150641 Railroads 4,400 2,200 2,600 2,200 2,000 1,600 10,60017150741 Railroads 1,200 4,400 2,200 2,600 2,200 2,000 13,40017150841 Railroads 0 1,200 4,400 2,200 2,600 2,200 12,60017150941 Railroads 0 0 1,200 4,400 2,200 2,600 10,40017151041 Railroads 0 0 0 1,200 4,400 2,200 7,80017151141 Railroads 0 0 0 0 1,200 4,400 5,60017151241 Railroads 0 0 0 0 0 1,200 1,200171594TA Other Highway Aid 0 0 0 0 0 0 017159941 Rail Freight 780 780 0 0 0 0 780171694TA Other Highway Aid 0 0 0 0 0 0 017229314 Aviation 1,000 750 500 250 0 0 1,50017230014 Statewide Aviation 420 360 55 0 0 0 41517230114 Statewide Aviation 324 0 0 0 0 0 017230214 Statewide Aviaiton 800 332 0 0 0 0 33217230314 Statewide Aviation 1,280 0 0 0 0 0 017230414 Statewide Aviation 2,320 1,280 800 640 560 480 3,76017230514 Statewide Aviation 960 2,320 1,280 800 640 560 5,60017230614 Statewide Aviation 720 960 2,320 1,280 800 640 6,00017230714 Statewide Aviation 80 720 960 2,320 1,280 800 6,08017230814 Statewide Aviation 0 80 720 960 2,320 2,280 6,36017230914 Statewide Aviation 0 0 80 720 960 2,320 4,08017231014 Statewide Aviation 0 0 0 80 720 2,960 3,76017231114 Statewide Aviation 0 0 0 0 80 720 80017231214 Statewide Aviation 0 0 0 0 0 80 8017239214 Statewide Aviation Development 200 100 0 0 0 0 10017239314 State Share Aviation Improvements 100 74 0 0 0 0 7417239514 Statewide Aviation D 100 75 50 25 25 25 20017239814 Statewide Aviation 90 0 0 0 0 0 017239914 Statewide Aviation 270 90 0 0 0 0 9017249279 Industrial Access 22 0 0 0 0 0 017249714 Aviation State Match 86 69 24 7 0 0 10017250013 Highway Maintenance 0 0 0 0 0 0 017250113 Highway Maintenance 0 0 0 0 0 0 017250213 Highway Maintenance 0 0 0 0 0 0 017250313 Highway Maintenance 107 0 0 0 0 0 017250413 Highway Maintenance 214 107 0 0 0 0 10717250513 Highway Maintenance 1,819 214 107 0 0 0 32117250613 Highway Maintenance 6,420 1,819 214 107 0 0 2,14017250713 Highway Maintenance 3,010 9,030 2,558 300 150 0 12,03817250813 Highway Maintenance 0 3,097 9,291 2,632 309 154 15,48317250913 Highway Maintenance 0 0 3,193 9,579 2,714 319 15,80517251013 Highway Maintenance 0 0 0 3,193 9,579 2,714 15,48617251113 Highway Maintenance 0 0 0 0 3,193 8,579 11,77217251213 Highway Maintenance 0 0 0 0 0 3,193 3,19317259813 Highway Maintenance 0 0 0 0 0 0 017259913 Highway Maintenance 0 0 0 0 0 0 017260118 Equipment Management 0 0 0 0 0 0 017260218 Equipment Management 0 0 0 0 0 0 017260318 Equipment Management 181 0 0 0 0 0 017260418 Equipment Management 362 181 0 0 0 0 18117260518 Equipment Management 279 0 0 0 0 0 017269818 Equipment Management 0 0 0 0 0 0 017269918 Equipment Management 0 0 0 0 0 0 017309322 Bonding Guarantee 500 400 300 200 100 50 1,05017348590 Southern Tier Expressway 2,000 500 0 0 0 0 50017369321 I95 Sound Barriers 100 100 100 100 100 100 50017429512 High Speed Rail--State Share 4 0 0 0 0 0 017438621 Other Highway Aid 800 600 400 200 100 50 1,35017459121 Noise Barriers -- I-684 0 0 0 0 0 0 017469121 Rt 303 Safety Study 0 0 0 0 0 0 017A38879 Industrial Access 72 0 0 0 0 0 017B18611 State Gateway Information Centers 150 100 50 0 0 0 15017D10330 Design And Construction 53 0 0 0 0 0 017D10430 Design And Construction 0 0 0 0 0 0 0

DETAILED DATA
285
Transportation, Department of PROJECTED APPROPRIATIONS AND DISBURSEMENTS BY FUND
2008-2009 THROUGH 2012-2013 (thousands of dollars)
DISBURSEMENTS Estimated Total
17D10530 Design And Construction 2007-2008 2008-2009 2009-2010 2010-2011
144 0 0 02011-2012 2012-2013 2008-2013
0 0 017D10630 Design And Construction 313 0 0 0 0 0 017D10730 Design and Construction 440 1,320 374 44 22 0 1,76017D10830 Design and Construction 0 440 1,320 374 44 22 2,20017D10930 Design and Construction 0 0 440 1,320 374 44 2,17817D11030 Design and Construction 0 0 0 440 1,320 374 2,13417D11130 Design and Construction 0 0 0 0 440 1,320 1,76017D11230 Design and Construction 0 0 0 0 0 440 44017H10330 Engineering Services 5,125 5,125 5,125 5,125 0 0 15,37517H10430 Engineering Services 15,420 5,140 5,140 5,140 5,140 0 20,56017H10530 Engineering Services 38,106 16,331 5,443 5,443 5,443 5,443 38,10317H10630 Engineering Services 117,179 45,569 29,529 16,510 6,510 6,510 104,62817H10730 Engineering Services 445,090 120,978 57,047 20,163 6,721 6,721 211,63017H10830 Engineering Services 0 456,883 130,939 47,032 25,156 6,718 666,72817H10930 Engineering Services 0 0 533,242 138,505 58,863 24,084 754,69417H11030 Engineering Services 0 0 0 542,610 149,565 60,856 753,03117H11130 Engineering Services 0 0 0 0 552,342 156,208 708,55017H11230 Engineering Services 0 0 0 0 0 566,281 566,28117H20330 Engineering Services 0 0 0 0 0 0 017H20430 Engineering Services Mgmt. 784 0 0 0 0 0 017H20530 Engineering Services Mgmt. 3,910 1,676 559 559 558 558 3,91017H20630 Engineering Services Mgmt. 3,346 0 0 0 0 0 017H20730 Engineering Services 38,818 10,275 3,996 1,712 570 570 17,12317H20830 Engineering Services 0 45,090 11,935 4,641 1,989 663 64,31817H30330 Engineering Services 0 0 0 0 0 0 017H30430 Engineering Services ROW 423 70 0 0 0 0 7017H30530 Engineering Services ROW 992 425 142 142 141 141 99117H30630 Engineering Services ROW 886 0 0 0 0 0 017H30730 Engineering Services 11,000 3,482 1,354 580 193 193 5,80217H30830 Engineering Services 0 13,470 3,565 1,386 594 198 19,21317H40730 Engineering Services 10,200 2,700 1,050 450 150 150 4,50017H40830 Engineering Services 0 10,200 2,700 1,050 450 150 14,55017H40930 Engineering Services 0 0 6,800 1,800 700 300 9,60017M100MR Local Projects 15,000 15,000 15,000 5,000 0 0 35,00017MM05MR Multi-Modal 16,500 15,000 15,000 25,000 15,000 15,000 85,00017MM06MR Multi-Modal Subtotal
24,000 22,000 20,000 20,0001,928,640 2,055,103 2,225,227 2,416,501
20,000 20,791 102,7912,559,181 2,651,822 11,907,834

DETAILED DATA
286
Motor Vehicles, Department of PROJECTED APPROPRIATIONS AND DISBURSEMENTS BY FUND
2008-2009 THROUGH 2012-2013 (thousands of dollars)
APPROPRIATIONS Reappro-
priations 2008-2009 2009-2010 2010-2011Dedicated Highway and Bridge Trust Fund 230103TS DMV Expenses 2,500 0 0 0
2011-2012
0
2012-2013
0
Total2008-2013
0230105TS DMV Expenses 0 0 0 0 0 0 0230107TS DMV Expenses 0 0 0 0 0 0 0230108TS DMV Expenses 0 221,453 0 0 0 0 221,453230109TS DMV Expenses 0 0 217,000 0 0 0 217,000230110TS DMV Expenses 0 0 0 223,500 0 0 223,500230111TS DMV expenses 0 0 0 0 228,417 0 228,417230112TS DMV expenses 0 0 0 0 0 236,400 236,400 Subtotal 2,500 221,453 217,000 223,500 228,417 236,400 1,126,770
1,126,770 Total 2,500 221,453 217,000 223,500 228,417 236,400
Motor Vehicles, Department of
PROJECTED APPROPRIATIONS AND DISBURSEMENTS BY FUND 2008-2009 THROUGH 2012-2013
(thousands of dollars) DISBURSEMENTS
Estimated Total
2007-2008 2008-2009 2009-2010 2010-2011 2011-2012 2012-2013 2008-2013Dedicated Highway and Bridge Trust Fund 230103TS DMV Expenses 0 0 0 0
0 0 0
230105TS DMV Expenses 13,906 0 0 0 0 0 0230107TS DMV Expenses 184,300 6,171 0 0 0 0 6,171230108TS DMV Expenses 0 214,049 1,562 0 0 0 215,611230109TS DMV Expenses 0 0 212,334 1,222 0 0 213,556230110TS DMV Expenses 0 0 0 217,334 2,163 0 219,497230111TS DMV expenses 0 0 0 0 222,545 0 222,545230112TS DMV expenses 0 0 0 0 0 228,251 228,251 Subtotal 198,206 220,220 213,896 218,556 224,708 228,251 1,105,631
1,105,631 Total 198,206 220,220 213,896 218,556 224,708 228,251

DETAILED DATA
287
INCREASING OPPORTUNITY FOR MINORITY AND WOMEN-OWNED BUSINESS ENTERPRISES The New York State Department of Transportation’s Bureau of Civil Rights (CRB) and Minority/Women’s Business Enterprise (M/WBE) has primary oversight responsibility for all civil rights and M/WBE related program functions. This includes oversight of the Department’s Purchasing Unit, within the Office of Contract Management, which has adopted practices which promote flexibility in choosing those M/WBE firms with which they do business. This means reliable, reputable and responsible M/WBE firms are often selected for their quality, service and business pride, rather than relying solely upon lowest bid as the method of vendor selection. We aggressively market partnering with M/WBE firms to our internal customers for those needs costing less than $100,000 (the new discretionary limit for non-competitive purchases from M/WBEs). As part of the outreach process, the Department provides all prospective vendors with an updated version in both paper and electronic form, of the publication “How to do Business with the New York State Department of Transportation.” Only M/WBEs certified by the Empire State Development Corporation Division of Minority and Women Business Development will be used to fulfill goals on 100 percent State-funded projects and/or the procurement of goods and services. The Department actively encourages and utilizes MWBEs in the Federally-Aided construction program. Many of the businesses who are eligible for certification as a Disadvantaged Business Enterprise (DBE) with the NYS Unified Certification Program for federally-financed State Contracts are also eligible for M/WBE certification by the Empire State Development Corporation for state contracting purposes. The Department is one of four agencies in New York who have authority to certify contractors as DBEs (the other three being the Metropolitan Transportation Authority, the Niagara Frontier Transportation Authority, and the Port Authority of NY and NJ). A memorandum of understanding with the Empire State Development Corporation has been proposed which would expedite the review and approval process for firms eligible for certification as both an M/WBE and a DBE. As part of its non-Federal aid construction program, the Department establishes annual goals for M/WBE participation in the construction program and for the general procurement of goods and services for the Department using its Discretionary Purchasing Program. The Department reviews these goals and takes appropriate measures to ensure attainment and/ or remove artificial barriers to such attainment. These goals are based on projected procurement activity, historical revitalization levels and available certified M/WBEs in relation to the projected procurement activity. The 100 percent State funded goals are established at 7 percent MBE and 5 percent WBE. The Department partners regularly with Federal, State, and local agencies, and community-based organizations such as NYS Empire State Development Corporation, the NYS Power Authority, the NYS Thruway Authority and Small Business Association and Association of Minority Enterprises of New York in the presentation of workshops to the NYS M/WBE community at locations throughout the State. Department staff also provide regular guidance and oversight through outreach programs to both Main Office and Regional user organizations promoting the importance of utilization of minority and women-owned business entities.

DETAILED DATA
288
The Civil Rights Bureau has conducted, and will continue to conduct, statewide DBE/M/WBE outreach seminars that will focus on DOT project information in effort to increase and encourage DBE/M/WBE participation on contract and purchase opportunities with NYSDOT. In order to attract maximum participation, a review of the five-year projected construction program is being conducted to highlight projects with the potential to yield a high volume of DBE/M/WBE participation. The Department is also considering a Mentor/Protégé program. In addition to this explanation, the Department of Transportation will provide, beginning July 1, 2007 and annually thereafter, a compliance report beginning with the 2005-06 fiscal year and for each subsequent year thereafter that will include: all the items of information required in accordance with regulations promulgated by the director of the division of minority and women’s business development in the department of economic development under article fifteen-A of the executive law; goals for participation by certified minority or women-owned business enterprises for such fiscal year; and a description of the types of expenditures, projects or contracts.