executing a successful ipo - pwc · 2016-11-11 · executing a successful ipo markets for...
TRANSCRIPT

April 2016
Executing a successful IPO
Markets for technology
www.pwc.com
Helping technology companies assess their choices
Content
2
Foreword 3
Where to list as a technology company? 4
When is the right time for your IPO? 8
What are the key drivers for choosing your listing venue? 9
What are the first steps on the road to a listing? 10
Technology IPO activity – 2011-2015 in review 11
Technology IPO highlights 12
2011-2015 technology IPO activity by listing venue 13
Technology IPO footprint 14
Top 10 technology IPOs and subsector breakdown 15
Global IPO activity – technology in perspective 16
Exchange factsheet 17
NYSE and Nasdaq 18
London Main Market and AIM 24
For more information 30
Methodology 31
PwC contacts 32
| Markets for Technology
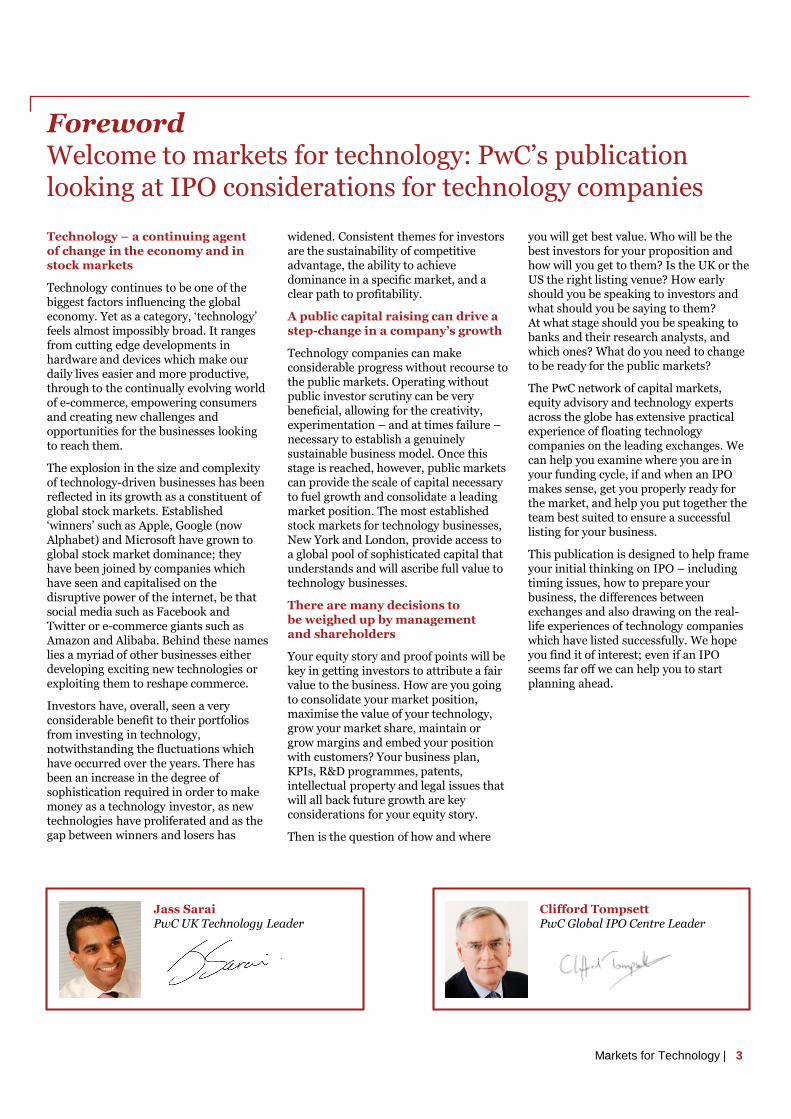
ForewordWelcome to markets for technology: PwC’s publication looking at IPO considerations for technology companies
Technology – a continuing agent of change in the economy and in stock markets
Technology continues to be one of the biggest factors influencing the global economy. Yet as a category, ‘technology’ feels almost impossibly broad. It ranges from cutting edge developments in hardware and devices which make our daily lives easier and more productive, through to the continually evolving world of e-commerce, empowering consumers and creating new challenges and opportunities for the businesses looking to reach them.
The explosion in the size and complexity of technology-driven businesses has been reflected in its growth as a constituent of global stock markets. Established ‘winners’ such as Apple, Google (now Alphabet) and Microsoft have grown to global stock market dominance; they have been joined by companies which have seen and capitalised on the disruptive power of the internet, be that social media such as Facebook and Twitter or e-commerce giants such as Amazon and Alibaba. Behind these names lies a myriad of other businesses either developing exciting new technologies or exploiting them to reshape commerce.
Investors have, overall, seen a very considerable benefit to their portfolios from investing in technology, notwithstanding the fluctuations which have occurred over the years. There has been an increase in the degree of sophistication required in order to make money as a technology investor, as new technologies have proliferated and as the gap between winners and losers has
widened. Consistent themes for investors are the sustainability of competitive advantage, the ability to achieve dominance in a specific market, and a clear path to profitability.
A public capital raising can drive a step-change in a company’s growth
Technology companies can make considerable progress without recourse to the public markets. Operating without public investor scrutiny can be very beneficial, allowing for the creativity, experimentation – and at times failure –necessary to establish a genuinely sustainable business model. Once this stage is reached, however, public markets can provide the scale of capital necessary to fuel growth and consolidate a leading market position. The most established stock markets for technology businesses, New York and London, provide access to a global pool of sophisticated capital that understands and will ascribe full value to technology businesses.
There are many decisions to be weighed up by management and shareholders
Your equity story and proof points will be key in getting investors to attribute a fair value to the business. How are you going to consolidate your market position, maximise the value of your technology, grow your market share, maintain or grow margins and embed your position with customers? Your business plan, KPIs, R&D programmes, patents, intellectual property and legal issues that will all back future growth are key considerations for your equity story.
Then is the question of how and where
you will get best value. Who will be the best investors for your proposition and how will you get to them? Is the UK or the US the right listing venue? How early should you be speaking to investors and what should you be saying to them? At what stage should you be speaking to banks and their research analysts, and which ones? What do you need to change to be ready for the public markets?
The PwC network of capital markets, equity advisory and technology experts across the globe has extensive practical experience of floating technology companies on the leading exchanges. We can help you examine where you are in your funding cycle, if and when an IPO makes sense, get you properly ready for the market, and help you put together the team best suited to ensure a successful listing for your business.
This publication is designed to help frame your initial thinking on IPO – including timing issues, how to prepare your business, the differences between exchanges and also drawing on the real-life experiences of technology companies which have listed successfully. We hope you find it of interest; even if an IPO seems far off we can help you to start planning ahead.
Jass SaraiPwC UK Technology Leader
Clifford TompsettPwC Global IPO Centre Leader
3Markets for Technology |

Where to list as a technology company?New York and London are the most attractive destinations for technology issuers
The US, the UK and China/HK are the most active exchange venues for the technology sector – though mainland Chinese exchanges, Shanghai and Shenzhen, are not open to foreign issuers.
New York remains by far the most popular destination for technology IPOs over the past five years, notably fuelled by Alibaba’s mega-IPO ($22bn - NYSE) in 2014. In addition, in 2012 the US enacted the ‘Jumpstart Our Business Startups’ (JOBS) Act, enabling emerging growth companies (EGCs) to access capital markets and raise capital through an IPO
by reducing the reporting requirements.
However, London has started to challenge the US exchanges following some major IPOs in 2015 including Worldpay, AutoTrader and Sophos.
Asian exchanges have been on the rise during the past five years, with Shenzhen recording the most proceeds, followed by Tokyo then Hong Kong – though the three taken together do not reach half of NYSE proceeds. The Chinese market recovered from 2013 when activity hit record lows following the Chinese
government decision to close the domestic stock exchanges. 2014 technology activity reached highs not seen before, but the trend did not carry on through 2015 due to hectic market conditions and another partial closure of the Chinese markets in the second half of 2015.
At 31 Dec 2015 New York London China
NYSE Nasdaq Main Market AIM Shanghai Shenzhen Hong Kong
Total no. of companies 2,424 2,859 1,321 1,044 1,144 1,762 1,878
Total market cap ($bn) 18,376 7,281 5,728 107 5,105 3,642 2,783
No. of international companies 514 388 460 321 0 0 1,423
No. of technology companies 117 383 40 101 47 182 158
Technology market cap ($bn) 801 3,225 143 9 143 465 270
As a % of total market cap 4% 44% 2% 9% 3% 13% 10%
Technology IPO proceeds
in 2015 ($m)6,510 2,946 7,849 129 607 1,541 1,816
Nasdaq
94 IPOs raised
$35.4bn
Average IPO proceeds
$377m
Largest IPO:
Facebook$16.0bn(2012)
London
22 IPOs raised
$10.8bn
Average IPO proceeds
$492m
Largest IPO:
Worldpay$3.8bn(2015)
NYSE
108 IPOs raised
$48.2bn
Average IPO proceeds
$447m
Largest IPO:
Alibaba$21.8bn(2014)
Top 3 stock exchanges for technology companies (by offering value) – 2011-2015
4 | Markets for Technology

Where to list as a technology company?New York and London have been the most popular destinations over the past 5 years for cross-border technology IPOs
Cross-border activity highlights the prominence of the US as the most popular destination for cross-border technology IPOs, attracting 53 foreign companies in the past five years.
Though 2015 was the second best year for technology IPOs in the past five years (following a buoyant 2014), cross-border
activity was hindered by rising volatility levels and global economic uncertainties. The number of 2015 cross-border IPOs was less than half of those in 2014.
Whilst in some cases a cross-border listing may make sense (for example offering the best comparables and best valuation), it carries an additional layer of
complexity relative to listing on the home market and the implications need to be properly considered.
Cross-border technology IPOs 2011-2015 – the US dominates
“The decision as to where to list a technology business will depend on a variety of factors. Sometimes the location of comparable companies and their valuation will make a US listing an obvious answer –for example, for super high-growth or specialised businesses – or there can be circumstances when having a US-listed share currency is strategically valuable. For others the decision will be more finely-balanced, and there are good examples of large UK technology companies listing successfully on the home market and achieving an attractive valuation relative to global peers.”
James AndersonDirector, Equity Advisory at PwC
20 IPOs($6.3bn)
EMEA
($1.3bn)
11of which are
within EMEA
10
Americas
53($34.8bn)
of which is within
Americas
1
Asia Pacific
($4.1bn)
23
of which are within Asia
Pacific
23
1 IPO($0.1bn)
32 IPOs($28.4bn)
5Markets for Technology |
Where to list as a technology company?Perspectives from technology issuers
• Leading semiconductor designer
• £14.6bn ($21.6bn) market cap at 31 Dec 2015
• UK incorporated
• London listed (IPO in 1998)
• US ADR on Nasdaq (33% of share trading)
• ARM institutional investors:
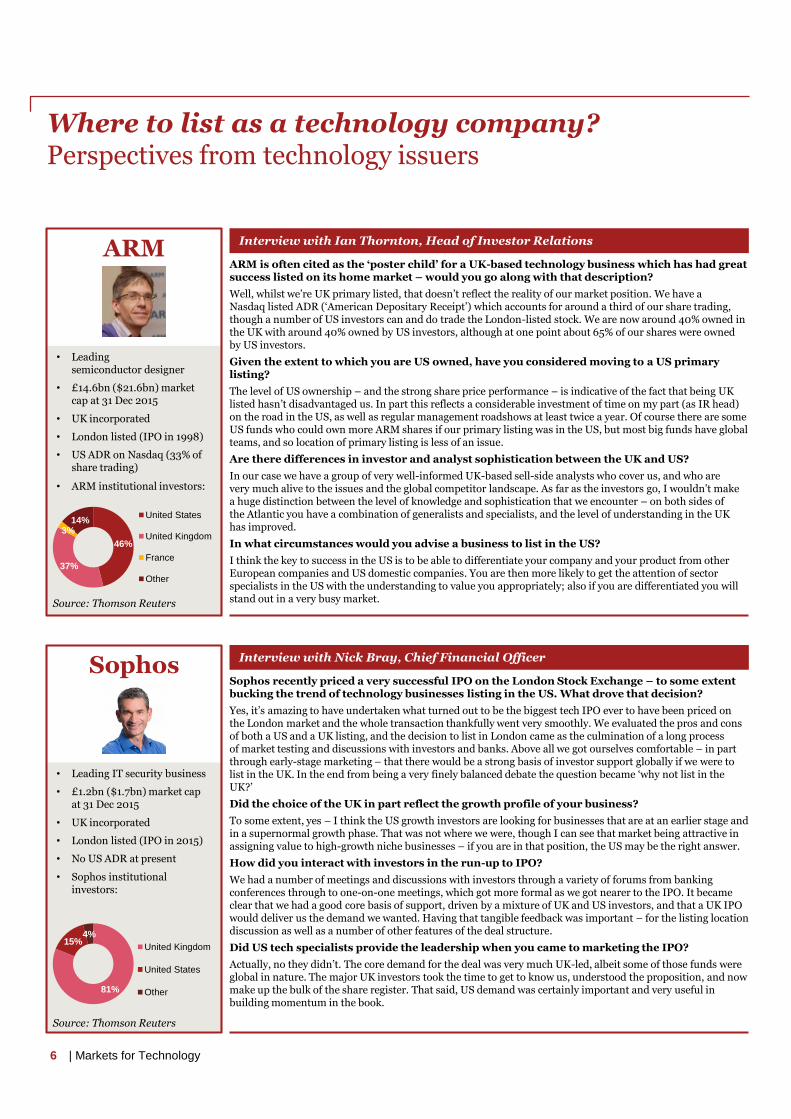
ARM Interview with Ian Thornton, Head of Investor Relations
ARM is often cited as the ‘poster child’ for a UK-based technology business which has had great success listed on its home market – would you go along with that description?
Well, whilst we’re UK primary listed, that doesn’t reflect the reality of our market position. We have a Nasdaq listed ADR (‘American Depositary Receipt’) which accounts for around a third of our share trading, though a number of US investors can and do trade the London-listed stock. We are now around 40% owned in the UK with around 40% owned by US investors, although at one point about 65% of our shares were owned by US investors.
Given the extent to which you are US owned, have you considered moving to a US primary listing?
The level of US ownership – and the strong share price performance – is indicative of the fact that being UK listed hasn’t disadvantaged us. In part this reflects a considerable investment of time on my part (as IR head) on the road in the US, as well as regular management roadshows at least twice a year. Of course there are some US funds who could own more ARM shares if our primary listing was in the US, but most big funds have global teams, and so location of primary listing is less of an issue.
Are there differences in investor and analyst sophistication between the UK and US?
In our case we have a group of very well-informed UK-based sell-side analysts who cover us, and who are very much alive to the issues and the global competitor landscape. As far as the investors go, I wouldn’t make a huge distinction between the level of knowledge and sophistication that we encounter – on both sides of the Atlantic you have a combination of generalists and specialists, and the level of understanding in the UK has improved.
In what circumstances would you advise a business to list in the US?
I think the key to success in the US is to be able to differentiate your company and your product from other European companies and US domestic companies. You are then more likely to get the attention of sector specialists in the US with the understanding to value you appropriately; also if you are differentiated you will stand out in a very busy market.
46%
37%
3%14%
United States
United Kingdom
France
Other
Source: Thomson Reuters
• Leading IT security business
• £1.2bn ($1.7bn) market cap at 31 Dec 2015
• UK incorporated
• London listed (IPO in 2015)
• No US ADR at present
• Sophos institutional investors:
Sophos Interview with Nick Bray, Chief Financial Officer
Sophos recently priced a very successful IPO on the London Stock Exchange – to some extent bucking the trend of technology businesses listing in the US. What drove that decision?
Yes, it’s amazing to have undertaken what turned out to be the biggest tech IPO ever to have been priced on the London market and the whole transaction thankfully went very smoothly. We evaluated the pros and cons of both a US and a UK listing, and the decision to list in London came as the culmination of a long process of market testing and discussions with investors and banks. Above all we got ourselves comfortable – in part through early-stage marketing – that there would be a strong basis of investor support globally if we were to list in the UK. In the end from being a very finely balanced debate the question became ‘why not list in the UK?’
Did the choice of the UK in part reflect the growth profile of your business?
To some extent, yes – I think the US growth investors are looking for businesses that are at an earlier stage and in a supernormal growth phase. That was not where we were, though I can see that market being attractive in assigning value to high-growth niche businesses – if you are in that position, the US may be the right answer.
How did you interact with investors in the run-up to IPO?
We had a number of meetings and discussions with investors through a variety of forums from banking conferences through to one-on-one meetings, which got more formal as we got nearer to the IPO. It became clear that we had a good core basis of support, driven by a mixture of UK and US investors, and that a UK IPO would deliver us the demand we wanted. Having that tangible feedback was important – for the listing location discussion as well as a number of other features of the deal structure.
Did US tech specialists provide the leadership when you came to marketing the IPO?
Actually, no they didn’t. The core demand for the deal was very much UK-led, albeit some of those funds were global in nature. The major UK investors took the time to get to know us, understood the proposition, and now make up the bulk of the share register. That said, US demand was certainly important and very useful in building momentum in the book.
Source: Thomson Reuters
81%
15%4%
United Kingdom
United States
Other
6 | Markets for Technology
Where to list as a technology company?Perspectives from technology issuers
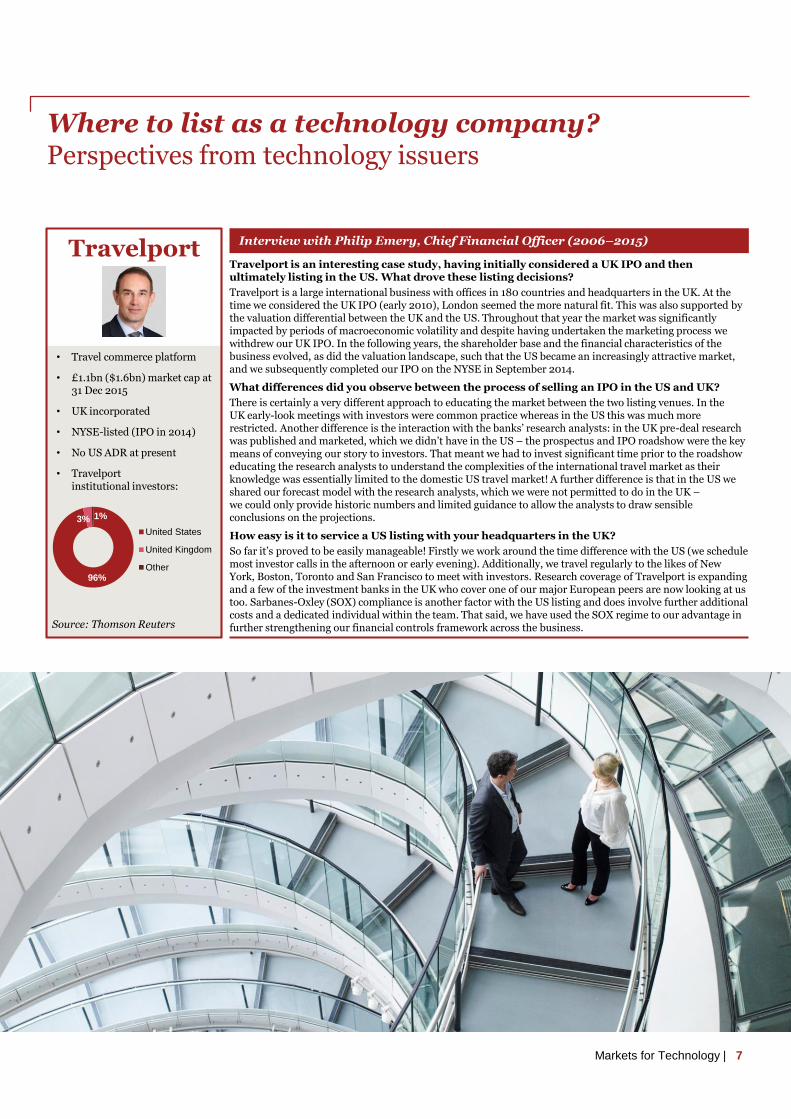
• Travel commerce platform
• £1.1bn ($1.6bn) market cap at 31 Dec 2015
• UK incorporated
• NYSE-listed (IPO in 2014)
• No US ADR at present
• Travelport institutional investors:
Travelport Interview with Philip Emery, Chief Financial Officer (2006–2015)
Travelport is an interesting case study, having initially considered a UK IPO and then ultimately listing in the US. What drove these listing decisions?
Travelport is a large international business with offices in 180 countries and headquarters in the UK. At the time we considered the UK IPO (early 2010), London seemed the more natural fit. This was also supported by the valuation differential between the UK and the US. Throughout that year the market was significantly impacted by periods of macroeconomic volatility and despite having undertaken the marketing process we withdrew our UK IPO. In the following years, the shareholder base and the financial characteristics of the business evolved, as did the valuation landscape, such that the US became an increasingly attractive market, and we subsequently completed our IPO on the NYSE in September 2014.
What differences did you observe between the process of selling an IPO in the US and UK?
There is certainly a very different approach to educating the market between the two listing venues. In the UK early-look meetings with investors were common practice whereas in the US this was much more restricted. Another difference is the interaction with the banks’ research analysts: in the UK pre-deal research was published and marketed, which we didn’t have in the US – the prospectus and IPO roadshow were the key means of conveying our story to investors. That meant we had to invest significant time prior to the roadshow educating the research analysts to understand the complexities of the international travel market as their knowledge was essentially limited to the domestic US travel market! A further difference is that in the US we shared our forecast model with the research analysts, which we were not permitted to do in the UK –we could only provide historic numbers and limited guidance to allow the analysts to draw sensible conclusions on the projections.
How easy is it to service a US listing with your headquarters in the UK?
So far it’s proved to be easily manageable! Firstly we work around the time difference with the US (we schedule most investor calls in the afternoon or early evening). Additionally, we travel regularly to the likes of New York, Boston, Toronto and San Francisco to meet with investors. Research coverage of Travelport is expanding and a few of the investment banks in the UK who cover one of our major European peers are now looking at us too. Sarbanes-Oxley (SOX) compliance is another factor with the US listing and does involve further additional costs and a dedicated individual within the team. That said, we have used the SOX regime to our advantage in further strengthening our financial controls framework across the business.
96%
3% 1%
United States
United Kingdom
Other
7
Source: Thomson Reuters
Markets for Technology |

When is the right time for your IPO?
An IPO is a defining event in the lifecycle of a business, bringing very profound change.
Not only is the process itself very demanding for the management team, but the new world of ‘being public’ and operating with a live share price makes a considerable difference to how your business is managed and how it communicates.
There are, of course, a number of potential advantages to being listed, not least the access to a very substantial capital pool to accelerate growth. However, careful thought needs to be given as to when is the right time to make the transition.
“Whilst some of today’s entrepreneurial companies have aspirations to IPO, others are staying private for longer, or have even discounted listing altogether. This is particularly apparent in the UK fast growth space where Venture Capital has been available for the right businesses and valuations have been increasing.
In addition, UK fast-growing tech companies can now take advantage of different sources of private capital such as peer-to-peer lending and crowdfunding and even the banks are lending more to such businesses than they used to because they see their growth potential and the banks’ attitudes to risk appear to have softened.
However, some of these alternative finance options will not serve the need of businesses as they scale up and when a number of companies reach a certain scale and stage in their development: joining a public market may be the natural next step.”
Brian HendersonPartner, Fast Growing Companies Leader at PwC
Investors have participated in IPOs for technology businesses even at relatively early stages of growth, so there are no hard and fast rules here. However, in order to succeed there needs to be a degree of stability around the core equity story. Is there a clear proof of concept? Is the growth clearly sustainable? Is there a well-founded and credible path to profitability? Will the company have the flexibility it needs to grow and develop under the constraints of reporting to the market on a regular basis?
Founders and CEOs are rightly focused on reducing the cost of capital and minimising dilution. An IPO therefore needs to be weighed up against the range of alternatives available across the capital structure, from more traditional sources of debt funding through to angel investors, venture capital, and crowdfunding. Pre-IPO investors are likely to seek a return in excess of public investors due to higher risk and the degree ofuncertainty of their investment, but against this should be weighed the benefit of not having to undergo the cost and difficulty of regular public reporting; and also the potential non-financial contribution and input from experienced early-stage investors.
Going public and being a listed company will impose a range of demands and constraints on the business. Even in less regulated markets such as London’s AIM market, it will be important to ensure that the systems and controls are in place to report regularly (quarterly in the US,6-monthly in the UK) and to be able to ensure the market is fully informed at all times. This needs to be reviewed before proceeding with the IPO and can require a degree of investmentin order to effect the corporate ‘evolution’. In the case of a US listing there is the additional requirement to comply with the Sarbanes-Oxley (SOX) regime with regard to internal controls and governance.
Is the equity story sufficiently robust for public market investors?
Does an IPO deliver the optimal cost of capital?
Is the business fully ready for the market?
8 | Markets for Technology
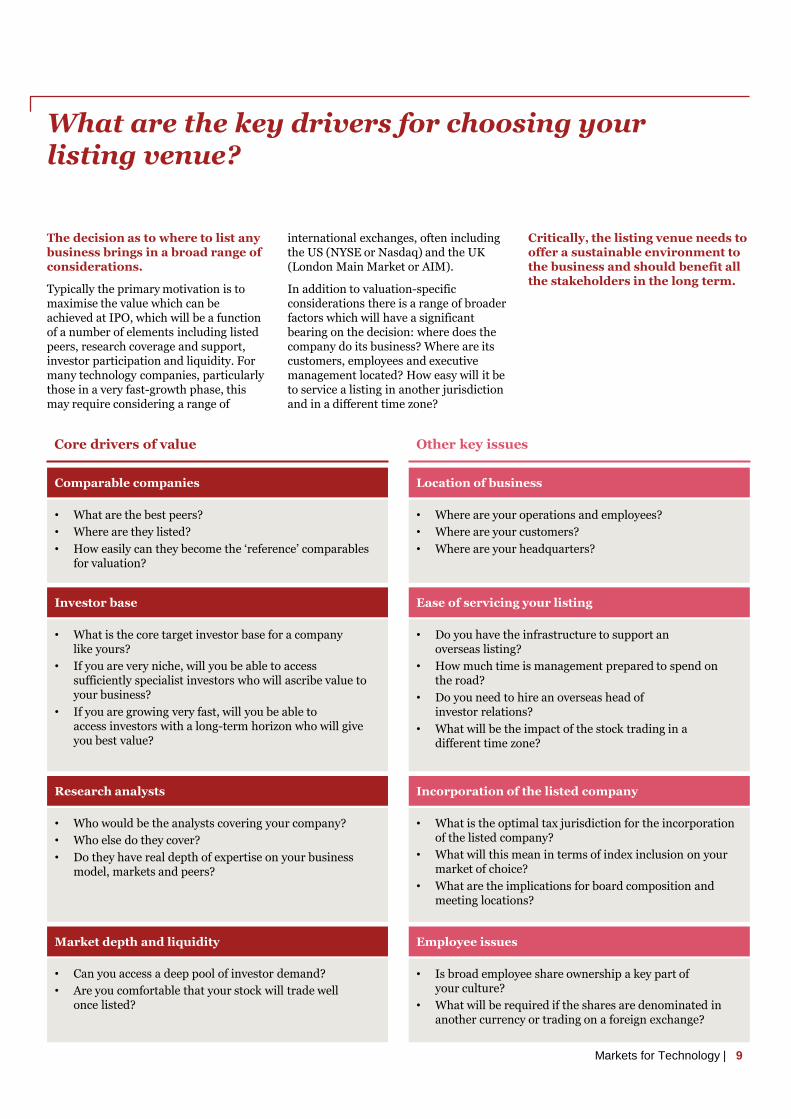
What are the key drivers for choosing your listing venue?
The decision as to where to list any business brings in a broad range of considerations.
Typically the primary motivation is to maximise the value which can be achieved at IPO, which will be a function of a number of elements including listed peers, research coverage and support, investor participation and liquidity. For many technology companies, particularly those in a very fast-growth phase, this may require considering a range of
international exchanges, often including the US (NYSE or Nasdaq) and the UK (London Main Market or AIM).
In addition to valuation-specific considerations there is a range of broader factors which will have a significant bearing on the decision: where does the company do its business? Where are its customers, employees and executive management located? How easy will it be to service a listing in another jurisdiction and in a different time zone?
Critically, the listing venue needs to offer a sustainable environment to the business and should benefit all the stakeholders in the long term.
Core drivers of value Other key issues
Comparable companies
• What are the best peers?
• Where are they listed?
• How easily can they become the ‘reference’ comparables for valuation?
Research analysts
• Who would be the analysts covering your company?
• Who else do they cover?
• Do they have real depth of expertise on your business model, markets and peers?
Investor base
• What is the core target investor base for a company like yours?
• If you are very niche, will you be able to access sufficiently specialist investors who will ascribe value to your business?
• If you are growing very fast, will you be able to access investors with a long-term horizon who will give you best value?
Ease of servicing your listing
• Do you have the infrastructure to support an overseas listing?
• How much time is management prepared to spend on the road?
• Do you need to hire an overseas head of investor relations?
• What will be the impact of the stock trading in a different time zone?
Incorporation of the listed company
• What is the optimal tax jurisdiction for the incorporation of the listed company?
• What will this mean in terms of index inclusion on your market of choice?
• What are the implications for board composition and meeting locations?
• Where are your operations and employees?
• Where are your customers?
• Where are your headquarters?
Location of business
• Can you access a deep pool of investor demand?
• Are you comfortable that your stock will trade well once listed?
Market depth and liquidity
• Is broad employee share ownership a key part of your culture?
• What will be required if the shares are denominated in another currency or trading on a foreign exchange?
Employee issues
9Markets for Technology |
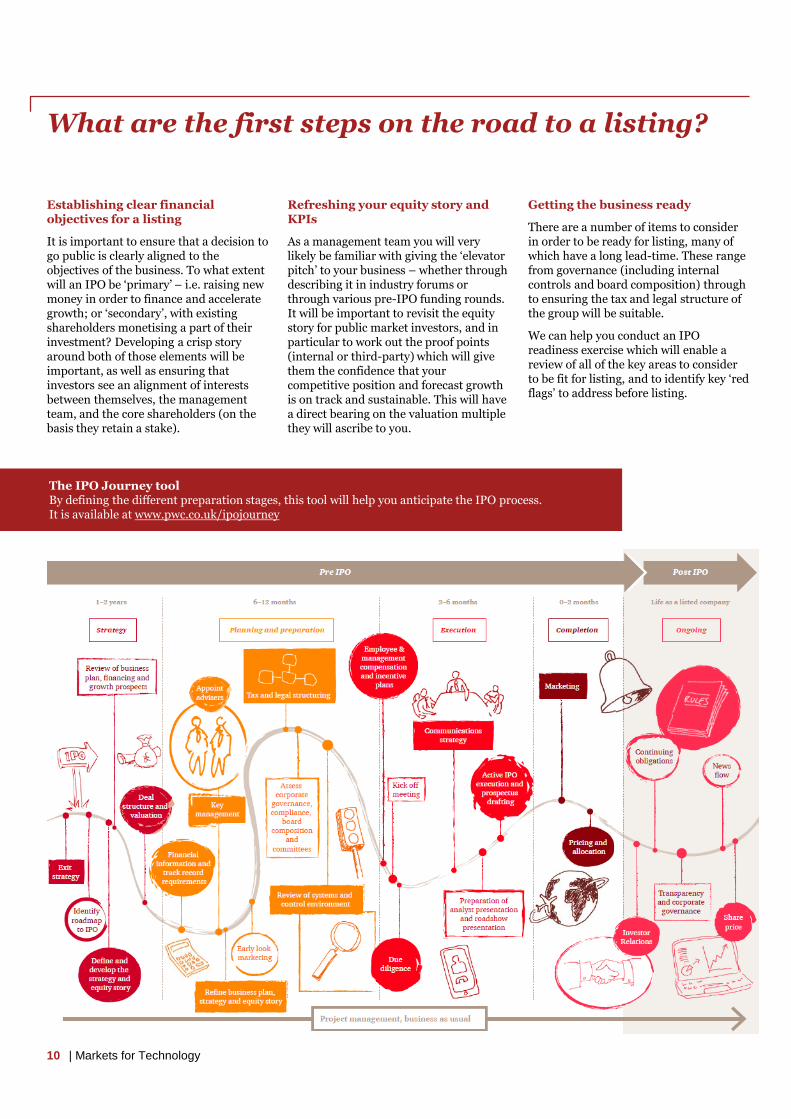
What are the first steps on the road to a listing?
Establishing clear financial objectives for a listing
It is important to ensure that a decision to go public is clearly aligned to the objectives of the business. To what extent will an IPO be ‘primary’ – i.e. raising new money in order to finance and accelerate growth; or ‘secondary’, with existing shareholders monetising a part of their investment? Developing a crisp story around both of those elements will be important, as well as ensuring that investors see an alignment of interests between themselves, the management team, and the core shareholders (on the basis they retain a stake).
Refreshing your equity story and KPIs
As a management team you will very likely be familiar with giving the ‘elevator pitch’ to your business – whether through describing it in industry forums or through various pre-IPO funding rounds. It will be important to revisit the equity story for public market investors, and in particular to work out the proof points (internal or third-party) which will give them the confidence that your competitive position and forecast growth is on track and sustainable. This will have a direct bearing on the valuation multiple they will ascribe to you.
Getting the business ready
There are a number of items to consider in order to be ready for listing, many of which have a long lead-time. These range from governance (including internal controls and board composition) through to ensuring the tax and legal structure of the group will be suitable.
We can help you conduct an IPO readiness exercise which will enable a review of all of the key areas to consider to be fit for listing, and to identify key ‘red flags’ to address before listing.
10 | Markets for Technology
The IPO Journey toolBy defining the different preparation stages, this tool will help you anticipate the IPO process.It is available at www.pwc.co.uk/ipojourney

Technology IPO activity –2011-2015 in review
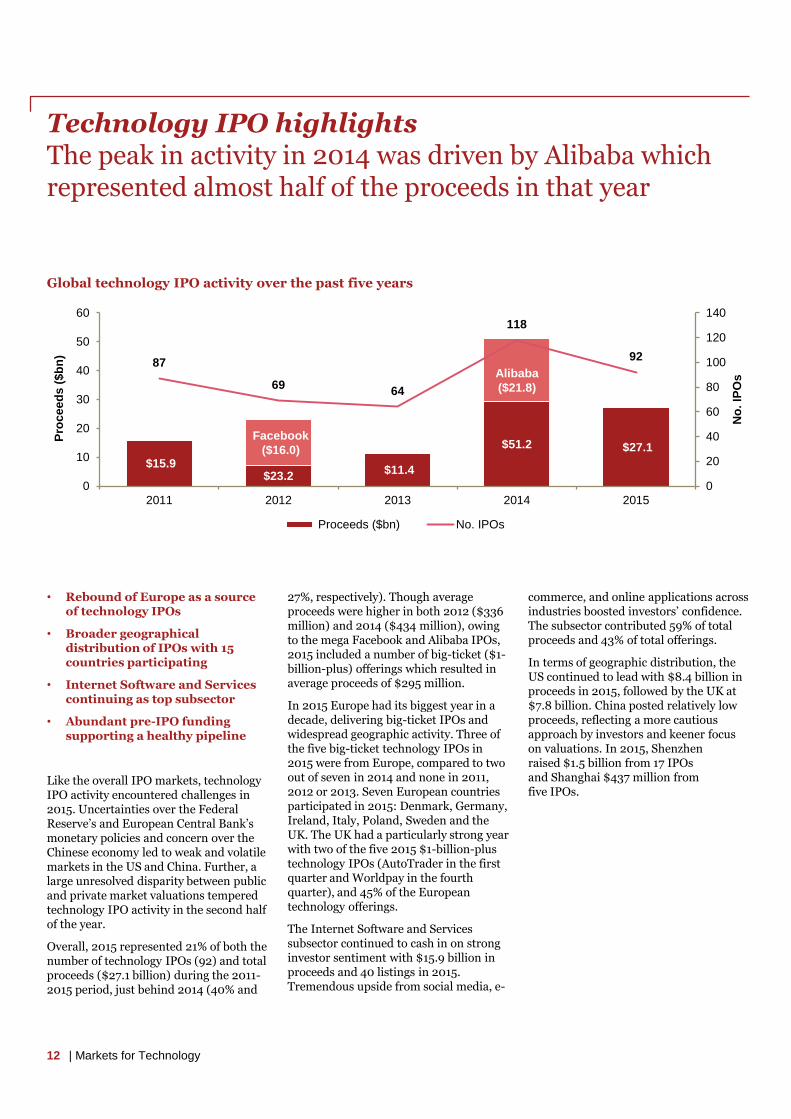
Technology IPO highlightsThe peak in activity in 2014 was driven by Alibaba which represented almost half of the proceeds in that year
Global technology IPO activity over the past five years
• Rebound of Europe as a source of technology IPOs
• Broader geographical distribution of IPOs with 15 countries participating
• Internet Software and Services continuing as top subsector
• Abundant pre-IPO funding supporting a healthy pipeline
Like the overall IPO markets, technology IPO activity encountered challenges in 2015. Uncertainties over the Federal Reserve’s and European Central Bank’s monetary policies and concern over the Chinese economy led to weak and volatile markets in the US and China. Further, a large unresolved disparity between public and private market valuations tempered technology IPO activity in the second half of the year.
Overall, 2015 represented 21% of both the number of technology IPOs (92) and total proceeds ($27.1 billion) during the 2011-2015 period, just behind 2014 (40% and
27%, respectively). Though average proceeds were higher in both 2012 ($336 million) and 2014 ($434 million), owing to the mega Facebook and Alibaba IPOs, 2015 included a number of big-ticket ($1-billion-plus) offerings which resulted in average proceeds of $295 million.
In 2015 Europe had its biggest year in a decade, delivering big-ticket IPOs and widespread geographic activity. Three of the five big-ticket technology IPOs in 2015 were from Europe, compared to two out of seven in 2014 and none in 2011, 2012 or 2013. Seven European countries participated in 2015: Denmark, Germany, Ireland, Italy, Poland, Sweden and the UK. The UK had a particularly strong year with two of the five 2015 $1-billion-plus technology IPOs (AutoTrader in the first quarter and Worldpay in the fourth quarter), and 45% of the European technology offerings.
The Internet Software and Services subsector continued to cash in on strong investor sentiment with $15.9 billion in proceeds and 40 listings in 2015. Tremendous upside from social media, e-
commerce, and online applications across industries boosted investors’ confidence. The subsector contributed 59% of total proceeds and 43% of total offerings.
In terms of geographic distribution, the US continued to lead with $8.4 billion in proceeds in 2015, followed by the UK at $7.8 billion. China posted relatively low proceeds, reflecting a more cautious approach by investors and keener focus on valuations. In 2015, Shenzhen raised $1.5 billion from 17 IPOs and Shanghai $437 million from five IPOs.
$15.9 $23.2
$11.4
$51.2 $27.1
87
6964
118
92
0
20
40
60
80
100
120
140
0
10
20
30
40
50
60
2011 2012 2013 2014 2015
No
. IP
Os
Pro
ce
ed
s (
$b
n)
Proceeds ($bn) No. IPOs
($16.0)
Alibaba
($21.8)
12 | Markets for Technology
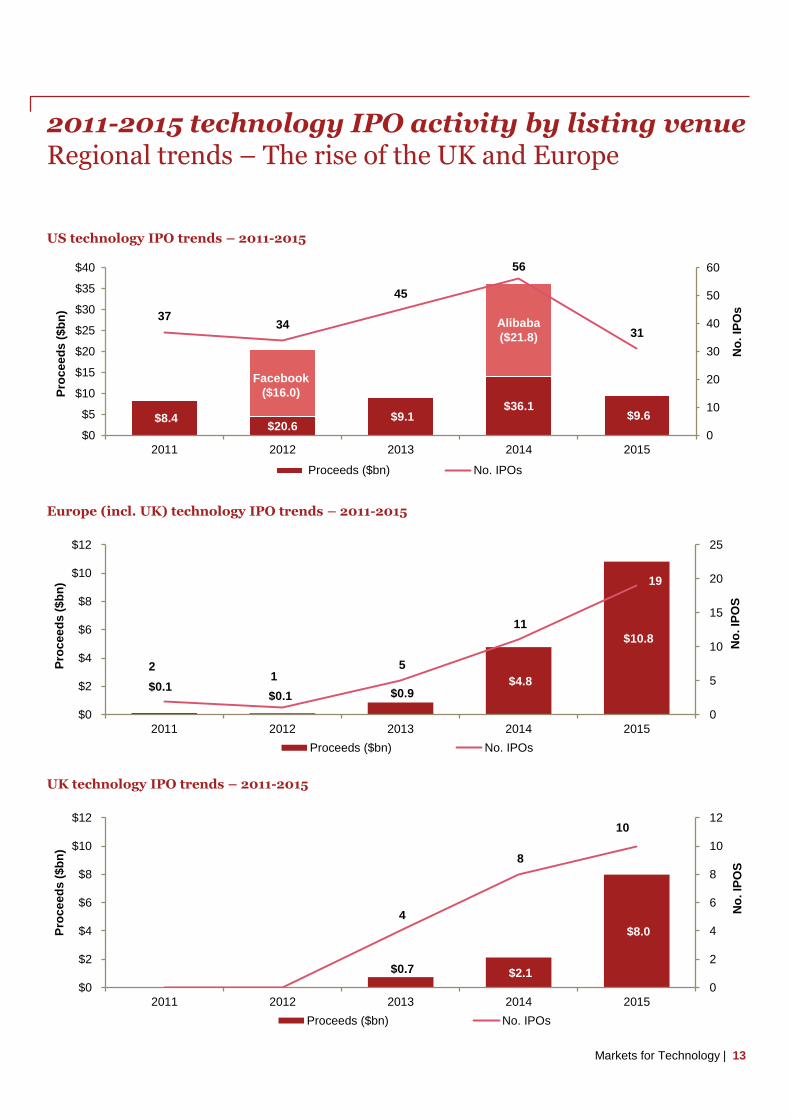
2011-2015 technology IPO activity by listing venueRegional trends – The rise of the UK and Europe
US technology IPO trends – 2011-2015
Europe (incl. UK) technology IPO trends – 2011-2015
UK technology IPO trends – 2011-2015
$0.1 $0.1 $0.9
$4.8
$10.8
2 1
5
11
19
0
5
10
15
20
25
2011 2012 2013 2014 2015
$0
$2
$4
$6
$8
$10
$12
Proceeds ($bn) No. IPOs
Pro
ce
ed
s (
$b
n)
No
. IP
OS
$0.7 $2.1
$8.0
4
8
10
0
2
4
6
8
10
12
2011 2012 2013 2014 2015
$0
$2
$4
$6
$8
$10
$12
Proceeds ($bn) No. IPOs
Pro
ce
ed
s (
$b
n)
No
. IP
OS
$8.4 $20.6
$9.1 $36.1
$9.6
3734
45
56
31
0
10
20
30
40
50
60
$0
$5
$10
$15
$20
$25
$30
$35
$40
2011 2012 2013 2014 2015
No
. IP
Os
Pro
ce
ed
s (
$b
n)
Proceeds ($bn) No. IPOs
($16.0)
Alibaba
($21.8)
13Markets for Technology |
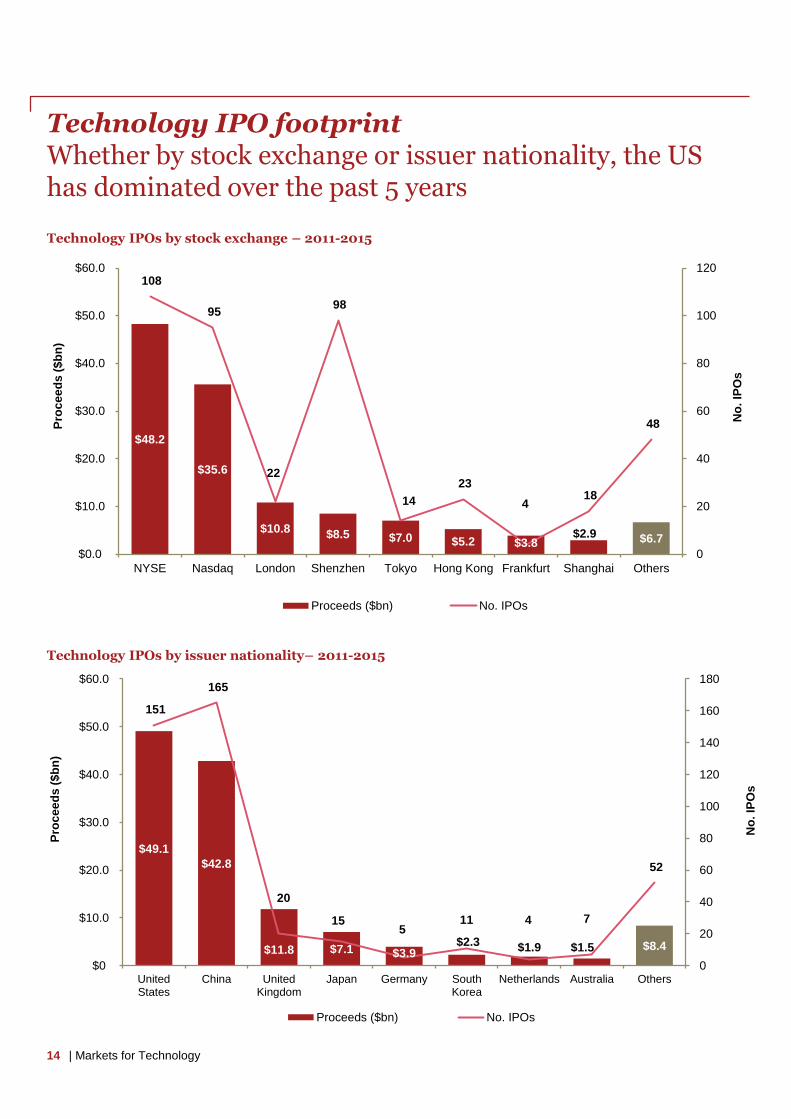
Technology IPO footprintWhether by stock exchange or issuer nationality, the US has dominated over the past 5 years
Technology IPOs by stock exchange – 2011-2015
Technology IPOs by issuer nationality– 2011-2015
$48.2
$35.6
$10.8 $8.5 $7.0 $5.2 $3.8$2.9 $6.7
108
95
22
98
14
23
4 18
48
0
20
40
60
80
100
120
NYSE Nasdaq London Shenzhen Tokyo Hong Kong Frankfurt Shanghai Others
$0.0
$10.0
$20.0
$30.0
$40.0
$50.0
$60.0
Proceeds ($bn) No. IPOs
Pro
ce
ed
s (
$b
n)
No
. IP
Os
$49.1
$42.8
$11.8 $7.1 $3.9$2.3 $1.9 $1.5 $8.4
151
165
20
15 5
11 4 7
52
0
20
40
60
80
100
120
140
160
180
UnitedStates
China UnitedKingdom
Japan Germany SouthKorea
Netherlands Australia Others $0
$10.0
$20.0
$30.0
$40.0
$50.0
$60.0
Proceeds ($bn) No. IPOs
Pro
ce
ed
s (
$b
n)
No
. IP
Os
14 | Markets for Technology
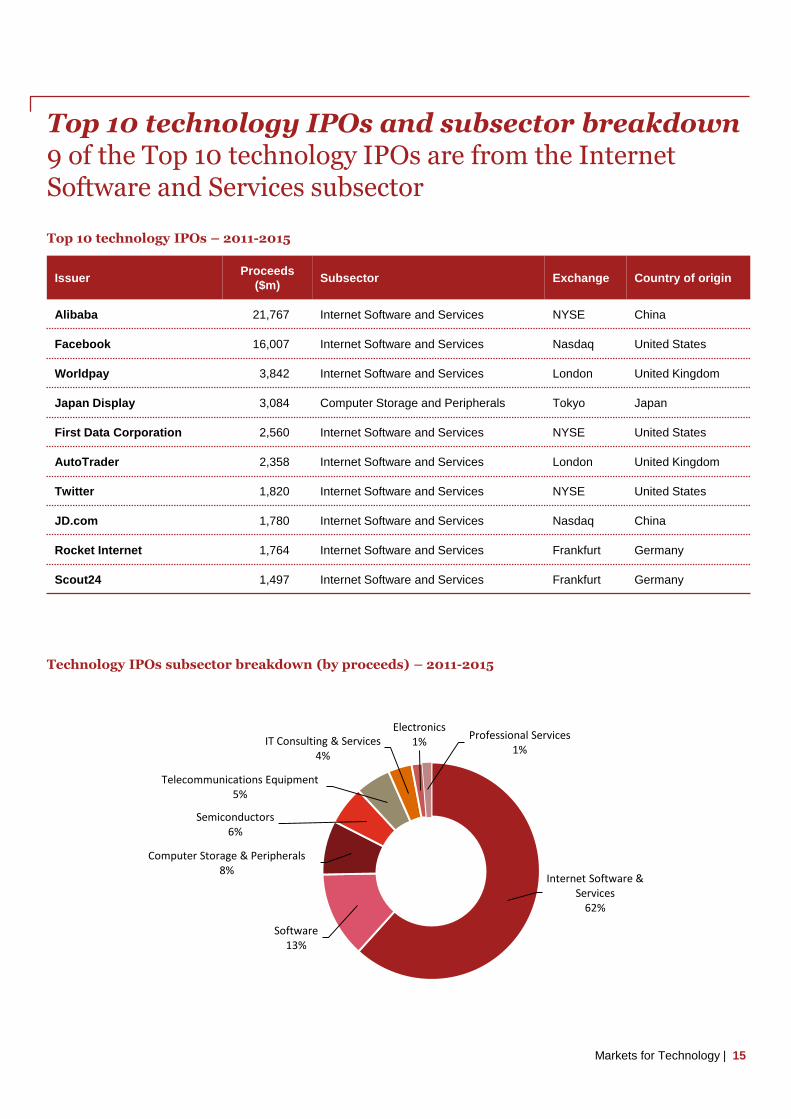
Top 10 technology IPOs and subsector breakdown9 of the Top 10 technology IPOs are from the Internet Software and Services subsector
Top 10 technology IPOs – 2011-2015
IssuerProceeds
($m)Subsector Exchange Country of origin
Alibaba 21,767 Internet Software and Services NYSE China
Facebook 16,007 Internet Software and Services Nasdaq United States
Worldpay 3,842 Internet Software and Services London United Kingdom
Japan Display 3,084 Computer Storage and Peripherals Tokyo Japan
First Data Corporation 2,560 Internet Software and Services NYSE United States
AutoTrader 2,358 Internet Software and Services London United Kingdom
Twitter 1,820 Internet Software and Services NYSE United States
JD.com 1,780 Internet Software and Services Nasdaq China
Rocket Internet 1,764 Internet Software and Services Frankfurt Germany
Scout24 1,497 Internet Software and Services Frankfurt Germany
Technology IPOs subsector breakdown (by proceeds) – 2011-2015
Internet Software & Services
62%
Software13%
Computer Storage & Peripherals8%
Semiconductors6%
Telecommunications Equipment5%
IT Consulting & Services4%
Electronics1%
Professional Services1%
15Markets for Technology |

Global IPO activity – Technology in perspectiveThe relative decrease of technology IPO activity in 2015 is in line with the wider IPO market
Global IPO activity trends – 2011-2015 (all sectors)
Global IPO activity by exchange nationality – 2011-2015 (all sectors)
Global IPO activity by sector – 2011-2015
$178.3$140.6
$194.6
$272.5
$200.7
1,036
719
858
1,154 1,144
0
400
800
1,200
0bn
100bn
200bn
300bn
2011 2012 2013 2014 2015
No
. IP
Os
Pro
ce
ed
s (
$b
n)
Proceeds ($bn) No. IPOs
$40.4$25.8 $24.2
$19.5 $15.7 $9.5 $7.9 $7.5 $6.3
$47.4190 219
120 88
98
13 17 8
92
501
0 50 100 150 200 250 300 350 400 450 500 550
UnitedStates
China Hong Kong UnitedKingdom
Japan Spain Germany Netherlands Australia Others$0
$10
$20
$30
$40
$50
Proceeds ($bn) No. IPOs
Pro
ce
ed
s (
$b
n)
No
. IP
OS
35%
17%11%
9%
8%
7%
5%4%
2% 2%
By proceeds
Financials
Consumer Services
Industrials
Oil & Gas
Health Care
Technology
Consumer Goods
Basic Materials
Telecommunications
Utilities
25%
13%
14%6%
15%
11%
9%
5%1%1%
By volume
16 | Markets for Technology

Exchange factsheetUS – NYSE and NasdaqUK – London Main Market and AIM

NYSE and NasdaqExchange overview
Spread of companies by market capitalisation at 31 Dec 2015 – Nasdaq and NYSE
0
200
400
600
800
1,000
1,200
1,400
0-5 5-10 10-25 25-50 50-100 100-250 250-500 500-1,000 Over 1,000
No
. c
om
pa
nie
s
Market cap range ($m)
Nasdaq NYSE
18
NYSE and Nasdaq are two distinct markets.
NYSE is by far the world’s largest stock exchange by market capitalisation of its listed companies. The NYSE is owned by Intercontinental Exchange.
Nasdaq is operated by Nasdaq Inc. and traditionally attracts smaller, high growth companies seeking access to a public market.
| Markets for Technology
23%
7%
39%
4%
10%
11%
1% 4% 1%
35%
10%
4%5%12%
14%
4%
15%
1%
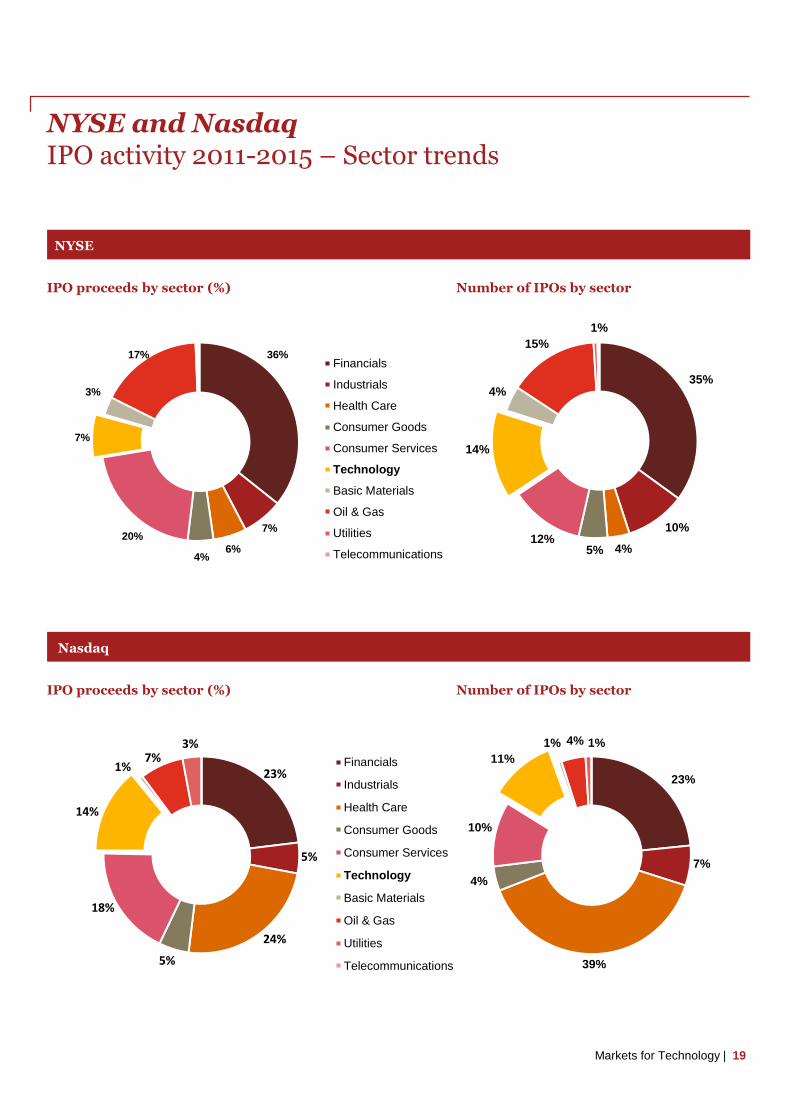
NYSE and NasdaqIPO activity 2011-2015 – Sector trends
NYSE
IPO proceeds by sector (%)
36%
7%
6%4%
20%
7%
3%
17%Financials
Industrials
Health Care
Consumer Goods
Consumer Services
Technology
Basic Materials
Oil & Gas
Utilities
Telecommunications
Number of IPOs by sector
Nasdaq
IPO proceeds by sector (%)
23%
5%
24%
5%
18%
14%
1%7%
3%
Financials
Industrials
Health Care
Consumer Goods
Consumer Services
Technology
Basic Materials
Oil & Gas
Utilities
Telecommunications
Number of IPOs by sector
19Markets for Technology |

NYSE and NasdaqTop 5 technology IPOs 2011-2015
NYSE
Date Issuer Proceeds
($m)
Subsector Country of origin
Sep-14 Alibaba 21,767 Internet Software and Services China
Oct-15 First Data Corporation 2,560 Internet Software and Services United States
Nov-13 Twitter 1,820 Internet Software and Services United States
Apr-14 IMS 1,495 IT Consulting and Services United States
Jul-14 Mobileye 890 Software Israel
Nasdaq
Date Issuer Proceeds
($m)
Subsector Country of origin
May-12 Facebook 16,007 Internet Software and Services United States
May-14 JD.com 1,780 Internet Software and Services China
May-11 Yandex 1,304 Internet Software and Services Netherlands
Jun-14 Markit 1,283 Software United Kingdom
Dec-11 Zynga 1,000 Internet Software and Services United States
20 | Markets for Technology

NYSE and NasdaqThe JOBS Act
Focus: the JOBS Act is designed to spur IPO activity
• The ‘going public’ process changed significantly with the April 2012 enactment of the Jumpstart Our Business Startups (JOBS) Act.
• The JOBS Act is designed to spur IPO activity by providing an on-ramp for certain companies, specifically called emerging growth companies (EGCs), to access capital markets and raise capital through an IPO by reducing the reporting requirements. EGCs now feature prominently in the IPO world representing over 80% percent of the IPOs filed.
• Principal goal is to increase American job creation and economic growth.
• The 2 main thrusts of the Act are to:
- create an 'IPO on-ramp' which reduces the filing and disclosure burdens associated with undertaking an IPO; and
- provide for easier and broader access to capital markets.
• EGCs are broadly defined as:
- < $1 billion in gross revenue;
- < $1 billion in issues of non-convertible debt in a 3-year period; and
- generally <$700 million in public float (not a large accelerated filer).
• The JOBS Act applies to EGCs for a maximum of five years.
21Markets for Technology |

NYSE and NasdaqEligibility requirements
NYSE Nasdaq
Financial eligibility test
Meet one of the financial criteria:
i) Earnings test
Income before tax from continuing operations and after minority interest, amortisation and equity in the earnings or losses of investees (subject to certain adjustments) must total at least:
• $10m in the aggregate for the last three fiscal years, together with a minimum of $2m in each of the two most recent fiscal years, and positive amounts in all three years
or
• if the company had a loss in the third year, then $12m in the aggregate for the last three fiscal years, together with a minimum of $5m in the most recent fiscal year and $2m in the next most recent fiscal year.
ii) Earnings test for EGCs
Income before tax from continuing operations and after minority interest, amortisation and equity in the earnings or losses of investees (subject tocertain adjustments) must total at least $10m in the aggregate for the last two fiscal years, together with a minimum of $2m in both years.
iii) Global market capitalisation test
Issuer must have at least $200m in global market cap.
Meet one of the financial criteria:
i) • Minimum income from continuing operations before income taxes of:
- $11m over the prior three fiscal years in aggregate, and
- $2.2m in each of the two most recent fiscal years, and
• Positive income from continuing operations before income taxes in each of the prior three fiscal years.
ii) • Minimum total revenue in the previous fiscal year – $110m,
• Minimum average market cap over the prior 12 months – $550m,
• Minimum cash flows of $27.5m over the prior three fiscal years in aggregate, and
• Positive cash flows in each of the prior three fiscal years.
iii) •Minimum total revenue in the previous fiscal year – $90m, and
• Minimum average market cap over the prior 12 months – $850m.
iv) • Minimum average market cap at the time of listing – $160m, and
• $80m of total assets and $55m of stockholders’ equity in the most recent publicly reported financial statements.
Audited history • 3 years audited accounts
• For emerging growth companies (EGCs) under the JOBS Act, 2 years of audited financial statements are permitted
• 3 years audited accounts
• For emerging growth companies (EGCs) under the JOBS Act, 2 years of audited financial statements are permitted
Applicable GAAP US GAAP or IFRS. US GAAP or IFRS
Min free float (or public float)
• $40m for IPOs
• $100m for all other listings
• 1,250,000 shares
• $45m market value of publicly held shares or market value of publicly held shares and stockholders’ equity
22 | Markets for Technology
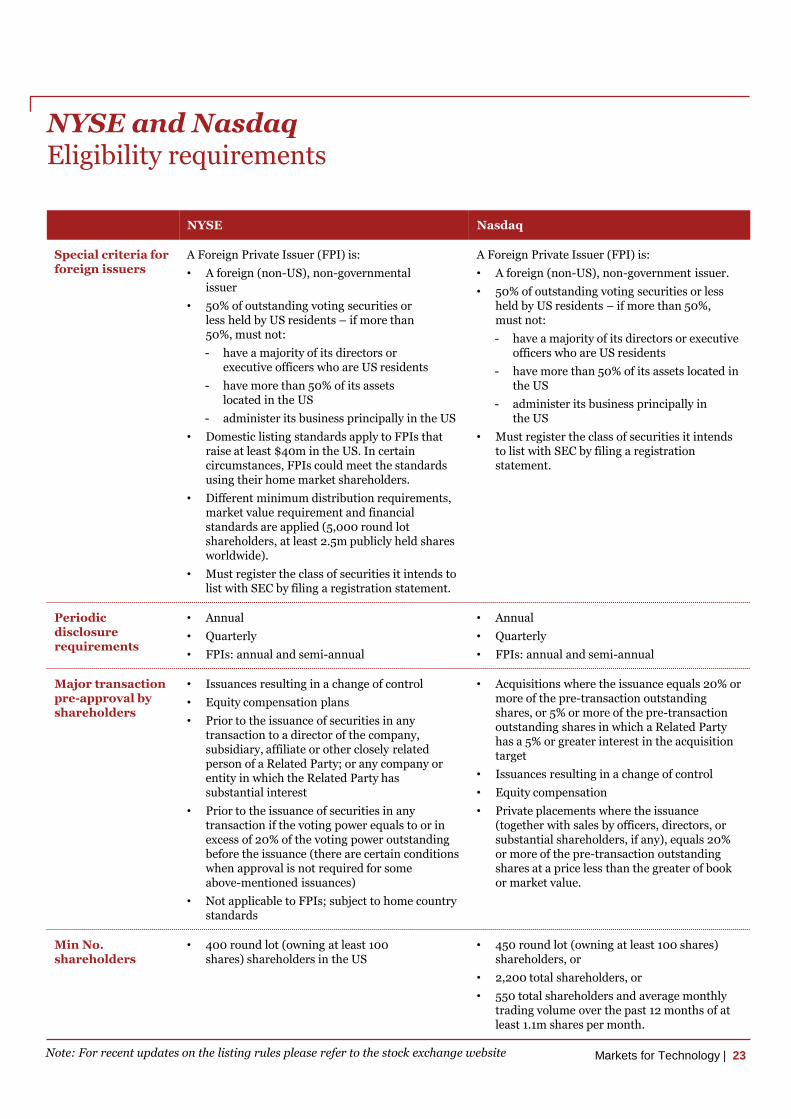
NYSE and NasdaqEligibility requirements
23
NYSE Nasdaq
Special criteria for foreign issuers
A Foreign Private Issuer (FPI) is:
• A foreign (non-US), non-governmentalissuer
• 50% of outstanding voting securities orless held by US residents – if more than50%, must not:
- have a majority of its directors orexecutive officers who are US residents
- have more than 50% of its assetslocated in the US
- administer its business principally in the US
• Domestic listing standards apply to FPIs that raise at least $40m in the US. In certain circumstances, FPIs could meet the standards using their home market shareholders.
• Different minimum distribution requirements, market value requirement and financial standards are applied (5,000 round lot shareholders, at least 2.5m publicly held shares worldwide).
• Must register the class of securities it intends to list with SEC by filing a registration statement.
A Foreign Private Issuer (FPI) is:
• A foreign (non-US), non-government issuer.
• 50% of outstanding voting securities or lessheld by US residents – if more than 50%,must not:
- have a majority of its directors or executive officers who are US residents
- have more than 50% of its assets located in the US
- administer its business principally in the US
• Must register the class of securities it intends to list with SEC by filing a registration statement.
Periodic disclosure requirements
• Annual
• Quarterly
• FPIs: annual and semi-annual
• Annual
• Quarterly
• FPIs: annual and semi-annual
Major transaction pre-approval by shareholders
• Issuances resulting in a change of control
• Equity compensation plans
• Prior to the issuance of securities in any transaction to a director of the company, subsidiary, affiliate or other closely related person of a Related Party; or any company or entity in which the Related Party has substantial interest
• Prior to the issuance of securities in any transaction if the voting power equals to or in excess of 20% of the voting power outstanding before the issuance (there are certain conditions when approval is not required for someabove-mentioned issuances)
• Not applicable to FPIs; subject to home country standards
• Acquisitions where the issuance equals 20% or more of the pre-transaction outstanding shares, or 5% or more of the pre-transaction outstanding shares in which a Related Party has a 5% or greater interest in the acquisition target
• Issuances resulting in a change of control
• Equity compensation
• Private placements where the issuance (together with sales by officers, directors, or substantial shareholders, if any), equals 20% or more of the pre-transaction outstanding shares at a price less than the greater of book or market value.
Min No. shareholders
• 400 round lot (owning at least 100 shares) shareholders in the US
• 450 round lot (owning at least 100 shares) shareholders, or
• 2,200 total shareholders, or
• 550 total shareholders and average monthly trading volume over the past 12 months of at least 1.1m shares per month.
Markets for Technology | Note: For recent updates on the listing rules please refer to the stock exchange website
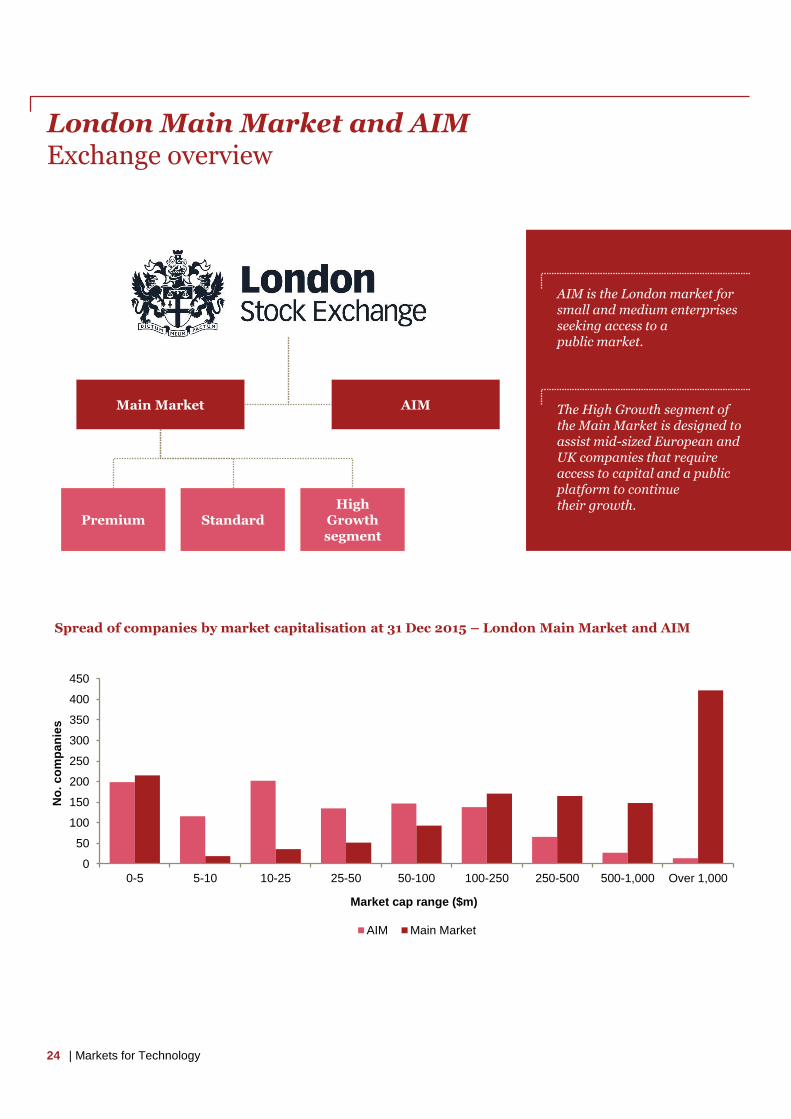
London Main Market and AIMExchange overview
AIMMain Market
PremiumHigh
Growth segment
Standard
AIM is the London market for small and medium enterprises seeking access to a public market.
The High Growth segment of the Main Market is designed to assist mid-sized European and UK companies that require access to capital and a public platform to continue their growth.
Spread of companies by market capitalisation at 31 Dec 2015 – London Main Market and AIM
0
50
100
150
200
250
300
350
400
450
0-5 5-10 10-25 25-50 50-100 100-250 250-500 500-1,000 Over 1,000
No
. c
om
pa
nie
s
Market cap range ($m)
AIM Main Market
24 | Markets for Technology

17%
11%
12%
7%19%
13%
10%
9%2%
58%
8%
5%
5%
12%
3% 3% 4% 1% 1%
London Main Market and AIMIPO activity 2011-2015 – Sector trends
London Main Market
IPO proceeds by sector (%) Number of IPOs by sector
London AIM
IPO proceeds by sector (%) Number of IPOs by sector
25
36%
13%3%4%
20%
2%
14%
5%3% Financials
Industrials
Health Care
Consumer Goods
Consumer Services
Technology
Basic Materials
Oil & Gas
Utilities
Telecommunications
21%
17%
10%4%
27%
5%
2%
9%
5%
Financials
Industrials
Health Care
Consumer Goods
Consumer Services
Technology
Basic Materials
Oil & Gas
Utilities
Telecommunications
Markets for Technology |
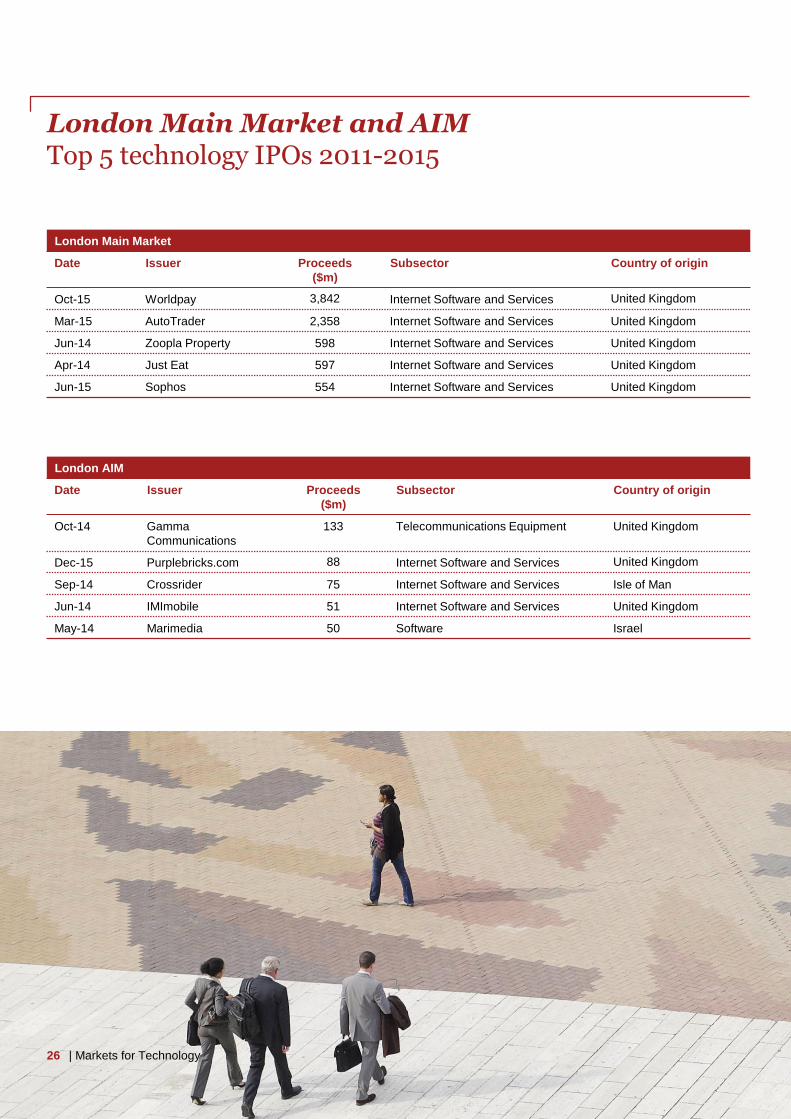
London Main Market and AIMTop 5 technology IPOs 2011-2015
London Main Market
Date Issuer Proceeds
($m)
Subsector Country of origin
Oct-15 Worldpay 3,842 Internet Software and Services United Kingdom
Mar-15 AutoTrader 2,358 Internet Software and Services United Kingdom
Jun-14 Zoopla Property 598 Internet Software and Services United Kingdom
Apr-14 Just Eat 597 Internet Software and Services United Kingdom
Jun-15 Sophos 554 Internet Software and Services United Kingdom
London AIM
Date Issuer Proceeds
($m)
Subsector Country of origin
Oct-14 Gamma
Communications
133 Telecommunications Equipment United Kingdom
Dec-15 Purplebricks.com 88 Internet Software and Services United Kingdom
Sep-14 Crossrider 75 Internet Software and Services Isle of Man
Jun-14 IMImobile 51 Internet Software and Services United Kingdom
May-14 Marimedia 50 Software Israel
26 | Markets for Technology
London Main Market and AIMThe High Growth segment of the Main Market
Focus: The High Growth segment of London Main Market
• It is a launch pad for European and UK companies that may not meet the eligibility criteria to join the Premium segment of the Main Market at the time of admission, in particular the free float requirement. They are larger than a typical AIM company, and have longer term aspirations to join the Premium segment of the Main Market.
• Companies enjoy the significant benefits of being listed on a London market – in particular gaining access to capital on an ongoing basis through a diverse and deep investor pool; ability to use shares as acquisition currency; access to an expert advisory community to help gain profile; and a regulatory framework that provides investor confidence without proving burdensome.
• To qualify for the High Growth segment, a company needs to be a revenue generating business with a historic revenue growth (CAGR) of at least 20% over a three-year period.
• Relaxed free float requirement at admission enables founder shareholders, including venture and private equity investors, to float a smaller percentage of the company at an earlier stage of development, as the company transitions from being private to becoming a public company.
27Markets for Technology |
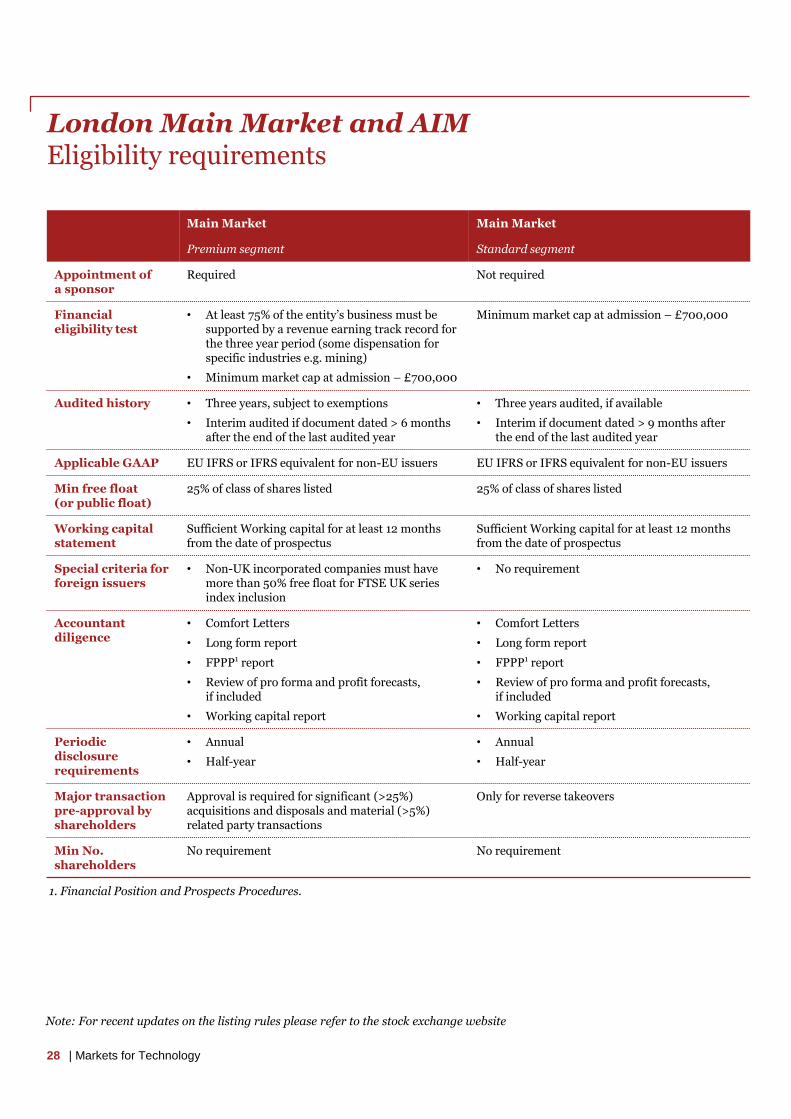
London Main Market and AIMEligibility requirements
Main Market Main Market
Premium segment Standard segment
Appointment of a sponsor
Required Not required
Financial eligibility test
• At least 75% of the entity’s business must be supported by a revenue earning track record for the three year period (some dispensation for specific industries e.g. mining)
• Minimum market cap at admission – £700,000
Minimum market cap at admission – £700,000
Audited history • Three years, subject to exemptions
• Interim audited if document dated > 6 months after the end of the last audited year
• Three years audited, if available
• Interim if document dated > 9 months after the end of the last audited year
Applicable GAAP EU IFRS or IFRS equivalent for non-EU issuers EU IFRS or IFRS equivalent for non-EU issuers
Min free float (or public float)
25% of class of shares listed 25% of class of shares listed
Working capital statement
Sufficient Working capital for at least 12 months from the date of prospectus
Sufficient Working capital for at least 12 months from the date of prospectus
Special criteria for foreign issuers
• Non-UK incorporated companies must have more than 50% free float for FTSE UK series index inclusion
• No requirement
Accountant diligence
• Comfort Letters
• Long form report
• FPPP1 report
• Review of pro forma and profit forecasts, if included
• Working capital report
• Comfort Letters
• Long form report
• FPPP1 report
• Review of pro forma and profit forecasts, if included
• Working capital report
Periodic disclosure requirements
• Annual
• Half-year
• Annual
• Half-year
Major transaction pre-approval by shareholders
Approval is required for significant (>25%) acquisitions and disposals and material (>5%) related party transactions
Only for reverse takeovers
Min No. shareholders
No requirement No requirement
1. Financial Position and Prospects Procedures.
28 | Markets for Technology
Note: For recent updates on the listing rules please refer to the stock exchange website
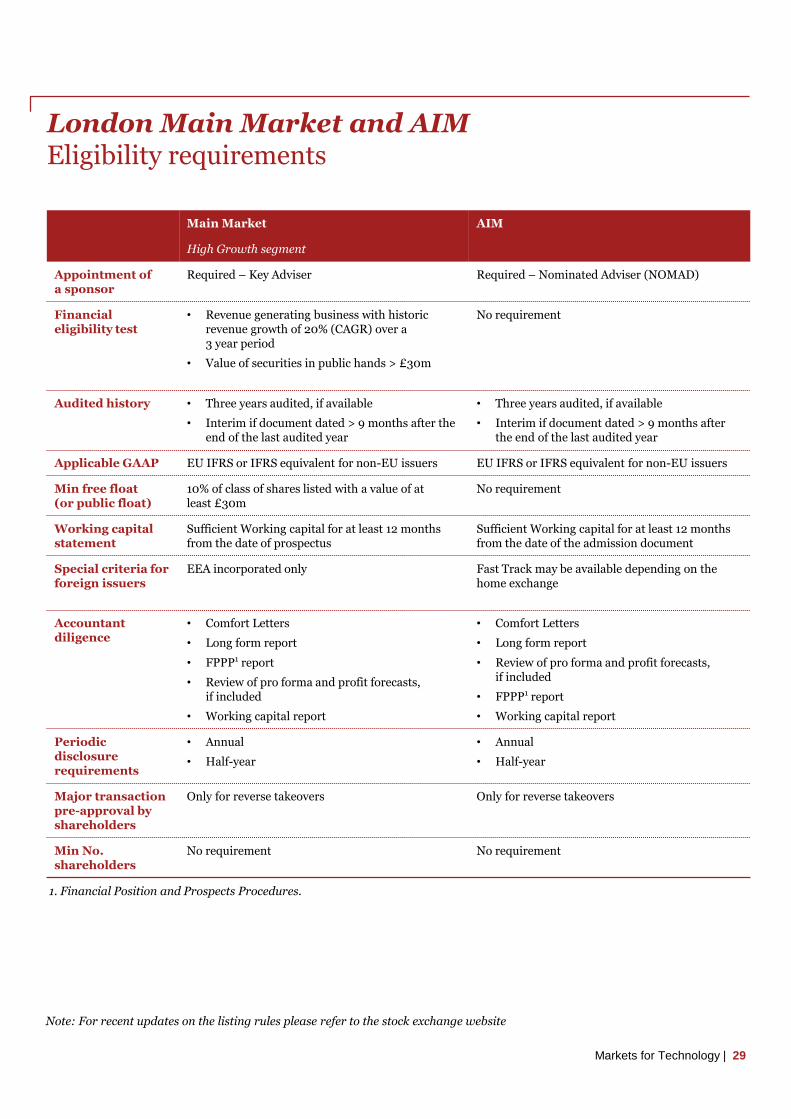
London Main Market and AIMEligibility requirements
29
Main Market AIM
High Growth segment
Appointment of a sponsor
Required – Key Adviser Required – Nominated Adviser (NOMAD)
Financial eligibility test
• Revenue generating business with historic revenue growth of 20% (CAGR) over a 3 year period
• Value of securities in public hands > £30m
No requirement
Audited history • Three years audited, if available
• Interim if document dated > 9 months after the end of the last audited year
• Three years audited, if available
• Interim if document dated > 9 months after the end of the last audited year
Applicable GAAP EU IFRS or IFRS equivalent for non-EU issuers EU IFRS or IFRS equivalent for non-EU issuers
Min free float (or public float)
10% of class of shares listed with a value of at least £30m
No requirement
Working capital statement
Sufficient Working capital for at least 12 months from the date of prospectus
Sufficient Working capital for at least 12 months from the date of the admission document
Special criteria for foreign issuers
EEA incorporated only Fast Track may be available depending on the home exchange
Accountant diligence
• Comfort Letters
• Long form report
• FPPP1 report
• Review of pro forma and profit forecasts, if included
• Working capital report
• Comfort Letters
• Long form report
• Review of pro forma and profit forecasts, if included
• FPPP1 report
• Working capital report
Periodic disclosure requirements
• Annual
• Half-year
• Annual
• Half-year
Major transaction pre-approval by shareholders
Only for reverse takeovers Only for reverse takeovers
Min No. shareholders
No requirement No requirement
Markets for Technology |
1. Financial Position and Prospects Procedures.
Note: For recent updates on the listing rules please refer to the stock exchange website

For more information
Capital markets and IPO publications Technology publications
Which Market guide – London, New York, Hong Kong and Singapore
Choosing on which market to go public is not an easy choice. The brochure gives an overview of regulatory listing requirements in London, New York, Hong Kong and Singapore stock exchanges, with detailed information on markets features, listing eligibility conditions, advantages and challenges.
Listing in the US – NYSE and NASDAQ
Meant for companies which are considering raising capital in the US, this guide includes a description of the IPO process, stock exchanges’ requirements, hints on how to choose the right market whether domestic or foreign issuer.
Executing a successful listing – London
This brochure summarises the different London markets, the listing standards for each of them, the process and timeline for going public in London as well as an overview of the wider regulatory environment.
Global Technology quarterly and annual IPO reviews
Global Technology IPO reviews are published on a quarterly basis. They survey technology stock market listings all over the world and provide a comparison by stock exchange, by subsector, as well as an analysis of cross-border IPOs and global trends perspective.
PwC Global 100 Software Leaders –Converging forces are building that could re-shape the entire industry
Released on a yearly basis, it continues PwC’s tradition of monitoring and analysing the leading companies and trends in the software industry. It contains unique statistics on the number of large companies participating in the SaaS market as well as the proportion of revenue they derive from this form of cloud computing.
Mobile Innovations Forecast
PwC's Mobile Innovations Forecast is a three-part framework for analysing and understanding mobile innovation: 1-Enabling technologies; 2- New technological capabilities; 3- New use cases and business models. They are explored in periodic articles and raise business issues related with innovation.
China's impact on the semiconductor industry
An annual update of key growth figures for various sectors of the semiconductor industry in China. Driven by mobile computing and the Internet of Things, the next ten years are likely to witness a new breed of semiconductor companies competing for leadership in the global industry.
These publications are available atwww.pwc.co.uk/capitalmarkets
Find out more at www.pwc.com
30 | Markets for Technology
Methodology
31
The Markets for Technology publication is based on PwC’s analysis of transaction data extracted from S&P Capital IQ (technology sector) and Dealogic (all sectors). The analysis considers IPOs across all countries worldwide during the period 1 January 2011 to 31 December 2015.
The definition of the technology sector is based on the S&P Capital IQ database industry classifications and includes the following subsectors:
• Internet Software and Services
• IT Consulting and Services
• Professional Services (e.g. Application Software, Software Solutions)
• Semiconductors
• Software
• Computer Storage and Peripherals
- Computer, Computer Peripheral Equipment
- Computer Storage Device Manufacturing
• Electronics (Electronic Computer Manufacturing)
• Telecommunications Equipment
Only IPOs with issue size greater than $40m were included in the analysis. All monetary amounts are in US dollars unless otherwise indicated.
Markets for Technology |

160509-172017-LF-OS
This publication has been prepared for general guidance on matters of interest only, and does not constitute professional
advice. You should not act upon the information contained in this publication without obtaining specific professional
advice. No representation or warranty (express or implied) is given as to the accuracy or completeness of the information
contained in this publication, and, to the extent permitted by law, PricewaterhouseCoopers LLP, its members, employees
and agents do not accept or assume any liability, responsibility or duty of care for any consequences of you or anyone
else acting, or refraining to act, in reliance on the information contained in this publication or for any decision based on it.
© 2016 PricewaterhouseCoopers LLP. All rights reserved. In this document, “PwC” refers to PricewaterhouseCoopers LLP
which is a member firm of PricewaterhouseCoopers International Limited, each member firm of which is a separate legal
entity.
PwC contacts
Capital markets
China/Hong KongKennedy Liu+852 2289 [email protected]
United KingdomMark Hughes+44 20 7804 [email protected]
United StatesNeil Dhar+1 646 471 [email protected]
Technology leaders
GlobalRaman Chitkara+1 408 817 [email protected]
China/Hong KongJianBin Gao+86 21 2323 [email protected]
United KingdomJass Sarai+44 18 9552 [email protected]
United StatesPierre-Alain Sur+1 646 471 [email protected]
Equity Advisory
United KingdomPeter Whelan+44 20 7804 [email protected]
James Anderson+44 20 7804 [email protected]
United StatesDaniel Klausner+1 646 471 [email protected]
Global IPO Centre
Clifford Tompsett+44 20 7804 [email protected]