exchange rates and content of vocs in mediterranean soils · boiling point and chemical structure...
TRANSCRIPT

Departament de Biologia Animal, de Biologia Vegetal i d’Ecologia
Unitat d’Ecologia
Exchange rates and content of VOCs in Mediterranean soils;
their responses to drought and warming and their linkage with biotic factors
___________________________________________
Ph. D. Thesis Mª Dolores Asensio Abella
Bellaterra, setembre del 2007

Departament de Biologia Animal, de Biologia Vegetal i d’Ecologia
Unitat d’Ecologia
Exchange rates and content of VOCs in Mediterranean soils; their responses to drought and warming and their linkage with
biotic factors
Memòria presentada per:
Mª Dolores Asensio Abella per optar al grau de Doctor
Amb el vist i plau dels directors de tesi:
Prof. Josep Peñuelas i Reixach Dr. Joan Llusià i Benet Professor d’Investigació del CSIC Investigador Científic
Unitat d’Ecofisiologia i Canvi Global Unitat d’Ecofisiologia i Canvi Global
CSIC-CEAB-CREAF CSIC-CEAB-CREAF
Universitat Autònoma de Barcelona Universitat Autònoma de Barcelona
Bellaterra, setembre del 2007

A Pandora i Enrique
A Adriano, per sobreviure

Todo momento, todo gesto, cada segundo, cada latido, es una conversión de mí mismo.
Hermano Pastis
Óscar Jordán

Agraïments De les cosetes bones que m’heu donat, conscient o inconscientment, i dels favors regalats, vull fer apreci: Fer apreci és reconèixer el valor, el mèrit d'alguna cosa. Així, reconec lo bé que ha estat treballar amb Josep Peñuelas i el valor que té. No només perquè és un generador d’idees, de incansable energia, pràctic, clar, multi-tasca amb bon humor...és fantàstic vore tot això en marxa, he disfrutat molt i he tingut tots els privilegis científics i personals de pertànyer al Grup Peñu (gràcies a la secció “grandes clásicos de hoy y de siempre”: Iola, Joan, Romà, Jordi, Marc...). Però lo curiós és que quan vaig arribar, jo no sabia res de tot això, ni tu, Josep, sabies res de mi. Llavors, gràcies per confiar en mi, donar-me l’oportunitat i dirigir-me el treball. I gràcies també, a l’atzar o necessitat, que van fer que jo vingués ací. Ací, tot just arribada, em vaig trobar amb Joan Llusià. Joan és molt volàtil, per això arriba a tothom. El teu savoir-faire és sempre present a tot el que fas, des d’una pizza fins a un cromatògraf. Podria estar-me hores mirant com arregles un aparell espatllat o com fas extractes. Això és una manera bonica d’ensenyar les coses. Gràcies per tot això i per compartir amb mi pensaments, cines, massatges anti-estrès, menjars, xocolata, parfums de Chine, ou bien de n’importe quoi, aclarir-me dubtes... Dubte sempre, això ho sé. Però per què? Potser em fa por equivocar-me, por al fracàs? O potser pense que no tinc prou informació per valorar?. Si no fos perquè mon pare i ma mare es van decidir a fotre’m canya, crec que encara estaria valorant les opcions de la primera decisió que vaig haver de prendre algun dia. Gràcies per fer-me llum, estar per mi i alhora deixar-me sempre ser, en sentit profund, jo. Jo, sempre he sigut i seré, amb tesi o sense ella, jo. No és per reafirmar-me. Simplement jo sóc altre. Gràcies doncs, des de fora cap a endins. No tornaré, a currar els caps de setmana. Però tots els caps de setmana, setmanes, mesos...anys! que porte al CREAF, han estat molt bé! Perquè la gent al CREAF fa tot més agradable. He estat com una reina, gràcies: Marta, Cristina, Charo, Magda, Carreño, Teresa i tots els que en conjunt, feu força. La força per fer l’ultima empenta d’aquest treball se la dec a Patrícia. Sóc molt afortunada per açò, per conèixer-te i poder gaudir la teua “amorositat”. La Operación Ducato nos espera...volveremos a coincidir. Coincidir amb les persones, trobar la sintonia, és una de les coses més agradables que hi ha. Des de el principi fins al final, ho he pogut comprovar. Hi ha un enteniment especial, després de tants cafès, sopars, estrès, viatges, Giraldillas, series dels 80, amor i desamor compartit, musica...uff..., amb els frikibecaris, doctors i amics, gràcies: Jara, Núria, Salvattore White Oak, Roger Dry, Stefania (quina dona...mincra totus!), Roser, Laia, Belén, Imma, Nacho, Xavi Domene, Carolina, Iola, Angi, Corina, Romà, Xavi Arnan, Rebeca, Miquel, José Luís, Gerardo...ping-poneros irreductibles artístics guies

del más allá: Jordi...moltíssimes gràcies!; cinèfils cràpules musicals bandarres: Maria Deu, Gerard, Ivette, Charo, Dr. NO (és a dir, en Martínez que sempre em diu NO). Futboleros que mai em deixareu marcar un gol, dones espectaculars: Sue...quin escàndol! És un escàndol que Lo Vuestro encara no tinga fet un vídeo ni una pàgina web...també és cert que hem assajat poc...No és Summer time, però sempre ens quedarà el youtube. Salvattore, Nacho: gràcies. Encara que no deixeu que s’escolte el baix! En pis de baix de casa nostra, a Cerdanyola City, van eixir goteres. Tot venia de les nostres canonades instal·lades en el Pleistoceno Superior. Allà hem viscut 5 anys. Les panderoles viuen amb més dignitat a les clavegueres, Senyora [...] però gràcies, pels seus savis consells: “Ves lo que pasa por ser bueno? Luego te engañan!” . I no m’enganye si dic que de tots els companys que he tingut de pis, el Kuñi, la Reme i la Laura són els més tarambanes, estrambòtics i carabasses que m’he trobat. Ens hem guanyat el cor de la Senyora [···] amb l’incansable frase: “eso ya estaba roto cuando llegué”. La festa de la creïlla, les estones bones... gràcies. I ara que me’n vaig, fiquen l’ascensor?...no importa, el pis el fèiem nosaltres... “si nosaltres no poseïm la frescor de l’aire, ni la lluïssor de l’aigua, com ens ho podeu comprar?” Gràcies Aneta cutxareta per regalar-me amb aquest llibre moltes de les teues idees i iniciar-me en l’art de la cullera. D’ací poc tot tornarà a funcionar com cal, ho sé. Ja ho sé, tindre un origen comú o compartir material genètic no implica necessàriament l’estima. Però això ha fet que Ibán (amb B!), Andrés i jo cresquérem junts, amb estima i baralla, inevitablement. I per això, elements sempre presents, vos agraïsc...les impagables sessions d’Eugenio quan més ho he necessitat. Però sobre tot, per estar ací i allà...repasate el manual? cada dia es un big-bang... Big-bang... sempre hi ha alguna cosa a l’inici. No em puc oblidar de Óscar Jordán, Àgueda Gras-Lady Rostand-, María, Núria...que sou amics al llarg del temps, gràcies. Gràcies, de manera molt conscient, als que amb la seua feina han contribuït a la meua manutenció i per tant, a la feina d’aquestos anys. Espere que l’intercanvi haja estat positiu per al conjunt, i que la cosa no es quede en un títol o unes publicacions. Bon profit!

1
CONTENTS
Index……………………………………………………………………………..…...1
Introductory note and objectives…………………………………………..…….....3
CHAPTER 1. Seasonal soil CO2 and VOC exchange rates in a Mediterranean
holm oak forest and their responses to drought…..…………………………..….23
1.1. Seasonal soil and leaf CO2 exchange rates in a Mediterranean holm oak
forest and their responses to drought conditions…………………...…….….....25
1.1.1. Introduction……………………………………………..……......28
1.1.2. Material and methods……………………………………….……29
1.1.3. Results……………………………………………………...…….32
1.1.4. Discussion and conclusions…………….………………………..37
1.2. Seasonal soil VOC exchange rates in a Mediterranean holm oak forest and
their responses to drought conditions…………………………………..………45
1.2.1. Introduction……………………………………………………....48
1.2.2. Material and methods…………………………………….………49
1.2.3. Results……………………………………………………………52
1.2.4. Discussion…………………………………………………..……56
1.2.5. Conclusions………………………………………………………60
CHAPTER 2. Internannual and interseasonal soil CO2 efflux and VOC exchange
rates in a Mediterranean holm oak forest in response to experimental
drought……………………………………………………………………...……...69
2.1. Introduction………………………………………………………………...72
2.2. Material and methods…………………………………………………...….74
2.3. Results……………………………………………………………………...78
2.4. Discussion…………………………………………...…………………..…86
2.5. Conclusions……………………………………………………………..….90

2
CHAPTER 3. Interannual and seasonal changes in the soil exchange rates of
monoterpenes and other VOCs in a Mediterranean shrubland……………..…99
3.1. Introduction…………………………………………………………….…102
3.2. Material and methods………………………………………………….….104
3.3. Results………………………………………………………………….…107
3.4. Discussion……………...…………………………………………………115
3.5. Conclusions……………………………………………………….………122
CHAPTER 4. On-line screening of soil VOCs exchange responses to moisture,
temperature and root presence…………………………………..……………..131
4.1. Introduction……………………………………………………………….134
4.2. Material and methods……………………………………………………..135
4.3. Results…………………………………………………………………….140
4.4. Discussion…………………………………...…………………………....149
4.5. Conclusions………………………………………………………….……151
CHAPTER 5. The distribution of volatile isoprenoids in the top soil horizons
around Pinus halepensis trees in field conditions…………………….……..…159
5.1. Introduction……………………………………………………………....162
5.2. Material and methods…………………………………………………….164
5.3. Results…………………………………………………………………….170
5.4. Discussion………………………………...………………………………176
5.5. Conclusions……………………………………………………………....182
General Conclusions………………………………………………….……………...187

Introductory note and objectives
3
Introductory note and objectives

Introductory note and objectives
4

Introductory note and objectives
5
Biogenic Volatile Organic Compounds (BVOCs)
Over biological time the major gases exchanged with living organisms have included
carbon dioxide (CO2), oxygen (O2) and nitrogen (N2). These exchanges have altered the
chemical composition and reactivity of the atmosphere (Peñuelas, 1993; Warneck,
1993). Most of the earth’s atmosphere is made up of nitrogen (78% by volume) and
oxygen (21% by volume). The remaining 1% of the atmospheric gases are known as
trace gases because they are present in such small concentrations. Much attention has
been given in the recent years to the measurements of fluxes of trace gases between the
biosphere and the atmosphere, particularly the greenhouse gases CO2, CH4 and NO2,
because of their role in the global climate change. Living organisms also exchange other
trace gases with the atmosphere. These biogenic volatile organic compounds (BVOCs)
are very important for the global tropospheric chemistry and the global carbon cycle
(Fehsenfeld et al, 1992; Singh and Zimmerman, 1992).
For the terrestrial biosphere, the principal non methane VOC sources come from
vegetation. At the global scale it is estimated that vegetation emits 1.2 x 10¹⁵ g C per
year (Guenther et al., 1995). Plants produce a variety of hydrocarbons of which the most
representative and abundant group is isoprenoids (Table 1). Isoprene, monoterpenes and
sesquiterpenes represent a small proportion of the diverse group of isoprenoid plant
products. In addition to isoprenoids, several other volatile organic compounds are
emitted by plants, for example methanol, methyl jasmonate, ethylene and many organic
oxygenated carbon compounds.

Introductory note and objectives
6
Table 1. Nonmethane organic compounds emitted by vegetation. The molecular weight, boiling point and chemical structure also presented.
Compound name
Chemical formula
Molecular weight (g mol-1)
Boiling point (K)
Chemical structure
Isoprene C5H8 68.12 307
Camphene C10H16 136.24 320
Δ3-Carene C10H16 136.24 441
α-Pinene C10H16 136.24 428
β-Pinene C10H16 136.24 436
Limonene C10H16 136.24 448
Myrcene C10H16 136.24 440
Terpineole C10H16 136.24 459
Sabinene C10H16 136.24 437
β-caryophyllene C15H24 204.35 396
α-Humulene C15H24 204.35 396

Introductory note and objectives
7
Table 1. Continued
Compound name
Chemical formula
Molecular weight (g mol-1)
Boiling point (K)
Chemical structure
Methyl chavicol C10H12O 148.20 489
Linalool C10H16O 154.25 469
Methyl jasmonate C13H20O3 224.30 383
γ-Terpinene C10H16 136.24 455
α-Terpinene C10H16 136.24 447
β-Phellandrene C10H16 136.24 446
α-Phellandrene C10H16 136.24 447
p-Cymene C10H14 134.22 450
c-β-Ocimene C10H16 136.24 373
t-β-Ocimene C10H16 136.24 373
α-Copaene C15H24 204.36 397
α-Cedrene C15H24 204.36 534
Introductory note and objectives
8
Why do living organisms emit these volatile compounds to the atmosphere has
continuously challenged research. Isoprene, monoterpenes and sesquiterpenes are not
emitted by all plant species and so it has been suggested that there is not necessarily a
specific role for every isoprenoid VOC emitted (Peñuelas and Llusia, 2004; Owen and
Peñuelas, 2005). However, volatile isoprenoids avoid damages in cellular membranes
under extreme conditions (Sharkey and Singsaas, 1995; Loreto and Velikova, 2001;
Peñuelas and Llusià, 2003). So some plants emit isoprenoids that protect them from
physiological stresses (water stress, high temperatures, oxidative stress or high
irradiation). Monoterpenes and sesquiterpenes have also important ecological functions.
Terpenes are used as defensive compounds in case of pathogens attack or herbivory
(Croteau, 1987; Pichersky and Gershenzon, 2002; Peñuelas and Llusià, 2004, Rasmann
et al. 2005), and also as antimicrobial compounds, as pollinator attractants (Kesselmeier
and Staudt, 1999), and as allelopathyc compounds (Fischer et al., 1994, Peñuelas et al.,
1996).
There are also multiple sinks of volatile compounds, i. e. processes that remove
non methane biogenic VOCs from the atmosphere. Oceans, forests and agricultural sites
are important sinks for many oxygenated VOCs due to the active uptake or passive
adsorption processes (Chebbi and Carlier, 1996; Seco et al., 2007). VOCs emitted to the
atmosphere are also removed by photochemical and dry and wet deposition processes
(Atkinson and Arey, 2003). Photochemical reactions includes reactions with the
hydroxyl radical (OH), photolysis, reactions with ozone and, during the night, with
nitrate radicals (NO3) (Warneke et al., 2004).
Biosphere and atmosphere show multiple regulation feedbacks in their
processes. On one hand plants play an important role in the low atmosphere chemistry.
The atmospheric photo-oxidation of the emitted VOCs leads to two important products
in the lower atmosphere, ozone and organic aerosol, which have important
consequences for air quality and climate. On the other hand, the earth’s global climate,
i. e. the changes in the variability or average state of the atmosphere over time, is
affecting biosphere activities in turn.

Introductory note and objectives
9
Climate Change
Climate monitoring over the past century and long term reconstructions of climate over
the past millennium indicate that the latter 20th century was anomalously warm and that
the earth is actually warming up, as reported by the latest Intergovernmental Panel on
Climate Change (IPCC 2007). For the next two decades a warming of about 0.2°C per
decade is projected for a range of SRES emission scenarios (IPCC 2007). Continued
greenhouse gas emissions at or above current rates would cause further warming and
induce many changes in the global climate system during the 21st century that would
very likely be larger than those observed during the 20th century. One of the direct
observations on recent climate change (IPCC 2007) is that more intense and longer are
droughts are occurring since the 1970s, particularly in the tropics and the subtropics. A
general conclusion of most of the GCMs (global circulation models) shows that
between 30º and 40º north and south latitudes the future decade’s precipitations would
be reduced, so Mediterranean communities would be affected by the enhanced drought,
which is likely to affect soil water availability in the future (Fig. 1). Hence, it is
important to estimate biogenic VOC fluxes to the atmosphere and their variations under
the climate warming and the increased drought projected for the next decades by
climatic (IPCC, 2007) and ecophysiological models such as GOTILWA (Sabaté et al.,
2002, Peñuelas et al., 2005).

Introductory note and objectives
10
Figure 1. Multi-model mean changes in (a) precipitation (mm day–1), (b) soil moisture content (%), (c) runoff (mm day–1) and (d) evaporation (mm day–1). To indicate consistency in the sign of change, regions are stippled where at least 80% of models agree on the sign of the mean change. Changes are annual means for the SRES A1B scenario for the period 2080 to 2099 relative to 1980 to 1999. Soil moisture and runoff changes are shown at land points with valid data from at least 10 models. From IPPC 2007.
The soil VOCs
Most of the research about non methane VOC fluxes has focused on fluxes from the
above-ground part of the plants at different levels, from canopy to foliar/flower/stem
level. However, until the last years, information about VOC fluxes from the below-
ground parts of the plants was very scarce. Firstly and apparently, the lack of
information may be due to troubles studying the hidden half of the plants under field or
roots’ natural conditions. Many technologies have been developed to manage the
methodologic inconveniences associated to roots growing in soil, for example the use of
water culture as an alternative to soil as a growth medium. This research line has opened
interesting new issues in the study of volatile and semi volatile root exudates and has
shown remarkable ecological roles (Akiyama et al., 2005; Nishida et al., 2005).
However, the main shortcoming of these laboratory techniques is that water culture

Introductory note and objectives
11
gives a homogeneous medium, whereas a fundamental character of soil is that it is
heterogeneous at the scale of a root. Secondly, root VOCs under natural conditions may
be less studied than VOCs from leaves because roots in soil establish multiple
relationships with other soil living organisms increasing the complexity of the soil
system. For example, the large capacity in soils for microbial oxidation of hydrocarbons
and other organic species released by roots, largely prevents soil VOC emissions to the
atmosphere, thus soil are thought to be a much weaker source of non methane VOCs
than aboveground parts of terrestrial plants. But soil microorganisms produce also
volatile compounds which are released to the soil atmosphere (Mackie and Wheatley,
1999; Ryu et al., 2003). Microbial populations associated to roots use roots’ exudates as
a growing carbon source and the effects of the organic matter degradation activity by
microorganisms in soil becomes necessary to root growth. Lastly, roots and
microorganisms activities are linked and herein the use of the term rhizosphere.
Soil nature and its gaseous phase
“Soil is essentially a natural body of mineral and organic constituents produced by
solid material recycling during a myriad of complex processes of solid crust
modifications, which are closely related to the hydrologic cycle” (from Mirsal, I. A.
Soil Pollution, Origin, monitoring and remediation)
Plants and soil organisms are involved also in soil physical and chemical
processes which lead through time to the transformation and evolution of rocks and
minerals and the functioning of biogeochemical cycles of elements. These interactions,
“plants-soil organisms and minerals” are mainly occurring in the upper soil horizons
and in the rhizosphere. The rhizosphere receives large amounts of available energy as
plant material (shoot and root litters, root exudates) and is where large populations of
microorganisms (bacteria, fungi, algae and protozoa groups) are present and active.
There are also other soil organisms grouped by their size in macrofauna (large molluscs,
beetles, large insect larvae, etc.) and mesofauna (nematodes, arthropods, annelids and
molluscs) which are also developing the soil profile by their activities.
Soil is a three dimensional system, made of a solid, a liquid and a gaseous phase,
each one in amounts depending on the abundance of their constituents and their kinetic
roles in the complex series of reactions leading to soil formation. Soil air or soil
atmosphere is the characteristic name given to the mixture of gases moving in the
Introductory note and objectives
12
aerated zone and filling the soil pores where these are not already occupied by
interstitial water. The mechanisms responsible for the transport of all soil gases are
diffusion, resulting in a net movement of gas from a zone of higher concentration to one
of lower concentration, and mass flow, where the whole gas mixture moves in response
to a pressure gradient. Most gas movement is by diffusion; mass flow is important only
when the pressure differences develop because of changes in barometric pressure,
temperature, or soil water content. The movement occurs overwhelmingly in the air-
filled pores, because diffusion in the gas phase is about four order of magnitude greater
than through water. As air-filled porosity varies with soil water content and soil
structure, these factors have a major effect on the rate of gas movement in soils. Gas
exchange between soil and the atmosphere occurs also along temperature gradients.
Soils description
The experimental work was carried out on soils from Prades (41º13’N, 0º55’E), Garraf
(41º18’N, 1º49’E) and Bellaterra (41º30’ N, 2º6º E). Soils were classified according to
Soil Taxonomy (Prades: Dystric Cambisol FAO, 1990; Garraf: Petrocalcic Calcixerept,
Soil Survey Staff, 1998 and Bellaterra: Calcixerollic Xerochrept, Soil Taxonomy,
1975). Horizons description from the typical soil profile and some physico-chemical
properties of the studied soils are in Tables 2, 3 and 4. Additional information about
climate and vegetation are shown in chapters 1, 3 and 5.

Introductory note and objectives
13
Table 2. Soil horizons description and physico-chemical properties of the studied soil in Prades holm oak forest. Prades South slope soil (22º)
Oi (L) 9-3/5-2 cm. Thick horizon in some places. Identifiable leaves of Phyllierea and other dominant species
Oe (F) 5-2/3-1 cm. Well differentiated. Partly decomposed leaves. Fibrous structure. Abundant fungal mycelium. Many fine roots.
Oa (H) 3-1/0 cm. Humified material mixed with a mineral particles and leave debris
A1 0/5-8 cm. Texture sandy loam. Rich in organic matter, debris and humus.
A2 5-8/20-25 cm. Texture sandy loam. Moderate organic matter content.
A3 20-25/43-47 cm. Texture loamy sand. Few organic matter content.
Bw 43-47/75-90 cm. Texture sandy loam. Frequent fine to coarse roots.
R >75-90 cm. Fracture methamorphic schists of Paleozoic.
Soil Type Dystric Cambisol Soil pH (water) 6.9 Soil texture
% Sand 71.0 % Silt 21.6 % Clay 7.4
Mineral horizon (mean 0-15 cm) Mineral horizon bulk
density (g cm-3) 1.0
Organic matter content (%) 7.3
Phosphorous (ppm) 13 Nitrogen (%) 0.2
Exchangeable cations K+ (ppm) 263
Mg2+ (mequ/100g) 1.2 EC 25ºC (dS/m) (1:5) 0.2

Introductory note and objectives
14
Table 3. Soil horizons description and physico-chemical properties of the studied soil in Garraf shrubland.
Garraf South-South-East slope soil (13º)
O 3.5-0.5/0 cm. Gravels and stones layer of calcareous nodules. A1 0/5-12 cm. Clay-loam. Moderate content of organic matter. A2 5-12/32-37 cm. Clay-loam. Few organic matter. B 32-37/35-70 cm. Petrocalcic horizon.
Soil Type Petrocalcic Calcixerept Soil pH (water) 8.1 Soil texture
% Sand 42.9 % Silt 38.7 % Clay 18.4
Mineral horizon (mean 0-15 cm) Mineral horizon bulk
density (g cm-3) 1.3
Organic matter content (%) 7.8
Phosphorous (ppm) 8 Nitrogen (%) 0.2
Exchangeable cations K+ (ppm) 299
Mg2+(mequ/100g) 1.2 EC 25ºC (dS/m) (1:5) 0.2

Introductory note and objectives
15
Table 4. Soil horizons description and physico-chemical properties of the studied grassland soil in Bellaterra, Campus UAB (Barcelona). (Soil data from Alcañiz, 1980).
Bellaterra Plain grassland soil
A1 0/3 cm. Texture clay loam. Moderate organic matter. Frequent medium roots and fine roots.
Ap 3/35 cm. Texture sandy clay loam. Very low organic matter. Few roots.
B 35/70 cm. Texture sandy clay loam. No organic matter. Few roots.
B/Cca 70/90 cm. Texture sandy clay loam. No organic matter. Few medium roots, no fine roots.
C 90/±200 cm. Texture sandy clay loam. No organic matter. No roots.
Soil Type Calcixerollic Xerochrept Soil pH (water) 8.0 Soil texture
% Sand 52.0 % Silt 22.3 % Clay 25.7
Mineral horizon (mean 0-20 cm) Mineral horizon bulk
density (g cm-3) 1.3
Organic matter content (%) 2.1
Phosphorous (ppm) 41.3 Nitrogen (%) 0.1
Exchangeable cations K+ (mequ/100g) 0.5
Mg2+(mequ/100g) 2.8 EC 25ºC (dS/m) (1:5) 1.0

Introductory note and objectives
16
A short introductory method description
In addition to the major constituents of the soil atmosphere (N2 and O2), other trace
gases may occur in the soil air, produced within the soil body or introduced into the soil
by rainwater, diffusion, uptake or other processes, from the atmosphere. We were
interested in the soil atmosphere trace gas exchange of CO2 and non methane biogenic
VOCs. The principal method used to measure soil fluxes in this work is a variant of the
enclosure method. We inserted a collar into the soil so that it protruded a few cm above
the surface, and then sealed a lid onto the collar when making a measurement. The
mode of operation was dynamic. A steady stream of air is pumped though the chamber,
and the gas emitted from the soil is measured directly in the air stream or adsorbed in a
suitable trapping material for subsequent release and analysis. We used the background
values (VOCs measured on the atmosphere near the soil surface) to calculate the
exchange rates on a mass balance basis. This way we measured either a positive soil
VOC “exchange rate”, i. e., a flux from the soil to the atmosphere (“emission rate”) or
a negative soil VOC “exchange rate”, i. e., flux from the atmosphere to the soil
(“uptake rate”).
General objectives
Soils, being sources and sinks of non methane VOCs, have received little attention
because of the complexity in studying soils and the assumption of the little soil
source/sink strength compared with foliar non methane VOC fluxes. However, soil
VOC fluxes really do happen and they are not well understood. Thereafter, the general
objectives of this PhD thesis were 1) to characterize Mediterranean soil VOC contents
and exchange, particularly monoterpenes because of their important role on ecology,
plant physiology and atmospheric chemistry, but also other VOCs, and 2) to assess the
possible changes in soil VOC and CO2 exchange rates under the global environmental
change towards more arid and warm conditions in the Mediterranean region.

Introductory note and objectives
17
Specific objectives
The general objectives were common to all chapters. In addition, the specific aims of
each chapter are listed below:
Chapter 1. Seasonal soil CO2 and VOC exchange rates in a Mediterranean holm
oak forest and the responses to drought.
Since soil respiration and above-ground processes are linked processes (photosynthesis
supplies carbon substrate for root metabolism and nutrition) we believe concurrent
study of soil respiration and plant activity can provide more insight in the principal
issue of this PhD, soil VOCs, and in the understanding of terrestrial carbon cycling and
fluxes between the atmosphere and the terrestrial biosphere. Hence, we aimed:
Chapter 1.1. Seasonal soil leaf and CO2 exchange rates and their responses to
drought conditions.
1) To assess the seasonal CO2 gas exchange from soils and plants.
2) To test their dependence on abiotic factors such as soil moisture and
temperature.
3) To study the linkage between above- and below-ground exchange processes.
4) To study the response of soil and leaf CO2 exchange to the lower soil water
availability predicted for the next decades for Mediterranean ecosystems by
IPCC and ecophysiological models.
Chapter 1.2. Seasonal soil VOC exchange rates and their responses to drought
conditions.
1) To construct an inventory of the VOC (especially monoterpenes) exchange
between soils and the atmosphere.
2) To investigate the seasonality of soil-atmosphere VOC exchange.
3) To investigate possible links to photosynthetic performance.
4) To study the response of soil VOC emissions to the lower soil water
availability predicted for the next decades by GCM and ecophysiological
models.
5) To investigate possible links between soil VOC and CO2 exchanges and
photosynthetic performance.

Introductory note and objectives
18
Chapter 2. Interannual and interseasonal soil CO2 efflux and VOC exchange rates
in a Mediterranean holm oak forest in response to experimental drought.
Given the importance of soil CO2 efflux in the global carbon balance and the important
role of soil monoterpene and VOCs in soil ecology, given the scarcity of knowledge on
their responses to environmental conditions, and given the predicted climate change, we
studied the responses of CO2 and VOCs exchange to the more arid conditions forecasted
for the Mediterranean region for the next decades. We performed a drought experiment
by partially excluding rainfall and water runoff in a natural Mediterranean holm oak
forest soil and we measured soil CO2 and VOC exchange rates, under the predicted 15-
20% lower soil water availability. Like in a previous study (Chapter 1) we studied the
CO2 and soil VOC exchange responses to the seasonal changes in soil moisture and
temperature but now we also studied another year, the dry 2004-2005. Then, we aimed:
1) To study the effects of the important interannual variability in soil moisture and
temperature characteristic of those Mediterranean ecosystems.
2) To measure the soil exchange of the whole range masses of volatile compounds
with the PTR-MS technique.
3) To find possible linkages between monoterpenes and other VOC exchange rates
and CO2 efflux.
Chapter 3. Interannual and seasonal changes in the soil exchange rates of
monoterpenes and other VOCs in a Mediterranean shrubland.
Similarly to Chapter 2, we conducted this study of soil VOC exchange rates in a
Mediterranean shrubland at the Garraf Natural Park, in Catalonia. Our aims were:
1) To explore and quantify the soil VOC exchange rates, with special attention to
monoterpenes, in a typical calcareous Mediterranean shrubland.
2) To investigate interannual and seasonal variations in soil VOC exchange rates.
3) To study soil VOC exchange rates’ links to soil temperature, soil moisture and
soil CO2 efflux.

Introductory note and objectives
19
Chapter 4. On-line screening of soil VOCs exchange responses to moisture,
temperature and root presence.
Many studies have shown the prominent role of VOCs on soil ecology, but the
mechanisms controlling the exchange are not well understood. In this chapter we
studied biotic and abiotic effects on soil VOCs exchange rates. We aimed:
1. To obtain information about changes in real time on the soil VOCs source/sink
activity, taking advantage of the recent availability of analytical instrumentation
to conduct these measurements.
2. To obtain information on soil VOCs exchange rates responses to root presence,
to the soil warming and to the soil drought.
With these aims, we monitored soil VOCs exchange rates in real time with the PTR-MS
technique in a controlled ‘soil + plant’-atmosphere and in a ‘soil’-atmosphere systems,
and submitted both ‘soil + plant’ and ‘soil’ systems to moisture and temperature
gradients.
Chapter 5. The distribution of volatile isoprenoids in the top soil horizons around
Pinus halepensis trees in field conditions.
Due to the lack of information about terpenes concentrations in different horizons and
on whether there is a natural root or litter source for soil, we aimed:
1. To quantify relative concentrations of terpenes in different soil layers (litter,
organic layer, mineral layer directly underlying the organic layer, mineral layer
20 cm deep, and root material in the 2 mineral layers) and in a distance gradient
from the trunk of a tree.
2. To quantify the pentane soluble fraction, i.e., the fraction likely to be colloid
bound in the soil system or extractable from the air space.
3. To quantify the water soluble fraction, i. e. the fraction more directly available in
aqueous solution to soil microfauna.
4. To investigate the effect of two variables that might affect the amount of volatile
isoprenoid in the different soil horizons: (1) the fraction by weight of root
material in the two mineral layers, and (2) the amount of litter per unit surface
area.
5. To discern between roots and litter sources of soil BVOC concentrations.
Introductory note and objectives
20
Other VOC studies not presented in this PhD thesis
While conducting my PhD I also participated in other studies on plant VOCs to
complement my scientific formation. As a result of that work I coauthored the following
papers:
Llusià, J., Peñuelas J., Asensio D., Munné-Bosch S., 2005. Airbone limonene
confers limited thermotolerance to Quercus ilex. Physiologia Plantarum 123, 40-
48.
Peñuelas, J., Llusià J., Asensio, D., Munné-Bosch, S., 2005. Linking isoprene
with plant thermotolerance, antioxidants and monoterpene emissions. Plant, Cell
and Environment 28, 278-286.
Munné-Bosch, S., Peñuelas, J., Asensio, D., Llusià, J., 2004. Airbone Ethylene
may alter antioxidant protection and reduce tolerance of holm oak to heat and
drought stress. Plant Physiology 136, 2937-2947.
Prieto, P., Peñuelas, J, Llusià, J., Asensio, D., Estiarte, M. Effects of
experimental warming and drought on photosynthesis, shoot elongation and
biomass accumulation in the dominant species of a Mediterranean shrubland.
Submitted.
References
Alcañiz, J.M. 1980. Dinámica de la Fracción Orgánica de un Suelo Calcáreo en las Primeras Etapas de una Sucesión Secundaria: a) Aspectos Cuantitativos. b) Caracterización por Pirolisis- Cromatografía de Gases. Tesi Doctoral. Univ. Autònoma de Barcelona. Bellaterra. Akiyama, K., Matsuzaki, K., Hayashi, H. 2005 Plant sesquiterpenes induce hyphal branching in arbuscular mycorrhizal fungi. Nature 435, 824-827. Atkinson, R., Arey, J. Gas-phase troposperic chemistry of biogenic volatile compounds: a review. Atmospheric Enviroment 37: S197-S219 Suppl. 2.

Introductory note and objectives
21
Chebbi, A., Carlier, P., 1996. Carboxylic acids in the troposphere, occurrence, sources, and sinks: a review. Atmospheric Environment 30 (24), 4233–4249. Croteau, R., 1987. Biosynthesis and catabolism of Monoterpenoids. Chemical Reviews 87, 929-954. Fehsenfeld, F, C., and Coauthors, 1992. Emission of volatile organic compounds from vegetation and the implications for atmospheric chemistry. Global Biogeochemistry Cycles 6,389-430. Fischer, N.H. et al. 1994. In search of allelopathy in the Florida scrub – the role of terpenoids. J. Chem. Ecol. 20, 1355 –1380. Guenther and Coauthors, 1995. A global model of natural volatile organic compound emissions. Journal of geophysical research 100, 8873-8892. IPCC, 2007: Climate Change 2007: The Physical Science Basis. Contribution of Working Group I to the Fourth Assessment Report of the Intergovernmental Panel on Climate Change [Solomon, S., D. Qin, M. Manning, Z. Chen, M. Marquis, K.B. Averyt, M. Tignor and H.L. Miller (eds.)]. Cambridge University Press, Cambridge, United Kingdom and New York, NY, USA, 996 pp. Kesselmeier, J. and Staudt, M. 1999. Biogenic volatile organic compounds (VOC): an overview on emission, physiology and ecology. J. Atmos. Chem. 33, 23–88). Loreto, F., Velikova, V. 2001. Isoprene produced by leaves protects the photosynthetic apparatus against ozone damage, quenches ozone products, and reduces lipid peroxidation of cellular membranes. Plant Physiology 127, 1781-1787. Mackie, A. E., Wheatley, R. E., 1999. Effects and incidence of volatile organic compound interactions between soil bacterial and fungal isolates. Soil Biology and Biochemistry 31, 375-385. Misral, I. A. 2004. Soil Pollution: origin, monitoring and remediation. Springer-Verlag, Berlin. 252 pp. Nishida, N., Tamotsu, S., Nagata, N., Saito, C., Sakai, A., 2005. Allelopathic effects of volatile monoterpenoids produced by Salvia leucophylla: Inhibition of cell proliferation and DNA syntesis in the root apical meristem of Brassica campestris seedlings. Journal of Chemical Ecology 31, 1187-1203. Owen, S., Peñuelas, J. 2005. Opportunistic emission of volatile isoprenoids. Trends in Plant science 10 (9) 420-426. Peñuelas, J., Ribas-Carbo, M., Giles, L., 1996. Effects of allelochemicals on plant respiration and oxygen isotope fraction by the alternative oxidase. Journal of Chemical Ecology 22 (4) 801-805. Peñuelas, J. 1993. El aire de la vida. Editorial Ariel, Barcelona. 260 pp.
Introductory note and objectives
22
Peñuelas, J., Llusià, J. 2003. BVOCs: Plant defense against climate warming? Trends in Pant Science 8, 105-109. Peñuelas, J., Llusià, J., 2004. Plant VOC emissions: making use of the unavoidable. Trends in Ecology & Evolution 19 (8), 402-404. Peñuelas J, Filella I, Sabate S and Gracia C 2005. Natural systems: terrestrial ecosystems. In Report on Climate change in Catalonia. Ed. J.E. Llebot. pp. 517-553. Institut d'Estudis Catalans, Barcelona. Pichersky, E., Gershenzon, J. The formation and function of plant volatiles: perfumes for pollinator attaction and defense. Current Opinion in Plant Biology 5, 237-243. 2002; Rasmann, S. et al. 2005. Recruitment of entomopathogenic nematodes by insect-damaged maize roots. Nature 434, 732–737, Ryu, C., Farag, M. A., Hu, C., Reddy, M. S., Wei, H., Pare, P. W., Kloepper, J. W., 2003. Bacterial volatiles promote growth in Arabidopsis. Proceedings of the National Academy of Science of the United States of America 100, (8) 4927-4932. Sabaté, S., Gracia, C., Sánchez, A., 2002. Likely effects of climate change on growth of Quercus ilex, Pinus halepensis, and Fagus sylvatica forest in the Mediterranean region. Forest Ecology and Management 162, 23-37. Seco, R., Peñuelas, J., Filella, I., 2007. Short-chain oxygenated VOCs: Emission and uptake by plants and atmopsheric source, sinks, and concentrations. Atmospheric Environment 41: 2477-2499. Sharkey T. D., Singsass, E. L., 1995. Why plant emit isoprene. Nature 374. 769. Singh, H., B., Zimmerman, P., 1992. Atmospheric distribution and sources of nonmethane hydrocarbons. Characterization and cycling. J. O. Nriagu, Ed., John Wiley and Sons, 235 pp. Warneck, P. 1993. Chemical change sin the atmosphere on geological and recent time scales. In “Global Atmospheric Chemical Change” (C. N. Hewitt, and W. T. Sturges, eds.) pp 1-52. Elsevier Applied Science: London. Warneke, C., de Gouw, J.A., Goldan, PD., Kuster, W.C., Williams, E.J., Lerner, B.M., Jakoubek, R., Brown, S.S., Stark, H., Aldener, M., Ravishankara, A.R., Roberts, J.M., Marchewka, M., Bertman, S., Sueper, D.T., McKeen, S.A., Meagher, J.F., Fehsenfeld, F.C. 2004. Comparison of daytime and nighttime oxidation of biogenic and anthropogenic VOCs along the New England coast in summer during New England Air Quality Study 2002. Journal of Geophysical Research Atmospheres 109 (D10), D10309.

Chapter 1 Seasonal soil CO2 and VOC exchange rates in a Mediterranean holm oak forest
23
Chapter 1
Seasonal soil CO2 and VOC exchange
rates in a Mediterranean holm oak
forest and their responses to drought

Chapter 1 Seasonal soil CO2 and VOC exchange rates in a Mediterranean holm oak forest
24
Chapter 1 Seasonal soil CO2 and VOC exchange rates in a Mediterranean holm oak forest
25
1.1. Seasonal soil and leaf CO2 exchange
rates in a Mediterranean holm oak forest
and their responses to drought conditions

Chapter 1 Seasonal soil CO2 and VOC exchange rates in a Mediterranean holm oak forest
26
Chapter 1 Seasonal soil CO2 and VOC exchange rates in a Mediterranean holm oak forest
27
Abstract.
We measured the soil and leaf CO2 exchange in Quercus ilex and Phillyrea latifolia
seasonally throughout the year in a representative site of the Mediterranean region, a
natural holm oak forest growing in the Prades Mountains in South-Eastern Catalonia. In
the wet seasons (spring and autumn), we experimentally decreased soil moisture by
30%, by excluding rainfall and water runoff in twelve plots 1 x 10 m and left twelve
further plots as controls. Our aim was to predict the response of these gas exchanges to
the drought forecasted for the next decades for this region by GCM and
ecophysiological models.
Annual average soil CO2 exchange rate was 2.27 ± 0.27 μmol CO2 m-2 s-1.
Annual average leaf CO2 exchange rates were 8 ± 1 μmol m-2 s-1 and 5 ± 1 μmol m-2 s-1
in Q. ilex and P. latifolia respectively. Soil respiration rates in control treatments
followed a seasonal pattern similar to photosynthetic activity. They reached maximum
values in spring and autumn (2.5-3.8 μmol m-2 s-1 soil CO2 emission rates and 7-15
μmol m-2 s-1 net photosynthetic rates) and minimum values (almost 0 for both variables)
in summer, showing that soil moisture was the most important factor driving the soil
microbial activity and the photosynthetic activity of plants. In autumn, drought
treatment strongly decreased net photosynthesis rates and stomatal conductance of
Quercus ilex by 44% and 53%, respectively. Soil respiration was also reduced by 43%
under drought treatment in the wet seasons. In summer there were larger soil CO2
emissions in drought plots than in control plots, probably driven by autotrophic (roots)
metabolism. The results indicate that leaf and soil CO2 exchange may be strongly
reduced (by ca. 44%) by the predicted decreases of soil water availability in the next
decades. Longer term studies are needed to confirm these predictions or to find out
possible acclimation of those processes.
Key words: Soil CO2 exchange, foliar net photosynthetic rates, Mediterranean holm oak forest, climate
change, drought, roots, microorganisms.

Chapter 1 Seasonal soil CO2 and VOC exchange rates in a Mediterranean holm oak forest
28
1.1.1. Introduction
Soil respiration and foliar photosynthesis represent large natural fluxes in the dynamics
of carbon exchange. While net primary production estimates are 50 × 1015 gC yr-1 (Field
et al., 1998) carbon losses by soils are estimated at approximately 75 × 1015 gC yr-1
(Schlesinger and Andrews, 2000). Therefore, the study of soil respiration is important to
understand the balance between biospheric and atmospheric carbon.
Soil respiration and above-ground processes are linked because photosynthesis supplies
carbon substrate for root metabolism and nutrition. Root metabolism produces the
release of exudates to the rhizosphere and these carbon-rich substances supply organic
residues to decomposers (Schlesinger and Andrews, 2000; Ryan and Law, 2005).
Concurrent study of soil respiration and plant activity (photosynthesis and conductance)
can provide more insight in the understanding of terrestrial carbon cycling and fluxes
between the atmosphere and the terrestrial biosphere.
Soil respiration includes two principal below ground processes: autotrophic and
heterotrophic respiration (Hanson et al. 2000). The autotrophic respiration results from
the growth and maintenance of roots and associated rhizosphere microorganisms
(Pendall et al. 2004). The heterotrophic respiration is the sum of heterotrophic bacteria
and fungi activity and soil faunal activity (Hanson et al. 2000). The proportion of soil
respiration from autotrophic and heterotrophic contributions may vary seasonally and
among ecosystems (Hanson et al. 2000) and may respond differently to environmental
factors (Ryan and Law 2005).
We conducted a study in a typical Mediterranean holm oak forest. The dominant
species, Quercus ilex L. and Phyllirea latifolia L. are widely distributed in the
Mediterranean basin. Both species are well adapted to drought, although P. latifolia has
been described as more drought resistant than Q. ilex (Tretiach 1993; Peñuelas et al.,
2001; Ogaya and Peñuelas 2003).
The goals of our study were (i) to assess the seasonal CO2 gas exchange from
soils and plants (ii) to test their dependence on abiotic factors such as soil moisture and
temperature, (iii) to study the linkage between above- and below-ground exchange
processes, and (iv) to study the response of soil and leaf CO2 exchange to the lower soil
water availability predicted for the next decades for Mediterranean ecosystems by IPCC
and ecophysiological models (IPCC 2001, Sabate et al. 2002, Peñuelas et al. 2005).

Chapter 1 Seasonal soil CO2 and VOC exchange rates in a Mediterranean holm oak forest
29
1.1.2. Material and methods
1.1.2.1 Sampling Site
This study was conducted between Spring 2003 and Spring 2004. Measurements were
carried out in a natural holm oak forest growing in the Prades Mountain region, in
Southern Catalonia (41º13’N, 0º55’E), on a south-facing slope (25% slope) at 930 m
above sea level. The soil is a Dystric Cambisol (FAO, 1990) on a bedrock of
metamorphic sandstone, and its depth ranges between 35 and 90 cm. The average
annual temperature is 12 ºC and the annual rainfall 658 mm. Summer drought occurs
approximately from mid-June to mid-September. The vegetation of the area is short
holm oak forest characterized by 3 or 4-m tall trees and shrubs. This forest is dominated
by Quercus ilex L. Phillyrea latifolia L. is also very abundant. Arbutus unedo L., some
shrubs of Erica arborea L., Juniperus oxycedrus L. and Cistus albidus L. and
occasional individuals of deciduous species (Sorbus torminalis L. Crantz and Acer
monspessulanum L.) occur occasionally (Ogaya and Peñuelas, 2003).
Experimental design
Twenty-four 1 × 10 m plots were randomly distributed at the same altitude along the
slope in the study area. Half of the plots were subjected to a drought treatment and the
remainder plots were control plots. The drought treatment consisted of rainfall
exclusion by suspending transparent PVC strips at a height of 0.5-0.8 m above the soil.
In addition a 0.8-1 m deep ditch was excavated along the entire 1m top edge of the
upper part of the treatment plots to intercept runoff water. Water intercepted by strips
and ditches was drained to an area outside and downhill of the plots. Rainfall exclusion
by plastic strips does not affect the light interception by the trees because the whole tree
canopies are located above the plastic strips.
Litter-fall on the plastic strips was moved underneath them each month to
sustain the humic composition of the soil. Therefore any nutrient differences below and
outside the strips were due only to the change in water available for decomposition of
this litterfall.
Drought treatment started in March 1999 and continues to the present.
Chapter 1 Seasonal soil CO2 and VOC exchange rates in a Mediterranean holm oak forest
30
1.1.2.2. Measurements of soil CO2 flux, temperature and moisture.
Soil respiration was measured in situ using a flow-through chamber method and an
infrared gas analyser system (EGM-4, PP Systems, Hitchin, Hertfordshire, England). A
vented soil chamber system was performed with PVC collars (12.5 cm in diameter and
8 cm in height) installed permanently 3-4 cm into the soil. The collars were covered by
a PVC lid with two outlets. One outlet was connected to the IRGA analyser by a tefflon
tube. The other outlet was open to exterior air entry. Air inside the chamber was flowed
(constant flux 0.4 L min-1) to the CO2 analyser by the EGM-4 integral DC pump. The
flow was measured with a bubbler flowmeter. Equilibration of CO2 concentration in the
effluent stream occurred after 20 minutes. Before the collar was covered, we measured
exterior air CO2 concentrations. Net soil CO2 fluxes were calculated by considering the
stable difference in CO2 concentration between the outlet air and the inlet air.
Measurements were automatically corrected for temperature and pressure by the EGM-4
analyser. The accuracy of CO2 measurements was estimated in 1%. Stability of the
measurements were assured with the periodic “Auto-Zero” resulting in automatic
correction for sample cell contamination, source aging, detector sensitivity variations
and pre-amplifier gain changes.
Twelve collars in both control and drought plots (one collar per plot, n=12) were
distributed randomly. The collars were installed in Winter 2002 and they were
permanently placed into soil, in order to minimise possible effects of the mechanical
disturbance during measurements. Before sampling litter recently fallen inside the PVC
collars was removed to obtain CO2 emissions only from soil roots and soil
microorganisms. We measured one soil respiration value per collar.
Soil temperature and moisture were measured at 10 cm depth, just beside each
PVC collar to avoid mechanical disturbances to the enclosed soil. Soil temperature
above the soil surface (air temperature) was also measured. A soil digital thermometer
was used to measure temperature (TO 15, Jules Richard instruments, Argenteuil,
France) and a HH2 soil moisture meter connected to a ML2x soil moisture sensor
(Delta-T Devices Ltd, Cambridge, England) was used to measure soil moisture.

Chapter 1 Seasonal soil CO2 and VOC exchange rates in a Mediterranean holm oak forest
31
1.1.2.3 Leaf CO2 exchange rates and leaf water status measurements
Leaf net CO2 exchange rates (A) and stomatal conductances (gs) were measured in situ
with a portable gas exchange system CIRAS2 (PP Systems, Hitchin, Hertfordshire, UK)
at a 1500 μmol m-2 h-1 PPFD. Intact leaves were clamped in a Parkinson leaf cuvette
(Std Broad 2.5, PP Systems, Hitchin, UK) connected to the CIRAS2.
Conductance for water vapor was calculated as: gs = 1 / rs where rs is the stomatal
resistance to water vapor: rs= ((Wleaf - Wan) / ΔW x us) - rb, and where: Wleaf = es / p, es
is the saturated vapor pressure at leaf surface, p is the atmospheric pressure, ΔW is the
water vapor differential across leaf chamber, Wan is the water vapor concentration out of
leaf chamber, rb is the boundary layer resistance to water vapor and us is the mass flow
of air per m2 of leaf area.
Net photosynthetic rate and stomatal conductance were measured in one sunlit
leaf of Q. ilex and one sunlit leaf of P. latifolia per plot. We conducted these
measurements in 6 control and 6 drought plots which had accessible leaves to manual
sampling. Sampled leaves had always the same age and similar position within the
canopy.
Water potential was measured in one terminal twig of two different plants per
species, in control and drought plots, using a Scholander pressure chamber (PMS,
Corvallis, Oregon, USA). Relative water content (RWC) was measured early in the
morning for 5 sunlit leaves of Q. ilex and P. latifolia in each plot. RWC was calculated
as: RWC = (MF – MD) / (MT – MD) where MF is leaf fresh mass, MD is leaf dry mass
and MT is leaf turgor mass, measured as water saturated leaf weight after 10-12 hours in
water saturating conditions (petiole in water).
1.1.2.4 Sampling strategy
Measurement campaigns were carried out during 3 consecutive sunny days in each
season: spring 2003 (April 22, 23 and 24), summer 2003 (August 12, 13 and 14),
autumn 2003 (November 3, 4 and 5), winter 2004 (February 17 and 18) and spring 2004
(April 21, 22 and 23). Soil and leaf CO2 exchange rates were measured during the
mornings (from 7 a.m. to 11 a.m.). Soil respiration measurements in each plot took 20
min. The interval sample from plot to plot was 15 min. Net photosynthetic rates
measurements took 15 min per plot. The interval sample between plots was 20 min.
Chapter 1 Seasonal soil CO2 and VOC exchange rates in a Mediterranean holm oak forest
32
Relative water content was measured early in the morning, and leaf water potential at
midday.
1.1.2.5. Statistical analyses
Repeated measures analyses of variance (ANOVA) were conducted with soil CO2
fluxes, soil moisture and temperature, leaf CO2 exchange rates, relative water content
and leaf water potential as dependent variables and with treatment and season as
independent factors. Data was log transformed when necessary to meet the ANOVA
assumptions. All analyses were performed with STATVIEW 5.01 software package
(Abacus Concepts Inc., 1998).
1.1.3. Results
Annual average soil temperature and moisture during the sampling period were 13 ± 3
ºC and 17 ± 5 % respectively. We did not find significant differences in the soil surface
temperature between control and drought plots (data not shown). Soil temperature at 10
cm depth was significantly higher in drought plots than in control plots only in
November 2003 (Fig. 1.1.1), a season with no significant differences in soil respiration
between treatments (Fig. 1.1.2). The lowest values of soil moisture were found in
summer (1.6 ± 0.3 %), coinciding with maximum temperatures (25 ± 1 ºC). The drought
treatment decreased soil moisture by 30% in spring and autumn (p<0.0001) when soil
moisture was at maximum values for the year (Fig. 1.1.1).
Mean values of soil CO2 efflux ranged from 2.00 to 2.53 μmol CO2 m-2 s-1 for
control treatment and from 1.64 to 1.92 μmol CO2 m-2 s-1 for drought treatment (Fig.
1.1.2). There were seasonal variations in soil respiration during the year with the highest
values in the springs (3.22± 0.49 and 3.76 ± 0.85 μmol CO2 m-2 s-1) and the lowest
values in summer (0.13 ± 0.01 μmol CO2 m-2 s-1). Significant differences between
drought and control plots in soil CO2 fluxes were found only in the spring seasons when
they were higher in control plots (p<0.05, p< 0.1 respectively), and in summer when
CO2 fluxes were higher in drought plots (control 0.13 ± 0.01 μmol m-2 s-1, drought 0.75
± 0.18 μmol m-2 s-1; p<0.01) (Fig. 1.1.2).

Chapter 1 Seasonal soil CO2 and VOC exchange rates in a Mediterranean holm oak forest
33
Figure 1.1.1. Seasonal course of soil moisture and soil temperature. Vertical bars indicate standard errors of the mean (n=12 plots). Significant differences between the two treatments in each season (ANOVA) are indicated with one asterisk (p<0.1), two asterisks (p<0.05) and three asterisks (p<0.01). Significance for the overall global effect of the treatment (repeated measurements ANOVA) is indicated inside the panels.
0
5
10
15
20
25
30
*
Soil
Tem
pera
ture
(ºC
)
drought p= 0.05
0
5
10
15
20
25
30
controldrought
drought p< 0.0001
**
*****
Soil
Moi
stur
e (%
volu
me)
Apr Aug Nov Feb Apr2003 2004

Chapter 1 Seasonal soil CO2 and VOC exchange rates in a Mediterranean holm oak forest
34
Figure 1.1.2. Seasonal course of soil CO2 emission rates during the studied period. Error bars indicate standard error of the mean (n=12 plots per treatment and season). Significant differences between the drought and control treatments in each season are indicated with one asterisk (p<0.1), two asterisk (p<0.05) and three asterisks (p<0.01). Significance for treatment global effect on CO2 emission rates from soil (repeated measurements ANOVA) is indicated inside the graph.
P. latifolia exhibited lower annual average of leaf water potential values than Q.
ilex (-2.9 ± 0.2 and –2.1 ± 0.1 Mpa respectively). Both species had maximum values in
spring and autumn, and minimum values in summer (Fig. 1.1.3 a and b). The summer
drought response was greater in P. latifolia, with values that reached –6.7 ± 0.3 MPa,
while values for Q. ilex only reached –3.1 ± 0.1 MPa. Slightly significant differences
between treatments were found in spring 2004 in Q. ilex and P. latifolia (p=0.056 and
p=0.059 respectively), (Fig. 1.1.3 a, b).
0
1
2
3
4
5
controldrought
drought p< 0.05drought x season p< 0.05
***
*
*So
il C
O2
flux
( μm
ol m
-2 s
-1)
Apr Aug Nov Feb Apr
2003 2004

Chapter 1 Seasonal soil CO2 and VOC exchange rates in a Mediterranean holm oak forest
35
Leaf water potentials were strongly correlated with soil moisture (logarithmic
regression: R= 0.92, n=10, p=0.0001 in Q. ilex and R= 0.94, n=10, p<0.0001 in P.
latifolia).
Figure 1.1.3 Seasonal course of leaf water potential in the two dominant plant species of the studied holm oak forest, Q. ilex (a) and P. latifolia (b). Seasonal course of relative water content in Q. ilex (c) in P. latifolia (d). Vertical bars indicate standard errors of the mean (n=8 samples per season, treatment and species). One asterisk indicates significant differences between the two treatments (p<0.1) in each season. No overall significant drought effect was found for any of the two species (repeated measurements ANOVA).
Annual mean values of RWC were similar in both species (0.83 ± 0.01 for Q.
ilex and 0.80 ± 0.02 for P. latifolia ). They showed a variation pattern similar to the
LWP (Fig. 1.1.3 c, d), especially in control plants, although the range of variation in
each species was different. P. latifolia minimum in summer (0.63 ± 0.07), and
maximum in both spring and autumn, with slightly lower values in drought than in
control plots treatments in the autumn season (p<0.1). For Q. ilex RWC values were
constant throughout the year. No overall significant effects of drought treatment were
detected (Fig. 1.1.3 c, d).
-7
-6
-5
-4
-3
-2
-1
0
control
drought
0,5
0,6
0,7
0,8
0,9
a b
c d
* *
*
Apr Aug Nov Feb Apr
2003 2004
Apr Aug Nov Feb Apr
Quercus ilex Phillyrea latifolia
Leaf
Wat
er P
oten
tial (
MPa
)R
elat
ive
Wat
er C
onte
nt
2003 2004

Chapter 1 Seasonal soil CO2 and VOC exchange rates in a Mediterranean holm oak forest
36
Figure 1.1.4. Seasonal course of net photosynthetic rates in sunlit leaves of Quercus ilex (a), and in sunlit leaves of Phillyrea latifolia (b). Seasonal course of stomatal conductance in sunlit leaves of Q. ilex (c), and in sunlit leaves of P. latifolia (d) during the studied period. Error bars indicate standard error of the mean (n=6 measures per treatment, season and species). One asterisk indicates (p<0.1) and two asterisk indicates (p<0.05) significant differences between the two treatments for the signalled species and season. No overall drought treatment effect (repeated measures ANOVA), was found for any of the two species.
Annual leaf CO2 exchange rates in Q. ilex were higher than in P. latifolia (8 ± 1
and 5 ± 1 μmol m-2 s-1 respectively, Fig. 1.1.4 a and b). Both species’ leaf CO2
exchange was minimum in summer with values near to 0 or even slightly negative in P.
latifolia. The maximum values in both species were found in spring and autumn, when
the water availability was high (Fig 1.1.1).
Leaf CO2 exchange rates were well correlated to leaf water potentials
(logarithmic regression: r2= 0.62, n=8, p<0.05 in Q. ilex and r2=0.83, n=8, p<0.005 in P.
latifolia). There were significant decreases (45%) of leaf CO2 exchange in drought plots
in spring (P. latifolia p<0.05) and in autumn (Q. ilex p<0.1), when there was rain to be
0
5
10
15
20
0
50
100
150
200 control
drought
a b
c d
*
*
*
Apr Aug Nov Feb
2003 2004
Apr Aug Nov Feb
Quercus ilex Phillyrea latifolia
Net
Pho
tosy
nthe
tic R
ate
(μm
ol m
-2 s
-1)
2003 2004
Stom
atal
Con
duct
ance
(m
mol
m-2
s-1
)
* *
* *
Chapter 1 Seasonal soil CO2 and VOC exchange rates in a Mediterranean holm oak forest
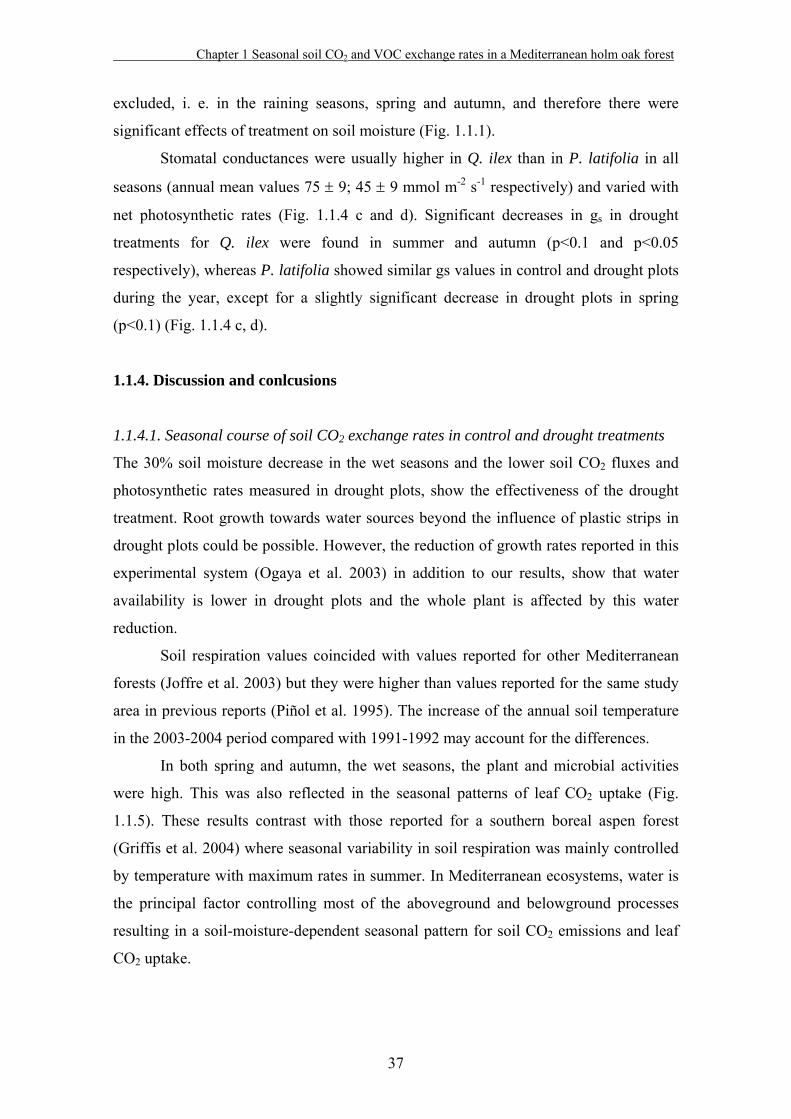
37
excluded, i. e. in the raining seasons, spring and autumn, and therefore there were
significant effects of treatment on soil moisture (Fig. 1.1.1).
Stomatal conductances were usually higher in Q. ilex than in P. latifolia in all
seasons (annual mean values 75 ± 9; 45 ± 9 mmol m-2 s-1 respectively) and varied with
net photosynthetic rates (Fig. 1.1.4 c and d). Significant decreases in gs in drought
treatments for Q. ilex were found in summer and autumn (p<0.1 and p<0.05
respectively), whereas P. latifolia showed similar gs values in control and drought plots
during the year, except for a slightly significant decrease in drought plots in spring
(p<0.1) (Fig. 1.1.4 c, d).
1.1.4. Discussion and conlcusions
1.1.4.1. Seasonal course of soil CO2 exchange rates in control and drought treatments
The 30% soil moisture decrease in the wet seasons and the lower soil CO2 fluxes and
photosynthetic rates measured in drought plots, show the effectiveness of the drought
treatment. Root growth towards water sources beyond the influence of plastic strips in
drought plots could be possible. However, the reduction of growth rates reported in this
experimental system (Ogaya et al. 2003) in addition to our results, show that water
availability is lower in drought plots and the whole plant is affected by this water
reduction.
Soil respiration values coincided with values reported for other Mediterranean
forests (Joffre et al. 2003) but they were higher than values reported for the same study
area in previous reports (Piñol et al. 1995). The increase of the annual soil temperature
in the 2003-2004 period compared with 1991-1992 may account for the differences.
In both spring and autumn, the wet seasons, the plant and microbial activities
were high. This was also reflected in the seasonal patterns of leaf CO2 uptake (Fig.
1.1.5). These results contrast with those reported for a southern boreal aspen forest
(Griffis et al. 2004) where seasonal variability in soil respiration was mainly controlled
by temperature with maximum rates in summer. In Mediterranean ecosystems, water is
the principal factor controlling most of the aboveground and belowground processes
resulting in a soil-moisture-dependent seasonal pattern for soil CO2 emissions and leaf
CO2 uptake.

Chapter 1 Seasonal soil CO2 and VOC exchange rates in a Mediterranean holm oak forest
38
Figure 1.1.5. Relationship between the seasonal means of the soil CO2 flux (n=12 in control and drought plots) and the corresponding seasonal means of soil moisture (n=12 on control and drought plots) and relationship between the seasonal means of the leaf CO2 exchange (n=6 per species Q. ilex and P. latifolia, in control and drought plots) and the corresponding seasonal means of soil moisture (n=6 in control and drought plots). Error bars indicate ± standard error of the means.
0
1
2
3
4
5
6
7
control
drought
y = 0,30424 + 0,12126x, r2=0.81, p<0.05y = 0,74513 + 0,076849x, r2=0.90, p=0.01
0
5
10
15
20
0 5 10 15 20 25 30
y = 0,24939 + 0,43837x, r2=0.79, p<0.01 y = 1,6665 + 0,38926x, r2=0.40, p<0.1
Soil Moisture (%volume)
Soil
CO
2 flux
(μm
ol m
-2 s
-1)
Net
pho
tosy
nthe
tic ra
tes
(μm
ol m
-2 s
-1)

Chapter 1 Seasonal soil CO2 and VOC exchange rates in a Mediterranean holm oak forest
39
Soil respiration is well correlated with microbial activity (Orchand et al. 1983).
During summer drought, the physiological activity of microorganisms in response to the
increase in temperature appears to be constrained by low soil moisture (Conant et al.
2004, Martin and Bolstad 2005). Similarly, drought treatment reduced soil respiration
by 43% (p<0.05) during the rainy season in spring (Fig. 1.1.2). The reduction of soil
respiration by excluding rainfall was found also by Borken et al. (1999, 2006) in similar
studies on the soil respiration responses to experimental drought. To what extent is this
reduction caused by lower microbial activity is unknown. Borken et al. (2006) suggest a
stronger effect of drought in heterotrophs than in autotrophohs because they observed
under drought smaller decreases in photosynthesis than in soil respiration. In our study
photosynthetic rates decreased 40% in drought plots in spring only in P. latifolia (Fig.
1.1.4). Moreover, it is known that the root contribution to total soil respiration is higher
during the growing season (Tang et al., 2005) thus, the reduction in the CO2 efflux
measured in drought plots in spring might be attributed to lower microbial activity.
Figure 1.1.6. Relationship between the seasonal means of the soil CO2 flux (n=12 per season in control and drought plots) and the seasonal means of the net photosynthetic rates in Q. ilex and P. latifolia (n=6 per season and species in control and drought plots). Error bars indicate ± standard error of the means.
0
1
2
3
4
5
6
7
-5 0 5 10 15 20
control
drought
y = 0,64439 + 0,19756x, r2=0.66, p<0.05y = 1,0964 + 0,096324x, r2=0.48, p<0.1
Net photosynthetic rates (μmol m-2 s-1)
Soil
CO
2 flux
(μm
ol m
-2 s
-1)

Chapter 1 Seasonal soil CO2 and VOC exchange rates in a Mediterranean holm oak forest
40
Nevertheless results showed a different response of soil CO2 emissions to
drought treatment in wet spring compared with the dry summer. In summer, CO2
emissions in drought plots were higher than in control plots which were practically zero
(Fig. 1.1.2). Soil moisture in summer was very low in both treatments (Fig 1.1.1), but
plants and microorganisms under drought treatment had been subjected to a lower water
availability for a longer time than those in control plots. Prolonged low water
availability in the drought treatment plots might have favoured root growth in those
plots, resulting in enhanced root respiration. There are several reasons for high root
respiration rate under severe drought stress (Li et al. 2004) in addition to the physical
larger root surface. A change in the plant source-sink relationship may led to a greater
proportion of assimilates transferring to roots, providing more substrate supply for root
respiration. This could be a strategy to improve the nutrient availability and water
uptake for the drought-stressed plant. Thus, in summer, CO2 emissions in drought plots
could be mostly driven by autotrophic metabolism as a result of changes in the
importance of root versus soil microbial activity. Although this hypothesis needs further
investigation, the significant correlation (r2= 0.56, p<0.05) between leaf and soil CO2
exchange in summer in drought plots, that was not found in control plots (r2= 0.0001,
p=0.76), provides support for the hypothesis that prolonged low water availability
favour root growth.
1.1.4.2. Coupling between soil respiration and leaf CO2 exchange.
Numerous studies of leaf gas exchange have demonstrated similar leaf responses to
those described here of net photosynthetic rates decreasing from spring to summer (Fig.
1.1.4) with increasing drought (Oechel et al. 1981, Tenhunen et al. 1990, Peñuelas et al.
1998, Ogaya and Peñuelas 2003). For instance, in a Mediterranean maquis characterised
by tall shrubs in Castelporziano (Italy), the seasonal variation of leaf CO2 exchange
rates and stomatal conductances (Gratani and Varone 2004) were very similar to those
found at Prades. The study of soil and leaf CO2 exchange throughout the year showed
that soil moisture and temperature were the main factors driving CO2 exchange.
Root respiration comprises a significant fraction of soil respiration (Irvine et al.
2005) and it strongly reflects plant metabolism (Ekblad and Högberg, 2001). We have
found a significant correlation between photosynthetic rates and soil respiration rates
(Fig. 1.1.6). However, this could be an indirect relationship resulting from seasonal
variations of temperature, moisture and phenology. Moreover, there could be time lags
Chapter 1 Seasonal soil CO2 and VOC exchange rates in a Mediterranean holm oak forest
41
between the assimilation of carbon in leaves and the carbon transport to the roots
(McDowell et al., 2004). Further studies considering separately autotrophic versus
heterotrophic respiration in a high frequency of measurements over a number of days
are needed to further confirm this correlation and gain knowledge on the relationships
between aboveground and belowground plant processes. Although our experimental
methods did not allow separation of the two components of the total soil respiration,
seasonal data correlation between carbon fixation and soil respiration in control plots
suggests a link between both variables.
The different soil respiration response to drought in spring and summer
highlights the need of a better understanding of the contribution of autotrophic
respiration to total soil CO2 exchange. The results suggested changes in drought
conditions towards a decrease in the microorganisms/roots ratio of activities in the
rhizosphere, especially in summer.
Finally, coupled GCM and ecophysiology models predict a 20-30% decrease in
water availability over the next three or four decades (IPCC 2001, Peñuelas et al.,
2005). Our results suggest a 44% reduction in soil and foliar CO2 exchange rates in wet
seasons in response to this decrease in water availability, demonstrating the importance
of considering climate change effects on soil CO2 flux and foliar CO2 uptake in the
budgeting of carbon in the atmosphere and the biosphere. However, acclimation of soil
respiration and photosynthesis to prolonged drought could occur and therefore long-
term studies of soil and leaf CO2 exchange are needed to discern the climate change
effects on soil CO2 fluxes.
Acknowledgements
This research was supported by Spanish MEC grants REN2003-04871, and CGL2004-
01402/BOS. We also gratefully acknowledge the partial funding by the ISONET
European Commission contract MC-RTN-CT-2003-504720, the ALARM European
Commision contract 506675 and a Fundación BBVA 2004 grant.
References.
Bombelli, A., Gratani, L. 2003. Interspecific differences of leaf gas exchange and water relations of three evergreen Mediterranean shrub species. Photosynthetica 41 (4), 619-625.

Chapter 1 Seasonal soil CO2 and VOC exchange rates in a Mediterranean holm oak forest
42
Borghetti M, Magnani F, Fabrizio A, Saracino A 2004. Facing drought in a Mediterranean post-fire community: tissue water relations in species with different life traits. Acta Oecologica-International Journal of Ecology 25 (1-2), 67-72.
Borken, W., Xu, Y. -J., Brumme, R., Lamersdorf, N. 1999. A climate scenario for carbon dioxide and dissolved organic carbon fluxes from a temperate forest soil: drought and rewetting effects. Soil Science Society of America Journal 63, 1848-1855. Borken, W., Savage, K, Davidson, E. A., Trumbore, S. E. 2006. Effects of experimental drought on soil respiration and radiocarbon efflux from a temperate forest soil. Global Change Biology 12, 177-193. Conant, R. T., Dalla-Betta, P., Klopatek, C. C., Jeffrey, M. J. 2004. Controls on soil respiration in semiarid soils. Soil Biology and Biochemistry 36, 945-951. Curiel Yuste J., Janssens I. A., Carrara A. and Ceulemans R. 2004. Annual Q10 of soil respiration reflects plant phenological patterns as well as temperature sensitivity . Global Change Biology 10, 161-169. Ekblad A. and Högberg P. 2001. Natural abundance of 13C in CO2 respired from forest soils reveals speed of link between tree photosynthesis and root respiration. Oecologia 124, 305-308.
Field, C.B., Behrenfeld, M.J., Randerson, J.T., Falkowsky, P. 1998. Primary production of the biosphere: Integrating terrestrial and oceanic components. Science 281 (5374), 237-240.
Flexas, J., Gulias, J.,Jonasson, S., Medrano, H. Mus, M. 2001. Seasonal patterns and control of gas exchange in local populations of the Mediterranean evergreen shrub Pistacia lentiscus L. Acta Oecologica-International Journal of Ecology 22 (1), 33-43.
Gratani L. and Varone L. 2004. Adaptive photosynthetic strategies of the Mediterranean maquis species according to their origin. Photosynthetica 42 (4), 551-558. Hanson P. J., Edwards N. T., Garten C. T., Andrews J. A. 2000. Separating root and soil microbial contributions to soil respiration: a review of methods and observations. Biogeochemistry 48, 115-146. Griffis, T. J., Black, T. A., Gaumont-Guay, D., Drewitt, G. B., Nesic, Z., Barr, A. G., Morgenstern, K., Kljun, N. 2004. Agricultural and Forest Meteorology 125, 207-223. IPCC 2001. Climate change 2001: The Scientific Basis. Contribution of Working Group I. Third Assessement Report of Intergovernamental Panel on Climate Change. Hougton, J. T., Dung, Y., Griggs, D. J., Noguer, M., Van der Linden, P., Dui, X., Maskell, K., Johnson, C. A., (Eds). Cambridge University Press, Cambridge. Joffre R., Ourcival J. M., Rambal S., Rocheteau A. 2003. The key-role of top soil moisture on CO2 efflux from a Mediterranean Quercus ilex forest. Annals of forest sciencie 60 (6), 519-526.

Chapter 1 Seasonal soil CO2 and VOC exchange rates in a Mediterranean holm oak forest
43
Irvine, J., Law, B. E., Kurpius, M. R. 2005. Coupling of canopy gas exchange with root and rhizosphere respiration in a semi-arid forest. Biogeochemistry 73, 271-282. Li F. M., Liu H. S., Xu H. 2004. Deficiency of water can enhance root respiration rate of drought-sensitive but not drought-tolerant spring wheat. Agricultural Water management, 64, 41-48. Llusià, J., Peñuelas, J. 2000. Seasonal patterns of terpene content and emission from seven Mediterranean woody species in field conditions. American Journal of Botany 87, 133-140. Martin J. G. and Bolstad P. V. 2005. Annual soil respiration in broadleaf forests of northern Wisconsin: influence of moisture and site biological, chemical, and physical characteristics. Biogeochemistry, 73, 149-182. McDowell, N.G., Bowling, D.R., Bond, B.J., Irvine, J., Law, B. E., Anthoni, P., Ehleringer, J. R. 2004. Response of the carbon isotopic content of ecosystem, leaf and soil respiration to meteorological and physiological driving factors in a Pinus ponderosa ecosystem. Global Biogeochemical Cycles, 18 (1): Art. No. GB1013.
Oechel, W. C., Lawrence, W., Mustafa, J., Martínez, J. 1981. Energy and carbon allocation. In: Resource use by chaparral and matorral: a comparison of vegetation function in two Mediterranean type ecosystems. Miller, P. C. (ed). Springer-Verlag, New York: pp. 409-433.OCLC: 755-1039.
Ogaya R, Peñuelas J. 2003 Comparative seasonal gas exchange and chlorophyll fluorescence of two dominant woody species in a Holm Oak Forest. Flora 198, 132-141.
Ogaya, R., Peñuelas, J. 2003. Comparative field study of Quercus ilex and Phillyrea latifolia: photosynthetic response to experimental drought conditions. Environmental and Experimental Botany 50, 137-148.
Ogaya R, Peñuelas J., Martínez-Vilalta J., Mangiron M. 2003. Effect of drought on diameter increment of Quercus ilex, Phillyrea latifolia, and Arbutus unedo in a holm oak forest of NE Spain. Forest Ecology and Management 180. 175-184.
Orchand, V., Cook, F. J. 1983. Relationship between soil respiration and soil moisture. Soil Biology and Biochemistry 15, 447-453.
Pendall E., Bridgham S., Hanson P. J., Hungate B., Kicklighter D. W., Johnson D. W., Law B. E., Luo Y. Q., Megonigal J. P., Olsrud M., Ryan M. G., Wang S. Q. 2004. Below-ground process responses to elevated CO2 and temperature: a discussion of observations, measurement methods, and models. New Phytologist 162, 311-322.
Peñuelas, J., Filella, I., Llusià, J., Siscart, D., Piñol, J. 1998. Comparative field study of spring and summer leaf gas exchange and photobiology of the mediterranean trees Quercus ilex and Phillyrea latifolia. Journal Experimental Botany 49 (319), 229-238.

Chapter 1 Seasonal soil CO2 and VOC exchange rates in a Mediterranean holm oak forest
44
Peñuelas, J., Llusià, J. 1999. Short-term responses of terpene emission rates to experimental changes of PFD in Pinus halepensis and Quercus ilex in summer field conditions. Environmental Experimental Botany 42, 61-68.
Peñuelas J., Lloret F., Montoya R. 2001. Severe drought effects on Mediterranean woody flora in Spain. Forest Sciencie 47 (2), 214-218.
Peñuelas, J., Filella, I., Sabate, S., and Gracia, C. 2005. Natural systems: terrestrial ecosystems. In Report on Climate change in Catalonia. Edited by J.E. Llebot. Institut d'Estudis Catalans, Barcelona. pp. 517-553.
Piñol J., Alcañiz J. M., Roda F. 1995. Carbon-dioxide efflux and pCO2 in soils of 3 Quercus ilex montane forests. Biogeochemistry 30 (3), 191-215. Ryan M. G. and Law B. E. 2005. Interpreting, measuring, and modelling soil respiration. Biogeochemistry 73, 3-27. Sabaté, S., Gracia, C., Sánchez, A. 2002. Likely effects of climate change on growth of Quercus ilex, Pinus halepensis, and Fagus sylvatica forest in the Mediterranean region. Forest Ecology and Management 162, 23-37.
Sánchez-Díaz, M. F., Kramer, P. J. 1973. Turgor differences and water stress in maize and sorghum leaves during drought and recovery. Journal of Experimental Botany 24, 511-515.
Schlesinger, W. H., Andrews, J. A. 2000. Soil respiration and the global carbon cycle. Biogeochemistry 48, 7-20. Tang, J.W., Misson, L., Gershenson, A., Cheng, W. X., Goldstein, A. H. 2005. Continuous measurements of soil respiration with and without roots in a ponderosa pine plantation in the Sierra Nevada Mountains. Agricultural and Forest Meteorology 132 (3-4), 212-227 Tenhunen, J. D., Sala Serra, A., Harley, P. C., Dougherty, R. L., Reynolds, J. F. 1990. Factors influencing carbon fixation and water use by Mediterranean sclerophyll shrubs during summer drought. Oecologia 82, 381-393. Tretiach, M. 1993. Photosynthesis and transpiration of evergreen Mediterranean and deciduous trees in a ecotone during a growing season. Acta Oecologia 14, 341-360.

Chapter 1 Seasonal soil CO2 and VOC exchange rates in a Mediterranean holm oak forest
45
1.2. Seasonal soil VOC exchange rates in a
Mediterranean holm oak forest and their
responses to drought conditions

Chapter 1 Seasonal soil CO2 and VOC exchange rates in a Mediterranean holm oak forest
46
Chapter 1 Seasonal soil CO2 and VOC exchange rates in a Mediterranean holm oak forest
47
Abstract.
Available information on soil Volatile Organic Compound (VOC) exchange, emissions
and uptake, is very scarce. We here describe the amounts and seasonality of soil VOC
exchange during a year in a natural Mediterranean holm oak forest growing in Southern
Catalonia. We investigated changes in soil VOC dynamics in drought conditions by
decreasing the soil moisture to 30% of ambient conditions by artificially excluding
rainfall and water runoff, and predicted the response of VOC exchange to the drought
forecasted in the Mediterranean region for the next decades by GCM and
ecophysiological models.
The annual average of the total (detected) soil VOC and total monoterpene
exchange rates were 3.2 ± 3.2 and –0.4 ± 0.3 μg m-2 h-1 respectively, in control plots.
These values represent 0.003 % of the total C emitted by soil at the study site as CO2
whereas the annual mean of soil monoterpene exchange represents 0.0004 % of total C.
Total soil VOC exchange rates in control plots showed seasonal variations following
changes in soil moisture and phenology. Maximum values were found in spring (17 ± 8
μg m-2 h-1). Although there was no significant global effect of drought treatment on the
total soil VOC exchange rates, annual average of total VOC exchange rates in drought
plots resulted in an uptake rate (-0.5 ± 1.8 μg m-2 h-1 ) instead of positive net emission
rates. Larger soil VOC and monoterpene exchanges were measured in drought plots
than in control plots in summer, which might be mostly attributable to autotrophic
(roots) metabolism.
The results show that the diversity and magnitude of monoterpene and VOC soil
emissions are low compared with plant emissions, that they are driven by soil moisture,
that they represent a very small part of the soil-released carbon and that they may be
strongly reduced or even reversed into net uptakes by the predicted decreases of soil
water availability in the next decades. In all cases, it seems that VOC fluxes in soil
might have greater impact on soil ecology than on atmospheric chemistry.
Key words: Soil VOC exchange, soil CO2 flux, Mediterranean holm oak forest, climate change,
monoterpenes, drought

Chapter 1 Seasonal soil CO2 and VOC exchange rates in a Mediterranean holm oak forest
48
1.2.1. Introduction
Emissions of Biogenic Volatile Organic Compounds (BVOCs) from vegetation have
been an area of research interest for several decades because of their important role in
biology and in atmospheric chemistry (Fehsenfeld et al., 1992; Kesselmeier and Staudt,
1999; Peñuelas and Llusià, 2003, 2004). There are several roles hypothesized for VOC
emission in plants, including various protective functions and intra- and inter-specific
communication (Langenheim 1994, Owen and Peñuelas, 2005). There are many studies
of VOC emissions from Mediterranean evergreen species, because the role proposed for
VOCs could be important in these species which are typically exposed to high
temperature and drought-stress summer conditions (Di Castri, 1973; Terradas and Savé,
1992) and because the Mediterranean vegetation is rich in plant species storing VOCs in
specialized organs (Peñuelas and Llusià, 2001).
It is known that soils may be both VOC sources (Guenther, 1999a) and sinks
(Van Ginkel et al. 1987; Bender et al., 1993), but the available information is scarce
(Hayward et al., 2001), much more scarce than for vegetation, especially for the
Mediterranean ecosystems. VOCs in natural soils may be derived from a variety of
sources. The root system of plants (Janson 1993, Chen et al. 2004) and soil
microorganisms (Scholler et al. 2002) seem to be the major sources of emission. Their
production is strongly influenced by environmental conditions. For example, Stahl and
Parkin (1996) studied the effect of different substrates and selective antibiotics on soil
VOC emissions. They found that treatments dominated by different groups of
microorganisms produced different kind of VOCs and the VOC composition was
different at each sampling day and also changed within a given treatment. Consumption
of VOCs by microorganisms has been demonstrated in laboratory conditions (Cleveland
and Yavitt, 1998; Kleinheinz et al. 1999; Demyttenaere et al. 2000; Yoo and Day 2002)
but, as far as we know, there are no reports on microbial consumption activity in natural
conditions. Soil VOC exchange in natural and laboratory conditions could be different.
The presence of roots and other below-ground biota in natural conditions may be
synergistic or antagonistic factors affecting the VOC consumption/emission by
microorganisms. For instance, Ryu et al. (2003) have reported bacterial volatiles that
promote growth in plants, and Mackie and Wheatley (1999) described negative
interactions between bacteria and fungi mediated by VOCs.
Chapter 1 Seasonal soil CO2 and VOC exchange rates in a Mediterranean holm oak forest
49
Yet, the role of soil VOCs is poorly understood in natural conditions due to the
scarcity of field data (Hayward et al., 2001). We have little information about soil
VOCs seasonality and also on their responses to the lower water availability predicted
in the Mediterranean region by Global Change Modelling and ecophysiological models
(IPCC, 2001; Peñuelas et al, 2005).
We conducted an study of soil VOC exchange in a typical Mediterranean holm
oak forest. The dominant species, Quercus ilex L., is a tree well adapted to drought and
widely distributed in the Mediterranean basin. Phillyrea latifolia L. is also codominant
in this forest and frequent in the Mediterranean forests and shrublands. It is a tall shrub
species associated with the holm oak forest. Both Q. ilex and P. latifolia emit significant
amounts of monoterpenes and other VOCs, but do not appear to store them (Llusià and
Peñuelas, 1998; Peñuelas and Llusià, 1999).
The goals of this study were (i) to construct an inventory of the VOC (especially
monoterpenes) exchange between soils and the atmosphere, particularly for
monoterpenes, (ii) to investigate the seasonality of soil-atmosphere VOC exchange, (iii)
to investigate possible links to photosynthetic performance, (iv) to test dependence of
VOC exchange on abiotic factors like soil moisture and temperature, and (v) to study
the response of soil VOC emissions to the lower soil water availability predicted for the
next decades by GCM and ecophysiological models (IPCC 2001, Sabate et al. 2002,
Peñuelas et al. 2005).
1.2.2. Material and methods
1.2.2.1. Sampling site, experiment design and sampling strategy.
Full details of the sampling site and strategy and the effectiveness of the drought
treatment are described before in this Chapter 1, section 1.1.2. In short, the study was
conducted in a typical Mediterranean mountains environment in the Prades region of
Southern Catalonia. Twelve 1x10 m plots were subjected to run off and rainfall
exclusion, with a further 12 control plots with natural rain and drainage. Treatments
started in March 1999 and measurements of soil VOC exchange were conducted in
parallel to those of soil and foliar CO2 fluxes (Chapter 1.1), during the four seasons of
the year from spring 2003 to spring 2004.

Chapter 1 Seasonal soil CO2 and VOC exchange rates in a Mediterranean holm oak forest
50
1.2.2.2. Measurements of soil VOC exchange with the atmosphere.
Soil CO2 flux and VOC exchange were sampled using a dynamic PVC soil cuvette
system. One soil chamber per plot (n=12) was installed permanently since Winter 2002.
Measurements of soil CO2 flux and VOC sampling were conducted simultaneously. An
IRGA non-dispersive CO2 analyser (EGM-4, PP Systems, Hitchin, Hertfordshire,
England) was connected to the outlet of the cuvette for determination of CO2 (sampling
interval and duration and flux calculation details in Chapter 1.1). Air from the cuvette
flowed though a T system impelled by a pump towards a glass tube (11.5 cm long and
0.4 internal diameter) filled with VOC adsorbents Carbotrap C (300 mg), Carbotrap B
(200 mg), and Carbosieve S-III (125 mg) (Supelco, Bellefonte, Pennsylvania) separated
by plugs of quartz wool. The hydrophobic properties of the tubes minimized sample
degradation by water. Standard compounds injected onto these tubes (3-hexen-1-ol, α-
pinene, β-pinene, limonene and dodecane) did not deteriorate before analysis. These
tubes were conditioned prior to use by heating at 350ºC for 3 minutes in a stream of
purified helium.
The VOC flow from the soil chamber to the glass tube filled with adsorbents
varied between 0.2 and 0.3 L min-1 depending on the glass tube adsorbent and quartz
wool packing. Soil VOC were sampled during 5 min. and the flow was regulated with a
peristaltic pump (Portable Escort Elf Pump, P/N 497701 S/N A2-31854; Mine Safety
Appliances Company, Pittsburg, Pennsylvania, USA). The flow adjustment was
determined with a bubble flowmeter. The interval sample from plot to plot was 15 min.
Glass tubes were stored in a portable fridge at 4ºC and taken to the laboratory, where
they were stored at -28ºC until analysis (within 1 week).
VOC analyses were conducted in a GC-MS (Hewlett Packard HP59822B, Palo
Alto, California). Trapped VOCs were desorbed (Thermal Desorption Unit, Model
890/891; Supelco, INC, Bellefonte, Pennsylvania) at 250ºC during 3 min and injected
into a 30 m x 0.25 mm x 0.25 mm film thickness capillary column (Supelco HP-5,
Crosslinked 5% pH Me Silicone). After sample injection, the initial temperature (40°C)
was increased at 30ºC min-1 up to 60ºC, and thereafter at 10ºC min-1 up to 150ºC,
maintained for 3 min, and thereafter at 70ºC min-1 up to 250ºC, which was maintained
for another 5 min. Helium flow was 1 mL min-1. The identification of VOCs was
conducted by GC-MS and comparison with standards from Fluka (Chemie AG, Buchs,
Switzerland), and GCD Chemstation G1074A HP reference library. The reference

Chapter 1 Seasonal soil CO2 and VOC exchange rates in a Mediterranean holm oak forest
51
compounds used for the identification were: 3-hexen-1-ol, α-pinene, β-pinene,
limonene and dodecane. Calibration with a range of solutions of these standards every 7
analyses was used for quantification. VOC calibration curves (N=5 different VOC
concentrations) were always significant (r2> 0.97) in the relationship between signal and
VOC concentration.
Calculations of VOC exchange rates were made on a mass balance basis, and
they were also normalised to 30 ºC using the algorithm of Guenther et al. (1993): E = Es
exp (β (T – Ts)), where E is the emission rate (μg m-2 h-1 in soil) at soil temperature T
(K), Es the emission rate at standard temperature Ts (K) and β (K-1) is an empirically
determined coefficient (0.09). Although mechanisms of release may be quite different
between soil and plants, there was a significant relationship between monotepernes such
as alpha-pinene and soil temperature. We calculated Es = -1.31 μg m-2 h-1 and β = 0.10
for alpha-pinene fluxes.
1.2.2.3. Statistical analyses.
Repeated measures analyses of variance (ANOVA) were conducted with total soil VOC
and soil monoterpene exchange rates as dependent variables and with treatment and
season as independent factors. Data was log transformed when necessary to meet the
ANOVA assumptions. Regression analyses model II were conducted with seasonal
mean values of the studied variables. All analyses were performed with STATVIEW
5.01 software package (Abacus Concepts Inc., 1998).
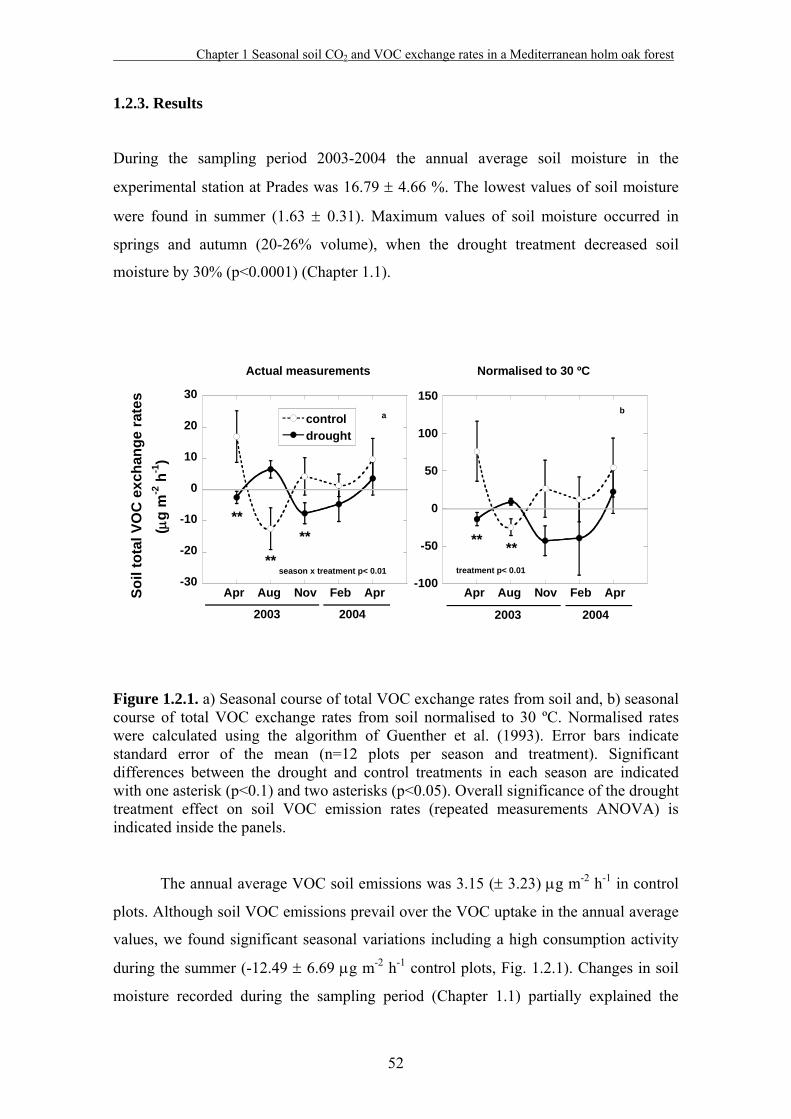
Chapter 1 Seasonal soil CO2 and VOC exchange rates in a Mediterranean holm oak forest
52
1.2.3. Results
During the sampling period 2003-2004 the annual average soil moisture in the
experimental station at Prades was 16.79 ± 4.66 %. The lowest values of soil moisture
were found in summer (1.63 ± 0.31). Maximum values of soil moisture occurred in
springs and autumn (20-26% volume), when the drought treatment decreased soil
moisture by 30% (p<0.0001) (Chapter 1.1).
Figure 1.2.1. a) Seasonal course of total VOC exchange rates from soil and, b) seasonal course of total VOC exchange rates from soil normalised to 30 ºC. Normalised rates were calculated using the algorithm of Guenther et al. (1993). Error bars indicate standard error of the mean (n=12 plots per season and treatment). Significant differences between the drought and control treatments in each season are indicated with one asterisk (p<0.1) and two asterisks (p<0.05). Overall significance of the drought treatment effect on soil VOC emission rates (repeated measurements ANOVA) is indicated inside the panels.
The annual average VOC soil emissions was 3.15 (± 3.23) μg m-2 h-1 in control
plots. Although soil VOC emissions prevail over the VOC uptake in the annual average
values, we found significant seasonal variations including a high consumption activity
during the summer (-12.49 ± 6.69 μg m-2 h-1 control plots, Fig. 1.2.1). Changes in soil
moisture recorded during the sampling period (Chapter 1.1) partially explained the
Soil
tota
l VO
C e
xcha
nge
rate
s
(μg
m-2
h-1
)
a bcontroldrought
-30
-20
-10
0
10
20
30
-100
-50
0
50
100
150
**** **
**
season x treatment p< 0.01 treatment p< 0.01
Apr Aug Nov Feb Apr
2003 2004 2003 2004
Actual measurements Normalised to 30 ºC
Apr Aug Nov Feb Apr
**

Chapter 1 Seasonal soil CO2 and VOC exchange rates in a Mediterranean holm oak forest
53
seasonal variations in VOC soil exchange rates. Soil VOC exchange was positive in
spring and autumn, resulting in overall emissions from the soil surface. There was a
significant correlation between total soil VOC emission exchange rates and soil
moisture in control plots (r2= 0.64, p=0.1 Fig. 1.2.4).
Figure 1.2.2 Seasonal course of monoterpene soil exchange rates (a) and monoterpene exchange rates normalised to 30 ºC (b). Normalised rates were calculated using the algorithm of Guenther et al. (1993). Error bars indicate standard error of the mean (n= 12 plots per season and treatment). Significance for the overall effect of drought on monoterpene emission rates from soil (repeated measurements ANOVA) is indicated inside the panels.
Total soil VOC emission rates tended to be higher in control than in drought
treatments, especially in April 2003 and November 2003 (p<0.05 and p<0.1
respectively, Fig. 1.2.1 a) when there were emissions from control plots, and uptakes in
drought plots. However, the overall treatment effect on total soil VOC emissions was
only significant when considering soil emission rates normalised to 30ºC (p<0.05 , Fig.
1.2.1 b).
In summer, there was uptake of VOC and monoterpenes by control plots and
emissions from drought plots (Fig. 1.2.1 a and b; Fig. 1.2.2 a and 1.2.2 b). This was
unexpected, because it was contrary to the annual exchange trends (i.e. emissions from
control plots and uptake by drought plots). The spring response was more a seasonal or
phenological response linked to soil moisture and phenological processes, e. g. high net
photosynthetic rates in spring in Q. ilex and P. latifolia (9.5 ± 1.5 μmol m-2 s-1 and 7.0 ±
Soil
mon
oter
pene
exc
hang
e ra
tes
(μ
g m
-2 h
-1)
a bcontroldrought
-4
-2
0
2
4
-20
-10
0
10
20
30
**
**
**season x treatment p< 0.01
season p< 0.05season x treatment p< 0.01
Apr Aug Nov Feb Apr
2003 2004 2003 2004
Actual measurements Normalised to 30 ºC
Apr Aug Nov Feb Apr
**

Chapter 1 Seasonal soil CO2 and VOC exchange rates in a Mediterranean holm oak forest
54
1.1 μmol m-2 s-1 respectively), rather than a temperature response, since it was still
significant after standardizing to 30ºC (Fig. 1.2.1 b, 3.2.2 b).
Figure 1.2.3. Relationships between the seasonal means of the soil total VOC exchange rates (n=12 in control and drought plots) and the corresponding seasonal means of soil CO2 flux (n=12 in control and drought plots). Error bars indicate ± standard error of the means.
Emission rates of detected monoterpenes were low, and very variable (Fig.
1.2.2), and represented only a small percentage of the total VOC emissions from soil
(8.21%). Contrary to the annual average of soil VOC exchange rates, annual soil
monoterpene exchange rate in control plots was negative, with uptake of soil
monoterpenes (-0.43 ± 0.30 μg m-2 h-1 ) prevailing over the emission (Fig. 1.3.2).
-24
-16
-8
0
8
16
24
32
40
0 1 2 3 4 5
controldrought
y = -12,955 + 7,2368x, r2=0,86, p<0,05
y = 10,614 - 6,3849x, r2=0,50, p=0.18
Tota
l VO
C s
oil e
xcha
nge
rate
s
(μg
m-2
h-1
)
Soil CO2 flux (μmol m-2 s-1)

Chapter 1 Seasonal soil CO2 and VOC exchange rates in a Mediterranean holm oak forest
55
Figure 1.2.4. Relationships between the seasonal means of the soil total VOC exchange rates (n=12 in control and drought plots) and the corresponding seasonal means of soil moisture (n=12 in control and drought plots). Error bars indicate ± standard error of the means.
Soil monoterpene exchange rates in control and drought plots showed different
seasonal variations. Monoterpene exchange pattern throughout the study period in
control treatment showed maxima in February 2004 and minima in August 2003 (Fig.
1.2.2). Although the treatment global effect on soil monoterpene emissions was not
significant, significantly higher emissions were measured in drought plots than in
control plots in August 2003 (drought 1.02 ± 0.96 vs control –2.05 ± 0.66 μg m-2 h-1,
p<0.05) and April 2004 (drought 0.92 ± 0.37 vs control –0.57 ± 0.42 μg m-2 h-1, p<0.05)
(Fig. 1.2.2 a and 1.2.2 b). Emission rates normalized to 30 ºC showed an overall effect
of season on monoterpene emissions (p<0.05) and an interaction with the drought
treatment (p<0.01) (Fig. 1.2.2 b).
-24
-16
-8
0
8
16
24
32
40
0 5 10 15 20 25 30
controldrought
y = -10,073 + 0,83698x, r2=0.64, p=0.1
y = 4,3584 - 0,3816x, r2=0.27, p=0.37
Soil Moisture (%volume)
Tota
l VO
C s
oil e
xcha
nge
rate
s(μ
g m
-2 h
-1)

Chapter 1 Seasonal soil CO2 and VOC exchange rates in a Mediterranean holm oak forest
56
The variety of different identified compounds emitted or taken up was lower in
drought than in control plots (Table 1.2.1) in concordance with the parallel decrease of
emissions. The most common compounds observed were 3-cyclohepten-1-one, 3-
octanone, nonanal, decanal and the monoterpenes α-pinene, limonene and camphene.
Benzene and p-xylene soil uptake and toluene soil emissions occurred occasionally
(Table 1.2.1). There was also a seasonal qualitative effect on the monoterpene
emissions. Tricyclene and camphene dominated emissions in winter, and limonene and
α-pinene in the warm seasons spring and summer (Table 1.2.1). Alpha-pinene and
limonene were the monoterpenes with the highest uptake rates throughout all seasons.
1.2.4. Discussion
1.2.4.1. Soil VOC emission and uptake rates: compounds and amounts
The results show that soil emissions and uptake rates of VOCs in general, and
monoterpenes in particular, are low in this Mediterranean ecosystem. The measured
monoterpene soil emission rates in summer (1.67 ± 1.57 μg m-2 h-1 normalised to 30 ºC,
Fig. 1.2.2 b) were lower than those described in temperate ecosystems, (range 8.97-16.4
μg m-2 h-1) (Hayward et al. 2001). We also measured monoterpene emission rates in Q.
ilex and P. latifolia leaves during the soil VOC sampling campaigns (data not shown).
Mean annual monoterpene emissions showed significant differences between leaf and
soil emission (about 1800 μg m-2 h-1 in Q. ilex and –0.4 μg m-2 h-1 in monoterpene soil
exchange). However, leaf emissions and soil uptake followed the same seasonal pattern.
A greater diversity of compounds was exchanged in control plots than in drought
plots (Table 1.2.1). In all cases, the diversity of monoterpenes (tricyclene, α-pinene,
camphene, β-pinene and limonene) (Table 1.2.1) was slightly lower than reported for a
temperate ecosystem (α-pinene, camphene, limonene, 3-carene, β-pinene, myrcene, α-
phellandrene and α-terpinene) (Hayward et al. 2001). The drier conditions, the lower
biomass and lower enzymatic activity linked to lower water availability may account for
such differences. In fact, drought treatment strongly decreased the VOC emissions up to
the point that soil became a sink more than a source for VOCs in most seasons of the
year.

Chapter 1 Seasonal soil CO2 and VOC exchange rates in a Mediterranean holm oak forest
57
Although the annual mean of VOC and monoterpene emissions in Prades
represents a very small percentage of the total C emitted as CO2 (0.003% and 0.0004%
respectively), they still might play an important ecological role on the soil and
rhizosphere interactions. There are some studies which show these interactions. For
example, root VOCs emissions induced by the attack of below-ground herbivores such
the larvae of the black vine weevil, Otiorhynchus sulcatus, resulted in the attraction of
soil-dwelling organisms such as nematodes (infective juveniles of Heterorhabditis
megidis) that attack the below-ground herbivores (Boff et al. 2002). Mackie and
Wheatley (1999) showed that VOCs may act as infochemicals in the interaction
between microbial population and fungal activity in the rhizosphere and their
surrounding. VOCs also have been reported to affect fungal mycelial growth by
inducing hyphal branching in arbuscular mycorrhizal fungi (Akiyama et al. 2005) and to
stimulate microbial respiration (Owens et al. 1969).
In a mixed-hardwood forest it has been showed that isoprene can be the growth
substrate for some microorganisms (Cleveland and Yavitt 1998) and that consumption
of this atmospheric isoprene by soil microorganisms may be a significant component of
the global isoprene budget. However, in the studied Mediterranean holm oak forest soil,
VOC exchange rates were very low and did not suggest a significant effect of soil VOC
exchange on carbon budgets.
1.2.4.2. Contrasting seasonal course of CO2 flux and VOC exchange rates in control
and drought treatments
The effect of drought treatment on soil VOC emission and consumption was significant
when VOC concentrations were normalised to 30ºC. There was a significant interaction
effect between season and treatment in total soil VOC and monoterpene exchange (p<
0.01, Fig. 1.2.1 a and Fig. 1.2.2 a). Seasonal induction of VOC emissions by
phenological processes must be considered as an additional factor which is likely to
control VOC and monoterpene exchange between soil and atmosphere. Such processes,
for example spring leaf emergence, which assumes an increase of physiological activity
in plants, have been shown to influence foliar VOC emissions (Fuentes et al., 1998;
Llusià and Peñuelas, 2000),.

Chapter 1 Seasonal soil CO2 and VOC exchange rates in a Mediterranean holm oak forest
58
Our results showed a different response in soil VOC emission and consumption
between control and drought plots which might be explained by the changes in the
importance of root versus microbial activity. VOC and monoterpene uptake depend on
the physiological activity of the microorganisms (Demyttenaere 1998; Cleveland and
Yavitt 1998). Thus soil VOC and monoterpene consumption should be linked to soil
respiration. In fact, VOC exchange in control plots followed a similar seasonal pattern
than CO2 flux (r2= 0.86, p< 0.05 Fig. 1.2.3) and soil moisture (r2= 0.64, p= 0.1 Fig.
1.2.4). This suggests that under the current rainfall regime in this Mediterranean holm
oak forest, soil moisture, in combination with plant phenology, regulate soil VOC
exchange. Nevertheless, the trend tended to be inverse for soil VOC exchange
relationship with CO2 flux in drought treatment (r2= 0.50, p= 0.18 Fig. 1.2.3), with
maximum VOC and monoterpene emissions in summer and minimum in autumn (Fig.
1.2.1 and Fig. 1.2.2). When physiological activity of microorganisms was high (wet
spring and autumn seasons and control plots), soil VOC emissions predominated. On
the contrary, in the dry summer, the decrease in microorganism activity could have
resulted in predominance of root emissions, if roots were less affected by the drought.
Thus in summer, a considerable amount of detected VOCs (and monoterpenes) from
soil could be produced by roots. Although monoterpene fluxes to atmosphere have been
reported to originate mostly from the recently fallen litter on the soil surface (Hayward
et al. 2001), a recent study in Arabidopsis shows that roots are also a non-negligible
source of VOCs (Steeghs et al. 2004). These latter authors describe VOC emissions as
induced specifically as a result of different compatible and non-compatible interactions
between microbes with insects and Arabidopsis roots. We have also found higher soil
CO2 flux in the plots subjected to a prolonged drought than in the control plots in
summer (Chapter 1.1), suggesting that autotrophic respiration (roots) is linked with soil
VOC emissions. Like many of the processes that occur in the rhizosphere, the biological
importance of these root emissions are not well understood, and need further studies to
assess their ecological implications (Hirsch et al. 2003, Vivanco et al 2004;).
The responses of soil VOC emissions to changes in soil moisture and
temperature, like those of soil respiration, are complex because of the heterogeneous
nature of the soil matrix, the distribution of water, and the availability of substrates for
microorganisms and roots, everything interacting in the process. In addition, there are
still too few studies, of soil volatiles (root and microorganism volatiles) and their
possible responses to abiotic stress, such as drought, warming and other stresses. For

Chapter 1 Seasonal soil CO2 and VOC exchange rates in a Mediterranean holm oak forest
59
example, one of the few studies on such issues reported the formation of some
metabolic VOCs, such as acetaldehyde and ethanol in response to oxygen deficiency in
roots of flooded soils (Drew, 1997). Further research is clearly warranted in this area of
soil VOC exchanges.
1.2.4.3. Relationships with photosynthetic rates.
Foliar monoterpene formation and emission seem to be dependent on ATP,
photosynthetic carbon availability and temperature (Loreto et al. 1996 a, b; Peñuelas
and Llusià, 1999; Peñuelas and Llusià, 2001). Plant root emissions might also have
those dependencies. This would account for the relatively high monoterpene emission
rates found in winter sampling (Fig. 1.2.2), when the weather was unusually warm for
the season, together with relatively high net photosynthetic rates, similar to those found
in spring (Chapter 1.1).
Although the instantaneous monoterpene emission rates in leaves have been
found to be correlated with net photosynthetic rates in many studies (Kesselmeier et al.
1996; Loreto et al. 1996c; Peñuelas and Llusià, 1999), other authors have reported a
breakdown in this apparent relationship in a longer time-scale, because net
photosynthesis and emission rates respond differently to stress conditions. There seems
to be a stronger relationship between photosynthetic electron transport rates and
reductive equivalents for net carbon assimilation (Niinemets et al. 2002). However, this
correlation between photosynthetic electron transport rates and emission rates does not
necessarily gives mechanistic insight into the physiology of monoterpene leaf emission
nor on the monoterpene emission from underground parts of plants, which is much less
understood. In fact, no significant direct relationships were found between the soil
monoterpene exchange rates and the net photosynthetic rates in our study (r2= 0.02, p=
0.62). Further studies are needed to gain knowledge on these linkages between
photosynthetic rates and soil emission rates.
1.2.4.4. Dependence on soil temperature and moisture. Next decades prediction.
The results suggest that under Mediterranean climate with the current rainfall regime,
VOC exchange rates were driven by the soil moisture, (r2= 0.64, p=0.10 Fig. 1.2.4). Its
effects, added to the phenology effects, resulted in a seasonal response in the total VOC
soil emission rates (Fig. 1.2.1).
Chapter 1 Seasonal soil CO2 and VOC exchange rates in a Mediterranean holm oak forest
60
In spite of the relatively low photosynthetic activity of plants and
microorganisms under the dry summer conditions, (even when the soil temperature
effect was suppressed normalizing to 30º C emissions in August 2003, Fig. 1.2.1 b and
Fig. 1.2.2 b), we found high VOC and monoterpene emission rates in drought plots.
Because of this, there was no significant relationship of VOC and monoterpene
exchange rates with soil moisture in the drought plots. Microorganisms might remain
dormant, while the plants could switch on protective mechanisms involving the above-
ground parts of the plant.
These results thus show that prolonged low water availability produces changes
in the biological activity of soils under stress conditions. In view of the ca. 25%
decrease in soil moisture forecasted by IPCC and the Gotilwa model for this
Mediterranean region in the next three or four decades (IPCC 2001, Peñuelas et al 2005,
Sabate et al. 2002), our results suggest that great differences can be expected in the
patterns of VOC fluxes from Mediterranean soils, although acclimation of soil and plant
processes to prolonged drought could occur, diminishing such expected differences.
Long-term studies on these issues are needed to improve our knowledge on soil and
plant responses to such expected climate changes.
1.2.5. Conclusions
This study constitutes a preliminary exploratory research for inventorying VOC and
monoterpene soil exchange rates in the Mediterranean area. The results show that total
VOC and monoterpene emission rates from soil surfaces are low. This supports the
conclusions of Hayward et al. (2001) that there is a relatively low soil contribution to
total biogenic monoterpene emissions to the atmosphere on a land area basis. In this
Mediterranean holm oak forest, the potential significance of soil VOC emissions on
atmospheric processes and carbon budgets seem to be low. In fact, in summer periods,
uptake in control plots was predominant rather than emissions, and in drought plots net
uptake was dominant over the year. The factors determining the sink potential and the
timescales for sink/source reversal are unknown but these results warrant further
research to solve these questions. Moreover, these results show, at least, that soil VOC
exchange with the atmosphere might greatly change in the next decades in response to
climate change.

Chapter 1 Seasonal soil CO2 and VOC exchange rates in a Mediterranean holm oak forest
61
There is a possible species composition effect on the diversity of identified
volatile compounds in soil emissions, but to confirm this effect, and also to differentiate
microorganisms and root contributions, further studies are needed. Meanwhile, these
results indicate that multiple factors affect VOC emissions from soil. Soil moisture
seems the most important one since it controls physiological processes in plants and
microorganisms. Plant phenology also seems to affect VOC and monoterpene emissions
from soil by increasing or decreasing availability of photosynthetic resources transferred
to roots. The effect of these multiple factors results in seasonality of VOC soil emission
rates.
The drought treatment simulated expected water availability in the next three or
four decades in the GCM and ecophysiological model predictions (IPCC, 2001; Sabaté
et al. 2002; Peñuelas et al. 2005). Total VOC emission rates were greatly reduced to the
point that emission rates were reversed into uptake rates. The results also suggest
changes towards a decrease in the ratio of microorganisms/roots activities in the
rhizosphere, especially in summer. The ecological implications of these changes in soil
VOC exchange rates need to be explored further, given the relatively smaller VOC
emission rates from soils and the postulated connection to microbial, fungal, and
herbivore activity there, it appears that cycling of VOCs in soils will have greater
impact on soil ecology and foliar releases will have greater impact on the chemistry of
the atmosphere.
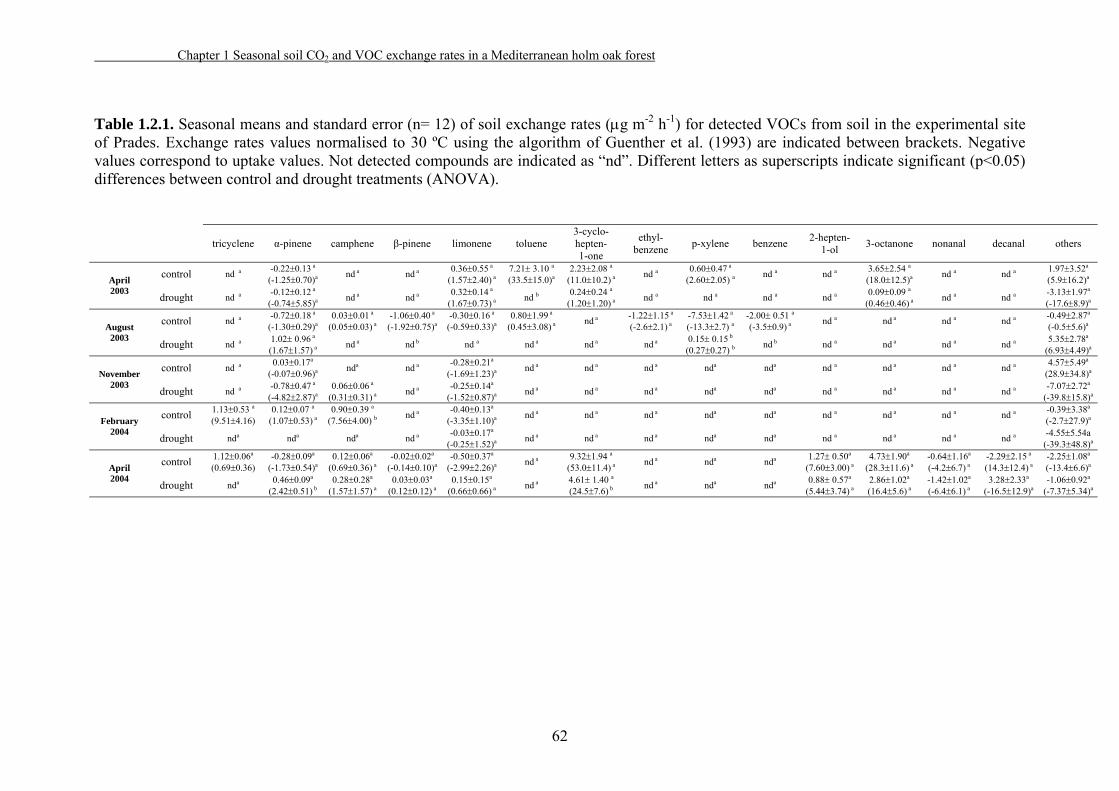
Chapter 1 Seasonal soil CO2 and VOC exchange rates in a Mediterranean holm oak forest
62
Table 1.2.1. Seasonal means and standard error (n= 12) of soil exchange rates (μg m-2 h-1) for detected VOCs from soil in the experimental site of Prades. Exchange rates values normalised to 30 ºC using the algorithm of Guenther et al. (1993) are indicated between brackets. Negative values correspond to uptake values. Not detected compounds are indicated as “nd”. Different letters as superscripts indicate significant (p<0.05) differences between control and drought treatments (ANOVA).
tricyclene α-pinene camphene β-pinene limonene toluene 3-cyclo- hepten- 1-one
ethyl-benzene p-xylene benzene 2-hepten-
1-ol 3-octanone nonanal decanal others
control nd a -0.22±0.13 a (-1.25±0.70)a nd a nd a 0.36±0.55 a
(1.57±2.40) a 7.21± 3.10 a (33.5±15.0)a
2.23±2.08 a (11.0±10.2) a nd a 0.60±0.47 a
(2.60±2.05) a nd a nd a 3.65±2.54 a (18.0±12.5)a nd a nd a 1.97±3.52a
(5.9±16.2)a April 2003 drought nd a -0.12±0.12 a
(-0.74±5.85)a nd a nd a 0.32±0.14 a (1.67±0.73) a nd b 0.24±0.24 a
(1.20±1.20) a nd a nd a nd a nd a 0.09±0.09 a (0.46±0.46) a nd a nd a -3.13±1.97a
(-17.6±8.9)a
control nd a -0.72±0.18 a (-1.30±0.29)a
0.03±0.01 a (0.05±0.03) a
-1.06±0.40 a (-1.92±0.75)a
-0.30±0.16 a (-0.59±0.33)a
0.80±1.99 a (0.45±3.08) a nd a -1.22±1.15 a
(-2.6±2.1) a -7.53±1.42 a (-13.3±2.7) a
-2.00± 0.51 a (-3.5±0.9) a nd a nd a nd a nd a -0.49±2.87a
(-0.5±5.6)a August 2003 drought nd a 1.02± 0.96 a
(1.67±1.57) a nd a nd b nd a nd a nd a nd a 0.15± 0.15 b (0.27±0.27) b nd b nd a nd a nd a nd a 5.35±2.78a
(6.93±4.49)a
control nd a 0.03±0.17a (-0.07±0.96)a nda nd a -0.28±0.21a
(-1.69±1.23)a nd a nd a nd a nda nda nd a nd a nd a nd a 4.57±5.49a (28.9±34.8)a November
2003 drought nd a -0.78±0.47 a (-4.82±2.87)a
0.06±0.06 a (0.31±0.31) a nd a -0.25±0.14a
(-1.52±0.87)a nd a nd a nd a nda nda nd a nd a nd a nd a -7.07±2.72a (-39.8±15.8)a
control 1.13±0.53 a (9.51±4.16)
0.12±0.07 a (1.07±0.53) a
0.90±0.39 a (7.56±4.00) b nd a -0.40±0.13a
(-3.35±1.10)a nd a nd a nd a nda nda nd a nd a nd a nd a -0.39±3.38a (-2.7±27.9)a February
2004 drought nda nda nda nd a -0.03±0.17a (-0.25±1.52)a nd a nd a nd a nda nda nd a nd a nd a nd a -4.55±5.54a
(-39.3±48.8)a
control 1.12±0.06a (0.69±0.36)
-0.28±0.09a (-1.73±0.54)a
0.12±0.06a (0.69±0.36) a
-0.02±0.02a (-0.14±0.10)a
-0.50±0.37a (-2.99±2.26)a nd a 9.32±1.94 a
(53.0±11.4) a nd a nda nda 1.27± 0.50a (7.60±3.00) a
4.73±1.90a (28.3±11.6) a
-0.64±1.16a (-4.2±6.7) a
-2.29±2.15 a (14.3±12.4) a
-2.25±1.08a (-13.4±6.6)a April
2004 drought nda 0.46±0.09a (2.42±0.51) b
0.28±0.28a (1.57±1.57) a
0.03±0.03a (0.12±0.12) a
0.15±0.15a (0.66±0.66) a nd a 4.61± 1.40 a
(24.5±7.6) b nd a nda nda 0.88± 0.57a (5.44±3.74) a
2.86±1.02a (16.4±5.6) a
-1.42±1.02a (-6.4±6.1) a
3.28±2.33a (-16.5±12.9)a
-1.06±0.92a (-7.37±5.34)a

Chapter 1 Seasonal soil CO2 and VOC exchange rates in a Mediterranean holm oak forest
63
Acknowledgements
This research was supported by Spanish MEC grants REN2003-04871, and CGL2004-
01402/BOS. We also gratefully acknowledge the partial funding by the ISONET
European Commission contract MC-RTN-CT-2003-504720, the ALARM European
Commision contract 506675 and a Fundación BBVA 2004 and a Catalan Government
SGR2005-003/2 grants.
References.
Akiyama, K., Matsuzaki, K., Hayashi, H. 2005. Plant sesquiterpenes induce hyphal branching in arbuscular mycorrhizal fungi. Nature, 435, 824-827. Bender, M., Conrad, R. 1993. Kinetics of methane oxidation in oxic soils. Chemosphere 26, 687-696.
Boff, M. I. C., Van Tol, R. W. H. M., Smiths, P. H.. 2002. Behavioural response of Heterorhabditis megidis (strain NLH-E87.3) towards plant roots and insect larvae. BioControl 47, 67-83.
Chen, F., Ro, D., Petri, J., Gershenzon, J., Bohlmann, J., Pichersky, E., Tholl, D. 2004. Characterization of a root-specific Arabidopsis terpene synthase responsible for the formation of the volatile monoterpene 1,8-cineole. Plant Physiology,, 135, 1956-1966.
Cleveland, C. C., Yavitt, J. B., 1998, Microbial consumption of atmospheric isoprene in a temperate forest soil. Applied and Environmental Microbiology 64 (1), 172-177. Demyttenaere, J. C. R, Herrera, M. D., De Kimpe, N., 2000. Biotransformation of geraniol, nerol and citral by sporulated surface cultures of Aspergillus niger and Penicillium sp. Phytochemistry, 55 (4), 363-373. Di Castri, F, 1973. Climatographical comparisons between Chile and the western coast of North America. In: Di Castri F,Mooney HA (eds) Mediterranean Type Ecosystems. Springer-Verlag, Berlin, pp 21–36. ISBN 0-38-70610-61 Drew, M. C. 1997. Oxygen deficiency and root metabolism: injury and acclimation under hypoxia and anoxia. Annual Review Plant Physiology, 48, 223-250. Fehsenfeld, F., Calvert, J., Fall, R., Goldan, P., Guenther, A. B., Hewitt, C. N., lamb, B., Liu, S., Trainer, M., Westberg, H., Zimmerman P. 1992. Emissions of volatile organic compounds from vegetation and the implications for atmospheric chemistry. Global Biogeochemical Cycles 6, 389-430. Fuentes, J. D., Wang, D., Gu, L. 1998. Seasonal variations in isoprene emissions from a boreal aspen forest. Journal of Applied Meteorology 38 (7), 855-869.

Chapter 1 Seasonal soil CO2 and VOC exchange rates in a Mediterranean holm oak forest
64
Gratani, L., Bombelli, A., 2000. Correlation between leaf age and other leaf traits in three Mediterranean maquis shrub species: Quercus ilex, Phillyrea latifolia, and Cistus incanus. Environment Experimental Botany 43, 141-153. Guenther, A., (1999a). Modeling biogenic organic compounds emissions to the atmosphere. p. 322 in: Hewitt, C. N. (ed). Reactive hydrocarbons in the atmosphere. San Diego. U. S.A. Hayward, S., Muncey, R. J., James, A. E., Halsall, C. J., Hewitt, C. N. 2001. Monoterpene emissions from soil in a Sitka spruce forest. Atmospheric Environment 35, 4081-4087. Hirsch, A. M. et al. 2003. Molecular signals and receptors: controlling rhizosphere interacting between plants and other organisms. Ecology 84, 858-868. IPCC 2001. Climate change 2001: The Scientific Basis. Contribution of Working Group I. Third Assessement Report of Intergovernamental Panel on Climate Change. Hougton, J. T., Dung, Y., Griggs, D. J., Noguer, M., Van der Linden, P., Dui, X., Maskell, K., Johnson, C. A., (Eds). Cambridge University Press, Cambridge. Janson, R. W. 1993. Monoterpene emissions from Scots pine and Norwegian spruce. Journal of Geophysical Research-Atmospheres 98 (D2), 2839-2850. Kesselmeier, J., Schafer, L., Ciccioli, P., Brancaleoni, E., Cecinato, A., Frattoni, M., Foster, P., Jacob, V., Denis, J., Fugit, J. L., Dutaur, L., Torres, L. 1996. Emission of monoterpenes and isoprene from Mediterranean oak species Quercus ilex L. measured within the BEMA (Biogenic Emission on the Mediterranean Area) project. Atmospheric environment 30: 1841-1850. Kesselmeier, J., Staudt, M. 1999. Biogenic volatile organic compounds (VOC): an overview on emission, physiology and ecology. Journal of Atmospheric Chemistry 33, 23-88. Kleinheinz, G. T., Bagley S. T., St. John W. P., Rughani J. R., McGinnis G. D. 1999. Characterization of alpha-pinene-degrading microorganisms and application to a bench-scale biofiltration system for VOC degradation. Archives of Environmental Contamination And Toxicology, 37 (2), 151-157. Langenheim, J. H. 1994. Higher plant terpenoids : A phytocentric overview of their ecological roles. Journal of Chemical Ecology 20 (6), 1223-1280.
Llusià, J., Peñuelas, J. 1998. Changes in terpene content and emission in potted Mediterranean woody plants under severe drought. Canadian Journal of Botany 76, 1366-1373.
Llusià, J., Peñuelas, J. 2000. Seasonal patterns of terpene content and emission from seven Mediterranean woody species in field conditions. American Journal of Botany 87, 133-140.

Chapter 1 Seasonal soil CO2 and VOC exchange rates in a Mediterranean holm oak forest
65
Loreto, F, Ciccioli, P., Cecinato, A., Brancaleoni, E., Frattoni, M., Fabozzi, C., Tricoli, D. 1996 a. Evidence of the photosynthetic origin of monoterpene emitted by Quercus ilex L. leaves by 13C labelling. Plant Physiology 110, 1317-1322.
Loreto, F, Ciccioli, P., Cecinato, A., Brancaleoni, E., Frattoni, M., Tricoli, D. 1996 b. Influence of environmental factors and air composition on the emssion of α-pinene from Quercus ilex leaves. Plant Physiology 110, 267-275.
Loreto, F, Ciccioli, P., Cecinato, A., Brancaleoni, E., Frattoni, M., Sharkey, T. D. 1996 c. Different sources of reduced carbon contribute to form three classes of terpenoid emitted by Quercus ilex L. leaves. Proceedings of the National Academy of Sciences, U.S.A. 93, 9966-9969.
Mackie, A. E., Wheatley, R. E. 1999. Effects and incidence of volatile organic compound interactions between soil bacterial and fungal isolates. Soil Biology and Biochemistry 31 (3), 375-385. Niinemets, Ü., Hauff, K., Bertin, N., Tenhunen, J. D., Steinbrecher, R., Seufert, G. 2002. Monoterpene emissions in relation to foliar photosynthetic and structural variables in Mediterranean evergreen Quercus species. New Phytologist 153, 243-256.
Ogaya, R., Peñuelas, J. 2003. Comparative field study of Quercus ilex and Phillyrea latifolia: photosynthetic response to experimental drought conditions. Environmental and Experimental Botany 50, 137-148.
Owen, S, Peñuelas, J. 2005. Opportunistic emissions of volatile isoprenoids. Trends in Plant Science, in press. Owens, L. D., Gilbert, R. G., Griebel, G. E., Menzies, J. D. 1969. Identification of plant volatiles that stimulate microbial respiration and growth in soil. Phytopatology 59, 1468-1472.
Peñuelas, J., Llusià, J. 1999. Seasonal emission of monoterpenes by the Mediterranean tree Quercus ilex in field conditions: Relations with photosynthetic rates, temperature and volatility. Physiologia Plantarum 105, 641-647.
Peñuelas, J., Llusià, J. 1999. Short-term responses of terpene emission rates to experimental changes of PFD in Pinus halepensis and Quercus ilex in summer field conditions. Environmental Experimental Botany 42, 61-68.
Peñuelas, J., Llusià, J. 2001. The complexity of factors driving volatile organic compound emissions by plants. Biologia Plantarum 44, 481-487.
Peñuelas, J., Llusià, J. 2001 Seasonal patterns of non-terpenoid C6-C10 VOC emission from seven Mediterranean woody species. Chemosphere 45, 237-244.
Peñuelas, J., Lloret, F., Montoya R. 2001. Severe drought effects on Mediterranean woody flora in Spain. Forest Sciencie 47 (2), 214-218.

Chapter 1 Seasonal soil CO2 and VOC exchange rates in a Mediterranean holm oak forest
66
Peñuelas, J., Llusià, J., 2003 BVOCs: Plant defense against climate warming? Trends in Plant Science 8, 105-109.
Peñuelas, J., Llusià, J. 2004. Plant VOC emissions: making use of the unavoidable. Trends in Ecology and Evolution 19 (8), 402-404.
Peñuelas, J., Filella, I., Sabate, S., and Gracia, C. 2005. Natural systems: terrestrial ecosystems. In Report on Climate change in Catalonia. Edited by J.E. Llebot. Institut d'Estudis Catalans, Barcelona. pp. 517-553. Ryu, C., Farag, M. A., Hu, C., Reddy, M. S. Wei, H., Pare, P. W., Kloepper, J. W. 2003. Bacterial volatiles promote growth in Arabidopsis. Proceeding of the National Academy of Sciences of the United States of America, 100 (8): 4927-4932. Sabaté, S., Gracia, C., Sánchez, A. 2002. Likely effects of climate change on growth of Quercus ilex, Pinus halepensis, and Fagus sylvatica forest in the Mediterranean region. Forest Ecology and Management 162, 23-37. Scholler, C. E. G., Gurtler, H., Pedersen, R., Molin, S., Wilkins, K. 2002. Volatile metabolites from actinomycetes. Journal of Agricultural and Food Chemistry 50 (9), 2615-2621. Steeghs, M., Bais, H. P., de Gouw, J., Goldan, P., Kuster, W., Northway, M., Fall, R., Vivanco, J. M. 2004. Proton-transfer-reaction mass spectrometry as a new tool for real time analisys of root-secreted volatile organic compounds in arabidopsis. Plant Physiology 135 (1), 47-58. Sthal, P. D., Parkin, T. B. 1996. Microbial production of volatile organic compounds in soil microcosms. Soil Science Society of America Journal 60 (3), 821-828. Tenhunen, J. D., Sala Serra, A., Harley, P. C., Dougherty, R. L., Reynolds, J. F. 1990. Factors influencing carbon fixation and water use by Mediterranean sclerophyll shrubs during summer drought. Oecologia 82, 381-393.
Terradas, J., Savé, R. 1992. The influence of summer and winters stress and water relationships on the distribution of Quercus ilex L. Vegetatio 100, 137-145.
Tretiach, M. 1993. Photosynthesis and transpiration of evergreen Mediterranean and deciduous trees in a ecotone during a growing season. Acta Oecologia 14, 341-360. Vivanco, J. M., Bais, H. P., Park, S., Weir, T. L., Callaway, R. M. 2004. How plants communicate using the underground information superhigway. Trends in Plant Science, 9 (1), 26-32. Van Ginkel, C. G., De Jong, E., Tialnus, J. W. R., Bont, J. A. M. 1987. Microbial oxidation of isoprene, a biogenic foliage volatile and of 1,3-butadiene, an anthropogenic gas. FEMS Microbiological Ecology, 45, 275-279.

Chapter 1 Seasonal soil CO2 and VOC exchange rates in a Mediterranean holm oak forest
67
Yoo, S. K. and Day, D. F.2002.Bacterial metabolism of alpha-pinene and beta-pinene and related monoterpenes by Pseudomonas sp. Strain PIN. Process Biochemistry, 37 (7), 739-745.

Chapter 1 Seasonal soil CO2 and VOC exchange rates in a Mediterranean holm oak forest
68

Chapter 2 Interannual soil CO2 and VOC exchange rates in a Mediterranean holm oak forest
69
Chapter 2
Interannual and interseasonal soil CO2
efflux and VOC exchange rates in a
Mediterranean holm oak forest in
response to experimental drought

Chapter 2 Interannual soil CO2 and VOC exchange rates in a Mediterranean holm oak forest
70
Chapter 2 Interannual soil CO2 and VOC exchange rates in a Mediterranean holm oak forest
71
Abstract
Climate models predict drier conditions in the next decades in the Mediterranean basin.
Given the importance of soil CO2 efflux in the global carbon balance and the important
role of soil monoterpene and VOCs in soil ecology, we aimed to study the effects of the
predicted drought on soil CO2, monoterpenes and other VOCs exchange rates and their
seasonal and interannual variations. We decreased soil water availability in a
Mediterranean holm oak forest soil by means of an experimental drought system
performed since 1999 to the present. Measurements of soil gas exchange were carried
out with IRGA, GC and PTR-MS techniques during two annual campaigns of
contrasting precipitation. Soil respiration was twice higher the wet year than the dry
year (2.27 ± 0.26 µmol m-2 s-1 and 1.05 ± 0.15 µmol m-2 s-1 respectively), and varied
seasonally from 3.76 ± 0.85 µmol m-2 s-1 in spring, to 0.13 ± 0.01 µmol m-2 s-1 in
summer. These results highlight the strong interannual and interseasonal variation in
CO2 efflux in Mediterranean ecosystems. The drought treatment produced a significant
soil respiration reduction in drought plots in the wet sampling period. This reduction
was even higher in wet springs (43% average reduction). These results show 1) that soil
moisture is the main factor driving seasonal and interannual variations in soil respiration
and 2) that the response of soil respiration to increased temperature is constrained by
soil moisture. The results also show an additional control of soil CO2 efflux by
physiology and phenology of trees and animals. Soil monoterpene exchange rates
ranged from –0.01 nmol m-2 s-1 to 0.004 nmol m-2 s-1, thus the contribution of this
Mediterranean holm oak forest soil to the total monoterpenes atmospheric budget seems
to be very low. Responses of individual monoterpenes and VOCs to the drought
treatment were different depending on the compound. This suggests that the effect of
soil moisture reduction in the monoterpenes and VOCs exchange rates seems to be
dependent on monoterpene and VOC type. In general, soil monoterpene and other
VOCs exchange rates were not correlated with soil CO2 efflux. In all cases, only a low
proportion of variance was explained by the soil moisture changes, since almost all
VOCs increased their emission rates in summer 2005, probably due to the effect of high
soil temperature. Results indicate thus that physical and biological processes in soil are
controlling soil VOCs exchange but further research is needed on how these factors
interact to produce the observed VOCs exchange responses.

Chapter 2 Interannual soil CO2 and VOC exchange rates in a Mediterranean holm oak forest
72
Key words: CO2 efflux, soil monoterpenes, soil VOCs, soil moisture, soil temperature, drought,
seasonality.
2.1. Introduction
Carbon dioxide produced in soils is an indicator of the biological activity of the entire
soil biota including microorganisms (bacteria, fungi, algae, and protozoa),
macroorganisms (such as earthworms, nematodes, and insects), and plant roots.
Moreover it represents a large natural flux in the dynamics of carbon exchange with the
atmosphere, approximately 75 × 1015 gC yr-1 (Schlesinger and Andrews, 2000). The
study of soil respiration environmental controls is important to understand soil
processes and their relationships with the global balance between biospheric and
atmospheric carbon. This soil CO2 efflux varies with substrate supply and root, micro
and macroorganisms activity (Davidson et al., 1998) which in turn depends on soil
physico-chemical conditions such as temperature, porosity or water content (Grant and
Rochette, 1994). Soil CO2 efflux is usually low in dry soils (Emmet et al., 2004;
Asensio et al., 2007a) and soil temperature generally stimulates soil CO2 efflux (Raich
and Schlesinger, 1992).
Soil volatile organic compound (VOC) fluxes are less known. Soil may be both
a VOC source (Guenther, 1999) and a sink (Van Ginkel et al. 1987; Bender et al., 1993;
Asensio et al., 2007b). VOCs in natural soils may be derived from a variety of sources.
The root system of plants (Janson 1993, Chen et al. 2004) and microorganisms (Scholler
et al. 2002) seem to be the major sources of emissions. Above ground, litter is also an
important source of VOCs emissions from soils, as reported in coniferous forests soils
(Hayward et al., 2001; Schade and Goldstein, 2001), in a beech forests soil
(Kesselmeier and Hubert, 2002) or in an orange plantation soil (Steinbrecher et al.,
1999). Soil VOC uptake can occur by physical adsorption of VOCs by soil components
(Pignatello and Xing, 1995) or by biodegradation by soil microorganisms (Van Roon et
al., 2005). It has also been shown that some VOCs can be adsorbed and degraded by
root tissue (Simonich and Hites, 1995; Newman et al., 1997; Cho et al., 2005).
Among other VOCs, monoterpenes have been reported to play different roles in
soil processes. For example, they can alter the rates of nitrogen cycle (White, 1994;
Smolander et al., 2006), or may act as potent biological inhibitors (Nishida et al., 2005)

Chapter 2 Interannual soil CO2 and VOC exchange rates in a Mediterranean holm oak forest
73
or as attractant to the larvae of some pine weevil species (Nordenhem and Nordlander,
1994) and they can be used as growth substrate for bacteria (Misra et al., 1996). Several
reports have also found soil volatiles to have interesting ecological roles, e. g. bacterial
volatiles that promote growth in plants (Ryu et al., 2003), plant volatiles that induce
hyphal branching in AM fungi (Akiyama et al., 2005) or plant exudates which act as an
aphid colonization signal for nearby plants (Chamberlain et al., 2001). Negative
interactions between bacteria and fungi mediated by VOCs have also been described
(Mackie and Wheatley, 1999; Xu et al., 2004). However, some studies have found that
their contribution to the total monoterpene and VOC atmospheric budget was low
(Hayward et al., 2001; Asensio et al., 2007b).
Despite the important role soil VOCs seem to play on soil ecology, little is
known about factors controling soil VOC emissions. Stahl and Parkin (1996) found that
VOCs production and uptake in laboratory is strongly influenced by environmental
conditions. However, information about soil moisture, temperature and their seasonal
and interannual variations effects on soil VOCs exchange or the relationship between
VOC exchange rates and the soil CO2 efflux is still scarce (Asensio et al., 2007b).
The increasing global surface temperatures will probably change the amount,
intensity and frequency of precipitations as well as evapotranspiration in most regions
of the earth (IPCC 2001). Coupled GCM and ecophysiologycal models such as
GOTILWA predict a 15-20% lower soil water availability and 1ºC warming for the next
three decades in Mediterranean ecosystems (IPCC 2001; Sabaté et al. 2002; Peñuelas et
al., 2005a), which are highly vulnerable to climate change (West et al., 1994, Peñuelas
et al. 2002, 2004, 2005a; Peñuelas and Boada 2003 ).
Given the importance of soil CO2 efflux in the global carbon balance and the
important role of soil monoterpene and VOCs in soil ecology, given the scarcity of
knowledge on their responses to environmental conditions, and given the predicted
climate change, we studied the responses of CO2 and VOCs exchange to the more arid
conditions forecasted for the Mediterranean region for the next decades. We performed
a drought experiment by partially excluding rainfall and water runoff in a natural
Mediterranean holm oak forest soil and we measured soil CO2 and VOCs exchange
rates, under the predicted 15-20% lower soil water availability. Like in a previous study
(Asensio et al., 2007a, b) we studied the CO2 and soil VOCs exchange responses to the
seasonal changes in soil moisture and temperature but now we also studied another
year, the dry 2004-2005, to study the effects of the important interannual variability in
Chapter 2 Interannual soil CO2 and VOC exchange rates in a Mediterranean holm oak forest
74
soil moisture and temperature characteristic of those Mediterranean ecosystems and we
now measured the soil exchange of the whole range masses of volatile compounds with
the PTR-MS technique. We conducted scans of all masses between 22 and 205 and
monitored seasonally the exchange rate responses to drought and to soil moisture and
temperature variations during the 2004-2005 period. During these studies, we also
aimed to find possible linkages between monoterpenes and other VOC exchange rates
and CO2 efflux.
2.2. Material and methods
2.2.1. Study Site
This study was conducted between Spring 2003 and Summer 2005, in two campaigns
from April 2003 to April 2004 and from November 2004 to July 2005. Measurements
were carried out in a natural holm oak forest growing in the Prades Mountain region, in
Southern Catalonia (41º13’N, 0º55’E), on a south-facing slope (25% slope) at 930 m
above sea level. The soil is a Dystric Cambisol (FAO, 1990) on a bedrock of
metamorphic sandstone, and its depth ranges between 35 and 90 cm. The average
annual temperature is 12 ºC and the annual rainfall 687 mm. Summer drought occurs
approximately from mid-June to mid-September. The vegetation of the area is short
holm oak forest characterized by 3 or 4-m tall trees and shrubs. This forest is dominated
by Quercus ilex L. and Phillyrea latifolia L. followed by Arbutus unedo L., Erica
arborea L., Juniperus oxycedrus L. and Cistus albidus L. and occasionaly deciduous
species (Sorbus torminalis L. Crantz and Acer monspessulanum L.) (Ogaya and
Peñuelas, 2003).
2.2.2. Experimental design
Twenty-four 1 × 10 m plots were randomly distributed at the same altitude along the
slope in the study area. Half of the plots were subjected to a drought treatment and the
other ones were control plots. The drought treatment consisted of rainfall exclusion by
suspending transparent PVC strips at a height of 0.5-0.8 m above the soil. In addition, a
0.8-1 m deep ditch was excavated along the entire 1m top edge of the upper part of the
treatment plots to intercept runoff water. Water intercepted by strips and ditches was
drained to an area outside and downhill of the plots. Rainfall exclusion by plastic strips

Chapter 2 Interannual soil CO2 and VOC exchange rates in a Mediterranean holm oak forest
75
does not affect the light interception by the trees because the whole tree canopies are
located above the plastic strips. There was practically no ground vegetation under the
plastic strips, except for some C. albidus small shrubs growing under the plastic strip in
some plots. In all cases the shrubs were wider than the plastic strip so their light
environment was not hardly disturbed. Drought treatment started in March 1999 and
continues to the present.
Litter-fall on the plastic strips was moved underneath them each month to
sustain the humic composition of the soil. Therefore any nutrient differences below and
outside the strips were due only to the change in water available for decomposition of
this litterfall.
2.2.3 . Sampling strategy
Measurement campaigns were carried out during 3 consecutive sunny days in each
season: spring 2003 (April 22, 23 and 24), summer 2003 (August 12, 13 and 14),
autumn 2003 (November 3, 4 and 5), winter 2004 (February 17, 18 and 19), spring 2004
(April 21, 22 and 23), autumn 2004 (November 7, 8 and 9), winter 2005 (January 14, 15
and 20), spring 2005 (April 9, 10 and 11) and summer 2005 (July 25, 26 and 27). Soil
CO2 fluxes and soil VOC exchange rates were measured during the morning (from 7
a.m. to 12 a.m. solar time).
2.2.4. Measurements of soil CO2 flux, temperature and moisture.
Soil respiration was measured in situ using a flow-through chamber method and an
infrared gas analyser system (EGM-4, PP Systems, Hitchin, Hertfordshire, England). A
vented soil chamber system was performed with PVC collars (12.5 cm in diameter and
8 cm in height) installed permanently 3-4 cm into the soil. The collars were covered by
a PVC lid with two outlets. One outlet was connected to the IRGA analyser by a tefflon
tube. The other outlet was open to exterior air entry. Air inside the chamber was flowed
(constant flux 0.4 l min-1) to the CO2 analyser by the EGM-4 integral DC pump. The
flow was measured with a bubbler flowmeter. Equilibration of CO2 concentration in the
effluent stream occurred after 20 minutes. Before the collar was covered, we measured
CO2 concentrations from external air. Net soil CO2 fluxes were calculated by
considering the stable difference in CO2 concentration between the outlet chamber air
and the inlet chamber air. Measurements were automatically corrected for temperature
and pressure by the EGM-4 analyser. The accuracy of CO2 measurements was estimated

Chapter 2 Interannual soil CO2 and VOC exchange rates in a Mediterranean holm oak forest
76
to be 1%. Stability of the measurements were assured with the periodic “Auto-Zero”
resulting in automatic correction for sample cell contamination, source aging, detector
sensitivity variations and pre-amplifier gain changes.
Twelve collars in both control and drought plots (one collar per plot, n=12) were
distributed randomly. The collars were installed in Winter 2002 and they were
permanently placed into the soil, in order to minimise possible effects of the mechanical
disturbance during measurements. Litter recently fallen inside the PVC collars was
removed before sampling to obtain CO2 emissions only from soil roots and soil
microorganisms.
Together with each gas exchange measurement, soil temperature was measured
with a soil digital thermometer (TO 15, Jules Richard instruments, Argenteuil, France)
and soil moisture with a HH2 soil moisture meter connected to a ML2x soil moisture
sensor (Delta-T Devices Ltd, Cambridge, England) at 10 cm depth, just beside each
PVC collar to avoid mechanical disturbances to the enclosed soil. Temperature above
the soil surface was also measured.
2.2.5. Measurements of soil VOC exchange with the atmosphere.
Measurements of soil VOC exchange were conducted immediately after those of soil
CO2 fluxes. Air from the cuvette flowed though a T system impelled by a pump towards
a glass tube (11.5 cm long and 0.4 internal diameter) filled with VOC adsorbents
Carbotrap C (300 mg), Carbotrap B (200 mg), and Carbosieve S-III (125 mg) (Supelco,
Bellefonte, Pennsylvania) separated by plugs of quartz wool and treated as described by
Llusià and Peñuelas (2000).
The VOC flow from the soil chamber to the glass tube filled with adsorbents
varied between 0.2 and 0.3 l min-1 depending on the glass tube adsorbent and quartz
wool packing and model of pump used. Soil VOCs were sampled during 5 min and the
flow was regulated with a peristaltic pump (Portable Escort Elf Pump, P/N 497701 S/N
A2-31854; Mine Safety Appliances Company, Pittsburg, Pennsylvania, USA). The flow
adjustment was determined with a bubble flowmeter. Glass tubes were stored in a
portable fridge at 4ºC and taken to the laboratory, where they were stored at -30 ºC until
analysis (within 1 week).
VOC analyses were conducted in a GC-MS (Hewlett Packard HP59822B, Palo
Alto, California) as described by Peñuelas et al. (2005b).

Chapter 2 Interannual soil CO2 and VOC exchange rates in a Mediterranean holm oak forest
77
From November 2004 to July 2005 soil VOCs were additionally sampled in
Tedlar bags in 4 control and 4 drought plots and analysed in laboratory with the PTR-
MS technique. We scanned all masses between 22 and 205 to study seasonal variations
and to find significant exchange rate responses to the drought effect. After equilibration
of CO2 concentration in the effluent stream, air from the cuvette was impelled by a
pump towards a 3 l Tedlar bag. To minimize VOCs degradation by solar radiation in the
field, Tedlar bags were enclosed into a dark bag and put into the shadow. In the
laboratory, bags were stored in a dark cool chamber at 4ºC until analyses with PTR-MS
(within a week).
The PTR-MS system (PTR-MS-FTD hs; Ionicon Analitik, Innsbruck, Austria)
provides highly sensitive detection of the mass selected ions that are characteristic of
the molecules of interest. Both PTR-MS and its use in VOC analysis have been
described in detail in Lindinger et al. (1998) and Fall et al. (1999). Detection of the
protonated volatiles is produced in a quadrupole mass spectrometer. We estimated the
concentration of total monoterpenes as the concentration of ions with mass 137
multiplied by 2.17 (after testing α-pinene standard), because certain fragmentation of
non-oxygenated monoterpenes in the drift tube occurred during ionization even under
“soft” conditions and resulted in masses 67, 81 and 95 among others. This correction
factor was corroborated by simultaneous PTR-MS and GC-MS (Carbotrap/Carbosive
trapping) measurements of monoterpenes standards (Peñuelas et al., 2005b). Since
different VOCs with the same mass cannot be separately measured, we combined PTR-
MS with GC-MS techniques to determine the different monoterpenes.
The PTR-MS drift tube was operated at 2.1 mbar and 40ºC, with a drift field of
600 V cm-1; the parent ion signal was maintained at ca. 3 x 10⁶ counts per second during
the measurements. We conducted scans of all masses between 22 and 205 and used the
background values to calculate the exchange balance in each compound.
2.2.6 Statistical analyses
Repeated measures analyses of variance (ANOVA) were conducted with soil CO2
fluxes, soil moisture and temperature as dependent variables and with treatment as
independent factor. Repeated measures ANOVAs were conducted also for the exchange
rate of every mass measured with the PTR-MS as dependent variable and with treatment
as independent factor. Regression analyses were conducted with seasonal mean values,
and therefore with values having known associated variance. Thus a model I regression

Chapter 2 Interannual soil CO2 and VOC exchange rates in a Mediterranean holm oak forest
78
is not strictly appropriate and a model II regression was used. Although, there is not a
consensus about the optimal technique to compute this model II regression, we used the
reduced major axis method (Sokal & Rohlf 1995). All analyses were performed with
STATVIEW 5.01 software package (Abacus Concepts Inc., 1998).
2.3. Results
2.3.1. Precipitation, soil moisture and soil temperature
The total rainfall during the first sampling period from August 2003 to April 2004 was
much higher than the total rainfall during the analogous sampling period from
November 2004 to July 2005 (893 mm and 265 mm respectively, Fig. 2.1 a).The
difference between the two years is reflected in the average soil moisture in each
sampling period (16.30 ± 1.30 % and 6.11 ± 1.04 % respectively, P <0.0001; Fig. 2.1 a).
Average soil temperatures for both annual periods were similar (nearly 13ºC).
Maximum soil moisture values during the wet year occurred in autumn 2003 and spring
2004 (26% and 24% respectively) while for the dry year, maximum soil moisture was
measured in winter 2005 (12%). In both years, the highest soil temperatures were
measured in summer (25ºC and 23ºC, Fig. 2.1) coinciding with the lowest soil moisture
values in both sampling periods (2%). The drought treatment reduced soil moisture by
30% in spring and autumn during the first sampling period (P <0.0001) and by 45% on
average in autumn, winter and spring during the second sampling period (P <0.0001).
The drought treatment slightly increased soil temperature (mean values for the complete
period 13.04 ± 0.63 and 13.54 ± 0.64 in control and drought plots, respectively). The
soil temperature mean values for the complete period 2003-2005 were not significantly
higher in drought plots than in control plots (13.54 ± 0.64 and 13.04 ± 0.63
respectively). However, the drought treatment increased soil temperature up to 2ºC in
some seasons, such as summer 2003 and winter 2003 (P <0.005, Fig. 2.1.1).

Chapter 2 Interannual soil CO2 and VOC exchange rates in a Mediterranean holm oak forest
79
Figure 2.1. Seasonal course of rainfall, soil moisture and soil temperature measured in the two sampling annual periods, 2003-2004 and 2004-2005. a): Bar diagram represents total monthly rainfall. Dotted and full lines (control and drought plots respectively) represent soil moisture and temperature. b): Seasonal course of soil CO2 efflux in control and drought plots. c): Soil monoterpene exchange rates in control and drought plots. Error bars indicate SEM for control and drought plots (n=12). Significant differences between the two treatments in each season (repeated measurements ANOVA) are indicated with one asterisk (P <0.1), two asterisks (P <0.05) and three asterisks (P <0.01). Significance for the overall global effect of the treatment (repeated measurements ANOVA) is indicated inside the panels.
Rai
nfal
l (m
m)
0
100
200
300
400
Soi
l Moi
stur
e (%
v/v
) and
Soi
l Tem
pera
ture
(ºC
)
-5
0
5
10
15
20
25
30
35
40
45Moist. ControlMoist. DroughtTemp. ControlTemp. Drought
Soi
l CO
2 Fl
ux
(μm
ol m
-2 s
-1)
0
1
2
3
4
ControlDrought
Apr 20
03
Aug 20
03
Nov 20
03
Feb 20
04
Apr 20
04
Nov 20
04
Jan 2
005
Apr 20
05
Jul 2
005
Soi
l Mon
oter
pene
Exc
hang
e R
ates
(nm
ol m
-2 s
-1)
-0.020
-0.015
-0.010
-0.005
0.00
0.005
0.010
0.015 ControlDrought
b)
c)
**
*****
***
***
***
*
***
*
** **
year P=0.001season P<0.0001season x treatment P<0.1
season P<0.05
soil moisture year P<0.0001
season P<0.0001treatment P<0.0001
season x treatment P<0.005
soil temperatureseason P<0.0001treatment P<0.05
2003 2004 2005a)

Chapter 2 Interannual soil CO2 and VOC exchange rates in a Mediterranean holm oak forest
80
2.3.2. Soil CO2 efflux
Total average soil CO2 efflux in the 2003-2004 sampling period was higher than total
average efflux measured in the 2004-2005 period (2.27 ± 0.26 µmol m-2 s-1 and 1.05 ±
0.15 µmol m-2 s-1 respectively, P= 0.001, Fig. 2.1 b).
Drought treatment reduced soil respiration during the wet year 2003-2004,
especially in springs (P <0.05, Fig. 2.1 b). There was no overall effect of the drought
treatment on the soil respiration during the dry year (2004-2005), although soil
respiration still was reduced in drought plots in spring 2005 (Fig.2.1 b).
Figure 2.2. Relationships of the seasonal means of soil CO2 flux with the seasonal means of soil moisture and soil temperature. Error bars indicate ± standard error of the mean (n= 12 for each season and treatment).
Seasonal soil CO2 efflux variations followed soil moisture variations all over the
sampling periods (overall season effect P <0.0001, Fig. 2.1 b). Soil respiration increased
in the wet seasons, springs and autumn for the first sampling period. During the second
sampling period, soil respiration was increasing from autumn to spring and it decreased
in summer (Fig. 2.1 b). There was a significant relationship between seasonal CO2
efflux mean values and soil moisture (r2= 0.82, P <0.0001, Fig. 2.2), whereas no linear
relationship was found between soil respiration and soil temperature.
0
1
2
3
4
5
0 5 10 15 20 25
Soil
CO
2 Effl
ux (μ
mol
m-2
s-1
)
Soil Moisture (%volume)
0 5 10 15 20 25 30
Soil Temperature (ºC)
y=0.10x + 0.52r2= 0.82; P <0.0001

Chapter 2 Interannual soil CO2 and VOC exchange rates in a Mediterranean holm oak forest
81
Figure 2.3. Soil monoterpene exchange rate of detected monoterpenes during the sampling annual periods 2003-2004 and 2004-2005 in control and drought plots.
2.3.3. Soil monoterpene exchange rates
Soil monoterpene exchange rates were very low; the total average exchange rate for
both periods was nearly zero the first year or negative, the second one. Among several
identified monoterpenes, camphene, α-pinene and Δ3-carene showed the highest
exchange rates (Fig. 2.3).
Soil moisture reduction in drought plots did not produce an overall significant
change in the total soil monoterpene exchange rates, although significantly higher
emissions in drought plots than in control plots were found in August 2003 and April
2004 (P <0.05; Fig. 2.1). Likewise, the soil moisture difference between the wet and the
dry year did not produce a significant effect on monoterpene exchange rates. Moreover,
they did not show significant correlations with soil moisture neither with the soil CO2
efflux. However, a significant negative correlation between monoterpene exchange rate
controlS
oil M
onot
erpe
ne E
xcha
nge
Rat
e(n
mol
m-2
s-1
)
-0.010-0.008-0.006-0.004-0.002
0.000.0020.0040.006
drought
Apr 20
03
Aug 20
03
Nov 20
03
Feb 20
04
Apr 20
04
Nov 20
04
Jan 2
005
Apr 20
05
Jul 2
005
-0.012-0.010-0.008-0.006-0.004-0.002
0.000.0020.0040.006
trycicleneα-pinenecamphene β-pineneβ-myrcene3-carene limonene others

Chapter 2 Interannual soil CO2 and VOC exchange rates in a Mediterranean holm oak forest
82
and soil temperature was found for the total sampling period 2003-2005 (r2=0.56, P
<0.05), although this correlation was found only in control plots.
Among the monoterpenes detected, only camphene and limonene showed an
overall effect of the drought treatment. The mean value of camphene exchange rate
during all the sampling period 2003-2005 was an uptake of –0.0003 ± 0.0002 nmol m-2
s-1 in drought plots whereas it was an emission of 0.0004 ± 0.0001 nmol m-2 s-1 in
control plots (P <0.005, Fig. 2.3). On the contrary, limonene was emited in drought
plots whereas it was taken up in control plots (drought 0.00003 ± 0.0002 nmol m-2 s-1
and control –0.0004 ± 0.0002 nmol m-2 s-1, P <0.1, Fig. 2.3).
Soil monoterpene exchange rates showed seasonal variations (overall season
effect, P <0.05) from maximum emission rates in February 2004 and November 2004,
in control plots (0.004 nmol m-2 s-1, Fig. 2.1) to maximum uptake rates in January 2005
in drought plots (-0.01 nmol m-2 s-1, Fig. 2.1).
2.3.4. Other soil VOCs exchange rates
Background air concentration for all masses with a significant exchange rate response to
seasonal changes and drought treatment are shown in Table 2.1.
During the sampling period 2004-2005 all the masses which presented a
significant effect of the drought treatment, showed higher emissions in drought plots
than in control plots (Fig. 2.4). The greatest differences between treatments were found
in January 2005 in M96 (monoterpenes fragment), M97 (heptanal), M125 (C9
aldehydes) and M139 (C10 aldehydes) and in July 2005 in M69 (isoprene), M71 (ethyl
acetate), M96 (monoterpenes fragment), M97 (heptanal) and M123 (sesquitepenes)
(Fig. 2.4).
Several masses which presented significant seasonal variations were increasing
their emission rates from November 2004 to January 2005 and then decreasing them to
April 2005, following the soil moisture changes from mid-autumn to mid-spring (Fig.
2.5 and Fig. 2.6). M45 (acetaldehyde), M57 ((E)-2-hexenal), M81 (monoterpenes) and
M205 (sesquiterpenes) (Fig. 2.5) and M93 (toluene) and M136 (p-cymeme) (Fig. 2.6)
showed this trend.
The uptake rates of some masses such as M35, M82 (monoterpene fragment),
M127 (6-methyl-5-hepten-2-one, only in control plots) and M156 (monoterpene) varied
seasonally, increasing with increasing soil moisture from November to January, and
decreasing from January to May, in parallel to the soil moisture decrease (Fig. 2.1, 2.5)

Chapter 2 Interannual soil CO2 and VOC exchange rates in a Mediterranean holm oak forest
83
Figure 2.4. Soil VOC exchange rates detected during the 2004-2005 sampling period using PTR-MS technique that presented significant exchange rates responses to the drought treatment. Error bars indicate ± standard error of the mean (n=4 control, n=4 drought). Significances for the drought treatment overall effect or for seasonal and interaction effects (repeated measurements ANOVA) are indicated inside the panels. Between brackets it is indicated the most likely VOC corresponding to each mass based on standard calculations of the PTR-MS system and literature.
-0.04
-0.02
0
0.02
0.04 M69
-0.04
-0.02
0
0.02
0.04
controldrought
M71
-0.05
0
0.05
0.1
0.15
0.2M73
-0.1
0
0.1
0.2
0.3
0.4M96
-0.02
-0.01
0
0.01
0.02
0.03
0.04
0.05M97
-0.005
0
0.005
0.01M123
-0.01
-0.005
0
0.005
M125
-0.004
-0.002
0
0.002
0.004
0.006M139
(isoprenemethyl butanal)
(ethyl acetatemethyl vinyl ketonemetacroleine)
(monoterpenesfragment)
(methyl ethylcetonebutanonemethyl ethyl ketone)
(heptanal(E, E)-2,4-hexadienal)
(sesquiterpenes)
(C10 aldehydes)(C9 aldehydes)
season P <0.01treatment P <0.05season x treatment P <0.01 treatment P <0.1
treatment P <0.1season x treatment P <0.1
season P <0.0001treatment P <0.1
treatment P <0.1season x treatment P <0.1
season P <0.1treatment P <0.05
season P <0.1treatment P <0.1treatment P <0.1
Soil
VOC
Exc
hang
e R
ates
(nm
ol m
-2 s
-1)
Nov
200
4
Jan
2005
Apr 2
005
Jul 2
005
Nov
200
4
Jan
2005
Apr
200
5
Jul 2
005

Chapter 2 Interannual soil CO2 and VOC exchange rates in a Mediterranean holm oak forest
84
Figure 2.5. Soil VOC exchange rates detected during the 2004-2005 sampling period using PTR-MS technique that presented significant exchange rates differences among seasons. Error bars indicate ± standard error of the mean (n=4 control, n=4 drought). Significances for the overall season effect (repeated measurements ANOVA) are indicated inside the panels. Between brackets it is indicated the most likely VOC corresponding to each mass based on standard calculations of the PTR-MS system and literature.
-0.02
-0.015
-0.01
-0.005
0
0.005
0.01
0.015
0.02M35
-0.1
0
0.1
0.2
0.3
0.4
controldrought
M45
-0.2
-0.15
-0.1
-0.05
0
0,05
0.1
0.15 M57
-0.015
-0.01
-0.005
0
0.005
0.01
0.015
0.02M81
-0.004
-0.002
0
0.002
0.004 M82
-0.01
-0.005
0
0.005
0.01M127
-0.002
-0.0015
-0.001
-0.0005
0
0.0005
0.001
0.0015
0.002M156
-0.004
-0.003
-0.002
-0.001
0
0.001
0.002
0.003M205
(phosphine) (acetaldehyde)
(monoterpenes(Z)-3-nexenalhexenol (69%)sesquiterpenes)
((E)-2-hexenal)
(monoterpenes fragment )
(6-methyl-5-hepten-2-one)
(sesquiterpenes)(monoterpene)
season P <0.05 season P <0.05
season P <0.05season P <0.05
season P <0.01 season P <0.05
season P <0.05season P <0.05
Soil
VOC
Exc
hang
e R
ates
(nm
ol m
-2 s
-1)
Nov
200
4
Jan
2005
Apr
200
5
Jul 2
005
Nov
200
4
Jan
2005
Apr 2
005
Jul 2
005

Chapter 2 Interannual soil CO2 and VOC exchange rates in a Mediterranean holm oak forest
85
Figure 2.6. Soil VOC exchange rates detected during the 2004-2005 sampling period using PTR-MS technique that presented significant seasonal variations and significant interactions with the drought treatment. Error bars indicate ± standard error of the mean (n=4 control, n=4 drought). Significances for the overall season effect or the interaction between seasons and drought treatment effect (repeated measurements ANOVA) are indicated inside the panels. Between brackets it is indicated the most likely VOC corresponding to each mass based on standard calculations of the PTR-MS system and literature.
Many masses showed a common trend to increase their emissions in July 2005,
especially in drought plots (M69, M73, M123, M71, M96, M97, M45, M57, M87, M93
and M99) (Figs 2.4, 2.5 and 2.6). There were also many other unidentified masses that
showed significant responses to the drought treatment or significant seasonal variations
(see table appendix A1 and A2).
-0.2
-0.1
0
0.1
0.2
0.3M87
-0.04
-0.02
0
0.02
0.04 M93
-0.02
-0.01
0
0.01
0.02
0.03
0.04
controldrought
M99
-0.004
-0.002
0
0.002
0.004 M136
Soi
l VO
C E
xcha
nge
Rat
es
(nm
ol m
-2 s
-1)
Nov
200
4
Jan
2005
Apr
200
5
Jul 2
005
(metil-butenol2 pente-1-ol2-3 butanedione)
season P <0.05season x treatment P <0.1
(toluenep-cymeneethanol)
season P <0.005season x treatment P <0.1
(p-cymene)
season P <0.005season x treatment P <0.05
(hexenol)
season P <0.05season x treatment P <0.05
Nov
200
4
Jan
2005
Apr
200
5
Jul 2
005

Chapter 2 Interannual soil CO2 and VOC exchange rates in a Mediterranean holm oak forest
86
Table 2.1. Air concentrations of masses of volatile organic compounds in ppbv (1 ppbv = 1 part in 109 by volume) detected by PTR-MS during the 2004-2005 sampling period in Prades. Only those masses that were identified and that were significantly affected by season or treatment are shown. Data are means ± SEM; n=4. Between brackets it is indicated the most likely VOC corresponding to each mass based on standard calculations of the PTR-MS system and literature.
2.4. Discussion
2.4.1. Soil CO2 Flux
Our results showed a decrease in the mean annual soil CO2 efflux in response to the
drier conditions during the 2004-2005 sampling period. This second sampling period,
2004-2005, was much drier than the first sampling period (2003-2004) (265 mm vs 893
mm respectively). Both annual periods, which exhibited very different climate regimes,
showed total annual precipitation values far away from the average total annual
precipitation for the last 7 years (634 ± 67mm). Other interannual soil respiration
Nov 2004 Jan 2005 April 2005 Jul 2005 M31 (formaldehyde) 3.89±0.26 3.66±0.11 26.93±3.91 9.68±1.14 M35 (phosphine) 0.07±0.01 1.09±0.14 0.18±0.02 0.09±0.01 M45 (acetaldehyde) 4.99±0.18 5.66±0.70 7.81±0.50 17.44±1.52 M57 ((E)-2-hexenal) 3.40±1.19 2.55±0.32 0.42±0.09 10.38±0.37 M69 (isoprene, methyl butanal) 0.75±0.06 0.49±0.04 0.09±0.02 2.38±0.23 M71 (ethyl acetate) 0.61±0.15 0.44±0.05 0.20±0.03 2.80±0.31 M73 (methyl ethyl cetone, butanone) 0.54±0.03 0.48±0.03 0.19±0.04 3.42±0.28 M81 (monoterpenes, hexenal, hexenol) 0.36±0.06 0.37±0.04 0.02±0.02 0.81±0.02 M82 (monoterpene fragment) 0.01±0.01 0.06±0.02 0.01±0.00 0.04±0.01 M87 (hexanol) 1.04±0.06 0.83±0.11 0.25±0.10 5.28±0.29 M89 (ethyl acetate) 6.04±0.43 7.66±0.73 0.21±0.05 37.98±2.38 M93 (toluene, p-cymene) 0.32±0.08 0.23±0.08 0.06±0.02 1.26±0.21 M96 (monoterpene fragment) 2.53±0.23 3.89±0.27 0.01±0.01 13.09±0.96 M97 (heptanal) 0.38±0.03 0.36±0.06 0.03±0.02 1.51±0.11 M99 (hexenol) 0.13±0.01 0.19±0.06 0.09±0.00 0.73±0.06 M109 (sesquiterpenes) 0.36±0.03 0.28±0.05 0.04±0.01 0.85±0.06 M123 (sesquiterpenes) 0.06±0.02 0.03±0.01 0.02±0.00 0.17±0.03 M125 (C9 aldehydes) 0.06±0.02 0.05±0.02 0.03±0.01 0.26±0.03 M127 (6-methyl-5-hepten-2-one) 0.08±0.02 0.07±0.01 0.01±0.01 0.36±0.03 M136 (p-cymene) 0.01±0.00 0.00±0.00 0.03±0.01 0.11±0.01 M139 (C10 aldehydes) 0.01±0.01 0.02±0.01 0.01±0.01 0.14±0.01 M143 (hexenyl acetales) 0.05±0.00 0.07±0.01 0.02±0.01 0.26±0.05 M156 (monoterpenes) 0.01±0.00 0.02±0.01 0.01±0.01 0.01±0.00 M205 (sesquiterpenes) 0.01±0.01 0.00±0.00 0.00±0.00 0.07±0.01

Chapter 2 Interannual soil CO2 and VOC exchange rates in a Mediterranean holm oak forest
87
studies have also found soil respiration to be depressed under drought conditions
(Savage and Davidson, 2001) and in any case these results highlight the strong
interannual variation in CO2 exchange in Mediterranean ecosystems.
The predicted drier conditions of the next decades simulated by artificial drought
induction by excluding rainfall and water run-off produced a significant soil respiration
reduction in drought plots in the wet sampling period 2003-2004. This reduction was
even higher in both springs in the first year (43% average reduction). Emmett et al.
(2004) and Borken et al. (2006) found similar results with throughfall exclusion
experiments which significantly decreased mean soil respiration rate in a Mediterranean
shrubland and in a mixed deciduous forest respectively.
Our results show a high dependence of soil CO2 efflux on soil moisture in this
Mediterranean oak forest. Soil moisture is thus a good predictor of soil respiration rate.
Soil respiration rates were instead not correlated with soil temperature (Fig. 2.2). There
was a decrease in soil CO2 efflux at the highest temperatures, which were registered
when soil moisture values were lowest. These results show a soil moisture primary
control seasonally and interannually on soil respiration in the Mediterranean forests and
that the response of soil respiration to increased temperature is constrained by soil
moisture. Other studies conducted in boreal forests, such a mixed-conifer subalpine
forest (Scott-Denton et al., 2003) or a broad-leaved forest (Mo et al., 2005), showed that
temperature was a much better predictor of soil respiration than soil moisture.
Temperature is a primary control of the rates of all metabolic reactions. However, soil
respiration responses to increases in soil temperature are constrained by soil moisture,
due to the direct effects of soil moisture on microbial biomass and the indirect effects of
moisture on the amount of photosynthate available as substrate for belowground root
and rhizosphere respiration. Thus, typical seasonal changes in soil temperature and soil
moisture will determine which is the limiting factor in each season.
The results also show an additional control of soil CO2 efflux by physiology and
phenology of trees and animals. For example, in April 2005, the increase of roots and
microorganisms activities in spring (Sardans and Peñuelas, 2005; Tang and Baldocchi,
2005) coinciding not only with warmer temperatures than in winter but also with leaf
emergence, probably enhanced soil respiration rates despite the lower soil moisture
values than in winter (Fig. 2.1).
The seasonal pattern of soil respiration rate during the wet year 2003-2004
showed maximum CO2 efflux in springs and autumn and minimum efflux during the

Chapter 2 Interannual soil CO2 and VOC exchange rates in a Mediterranean holm oak forest
88
summer drought in August. This pattern is characteristic of the drought-stressed regions.
Similar seasonal trends in soil respiration have been observed in other studies (Conant
et al., 2000; Xu and Qi, 2001; Rey et al., 2002).
However, soil respiration during the dry year 2004-2005 did not respond
significantly to the soil moisture seasonal variations neither did to the drought
treatment, while these two responses were clearly evident during the wet year 2003-
2004 (Fig. 2.1), suggesting that it is needed a minimum soil moisture to appreciate
significant differences in soil respiration.
2.4.2. Soil VOCs exchange
Soil monoterpene exchange rates were very low. They ranged from –0.01 nmol m-2 s-1
to 0.004 nmol m-2 s-1 similarly to those measured in previous studies conducted with the
same soil type (ranging from –0.004 nmol m-2 s-1 to 0.004 nmol m-2 s-1, Asensio et al.,
2007b). However, they were lower than values reported in a Sitka spruce forest soil
(0.026 nmol m-2 s-1, Hayward et al., 2001) and much lower than values reported for
monoterpene foliar emission rates in Q. ilex (3.24 nmol m-2 s-1; Llusià and Peñuelas,
2000). Results show thus that the contribution of this Mediterranean holm oak forest
soil to the total monoterpenes atmospheric budget seems to be very low.
Responses of individual monoterpene to the drought treatment were different
depending on the compound. For example, camphene uptake was significantly higher in
drought plots than in control plots. Conversely, limonene uptake was significantly
higher in control plots than in drought plots, whereas other monoterpenes such as α-
pinene, β-pinene or Δ3-carene, among others, did not show significant exchange rate
responses to the drought treatment. This suggests that the effect of soil moisture
reduction on the monoterpenes exchange rates seems to be dependent on monoterpene
type.
In general, results seem to indicate that monoterpene exchange rates fluctuate
randomly. However, since they showed significant seasonal variations, monoterpene
exchange rates variations should be related to seasonal changes in soil moisture and
temperature although we have not found a simple relationship for all the data set. The
interaction of multiple factors could have produced non-linear responses resulting in a
random-like fluctuation of soil monoterpene exchange rates. In addition, the low values
and the high variability that may be explained by soil intrinsic heterogeneity and
rhizosphere processes, e. g. root growth, water uptake, absorption, respiration and

Chapter 2 Interannual soil CO2 and VOC exchange rates in a Mediterranean holm oak forest
89
exudation, which are responsible for spatial and temporal heterogeneities (Hinsinguer et
al., 2005) made difficult to distinguish general trends in our results.
Soil monoterpene exchange rates during the complete sampling period 2003-
2005 in control plots did not show a significant relationship with soil CO2 efflux. Thus,
the high monoterpene uptake rates measured in control plots in both summers (August
2003 and July 2005) can not be attributable to microbial monoterpene consumption
activity. High monoterpene emission rates from Quercus ilex leaves have been
described in summer in this Mediterranean holm oak forest (Llusià, personal
communication), and our results show the low activity of soil microorganisms and roots
during summer. Thus, those high monoterpene uptake rates measured in both summers
in control plots might be the result of a monoterpene gradient between the rich-
monoterpene air just above the soil surface and the poor-monoterpene soil air-space.
On the other hand, soil monoterpene exchange linkages with soil CO2 efflux in
drought plots were noticeable only during the dry year 2004-2005. High monoterpene
uptake rates in drought plots coincided with high soil CO2 efflux in this period (linear
regression not shown, r2=0.95, P <0.05). This suggests that soil monoterpene exchange
rates during a dry year could be mostly driven by the microorganisms consumption
activity.
Although the changes were small, the drought treatment increased the exchange
rates of several other VOCs during the studied period 2004-2005 (Fig. 2.4 and appendix
Table A1). These higher emissions observed in drought plots might be due to changes in
soil physical properties induced by low soil moisture, more than changes in the
rhizosphere or in the bulk soil microorganisms activity. Thus, when soil dries, larger
pores are formed and VOCs exchange with the atmosphere can increase. Our results
support this hypothesis because the 2004-2005 exchange rate patterns of most of the
studied VOCs were not significantly correlated with the soil CO2 efflux changes. At
higher temperatures the gas phase concentrations of monoterpenes and other VOCs
increased, leading to a larger volatilisation (Van Roon et al., 2005). Similarly to the
physical effect of the drought treatment, this physical effect of high soil temperature
over the soil exchange processes may also partially account for the high emissions
measured in July 2005 in drought plots
Seasonal variations in the very low emission rates of VOCs revealed two
different trends in responses to soil moisture changes during this dry period 2004-2005.
Chapter 2 Interannual soil CO2 and VOC exchange rates in a Mediterranean holm oak forest
90
Most compounds increased their emission rates when soil moisture increased, but a
minor number of compounds emissions tended to decrease with soil moisture increases
(Fig. 2.5 and 2.6 and appendix Table A2). In all cases, only a low proportion of variance
was explained by the soil moisture changes, since almost all compounds increased their
emission rates in summer 2005, probably due to the effect of high soil temperature (Van
Roon et al., 2005).
2.5. Conclusions
In this Mediterranean holm oak forest, temperature dependency of soil respiration was
constraint by soil moisture. Phenology seemed to exert a secondary control over soil
respiration. As a result, maximum rates of CO2 efflux occurred in spring and autumn
and the minimum values in summer.
Soil monoterpene exchange rates were extremely low. They were affected by
seasonal variations in soil moisture, temperature and other factors throughout the years.
High soil temperatures increased the monoterpene uptake in control plots. The response
of each individual monoterpene to drought treatment and to the seasonal variations
seems to be monoterpene specific.
High soil temperatures in summer increased VOC exchange rates. Drought
treatment tended to increase the emission rates of several of these VOCs. Temperature
seemed to affect the emission rates depending on the compound type.
The expected decrease in water availability in the next three or four decades by
GCM and ecophysiological models such as GOTILWA (IPCC, 2001; Sabaté et al.
2002; Peñuelas et al. 2005a) will decrease soil respiration and may increase soil
emissions of several volatile compounds.

Chapter 2 Interannual soil CO2 and VOC exchange rates in a Mediterranean holm oak forest
91
Appendix-Table A1. Soil VOC exchange rates (nmol m-2 s-1) detected during the 2004-2005 sampling period using PTR-MS technique that presented significant exchange rates responses to the drought treatment or to the interaction between season and drought treatment (S x T). Error bars indicate ± standard error of the mean (n=4 control, n=4 drought). Significance for the drought treatment overall effect or for season and interaction effects (repeated measurement ANOVA) is indicated for each mass.
significance November 2004 January 2005 April 2005 July 2005
Season Treatments S x T control drought control drought control drought control drought
M21 P<0.05 -0.2605±0.2765 -0.3599±0.5639 0.0552±0.2568 0.0743±0.0753 -0.0107±0.1484 -0.1224±0.4189 -1.8797±1.1548 2.6984±2.5534
M28 P<0.05 0.0023±0.0031 0.0041±0.0014 -0.0073±0.0057 0.0058±0.0060 -0.0010±0.0018 -0.0015±0.0018 -0.0061±0.0031 0.0040±0.0059
M30 P<0.1 P<0.05 0.5376±0.5461 -0.0709±0.5067 -0.9333±0.2533 -0.0998±0.3082 -0.0678±0.5778 -0.9870±1.3973 -7.0211±5.0306 7.5290±6.6176
M60 P<0.05 P<0.05 0.0007±0.0037 -0.0052±0.0029 -0.0097±0.0020 0.0052±0.0035 0.0004±0.0007 -0.0001±0.0012 -0.0091±0.0196 0.0516±0.0289
M75 P<0.05 -0.0009±0.0026 -0.0043±0.0009 -0.0002±0.0010 0.0007±0.0037 -0.0007±0.0016 -0.0010±0.0014 -0.0109±0.0062 0.0096±0.0101
M88 P<0.1 -0.9151±0.9192 -1.2952±0.5464 0.0306±1.3803 0.6966±1.5465 0.0011±0.0009 -0.0004±0.0009 -1.4723±4.4442 13.2305±8.4834
M105 P<0.05 P<0.1 P<0.005 -0.0031±0.0023 -0.0064±0.0033 -0.0017±0.0013 0.0001±0.0003 0.0010±0.0002 0.0001±0.0005 -0.0043±0.0029 0.0096±0.0038
M113 P<0.1 0.0000±0.0006 0.0004±0.0007 0.0007±0.0010 -0.0001±0.0009 0.0004±0.0009 0.0011±0.00003 -0.0008±0.0013 0.0032±0.0010
M141 P<0.05 -0.0004±0.0004 0.0004±0.0006 0.0000±0.0010 0.0007±0.0009 0.0004±0.0002 0.0006±0.0004 -0.0005±0.0010 0.0022±0.0006
M150 P<0.1 0.0004±0.0002 0.0002±0.0002 0.0004±0.0007 -0.0006±0.0003 -0.0002±0.0002 -0.0002±0.0002 -0.0008±0.0002 0.0003±0.0004
M193 P<0.05 0.0002±0.0002 0.0000±0.0000 -0.0003±0.0003 0.0009±0.0006 -0.0002±0.0002 -0.0002±0.0002 0.0001±0.0002 -0.0005±0.0003
M200 P<0.05 0.0002±0.0002 0.0000±0.0000 0.0004±0.0004 0.0003±0.0003 0.0002±0.0002 0.0002±0.0002 -0.0004±0.0001 0.0008±0.0002
M202 P<0.0001 P<0.0005 P<0.0001 0.0000±0.0000 0.0000±0.0000 0.0000±0.0000 0.0000±0.0000 0.0000±0.0000 0.0000±0.0000 0.0003±0.0001 0.0007±0.0000

Chapter 2 Interannual soil CO2 and VOC exchange rates in a Mediterranean holm oak forest
92
Appendix-Table A2. Soil VOC exchange rates (nmol m-2 s-1) detected during the 2004-2005 sampling period using PTR-MS technique that presented significant exchange rates differences among seasons. Error bars indicate ± standard error of the mean (n=4 control, n=4 drought). Significance for season and season x treatment (S x T) interaction effects (repeated measurements ANOVA) is indicated for each mass.
significance November 2004 January 2005 April 2005 July 2005
Season S x T control drought control drought control drought control drought M22 P<0.1 0.2765±-0.0051 -0.0012±0.0016 0.0048±0.0025 0.0014±0.0019 -0.0004±0.0016 0.0023±0.0024 0.0008±0.0016 0.0016±0.0019
M36 P<0.1 0.0053±0.0023 0.0080±0.0050 -0.0114±0.0053 -0.0046±0.0043 0.0014±0.0020 0.0031±0.0027 0.0065±0.0069 0.0560±0.0478
M40 P<0.01 -0.0019±0.0006 -0.0015±0.0005 0.0004±0.0011 0.0003±0.0011 0.0002±0.0002 0.0001±0.0006 -0.0005±0.0007 -0.0007±0.0003
M44 P<0.1 P<0.05 -0.0219±0.0123 -0.0187±0.0045 -0.0001±0.0127 -0.0006±0.0107 0.0002±0.0014 -0.0004±0.0012 -0.0285±0.0163 0.0532±0.0398
M46 P<0.1 -0.0602±0.0184 -0.0653±0.0209 0.0086±0.0269 0.0112±0.0321 -0.0035±0.0038 -0.0012±0.0072 -0.0847±0.1409 0.3052±0.2188
M62 P<0.05 -0.0025±0.0015 -0.0003±0.0032 0.0011±0.0041 0.0005±0.0028 -0.0018±0.0005 -0.0008±0.0014 0.0085±0.0014 0.0308±0.0147
M70 P<0.1 -0.0025±0.0010 -0.0015±0.0012 0.0011±0.0012 0.0010±0.0005 0.0004±0.0003 0.0010±0.0006 0.0001±0.0015 0.0016±0.0024
M72 P<0.005 -0.0015±0.0019 -0.0030±0.0023 0.0007±0.0005 0.0011±0.0017 0.0001±0.0004 -0.0004±0.0004 0.0014±0.0015 0.0059±0.0007
M86 P<0.01 -0.0019±0.0007 0.0000±0.0001 0.0000±0.0015 0.0011±0.0004 -0.0014±0.0009 -0.0009±0.0010 0.0017±0.0015 0.0032±0.0009
M90 P<0.1 -0.0033±0.0050 -0.0020±0.0023 -0.0032±0.0033 0.0000±.0.0021 0.0007±0.0008 0.0002±0.0002 0.0003±0.0128 0.0407±0.0280
M94 P<0.05 -0.0003±0.0045 -0.0047±0.0079 -0.0048±0.0038 -0.0016±0.0011 0.0003±0.0005 0.0003±0.0005 0.0058±0.0104 0.0365±0.0229
M108 P<0.05 -0.0017±0.0019 -0.0024±0.0021 0.0023±0.0007 0.0000±0.0005 0.0004±0.0002 -0.0001±0.0003 0.0003±0.0008 0.0008±0.0006
M124 P<0.05 0.0012±0.0004 0.0019±0.0007 0.0010±0.0006 0.0010±0.0003 -0.0003±0.0004 -0.0002±0.0002 0.0010±0.0006 0.0001±0.00006
M126 P<0.05 0.0013±0.0007 0.0013±0.0009 -0.0006±0.0003 -0.0003±0.0003 -0.0001±0.0006 -0.0005±0.0005 0.0005±0.0006 0.0008±0.0010
M131 P<0.05 -0.0004±0.0006 -0.0010±0.0006 0.0005±0.0008 -0.0010±0.0004 -0.0002±0.0004 0.0001±0.0004 0.0007±0.0012 0.0021±0.0006
M145 P<0.05 -0.0006±0.0000 -0.0002±0.0008 0.0004±0.0008 0.0008±0.0005 0.0006±0.0008 -0.0002±0.0004 0.0004±0.0008 0.0035±0.0009
M163 P<0.1 -0.0006±0.0006 -0.0006±0.0006 0.0001±0.0006 0.0014±0.0011 -0.0002±0.0007 -0.0009±0.0005 0.0019±0.0012 0.0015±0.0019
M168 P<0.05 0.0000±0.0000 0.0000±0.0000 0.0000±0.0000 0.0000±0.0000 -0.0002±0.0002 0.0000±0.0003 -0.0005±0.0003 -0.0007±0.0004
M173 P<0.1 0.0000±0.0004 -0.0004±0.0002 0.0010±0.0006 0.0014±0.0011 -0.0003±0.0005 -0.0005±0.0003 0.0007±0.0006 -0.0001±0.0005
M175 P<0.1 0.0008±0.0002 0.0002±0.0002 -0.0005±0.0003 -0.0009±0.0006 0.0000±0.0003 0.0000±0.0003 0.0006±0.0008 0.0002±0.0008
M177 P<0.05 0.0000±0.0007 0.0000±0.0003 -0.0008±0.0010 -0.0013±0.0005 0.0004±0.0002 0.0002±0.0002 0.0000±0.0009 0.0018±0.0005
M178 P<0.001 0.0000±0.0000 0.0002±0.0002 -0.0013±0.0005 -0.0013±0.0005 -0.0002±0.0002 -0.0002±0.0002 -0.0001±0.0003 0.0011±0.0004
M194 P<0.1 0.0000±0.0000 0.0000±0.0000 0.0000±0.0000 0.0003±0.0003 -0.0002±0.0002 -0.0002±0.0002 0.0002±0.0001 0.0004±0.0002
Chapter 2 Interannual soil CO2 and VOC exchange rates in a Mediterranean holm oak forest
93
Appendix A
Table A.1 presents the soil VOC exchange rates (nmolm2 s-1) detected during the 2004–
2005 sampling period using PTR-MS technique that presented significant exchange
rates responses to the drought treatment or to the interaction between season and
drought treatment (S_T).
Table A.2 presents the soil VOC exchange rates (nmolm2 s-1) detected during the 2004–
2005 sampling period using PTR-MS technique that presented significant exchange
rates differences among seasons.
Acknowledgements
This research was supported by Spanish MEC grants. We also gratefully acknowledge
partial funding by the ISONET European Commission contract MC-RTN-CT-2003, the
ALARM European Commision contract and a Fundación BBVA 2004 and a Catalan
Government grants.
References
Akiyama, K., Matsuzaki, K., Hayashi, H., 2005. Plant sesquiterpenes induce hyphal branching in arbuscular mycorrhizal fungi. Nature 435, 824-827. Asensio, D., Peñuelas, J. & Llusià, J. 2007a. Interannual and interseasonal soil CO2 efflux and VOC exchange rates in a Mediterranean holm oak forest in response to experimental drought. Soil Biology and Biochemistry 39, 2471-2484. Asensio, D., Peñuelas, J., Llusià, J. & Ogaya, R. 2007b. Seasonal soil VOC exchange rates in a Mediterranean holm oak forest and their responses to drought conditions. Atmospheric Environment 41, 2456-2466. Bender, M., Conrad, R., 1993. Kinetics of methane oxidation in oxic soils. Chemosphere 26, 687-696. Borken, W., Savage, K, Davidson, E. A., Trumbore, S., E. 2006. Effects of experimental drought on soil respiration and radiocarbon efflux from a temperate forest soil. Global Change Biology 12, 177-193. Chamberlain, K., Guerrieri, E., Pennacchio, F., Pettersson, J., Pickett, J. A., Poppy, G. M., Powell, W., Wadhams, L. J., Woodcok, C. M., 2001. Can aphid-induced plant signals be transmitted aerially and through the rhizosphere?. Biochemical Systematics and Ecology 29, 1063-1074.

Chapter 2 Interannual soil CO2 and VOC exchange rates in a Mediterranean holm oak forest
94
Chen, F., Ro, D., Petri, J., Gershenzon, J., Bohlmann, J., Pichersky, E., Tholl, D., 2004. Characterization of a root-specific Arabidopsis terpene synthase responsible for the formation of the volatile monoterpene 1,8-cineole. Plant Physiology, 135, 1956-1966.
Cho, C., Sung, K., Coapcioglu, M. Y., Drew, M., 2005. Influence of water content and plants on the dissipation of chlorinated volatile organic compounds in soil. Water, Air and Soil Pollution 167, 259-271. Conant, R. T., Dalla-Betta, P., Klopatek, C. C., Jeffrey, M. J., 2004. Controls on soil respiration in semiarid soils. Soil Biology and Biochemistry 36, 945-951. Davidson, B. A., Belk, E., Boone, R. D., 1998. Soil water content and temperature as independent or confound factors controlling soil respiration in a temperate mixed harwood forest. Global Change Biology 4, 217-227. Emmett, B. A., Beier, C., Estiarte, M., Tietema, A., Kristensen, H. L., Williams, D., Peñuelas, J., Schmidt, I., Sowerby, A., 2004. The response of soil processes to climate change: Results from manipulation studies of shrublands across an environmental gradient. Ecosystems 7, 625-637. Fall, R., Karl, T., Hansel, A., Jordan, A., Lindinger, W., 1999. Volatile organic compounds emitted after leaf wounding: on-line analysis by proton-transfer-reaction mass spectrometry. Journal of Geophysical Research 104, 15963–15974. Grant, R. F., Rochette, P., 1994. Soil microbial respiration at different water potentials and temperatures. Theory and mathematical modelling. Soil Science Society of America Journal 58, 1681-1690. Guenther, A., 1999. Modeling biogenic organic compounds emissions to the atmosphere. In: Hewitt, C. N. (Ed.), Reactive Hydrocarbons in the Atmosphere. San Diego. U. S.A., pp. 98-116. Hayward, S., Muncey, R. J., James, A. E., Halsall, C. J., Hewitt, C. N., 2001. Monoterpene emissions from soil in a Sitka spruce forest. Atmospheric Environment 35, 4081-4087. Hisinger, P., Gobran, G. R., Gregory, P., J., Wenzel, W. W., 2005. Rhizosphere geometry and heterogeneity arising from root-mediated physical and chemical processes. New Phytologist 168, 293-303. IPCC 2001. Climate change 2001: The Scientific Basis. Contribution of Working Group I. Third Assessement Report of Intergovernamental Panel on Climate Change. Hougton, J. T., Dung, Y., Griggs, D. J., Noguer, M., Van der Linden, P., Dui, X., Maskell, K., Johnson, C. A., (Eds). Cambridge University Press, Cambridge. Janson, R. W., 1993. Monoterpene emissions from Scots pine and Norwegian spruce. Journal of Geophysical Research-Atmospheres 98 (D2), 2839-2850.

Chapter 2 Interannual soil CO2 and VOC exchange rates in a Mediterranean holm oak forest
95
Kesselmeier, J., Hubert, A., 20002. Exchange of reduced volatile sulfur compounds between leaf litter and the atmosphere. Atmospheric Environment 36 (29), 4679-4686. Lindinger, W., Hansel, A., Jordan, A., 1998. On-line monitoring of volatile organic compounds at pptv level by means of proton-transfer-reaction mass spectrometry (PTR-MS). International Journal of Mass Spectrometry 173, 191-241.
Llusià, J., Peñuelas, J., 2000. Seasonal patterns of terpene content and emission from seven Mediterranean woody species in field conditions. American Journal of Botany 87, 133-140.
Mackie, A. E., Wheatley, R. E., 1999. Effects and incidence of volatile organic compound interactions between soil bacterial and fungal isolates. Soil Biology and Biochemistry 31, 375-385. Misra, G., Pavlostathis, S. G., Perdue, E. M., Araujo, R., 1996. Aerobic biodegradation of selected monoterpenes. Applied Microbiology and Biotechnology 45, 831-838. Mo, W., Lee, M., Uchida, M., Inatomi, M., Saigusa, N., Mariko, S., Koizumi, H., 2005. Seasonal and annual variations in soil respiration in a cool-temperate decidous broad-leaved forest in Japan. Agricultural Forest and Metereology 134, 81-94. Newman, L. A., Strand, S. E., Choe, N., Duffy, J., Ekuan, G., Ruszaj, M., Shurtleff, B. B., Wilmoth, J., Heilman, P., Gordon, M. P., 1997. Uptake and biotransformation of trichloroethylene by hybrid poplars. Environmental Science and Technology 31 (4), 1062-1067. Nishida, N., Tamotsu, S., Nagata, N., Saito, C., Sakai, A., 2005. Allelopathic effects of volatile monoterpenoids produced by Salvia leucophylla: Inhibition of cell proliferation and DNA syntesis in the root apical meristem of Brassica campestris seedlings. Journal of Chemical Ecology 31, 1187-1203. Nordenhem, H., Nordlander, G., 1994. Olfactory oriented migration through soil by root-living Hylobius abietis (L) larvae (Col, Curculionidae). Journal of Applied. Entomology 117, 457-462.
Ogaya, R., Peñuelas, J., 2003. Comparative field study of Quercus ilex and Phillyrea latifolia: photosynthetic response to experimental drought conditions. Environmental and Experimental Botany 50, 137-148.
Ogaya, R., Peñuelas, J., 2004. Phenological patterns of Quercus ilex, Phillyrea latifolia, and Arbutus unedo growing under a field experimental drought. Écoscience 11 (3), 263-270.
Peñuelas, J., Filella, I., Comas, P., 2002. Changed plant and animal life cycles from 1952-2000 in the Mediterranean region. Global Change Biology 8, 531-544.
Peñuelas, J., Boada, M., 2003. A global change-induced biome shift in the Montseny mountains (NE Spain). Global Change Biology 9, 131-140.

Chapter 2 Interannual soil CO2 and VOC exchange rates in a Mediterranean holm oak forest
96
Peñuelas, J., Gordon, C., Llorens, L., Nielsen, T., Tietema, A., Beier, C., Bruna, P., Emmett, B., Estiarte, M., Gorissen, A., 2004. Non intrusive field experiments show different plant responses to warming and drought among sites, seasons and species in a North-South European gradient. Ecosystems 7, 598-612.
Peñuelas, J., Filella, I., Sabate, S., Gracia, C., 2005a. Natural systems: terrestrial ecosystems. In Llebot, J. E. (Ed), Report on Climate change in Catalonia. Institut d'Estudis Catalans, Barcelona. pp. 517-553.
Peñuelas, J., Filella, I., Stefanescu, C., Llusià, J., 2005b. Caterpillars of Euphydryas aurinia (Lepidoptera: Nymphalidae) feeding on Succisa pratensis leaves induce large foliar emissions of methanol. New Phytologist 167, 851-857.
Pignatello, J. J., Xing, B., 1996. Mechanisms of slow sorption of organic chemicals to natural particles. Environmental Science and Technology 30, 1-11.
Raich, J. W., Schlesinger, W. H., 1992. The global carbon dioxide flux in soil respiration and its relationship to vegetation and climate. Tellus Series B-Chemical and Physical Metereology 44, 81-99.
Rey, A., Pegoraro, E., Tedeschi, V., De Parri, I., Jarvis, P. G., Valentini, R., 2002. Annual variation in soil respiration and its components in a coppice oak forest in Central Italy. Global Change Biology 8, 851-866.
Ryu, C., Farag, M. A., Hu, C., Reddy, M. S., Wei, H., Pare, P. W., Kloepper, J. W., 2003. Bacterial volatiles promote growth in Arabidopsis. Proceedings of the National Academy of Science of the United States of America 100, (8) 4927-4932.
Sardans, J., Peñuelas, J., 2005. Drought decreases soil enzyme activity in a Mediterranean Quercus ilex L. forest. Soil Biology and Biochemistry 37, 455-461.
Sabaté, S., Gracia, C., Sánchez, A., 2002. Likely effects of climate change on growth of Quercus ilex, Pinus halepensis, and Fagus sylvatica forest in the Mediterranean region. Forest Ecology and Management 162, 23-37. Savage, K. E., Davidson, E. A., 2001. Interannual variation of soil respiration in two New England forests. Global Biogeochemical Cycles 15, 337-350. Schade, G. W., Goldstein, A. H., 2001. Fluxes of oxygenated volatile organic compounds from a ponderosa pine plantation. Journal of Geophysical Research-Atmospheres 106 (D3), 3111-3123. Schlesinger, W. H., Andrews, J. A., 2000. Soil respiration and the global carbon cycle. Biogeochemistry 48, 7-20. Scholler, C. E. G., Gurtler, H., Pedersen, R., Molin, S., Wilkins, K., 2002. Volatile metabolites from actinomycetes. Journal of Agricultural and Food Chemistry 50, 2615-2621.

Chapter 2 Interannual soil CO2 and VOC exchange rates in a Mediterranean holm oak forest
97
Scott-Denton, L. E., Sparks, K. L., Monson, R. K., 2003. Spatial and temporal controls of soil respiration rate in a high-elevation, subalpine forest. Soil Biology and Biochemistry 35, 525-534. Simonich, S. L., Hites, R. A., 1995. Organic Pollutant accumulation in vegetation. Environmental Sciences and technology 29 (12), 2905-2914. Smolander, A., Ketola, R. A., Kotiaho, T., Kanerva, S., Suominen, K., Kitunen, V., 2006. Volatile monoterpenes in soil atmosphere under birch and conifers: Effects on soil N transformations. Soil Biology and Biochemistry 38, 3436-3442. Sokal, R.R., Rohlf, F.J., 1995. Biometry. The Principles and Practice of Statistics in Biological Research, 3rd edn. W.H.Freeman and Co., New York. Steinbrecher, R., Hauff, K., Rossler, J., Durr, M., Seufert, G., 1999. Monoterpene emission from soils in orange plantations of the Valencian Citrus belt, Spain. Physics and Chemistry of the Earth Part B-Hydrology Oceans and Atmosphere 24, (6) 695-698. Sthal, P. D., Parkin, T. B., 1996. Microbial production of volatile organic compounds in soil microcosms. Soil Science Society of America Journal 60, 821-828. Tang, J. W., Baldocchi, D. D., 2005. Spatial temporal variation in soil respiration in an oak-grass savanna ecosystem in California and its partitioning into autotrophic and heterotrophic components. Biogeochemistry 73,183-207. Tani, A., Hayward, S., Hewitt, C. N., 2003. Measurements of monoterpenes and related compounds by proton transfer reaction-mass spectrometry (PTR-MS). International Journal of Mass Spectrometry 223, 561-578. Van Ginkel, C. G., De Jong, E., Tialnus, J. W. R., Bont, J. A. M., 1987. Microbial oxidation of isoprene, a biogenic foliage volatile and of 1,3-butadiene, an anthropogenic gas. FEMS Microbiological Ecology, 45, 275-279. Van Roon, A., Parsons J. R., Krap L., Govers H. A. J., 2005. Fate and transport of monoterpenes through soils. Part II: Calculation of the effect of soil temperature,water saturation and organic carbon content. Chemosphere 61, 129-138. West, N. E., Stark, J. M., Johnson, D. W., Abrams, M. M., Wight, J. R., Heggem, D., Pecks S., 1994. Effects of climatic-change on the edaphic features of arid and semiarid lands of western north-America. Arid Soil Research and Rehabilitation 8, 307-351. White, C. S., 1994. Monoterpenes-Their effects on ecosystem nutrient cycling. Journal of Chemical Ecology 20, 1381-1406. Xu, M., Qi, Y., 2001. Soil-surface CO2 efflux and its spatial and temporal variation in a young ponderosa pine plantation in northern California. Global Change Biology 7, 667-677. Xu, C. K., Mo, M. H., Zhang, L. M., Zhang, K. Q., 2004. Soil volatile fungistasis and volatile fungistatic compounds. Soil Biology and Biochemistry 36, 1997-2004.

Chapter 2 Interannual soil CO2 and VOC exchange rates in a Mediterranean holm oak forest
98
Chapter 3 Interannual monoterpene and VOC exchange rates in a Mediterranean shrubland
99
Chapter 3
Interannual and seasonal changes in the
soil exchange rates of monoterpenes
and other VOCs in a Mediterranean
shrubland

Chapter 3 Interannual monoterpene and VOC exchange rates in a Mediterranean shrubland
100
Chapter 3 Interannual monoterpene and VOC exchange rates in a Mediterranean shrubland
101
Abstract
Information about soil VOC inventories and exchange rates in different soils is very
scarce. Seasonality of soil VOC exchange rates is also largely unknown, despite the
increasing interest in some soil volatile compounds, such as monoterpenes, because of
their important role in soil ecology. We aimed to explore and quantify soil VOC
exchange rates in a Mediterranean shrubland and their seasonality. Measurements of
soil VOC exchange were taken using GC-MS and PTR-MS techniques, together with
soil temperature, soil moisture and soil CO2 efflux measurements, during two annual
campaigns with contrasting precipitation.
M33 (methanol), M43 (acetic acid, ethyl acetate), M45 (acetaldehyde), M59
(acetone), M73 (C3 and C4 carboniles), α-pinene and limonene, showed the highest
emission rates. Maximum soil monoterpene emission rates were very low (0.003 nmol
m-2 s-1) compared with foliar monoterpene emission rates. The emission rates of the
other VOCs were also low (maximum 0.8 nmol m-2 s-1) except for M33 (methanol, 2.5
nmol m-2 s-1). Maximum soil uptake rates for some VOCs, such as M33 (methanol) and
M42 (acetonitrile) (ranging from –0.1 nmol m-2 s-1 to –0.5 nmol m-2 s-1) were, however,
comparable with foliar uptake rates. Further studies are needed to corroborate these
results and the possible importance of the soil VOC sink in regional chemistry-climate
models.
Long-term severe drought increased soil monoterpene emission rates in this
Mediterranean shrubland. The increases seem to be linked to changes in the soil’s
physical properties induced by low soil moisture. Unlike monoterpenes, other soil VOC
emission rates decreased when soil moisture was low. The results suggest a strong
seasonal control of soil temperature on the emission rates of monoterpenes and other
VOCs. The emission rates increase with soil temperature. Positive correlations between
the VOC exchange rates and the soil CO2 fluxes suggest that phenology of roots and
microorganisms also controls soil VOCs’ seasonal changes in this Mediterranean
shrubland.
Key words: Mediterranean shrubland, soil monoterpenes, soil VOCs, soil moisture, soil temperature,
drought, seasonality.
Chapter 3 Interannual monoterpene and VOC exchange rates in a Mediterranean shrubland
102
3.1. Introduction
Volatile Organic Compounds (VOCs) are reactive trace gases in the troposphere which
interact with other atmospheric trace compounds, affecting distributions of air pollutants
such as NOx, PANs, and particles (Atkinson and Arey, 2003) and playing a central role
in tropospheric ozone formation (Fuentes et al., 2000; Chen and Griffin, 2005). For this
reason, considerable effort has been made to identify the sources and to quantify the
amounts (Lamb et al., 1987; Mueller, 1992).
VOCs originate from three main sources: anthropogenic activities, biomass
burning and the biosphere. The biosphere is the largest source of VOCs, its emissions
surpassing several times those from anthropogenic and biomass burning sources
(Guenter et al., 1995). Natural sources of VOC emissions to the atmosphere include
marine and fresh water, soil and sediments, microbial decomposition of organic
material, geological hydrocarbon reservoirs, plant foliage and woody material. Among
terrestrial ecosystems, foliar emissions (mainly isoprene and terpenes) from woodlands
are considered the largest source (Guenther et al. 1994; Fuentes et al., 1996, Peñuelas
and Llusia 2001). Isoprene and monoterpenes, and some partly oxygenated VOCs such
as formaldehyde, acetaldehyde, acetone, methanol, ethanol, formic and acetic acids, are
synthesized in plants and emitted in large amounts into the atmosphere (Guenther et al.
1994; Fall, 1999; Fall et al., 1999, Seco et al 2007). Most studies have focused on these
compounds, since they are highly reactive and have a greater ozone formation potential.
These volatile compounds are also involved in numerous physiological and ecological
interactions in forest ecosystems (Gershenzon, 1994; Lerdau et al., 1995; Peñuelas et
al., 1995; Fall et al., 1999; Heiden et al., 2003; Peñuelas and Llusià, 2001, 2003, 2004).
In contrast to foliar VOC exchanges, non methane soil VOC exchanges with the
atmosphere have received little attention, because they probably represent less than a
few percent of total global VOC exchange (Lamb et al., 1987; Guenther et al. 1995),
though further investigation is needed to verify this assumption. In fact, there is still a
lack of data on soil VOC inventories in different soil and ecosystem types. There are
also many uncertainties about the soil VOC exchange process, since several factors are
involved in the emission and uptake of VOCs by soils.
There is now evidence that soil may be both a VOC source (Guenther, 1999) and
a sink (Van Ginkel et al., 1987, Bender and Conrad, 1993; Asensio et al., 2007a, b).
Litter is the largest source of VOC emissions from natural soils (Hayward et al., 2001,

Chapter 3 Interannual monoterpene and VOC exchange rates in a Mediterranean shrubland
103
Schade and Goldstein, 2001) followed by roots (Janson 1993, Chen et al. 2004; Lin et
al., 2007) and microorganisms (Scholler et al. 2002). Physical adsorption of VOCs to
soil particles (Pignatello and Xing, 1996) and biodegradation by microorganisms (Van
Roon et al. 2005b) or adsorption and degradation by root tissue (Simonich and Hites,
1995; Newman et al., 1997¸ Cho et al., 2005) are known to produce soil VOC uptake.
The role of monoterpenes and other VOCs in soil ecology is far from well
understood. However, important roles such as the VOC-mediated interactions among
bacteria/fungi and plants have been described in recent years. For example, Ruy et al.
(2003) reported that 2,3-butanediol and acetoin are synthesized and emitted by plant
growth-promoting Bacillus strains that enhance growth and induce systemic resistance
of Arabidopsis thaliana. Splivallo et al. (2007) reported that fungal volatiles from
truffles caused bleaching of Arabidopsis thaliana leaves, and/or inhibition of root and
leaf development. Volatiles in soil also mediate plant-plant interactions (Nishida et al.,
2005) and plant-insect interactions (Nordenhem and Nordlander, 1994; Chamberlain et
al., 2001). Other authors have reported the potential for monoterpenes to alter rates of
nutrient cycling since monoterpenes inhibit nitrification in soil (White, 1994; Smolander
et al., 2006) but serve as a carbon and energy source for soil microbes (Misra et al.,
1996; Owen et al., 2007).
Climatic (IPCC, 2007) and ecophysiological models such as GOTILWA (Sabaté
et al., 2002, Peñuelas et al., 2005) project increased drought in the near future in the
Mediterranean Basin, which may affect soil VOC emission and uptake directly (Asensio
et al. 2007a), or indirectly through its effects on plants and soil micro-organism
activities (Ogaya and Peñuelas 2003; Ogaya et al. 2003; Emmet et al. 2004; Peñuelas et
al. 1998; 2004; 2007; Sardans and Peñuelas, 2005).
Given the lack of information on soil-atmosphere VOC fluxes, the importance of
soil VOCs on soil ecology, and the projections of increased drought in Mediterranean
ecosystems, we conducted this study of soil VOC exchange rates in a Mediterranean
shrubland at the Garraf Natural Park, in Catalonia. Our aims were (i) to explore and
quantify the soil VOC exchange rates, with special attention to monoterpenes, in a
typical calcareous Mediterranean shrubland (ii) to investigate interannual and seasonal
variations in soil VOC exchange rates and (iii) to study soil VOC exchange rates’ links
to soil temperature, soil moisture and soil CO2 efflux.

Chapter 3 Interannual monoterpene and VOC exchange rates in a Mediterranean shrubland
104
3.2. Material and methods
3.2.1. The study site and species description
The study was carried out in a dry shrubland (Rosmarino-Ericion) at the Garraf Natural
Park, in Catalonia, North-East Spain (41º18’N, 1º49’E), at 210 m a.s.l., on a South-
South-East slope (13º). The climate is typically Mediterranean (annual average
temperature 15.1 ºC and annual average precipitation 455 mm. The site, which is
located on terraces of abandoned vineyards, suffered severe fires in the summers of
1982 and 1994. The soil is a Petrocalcic Calcixerept (Soil Survey Staff, 1998), thin (12–
37 cm), with a loamy texture and abundant calcareous nodules and soil pH is 7.7.
Physico-chemical soil properties measured within 0-15 cm soil depth are shown in
Table 3.1. Currently the vegetation covers 60-70% with a maximum height of 70 cm.
The dominant species at the study site, Erica multiflora L., Globularia alypum L., Pinus
halepensis L. and Rosmarinus officinalis L., are evergreen species that typically occur
on basic soils of the western Mediterranean Basin, where they are common components
of the coastal shrubland.
3.2.2. Sampling
Measurement campaigns were carried out on 2 consecutive sunny days in each season
of two annual sampling periods (one with standard climate, between spring 2003 and
winter 2004 and a dry one, between autumn 2004 and summer 2005): spring 2003 (May
9 and 10), summer 2003 (August 19 and 20), autumn 2003 (November 19 and 20),
winter 2004 (January 27 and 28), autumn 2004 (November 9 and 10), winter 2005
(February 1 and 2), spring 2005 (May 25 and 26) and summer 2005 (August 4 and 5).
Soil CO2 fluxes and soil VOC exchange rates were measured during the morning (from
7 a.m. to 12 a.m. solar time).
3.2.3. Measurements of soil CO2 flux, temperature and moisture.
Soil respiration was measured in situ using a flow-through chamber method and an
infrared gas analyser system (EGM-4, PP Systems, Hitchin, Hertfordshire, England) as
described by Asensio et al. (2007b).
Twenty seven collars were distributed randomly in a 1 ha field site. The collars
were installed in winter 2002 and were permanently placed into the soil, in order to

Chapter 3 Interannual monoterpene and VOC exchange rates in a Mediterranean shrubland
105
minimise possible effects of mechanical disturbance during measurements. Litter
recently fallen inside the PVC collars was removed before sampling to obtain CO2
emissions only from mineral soil, roots and microorganisms.
Together with each gas exchange measurement, soil temperature was measured
with a digital soil thermometer (TO 15, Jules Richard instruments, Argenteuil, France)
and soil moisture with a HH2 soil moisture meter connected to a ML2x soil moisture
sensor (Delta-T Devices Ltd, Cambridge, England). These measurements were taken at
10 cm depth, just beside each PVC collar to avoid mechanical disturbances to the
enclosed soil. Temperature above the soil surface was also measured.
3.2.4. Measurements of soil VOC exchange with the atmosphere.
Measurements of soil VOC exchange were conducted immediately after those of soil
CO2 fluxes. Air from the cuvette was pumped though a T system to a glass tube (11.5
cm long and 0.4 internal diameter) filled with VOC adsorbents Carbotrap C (300 mg),
Carbotrap B (200 mg), and Carbosieve S-III (125 mg) (Supelco, Bellefonte,
Pennsylvania) separated by plugs of quartz wool and treated as described by Llusià and
Peñuelas (2000).
The VOC flow from the soil chamber to the glass tube varied between 0.2 and
0.3 l min-1 depending on the adsorbent and quartz wool packing and model of pump
used. Soil VOCs were sampled for 5 min and the flow was regulated with a peristaltic
pump (Portable Escort Elf Pump, P/N 497701 S/N A2-31854; Mine Safety Appliances
Company, Pittsburg, Pennsylvania, USA). The flow adjustment was determined with a
bubble flowmeter. Glass tubes were stored in a portable fridge at 4ºC and taken to the
laboratory, where they were stored at -30 ºC until analysis (within 1 week). VOC
analyses were conducted in a GC-MS (Hewlett Packard HP59822B, Palo Alto,
California) as described by Peñuelas et al. (2005b).
From November 2004 to August 2005 soil VOCs were additionally sampled in
Tedlar bags in 9 PVC collars and analysed in laboratory using the PTR-MS technique as
described by Asensio et al. (2007b). We scanned all masses between 22 and 205 to
study seasonal variations. The PTR-MS system (PTR-MS-FTD hs; Ionicon Analitik,
Innsbruck, Austria) provides highly sensitive detection of the mass selected ions that are
characteristic of the molecules of interest. Both PTR-MS and its use in VOC analysis
have been described in detail in Lindinger et al. (1998) and Fall et al. (1999). The
protonated volatiles were detected in a quadrupole mass spectrometer. Since different

Chapter 3 Interannual monoterpene and VOC exchange rates in a Mediterranean shrubland
106
VOCs with the same mass cannot be separately measured, we combined PTR-MS with
GC-MS techniques to determine the different monoterpenes.
The PTR-MS drift tube was operated at 2.1 mbar and 40ºC, with a drift field of
600 V cm-1; the parent ion signal was maintained at ca. 3 x 10⁶ counts per second during
the measurements. We used the background values of all masses between 22 and 205 to
calculate the exchange balance for each compound.
Table 3.1. Physico-chemical soil properties of the studied soil in Garraf shrubland. (Data for soluble ammonium, nitrate and phosphate are from Sardans et al. 2006 and Sardans et al., 2007).
Soil Type Petrocalcic Calcixerept Soil texture % Sand 42.9 % Silt 38.7 % Clay 18.4 Mineral horizon (mean 0-15 cm) Mineral horizon bulk density (kg m-3) 0.00128 Carbon (%) 2.04 Nitrogen (%) 0.16 Carbon store (kg C m-2) 1.46 Nitrogen store (kg m-2) 0.24 Mean annual soil water content (% vol/vol) 18 Min (% wilting point) 5 Max (% field capacity) 26 Soluble ammonium NH4
+ (mg kg–1 soil) Summer 04 1.45 ± 0.13 Autumn 04 1.25 ± 0.07 Winter 04-05 1.45 ± 0.09 Spring 05 1.18 ± 0.37 Soluble nitrate NO3
- (mg kg-1 soil) Summer 04 13.57 ± 4.39 Autumn 04 10.33 ± 4.23 Winter 04-05 22.83 ± 2.54 Spring 05 9.10 ± 0.87 Olsen-Pi (mg g-1 soil) Summer 04 2.81 ± 0.25 Autumn 04 2.40 ± 0.28 Winter 04-05 1.90 ± 0.50 Spring 05 4.17 ± 0.64

Chapter 3 Interannual monoterpene and VOC exchange rates in a Mediterranean shrubland
107
3.2.5. Statistical analyses
Repeated measures analyses of variance (ANOVA) were conducted with soil CO2
fluxes, soil moisture and temperature as dependent variables. Repeated measures
ANOVAs were also conducted for the exchange rate of every mass measured with the
PTR-MS as dependent variable. Regression analyses were conducted to explore the
relationships of the exchange rates of monoterpenes and of every mass measured with
the PTR-MS with soil CO2 fluxes, soil moisture and temperature. All analyses were
performed with STATVIEW 5.01 software package (Abacus Concepts Inc.).
3.3. Results
3.3.1. Soil temperature, moisture and soil CO2 flux. Interannual and seasonal
variations.
Total rainfall in the first annual sampling period (from May 2003 to January 2004) was
495.4 mm while total rainfall in the second annual sampling period (from November
2004 to August 2005) was 248.2 mm (Fig. 3.1). While the first annual sampling period
was significantly wetter than the second (soil moisture 19.01 ± 1.53 vs 12.78 ± 1.01 %;
P <0.005; Fig. 3.1), the mean soil temperatures in each period were not significantly
different (soil temperature: 18.9 ± 1.3 vs 17.9 ± 1.3 ºC; Fig. 3.1). Soil CO2 flux mean
value did not differ significantly between the first and the second sampling periods
(0.98 ± 0.11 vs 0.95 ± 0.07 μmol m-2 s-1, Fig. 3.1).
Soil temperature, moisture and soil CO2 flux showed seasonal changes
throughout the years (overall season effect P <0.0001, Fig. 3.1). Soil respiration
increased in the wet seasons, spring and autumn, for both sampling periods (Fig. 3.1).
During the first sampling period the highest soil temperature and the lowest soil
moisture coincided in summer (August 2003, 30ºC and 8%, Fig. 3.1). During the second
sampling period the highest soil temperature values were measured in spring and
summer (May and August 2005, 26ºC and 24ºC respectively, Fig. 3.1). The lowest soil
moisture values for this period were measured in winter (anomalously dry) and summer
(February and August 2005, 9% and 10% respectively, Fig. 3.1).
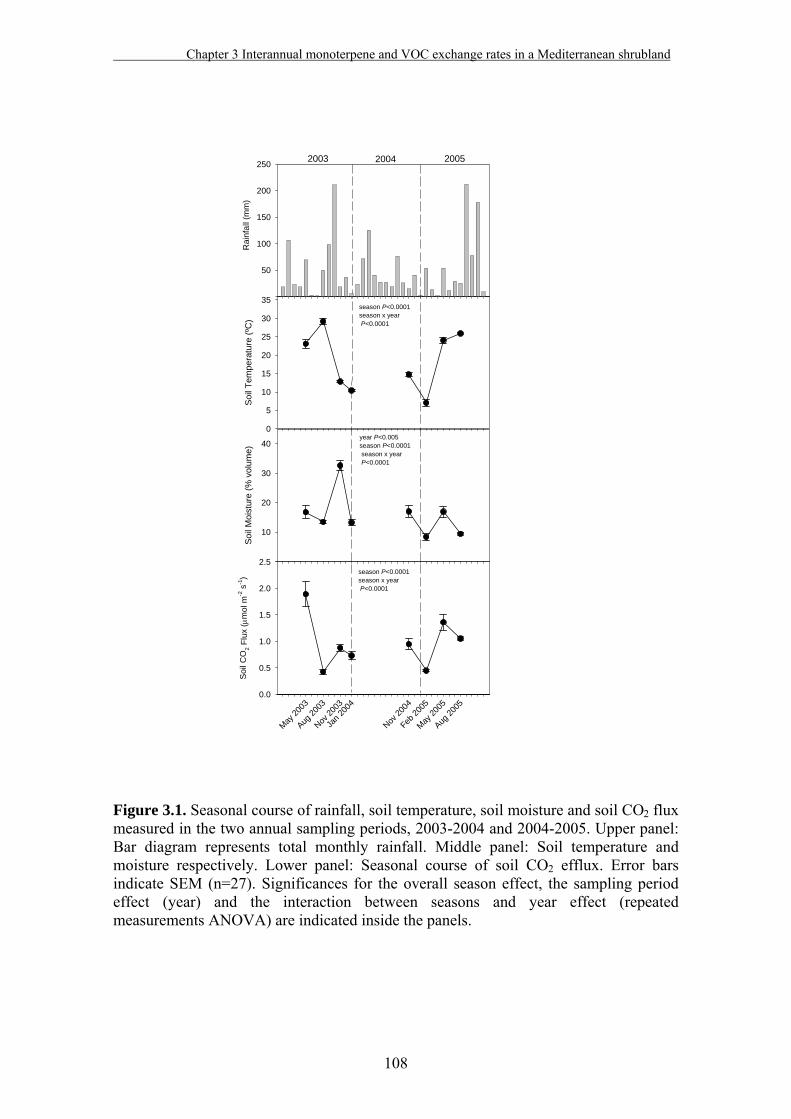
Chapter 3 Interannual monoterpene and VOC exchange rates in a Mediterranean shrubland
108
Figure 3.1. Seasonal course of rainfall, soil temperature, soil moisture and soil CO2 flux measured in the two annual sampling periods, 2003-2004 and 2004-2005. Upper panel: Bar diagram represents total monthly rainfall. Middle panel: Soil temperature and moisture respectively. Lower panel: Seasonal course of soil CO2 efflux. Error bars indicate SEM (n=27). Significances for the overall season effect, the sampling period effect (year) and the interaction between seasons and year effect (repeated measurements ANOVA) are indicated inside the panels.
May 20
03
Aug 20
03
Nov 20
03
Jan 2
004
Nov 20
04
Feb 20
05
May 20
05
Aug 20
05
Soil
CO
2 Flu
x (μ
mol
m-2
s-1
)
0.0
0.5
1.0
1.5
2.0
2.5
Soi
l Tem
pera
ture
(ºC
)
0
5
10
15
20
25
30
35
Soi
l Moi
stur
e (%
vol
ume)
10
20
30
40
season P<0.0001season x year P<0.0001
year P<0.005season P<0.0001 season x year P<0.0001
season P<0.0001season x year P<0.0001
Rai
nfal
l (m
m)
50
100
150
200
250 2003 2004 2005

Chapter 3 Interannual monoterpene and VOC exchange rates in a Mediterranean shrubland
109
3.3.2. Soil monoterpene exchange rates. Interannual and seasonal variations.
Total monoterpene exchange rates measured during the study years were very small and
ranged from uptake to net emissions (from –0.003 ± 0.001 nmol m-2 s-1 to 0.003 ± 0.002
nmol m-2 s-1, Fig. 3.2). Alpha–pinene and limonene were the most common
monoterpenes detected with the highest exchange rates (Fig. 3.2) followed by camphene
(Table 3.2). Beta-pinene, β-myrcene and Δ3-carene were also detected in some seasons
although with very low exchange rates (Table 3.2).
There were emissions of total monoterpenes, α–pinene and limonene only in the
second, dry sampling period; in the first, wet period there was soil uptake of these
monoterpenes except for a slight emission of total monoterpenes in spring 2003 (Fig.
3.2).
Soil monoterpene seasonal changes were small in most cases and no significant
overall seasonal effect on total monoterpene or individual monoterpenes exchange rates
was found (Fig. 3.2). However, total monoterpenes and limonene exchange rates
increased their uptake rates from spring to winter, during the first sampling period
(2003-2004, Fig. 3.2). During the second sampling period 2004-2005, maximum total
monoterpene emission rates were recorded in autumn and summer (November 2004 and
August 2005, Fig. 3.2).
Table 3.2. Seasonal course of soil exchange rates (nmol m-2 s-1) of other detected monoterpenes during the sampling annual periods 2003-2004 and 2004-2005. Values are means ± SEM (n=27). Nd= non detected.
camphene β-pinene β-myrcene Δ3-carene
May 2003 0.0000079±0.000036 0.000171±0.000159 Nd Nd
Aug 2003 Nd 0.0000040±0.000004 Nd 0.00004±0.000034
Nov 2003 -0.000377±0.000164 -0.000092±0.000098 -0.000022±0.000150 0.000024±0.000060
Jan 2004 -0.000178±0.000125 -0.000030±0.000057 0.000119±0.000089 0.000015±0.000015
Nov 2004 0.000552±0.000386 0.000162±0.000179 0.0003±0.000409 0.000291±0.000226
Feb 2005 0.000129±0.000078 Nd Nd Nd
May 2005 0.000132±0.000132 0.000018±0.000018 Nd Nd
Aug 2005 0.001127±0.000595 Nd Nd Nd
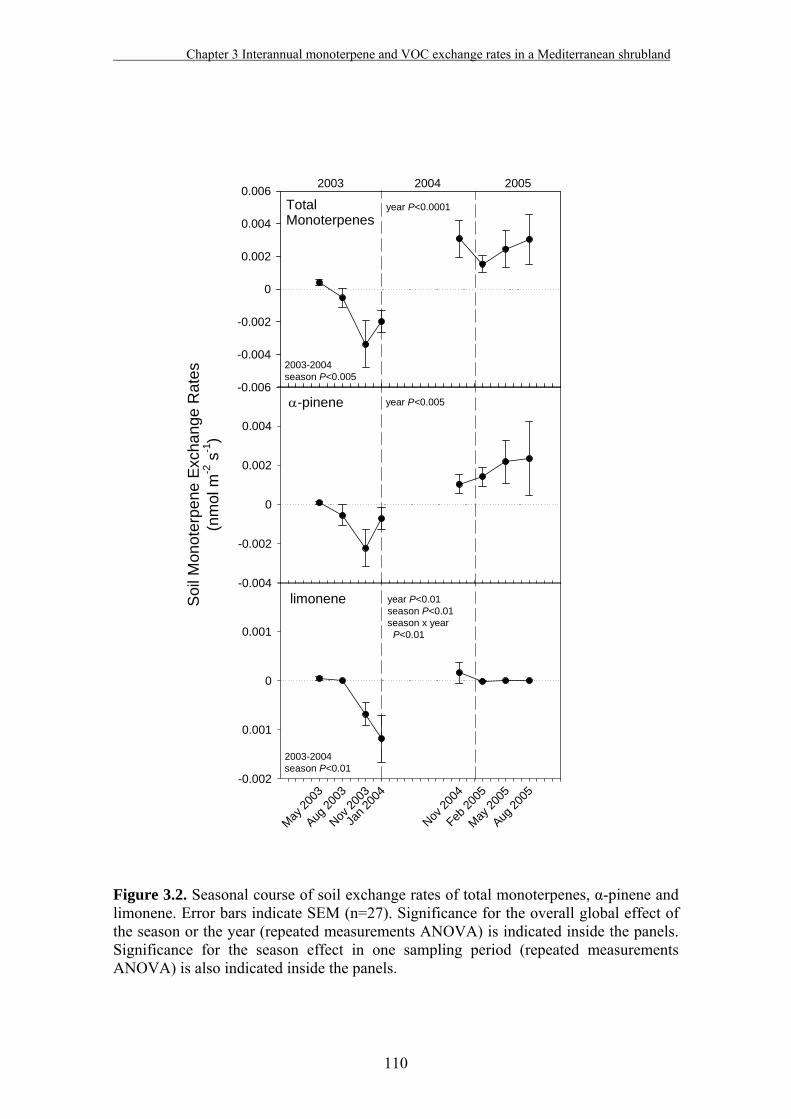
Chapter 3 Interannual monoterpene and VOC exchange rates in a Mediterranean shrubland
110
Figure 3.2. Seasonal course of soil exchange rates of total monoterpenes, α-pinene and limonene. Error bars indicate SEM (n=27). Significance for the overall global effect of the season or the year (repeated measurements ANOVA) is indicated inside the panels. Significance for the season effect in one sampling period (repeated measurements ANOVA) is also indicated inside the panels.
-0.006
-0.004
-0.002
0
0.002
0.004
0.006year P<0.0001
α-pinene
Soi
l Mon
oter
pene
Exc
hang
e R
ates
(nm
ol m
-2 s
-1)
-0.004
-0.002
0
0.002
0.004
Total Monoterpenes
May 20
03
Aug 20
03
Nov 20
03
Jan 2
004
Nov 20
04
Feb 20
05
May 20
05
Aug 20
05-0.002
0.001
0
0.001
limonene
year P<0.005
year P<0.01season P<0.01season x year P<0.01
2003 2004 2005
2003-2004season P<0.01
2003-2004season P<0.005

Chapter 3 Interannual monoterpene and VOC exchange rates in a Mediterranean shrubland
111
3.3.3. Other VOCs’ exchange rates.
Background air concentration for all identified masses (analysed with the PTR-MS
technique during the 2004-2005 sampling period) with a significant exchange rate
response to seasonal changes are shown in Table 3.3. Among all the identified masses,
maximum soil emission rates ranged from 0.23 nmol m-2 s-1 to 2.5 nmol m-2 s-1. These
maximum soil emission rates were measured in compounds such as M33 (methanol),
M45 (acetaldehyde) and M43 (acetic acid) shown in figure 3.3 and M73 (C3 and C4
carboniles), M59 (acetone) and M61 (acetic acid) shown in figure 3.4. M137
(monoterpenes and sesquiterpenes), M57 ((E)-2-hexenal), M31 (formaldehyde) and
M97 (heptanal) and M99 (hexenol) emission rates were lower, ranging from 0.01 to
0.04 nmol m-2 s-1 (Figs. 3.3-3.4). Even lower emissions rates were measured in other
compounds like M123 (sesquiterpenes), M139 (C13 unsaturated alcohols) and M155
(linalool) (Fig. 3.3) or M127 (6-methyl-5-hepten-2-one), M199 (C13 unsaturated
alcohols) and M143 (hexenyl acetates) (Fig. 3.4). Their maximum emission rates
reached up to 0.005 nmol m-2 s-1. Maximum soil VOC uptake rates measured, among
the identified masses, ranged from -0.002 nmol m-2 s-1 to –0.1 nmol m-2 s-1 in VOCs
such as M33 (methanol), M45 (acetaldehyde) and M43 (acetic acid) (Fig. 3.3) and M59
(acetone) (Fig. 3.4).

Chapter 3 Interannual monoterpene and VOC exchange rates in a Mediterranean shrubland
112
Figure 3.3. Soil VOC exchange rates detected during the 2004-2005 sampling period using PTR-MS technique that presented maximum exchange rates in spring.. Error bars indicate ± standard error of the mean (n=9). Significances for the overall season effect (repeated measurements ANOVA) are indicated inside the panels. The most likely VOC corresponding to each mass based on standard calibrations of the PTR-MS system and on the literature is indicated in brackets.
-1
0
1
2
3
4
5M33
0
0.2
0.4
0.6
0.8
1M45
-0.1
0
0.1
0.2
0.3
0.4
0.5
0.6M43
0
0.01
0.02
0.03
0.04
0.05
0.06M137
-0.05
0
0.05
0.1
0.15
0.2M57
-0.05
0
0.05
0.1M31
-0.02
-0.01
0
0.01
0.02
0.03
0.04
0.05M97
-0.015
-0.01
-0.005
0
0.005
0.01
0.015
0.02M91
-0.015
-0.01
-0.005
0
0.005
0.01
0.015
0.02M35
-0.005
0
0.005
0.01M123
-0.005
0
0.005
0.01M139
-0.004
-0.002
0
0.002
0.004 M155
(acetic acidethyl acetate2,3-butanedione)
(fosfine)
season P<0.01
season P=0.01
season P<0.01
season P<0.05
(formaldehyde)
(acetaldehyde)
season P=0.05
((E)-2-hexenal)
season P<0.05
(heptanal2e,4e-hexadienal)
(PPN)
season P<0.005
(sesquiterpenes)
season P=0.05
season P<0.005
(linalool1,8-cineole)
(C13 unsaturated alcohols)
season P<0.001
(monoterpenessesquiterpenes)
season P=0.05season P<0.0005
Nov
200
4
Feb
2005
May
200
5
Aug
2005
Nov
200
4
Feb
2005
May
200
5
Aug
200
5
(methanol)
Soil
VOC
Exc
hang
e R
ates
(nm
ol m
-2 s
-1)

Chapter 3 Interannual monoterpene and VOC exchange rates in a Mediterranean shrubland
113
Figure 3.4. Soil VOC exchange rates detected during the 2004-2005 sampling period using PTR-MS technique that presented maximum exchange rates in summer. Error bars indicate ± standard error of the mean (n=9). Significances for the overall season effect (repeated measurements ANOVA) are indicated inside the panels. The most likely VOC corresponding to each mass based on standard calibrations of the PTR-MS system and on the literature is indicated in brackets.
0
0.1
0.2
0.3
0.4
0.5M73
-0.2
0
0.2
0.4
0.6M59
-0.2
0
0.2
0.4
0.6M61
-0.01
0
0.01
0.02
0.03
0.04
0.05M99
-0.02
-0.01
0
0.01
0.02
0.03
0.04M101
0
0.005
0.01M127
-0.004
-0.002
0
0.002
0.004 M199
-0.005
0
0.005
0.01M143
(acetone)
season P<0.1
(C3 and C4 carbonilesMECMEKbutanone)
season P<0.005
season P<0.05
(acetic acidethyl acetate2,3-butanedione)
(hexenol (27%))
season P=0.01
(hexenal)
season P<0.05
(6-methyl-5-hepten-2-one)
(hexenyl acetatesC9 unsaturated alcohols)
season P=0.01
season P=0.005
(C13 unsaturated alcohols)
season P<0.0005
Nov
200
4
Feb
2005
May
200
5
Aug
200
5
Nov
200
4
Feb
2005
May
200
5
Aug
2005
Soil
VOC
Exc
hang
e R
ates
(nm
ol m
-2 s
-1)
Chapter 3 Interannual monoterpene and VOC exchange rates in a Mediterranean shrubland
114
3.3.4. Relationships between soil VOC exchange rates and soil temperature, moisture or
soil CO2 flux.
The relationships between total and individual monoterpene exchange rates as
dependent variables and soil moisture, temperature and soil CO2 flux as independent
variables are plotted in Figure 3.5. Total monoterpene, α-pinene and limonene exchange
rates were poorly or not correlated with soil moisture, temperature and CO2 flux, as
shown by the scatterplots (Fig 3.5).
Total monoterpene and α-pinene emission rates decreased significantly in
response to increases in soil moisture, although the coefficients of determination were
low (R2=0.08; P<0.05 and R2=0.13; P<0.005 respectively, Fig. 3.5). The scatterplots of
total and individual monoterpenes’ correlations with soil temperature showed hardly
any significant correlation. The average of total monoterpene and α-pinene exchange
rates in the first set, grouped from 5ºC to 18ºC, were significantly lower than the
respective averages measured from the second set, from 20ºC to 33ºC (P<0.1 and
P<0.05 for total monoterpene and α-pinene respectively, Fig. 3.5). In this study no
significant correlations or clear trends were found in the relationships between
monoterpene exchange rates and soil CO2 flux (Fig. 3.5). Neither were they when the
whole data was separated into the two different sampling periods, 2003-2004 and 2004-
2005.
However, significant and positive correlations were found between other soil
VOCs’ exchange rates and soil moisture (correlations not shown). Compounds in figure
3.3 presented these relationships. All these VOCs’ emission rates increased
considerably in spring, when soil moisture was high (May 2005, Fig. 3.1). However,
they did not increase in the other rainy season, autumn 2004. Thus the correlations
found with soil moisture were quite low (R2 up to 0.24). Other VOCs’ exchange rates
showed higher positive correlation with soil temperature than with soil moisture, with a
common trend to increase their emission rates when soil temperature increased in
summer (Figure 3.4). We found a better fit between VOC exchange rates and soil
temperature than for soil moisture (R2 up to 0.40). The majority of the masses which
showed a significant correlation with soil CO2 fluxes tended to increase their emission
rates when soil CO2 flux increased e. g. M45 (acetaldehyde), M137 (monoterpenes and
sesquiterpenes) and other VOCs in figure 3.6. Yet the correlations found, when
significant, again showed low R2 values (up to 0.30).

Chapter 3 Interannual monoterpene and VOC exchange rates in a Mediterranean shrubland
115
Figure 3.5. Relationships of total monoterpene and α-pinene exchange rates with soil moisture, temperature and CO2 flux measured during the complete study period 2003-2005.
3.4. Discussion
3.4.1. Soil VOC exchange rates in a Mediterranean shrubland
The monoterpenes α-pinene and limonene, along with monoterpenes shown in Table
3.2, have also been detected in other studies of soil VOC exchange in a Mediterranean
holm oak forest soil (Asensio et al., 2007b) and in a non Mediterranean sitka spruce
forest soil (Hayward et al., 2001). As we removed the litter layer, the principal source of
these terpenoids emitted by soil is likely to be the root system of plants. We were not
able to directly identify the origin of the detected compounds since our VOC sampling
method includes all living organisms in soil. However, Pinus halepensis is abundant at
this site and the finding of high amounts of α-pinene, limonene, β-pinene and camphene
in Pinus root emissions and content (Lin et al., 2007) indicates that roots are the likely
source of these monoterpenes.
Tota
l Mon
oter
pene
Exc
hang
e R
ates
(nm
ol m
-2 s-1
)
-0.010
-0.005
0.000
0.005
0.010
0.015
0.020y=-0.0001x + 0.0025R2= 0.08; P<0.05
Soil Moisture (% volume)
0 5 10 15 20 25 30 35 40
α-p
inen
eEx
chan
ge R
ates
(nm
ol m
-2 s-1
)
-0.010
-0.005
0.000
0.005
0.010
Soil Temperature (ºC)
5 10 15 20 25 30
Soil CO2 flux (μmol m-2 s-1)
0 0.5 1.0 1.5 2.0 2.5 3.0 3.5
y=-0.0001x + 0.0022R2= 0.13; P<0.005

Chapter 3 Interannual monoterpene and VOC exchange rates in a Mediterranean shrubland
116
Figure 3.6. Examples of the relationships found between some identified VOC exchange rates and soil CO2 flux during the 2004-2005 sampling period. The most likely VOC corresponding to each mass based on standard calibrations of the PTR-MS system and on the literature is indicated in brackets.
M45
-0.5
0.0
0.5
1.0
1.5
2.0
2.5(acetaldehyde)y=0.4345x - 0.1561R2=0.13; P<0.05
M57
-0.1
0.0
0.1
0.2
0.3
0.4
0.5((E)-2-hexenal)y=0.0836x - 0.0123R2=0.12; P<0.05
M137
Soi
l VO
C E
xcha
nge
Rat
es(n
mol
m-2
s-1)
-0.02
0.00
0.02
0.04
0.06
0.08(monoterpenessesquiterpenes)y=0.0281x - 0.0126R2=0.24; P<0.005
Soil CO2 flux (μmol m-2 s-1)
0.2 0.4 0.6 0.8 1.0 1.2 1.4 1.6 1.8-0.008-0.006-0.004-0.0020.0000.0020.0040.0060.008 M114y=0.0037x - 0.0033
R2=0.29; P<0.005
-0.010
-0.005
0.000
0.005
0.010
0.015M139(C10 aldehydes)
y=0.0055x - 0.0043R2=0.25; P<0.005

Chapter 3 Interannual monoterpene and VOC exchange rates in a Mediterranean shrubland
117
Since our sampling method did not damage the roots, belowground parts of the plants
are probably affecting the total soil terpene emission rates through the production and
release of terpenes to the rhizosphere by living roots or decomposing plant material.
In accordance with Asensio et al. (2007b), our results show that soil
monoterpene emission rates in general are very low compared with monoterpene
emissions from leaves. For example, Peñuelas and Llusià (1999) reported values of
about 18 nmol m-2 s-1 from Pinus halepensis leaves in summer. So soil monoterpene
emissions may represent a small part of the total monoterpene fluxes emitted to the
atmosphere by a vegetated land surface. Maximum soil monoterpene emission rates
reported in this study were similar to those maximum emission rates reported by
Asensio et al. (2007b) in a Mediterranean holm oak soil forest (0.003 nmol m-2 s-1 and
0.004 nmol m-2 s-1, respectively). We expected to find higher monoterpene emissions in
this shrubland soil than in the holm oak forest soil, due to the previously mentioned
presence of Pinus halepensis, a terpene storing tree with high monoterpene content in
their roots and leaves (Llusià and Peñuelas, 1998, 2000; Lin et al. 2007). In contrast, the
holm oak is a non terpene-storing species with lower monoterpene content in its leaves
(Llusià and Peñuelas, 1998; 2000). As far as we know, there are no published works on
holm oak monoterpene root content but, as with leaf content, it is likely to be lower than
monoterpene content in Pinus roots. Therefore these results indicate that soil
monoterpene emissions to the atmosphere are not one of the most important fates for
soil monoterpenes. Monoterpenes might be stored in the soil mineral layers more than
emitted to the atmosphere. However, so far there are few studies on soil’s monoterpenes
content (White, 1994; Smolander; 2006, Lin et al 2007) so research into terpene content
in different soil layers is still needed.
Soil monoterpene uptake in this shrubland was lower than monoterpene uptake
measured in the holm oak forest soil (–0.003 m-2 s-1 and -0.01 nmol, respectively). This
difference is possibly due to differences in the physical soil features or in the soil
microorganisms’ biodegradation of terpenes, since soil VOC uptake activity is
occurring by physical adsorption of VOCs by soil components (Pignatello and Xing,
1996) or by biodegradation by soil microorganisms (Van Roon et al., 2005b). In fact,
soil enzyme activity and soil CO2 flux, which are good indicators of microorganisms’
activity in soils (Hanson et al., 2000; Baum et al., 2003; Nannipieri et al., 2003) were
also lower in this shrubland soil than in the holm oak forest soil (Sardans and Peñuelas,
2005; Sardans et al, 2006; Asensio et al., 2007b).

Chapter 3 Interannual monoterpene and VOC exchange rates in a Mediterranean shrubland
118
Except for mass 33 (methanol, Fig. 3.3), the other volatile compounds emission
rates measured with the PTR-MS technique, were in the range or slightly higher than
those reported in a holm oak forest soil by Asensio et al. (2007b) (maximum emission
rates up to 0.6 nmol m-2 s-1 in this shrubland and up to 0.3 nmol m-2 s-1 in the holm oak
forest). These results show again that soil VOC emission rates in general are very low,
except for methanol. Methanol emission rates were much higher than other VOCs’
emission rates measured in the holm oak soil forest and in this shrubland (maximum
methanol emission rates 2.5 nmol m-2 s-1, Fig. 3.3). Large methanol soil emissions
(maximum about 4.6 nmol m-2 s-1) have been reported above a bare agricultural field by
Schade and Custer (2004). These authors suggest a methanol source at the soil surface
and that its production is probably linked to a physico-chemical degradation process of
soil organic matter. Since we removed the litter layer, the source of soil methanol
emissions in this study should be in the soil.
Monoterpene and sesquiterpene (M137) emission rates measured in spring (May
2005; Fig. 3.3), using PTR-MS technique, were approximately ten times higher than the
monoterpene emission rates measured using GC-MS technique (Fig. 3.2 and 3.3). The
higher abundance of mass 137 might indicate the presence of high sesquiterpene
amounts released by roots. In fact, sesquiterpenes are one of the most abundant
compounds in Pinus roots (Lin et al., 2007). The sum of all masses documented in
literature as sesquiterpenes or sesquiterpene fragments (M109, M123, M149 and M205)
clearly reflected the same emission pattern as mass 137, but the sum of these masses
only doubled the mass 137 in spring 2005, indicating that there must be other sources
contributing to the high mass 137 values of that spring sampling.
Our results showed maximum soil uptake rates ranging from –0.1 nmol m-2 s-1 to
–0.5 nmol m-2 s-1 in some compounds like M33 (methanol, Fig. 3.3), M42 (acetonitrile),
M46, M59 (acetone), M88 and M89 (ethyl acetate) (not shown). These values are
comparable to foliar uptake rates reported by other authors (ranging from –0.4 nmol m-2
s-1 to –3 nmol m-2 s-1) for some compounds like MIBK (methyl isobutyl ketone) (Tani et
al., 2007), monoterpenes (Copolovici et al., 2005) or M31 (formaldehyde) (Filella et al.,
2006). However, there is still insufficient knowledge about the soil VOC sink strength
to evaluate whether it could be small but non-negligible on a global scale. Soil VOC
and other soil gas uptake fluxes have been described (Chang et al., 2002; Pegoraro et
al., 2006; Asensio et al, 2007a, b; Chapuis-Lardy et al., 2007) but they have received
little attention due to the relatively low uptake rates and the quite high uncertainties

Chapter 3 Interannual monoterpene and VOC exchange rates in a Mediterranean shrubland
119
around soil VOC exchange processes. Soil VOC uptake rate depends on the air
concentration and on the soil concentration resulting from the balance between soil
VOC production and consumption (Pignatello and Xing, 1996), which may vary with
the soil type and plants’ species-specific variation of VOC content.
3.4.2 Interannual variation and seasonality of soil VOC exchange rates and
relationships with soil temperature, moisture and CO2 flux.
Results indicate that a severe drought period increases soil monoterpene emission rates
in this Mediterranean shrubland (Fig. 3.2). Even though monoterpene exchange rates
were very low, there were highly significant differences between the exchange rates
measured in the two years of contrasting precipitation. This may be the result of lower
uptake rates due to lower physiological activity during the drier sampling period 2004-
2005. However, the fact that monoterpene exchange rates and soil CO2 fluxes were not
significantly correlated (Fig. 3.5) and that soil CO2 fluxes did not decrease significantly
during the dry year 2004-2005 (Fig. 3.1) suggest that the increase in soil monoterpene
emission rates in response to lower soil water availability could be due to changes in
soil physical properties induced by low soil moisture, rather than to a lower
physiological activity of roots and microorganisms.
Seasonal changes in total monoterpene, α-pinene and limonene were smaller
than interannual changes and the exchange rates measured were highly variable in some
seasons (Fig. 3.2). Total and individual monoterpene exchange rates did not show
overall significant seasonal effects in the second, dry sampling period, although there
were significant seasonal changes in soil moisture and temperature (Fig. 3.1). These
results, in addition to the very low, though significant, negative correlations found
between monoterpene exchange rates and soil moisture (Fig. 3.5), suggest that
monoterpene exchange rates are less affected by seasonal soil moisture changes than by
long-term severe changes.
Results show that high soil temperatures increase soil monoterpene emission
rates. This accords with Asensio et al. (2007b) results and it is possibly due to the
higher volatilisation rates of volatile compounds in response to increases in temperature
(Van Roon et al., 2005a). Our results suggest that seasonal changes in soil temperature
could have strong effects on monoterpene exchange rates, since monoterpene emissions
were recorded mainly during the warm seasons (spring and summer) and most
monoterpene uptake was recorded during the cold seasons (autumn and winter) as

Chapter 3 Interannual monoterpene and VOC exchange rates in a Mediterranean shrubland
120
shown in figure 3.5. The mean value of the monoterpene exchange rates measured from
20ºC to 33ºC, was positive and significantly higher than the exchange rate mean value
calculated for the colder soil temperature range (Fig. 3.5).
There were significant seasonal variations in other VOCs’ exchange rates (Fig.
3.3 and Fig. 3.4) together with changes in soil temperature, moisture and soil CO2 flux
variations (Fig. 3.1). Soil moisture effect on soil VOC exchange rates depends on the
compound type, although results suggest that high soil moisture tended to increase soil
VOC emissions, at least in those compounds which showed significant seasonal
changes in their exchange rates (Figs. 3.3 and 3.4). The positive correlations found
between several soil VOC exchange rates and soil moisture provides evidence of this
trend. However, the correlations were not strong because soil moisture effects on VOC
exchange rates were constrained by low soil temperatures; for example, in autumn
(November 2004, Fig. 3.1). Similarly, we found positive correlations between soil VOC
exchange rates and soil CO2 flux (Fig. 3.6) suggesting that phenology of plants and soil
microorganisms are also affecting VOC exchange rates. Soil CO2 flux is considered to
be a good indicator of the roots’ and microorganisms’ physiological activity (Hanson et
al., 2000). Thus, the increase of soil VOC emission rates in this Mediterranean
shrubland in spring (Figs. 3.3 and 3.4) might be linked to the increase of root and
microorganism activities in spring and autumn; for example the root-surface and soil
phosphatase activities (Sardans et al., 2006; Sardans et al., 2007) in parallel with the
increase of soil-available P in spring (Table 3.1). The decrease in available ammonium
and nitrate in soil during spring and autumn (Table 3.1) corresponded to the plant
growing seasons and it could be also related to the increase in soil VOC emission rates
during spring.
Because maximum emission rates always occurred in spring or summer, when
the soil temperature was high, we found significant positive correlations between
several VOC exchange rates and soil temperature (not shown). Thus, results indicate
again seasonal soil temperature controls on several soil VOCs’ exchange, increasing
soil VOC emission rates when soil temperature increased.

Chapter 3 Interannual monoterpene and VOC exchange rates in a Mediterranean shrubland
121
Table 3.3. Air concentrations of masses of volatile organic compounds in ppbv (1 ppbv = 1 part in 109 by volume) detected by PTR-MS during the 2004-2005 sampling period in Garraf. Only those masses that were identified and that were significantly affected by season or treatment are shown. Data are means ± SEM; n=27. The most likely VOC corresponding to each mass based on standard calculations of the PTR-MS system and literature is indicated in brackets. (MEK= Methyl Ethyl Ketone, PPN= Peroxy Propionic Nitrid anhydride)
Nov 2004 Feb 2005 May 2005 Aug 2005 M31 (formaldehyde) 5.24±0.40 3.19±0.24 5.37±0.49 8.58±0.36 M33 (methanol) 222.55±4.34 179.92±0.31 231.80±7.32 77.85±9.83 M35 (phosphine) ) 0.52±0.06 0.52±0.07 0.81±0.05 0.18±0.05 M43 (acetic acid, ehtyl acetate, 2-3 butanedine) 12.24±1.18 13.68±0.24 18.24±0.30 27.03±2.88 M45 (acetaldehyde) 9.11±1.14 5.09±0.85 18.49±2.36 19.94±3.13 M57 ((E)-2-hexenal 2.98±0.16 2.86±0.18 13.08±1.22 9.44±0.99 M59 (acetone) 7.92±0.21 4.66±0.38 24.45±9.43 21.30±2.93 M61 (acetic acid) 4.59±0.30 2.96±0.41 10.08±0.13 23.58±2.54 M73 (methyl ehtyl cetona, butanona, MEK) 0.99±0.16 0.82±0.13 3.30±0.02 4.26±0.38 M91 (PPN) 1.37±0.03 0.09±0.02 0.74±0.10 0.45±0.06 M97 (heptanal, 2e-4e-hexadienal) 0.43±0.03 0.50±0.12 1.76±0.10 1.96±0.37 M99 (hexenol) 0.14±0.02 0.18±0.01 0.80±0.06 0.97±0.15 M101 (hexenal) 0.15±0.01 0.15±0.04 0.94±0.04 1.19±0.09 M114 0.01±0.09 0.09±0.03 0.10±0.02 0.13±0.01 M123 (sesquiterpenes) 0.04±0.00 0.06±0.02 0.25±0.02 0.19±0.05 M127 (C9 aldehydes) 0.07±0.02 0.03±0.03 0.38±0.04 0.31±0.07 M137 (monoterpenes, sesquiterpenes) 0.14±0.02 0.21±0.05 0.48±0.03 0.62±0.29 M139 (C10 aldehydes) 0.01±0.01 0.10±0.01 0.18±0.01 0.13±0.01 M143 (hexenyl acetates) 0.03±0.01 0.09±0.02 0.39±0.03 0.28±0.05 M155 (linalool, 1, 8-cineole) 0.02±0.01 0.02±0.01 0.12±0.02 0.16±0.06 M199 (C13 unsaturated alcohols) 0.00±0.00 0.05±0.02 0.13±0.00 0.07±0.06

Chapter 3 Interannual monoterpene and VOC exchange rates in a Mediterranean shrubland
122
3.5. Conclusions and final remarks
Soil VOC exchange rates measured in this Mediterranean shrubland are the result of the
synthesis and uptake of VOCs which are dependent on temperature, water availability,
phenology of plants and soil microorganisms, soil physical traits and concentration of
the compounds in the atmosphere near the soil. Alpha-pinene and limonene were the
most common identified soil exchanging monoterpenes. M33 (methanol), M43 (acetic
acid, ethyl acetate), M45 (acetaldehyde), M59 (acetone) and M73 (C3 and C4
carboniles) showed the highest emission rates among all the identified VOCs. Exudates
from rhizosphere activities, roots VOC production and organic matter decomposition by
microorganisms in the soil organic or mineral horizons may be the most important
sources of these VOCs.
Soil monoterpene and in general soil VOC emissions, except mass 33
(methanol) were very low compared with foliar VOC emission rates. However, some
soil VOC uptake rates were comparable with those reported for leaves. These VOCs
might be consumed by soil microorganisms or stored in the soil layers. Further studies
are needed to corroborate these results and to investigate the possible importance of the
soil VOC sink in chemistry-climate models.
Results suggest that severe long-term drought increases soil monoterpene
emission rates in this Mediterranean shrubland. The increase in soil monoterpene
emissions in response to lower soil water availability is probably linked to changes in
soil physical properties induced by low soil moisture in this Mediterranean shrubland,
since monoterpene exchange rates and soil CO2 fluxes were not significantly correlated.
Conversely, other soil VOCs increased their emission rates when soil moisture
increased, although the effects were constrained by soil temperature, for example in the
cold seasons. Most of these compounds’ exchange rates showed significant correlations
with CO2 flux, suggesting that the increase of root and microbial activities during the
growing seasons may increase these soil VOC exchange rates.
High soil temperatures increased emission rates of monoterpenes and other
VOCs possibly due to higher volatilisation rates. Results suggest a strong seasonal
control of soil temperature on monoterpene exchange rates.
The effect of soil moisture reduction on soil VOC exchange rates is still poorly
understood because several factors are probably affecting in soil VOC exchange rates.
Improved knowledge of the multiple interactions between rhizosphere components, and

Chapter 3 Interannual monoterpene and VOC exchange rates in a Mediterranean shrubland
123
of soil emission and uptake processes in general, will help to disentangle the effects on
soil VOC exchange with the atmosphere resulting from the decrease in water
availability projected for the next decades by climatic (IPCC, 2007) and
ecophysiological models such as GOTILWA (Sabaté et al. 2002; Peñuelas et al. 2005a).
Acknowledgements
This research was supported by Spanish MEC grants CGL2004-01402/BOS and
CGL2006-04025/BOS.. We also gratefully acknowledge partial funding by the ISONET
European Commission contract MC-RTN-CT-2003-504720, the European Commission
contract ALARM 506675, the European project NITROEUROPE GOCE017841 and
Fundación BBVA 2004 and Catalan Government SGR2005-003/12 grants.
References
Asensio, D., Peñuelas, J., Llusià, J. & Ogaya, R. 2007a. Seasonal soil VOC exchange rates in a Mediterranean holm oak forest and their responses to drought conditions. Atmospheric Environment 41, 2456-2466. Asensio, D., Peñuelas, J. & Llusià, J. 2007b. Interannual and interseasonal soil CO2 efflux and VOC exchange rates in a Mediterranean holm oak forest in response to experimental drought. Soil Biology and Biochemistry 39, 2471-2484. Atkinson, R. & Arey, J. 2003. Atmospheric degradation of volatile compounds. Chemical Reviews 103 (12), 4605-4638. Baum, C., Leinweber, P., & Schlichting, A. 2003. Effects of chemical conditions in rewetted peats temporal variation in microbial biomass and acid phosphatase activity within the growing season. Applied Soil Ecology 22, 167–174. Bender, M. & Conrad, R. 1993. Kinetics of methane oxidation in oxic soils. Chemosphere 26, 687-696. Chamberlain, K., Guerrieri, E., Pennacchio, F., Pettersson, J., Pickett, J.A., Poppy G.M., Powell, W., Wadhams, L.J. & Woodcok, C.M. 2001 Can aphid-induced plant signals be transmitted aerially and through the rhizosphere?. Biochemical Systematic and Ecology 29, 1063-1074. Chang, Y.Y., Bae, B., Lee, I. & Corapcioglu, M.Y. 2002. Modelling plant-aided in-situ bioremediation of soil contaminated with a volatile organic compound (VOC). Acta Biotechnologica 22 (1-2), 21-34.

Chapter 3 Interannual monoterpene and VOC exchange rates in a Mediterranean shrubland
124
Chapuis-Lardy, L., Wrage, N., Metay, A., Chottes, J. & Bernouxs, M. 2007. Soils, a sink for N2O? A review. Global Change Biology 13, 1-17.
Chen, F., Ro, D., Petri, J., Gershenzon, J., Bohlmann, J., Pichersky, E. & Tholl, D., 2004. Characterization of a root-specific Arabidopsis terpene synthase responsible for the formation of the volatile monoterpene 1,8-cineole. Plant Physiology 135, 1956-1966.
Chen, J.J. & Griffin, R.J. 2005. Modelling secondary organic aerosol formation from oxidation of alpha-pinene, beta-pinene and limonene. Atmospheric Environment 39, (40), 7791-7744. Cho, C., Sung, K., Coapcioglu, M.Y. & Drew, M. 2005. Influence of water content and plants on the dissipation of chlorinated volatile organic compounds in soil. Water, Air and Soil Pollution 167, 259-271. Copolovici, L., Filella, I., Llusià, J., Niinemets, U. & Peñuelas, J. 2005. The capacity for thermal protection of photosynthetic electron transport varies for different monoterpenes in Quercus ilex. Plant Physiology 139, 485-496. Emmett, B.A., Beier, C., Estiarte, M., Tietema, A., Kristensen, H.L., Williams, D., Peñuelas, J., Schmidt, I. & Sowerby, A., 2004. The response of soil processes to climate change: Results from manipulation studies of shrublands across an environmental gradient. Ecosystems 7, 625-637. Fall, R. 1999. Biogenic emissions of volatile organic compounds from higher plants. In: Reactive Hydrocarbons in the Atmosphere (ed. C.N. Hewitt), pp 41-96. San Diego. U. S. A. Fall, R., Karl, T., Hansel, A., Jordan, A. & Lindinger, W. 1999. Volatile organic compounds emitted after leaf wounding: on-line analysis by proton-transfer-reaction mass spectrometry. Journal of Geophysical Research 104, 15963–15974. Filella, I., Peñuelas, J. & Llusià, J., 2006. Dynamics of the enhanced emissions of monoterpenes and methyl salicylate, and decreased uptake of formaldehyde by Quercus ilex leaves after application of jasmonic acid. New Phytologist 169, 135-144. Fuentes, J.D., Wang, D., Neumann, H.H., Gillespie, T.J., den Hartog, G. & Dann, T.F., 1996. Ambient biogenic hydrocarbons and isoprene emissions from a mixed deciduous forest. Journal of Atmospheric Chemistry 25, 67-95. Fuentes, J.D., Lerdau, M., Atkinson, R., Baldocchi, D., Bottenheim, J.W., Ciccioli, P., Lamb, B., Geron, C., Gu, L., Guenther, A., Sharkey, T.D. & Stockwell, W. 2000. Biogenic hydrocarbons in the atmospheric boundary layer: A review. Bulletin of the American an Meteorological Society 81 (7), 1537-1575.

Chapter 3 Interannual monoterpene and VOC exchange rates in a Mediterranean shrubland
125
Gershenzon, J. 1994. Metabolic costs of terpenoid accumulation in higher plants. Journal of Chemical Ecology 20 (6), 1281-1328. Guenther, A., Zimmerman, P. & Wildermuth, M. 1994. Natural volatile organic compound emission rate estimates for U. S. woodland landscapes. Atmospheric Environment 28, 1197-1210. Guenther, A., Hewitt, C.N., Erickson, D., Fall, R., Geron, C., Graedel, T., Harley, P., Klinger, L., Lerdau, M., McKay, W.A., Pierce, T., Scholes, B., Steinbrecher, R., Tallamraju, R., Taylor, J. & Zimmerman, P. 1995. A global model of natural volatile organic compound emissions. Journal of Geophysical Research 100, 8873-8892. Guenther, A. 1999. Modeling biogenic organic compounds emissions to the atmosphere. In: Reactive Hydrocarbons in the Atmosphere. (ed C.N. Hewitt) pp. 98-116. San Diego. U. S. A. Hanson, P.J., Edwards, N.T., Garten, C.T. & Andrews, J.A. 2000. Separating root and soil microbial contributions to soil respiration: a review of methods and observations. Biogeochemistry 48, 115-146. Hayward, S., Muncey, R.J., James, A.E., Halsall, C.J. & Hewitt, C.N. 2001. Monoterpene emissions from soil in a Sitka spruce forest. Atmospheric Environment 35, 4081-4087. Heiden, A.C., Kobel, K., Langebartels, C., Schuch-Thomas, G. & Wildt, J. 2003. Emissions of oxygenated volatile organic compounds from plants—part I: emissions from lipooxygenase activity. Journal of Atmospheric Chemistry 45 (2), 143-172. IPCC 2007: Climate Change 2007: The Physical Science Basis. Contribution of Working Group I to the Fourth Assessment Report of the Intergovernmental Panel on Climate Change [Solomon, S., D. Qin, M. Manning, Z. Chen, M. Marquis, K.B. Averyt, M. Tignor and H.L. Miller (eds.)]. Cambridge University Press, Cambridge, United Kingdom and New York, NY, USA, 996 pp. Janson, R.W. 1993. Monoterpene emissions from Scots pine and Norwegian spruce. Journal of Geophysical Research Atmosphere 98 (D2), 2839-2850. Lamb, B., Guenther, A., Gay, D. & Westberg, H. 1987. A national inventory of biogenic hydrocarbon emissions. Atmospheric environment 21 (8), 1695-1705. Lin, C., Owen, S., Peñuelas, J. 2007. Volatile organic compounds in the rizhosphere of Pinus spp. Soil Biology and Biochemistry 39, 951-960. Lindinger, W., Hansel, A. & Jordan, A. 1998 On-line monitoring of volatile organic compounds at pptv level by means of proton-transfer-reaction mass spectrometry (PTR-MS). International Journal of Mass Spectrometry Ion Processes 173, 191-241. Lerdau, M., Matson, P., Fall, R. & Monson, R. 1995. Ecological controls over monoterpene emissions from Douglas-fir (Pseudotsuga-Menziesii). Ecology 76 (8), 2640-2647.
Chapter 3 Interannual monoterpene and VOC exchange rates in a Mediterranean shrubland
126
Llusià, J., Peñuelas, J. 1998. Changes in terpene content and emission in potted Mediterranean woody plants under severe drought. Canadian Journal of Botany 76, 1366-1373. Llusià, J., Peñuelas, J., 2000. Seasonal patterns of terpene content and emission from seven Mediterranean woody species in field conditions. American Journal of Botany 87, 133-140. Misra, G., Pavlostathis, S.G., Perdue, E.M. & Araujo, R. 1996 Aerobic biodegradation of selected monoterpenes. Applied Microbiology and Biotechnology 45, (6) 831-838. Mueller, J-F., 1992. Geographycal distribution and seasonal variation of surface emissions and deposition velocities of atmospheric trace gases. Journal of Geophysical Research 97, 3787-3804. Nannipieri, P., Ascher, J., Ceccherini, M.T., Landi, L., Pietramellara, G. & Renella, G. 2003. Microbial diversity and soil functions. Europena Journal of Soil Science, 54 (4), 655-670. Newman, L.A., Strand, S.E., Choe, N., Duffy, J., Ekuan, G., Ruszaj, M., Shurtleff, B. B., Wilmoth, J., Heilman, P. & Gordon, M.P. 1997. Uptake and biotransformation of trichloroethylene by hybrid poplars. Environmental Science and Technology 31 (4), 1062-1067. Nishida, N., Tamotsu, S., Nagata, N., Saito, C. & Sakai, A. 2005. Allelopathic effects of volatile monoterpenoids produced by Salvia leucophylla: Inhibition of cell proliferation and DNA syntesis in the root apical meristem of Brassica campestris seedlings. Journal of Chemical Ecology 31, (5) 1187-1203. Nordenhem, H. & Nordlander, G. 1994. Olfactory oriented migration through soil by root-living Hylobius abietis (L) larvae (Col, Curculionidae). J. Appl. Entomol. 117, (5) 457-462. Ogaya, R., Peñuelas, J. 2003. Comparative field study of Quercus ilex and Phillyrea latifolia: photosynthetic response to experimental drought conditions. Environmental and Experimental Botany 50, 137-148. Ogaya, R., Peñuelas, J., Martínez-Vilalta, J. & Mangiron, M. 2003. Effect of drought on diameter increment of Quercus ilex, Phillyrea latifolia, and Arbutus unedo in a holm oak forest of NE Spain. Forest Ecology and Management 180, 175-184. Owen, M.S., Clark, S., Pompe, M. & Semple, K.T. 2007. Biogenic volatile organic compounds as potential carbon sources for microbial communities in soil from the rhizosphere of Populus tremula. FEMS Microbiology Letters 268, 34-39. Pegoraro, E., Rey, A., Abrell, L., Vanharen, J. & Lin, G.H. 2006. Drought effect on isoprene production and consumption in Biosphere 2 tropical rainforest. Global Change Biology 12 (3), 456-469.

Chapter 3 Interannual monoterpene and VOC exchange rates in a Mediterranean shrubland
127
Peñuelas, J., Llusià, J. & Estiarte, M., 1995. Terpenoids—a plant language. Trends in Ecology & Evolution 10 (7), 289. Peñuelas, J. & Llusià, J. 1997. Effects of carbon dioxide, water supply and seasonality on terpene content and emission by Rosmarinus officinalis. Journal of Chemical Ecology 23 (44), 979-994. Peñuelas, J., Filella, I., Llusià, J., Siscart, D. & Piñol, J. 1998. Comparative field study of spring and summer leaf gas exchange and photobiology of the mediterranean trees Quercus ilex and Phillyrea latifolia. Journal Experimental Botany 49 (319), 229-238. Peñuelas, J. & Llusià, J. 1999. Short-term responses of terpene emission rates to experimental changes of PFD in Pinus halepensis and Quercus ilex in summer field conditions. Environmental Experimental Botany 42, 61-68. Peñuelas, J. & Llusia, J. 2001. The complexity of factors driving volatile organic compound emissions by plants. Biologia Plantarum 44, 481-487. Peñuelas, J. & Llusià, J. 2003. BVOCs: Plant defense against climate warming? Trends in Plant Science 8, 105-109. Peñuelas, J., Gordon, C., Llorens, L., Nielsen, T., Tietema, A., Beier, C., Bruna, P., Emmett, B., Estiarte, M. & Gorissen, A. 2004. Nonintrusive field experiments show different plant responses to warming and drought among sites, seasons and species in a North-South European gradient. Ecosystems 7, 598-612. Peñuelas, J. & Llusià, J. 2004. Plant VOC emissions: making use of the unavoidable. Trends in Ecology & Evolution 19 (8), 402-404. Peñuelas, J., Filella, I., Sabate, S. & Gracia, C. 2005a. Natural systems: terrestrial ecosystems. In Report on Climate change in Catalonia (ed. Llebot J.E) pp. 517-553. Institut d'Estudis Catalans, Barcelona. Peñuelas, J., Filella, I., Stefanescu, C. & Llusià, J. 2005b. Caterpillars of Euphydryas aurinia (Lepidoptera: Nymphalidae) feeding on Succisa pratensis leaves induce large foliar emissions of methanol. New Phytologist 167, 851-857. Peñuelas, J., Prieto, P., Beier, C., Cesaraccio, C., De Angelis, P., de Dato, G., Emmett, B.A., Estiarte, M., Garadnai, J., Gorissen, A., Kovács-Láng, E., Kröel-Dulay, G., Llorens, L., Pellizzaro, G., Riis-Nielsen, T., Schmidt, I.K., Sirca, C., Sowerby, A., Spano, D. & Tietema, A. Response of plant species richness and primary productivity in shrublands along a north-south gradient in Europe to seven years of experimental warming and drought. Reductions in primary productivity in the heat and drought year of 2003. Global Change Biology in press. Pignatello, J.J & Xing, B. 1996 Mechanisms of slow sorption of organic chemicals to natural particles. Environmental Science and Technology 30, (1) 1-11.

Chapter 3 Interannual monoterpene and VOC exchange rates in a Mediterranean shrubland
128
Ryu, C., Farag, M.A., Hu, C., Reddy, M.S., Wei, H., Pare, P.W. & Kloepper, J.W. 2003 Bacterial volatiles promote growth in Arabidopsis. Proceedings of the National Academy of Sciences U. S. A. 100, (8) 4927-4932. Sabaté, S., Gracia, C. & Sánchez, A. 2002. Likely effects of climate change on growth of Quercus ilex, Pinus halepensis, and Fagus sylvatica forest in the Mediterranean region. Forest Ecology and Management 162, 23-37.
Sardans, J. & Peñuelas, J., 2005. Drought decreases soil enzyme activity in a Mediterranean Quercus ilex L. forest. Soil Biology and Biochemistry 37, 455-461.
Sardans, J., Peñuelas, J. & Estiarte, M. 2006. Warming and drought alter soil phophatase activity and soil P availability in a Mediterranean shrubland. Plant Soil 289, 227-238. Sardans, J., Peñuelas, J. & Estiarte, M. 2007. Seasonal patterns of root-surface phosphatase activities in a Mediterranean shrubland. Responses to experimental warming and drought. Biology and Fertility of Soils, in press. Schade, G.W. & Goldstein, A.H. 2001. Fluxes of oxygenated volatile compounds from a ponderosa pine plantation. Journal of Geophysical Research Atmosphere 106, (D3) 3111-3123. Schade, G.W. & Custer, T.G. 2004. OVOC emissions from agricultural soil in northern Germany during the 2003 European heat wave. Atmospheric Environment 38 (36), 6105-6114. Scholler, C.E.G., Gurtler, H., Pedersen, R., Molin, S. & Wilkins, K. 2002. Volatile metabolites from actinomycetes. Journal of Agricultural and Food Chemistry 50 (9), 2615-2621. Seco, R., Peñuelas, J. & Filella, I., 2007. Short-chain oxygenated VOCs: Emission and uptake by plants and atmospheric sources, sinks, and concentrations. Atmospheric Environment 41, 2477-2499. Simonich, S.L. & Hites, R.A., 1995. Organic Pollutant accumulation in vegetation. Environmental Sciences and technology 29 (12), 2905-2914. Smolander, A., Ketola, R.A., Kotiaho, T., Kanerva, S., Suominen, K. & Kitunen, V. 2006. Volatile monoterpenes in soil atmosphere under birch and conifers: Effects on soil N transformations. Soil Biology and Biochemistry 38, 3436-3442. Splivallo, R., Novero, M., Bertea, C. M., Bossi, S. & Bonfante, P. 2007. Truffle volatiles inhibit growth and induce an oxidative burst in Arabidopsis thaliana New Phytologist 175 (3), 417–424.

Chapter 3 Interannual monoterpene and VOC exchange rates in a Mediterranean shrubland
129
Tani, A., Kato, S., Kajii, Y., Wilkinson, M., Owen, S. & Hewitt, N. 2007. A proton transfer reaction mass spectrometry based system for determining plant uptake of volatile compounds. Atmospheric Environment 41, 1736-1746. Van Ginkel, C.G., De Jong, E., Tialnus, J.W.R. & Bont, J.A.M. 1987. Microbial oxidation of isoprene, a biogenic foliage volatile and of 1,3-butadiene, an anthropogenic gas. FEMS Microbiological Ecology, 45, 275-279. Van Roon, A., Parsons, J.R., Te Kloeze, A. & Govers, H.A.J. 2005a. Fate and transport of monoterpenes through soils. Part I. Prediction of temperature dependent soil fate model input-parameters. Chemosphere 61, 599-609. Van Roon, A., Parsons, J.R., Krap, L. & Govers, H.A.J. 2005b. Fate and transport of monoterpenes through soils. Part II: Calculation of the effect of soil temperature, water saturation and organic carbon content. Chemosphere 61, 129-138. White, C.S. 1994. Monoterpenes-Their effects on ecosystem nutrient cycling. Journal of Chemical Ecology 20, (6) 1381-1406.

Chapter 3 Interannual monoterpene and VOC exchange rates in a Mediterranean shrubland
130
Chapter 4 On-line screening of soil VOCs responses to moisture, temperature and root presence
131
Chapter 4
On-line screening of soil VOCs exchange
responses to moisture, temperature and
root presence

Chapter 4 On-line screening of soil VOCs responses to moisture, temperature and root presence
132

Chapter 4 On-line screening of soil VOCs responses to moisture, temperature and root presence
133
Abstract
The exchanges of volatile organic compounds (VOCs) between soils and the
atmosphere are poorly known. We investigated VOC exchange rates and how they were
influenced by soil moisture, temperature and the presence of plant roots in a
Mediterranean forest soil. We measured VOC exchange rates along a soil moisture
gradient (5%-12.5%-20%-27.5% v/v) and a temperature gradient (10ºC-15ºC-25ºC-
35ºC) using PTR-MS. Monoterpenes were identified with GC-MS. Soils were a sink
rather than a source of VOCs in both soil moisture and temperature treatments (-2.16 ±
0.35 nmol m-2 s-1 and -4.90 ± 1.24 nmol m-2 s-1 respectively). Most compounds observed
were oxygenated VOCs like alcohols, aldehydes and ketones and aromatic
hydrocarbons. Other volatiles such as acetic acid and ethyl acetate were also observed.
All those compounds had very low exchange rates (maximum uptake rates from –0.8
nmol m-2 s-1 to –0.6 nmol m-2 s-1 for methanol and acetic acid). Monoterpene exchange
ranged only from –0.004 nmol m-2 s-1 to 0.004 nmol m-2 s-1 and limonene and α-pinene
were the most abundant compounds. Increasing soil moisture resulted in higher soil sink
activity possibly due to increases in microbial VOCs uptake activity. No general pattern
of response was found in the temperature gradient for total VOCs. Roots decreased the
emission of many compounds under increasing soil moisture and under increasing soil
temperature. While our results showed that emission of some soil VOCs might be
enhanced by the increases in soil temperature and that the uptake of most soil VOCs
uptake might be reduced by the decreases of soil water availability, the low exchange
rates measured indicated that soil-atmosphere VOC exchange in this system are unlikely
to play an important role in atmospheric chemistry.
Key words: Monoterpenes; PTR-MS; roots; soil moisture; soil VOC exchange; temperature.

Chapter 4 On-line screening of soil VOCs responses to moisture, temperature and root presence
134
4.1. Introduction
Soils are reported to be both source and sink of volatile organic compounds (VOCs).
For example, acetone and methanol emissions have been described from agricultural
soils (Schade and Custer, 2004), emissions of methanol, acetone and acetaldehyde in a
ponderosa pine plantation were found to contribute significantly to the canopy level
fluxes of such compounds (Schade and Goldstein, 2001), and monoterpene emissions
from a Sitka spruce soil forest have been also characterised, although their contribution
to the total monoterpene atmospheric budget was low (Hayward et al., 2001). Reports
on the soil VOCs sink activity are more scarce. For example, VOC uptake in soil has
been reported for atmospheric isoprene (Cleveland and Yavitt, 1998; Pegoraro et al.,
2005) and for methane-derived compounds, such chloromethane (Keppler et al., 2005).
Roots and soil microorganisms are thought to be the principal sources of soil
VOCs emission (Janson, 1993; Mackie and Wheatley, 1999; Chen et al., 2004; Steeghs
et al., 2004; Ping and Boland, 2004). Likewise, roots can also uptake and accumulate or
degrade some contaminant organic volatiles from the soil solution (Cho et al., 2005) and
microorganisms can consume them (Cleveland and Yavitt, 1998; Yoo and Day, 2002).
In addition, there could be interactions between these biological processes, for example,
roots activity produces the enhancement of associated microbial populations by
releasing carbon-rich exudates on the rhizosphere (Walker et al., 2003). Thus,
constituents of soil VOCs dynamics, sources and sinks, are linked, resulting in complex
interactions.
Both soil moisture and temperature are reported to affect physical VOC
processes in soil (adsorption, dissolution, volatilisation) and also biological processes
(biodegradation by microorganisms, uptake by plants) (Pignatello and Xing, 1996; Cho
et al., 2005; Johnsen et al. 2005), which in turn affect the VOCs soil exchange rates.
Up to date, some studies have revealed interesting properties for volatile
compounds that could play an important role in the soil e. g. bacterial volatiles such 2,3-
butadienol and acetoin that promote growth in plants (Ryu et al., 2003), plant volatiles
like sesquiterpenes that induce hyphal branching in AM fungi (Akiyama et al., 2005) or
(z)-jasmone plant exudates which act as an aphid colonization signal for nearby plants
(Chamberlain et al., 2001). Negative interactions between bacteria and fungi mediated
by several VOCs, trimethylamine, benzaldehyde or N, N-dimethyloctylamine, have also
been described (Mackie and Wheatley, 1999; Xu et al., 2004). Among VOCs, the

Chapter 4 On-line screening of soil VOCs responses to moisture, temperature and root presence
135
monoterpenes have been reported to be able to alter the rates of nitrogen cycle (White,
1994), act as potent biological inhibitors (Nishida et al., 2005) or as attractant to the
larvae of some pine weevil species (Nordenhem and Nordlander, 1994) and to be used
as growth substrate for bacteria (Misra et al., 1996).
All these examples make prominent the likely role of VOCs on soil ecology, and
information on soil VOCs is still scarcely available (Asensio et al., 2007). Furthermore,
it is likely that the soil warming and lower water availability predicted by GCM and
ecophysiological models in the Mediterranean region (IPCC 2001; Peñuelas et al.,
2005a) will affect soil VOCs exchange rates.
We aimed thus to obtain information about changes in real time on the soil
VOCs source/sink activity, taking advantage of the recent availability of analytical
instrumentation to conduct these measurements, and to obtain information on soil VOCs
exchange rates responses to root presence, to the soil warming and to the lower water
availability predicted by GCM and ecophysiological models in the Mediterranean
region. With these aims, we monitored soil VOCs exchange rates in real time with the
PTR-MS technique in a controlled ‘soil+plant’-atmosphere and in a ‘soil’-atmosphere
systems, and submitted both ‘soil + plant’ and ‘soil’ systems to moisture and
temperature gradients.
4.2. Material and methods
4.2.1. Plant Material
Quercus ilex seedlings were grown in a nursery (Forestal Catalana, S. A., Breda, Spain)
under typical Mediterranean environmental conditions (mean annual average
temperature 16ºC, mean annual precipitation 600mm). In November 2004, 2-year-old
plants were transplanted with their intact roots to 2-L pots filled with soil from a natural
holm oak forest in Prades mountains, South-Eastern Catalonia.
4.2.3. Soil Material
Soil samples were collected from the top soil layer (20 cm) in a natural holm oak forest
growing in the Prades Mountain region, in South-Eastern Catalonia (41º 13’N, 0º55’E),
on a south-facing slope (25% slope) at 930 m above sea level. All the soil mineral
particles and organic matter were maintained to preserve natural soil structure. We

Chapter 4 On-line screening of soil VOCs responses to moisture, temperature and root presence
136
turned over the soil before putting it into the pots, in order to avoid compaction and
therefore soil density in the pots was similar to soil density in the natural situation.
4.2.4. ‘Soil + Plant’ and ‘Soil’ treatments
Soil samples were used to fill six pots with Quercus ilex plants and further soil samples
were used to fill six pots without plant. All the pots were maintained in winter
Mediterranean-like conditions in the University experimental fields (average
temperature and moisture for the three months: 7.9 ºC and 82.7%) from November 2004
to February 2005, when we started the experiment.
Figure 4.1. (A) Schematic overview of the system used for measurements of the soil VOCs exchange rate. The air enters into the system from the inlet, the air leaving the soil chamber is flowed by a T-system to an IRGA to measure soil CO2 efflux or either to the PTR-MS and GC-MS to measure soil VOCs. (B) Schematic overview of the system used for measurements of the background VOCs (blank measurements). Air enters into the system from the inlet and is flowed to the PTR-MS or GC-MS as in the Fig. 4.1 A.
4.2.4. Moisture Gradient Treatment
Half of the pots (three ‘soil + plant’ and three ‘soil’ without plant) were maintained
within a low irrigation regime (50 cm3 each 3 days from November to February) and
assigned for the soil moisture gradient treatment. These pots had 5% volume soil
moisture when VOCs measurements started in February 2005. Soil temperature was
constant at 20ºC during all the soil moisture treatment. A gradient from 5% to 27.5%
(7.5% steps) was applied by uniformly spraying 200 cm3 water over the pot surface in
each moisture step. We waited 1 hour of stabilization after irrigation and then started
soil and leaf measurements.
PTR-MS GC-MS
IRGAsoil chamber
inlet
PTR-MS GC-MS
IRGA
soil chamber
inlet
‘soil’ pot inert surface
A B

Chapter 4 On-line screening of soil VOCs responses to moisture, temperature and root presence
137
4.2.5. Temperature Gradient Treatment
The other six pots (three ‘soil + plant’ and three ‘soil’ without plant) were well watered
(250 cm3 each 3 days from November to February) and assigned for the temperature
gradient treatment. These pots had 21% soil moisture when VOCs measurements started
in February 2005. They were exposed to a temperature gradient: 10ºC, 15ºC, 25ºC and
35ºC. Soil temperature steps were reached by putting the pot into a thermostatic bath.
The soil in the pot surface was open to the gas exchange and sampling. The soil same
leaf temperatures were reached in the controlled environment cuvette used for leaf
measurements.
4.2.6. Experimental System and Variables Measured
We measured soil CO2 and VOC exchange, and leaf net CO2 uptake and stomatal
conductance at each soil moisture and temperature step. We measured one pot (one
gradient) per day.
In every ‘soil + plant’ and ‘soil’ pot, a 97.5 cm2 soil metal collar was inserted 10
cm into the soil 1 hour before starting the measurements. A soil hood chamber was
placed hermetically onto the soil collar. This soil gas exchange system was prepared
with one inlet for the ambient air and one outlet connected to an IRGA porometer
(LCA-4, ADC; Hoddeson, Hertfordshire, UK). The air exiting from the enclosed soil
flowed through a T-system to the PTR inlet for VOC analysis during 40 min and to the
IRGA inlet for CO2 analysis, as showed in the Figure 4.1 a.
For each soil PTR-MS VOC measurements, we also sampled the VOCs
with carbon-trap adsorption tubes. We conducted GC-MS analyses to identify the
different monoterpenes. The air exiting the soil chamber flowed through a T-system
impelled by a pump towards a glass tube (11.5 cm long and 0.4 internal diameter) filled
with VOC adsorbents Carbotrap C (300 mg), Carbotrap B (200 mg) and Carbosieve S-
III (125 mg) separated by plugs of quartz wool and treated as described by Peñuelas et
al. (2005b). After VOC sampling, the adsorbent tubes were stored at –30ºC until
analysis (within 24-48 h). The VOC analyses were conducted in a GC-MS (HP59822B;
Hewlett Packard, Palo Alto, CA, USA), as described by Peñuelas et al. (2005b).
Before each measurement of soil VOC exchange rate, we conducted system
blank measurements by sampling air from an empty surface covered by teflon and
enclosed by the soil hood, as it is shown in Figure 4.1 b. Ambient air was fluxed into the
soil hood and the air coming out flowed through a T-system to either a PTR-MS system

Chapter 4 On-line screening of soil VOCs responses to moisture, temperature and root presence
138
or to an absorption glass tube for GC-MS analysis. Net soil VOCs fluxes were
calculated by considering the stable difference in the VOCs concentration between the
soil chamber air (soil VOCs) and the ambient air (background VOCs). Measuring
replicate pots of the same treatment over different days could increase the variability of
the measurements since they will vary with ambient air composition variations from day
to day. In spite of this added daily variability, there were several masses (those
presented here) which showed significant responses to the treatments or a clear trend, so
we kept using ambient air to achieve maximum similarity with natural conditions. Soil
and leaf CO2 gas exchange measurements were also conducted with the empty soil hood
and the empty leaf cuvette as additional control.
Soil moisture and temperature were also monitored at 10 cm depth, beside the
collar to avoid mechanical disturbances to the enclosed soil. A HH2 soil moisture meter
connected to a ML2x soil moisture sensor (Delta-T Devices Ltd, Cambridge, England)
was used to measure soil moisture and a soil digital thermometer was used to measure
temperature (TO 15, Jules Richard instruments, Argenteuil, France).
For leaf net assimilation and stomatal conductance measurements we used a
portable photosynthesis system CIRAS-2 (PP Systems). An intact leaf was clamped in a
Parkinson leaf cuvette (Std Broad 2.5, PP Systems, Hitchin, UK). At every soil moisture
and temperature in each ‘soil + plant’ replicate we measured the same leaf to minimize
leaf-to-leaf variability. Leaf cuvette temperature was controlled by CIRAS-2 and
maintained at 20ºC during the soil moisture treatment and 10ºC, 15ºC, 25ºC and 35ºC
during temperature treatment. All leaf measurements were conducted at 1000 μmol m-2
h-1 PPFD. After the soil moisture and temperature gradient treatment, the sampled leaf
of each ‘soil + plant’ replicate was harvested to measure its surface area in a Li-Cor
3100 Area Meter (Li-Cor Inc., Lincoln, NE, USA).
4.2.7. Analysis of VOCs by PTR-MS and GC-MS
The PTR-MS system (PTR-MS-FTD hs; Ionicon Analitik, Innsbruck, Austria) provides
real time highly sensitive detection of the mass selected ions that are characteristic of
the molecules of interest. Both PTR-MS and its use in VOC analysis have been
described in detail in Lindinger et al. (1998) and Fall et al. (1999). Detection of the
protonated volatiles is produced in a quadrupole mass spectrometer. For many
compounds, proton transfer from H3O+ was nondissociative; however, in the case of
monoterpenes, dissociation occurred. Mass fragmentation and the fact that compounds

Chapter 4 On-line screening of soil VOCs responses to moisture, temperature and root presence
139
with the same molecular mass cannot be separately measured are the main limitations of
using PTR-MS. We estimated the concentration of total monoterpenes as the
concentration of ions with mass 137, 95, 81 and 67 because certain fragmentation of
non-oxygenated monoterpenes in the drift tube occurred during ionization (checked
with α-pinene standard). To solve the second limitation, we combined PTR-MS with
GC-MS techniques to determine the different monoterpenes.
The PTR-MS instrument was calibrated using calibration standards for the most
common compounds found in previous studies of this Mediterranean soil (Asensio et
al., 2007). The quantification of VOCs was based on the use of 3 times replicated
calibration standards (methanol, acetaldehyde, acetone, isoprene and α-pinene Abelló-
Linde, Barcelona, Spain) for each day of measurements. The detection limit of he PTR
model we used, a PTR-MS-FTD hs with a high sensitivity, was in the order of pptv and
the reproducibility for quantitative analysis was better than 10%.
In this experiment the PTR-MS drift tube was operated at 2.1 mbar and 40ºC,
with a drift field of 600 V cm-1; the parent ion signal was maintained at ca. 3 x 10⁶
counts per second during the measurements. We conducted scans of all masses between
22 and 205 and use the background values to calculate the exchange balance for each
compound. The background air concentrations, one of the main factors driving such
exchange, for all masses with significant exchange are shown in Table 4.1 and Table 4.2
(soil moisture and soil temperature treatments respectively). Screening soil VOCs
concentrations in response to soil moisture and temperature changes with the PTR-MS
technique allowed the measure of VOCs exchange rates in real time and therefore to
wait until stabilization for sampling VOCs in each soil moisture or temperature set.
4.2.8. Statistical Analyses
Analyses of variance (ANOVA) were conducted in soil and leaf measurements for
every mass with the VOC exchange rate as dependent variable and with treatment (soil
moisture or temperature gradient) and the presence of living roots in soil as independent
factors. When needed, Fisher’s PLSD post hoc tests were conducted. All analyses
(ANOVAs, Post Hoc Test and regression models) were performed with STATVIEW
5.01 software package (SAS Institute Inc., Cary, NC).

Chapter 4 On-line screening of soil VOCs responses to moisture, temperature and root presence
140
4.3. Results
4.3.1. Soil Moisture Treatment
Total VOCs and Monoterpenes
The overall exchange rate of VOCs resulted in soil uptake (Fig. 4.2). Mean values of the
total soil VOC uptake rates were -2.16 ± 0.35 nmol m-2 s-1. Soil monoterpene emissions
prevailed over monoterpene uptake during the soil moisture treatment (Fig. 4.2),
although the exchange rate values were very low. Maximum monoterpene emission
rates were detected at 5% soil moisture and 21ºC soil temperature in the ‘soil’
measurements (0.009 ± 0.003 nmol m-2 s-1, Fig. 4.2). Total monoterpene exchange rate
values measured with the GC-MS technique were in agreement with PTR-MS values
and trends (Figs. 4.2 and 4.3). The largest part of detected monoterpenes were α-pinene
and limonene (Fig. 4.3).
Soil VOCs uptake increased with increases in soil moisture (soil moisture p<
0.1, Fig. 4.2). Similarly, soil monoterpene uptake increased at higher moistures (Fig.
4.2). The soil moisture treatment did not alter neither the composition nor the relative
abundance of soil monoterpene exchange (Fig. 4.3).
Soil VOC uptake was larger in ‘soil + plant’ than in ‘soil’ measurements (roots
p< 0.1, Fig. 4.2). Similar results were found for roots effect on soil monoterpene
exchange (p< 0.05, Fig. 4.2). Limonene uptake was significantly larger when there were
roots in soil (roots p< 0.05) (Fig. 4.3).
Other VOCs
The responses to soil moisture of individual compounds are available in the
Supplementary Table 1. A great part of all masses which had a significant response to
soil moisture treatment, such as formaldehyde, methanol, acetaldehyde, ethanol, hexanal
and hexenol (Supplementary Table 1), followed the same pattern than total soil VOC
exchange rate (Fig. 4.2). They were increasingly taken up from air to soil when soil
moisture was increased. Only few masses which had a significant response to soil
moisture treatment showed the inverse trend (M155, Supplementary Table 1).

Chapter 4 On-line screening of soil VOCs responses to moisture, temperature and root presence
141
Figure 4.2. Total detected soil VOCs exchange rates and soil monoterpene exchange rates measured during the soil moisture treatment in the ‘soil’ and ‘soil + plant’ pots. Total VOCs are the sum of the exchange rate of scanned masses (22-205, except M37 and M39, water clusters and isotopes of water cluster). Error bars indicate ± standard error of the mean (n=3 ‘soil’ pots and n=3 ‘soil + plant’ pots, for both total VOCs and monoterpenes). Significances for the overall effect of the soil moisture treatment and the roots presence (ANOVA) are indicated inside the panels.
The major part of all masses which had a significant exchange rate response to
the presence of roots effect showed a greater uptake in their presence than in their
absence. Acetic acid, (E)-2-hexenal, benzene, xylene, M123 and p-cymene
(Supplementary Table 1) followed this trend. The exchange rate response of a few
masses such as M157 followed the contrary trend.
Apart from the masses shown in Supplementary Table 1, there were other
masses with significant exchange rate responses to the soil moisture and to the roots
presence which followed the main trends described in this Supplementary Table 1. For
example, M32, M62, M84, M114, M120, M145 and M159 uptake increased with rising
soil moistures and M90, M121, M122, M159, M164 and M194 uptake was larger in the
‘soil + plant’ measurements than in the ‘soil’ measurements.
Soil
VOC
Exc
hang
e R
ates
(nm
ol m
-2 s
-1)
-10
-5
0
5
soilsoil + plant
5 12.5 20 27.5
Total VOCs
-0.01
-0.005
0
0.005
0.01
0.015
0.02
5 12.5 20 27.5
M137
Soil Moisture (% volume)
roots p<0.1soil moisture p<0.1
Soil Moisture (% volume)
Soil
Mon
oter
pene
Ex
chan
ge R
ates
(nm
ol m
-2 s
-1)
roots p<0.05soil moisture p<0.005roots x soil moisture p<0.05
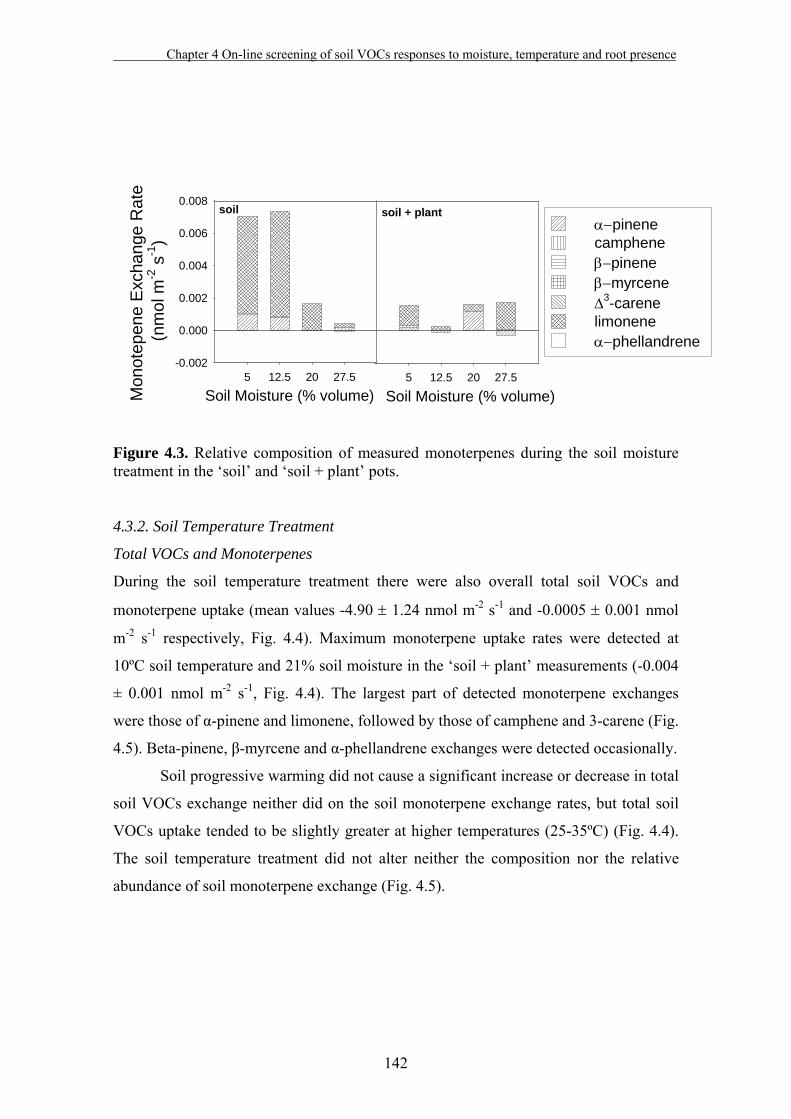
Chapter 4 On-line screening of soil VOCs responses to moisture, temperature and root presence
142
Figure 4.3. Relative composition of measured monoterpenes during the soil moisture treatment in the ‘soil’ and ‘soil + plant’ pots.
4.3.2. Soil Temperature Treatment
Total VOCs and Monoterpenes
During the soil temperature treatment there were also overall total soil VOCs and
monoterpene uptake (mean values -4.90 ± 1.24 nmol m-2 s-1 and -0.0005 ± 0.001 nmol
m-2 s-1 respectively, Fig. 4.4). Maximum monoterpene uptake rates were detected at
10ºC soil temperature and 21% soil moisture in the ‘soil + plant’ measurements (-0.004
± 0.001 nmol m-2 s-1, Fig. 4.4). The largest part of detected monoterpene exchanges
were those of α-pinene and limonene, followed by those of camphene and 3-carene (Fig.
4.5). Beta-pinene, β-myrcene and α-phellandrene exchanges were detected occasionally.
Soil progressive warming did not cause a significant increase or decrease in total
soil VOCs exchange neither did on the soil monoterpene exchange rates, but total soil
VOCs uptake tended to be slightly greater at higher temperatures (25-35ºC) (Fig. 4.4).
The soil temperature treatment did not alter neither the composition nor the relative
abundance of soil monoterpene exchange (Fig. 4.5).
soil + plant
Soil Moisture (% volume)5 12.5 20 27.5
Mon
otep
ene
Exc
hang
e R
ate
(nm
ol m
-2 s
-1)
5 12.5 20 27.5-0.002
0.000
0.002
0.004
0.006
0.008soil
Soil Moisture (% volume)
α−pinene campheneβ−pinene β−myrcene Δ3-carene limoneneα−phellandrene

Chapter 4 On-line screening of soil VOCs responses to moisture, temperature and root presence
143
Figure 4.4. Total detected soil VOCs exchange rates and soil monoterpene exchange rates measured during the soil temperature treatment in the ‘soil’ and ‘soil + plant’ pots. Error bars indicate ± standard error of the mean (n=3 ‘soil’ pots and n=3 ‘soil + plant’ pots, for both total VOCs and monoterpenes).
Figure 4.5. Relative composition of measured monoterpenes during the soil temperature treatment in the ‘soil’ and ‘soil + plant’ pots.
soil + plant
Soil Temperature (ºC)10 15 25 3510 15 25 35
-0.002
0.000
0.002
0.004
0.006
0.008
α−pinene campheneβ−pinene β−myrcene Δ3-carene limoneneα−phellandrene
soil
Mon
otep
ene
Exc
hang
e R
ate
(nm
ol m
-2 s
-1)
Soil Temperature (ºC)
Soil
VOC
Exc
hang
e R
ates
(nm
ol m
-2 s
-1)
10 15 25 35-10
-5
0
5Total VOCs
soilsoil + plant
10 15 25 35-0.01
-0.005
0
0.005
0.01
0.015
0.02M137
Soil Temperature (ºC) Soil Temperature (ºC)
Soil
Mon
oter
pene
Ex
chan
ge R
ates
(nm
ol m
-2 s
-1)

Chapter 4 On-line screening of soil VOCs responses to moisture, temperature and root presence
144
Other Compounds
The responses to soil temperature of individual compounds are available in the
Supplementary Table 2. In the soil temperature treatment, an increased positive mass
exchange rate was the common response to the increases in soil temperature. Most of
the masses which presented a significant exchange rate response to soil temperature
(such as M55, ethyl acetate, M91, M157, M167 and M195 in Supplementary Table 2)
followed this trend.
The effect of the roots, when significant (Supplementary Table 2), was the same
that in the soil moisture treatment. We found greater VOC uptake in the ‘soil + plant’
measurements than in the ‘soil’ measurements (Supplementary Table 2). Only some
masses presented lower uptake in the ‘soil + plant’ than in the ‘soil’ measurements
(M105, M116 and M190, not shown).
Apart from the masses given in Supplementary Table 2, there were other masses
with significant exchange rate responses to the soil temperature and to the roots
presence which followed the main trends described in this Supplementary Table 2. For
example, M20, M30, M36, M38, M40, M111, M163, M169 and M192 exchange rate
increased when rising soil temperatures. M104, M111, M124, M146, M151, M154,
M158, M163, M174 and M186 uptake was also larger in the presence of roots.
4.3.3. Soil and leaf CO2 exchange
Soil CO2 emissions increased when soil moisture and temperature were increased (soil
moisture p< 0.005; soil temperature p< 0.0001, Fig. 4.6). The highest CO2 exchange
rates were measured at 35ºC soil temperature in the ‘soil + plant’ measurements (27.88
± 10.34 μmol m-2 s-1). Minimum soil CO2 production rates were found when soil
moisture and temperature were the lowest (5% and 10ºC respectively, Fig. 4.6). These
values ranged from 2.27 to 4.22 μmol m-2 s-1. Soil CO2 production was higher in ‘soil +
plant’ than in ‘soil’ pots, although the differences were statistically significant only in
the soil moisture treatment (roots p< 0.0005, Fig. 4.6).
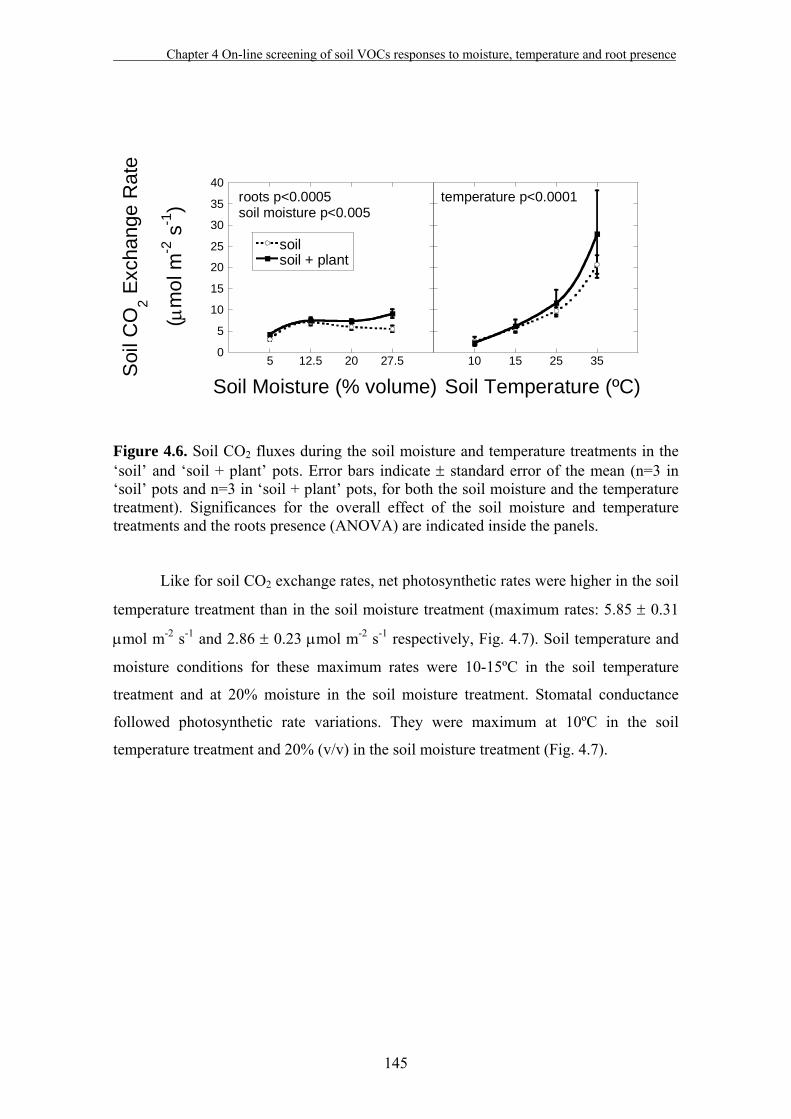
Chapter 4 On-line screening of soil VOCs responses to moisture, temperature and root presence
145
Figure 4.6. Soil CO2 fluxes during the soil moisture and temperature treatments in the ‘soil’ and ‘soil + plant’ pots. Error bars indicate ± standard error of the mean (n=3 in ‘soil’ pots and n=3 in ‘soil + plant’ pots, for both the soil moisture and the temperature treatment). Significances for the overall effect of the soil moisture and temperature treatments and the roots presence (ANOVA) are indicated inside the panels.
Like for soil CO2 exchange rates, net photosynthetic rates were higher in the soil
temperature treatment than in the soil moisture treatment (maximum rates: 5.85 ± 0.31
μmol m-2 s-1 and 2.86 ± 0.23 μmol m-2 s-1 respectively, Fig. 4.7). Soil temperature and
moisture conditions for these maximum rates were 10-15ºC in the soil temperature
treatment and at 20% moisture in the soil moisture treatment. Stomatal conductance
followed photosynthetic rate variations. They were maximum at 10ºC in the soil
temperature treatment and 20% (v/v) in the soil moisture treatment (Fig. 4.7).
0
5
10
15
20
25
30
35
40
soilsoil + plant
5 12.5 20 27.5 10 15 25 35Soi
l CO
2 Exc
hang
e R
ate
(μm
ol m
-2 s
-1)
Soil Moisture (% volume) Soil Temperature (ºC)
roots p<0.0005soil moisture p<0.005
temperature p<0.0001

Chapter 4 On-line screening of soil VOCs responses to moisture, temperature and root presence
146
Figure 4.7. Net photosynthetic rates and stomatal conductances in Quercus ilex leaves during the soil moisture and temperature treatments. Error bars indicate ± standard error of the mean (n=3 leaves for both the soil moisture and the temperature treatment).
1
2
3
4
5
6
7
0
10
20
30
40
50
60
70
80
5 12.5 20 27.5 10 15 25 35
Net
Pho
tosy
nthe
tic R
ate
(μm
ol m
-2 s
-1)
Sto
mat
al C
ondu
ctan
ce
(mm
ol m
-2 s
-1)
Soil Moisture (% volume)
Soil and Leaf Temperature (ºC)
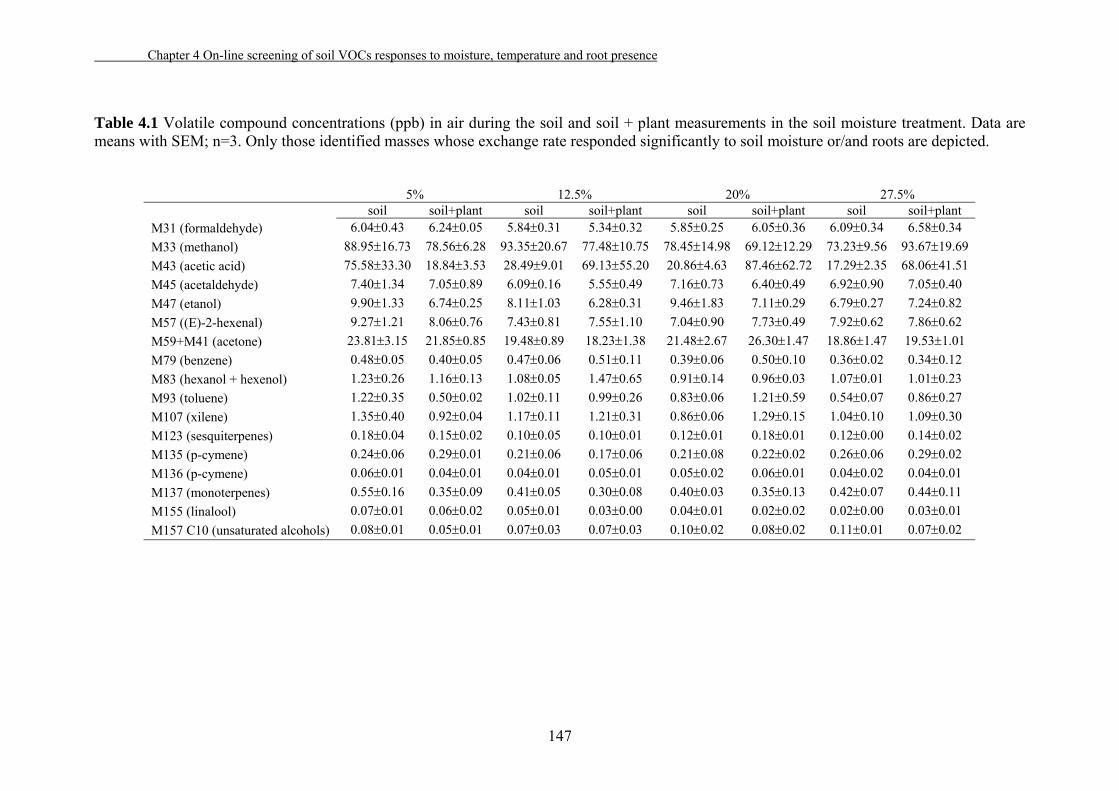
Chapter 4 On-line screening of soil VOCs responses to moisture, temperature and root presence
147
Table 4.1 Volatile compound concentrations (ppb) in air during the soil and soil + plant measurements in the soil moisture treatment. Data are means with SEM; n=3. Only those identified masses whose exchange rate responded significantly to soil moisture or/and roots are depicted.
5% 12.5% 20% 27.5% soil soil+plant soil soil+plant soil soil+plant soil soil+plant M31 (formaldehyde) 6.04±0.43 6.24±0.05 5.84±0.31 5.34±0.32 5.85±0.25 6.05±0.36 6.09±0.34 6.58±0.34 M33 (methanol) 88.95±16.73 78.56±6.28 93.35±20.67 77.48±10.75 78.45±14.98 69.12±12.29 73.23±9.56 93.67±19.69 M43 (acetic acid) 75.58±33.30 18.84±3.53 28.49±9.01 69.13±55.20 20.86±4.63 87.46±62.72 17.29±2.35 68.06±41.51 M45 (acetaldehyde) 7.40±1.34 7.05±0.89 6.09±0.16 5.55±0.49 7.16±0.73 6.40±0.49 6.92±0.90 7.05±0.40 M47 (etanol) 9.90±1.33 6.74±0.25 8.11±1.03 6.28±0.31 9.46±1.83 7.11±0.29 6.79±0.27 7.24±0.82 M57 ((E)-2-hexenal) 9.27±1.21 8.06±0.76 7.43±0.81 7.55±1.10 7.04±0.90 7.73±0.49 7.92±0.62 7.86±0.62 M59+M41 (acetone) 23.81±3.15 21.85±0.85 19.48±0.89 18.23±1.38 21.48±2.67 26.30±1.47 18.86±1.47 19.53±1.01 M79 (benzene) 0.48±0.05 0.40±0.05 0.47±0.06 0.51±0.11 0.39±0.06 0.50±0.10 0.36±0.02 0.34±0.12 M83 (hexanol + hexenol) 1.23±0.26 1.16±0.13 1.08±0.05 1.47±0.65 0.91±0.14 0.96±0.03 1.07±0.01 1.01±0.23 M93 (toluene) 1.22±0.35 0.50±0.02 1.02±0.11 0.99±0.26 0.83±0.06 1.21±0.59 0.54±0.07 0.86±0.27 M107 (xilene) 1.35±0.40 0.92±0.04 1.17±0.11 1.21±0.31 0.86±0.06 1.29±0.15 1.04±0.10 1.09±0.30 M123 (sesquiterpenes) 0.18±0.04 0.15±0.02 0.10±0.05 0.10±0.01 0.12±0.01 0.18±0.01 0.12±0.00 0.14±0.02 M135 (p-cymene) 0.24±0.06 0.29±0.01 0.21±0.06 0.17±0.06 0.21±0.08 0.22±0.02 0.26±0.06 0.29±0.02 M136 (p-cymene) 0.06±0.01 0.04±0.01 0.04±0.01 0.05±0.01 0.05±0.02 0.06±0.01 0.04±0.02 0.04±0.01 M137 (monoterpenes) 0.55±0.16 0.35±0.09 0.41±0.05 0.30±0.08 0.40±0.03 0.35±0.13 0.42±0.07 0.44±0.11 M155 (linalool) 0.07±0.01 0.06±0.02 0.05±0.01 0.03±0.00 0.04±0.01 0.02±0.02 0.02±0.00 0.03±0.01 M157 C10 (unsaturated alcohols) 0.08±0.01 0.05±0.01 0.07±0.03 0.07±0.03 0.10±0.02 0.08±0.02 0.11±0.01 0.07±0.02

Chapter 4 On-line screening of soil VOCs responses to moisture, temperature and root presence
148
Table 4.2 Volatile compound concentrations (ppb) in air during the soil and soil + plant measurements in the soil temperature treatment. Data are means with SEM; n=3. Only those identified masses whose exchange rate responded significantly to soil temperature or/and roots are depicted.
10ºC 15ºC 25ºC 35ºC soil soil+plant soil soil+plant soil soil+plant soil soil+plant M55 (1, 3 butadiene/water cluster) 198.73±82.14 188±45.06 149.85±25.81 130.21±24.99 197.80±28.81 189.83±67.74 186.81±60.65 131.05±22.94 M71 (ethyl acetate) 2.99±0.86 2.60±0.75 2.43±0.42 2.48±0.74 3.92±1.60 2.83±0.63 3.90±1.31 2.68±0.61 M91 (PPN) 0.52±0.16 0.54±0.18 0.53±0.21 0.56±0.20 0.73±0.30 0.55±0.11 0.93±0.39 0.49±0.21 M103 (hexenol) 0.17±0.04 0.24±0.05 0.05±0.01 0.13±0.03 0.15±0.03 0.07±0.02 0.15±0.04 0.14±0.02 M109 (sesquiterpenes) 0.69±0.28 0.86±0.19 0.77±0.04 0.89±0.09 0.95±0.09 0.88±0.05 1.16±0.05 1.32±0.16 M125 (C9 aldehydes) 0.15±0.05 0.25±0.06 0.21±0.02 0.27±0.03 0.19±0.09 0.22±0.04 0.35±0.06 0.16±0.00 M135 (p-cymene) 0.59±0.23 0.64±0.14 0.42±0.02 0.38±0.10 0.45±0.24 0.54±0.11 0.64±0.27 0.57±0.11 M137 (monoterpenes) 1.03±0.43 0.74±0.23 0.70±0.47 0.58±0.33 0.70±0.30 0.52±0.15 0.84±0.17 0.54±0.17 M157 (C10 unsaturated alcohols) 0.11±0.07 0.17±0.07 0.08±0.04 0.10±0.03 0.12±0.05 0.06±0.01 0.07±0.02 0.12±0.02 M167 (C12 aldehydes) 0.09±0.05 0.08±0.03 0.03±0.02 0.04±0.01 0.05±0.02 0.04±0.01 0.04±0.03 0.03±0.02 M171 C11 (unsaturated alcohols) 0.03±0.02 0.12±0.08 0.03±0.01 0.04±0.01 0.05±0.01 0.07±0.03 0.06±0.04 0.03±0.00 M195 (geranyl acetone) 0.05±0.04 0.03±0.02 0.01±0.01 0.02±0.01 0.01±0.01 0.01±0.01 0.02±0.01 0.04±0.02 M199 C13 (unsaturated alcohols) 0.04±0.01 0.03±0.02 0.00±0.00 0.02±0.00 0.02±0.01 0.03±0.02 0.03±0.02 0.03±0.02

Chapter 4 On-line screening of soil VOCs responses to moisture, temperature and root presence
149
4.4. Discussion
4.4.1. Mediterranean soil: sink more than source for VOCs.
Results showed the studied soil as behaved a sink rather than as a source of VOCs, since
uptake overcame total soil VOC emissions in both soil moisture and temperature
treatments (Fig. 4.2 and Fig. 4.4). However, the gradient in chemical potential between
the soil and the atmosphere drives the soil-atmosphere gas exchange diffusive process,
and the direction and magnitude of this gradient is determined by the concentrations in
the soil and air and by the soil/air equilibrium partitioning coefficient KSA (Hippelein
and McLachlan, 1998). Thus, soil VOCs influx or efflux are concentration-dependent.
In order to achieve maximum similarity with natural soil conditions, we have used
atmospheric air regardless of the associated variability. The rates reported here depend
on the concentrations of each VOC in the atmosphere during the soil VOCs sampling
and these vary from day-to-day and between experiments (Table 1 and Table 2)
introducing a large variability what makes conservative our conclusions on the
treatments effects.
Monoterpene exchange rates measured in this experiment were concordant with
exchange rates measured in the same soil type in natural conditions (Asensio et al.,
2007) which ranged from –0.004 nmol m-2 s-1 to 0.004 nmol m-2 s-1. Nonetheless, they
were lower than those reported in previous studies of monoterpene emissions from soils
i. e. 0.026 nmol m-2 s-1 (Hayward et al. 2001). This could be related to the
environmental differences between a Mediterranean holm oak forest and a Sitka spruce
plantation, e. g. plant species composition, lower biomass and drier conditions which all
affect soil microbial activity. In any case, we also found limonene and α-pinene were
the most abundant compounds (Hayward et al., 2001).
Most compounds observed in this study to be exchanged by this Mediterranean
soil were oxygenated VOCs like alcohols, aldehydes and ketones and aromatic
hydrocarbons. Other volatiles such as acetic acid or ethyl acetate were also observed.
The compounds which presented the highest soil uptake rates were methanol and acetic
acid (maximum uptake rates from –0.8 nmol m-2 s-1 to –0.6 nmol m-2 s-1). Methanol is
known to be degraded by different aerobic soil bacteria such methylotrophic bacteria,
acidophilic bacteria or the ubiquitous saprophytic bacteria of the genus Pseudomonas
(Boyd et al., 2000; Trotsenko et al., 2001). Aliphatic low molecular weight organic

Chapter 4 On-line screening of soil VOCs responses to moisture, temperature and root presence
150
acids, such acetic, constitute part of root exudates (Strobel, 2000) and they are known to
be degraded by bacteria in soil forests (Evans, 1998).
Acetone was greatly emitted in ‘soil’ pots (0.4 nmol m-2 s-1, Supplementary
Table 1) when soil moisture was the lowest. Schade and Goldstein (2001) found
significant soil and litter emissions of acetone in a ponderosa pine plantation. However
little emissions of acetone were measured by Steeghs et al. (2004) from hairy roots
cultures of Arabidopsis (0.02 nmol m-2 s-1) when they are compared with our results in
‘soil + plant’ pots (0.11 nmol m-2 s-1, Supplementary Table 1). Low exchange rate
ranges from -0.04 nmol m-2 s-1 to 0.02 nmol m-2 s-1 were also observed for
formaldehyde, acetaldehyde, ethanol, (E)-2-hexenal and ethyl acetate. More information
about which compounds are exchanged and how biotic and abiotic factors can affect
their exchange processes is thus needed.
4.4.2. Soil moisture and temperature effects on soil VOCs exchange
Increasing soil moisture resulted in higher soil sink activity. In parallel, we measured
higher CO2 exchange rates and net photosynthetic rates, corresponding to greater
microbial and plant activity. Biodegradation of VOCs by soil microorganisms or roots
could be responsible for the soil sink activity (Schade and Custer, 2004; Cho et al.,
2005; Van Roon et al. 2005) as well as physical adsorption of VOCs to water, soil
particles surface or organic matter and dissolution (partitioning) of VOCs in water
(Pignatello and Xing, 1996).
The experimental increase of soil temperature enhanced the emission rates of
some volatile compounds (Supplementary Table 2) but this trend was not appreciable in
the total soil VOCs exchange (Fig. 4.4). The exponential increase of soil CO2 exchange
rate measured during the soil temperature experiment (Fig. 4.6) implies higher
microbial activity and possibly higher microbial consumption activity, as occurred
during the soil moisture treatment. Therefore, during the soil temperature treatment
VOCs uptake is also likely to be enhanced but at high temperatures (25-35ºC) the rate
of volatilisation might be higher than the uptake rate, resulting in a increasingly positive
exchange rate balance in some compounds (Supplementary Table 2). As also for the soil
moisture treatment, the experimental design does not enable us to discern the processes
behind these changes. Further research is thus warranted.

Chapter 4 On-line screening of soil VOCs responses to moisture, temperature and root presence
151
4.4.3. Role of roots in soil VOCs exchange.
The results indicate that the presence of roots influences the flux. Roots bring down the
emission rates of many compounds under increasing soil moisture and under increasing
soil temperature (Supplementary Tables 1 and 2). The exudates released by roots can
stimulate rhizospheric microbial population (Hamilton and Frank, 2001; Valé et al.,
2005) and consequently VOCs consumption might be increased. The enhancement of
microbial activity by root exudates is also supported by higher soil CO2 emissions in the
‘soil + plant’ pots than in the ‘soil’ pots, during the soil moisture treatment (roots p<
0.0005, Fig. 4.6). This enhancement of microbial activity by roots could facilitate the
uptake of limiting soil resources by plants (Hamilton and Frank, 2001). Root exudation
is quickly assimilated by microbial population in the rhizosphere, thus increasing the
rates of decomposition and thereby assimilable nutrients in soil. During the soil
temperature treatment there was not a significant root effect on the soil CO2 exchange
measurements nor on the total soil VOCs exchange rates (Fig 4.6 and Fig. 4.4). These
results suggest that roots play a key role in soil VOCs exchange increasing bacterial
metabolism, especially when water is the limiting factor, which is a common situation
in the studied Mediterranean ecosystem (Ogaya et al. 2003).
There were also a few cases in which roots increased the emission rates both in
the soil moisture (M157, M160, M166 and M169) and the soil temperature treatment
(M116 and M190). In all of them net emissions were very low, as it is shown for M157
in Supplementary Table 1 (range from 0 to 0.0005nmol m-2 s-1). This confirms the
potential ability of roots to emit volatile compounds, although in natural soils these
emissions could be hidden by microbial consumption activity.
4.5. Conclusions and final remarks
The studied Mediterranean soil behaved more as a sink of VOCs than as a source.
Under the most standard soil moisture and temperature conditions i. e. 20% v/v and
20ºC, there was overall VOC uptake. An increase in soil moisture produced an
enhancement of the uptake activity of microorganisms or/ and an increase of physical
passive storage of VOCs. Conversely, an increase in soil temperature increased VOCs
emissions. Both biological sources (microorganisms or roots) or physical factors
(volatilisation) seem involved in these responses.

Chapter 4 On-line screening of soil VOCs responses to moisture, temperature and root presence
152
Most VOCs increase their soil uptake at higher soil moistures. This was the
response of formaldehyde, methanol, acetaldehyde, ethanol, acetone, hexanol +
hexenol, monoterpenes, M93 and M155. Also greater uptake in presence of roots than
in their absence was the common trend in VOCs such acetic acid, (E)-2-hexenal,
benzene, xylene, p-cymene, C10 unsaturated alcohols, acetone, monoterpenes, M93 and
M123 during the soil moisture treatment.
During the soil temperature treatment, an increasingly positive VOC exchange
rate in response to increases in temperature was the principal trend detected in ethyl
acetate, PPN, C10 unsaturated alcohols, C12 aldehydes, hexenol, p-cymene and M195,
among other masses. Similarly to the soil moisture treatment, greater compound uptake
in presence of roots than in their absence (e. g. in hexenol, C9 aldehydes, p-cymene,
C11 unsaturated alcohols, C13 unsaturated alcohols and M109) was the principal trend
when increasing soil temperature.
Results confirm the link between roots and microbial activity, especially when
soil moisture was the limiting factor. We suggest that the role of roots on soil VOCs
exchange was indirect by releasing exudates which enhanced microbial VOCs
consumption activities.
VOCs showed low exchange rates. Methanol was the most uptaken compound
because it presented the highest concentration in air, and also possibly due to the
activity of aerobic methanotrophic bacteria, which are frequent in rhizosphere and
phyllosphere.
Coupled GCM and ecophysiology models predict soil warming and lower water
availability in the Mediterranean region (IPCC 2001; Sabaté et al., 2002; Peñuelas et al.,
2005a) for the next decades. Our results suggest an enhancement of some soil VOCs
emission in response to this increase in soil temperature and the reduction of soil VOCs
uptake in response to low water availability. Although our results suggest a small
significance of these soil VOCs exchange for the atmospheric chemistry, the climate
change effects on soil VOCs exchange could significantly influence soil ecology. A
wide variety of interactions might occur, so further research is warranted in this area.

Chapter 4 On-line screening of soil VOCs responses to moisture, temperature and root presence
153
Supplementary material.
Supplementary Table 1. Soil VOC exchange rates measured during the soil moisture treatment. Examples of compounds which showed a significant exchange rate response to soil moisture increases and to the roots presence. Data are means ± SEM; n=3 in ‘soil’ and ‘soil + plant’ pots. Significance for the overall effect of the soil moisture treatment and the roots presence (ANOVA) is indicated for each mass.
significance 5% 12.5% 20% 27.5% Moisture Roots soil soil+plant soil soil+plant soil soil+plant soil soil+plant M31 (formaldehyde) p=0.05 -0.0322±0.0019 -0.0314±0.0026 -0.0307±0.0037 -0.0290±0.0021 -0.0337±0.0019 -0.0356±0.0028 -0.0352±0.0039 -0.0413±0.0034
M33 (methanol) p<0.01 0.1240±0.1575 -0.2792±0.1561 -0.6283±0.2916 -0.6422±0.0917 -0.6384±0.1285 -0.5760±0.1061 -0.5918±0.0768 -0.8051±0.1686
M43 (acetic acid) p<0.05 0.1851±0.0421 -0.0211±0.0351 -0.0793±0.0957 -0.0533±0.4414 -0.0850±0.0358 -0.5342±0.3924 -0.0680±0.0198 -0.4915±0.3303
M45 (acetaldehyde) p<0.05 0.0169±0.0375 0.0113±0.0065 -0.0007±0.0134 -0.0012±0.0113 -0.0264±0.0087 -0.0204±0.0038 -0.0279±0.0061 -0.0328±0.0031
M47 (etanol) p<0.05 -0.0135±0.0055 -0.0096±0.0052 -0.0277±0.0089 -0.0247±0.0046 -0.0546±0.0223 -0.0347±0.0010 -0.0240±0.0079 -0.0361±0.0087
M57 ((E)-2-hexenal) p<0.1 0.0026±0.0125 -0.0030±0.0091 0.0158±0.0066 -0.0010±0.0084 0.0068±0.0044 -0.0058±0.0053 -0.0064±0.0036 -0.0123±0.0036
M59+M41 (acetone) p<0.001 p<0.05 0.4365±0.1681 0.1060±0.0216 0.0516±0.0919 -0.0388±0.0263 -0.0880±0.0186 -0.1402±0.0089 -0.0718±0.0067 -0.1171±0.0086
M79 (benzene) p<0.05 0.0010±0.0005 -0.0005±0.0007 0.0007±0.0013 -0.0016±0.0006 -0.0006±0.0002 -0.0021±0.0008 -0.0015±0.0003 -0.0012±0.0007
M83 (hexanol + hexenol) p=0.1 0.0031±0.0027 0.0054±0.0044 0.0009±0.0005 0.0017±0.0017 0.0001±0.0016 -0.0005±0.0012 -0.0009±0.0008 -0.0018±0.0020
M93 (toluene) p<0.05 p<0.05 0.0065±0.0044 0.0033±0.0019 0.0062±0.0034 -0.0009±0.0006 -0.0010±0.0014 -0.0036±0.0020 0.0007±0.0003 -0.0024±0.0013
M107 (xilene) p<0.05 0.0045±0.0067 -0.0024±0.0009 0.0048±0.0029 -0.0037±0.0013 -0.0008±0.0009 -0.0048±0.0007 -0.0047±0.0011 -0.0049±0.0016
M123 (sesquiterpenes) p<0.1 0.0000±0.0003 0.0001±0.0004 0.0005±0.0006 0.0003±0.0002 0.0005±0.0003 -0.0004±0.0001 0.0004±0.0002 -0.0003±0.0003
M135 (p-cymene) p<0.01 0.0024±0.0019 -0.0006±0.0005 0.0016±0.0005 0.0007±0.0004 0.0017±0.0001 -0.0006±0.0005 -0.0001±0.0005 -0.0011±0.0002
M136 (p-cymene) p<0.1 0.0004±0.0002 0.0001±0.0002 0.0002±0.0002 0.0000±0.0001 0.0002±0.0002 -0.0001±0.0004 0.0004±0.0004 -0.0001±0.0002
M155 (linalool) p<0.05 0.0001±0.0002 -0.0003±0.0002 0.0005±0.0000 0.0003±0.0002 0.0003±0.0000 0.0006±0.0003 0.0002±0.0002 0.0003±0.0002
M157 C10 (unsaturated alcohols) p<0.1 0.0000±0.0003 0.0003±0.0002 0.0000±0.0001 0.0004±0.0001 0.0002±0.0003 0.0003±0.0002 -0.0003±0.0001 0.0002±0.0003

Chapter 4 On-line screening of soil VOCs responses to moisture, temperature and root presence
154
Supplementary Table 2. Soil VOC exchange rates measured during the soil temperature treatment. Examples of compounds which showed a significant exchange rate response to soil temperature increases and to the roots presence. Data are means ± SEM; n=3 in ‘soil’ and ‘soil + plant’ pots. Significance for the overall effect of the soil temperature treatment and the roots presence (ANOVA) is indicated for each mass. (PPN: Peroxypropionic Nitric anhydride). T x R, interaction between temperature and root presence.
significance 10ºC 15ºC 25ºC 35ºC Temperature Roots T x R soil soil+plant soil soil+plant soil soil+plant soil soil+plant M55 (1, 3 butadiene/water cluster) p<0.05 -0.8929±0.3510 -0.6510±0.2609 -0.1959±0.2339 -0.3730±0.1702 -0.3375±0.2798 -0.5824±0.4038 0.0507±0.1176 0.1913±0.2963
M71 (ethyl acetate) p<0.05 -0.0118±0.0034 -0.0105±0.0021 -0.0025±0.0028 -0.0064±0.0053 -0.0047±0.0048 -0.0035±0.0028 -0.0009±0.0030 -0.0002±0.0008
M91 (PPN) p=0.05 -0.0010±0.0013 -0.0010±0.0013 0.0022±0.0015 -0.0012±0.0012 0.0065±0.0049 0.0021±0.0011 0.0051±0.0023 0.0032±0.0014
M103 (hexenol) p<0.01 p<0.05 p<0.05 -0.0006±0.0005 -0.0021±0.0002 0.0004±0.0002 -0.0006±0.0003 -0.0009±0.0001 -0.0004±0.0003 -0.0007±0.0004 -0.0010±0.0002
M109 (sesquiterpenes) p<0.05 -0.0018±0.0019 -0.0038±0.0007 -0.0006±0.0021 -0.0031±0.0003 -0.0006±0.0007 -0.0009±0.0008 -0.0006±0.0017 -0.0040±0.0007
M125 (C9 aldehydes) p<0.05 p<0.05 0.0004±0.0004 -0.0016±0.0002 -0.0002±0.0010 -0.0009±0.0001 0.0011±0.0007 -0.0005±0.0005 -0.0005±0.0001 0.0006±0.0004
M135 (p-cymene) p<0.01 p<0.05 -0.0022±0.0012 -0.0053±0.0005 0.0000±0.0008 -0.0002±0.0011 0.0000±0.0013 -0.0017±0.0007 -0.0020±0.0014 -0.0030±0.0008
M157 (C10 unsaturated alcohols) .p<0.05 -0.0006±0.0005 -0.0011±0.0005 0.0002±0.0003 0.0000±0.0004 0.0002±0.0005 0.0010±0.0002 0.0005±0.0002 -0.0001±0.0003
M167 (C12 aldehydes) p<0.05 -0.0005±0.0001 -0.0005±0.0002 -0.0002±0.0002 0.0001±0.0001 0.0002±0.0003 0.0003±0.0001 0.0001±0.0003 0.0000±0.0002
M171 C11 (unsaturated alcohols) p<0.05 p<0.1 0.0003±0.0003 -0.0006±0.0003 0.0004±0.0002 -0.0001±0.0001 0.0004±0.0003 -0.0003±0.0001 -0.0004±0.0003 0.0001±0.0003
M195 (geranyl acetone) p<0.05 -0.0005±0.0003 -0.0003±0.0001 0.0000±0.0001 -0.0001±0.0001 0.0003±0.0002 0.0002±0.0001 -0.0002±0.0001 0.0001±0.0001
M199 C13 (unsaturated alcohols) p<0.05 -0.0002±0.0001 -0.0004±0.0001 0.0003±0.0001 -0.0002±0.0000 -0.0001±0.0002 -0.0002±0.0002 0.0001±0.0001 -0.0002±0.0001

Chapter 4 On-line screening of soil VOCs responses to moisture, temperature and root presence
155
Acnowledgements
This research was supported by Spanish MEC grants REN2003-04871, and CGL2004-
01402/BOS and CGL2006-04025/BOS. We also gratefully acknowledge the partial
funding by the ISONET European Commission contract MC-RTN-CT-2003-504720,
the ESF program VOCBAS, the ALARM European Commision contract 506675, and a
Fundación BBVA 2004 and a Catalan Government SGR2005-003/12 grants.
References
Akiyama K, Matsuzaki K and Hayashi H 2005 Plant sesquiterpenes induce hyphal branching in arbuscular mycorrhizal fungi. Nature 435, 824-827. Asensio, D., Peñuelas, J., Llusià, J. & Ogaya, R. 2007. Seasonal soil VOC exchange rates in a Mediterranean holm oak forest and their responses to drought conditions. Atmospheric Environment 41, 2456-2466. Boyd D R, Clarke D, Cleij M C, Hamilton J T G and Sheldrake G N 2000 Bacterial biotransformation of isoprene and related dienes. Monat. Chem. 131, (6) 673-685. Chamberlain K, Guerrieri E, Pennacchio F, Pettersson J, Pickett J A, Poppy G M, Powell W, Wadhams L J and Woodcok C M 2001 Can aphid-induced plant signals be transmitted aerially and through the rhizosphere?. Biochem. System. Ecol. 29, 1063-1074.
Chen F, Ro D, Petri J, Gershenzon J, Bohlmann J, Pichersky E and Tholl D 2004 Characterization of a root-specific Arabidopsis terpene synthase responsible for the formation of the volatile monoterpene 1,8-cineole. Plant Physiol. 135, 1956-1966.
Cho C, Sung K, Coapcioglu M Y and Drew M 2005 Influence of water content and plants on the dissipation of chlorinated volatile organic compounds in soil. Water Air Soil Pollut. 167, 259-271. Cleveland C C and Yavitt J B 1998 Microbial consumption of atmospheric isoprene in a temperate forest soil. Appl. Environ. Microbiol. 64, (1) 172-177. Evans A 1998 Biodegradation of 14C-labeled low molecular organic acids using three biometer methods. J. Geochem. Exp. 65, 17-25. Fall R, Karl T, Hansel A, Jordan A and Lindinger W 1999 Volatile organic compounds emitted after leaf wounding: on-line analysis by proton-transfer-reaction mass spectrometry. J. Geophys. Res. 104, 15963–15974.

Chapter 4 On-line screening of soil VOCs responses to moisture, temperature and root presence
156
Hamilton E W, Frank D A 2001 Can plants stimulate soil microbes and their own nutrient supply? Evidence from a grazing tolerant grass. Ecology 82, 2397-2402. Hayward S, Muncey R J, James A E, Halsall C J and Hewitt C N 2001 Monoterpene emissions from soil in a Sitka spruce forest. Atmos. Environ. 35, 4081-4087. Hippelein M and Mclachlan M S 1998 Soil/air partitioning of semivolatiles organic compounds. 1. Method development and influence of physical-chemical properties. Environ. Sci. Technol. 32, (2) 310-316. IPCC 2001. Climate change 2001: The Scientific Basis. Contribution of Working Group I. Third Assessement Report of Intergovernamental Panel on Climate Change. Hougton J T, Dung Y, Griggs D J, Noguer M, Van der Linden P, Dui X, Maskell K, Johnson C A, (Eds). Cambridge University Press, Cambridge, UK. Janson R W 1993 Monoterpene emissions from Scots pine and Norwegian spruce. J. Geophys. Res. Atmos. 98 (D2), 2839-2850. Johnsen A R, Wick L Y and Harms H 2005 Principles of microbial PAH-degradation in soil. Environ. Pollut. 133, 71-84. Keppler F, Harper D B, Rockmann T, Moore R M and Hamilton J T G 2005 New insight into the atmospheric chloromethane budget gained using stable carbon isotope ratios. Atmos. Chem. Phys. 5, 2403-2411. Lindinger W, Hansel A and Jordan A 1998 On-line monitoring of volatile organic compounds at pptv level by means of proton-transfer-reaction mass spectrometry (PTR-MS). Int. J. Mass Spectrom. Ion Proc. 173, 191-241. Mackie A E and Wheatley R E 1999 Effects and incidence of volatile organic compound interactions between soil bacterial and fungal isolates. Soil Biology and Biochemistry 31, (3) 375-385. Misra G, Pavlostathis S G, Perdue E M and Araujo R 1996 Aerobic biodegradation of selected monoterpenes. Appl. Microbiol. Biotechnol. 45, (6) 831-838. Nishida N, Tamotsu S, Nagata N, Saito C and Sakai A 2005 Allelopathic effects of volatile monoterpenoids produced by Salvia leucophylla: Inhibition of cell proliferation and DNA syntesis in the root apical meristem of Brassica campestris seedlings. J. Chem. Ecol. 31, (5) 1187-1203. Nordenhem H and Nordlander G 1994 Olfactory oriented migration through soil by root-living Hylobius abietis (L) larvae (Col, Curculionidae). J. Appl. Entomol. 117, (5) 457-462.

Chapter 4 On-line screening of soil VOCs responses to moisture, temperature and root presence
157
Ogaya R, Peñuelas J, Matínez-Vilalta J, Mangiron M 2003 Effect of drought on diameter increment of Quercus ilex, Phillyrea latifolia, and Arbutus unedo in a holm oak forest of NE Spain. Forest Ecol. Man. 180, 175-184.
Pegoraro E, Abrell L, Van Haren J, Barron-Gafford G, Grieve K A, Malhi Y, Murthy R and Lin G 2005 The effect of elevated atmospheric CO2 and drought on sources and sinks of isoprene ina temperate and tropical rainforest mesocosm. Global Change Biol. 11, 1234-1246. Peñuelas J, Filella I, Sabate S and Gracia C 2005a Natural systems: terrestrial ecosystems. In Report on Climate change in Catalonia. Ed. J.E. Llebot. pp. 517-553. Institut d'Estudis Catalans, Barcelona.
Peñuelas J, Filella I, Stefanescu C and Llusià J 2005b Caterpillars of Euphydryas aurinia (Lepidoptera: Nymphalidae) feeding on Succisa pratensis leaves induce large foliar emissions of methanol. New Phytol. 167, 851-857.
Ping L and Boland W 2004 Signals from the underground: bacterial volatiles promote growth in Arabidopsis. Trends Plant Sci. 9, (6) 263-266. Pignatello J J and Xing B 1996 Mechanisms of slow sorption of organic chemicals to natural particles. Environ. Sci. Technol. 30, (1) 1-11. Ryu C, Farag M A, Hu C, Reddy M S, Wei H, Pare P W, Kloepper J W 2003 Bacterial volatiles promote growth in Arabidopsis. Proc. Natl. Acad. Sci. U.S.A. 100, (8) 4927-4932. Sabate S, Gracia CA, Sanchez A 2002 Likey effects of climate change on growth of Quercus ilex, Pinus halepensis, Pinus pinaster, Pinus sylvestris and Fagus sylvatica forests in the Mediterranean region. Forest Ecol. Manag. 162 (1), 23-37. Schade G W and Goldstein A H 2001 Fluxes of oxygenated volatile compounds from a ponderosa pine plantation. J. Geophys. Res. Atmos. 106, (D3) 3111-3123. Schade G W and Custer T G 2004 OVOC emissions from agricultural soil in northern Germany during the 2003 European heat wave. Atmos. Environ. 38, 6105-6114. Steeghs M, Bais H P, de Gouw J, Goldan P, Kuster W, Northway M, Fall R and Vivanco J M 2004 Proton-transfer-reaction mass spectrometry as a new tool for real time analisys of root-secreted volatile organic compounds in arabidopsis. Plant Physiol. 135, (1) 47-58. Strobel B W 2000 Influence of vegetation on low-molecular-weight carboxylic acids in soil solution-a review. Geoderma 99, 169-198.

Chapter 4 On-line screening of soil VOCs responses to moisture, temperature and root presence
158
Walker T S, Bais H P, Grotewold E and Vivanco J M 2003 Root exudation and rhizosphere biology. Plant Physiol. 132, 44-51. Trotsenko Y A, Ivanova Y A, Ivanova E G and Doronina N V 2001 Aerobic methylotrophic bacteria as phytosymbionts. Microbiology 70, (6) 623-632. Valé M, Nguyen C, Dambrine E and Dupouey J L 2005 Microbial activity in the rhizosphere soil of six herbaceous species cultivated in a greenhouse is correlated with shoot biomass and root C concentrations. Soil Biol. Biochem. 37, 2329-2333. Van Roon A, Parsons J R, Te Kloeze A and Govers H A J 2005 Fate and transport of monoterpenes through soils. Part I. Prediction of temperature dependent soil fate model input-parameters. Chemosphere 61, 599-609. White C S 1994 Monoterpenes-Their effects on ecosystem nutrient cycling. J. Chem. Ecol. 20, (6) 1381-1406. Xu C K, Mo M H, Zhang L M, Zhang K Q 2004 Soil volatile fungistasis and volatile fungistatic compounds. Soil Biol. Biochem. 36, (12) 1997-2004. Yoo S K and Day D F 2002.Bacterial metabolism of alpha-pinene and beta-pinene and related monoterpenes by Pseudomonas sp. Strain PIN. Process Biochem. 37, (7) 739-745.
Chapter 5 The distribution of volatile isoprenoids in the top soil horizons around Pinus halepensis trees
159
Chapter 5
The distribution of volatile isoprenoids
in the top soil horizons around Pinus
halepensis trees in field conditions

Chapter 5 The distribution of volatile isoprenoids in the top soil horizons around Pinus halepensis trees
160

Chapter 5 The distribution of volatile isoprenoids in the top soil horizons around Pinus halepensis trees
161
Abstract
A considerable proportion of rhizosphere sources of volatile isoprenoids may not
diffuse through soil to the atmosphere. However, little is known about the quantitative
and qualitative distribution of volatile isoprenoids in different soil systems. We
measured the terpene concentration in pentane and water extracts from different soil
layers (litter, organic, mineral top, mineral low) and from roots in top and low mineral
layers on a distance gradient from three different Pinus halepensis L. trees.
The litter layer and top and low roots were identified as the largest sources of terpenes
in soil. The most abundant terpenes in soil horizons were α-pinene, β-pinene, sabinene,
β-caryophyllene and α-humulene. Alpha-pinene dominated the total terpene
concentration in top (0.3 ± 0.1 mg g-1 or 38 ± 14 mg m-2) and low roots (0.5 ± 0.2 mg g-
1 or 14 ± 5 mg m-2). However, β-caryophyllene was the most dominant compound in
litter (3 ± 1 mg g-1 or 4336 ± 1002 mg m-2). Alpha-pinene was also the dominant
compound in the top and low mineral soil layers (4.1 ± 1.8 mg g-1 and 3.5 ± 1.7 mg g-1
respectively) but there were also relatively high concentrations of β-caryophyllene (2.3
± 0.8 mg g-1 and 0.7 ± 0.3 mg g-1 in top and low mineral respectively). Terpene
concentration in different soil layers decreased with increasing distance to the trunk, and
this is related to changes in litter and roots type (from pine to grasses) on the distance
gradient. Results suggest that litter could be a less variable source of terpenes for deeper
soil layers than roots. There were differences between the α-pinene distribution and the
distribution of other terpenes in the different soil layers, suggesting that litter of P.
halepensis is probably the main source of the major terpene compounds, and in
addition, long term emissions of α-pinene from P. halepensis roots also contribute to
the α-pinene concentration of rhizosphere soils.
Key words: soil horizons, volatile isoprenoids, Pinus halepensis, Pinus root extracts, Pinus litter extracts,
soil terpene distribution.
Chapter 5 The distribution of volatile isoprenoids in the top soil horizons around Pinus halepensis trees
162
5.1. Introduction
Among the biogenic volatile organic compounds (BVOCs), volatile isoprenoids are the
most abundant VOCs synthesised and emitted by plants. Isoprenoids, which consist of
sequential combinations of a five-carbon structure units, isoprene (C5H8), have
important biochemical, physiological and ecological functions which are essential for
healthy function and survival in plant species (reviewed by Kesselmeier and Staudt,
1999; Owen and Peñuelas, 2005). In this study, we focus on monoterpenes and
sesquiterpenes which are part of the large isoprenoid group and occur in almost all
plants. Monoterpenes have two isoprene units (C10H16) and may be linear (acyclic) or
contain a ring while sesquiterpenes have three isoprene units (C15H24) (Croteu, 1987;
Kesselmeir and Staudt 1999, Peñuelas and Llusià, 2001). They have characteristic
odours and they are only slightly soluble in water. Besides their physiological and
ecological roles, they are emitted in significant amounts to the atmosphere (Guenther et
al 1995; Peñuelas and Llusià, 2001) having significant roles in the chemistry and
physics of the atmosphere (Fehsenfeld et al, 1992; Fuentes et al., 2000; Peñuelas and
Llusià, 2003)
These volatile isoprenoids are also present in soil (White, 1991; 1994; Wheatley
et al., 1996) where they have important ecological roles. They may be involved in
nutrient cycling and may determine the rhizosphere community dynamics and structure.
For example, White (1991, 1994) found certain monoterpenes could inhibit the net
mineralization of nitrogen and net nitrification in soil. Misra et al. (1996) and other
authors (Kleinheinz et al. 1999; Demyttenaere et al. 2000; Vokou et al., 2002; Yoo and
Day 2002; Owen et al., 2007) found monoterpenes from forest-soil extracts and
enriched cultures can be utilized by some soil microflora as growth substrates. These
findings demonstrate the effect of terpenes on the catabolism kinetics of microbial
populations. Volatiles in soil also are key compounds in the interactions between living
soil organisms. Soil VOCs act as infochemicals in plant-insect relations when they are
transmitted through the rhizosphere (Chamberlain et al., 2001; Nordenhem and
Nordlander, 1994), and in plant-plant interactions, as for example when the
monoterpenes produced by Salvia leucophylla have allelopathic effects by inhibiting
cell proliferation and DNA synthesis in the root apical meristem of Brassica campestris
seedlings (Nishida et al., 2005). Other VOC-mediated interaction in soils occur between
bacteria and fungi (Mackie and Wheatley, 1999), in mycorrhiza (Raparinni et al., 2007),
Chapter 5 The distribution of volatile isoprenoids in the top soil horizons around Pinus halepensis trees
163
and between bacteria and plants or fungi and plants (Ruy et al., 2003; Akiyama and
Hayashi, 2006; Splivallo et al. 2007).
A considerable proportion of rhizosphere sources of volatile isoprenoids may not
diffuse through soil to the atmosphere. It has been shown that soil terpene exchange
rates with the atmosphere are low (Hayward et al., 2001; Asensio et al., 2007) and that
observed rates of emission, when there is emission, are lower than those of uptake,
when there is uptake (Asensio et al., 2007). However, little is known about the
quantitative and qualitative distribution of volatile isoprenoids in different soil systems
(White, 1991; 1994). The relative importance of different sources is also not known,
but Janson et al. (1993) suggest roots as a possible source of monoterpenes in soil.
Recently this was supported by measurements of monoterpene emissions in laboratory
experiments from pine roots with qualitative evidence of the existence of monoterpenes
in soils under pine trees (Lin et al., 2007). Previous studies have also explored the effect
of the distance from a tree on the amount of monoterpenes found in the rhizosphere (Lin
et al., 2007) and on microbial monoterpene consumption rates (Owen et al., 2007). Both
studies found evidence of a gradient from high levels of monoterpenes and microbial
consumption at the base of the trunk to lower levels of activity at the furthest distance.
But not much is known about terpenes concentrations in different horizons, on whether
there is a natural undisturbed root or litter source for soil content.
The aims of this work were: (i) to quantify the relative concentrations of
terpenes in different soil layers (litter, organic layer, mineral layer directly underlying
the organic layer, mineral layer 20 cm deep, and root material in the 2 mineral layers),
and along a distance gradient from the trunk of a tree; (ii) to determine the pentane
soluble fraction, i.e. the fraction likely to be colloid bound in the soils system or
extractable from the air space; (iii) to quantify the water soluble fraction, i.e. the
fraction more directly available in aqueous solution to soil microfauna; (iv) to
investigate the effect of two variables that might affect the amount of volatile isoprenoid
in the different soil horizons: namely (1) the fraction by weight of root material in the
two mineral layers, and (2) the amount of litter per unit surface area; and (v) to discern
between roots and litter as sources of soil BVOC concentrations.

Chapter 5 The distribution of volatile isoprenoids in the top soil horizons around Pinus halepensis trees
164
5.2. Material and methods
5.2.1. Study site and experimental design
This study was performed at the campus of the Autonomous University of Barcelona
(41º 30’ N, 2º 6º E) in a 2.3 ha grassland. The vegetation consisted principally in
Leguminosae herbs like Trifolium repens L., Psoralea bituminosa L., Medicago minima
(L.) Bartal., other herbs like Plantago lanceolata L. and grasses (Lolium perenne L.,
Brachypodium phoenicoides R. & S. and Bromus intermedius Guss.). There were also
isolated Pinus halepensis L. trees. The climate is Mediterranean, with wet springs and
autumns and dry winters and summers, with mean annual temperature of 16ºC and
mean annual rainfall of 575 mm. The soil texture type was silty-clay with high
proportion of carbonates (pH 8) and high amounts of organic matter in the first soil
horizons near the Pinus trees. The three pines showed similar ground surface covered by
the crown vertical projection (mean large diameter = 18 m, mean small diameter = 10
m) and were of similar age (mean trunk diameter = 1.27 m). In each transect we marked
3 sampling points: point 1 which was nearest to the trunk, point 2 at 3 m from the trunk
and point 3 which was furthest from the trunk, at 10 m. At each point, we collected soil
material from the different horizons (litter, organic, mineral top, mineral low), and roots
material from both top and low mineral horizons. All transects carried out were on the
same direction E-W.
5.2.2. Field sampling
The field sampling was carried out during autumn, between the end of September 2006
and the middle of November 2006. Tree 2 soil samples were collected first on
September 21, 26 and 29 (one transect per day), followed by transect replicates of tree 1
(October 23, 25 and 29) and finally tree 3 (November 9, 15 and 17). All transects were
sampled in the morning of sunny or slightly cloudy days, between 9 am and 13 pm
At each point, a 0.0625 m2 quadrat was placed on the soil surface and the total
amount of litter and organic layers within the quadrat was collected. Below the organic
layer, a sample of mineral soil material was collected at approximately 0-10 cm depth.
Part of this top mineral soil sample was sieved (5 mm sieve) in the field immediately
after collection for terpene extraction analyses in the laboratory. All the visible root
material in the sieved subsample were removed immediately, to avoid terpene
contamination of the mineral soil subsamples by broken roots. Then all the top mineral

Chapter 5 The distribution of volatile isoprenoids in the top soil horizons around Pinus halepensis trees
165
roots with diameter > 0.5 mm present in the area enclosed by the quadrat were collected.
The top 20 cm depth of soil was then removed and the same procedure was repeated at a
level 20-30 cm below the surface (“low mineral”). Soil layers and root material
collected for terpene extractions were placed in separate sealed glass jars, and stored in
a cool chamber (4ºC) prior to terpene extraction (within the following 2 days) and
analyses.
The total amounts of soil material collected in the field at each point and layer
were gathered in trays and weighed in the laboratory. To determine the density of the
soil litter and organic layers (total mass of the soil layer per area unit) we added the total
mass in the trays and jars and divided by the area of the quadrat. After weighing the
total, a fraction of fresh soil material from each layer was separated to determine water
content of each layer. Water content was calculated as the difference between the fresh
soil material weight and the dry soil material weight after 5 days in an oven at 60ºC. At
each sample point, soil temperature was measured with a soil digital thermometer (TO
15, Jules Richard instruments, Argenteuil, France) at 10 cm depth, just beside the four
corners of each quadrat to avoid mechanical disturbances to the enclosed soil. At the
same time, soil moisture was measured with a HH2 soil moisture meter connected to a
ML2x soil moisture sensor (Delta-T Devices Ltd, Cambridge, England) at 10 cm depth.
5.2.3. Pentane and water solutions for terpene extraction
For pentane extracts, we first prepared a concentrated standard with 50 ml of pure
pentane and 160 μL of internal standard dodecane (99% Sigma-Aldrich). 2 ml of this
pentane concentrated solution were made up to volume in a 200 ml flask with pure
pentane to achieve a final concentration of 1.4·10-4 mol L-1 for the internal standard.
Distilled water was spiked with dodecane in a similar way for the water extracts. Both
pentane and water spiked with internal standard were shaken manually and stored in the
cool chamber (4ºC) until needed for terpene extraction. A new stock was made prior to
extracting samples for each transect. The spiked solvents were shaken thoroughly before
each sample extraction.
5.2.4. Terpene extraction method
Litter and organic layers and root material were placed in Teflon tubes with liquid
nitrogen, and crushed mechanically with a Teflon embolus in order to facilitate
extraction of terpenes. Sieved soil mineral layers did not need previous mechanical

Chapter 5 The distribution of volatile isoprenoids in the top soil horizons around Pinus halepensis trees
166
extraction treatment. The amount of material extracted for litter, organic, mineral and
root layers was 2, 3, 10 and 2 g. respectively. For pentane and water extracts, 5 ml of
the spiked pentane (or deionised water) was added. Further 5 ml pure pentane (or
deionised water) were added. After shaking manually, samples were placed in a
mechanical shaking water-bath (WNB 7-45 Memmert, Schawabach, Germany) for 1 h
at 25 ºC. Samples were then centrifuged for 15 min at 10000 rpm and 5-10ºC in order to
separate the liquid and solid phases. The liquid phase of pentane extracts were then
passed through a Pasteur pipette filled with anhydrous sodium sulphate in order to
remove water remaining in the extract. The pentane extracts were put into opaque vials
and stored at -30ºC until GC-MS analyses. After the centrifuging of water extracts, the
decanted liquid phase was mixed with 3 ml of pure pentane in a second centrifuge tube
which was sealed and manually shaken, then shaken again in a water bath at 25 ºC and
centrifuged to transfer terpenes extracted from soil and roots material from the water to
the pentane phase. After the final centrifuging of the water extracts, the top liquid phase
(pentane) was pipetted out and passed through two anhydrous sodium sulphate columns
to ensure that no water remained in the pentane phase. Finally, water extracts in pentane
were decanted into opaque amber glass vials and stored at -30ºC until GC-MS analyses.
5.2.5. GC-MS analyses of terpenes
Soil terpene extract analyses were conducted using a GC-MS (Hewlett Packard
HP59822B; Palo Alto, CA, USA). 3 μL of the extract were injected automatically by an
automatic sample processor (FOCUS) (ATAS GL International BV 5500 AA
Veldhoven, The Netherlands) in an OPTIC3 injector (ATAS GL International BV 5500
AA Veldhoven, The Netherlands) into a 30 m x 0.25 x 0.25 mm film thickness capillary
column (HP-5, Crosslinked 5% pH Me Silicone; Supelco Inc.). The injector temperature
(200ºC) was increased at 5 ºC s-1 to 300ºC. The injected sample was cryofocused at -
20ºC for 2 min. After this time, the cryotrap was heated rapidly to 200 ºC. The column
temperature (60 °C) was increased at 10 ºC min-1 to 150 ºC, and then at 40 ºC min-1 to
270 ºC. Helium flow was 0.7 mL min-1. Total run time was 20 min and the solvent delay
was 4 min. Identification of terpenes was conducted by GC-MS and by comparison with
standards from Fluka (Buchs, Switzerland), literature spectra, using GCD Chemstation
G1074A HP. Frequent calibration with standards of common terpenes (α-pinene, 3-
carene, β-pinene, β-myrcene, p-cymene, limonene and sabinene) once every five
Chapter 5 The distribution of volatile isoprenoids in the top soil horizons around Pinus halepensis trees
167
analyses was used for quantification and QA. Terpene calibration curves (N=4 different
terpene concentrations) were always highly significant (r2 > 0.99) in the relationship
between signal and terpene concentration. The most abundant terpenes had very similar
sensitivity (differences were less than 5%). In order to detect possible column
contamination during the analyses, a blank sample of pure pentane was injected and
analysed twice, prior to start the GC-MS analysis and at the end of the analyses for each
tree. For determining the Method Detection Limit (MDL) we analysed 7 samples of
concentration near the expected limit of detection. The standard deviation was then
determined. The one-sided t distribution (six degrees of freedom t value = 3.14) was
multiplied versus the determined standard deviation. This value resulted 5 ng on column
and analyses of amounts in samples ≤ 5 g were considered as 0 g.
5.2.6. Statistical analyses
Analyses of variance (ANOVA) were conducted with terpenes concentration as the
dependent variable and with soil layer and transect position as the independent factors.
Correlation analyses were carried out between mean concentrations of compounds in
the top and low mineral layers and total amounts of those compounds in a) litter b) roots
in the low mineral layer and c) roots in the top mineral layer were carried out. These
analyses were performed with the Statview software package (Abacus Concepts Inc.,
Cary, North Carolina, USA) and the Statistica software package (StatSoft, Inc. Tulsa,
Oklahoma). Differences were considered significant at a probability level of P < 0.05.
Cluster analysis of terpene concentration of pine soils was performed using non-
standardized Euclidean distance for measuring multi-dimensional distance between
points, and single linkage method was used for the clustering process (Statistica
Statsoft, Inc. Tulsa, Oklahoma). The distance matrix between the different terpene
compounds was calculated with mean concentration of each terpene in the top mineral
layer, mean total concentration in the litter layer, mean total concentration in the top
roots and mean total concentration in the low roots as input data. The data were
transformed where necessary to appropriate units, so that the order of magnitude of the
range of values of input data was minimised.

Chapter 5 The distribution of volatile isoprenoids in the top soil horizons around Pinus halepensis trees
168
Table 5.1. Concentration of pentane and water extractable terpenes (μg g-1 of fresh material) within a horizon soil collections from 3 pine tree soil and in a distance gradient (0 m, 3 m and 10 m) from the trunk of the pine. Values are means ± SE (N=3 replicates per horizon in each sampling distance point). Blank spaces represent the absence of a soil horizon at one distance point. Within a column in each tree, values followed by different letters are significantly different (Post-hoc tests, P<0.05 according to the Fisher’s test). Horizons in different distance positions followed by different letters in parentheses are significantly different (Post-hoc tests, P<0.05 according to the Fisher’s test).
PENTANE EXTRACTS sample concentration μg g-1 of fresh material
α-pinene sabinene β-pinene β-caryophyllene α-humulene
Tree 1 0 m 3 m 10 m 0 m 3 m 10 m 0 m 3 m 10 m 0 m 3 m 10 m 0 m 3 m 10 m Litter 1422.8±503.6 b (b) 288.9±32.2 a (a) 64.0±25.2 a (a) 366.1±79.2 b (b) 135.8±27.9 b (a) 15.6±8.0 b (a) 545.6±142.4 b (b) 90.6±16.7 b (a) 8.7±7.3 a (a) 429.4±55.8 b (a) 236.5±25.9 b (b) 34.3±13.5 b (c) 2161.9±465.9 b (b) 804.6±73.0 b (a) 211.8±94.7 b (a)
LM 2.7±1.6 a (a) 0.8±0.7 a (a) 0.0±0.0 a (a) 0.0±0.0 a 0.0±0.0 a 0.0±0.0 a 0.0±0.0 a 0.0±0.0 a 0.0±0.0 a 0.0±0.0 a 0.0±0.0 a 0.0±0.0 a 0.0±0.0 a 0.0±0.0 a 0.0±0.0 a
LR 674.3±133.5 ab (ab) 985.6±451.8 b (b) 2.2±2.2 a (a) 3.4±3.4 a (a) 0.0±0.0 a (a) 0.0±0.0 a (a) 45.5±14.9 a (a) 55.7±27.9 b (a) 0.0±0.0 a (a) 0.0±0.0 a 0.0±0.0 a 0.0±0.0 a 27.2±9.2 a (b) 10.2±8.9 a (ab) 0.0±0.0 a (a)
TM 4.7±1.0 a (b) 2.3±1.5 a (ab) 0.0±0.0 a (a) 0.1±0.1 a (a) 0.0±0.0 a (a) 0.0±0.0 a (a) 0.9±0.9 a (a) 2.2±2.2 a (a) 0.0±0.0 a (a) 0.0±0.0 a (a) 0.7±0.7 a (a) 0.0±0.0 a (a) 1.3±1.3 a (a) 1.4±1.4 a (a) 0.0±0.0 a (a)
TR 730.1±373.8 ab (a) 179.6±113.8 a (a) 69.4±69.4 a (a) 0.8±0.8 a (a) 0.0±0.0 a (a) 0.0±0.0 a (a) 29.0±15.2 a (a) 11.8±5.9 a (a) 3.2±3.2 a (a) 0.0±0.0 a 0.0±0.0 a 0.0±0.0 a 8.3±8.3 a (a) 0.4±0.4 a (a) 0.0±0.0 a (a)
Organic 162.2±142.0 a (a) 29.4±17.6 a (a) 40.1±11.7 a (a) 5.9±3.6 a (b) 1.6±0.8 a 8a) 1.0±1.0 a (a) 29.0±5.8 a (a) 7.7±1.5 a (b) 87.5±31.5 a (a) 8.0±2.4 a (a)
Tree 2 0 m 3 m 10 m 0 m 3 m 10 m 0 m 3 m 10 m 0 m 3 m 10 m 0 m 3 m 10 m Litter 841.2±197.9 b (b) 780.5±171.0 b (b) 153.0±13.8 b (a) 440.3±127.3 b (b) 357.6±140.4 b (ab) 59.3±13.5 b (a) 727.1±255.5 b (a) 604.4±210.1 b (a) 86.7±14.9 b (a) 6163.8±1483.4 b (b) 4544.0±990.6 b (ab) 1817.2±173.1 b (a) 1483.4±285.0 b (b) 1114.1±273.8 b (ab) 386.7±35.3 b (a)
LM 22.8±11.1 a (b) 3.8±1.9 a (ab) 0.0±0.0 a (a) 0.1±0.1 a (a) 0.0±0.0 a (a) 0.0±0.0 a (a) 0.5±0.5 a (a) 0.0±0.0 a (a) 0.0±0.0 a (a) 3.8±2.1 a (a) 0.2±0.1 a (a) 0.0±0.0 a (a) 0.3±0.3 a (a) 0.0±0.0 a (a) 0.0±0.0 a (a)
LR 815.7±406.7 b (a) 117.2±93.6 a (a) 0.0±0.0 a (a) 14.5±7.3 a (a) 0.6±0.6 a (a) 0.0±0.0 a (a) 64.6±20.1 a (b) 1.7±1.4 a (a) 0.0±0.0 a (a) 77.5±32.8 a (a) 13.7±12.2 a (a) 11.0±11.0 a (a) 13.1±6.3 a (b) 0.4±0.4 a (a) 0.0±0.0 a (a)
TM 23.8±11.9 a (a) 1.5±0.7 a (a) 0.0±0.0 a (a) 1.3±0.4 a (b) 0.1±0.1 a (a) 0.0±0.0 a (a) 1.0±0.5 a (b) 0.0±0.0 a (a) 0.0±0.0 a (a) 1.8±0.7 a (a) 1.3±0.3 a (a) 3.1±1.3 a (a) 0.1±0.1 a (a) 0.0±0.0 a (a) 0.2±0.2 a (a)
TR 910.4±106.6 b (b) 440.6±326.6 ab (ab) 0.0±0.0 a (a) 11.1±2.4 a (b) 4.9±4.9 a (ab) 0.0±0.0 a (a) 111.0±18.9 a (b) 50.3±44.3 a (ab) 0.0±0.0 a (a) 84.2±20.1 a (b) 18.1±11.8 a (a) 4.3±2.3 a (a) 15.5±3.6 a (b) 2.4±2.2 a (a) 0.0±0.0 a (a)
Organic 4.4±2.2 a (a) 24.3±15.6 a (a) 12.7±4.2 a (a) 10.4±2.6 a (a) 1.4±0.7 a (a) 3.0±1.5 a (a) 62.1±33.9 a (a) 49.4±4.2 a (a) 10.7±6.6 a (a) 7.9±0.7 a (a)
Tree 3 0 m 3 m 10 m 0 m 3 m 10 m 0 m 3 m 10 m 0 m 3 m 10 m 0 m 3 m 10 m Litter 807.7±79.7 ab (a) 416.4±114.1 b (b) 32.7±86.2 b (a) 242.9±62.3 b (a) 81.6±6.6 a (a) 43.9±11.3 b (b) 6136.2±2495.8 b 5466.4±1364.5 b 1590.2±715.3 b (a) 1393.3±362.7 b (a)
LM 1.6±0.6 a (b) 0.1±0.1 a (a) 0.0±0.0 a (a) 0.2±0.2 a (a) 0.0±0.0 a (a) 0.0±0.0 (a) 0.0±0.0 a 0.0±0.0 a 0.0±0.0 1.7±1.7 a (a) 1.0±0.5 a (a) 0.0±0.0 (a) 0.2±0.2 a (a) 0.0±0.0 a (a) 0.0±0.0 (a)
LR 1763.0±878.9 bc (a) 163.1±80.3 a (a) 5.6±5.6 a (a) 41.0±27.8 a (a) 0.1±0.1 a (a) 0.0±0.0 (a) 77.2±45.4 a (a) 5.0±1.2 a (a) 0.0±0.0 (a) 242.6±137.2 a (a) 27.8±14.7 a (a) 0.0±0.0 (a) 41.5±26.6 a (a) 4.5±2.3 a (a) 0.0±0.0 (a)
TM 4.0±0.7 a (a) 0.2±0.2 a (a) 0.0±0.0 a (a) 1.9±1.0 a (a) 0.0±0.0 a (a) 0.0±0.0 (a) 0.0±0.0 a 0.0±0.0 a 0.0±0.0 8.8±5.9 a (a) 5.2±2.8 a (a) 0.0±0.0 (a) 7.2±7.2 a (a) 1.8±1.8 a (a) 0.0±0.0 (a)
TR 590.6±300.9 cd (a) 26.5±13.5 a (a) 5.0±5.0 a (a) 15.2±6.6 a (b) 0.0±0.0 a (a) 0.0±0.0 (a) 125.9±103.0 a (a) 0.5±0.5 a (a) 0.0±0.0 (a) 78.0±39.9 a (a) 4.9±2.5 a (a) 0.0±0.0 (a) 15.9±9.3 a (a) 0.6±0.6 a (a) 0.0±0.0 (a)
Organic 16.1±5.4 ad (a) 9.3±2.6 a (a) 62.7±41.2 a (a) 15.0±6.4 a (a) 0.1±0.1 a (a) 5.4±5.4 a (a) 62.4±31.9 a (a) 201.4±60.3 a (a) 13.6±7.9 a (a) 41.3±8.6 a (a)

Chapter 5 The distribution of volatile isoprenoids in the top soil horizons around Pinus halepensis trees
169
WATER EXTRACTS sample concentration μg g-1 of fresh material.
α-pinene sabinene β-pinene β-caryophyllene α-humulene
Tree 1 0 m 3 m 10 m 0 m 3 m 10 m 0 m 3 m 10 m 0 m 3 m 10 m 0 m 3 m 10 m
Litter 2.6±2.6 a (a) 0.0±0.0 (a) 0.3±0.3 a (a) 0.0±0.0 0.0±0.0 0.0±0.0 0.5±0.5 a (a) 0.0±0.0 (a) 0.0±0.0 (a) 53.5±23.9 b (b) 9.7±6.3 a (ab) 1.1±0.6 a (a) 5.0±3.4 a (a) 0.0±0.0 (a) 0.0±0.0 (a)
LM 0.0±0.0 a 0.0±0.0 0.0±0.0 a 0.0±0.0 0.0±0.0 0.0±0.0 0.0±0.0 a 0.0±0.0 0.0±0.0 0.0±0.0 a 0.0±0.0 a 0.0±0.0 a 0.0±0.0 a 0.0±0.0 0.0±0.0
TM 0.0±0.0 a 0.0±0.0 0.0±0.0 a 0.0±0.0 0.0±0.0 0.0±0.0 0.0±0.0 a 0.0±0.0 0.0±0.0 0.0±0.0 a 0.0±0.0 a 0.0±0.0 a 0.0±0.0 a 0.0±0.0 0.0±0.0
Organic 0.0±0.0 a 0.0±0.0 0.0±0.0 0.0±0.0 0.0±0.0 a 0.0±0.0 0.0±0.0 a 0.0±0.0 a 0.0±0.0 a 0.0±0.0
Tree 2 0 m 3 m 10 m 0 m 3 m 10 m 0 m 3 m 10 m 0 m 3 m 10 m 0 m 3 m 10 m
Litter 1.0±0.5 b (a) 0.4±0.3 a (a) 0.0±0.0 (a) 0.2±0.2 a (a) 0.0±0.0 (a) 0.0±0.0 (a) 0.4±0.3 a (a) 0.0±0.0 (a) 0.0±0.0 (a) 2.8±1.5 a (a) 1.7±0.4 b (a) 3.7±3.4 a (a) 1.2±0.6 b (a) 0.5±0.2 b (a) 1.1±1.1 a (a)
LM 0.0±0.0 a 0.0±0.0 a 0.0±0.0 0.0±0.0 a 0.0±0.0 0.0±0.0 0.2±0.2 a 0.0±0.0 (a) 0.0±0.0 (a) 0.0±0.0 a 0.0±0.0 a 0.0±0.0 a 0.0±0.0 a 0.0±0.0 a 0.0±0.0 a
TM 0.0±0.0 a 0.0±0.0 a 0.0±0.0 0.0±0.0 a 0.0±0.0 0.0±0.0 0.0±0.0 a 0.0±0.0 0.0±0.0 0.0±0.0 a 0.0±0.0 a 0.0±0.0 a 0.0±0.0 a 0.0±0.0 a 0.0±0.0 a
Organic 0.0±0.0 a 0.0±0.0 a 0.0±0.0 a 0.0±0.0 0.0±0.0 a 0.0±0.0 0.0±0.0 a 0.0±0.0 a 0.0±0.0 a 0.0±0.0 a
Tree 3 0 m 3 m 10 m 0 m 3 m 10 m 0 m 3 m 10 m 0 m 3 m 10 m 0 m 3 m 10 m
Litter 1.1±0.6 a (a) 2.0±1.7 a (a) 0.0±0.0 0.0±0.0 a 0.2±0.2 a (a) 0.0±0.0 (a) 22.5±4.3 b (a) 15.8±0.4 b (a) 3.1±1.2 b (a) 1.6±0.5 b (a)
LM 0.3±0.3 a (a) 0.1±0.1 a (a) 0.2±0.1 a (a) 0.0±0.0 0.0±0.0 a 0.0±0.0 0.0±0.0 a 0.0±0.0 0.0±0.0 0.0±0.0 a 0.0±0.0 a 0.0±0.0 0.0±0.0 a 0.0±0.0 a 0.0±0.0
TM 0.0±0.0 a (a) 0.0±0.0 a (a) 0.4±0.3 a (a) 0.0±0.0 (a) 0.1±0.1 a (a) 0.0±0.0 (a) 0.0±0.0 a 0.0±0.0 0.0±0.0 0.0±0.0 a 0.0±0.0 a 0.0±0.0 0.0±0.0 a 0.0±0.0 a 0.0±0.0
Organic 0.0±0.0 a (a) 0.1±0.1 a (a) 0.0±0.0 0.0±0.0 a 0.0±0.0 a 0.0±0.0 0.0±0.0 a 0.0±0.0 a 0.0±0.0 a 0.0±0.0 a
Chapter 5 The distribution of volatile isoprenoids in the top soil horizons around Pinus halepensis trees
170
5.3. Results
5.3.1. Terpene concentration in soil layers and soil roots
Table 5.1 gives an overview of the concentrations of different compounds extracted
from each soil layer or root sample. The organic layer at 10 m distance from the tree
was absent for all trees. The litter was absent at 10 m distance only for tree 3.
The monoterpenes α-pinene, sabinene and β-pinene and the sesquiterpenes β-
caryophyllene and α-humulene were the most abundant terpenes found in water and
pentane extracts. As expected from their solubility, terpenes concentration in pentane
extracts was higher than in water extracts (Table 5.1). We found relatively high
concentrations of β-caryophyllene in water extracts from litter layers at 0 and 3 m
distance, especially for trees 1 and 3.
5.3.2. Terpene concentration distribution in horizontal gradients.
Terpene concentrations measured in different soil layers and root extracts decreased
from transect position 1 (closest point to the trunk) to transect position 3 (at 10 m
distance, the most distant from the trunk; Fig. 5.1). Significant differences between
transect positions were found for α-pinene concentration (0 m > 3 m, P<0.05; 0 m > 3
m; P<0.005; Fig. 5.1), but differences between transect positions for other compounds
were not significant, probably because there was large variability in measured
concentrations.
5.3.3. Terpene concentration distribution in vertical gradients.
Higher α-pinene concentrations were found in extracts of litter layers, roots and organic
layers than in mineral layers (Fig. 5.1). Significant differences in the terpene
concentration between layers, all trees and all points considered together, are shown in
the first five columns of Table 5.2. As expected, we found significant differences in α-
pinene concentration between the litter and mineral layers (comparisons 1 and 3, Table
5.2) and between the mineral layers and the low roots (comparisons 6 and 10, Table
5.2). We found only marginal significant differences between α-pinene concentration in
top roots and both mineral layers (comparisons 8 and 13, 0.05<P<0.06), indicated by an
asterisk Table 5.2. We also expected to find significant differences between α-pinene
concentration in the two mineral layers and the organic layer (comparisons 9 and 14,
Chapter 5 The distribution of volatile isoprenoids in the top soil horizons around Pinus halepensis trees
171
Table 5.2) but measurements showed high variability (Table 5.1) resulting in non-
significant differences between these layers. There were no differences in α-pinene
concentration between both top and low mineral layers (comparison 7, Table 5.2).
Comparisons between the layers with high α-pinene concentration showed that there
were no differences between the litter layer, and top and low roots (comparisons 2 and
4, Table 5.2) nor between top and low roots (comparison 11, Table 5.2). Alpha-pinene
concentration in the organic layer extracts was significantly lower than in litter and low
roots extracts (comparisons 5 and 12, Table 5.2), but there were no differences between
α-pinene concentrations in the organic layer and in the top roots (comparison 15, Table
5.2).
For all of the other compounds, sabinene, β-pinene, β-caryophyllene and α-
humulene, we found significantly higher terpene concentration in the litter layer
compared with the other layers and the soil roots extracts. However, there were no
significant differences in concentrations of these compounds between organic layers,
mineral layers, and roots (Fig. 5.1 and Table 5.2).
When each transect position was considered separately, significant differences in
concentrations of all compounds except α-pinene were found for comparisons 1-5,
similar to those found when considering all points together (data not shown). However,
α-pinene concentration in soil layers and roots again showed a different vertical
distribution compared with the other terpenes (comparisons at positions 0 m, 3 m and 10
m, Table 5.2). The significance of differences found in the α-pinene concentration
between soil layers and roots increased when considering transect position at 0 m
separately (column 6, Table 5.2).
5.3.4. Distribution of compounds between top and low mineral layers.
Alpha-pinene concentration in mineral layers showed a significant gradient for distance
from the tree, (P=0.05) but there were no significant differences in concentration
between top and low mineral layers (Table 5.2). Other compounds’ concentration in
mineral layers showed evidence of a distance gradient from the tree although it was
significant only for sabinene (P<0.05). Higher terpene concentration was observed in
the top mineral compared with the low mineral for all compounds (Fig. 5.3) but the
differences were not significant (Table 5.2).

Chapter 5 The distribution of volatile isoprenoids in the top soil horizons around Pinus halepensis trees
172
Table 5.2. Significant differences between concentrations of compounds in different soil layers and roots (all trees considered together).
sabinene β-pinene β-caryophyllene α-humulene α-pinene α-pinene α-pinene α-pinene All points All points All points All points All points 0 m 3 m 10 m 1 litter, mineral low <0,0001 <0,0001 <0,0001 <0,0001 0,001 0,0011 0,0274 0,0021 2 litter, roots low <0,0001 0.00001 <0,0001 <0,0001 ns ns ns 0,0024 3 litter, mineral top <0,0001 <0,0001 <0,0001 <0,0001 0,0011 0,0011 0,0273 0,0021 4 litter, roots top <0,0001 0.0002 <0,0001 <0,0001 ns ns ns 0,0093 5 litter, organic <0,0001 0.0001 <0,0001 <0,0001 0,0052 0,0016 0,0328 ns 6 mineral low, roots low ns ns ns ns 0,0041 0,0007 ns* - 7 mineral low, mineral top ns ns ns ns ns ns ns ns 8 mineral low, roots top ns ns ns ns ns* 0,0091 ns ns 9 mineral low, organic ns ns ns ns ns ns ns ns 10 roots low, mineral top ns ns ns ns 0,0041 0,0007 ns* ns 11 roots low, roots top ns ns ns ns ns ns ns 0,0021 12 roots low, organic ns ns ns ns 0,0160 0,0010 ns 0,0024 13 mineral top, roots top ns ns ns ns ns* 0,0092 ns 0,0021 14 mineral top, organic ns ns ns ns ns ns ns 0,0093 15 roots top, organic ns ns ns ns ns 0,0137 ns ns

Chapter 5 The distribution of volatile isoprenoids in the top soil horizons around Pinus halepensis trees
173
Figure 5.1. Horizontal and vertical gradients of compound concentrations in rhizosphere soils and roots of Pinus halepensis. Mean and SE of all trees. N=3 for all points, for all layers. N=2 for point 3 litter. For each compound, those transect points with the same letter are not significantly different according to the Fisher’s test (P<0.05).
α -pinene
0
500
1000
1500
2000
2500
3000
3500
0 m 3 m 10 m
μg
terp
ene
g-1
mat
eria
l
litterorganicmineral toproots topmineral lowroots low
a
a
b
β-pinene
0
100
200
300
400
500
600
700
800
900
0 m 3 m 10 m
μg
terp
ene
g-1
mat
eria
l
litterorganicmineral toproots topmineral lowroots low
a
a
a
sabinene
0
100
200
300
400
500
600
0 m 3 m 10 m
μg
terp
ene
g-1
mat
eria
l
litterorganicmineral toproots topmineral lowroots low
a
a
a
β-caryophyllene
0
1000
2000
3000
4000
5000
6000
7000
0 m 3 m 10 m
μg
terp
ene
g-1
mat
eria
l
litterorganicmineral toproots topmineral lowroots low
a
a
a
α -humulene
0
500
1000
1500
2000
2500
0 m 3 m 10 m
μg
terp
ene
g-1
mat
eria
l
litterorganicmineral toproots topmineral lowroots low
a
a
a

Chapter 5 The distribution of volatile isoprenoids in the top soil horizons around Pinus halepensis trees
174
5.3.5. Source of compounds in soil.
To investigate the source of the compounds we performed a cluster analysis of terpenes
mean concentration in top mineral layer, litter layer and top and low roots (Fig. 5.2).
Alpha-pinene was the last compound to be incorporated into the cluster, being at a much
greater distance than that separating the other four compounds (Fig. 5.2). To investigate
the source of compounds we also represented mean concentrations of compounds in the
top and low mineral layers as function of total amounts of those compounds in a) litter
b) roots in the low mineral layer and c) roots in the top mineral layer (Fig. 5.3). The
total concentration for litter, top mineral roots and low mineral roots are for the area
enclosed by the quadrat which defined the sample (0.0625 m2) and means are for all
trees and all points. Left panels in figure 5.3 show a strong linear relationship between
mean concentration for all trees, all points and all replicates of β-pinene, sabinene, β-
caryophyllene and α-humulene in the top and low mineral layers plotted against the total
amount of compound in the litter gathered from the quadrat (R2 =0.96 and R2 = 0.93 for
top and low mineral respectively; Fig. 5.3). When α-pinene is included in the plots, the
point for α-pinene lies outside and above the linear relationship defined by the other
compounds. However, the relationships between terpenes concentrations in the top and
low mineral layer with the total amounts of compounds in the roots gathered from the
top and low mineral layers under the quadrat, show that without α-pinene, there is no
relationship (central and right small panels; Fig. 5.3). Unlike the relationships with litter
concentration, including α-pinene in the plots creates a relationship between greater
compound concentration in the top and low mineral layers, and greater compound
concentration in the top and low layer roots (central and right panels; Fig. 5.3).
Comparisons between terpenes concentration in the litter layer and top and low
roots (comparisons 2 and 4, Table 5.2) showed significant higher concentration
(expressed per unit mass of material) in litter than in roots extracts for all compounds,
except for α-pinene. When the mean total terpene concentration (expressed per unit area
of material) in litter, top roots and low roots harvested from the 0.0625 m2 quadrats
were compared (Fig. 5.4) we found that all individual compounds in litter, including α-
pinene, were significantly higher than concentration in roots (two to four orders of
magnitude greater, P<0.05; Fig. 5.4). The relative contribution of each compound to
total concentration was similar in top and low roots, with α-pinene dominating the total
terpene concentration (785 ± 159 mg m-2, 38 ± 14 mg m-2 and 14 ± 5 mg m-2 in litter

Chapter 5 The distribution of volatile isoprenoids in the top soil horizons around Pinus halepensis trees
175
and top and low roots respectively; Fig. 5.4). In litter, however, β-caryophyllene was the
most dominant compound (4336 ± 1002 mg m-2, 3.0 ± 1.6 mg m-2 and 0.7 ± 0.3 mg m-2
in litter and top and low roots respectively; Fig. 5.4). Similar to the profile of
compounds in root extracts, α-pinene was the dominant compound in the top and low
mineral soil layers (4.1 ± 1.8 mg g-1 and 3.5 ± 1.7 mg g-1 respectively; Fig. 5.4), and
there were also relatively high concentrations of β-caryophyllene (2.3 ± 0.8 mg g-1 and
0.7 ± 0.3 mg g-1 in top and low mineral respectively; Fig. 5.4).
Figure 5.2. Dendrogram of the cluster analyses of the different terpene compounds described by their positions in the multi-dimensional space defined by their concentrations in different soil layers. Single linkage was used as amalgamation rule. Multi-dimensional distance between points is measured using non-standardized Euclidean distance.
0 500 1000 1500 2000 2500
Linkage Distance
β-pinene
β-caryophyllene
α-humulene
sabinene
α-pinene

Chapter 5 The distribution of volatile isoprenoids in the top soil horizons around Pinus halepensis trees
176
5.4. Discussion
5.4.1. Terpenes concentration in pentane and water extracts.
The most abundant terpenes in soil horizons and roots extracts around Pinus halepensis
trees reported here (α-pinene, β-pinene, sabinene, β-caryophyllene and α-humulene)
were also noticeable in the composition of monoterpenes exchanged by soil to the
atmosphere in coniferous and ever-green holm oak forests (Hayward et. al. 2001;
Asensio et al. 2007), in the terpenoids composition of Pinus rhizosphere air (Smolander
et al.; 2006; Lin et al., 2007) and in the terpene composition of Pinus roots (White 1991;
Lin et al., 2007). It is noteworthy that we did not find limonene in large amounts in soil
horizons and roots extracts, while it was one of the main contributing compounds to
roots and soil emissions (Hayward et al., 2001; Asensio et al., 2007; Lin et al., 2007;
Owen et al, 2007) and also to the total terpene concentration in Pinus roots, as reported
by Lin et al. (2007). Inter specific differences in the terpenes relative composition
between species studied (P. halepensis, P. pinea, P. sylvestris, Picea sitchensis,
Quercus ilex or Populus tremula) are likely accounting for the different soil terpene
composition.
Alpha-pinene, together with the sesquiterpenes β-caryophyllene and α-
humulene, were particularly high in litter extracts. This is in agreement with the main
terpenes found in Pinus halepensis leaves extracts (Llusià and Peñuelas, 2000; Llusià et
al., 2006). The relative composition of terpenes in needle litter is related with green
needle terpenes composition, although the concentration of different terpenes may
change through time in decomposing needle litter (Kainulainen and Holopainen, 2002).
Previous studies on needle litter and green needle terpenes concentration from Pinus
trees showed significant inter and intra specific differences in the terpenes relative
composition and type (Barnola et al., 1997; Kainulainen and Holopainen, 2002; Semiz
et al., 2007; Thoss et al., 2007). The major differences found between terpenes
concentration in P. halepensis litter here and other authors’ reports for P. sylvestris and
P. caribaea (Barnola et al., 1997; Kainulainen and Holopainen, 2002; Semiz et al.,
2007) are the absence of significant amounts of Δ3-carene and the higher concentration
of sabinene and the sesquiterpenes Beta-caryophyllene and α-humulene in our P.
halepensis litter extracts. β-caryophyllene concentration in litter from trees 2 and 3 was
14 times higher than β-caryophyllene concentration in litter from tree 1 (Table 5.1)
which could be related with large amounts of fungal hyphae growing on litter in trees 2
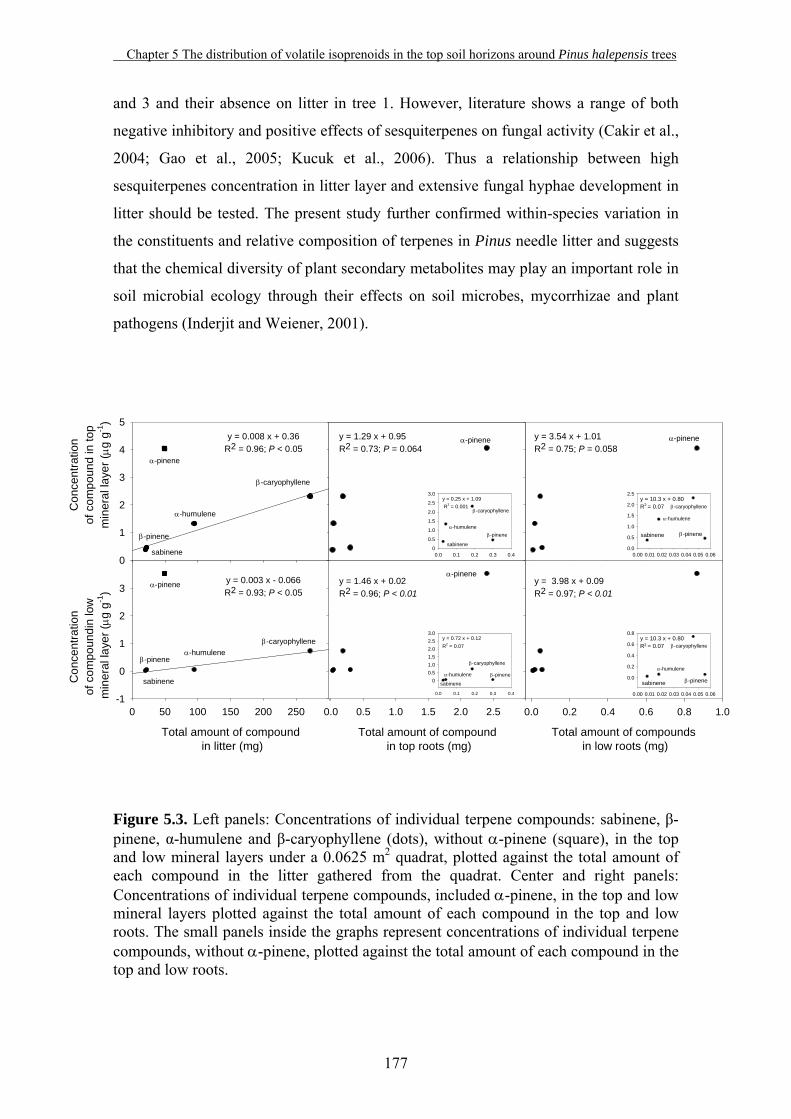
Chapter 5 The distribution of volatile isoprenoids in the top soil horizons around Pinus halepensis trees
177
and 3 and their absence on litter in tree 1. However, literature shows a range of both
negative inhibitory and positive effects of sesquiterpenes on fungal activity (Cakir et al.,
2004; Gao et al., 2005; Kucuk et al., 2006). Thus a relationship between high
sesquiterpenes concentration in litter layer and extensive fungal hyphae development in
litter should be tested. The present study further confirmed within-species variation in
the constituents and relative composition of terpenes in Pinus needle litter and suggests
that the chemical diversity of plant secondary metabolites may play an important role in
soil microbial ecology through their effects on soil microbes, mycorrhizae and plant
pathogens (Inderjit and Weiener, 2001).
Figure 5.3. Left panels: Concentrations of individual terpene compounds: sabinene, β-pinene, α-humulene and β-caryophyllene (dots), without α-pinene (square), in the top and low mineral layers under a 0.0625 m2 quadrat, plotted against the total amount of each compound in the litter gathered from the quadrat. Center and right panels: Concentrations of individual terpene compounds, included α-pinene, in the top and low mineral layers plotted against the total amount of each compound in the top and low roots. The small panels inside the graphs represent concentrations of individual terpene compounds, without α-pinene, plotted against the total amount of each compound in the top and low roots.
Con
cent
ratio
n o
f com
poun
d in
top
min
eral
laye
r (μ g
g-1
)
0
1
2
3
4
5y = 0.008 x + 0.36
R2 = 0.96; P < 0.05α-pinene
β-pinene
sabinene
y = 0.25 x + 1.09R2 = 0.001
α-pinene
0.0 0.1 0.2 0.3 0.40
0.5
1.0
1.5
2.0
2.5
3.0
sabinene
β-pinene
y = 1.29 x + 0.95R2 = 0.73; P = 0.064
α-pinene
0.00 0.01 0.02 0.03 0.04 0.05 0.060.0
0.5
1.0
1.5
2.0
2.5
sabinene β-pinene
y = 10.3 x + 0.80R2 = 0.07
y = 3.54 x + 1.01R2 = 0.75; P = 0.058
y = 0.25 x + 1.09 R2 = 0.001
Total amount of compound in litter (mg)
0 50 100 150 200 250
Con
cent
ratio
n of
com
poun
din
low
m
iner
al la
yer (
μ g g
-1)
-1
0
1
2
3 α-pinene
β-pinene
sabinene
α-humuleneβ-caryophyllene
y = 0.003 x - 0.066R2 = 0.93; P < 0.05
Total amount of compound in top roots (mg)
0.0 0.5 1.0 1.5 2.0 2.5
0.0 0.1 0.2 0.3 0.4
00.51.01.52.02.53.0
α-pinene
α-humulene
sabinene
β-caryophyllene
β-pinene
y = 1.46 x + 0.02R2 = 0.96; P < 0.01
y = 0.72 x + 0.12R2 = 0.07
Total amount of compounds in low roots (mg)
0.0 0.2 0.4 0.6 0.8 1.0
y = 3.98 x + 0.09R2 = 0.97; P < 0.01
0.00 0.01 0.02 0.03 0.04 0.05 0.06
0.0
0.2
0.4
0.6
0.8
sabinene β-pinene
y = 10.3 x + 0.80R2 = 0.07
α-humulene
β-caryophyllene
α-humulene
β-caryophyllene
α-humulene
β-caryophyllene
α-humulene
β-caryophyllene

Chapter 5 The distribution of volatile isoprenoids in the top soil horizons around Pinus halepensis trees
178
Not surprisingly, terpene concentrations in soil and roots were higher in pentane
than in water extracts because non-oxygenated terpenes are only slightly soluble in
water (Weidenhamer et al., 1993). The overall biodegradation rate of a sorbed organic
chemical will be kinetically limited by the rate of diffusion (Liu et al., 2007). This
means that in the soil system liquid phase (i.e. the aqueous medium), terpene
availability is lower than for other water soluble and biodegradable compounds (e.g.
ethanol and methanol). However, small amount of terpenes will be partitioned into the
aqueous phase because of the slight water-solubility. The relatively high water
solubility of β-caryophyllene in the litter layer shown by water extracts is an interesting
finding because soil microorganisms are likely to obtain their carbon source in the
aqueous phase. β-caryophyllene therefore may represent an accessible source of carbon
for soil microbes, but further research is needed into soil microorganism metabolism to
confirm this hypothesis. Miller and Allen (2005) proposed a model of biologically
mediated transformation for water insoluble compounds, such as α-pinene, in biofilms.
This model assumes that an enzymatic mediated first step is taking place, changing the
initial insoluble compound into a more soluble compound. Other microorganisms are
then capable of metabolising this more soluble by-product. These authors found that cis-
2,8-p-menthandien-1-ol, the by-product of α-pinene degradation in biofilms, was also
reported as one of several conversion products of myrcene by different strains of
basidiomycetes, and it can also be produced from oxidation of other terpenes. The
results of Miller and Allen (2005) suggest that soil enzyme activity may be linked with
soil microbial terpene degradation and that, although water insoluble, terpenes occurring
naturally in plant tissues and soil solution, may play an important role in soil ecology
(Weidenhamer, 1993; Inderjit and Weiner, 2001).
5.4.2. Evidence of a soil terpene concentration gradient from the trunk of Pinus trees.
In agreement with Lin et al. (2007), our results showed a clear decrease in overall soil
terpene concentration with increasing the distance to the trunk (Fig. 5.1). However, this
finding does not indicate whether tree roots or litter is the main source of terpenes in the
soil system, because terpene concentration of both roots and litter decreased with
increasing distance from the trunk. The horizontal change in litter and roots type from
the tree might explain the interaction found between the distance gradient and the
terpenes concentration in different soil layers, especially for α-pinene (Table 5.2). Thus,
near the tree (transect position 1) we found more Pinus litter and roots with higher α-

Chapter 5 The distribution of volatile isoprenoids in the top soil horizons around Pinus halepensis trees
179
pinene concentration compared with the furthest position at 10 m from the tree (Fig.
5.1), where litter and roots were mostly from herbs, grasses and other non-woody plant
types.
Figure 5.4. Total concentration of α-pinene, β-pinene, sabinene, β-caryophyllene and α-humulene in litter, top and low roots (upper panel) and in top and low mineral layers (lower panel) under 0.0625 m2 quadrats. Values are total average ± SE (N=27). Comparisons between each compound’s concentration in litter, top and low roots (upper panel) and top and between each compound’s concentration in low mineral layers (lower panel) were carried out. Compounds with the same letter were not significantly different according to the Fisher’s test (P<0.05).
Litter Roots Top Roots Low
Tota
l ter
pene
con
cent
ratio
n (m
g m
-2)
0.01
0.1
1
10
100
1000
10000
α-pinene sabineneβ-pinene β-caryophyllene α-humulene
Mineral Top Mineral Low
Tota
l ter
pene
con
cent
ratio
n (m
g g-1
)
0.01
0.1
1
10
bb b
b
b
a
a
aa
a
a
a
a a
a
a
a
a
a
a
a
ba
aa

Chapter 5 The distribution of volatile isoprenoids in the top soil horizons around Pinus halepensis trees
180
Even though both litter and root terpene concentration decreased with increasing
distance from the tree, the decrease was higher for roots than for litter (Fig. 5.1)
suggesting that litter could be a less variable source of terpenes for deeper soil layers.
The horizontal distribution gradient for terpenes in litter and roots might affect the
terpene concentration in organic and mineral layers. In fact, these layers also showed a
decreasing concentration gradient, although the differences were not significant for the
organic layer (Fig. 5.1) and only significant for α-pinene and sabinene in the mineral
layers.
Table 5.3. Ratio of total amount of compounds in litter:total amount of compounds in roots.
litter:roots top litter:roots low α-pinene 14 46 β-pinene 58 385 sabinene 533 1428 β-caryophyllene 1150 2916 α-humulene 1865 4131
5.4.3. Terpenes concentration distribution in soil layers and soil roots.
As expected, the litter layer and top and low roots were identified as the largest sources
of terpenes in soil, because both come from living plant material which is reported to be
rich in terpenoids, among other compounds (Llusià et al. 2006; Lin et al., 2007).
Terpene concentration in green needles reported by Llusià et al. (2006) was
considerably higher than terpenes concentration measured here in soil litter layer
suggesting a huge potential source for soil terpenes in fresh Pinus litter. Actually,
except for α-pinene, the concentrations of all the other terpenes in litter were
significantly higher than concentrations of terpenes measured in other soil layers and
roots. This indicates that litter is the strongest source for the concentrations of sabinene,
β-pinene, β-caryophyllene and α-humulene which are found in the other soil layers
(organic and mineral). Terpenes concentration in litter is susceptible to seasonal changes
due to changes in environmental conditions and decay status throughout the year
(Kainulainen and Holopainen 2002). Therefore, concentration of terpenes in deeper soil

Chapter 5 The distribution of volatile isoprenoids in the top soil horizons around Pinus halepensis trees
181
layers could be dependent on seasonal patterns of litter-fall inputs from the
aboveground parts of the tree to soil surface.
The vertical distribution of α-pinene concentration in soil layers and roots was
different to that found for other terpenes (Table 5.2 and Table 5.3) and provides
evidence about the comparable α-pinene source strengths of litter and roots. At transect
position 1 closest to the trees (0 m), and at the middle position (3 m) litter and roots
were comparable sources of α-pinene, while at the furthest position from the tree (10
m), α-pinene concentration in roots was significantly lower than that of litter (Table
5.3). There were no significant differences between the α-pinene concentration in top
and low roots. However, α-pinene concentration in low roots was higher than in top
roots at 0 m distance and 3 m distance (Fig. 5.1), probably because at these transect
positions the influence of the deep Pinus roots (compared with roots of non-tree
species) was more important than at 10 m distance.
5.4.4. Source and distribution of compounds in top and low mineral layers: litter vs
roots
Although not significant, sabinene, β-pinene, β-caryophyllene and α-humulene each
tended to show higher concentrations in top mineral soils compared with the low
mineral soils, whereas α-pinene showed no difference between top and low mineral
layers (Fig. 5.3). This result demonstrates again the different behaviour of α-pinene
concentration distribution, suggesting that the sources of α-pinene might differ from the
source of other compounds in the mineral layers. The cluster analysis reinforced
difference between the distribution of α-pinene and that of the other terpene compounds
in the different soil layers. Figure 5.3 suggests that the concentration of each compound
(except α-pinene) in the mineral layer is dependent upon its concentration in the litter
above. Because α-pinene lies above the relationship line (left panels Fig. 5.3), it is likely
that there is an extra source of this compound, possibly emissions from roots.
In spite of the extreme care taken during sampling, mechanical damage of roots
while sampling could have affected the results, because disturbances of the root system
cause elevated concentrations of terpenes in the soil atmosphere (Hayward et al., 2001;
Smolander et al., 2006). If the source of α-pinene from root material were from broken
roots, we would expect that β-pinene would also follow the patterns shown by α-pinene
in Fig. 5.3, since both α-pinene and β-pinene concentration showed the same order of
Chapter 5 The distribution of volatile isoprenoids in the top soil horizons around Pinus halepensis trees
182
magnitude in the ratio litter : top roots (Table 5.3). However, this was not the case, so
we suggest that the different distribution of α-pinene in the mineral layers is due to long
term root emission of this compound.
5.5. Concluding remarks
Needle litter of Pinus halepensis is probably the main source of the major terpene
compounds (α-pinene, sabinene, β-pinene, α-humulene, β-caryophyllene) found in the
mineral layers of rhizosohere soil near P. halepensis trees. However, there is evidence
to suggest that long term emissions of α-pinene from P. halepensis roots also contribute
to the α-pinene concentration in rhizosphere soils. We believe that this is the first
experimental evidence in field conditions that natural emissions from roots might be an
active source of monoterpenes in soils. There is a need for further investigations of the
sources dynamics of terpenes in rhizosphere systems, particularly to investigate (1) the
role of mycorrhizal fungi and needle-degrading microorganisms, and (2) conversions
and use of terpenes as carbon sources.
Acknowledgements
This research was supported by Spanish MEC grants CGL2004-01402/BOS and
CGL2006-04025/BOS. We also gratefully acknowledge partial funding by the ISONET
European Commission contract MC-RTN-CT-2003-504720, the European Commision
contract ALARM 506675, the European project NITROEUROPE GOCE017841 and a
Fundación BBVA 2004 and a Catalan Government SGR2005-003/12 grants.
References
Akiyama, K., Hayashi, H. 2006. Strigolactones: Chemical signals for fungal symbionts and parasitic weeds in plant roots. Annals of Botany 97 (6), 925-931. Asensio, D., Peñuelas, J., Llusià, J. & 2007. Interannual and interseasonal soil CO2 efflux and VOC exchange rates in a Mediterranean holm oak forest in response to experimental drought. Soil Biology and Biochemistry 39, 2471-2484.

Chapter 5 The distribution of volatile isoprenoids in the top soil horizons around Pinus halepensis trees
183
Barnola, L. F., Cedeño, A., Hasegawa, M. 1997. Intraindividual variations of volatile terpene contents in Pinus caribaea needles and its possible relationship to Atta laevigata herbivory. Biochemical Systematics and Ecology 25 (8), 707-716. Cakir, A., Kordali, S., Zengin, H., Izumi, S., Hirata, T. 2004. Composition and antifungal activity of essential oils isolated from Hypericum hyssopifolium and Hypericum heterophyllum. Flavour and Fragance Journal 19 (1), 62-68. Chamberlain K, Guerrieri E, Pennacchio F, Pettersson J, Pickett J A, Poppy G M, Powell W, Wadhams L J and Woodcok C M 2001 Can aphid-induced plant signals be transmitted aerially and through the rhizosphere?. Biochem. System. Ecol. 29, 1063-1074. Croteu, R. 1987. Biosynthesis and catabolism of monoterpenoids. Chemical Reviews 87, 929-954. Demyttenaere, J. C. R, Herrera, M. D., De Kimpe, N., 2000. Biotransformation of geraniol, nerol and citral by sporulated surface cultures of Aspergillus niger and Penicillium sp. Phytochemistry, 55 (4), 363-373. Fehsenfeld, F. C. and Coauthors, 1992. Emission of volatile organic compounds from vegetation and the implications for atmospheric chemistry. Global Biogeochemistry Cycles 6,389-430. Fuentes, J.D., Lerdau, M., Atkinson, R., Baldocchi, D., Bottenheim, J.W., Ciccioli, P., Lamb, B., Geron, C., Gu, L., Guenther, A., Sharkey, T.D. & Stockwell, W. 2000. Biogenic hydrocarbons in the atmospheric boundary layer: A review. Bulletin of the American an Meteorological Society 81 (7), 1537-1575. Gao, Y., Jin, Y.J., Li, H.D., Chen, H.J. 2005. Volatile organic compounds and their role on bacteriostasis in five conifer species. Journal of Integrative Plant Biology 47 (4), 499-507. Guenther and Coauthors, 1995. A global model of natural volatile organic compound emissions. Journal of geophysical research 100, 8873-8892. Hayward S, Muncey R J, James A E, Halsall C J and Hewitt C N 2001 Monoterpene emissions from soil in a Sitka spruce forest. Atmos. Environ. 35, 4081-4087. Inderjit and Weiner, J. 2001. Plant allelochemical interference on soil ecology?. Perspectives in Plant Ecology, Evolution and Systematics 4 (1), 3-12. Janson R W 1993 Monoterpene emissions from Scots pine and Norwegian spruce. J. Geophys. Res. Atmos. 98 (D2), 2839-2850. Kainulainen, P., Holopainen, J. K. 2002. Concentrations of secondary compounds in Scots pine needles at different stages of decomposition. Soil Biology and Biochemistry, 34 (1), 37-42.

Chapter 5 The distribution of volatile isoprenoids in the top soil horizons around Pinus halepensis trees
184
Kesselmeir J., Staudt, M. 1999. Biogenic volatile organic compounds (VOC): An overview on emission, physiology and ecology. Journal of Atmospheric Chemistry 33, 23-88. Kleinheinz, G. T., Bagley, S. T., St John W. P., Rughani J. R., McGinnis, G. D. 1999. Characterization of alpha-pinene-degrading microorganisms and application to a bench-scale biofiltration system for VOC degradation. Archives of Environmental Contamination and Toxicology 37 (2), 151-157. Kucuk, M., Gulec, C., Yasar, A., Ucuncu, O., Yayli, N., Coskuncelebi, K., Terzioglu, S., Yayli, N. 2006. Chemical composition and antimicrobial activities of the essential oils of Teucrium chamaedrys subsp chamaedrys, T. orientale var. puberulens, and T. chamaedrys subsp lydium. Pharmaceutical Biology 44 (8), 592-599. Lin, C., Owen, S., Peñuelas, J. 2007. Volatile organic compounds in the rizhosphere of Pinus spp. Soil Biology and Biochemistry 39, 951-960. Liu, L., Tindall, J. A., Friedel, M. J., Zhang, W. 2007. Biodegradation of organic chemicals in soil/water microcosm system: Model development. Water Air Soil Pollution 178, 131-143. Llusià, J. and Peñuelas, J. 2000. Seasonal patterns of terpene content and emission from seven Mediterranean woody species in field conditions. American Journal of Botany 87, 133-140. Llusià, J., Peñuelas, J., Alessio, G., Estiarte, M. 2006. Seasonal contrasting changes of foliar concentrations of terpenes and other volatile organic compounds in four dominant species of a Mediterranean shrubland submitted to a field experimental drought and warming. Physiologia Plantarum 127, 632-649. Mackie, A. E., Wheatley, R. E., 1999. Effects and incidence of volatile organic compound interactions between soil bacterial and fungal isolates. Soil Biology and Biochemistry 31, 375-385. Miller, M. J., Allen, D. G. 2005. Biodegradation of α-Pinene in model biofilms in biofilters. Environmental Science and Technology 39, 5856-5863. Misra, G., Pavlostathis, S.G., Perdue, E.M. & Araujo, R. 1996 Aerobic biodegradation of selected monoterpenes. Applied Microbiology and Biotechnology 45, (6) 831-838. Nishida, N., Tamotsu, S., Nagata, N., Saito, C., Sakai, A., 2005. Allelopathic effects of volatile monoterpenoids produced by Salvia leucophylla: Inhibition of cell proliferation and DNA syntesis in the root apical meristem of Brassica campestris seedlings. Journal of Chemical Ecology 31, 1187-1203. Nordenhem H and Nordlander G 1994 Olfactory oriented migration through soil by root-living Hylobius abietis (L) larvae (Col, Curculionidae). J. Appl. Entomol. 117, (5) 457-462.
Chapter 5 The distribution of volatile isoprenoids in the top soil horizons around Pinus halepensis trees
185
Owen, S., Peñuelas, J. 2005. Opportunistic emission of volatile isoprenoids. Trends in Plant science 10 (9) 420-426. Owen, M.S., Clark, S., Pompe, M. & Semple, K.T. 2007. Biogenic volatile organic compounds as potential carbon sources for microbial communities in soil from the rhizosphere of Populus tremula. FEMS Microbiology Letters 268, 34-39. Peñuelas, J. & Llusia, J. 2001. The complexity of factors driving volatile organic compound emissions by plants. Biologia Plantarum 44, 481-487. Peñuelas, J. & Llusià, J. 2003 BVOCs: Plant defense against climate warming? Trends in Plant Science 8, 105-109. Rapparini, F., Llusià, J., Peñuelas, J. 2007. Effect of arbuscular mycorrhizal (AM) and soil microorganisms colonization on VOC emission by plants. Plant Biology (in press). Ryu, C., Farag, M. A., Hu, C., Reddy, M. S., Wei, H., Pare, P. W., Kloepper, J. W., 2003. Bacterial volatiles promote growth in Arabidopsis. Proceedings of the National Academy of Science of the United States of America 100, (8) 4927-4932. Thoss, V., O’Reilly-Wapstra, J., Iason, G. R. 2007. Assesment and implications of intraspecific and phenological variability in monoterpenes of Scots Pine (Pinus sylvestrys) foliage. Journal of Chemical Ecology 33, 477-491. Semiz, G., Heijari, J., Isik, K., Holopainen, J. K. 2007. Variation in needle terpenoids among Pinus sylvestris L. (Pinaceae) provenances from Turkey. Biochemical Systematics and Ecology 35, 652-661. Smolander, A., Ketola, R. A., Kotiaho, T., Kanerva, S., Suominen, K., Kitunen, V., 2006. Volatile monoterpenes in soil atmosphere under birch and conifers: Effects on soil N transformations. Soil Biology and Biochemistry 38, 3436-3442. Splivallo, R., Novero, M., Bertea, C. M., Bossi, S., Bonfante, P. 2007. Truffle volatiles inhibit growth and induce an oxidative burst in Arabidopsis thaliana. New Phytologist 175 (3), 417–424 Vokou, D., Chalkos, D., Karamanlidou, G., Yiangou, M. 2002. Activation of soil respiration and shift of the microbial population balance in soil as a response to Lavandula stoechas essential oil. Journal of Chemical Ecology 28 (4), 755-768. Weidenhamer, J. D., Macias, F. A., Fischer, N. H., Williamson, G. B. 1993. Just how insoluble are monoterpenes. Journal of Chemical Ecology 19 (8), 1799-1807. Wheatley, R. E., Millar, S. E., Griffiths, D. W. 1996. The production of volatile organic compounds during nitrogen transformations in soils. Plant and Soil 181, 163-167. White, C.S. 1991. The role of monoterpenes in soil-nitrogen cycling processes in ponderosa pine results from laboratory bioassays and field studies. Biogeochemistry 12 (1), 43-68.

Chapter 5 The distribution of volatile isoprenoids in the top soil horizons around Pinus halepensis trees
186
White, C.S. 1994. Monoterpenes-Their effects on ecosystem nutrient cycling. Journal of Chemical Ecology 20, (6) 1381-1406. Yoo, S. K. and Day, D. F.2002.Bacterial metabolism of alpha-pinene and beta-pinene and related monoterpenes by Pseudomonas sp. Strain PIN. Process Biochemistry, 37 (7), 739-745.

General Conclusions
187
General Conclusions

General Conclusions
188

General Conclusions
189
General conclusions
This PhD thesis investigates the exchange rates and the content of volatile organic
compounds (VOCs) and, especially, monoterpenes in the Mediterranean soils, and
estimates possible changes in response to climate change.
The major conclusions are the following ones:
1) Total VOC and monoterpene exchange rates from soil surfaces are low. There is
relatively low soil emissions contribution to total biogenic monoterpene
emissions to the atmosphere on a land area basis. Soil VOC and monoterpene
uptake rates were also low, though comparable with some foliar uptake rates.
Further studies are needed to corroborate these results and the possible
importance of the soil VOCs sink in chemistry-climate models.
2) Results suggest that the water availability reduction and the increase of
temperature expected in the next decades might greatly affect soil VOC
exchange rates to the atmosphere, but longer-term studies are needed to discern
the response of soil VOC exchange rates to climate change. We found that
drought and high temperatures tended to increase soil VOC emission rates.
Results suggest the causes may be more the physical effects on soil features and
VOCs volatility than the effects on soil roots and microorganisms activities.
However, results also showed that drought reduced soil CO2 fluxes, while high
temperature increased them. Thus, drought and warming are affecting several
biological below-ground and above-ground processes which could affect soil
VOCs exchange. The final effect of climate change is not clear but uncoupling
effects to different processes are thus likely to occur.
General Conclusions
190
Specific conclusions
The specific conclusions of each one of the chapter-studies of this PhD thesis are the
following ones:
Chapter 1. Seasonal Soil CO2 and VOC exchange rates in a Mediterranean holm
oak forest and the responses to drought.
Chapter 1.1. Seasonal soil and leaf CO2 exchange rates:
1) In Mediterranean ecosystems, water is the principal factor controlling most
of the aboveground and belowground processes resulting in a soil-moisture-
dependent seasonal pattern for soil CO2 emissions and leaf CO2 uptake.
2) We have found a significant correlation between photosynthetic rates and
soil respiration rates. However, this could be an indirect relationship
resulting from seasonal variations of temperature, moisture and phenology or
the effect of time lags between the assimilation of carbon in leaves and the
carbon transport to the roots. Further studies considering autotrophic versus
heterotrophic respiration separately are needed to gain knowledge on the
relationships between above- and below-ground plant processes.
3) Prolonged low water availability in the drought treatment plots might have
favoured root growth in those plots, resulting in enhanced root respiration.
Thus, in summer, CO2 emissions in drought plots could be mostly driven by
autotrophic metabolism as a result of changes in the importance of root
versus soil microbial activity.
4) The results suggested changes in drought conditions towards a decrease in
the microorganisms/roots ratio of activities in the rhizosphere, especially in
summer.
General Conclusions
191
Chapter 1.2. Seasonal soil VOC exchange rates:
1) VOC and monoterpene emissions in the holm oak forest represent a very
small percentage of the total C emitted as CO2.
2) No significant direct relationships were found between the soil monoterpene
exchange rates and the net photosynthetic rates in our study. The correlation
between photosynthetic electron transport rates and emission rates does not
necessarily gives mechanistic insight into the physiology of monoterpene
leaf emission nor on the monoterpene emission from underground parts of
plants. Further studies are needed to gain knowledge on these linkages
between photosynthetic rates and soil emission rates.
3) Seasonal induction of VOC emissions by phenological processes must be
considered as an additional factor which is likely to control VOC and
monoterpene exchange between soil and atmosphere.
4) The factors determining the sink potential and the timescales for sink/source
reversal are unknown but these results warrant further research to solve these
questions.
5) Results also suggest changes towards a decrease in the ratio of
microorganisms/roots activities in the rhizosphere, especially in summer.
The ecological implications of these changes in soil VOC exchange rates
need to be explored further.
Chapter 2. Internannual and interseasonal soil CO2 efflux and VOC exchange
rates in a Mediterranean holm oak forest in response to experimental drought:
1) Drought strongly reduces soil respiration. This was highlighted by an strong
interannual variation in CO2 exchange in this Mediterranean ecosystem. Soil
moisture exerted a primary control seasonally and interannually on soil
respiration.
2) Soil respiration responses to increases in soil temperature are constrained by soil
moisture, due to the direct effects of soil moisture on microbial biomass and the
indirect effects of moisture on the amount of photosynthate available as
substrate for belowground root and rhizosphere respiration. As a result,

General Conclusions
192
maximum rates of CO2 efflux occurred in spring and autumn and the minimum
values in summer.
3) Camphene, α-pinene and Δ3-carene showed the highest exchange rates.
4) Soil monoterpenes exchange fluctuated randomly throughout the seasons. The
interaction of multiple factors could have produced non-linear responses
resulting in this random-like fluctuation.
5) The response of each individual monoterpene to drought treatment and to the
seasonal variations seems to be monoterpene specific.
6) High soil temperatures in summer increased other VOC exchange rates. Drought
treatment tended to increase the emission rates of several of these VOCs.
Temperature seemed to affect the emission rates depending on the compound
type.
Chapter 3. Interannual and seasonal changes in the soil exchange rates of
monoterpenes and other VOCs in a Mediterranean shrubland:
1) Alpha-pinene and limonene monoterpenes were the most common identified soil
exchanging monoterpenes. M33 (methanol), M43 (acetic acid, ethyl acetate),
M45 (acetaldehyde), M59 (acetone) and M73 (C3 and C4 carboniles) showed
the highest exchange rates among all the identified VOCs. Exudates from
rhizosphere activities, roots VOCs production and organic matter decomposition
by microorganisms in the soil organic or mineral horizons may be the most
important sources of these VOCs.
2) Soil monoterpene exchange rates were very low so soil monoterpene emissions
may represent a small part of the total monoterpene fluxes emitted to the
atmosphere by a vegetated land surface. However, some soil VOC uptake rates
were comparable with those reported for leaves. These VOCs might be
consumed by soil microorganisms or stored in the soil layers.
3) Results suggest that severe long-term drought increases soil monoterpene
emission rates in this Mediterranean shrubland. The increase in soil
monoterpene emissions in response to lower soil water availability is probably
linked to changes in soil physical properties induced by low soil moisture in this
Mediterranean shrubland.

General Conclusions
193
4) Conversely, other soil VOCs increased their emission rates when soil moisture
increased, although the effects were constrained by soil temperature. These
results showed that soil moisture effect on soil VOC exchange rates in this
Mediterranean shrubland depends on the compound type.
5) High soil temperatures increase soil monoterpene and other VOC emission rates
possibly due to higher volatilisation rates. Results suggest a strong seasonal
control of soil temperature on monoterpene exchange rates.
Chapter 4. On-line screening of soil VOCs exchange responses to moisture,
temperature and root presence:
1) The studied Mediterranean soil behaved more as a sink of VOCs than as a
source. Under the most standard soil moisture and temperature conditions i.e.
20% v/v and 20°C, there was overall VOC uptake.
2) Increasing soil moisture resulted in higher soil sink activity. In parallel, we
measured higher CO2 exchange rates and net photosynthetic rates,
corresponding to greater microbial and plant activity. Biodegradation of VOCs
by soil microorganisms or roots could be responsible for the soil sink activity as
also an increase of physical passive storage of VOCs.
3) Conversely, an increase in soil temperature increased VOC emission rates. Both
biological sources (microorganisms or roots) or physical factors (volatilization)
seem involved in these responses.
4) Results confirm the link between roots and microbial activity, especially when
soil moisture was the limiting factor. We suggest that the role of roots on soil
VOCs exchange was indirect by releasing exudates which enhanced microbial
VOCs consumption activities.
5) Roots play a key role in soil VOCs exchange increasing bacterial metabolism,
especially when water is the limiting factor, which is a common situation in the
studied Mediterranean ecosystem.

General Conclusions
194
Chapter 5. The distribution of volatile isoprenoids in the top soil horizons around
Pinus halepensis trees in field conditions:
1) The most abundant terpenes in soil horizons and roots extracts around Pinus
halepensis trees reported were α-pinene, β-pinene, sabinene, β-caryophyllene
and α-humulene. Alpha-pinene, together with the sesquiterpenes β-
caryophyllene and α-humulene, were particularly high in litter extracts.
2) The relatively high water solubility of β-caryophyllene in litter layer indicates
soil microorganisms are likely to obtain their carbon source in the aqueous
phase.
3) Litter layer and top and low roots of Pinus halepensis were identified as the
largest sources of α -pinene, sabinene, β-pinene, β-caryophyllene and α-
humulene which are found in the other soil layers (organic and mineral).
4) Soil terpene content decrease with increasing the distance to the trunk.
5) There is evidence to suggest that long term emissions of α-pinene from P.
halepensis roots also contribute to the α-pinene content of rhizosphere soils.
6) There is a need for further investigations of the sources dynamics of terpenes in
rhizosphere systems, particularly to investigate (1) the role of mycorrhizal fungi
and needle-degrading microorganisms, and (2) conversions and use of terpenes
as carbon sources.