exchange rate in the long run
DESCRIPTION
Exchange Rate in the Long Run. In the long run, exchange rate is determined by the relative purchasing power of the two currencies in their respective countries. Exchange Rate in the Long Run. - PowerPoint PPT PresentationTRANSCRIPT

12-1
Exchange Rate in the Long Run
In the long run, exchange rate is determined by the relative purchasing power of the two currencies in their respective countries.

12-2
Exchange Rate in the Long Run
Two currencies are considered to be at purchasing power parity (PPP) when one unit of either one of them buys the same basket of goods in both countries.

Real exchange rateReal exchange rate (R) shows the relative purchasing power of two currencies.
(3)
where Pf: Price level in the foreign country
P: Price level in the home country 12-3
P
ePR f

Real exchange rate
If R = 1, currencies are at PPP.If R > 1, goods abroad are more expensive
than at home If R < 1, goods abroad are cheaper than those
at home
12-4
P
ePR f

PPP facts
Today, it takes about 4 years to reduce deviations from PPP by half.
PPP holds in the LR, but it is only one of the determinants of the exchange rate
12-5
12-6
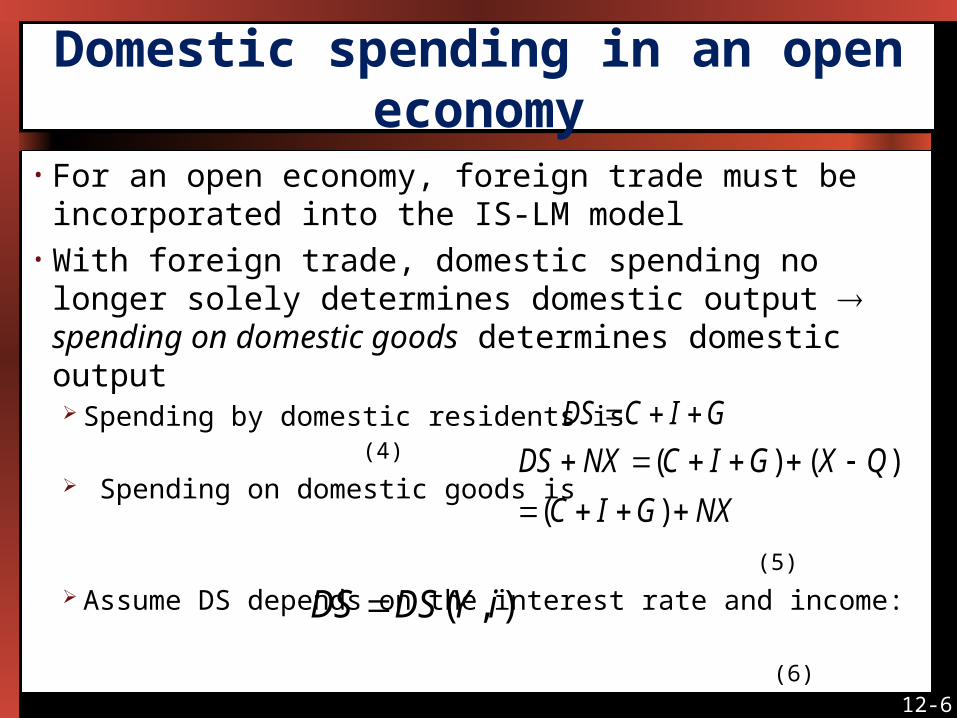
Domestic spending in an open economy
• For an open economy, foreign trade must be incorporated into the IS-LM model
• With foreign trade, domestic spending no longer solely determines domestic output spending on domestic goods determines domestic output Spending by domestic residents is (4)
Spending on domestic goods is
(5)
Assume DS depends on the interest rate and income:
(6)
GICDS
NXGIC
QXGICNXDS
)(
)()(
),( iYDSDS
12-7
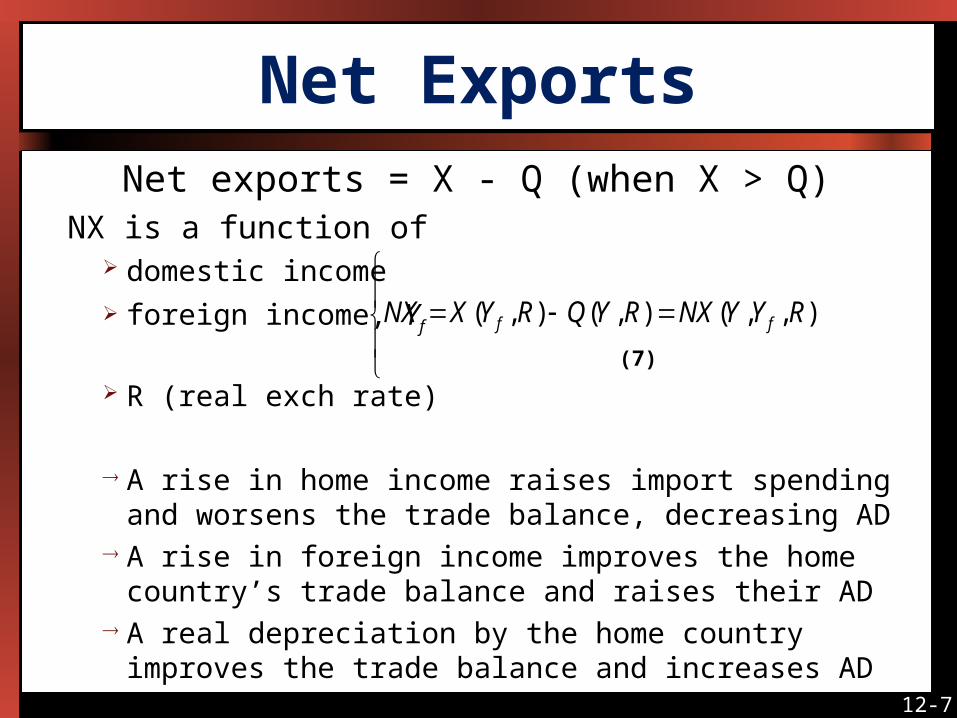
Net ExportsNet exports = X - Q (when X > Q)
NX is a function of domestic income
foreign income, Yf (7)
R (real exch rate)
A rise in home income raises import spending and worsens the trade balance, decreasing AD
A rise in foreign income improves the home country’s trade balance and raises their AD
A real depreciation by the home country improves the trade balance and increases AD
),,(),(),( RYYNXRYQRYXNX ff
12-8
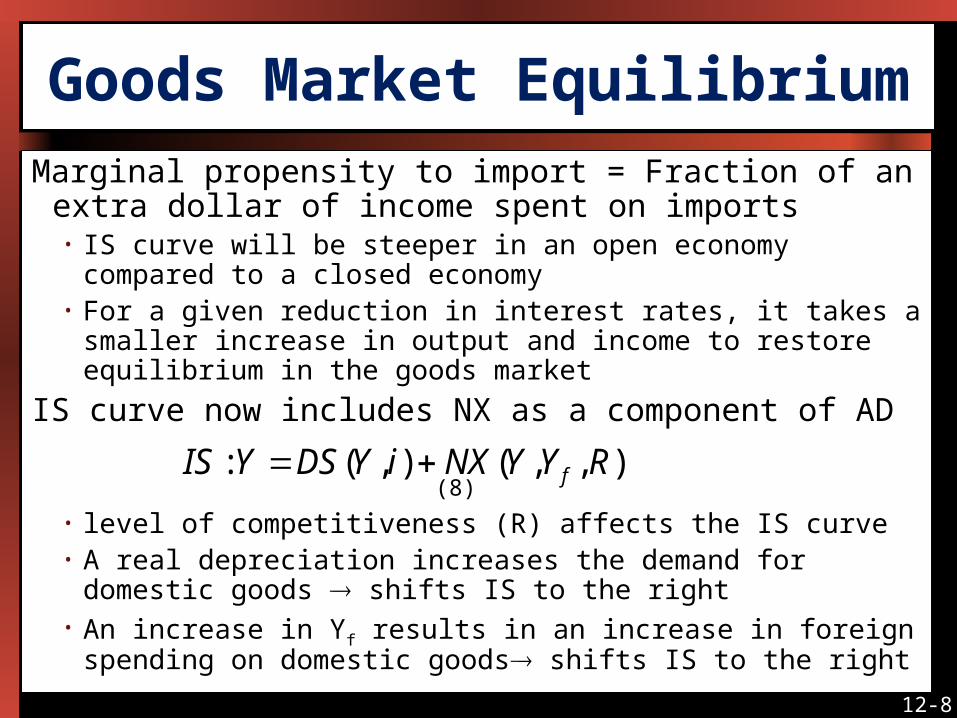
Goods Market EquilibriumMarginal propensity to import = Fraction of an extra dollar
of income spent on imports• IS curve will be steeper in an open economy compared to a
closed economy• For a given reduction in interest rates, it takes a smaller increase
in output and income to restore equilibrium in the goods market
IS curve now includes NX as a component of AD (8)
• level of competitiveness (R) affects the IS curve• A real depreciation increases the demand for domestic goods
shifts IS to the right• An increase in Yf results in an increase in foreign spending on
domestic goods shifts IS to the right
),,(),(: RYYNXiYDSYIS f

12-9
Goods Market Equilibrium• When foreign income
increases, so does AD for home goods. This means higher output at the same level interest. IS shifts to the right, and the market reaches equil at a higher i-higher Y pt.
• Same dynamic occurs as a result of a real depreciation in the exchange rate
Figure 12-3
12-10
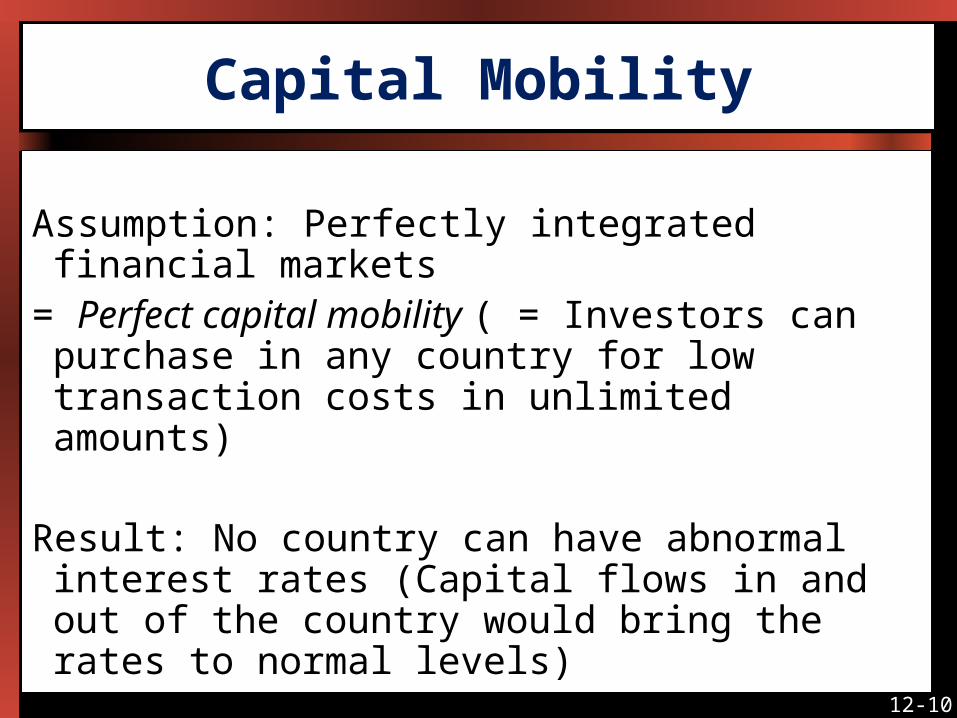
Capital Mobility
Assumption: Perfectly integrated financial markets = Perfect capital mobility ( = Investors can
purchase in any country for low transaction costs in unlimited amounts)
Result: No country can have abnormal interest rates (Capital flows in and out of the country would bring the rates to normal levels)
12-11
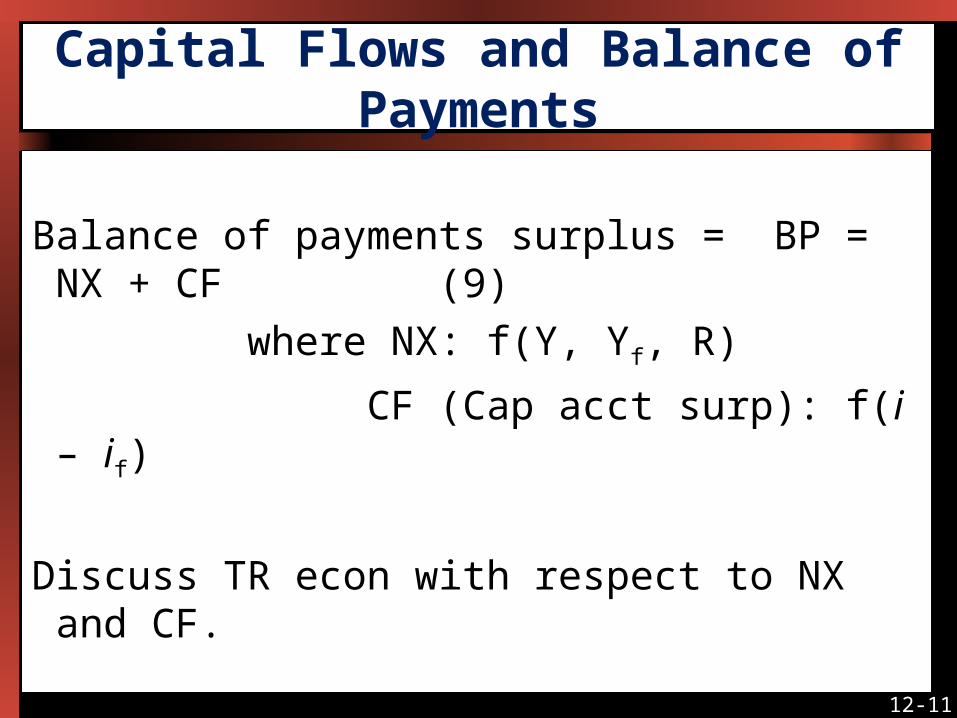
Capital Flows and Balance of Payments
Balance of payments surplus = BP = NX + CF (9)
where NX: f(Y, Yf, R)
CF (Cap acct surp): f(i – if)
Discuss TR econ with respect to NX and CF.
12-12
Mundell-Fleming Model: Perfect Capital Mobility Under Fixed Exchange Rates
Mundell-Fleming Model: IS-LM when foreign exchange under perfect capital mobility is factored in.
12-13
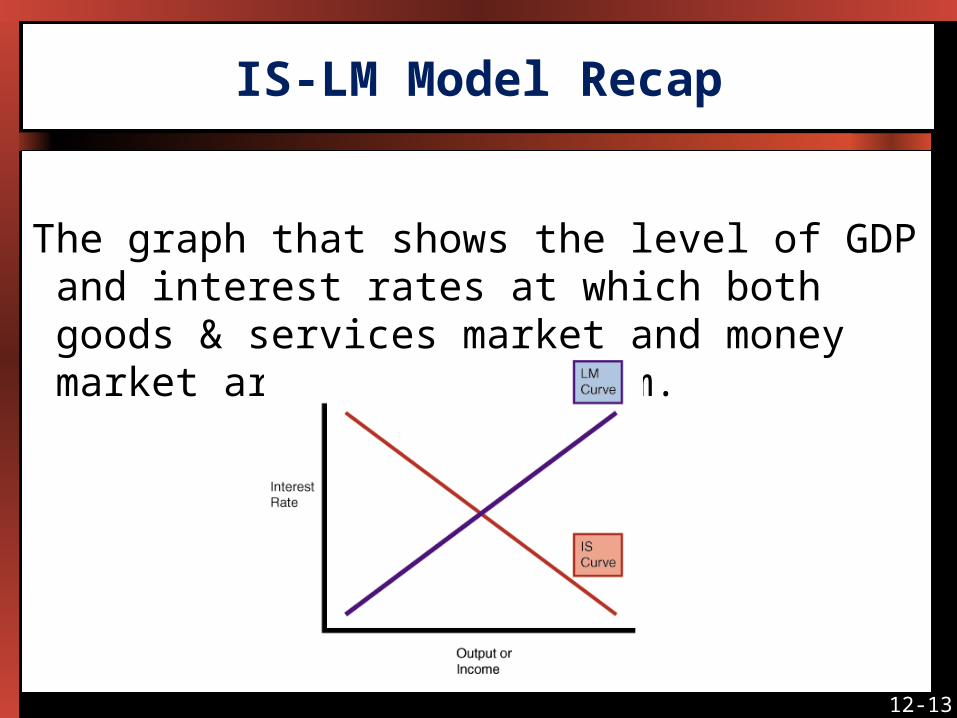
IS-LM Model Recap
The graph that shows the level of GDP and interest rates at which both goods & services market and money market are at equilibrium.

12-14
IS Curve/Schedule
. In “real” markets (goods or services = Non-financial markets)
. IS curve shows equilibrium points between Investments and Savings (points where total private investment equals total
savings of consumers,
government and foreign trade).
Y = C+I+G+NX
. In IS curve, i is the independent
variable.

12-15
LM Curve/Schedule
. In money (financial) markets
. LM curve shows equilibrium points between Liquidity Preference and Money Supply (points where demand and supply of money intersects).
. In LM curve, Y is the
independent variable.
. When Y increases, liq pref
function moves right, and
interest rates increase.

12-16
Mundell-Fleming Model: Perfect Capital Mobility Under Fixed Exchange Rates
Mundell-Fleming Model says: Under perfect capital mobility, any interest differential attracts infinite capital inflows, which disallows the central bank to conduct an independent monetary policy.
Because: In order to prevent the exchange rate to go off, Central Bank has to follow only one type of strategy (but not any other)

12-17
Mundell-Fleming Model: Perfect Capital Mobility Under Fixed Exchange Rates
For ex: Suppose the bank tightens money supply to increase interest rates.
• International investors would shift their money into the country• Balance of payments registers a surplus• Demand for domestic currency exceeds its supply, and domestic
currency appreciates• To prevent it to hurt exports and trade balance, central bank
intervenes to keep the exchange rate fixed• The central bank buys foreign currency with domestic currency• Domestic money stock increases, and interest rates drop• Interest rates continue to drop until they return to the original
level

12-18
Monetary Expansion
BP schedule is horizontal under perfect capital mobility (i = if)
• A monetary expansion shifts LM to right (E’ becomes the new equil pt)
• At E’, there is a payments deficit. It applies pressure for exchange rate to depreciate
• Central bank intervenes, and sells foreign currency to bring in domestic currency
• Money supply falls, pushes interest rates up, and moves LM back to the original position
Figure 12-5

12-19
Fiscal Expansion
• Under fixed exchange rate and perfect capital mobility, monetary policy is infeasible, but fiscal expansion is effective
• Fiscal expansion shifts the IS curve to the right (Interest rates and output increases)
• Due to higher interest rates, capital inflow increases, which appreciates the domestic currency
• To prevent it hurt exports and trade balance, central bank expands the money supply. (LM shifts to the right)
• Interest rates comes back to initial level, but output continues to increase.
12-20
Perfect Capital Mobility and Flexible Exchange Rates
(Flexible exchange rate system: Central bank does not intervene in the market to control the exchange rate)
• When central bank cannot intervene, BP must equal zero
• Central bank cannot intervene in currency markets, but it can change the money supply. (Because there is no automatic link between money supply and BP)

12-21
• Perfect capital mobility implies that BP = 0 when i = if (10)
• If i > if, demand for domestic currency exceeds its supply, which causes the currency to appreciate. Domestic goods become more expensive (IS shifts to left)
Figure 12-6
Perfect Capital Mobility and Flexible Exchange Rates

12-22
How do various changes in foreign trade affect the output, interest rate, and exchange rate?
If exports increase
Demand for domestic goods increases
IS shifts to the right The new equilibrium (E’)
moves towards forming at a higher income and interest levels
But it doesn’t reach there, because E’ is a disequilibrium pt (BP surplus) that appreciates the domestic currency, and bring the economy back to E.
Figure 12-7
12-23
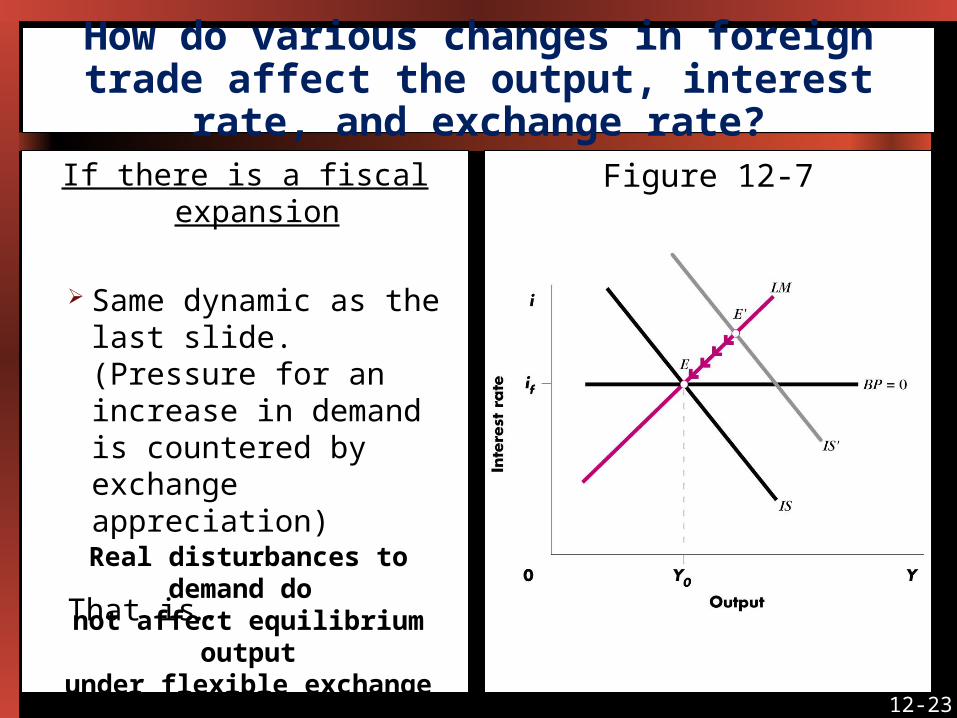
If there is a fiscal expansion
Same dynamic as the last slide. (Pressure for an increase in demand is countered by exchange appreciation)
That is…
Figure 12-7
Real disturbances to demand do not affect equilibrium outputunder flexible exchange rates
with capital mobility.
How do various changes in foreign trade affect the output, interest rate, and exchange rate?

12-24
If nominal money supply increases The real stock of money (M/P)
increases since P is fixed At E there will be an excess supply
of real money balances To restore equilibrium, interest
rates will have to fall LM shifts to the right
At point E’, goods market is in equilibrium, but i is below the world level capital inflows depreciate the exchange rate
Figure 12-8
How do various changes in foreign trade affect the output, interest rate, and exchange rate?

12-25
Import prices increase, domestic goods more competitive, and demand for home goods expands
IS shifts right to E”, where i = if
Result: A monetary expansion leads to an increase in output and a depreciation of the exchange rate under flexible rates
Figure 12-8
Under fixed rates, the central bankcannot control the nominal money
stock.
Under flexible rates, the central bank can control the nominal money stock,and is a key aspect of that exchange
rate system.
How do various changes in foreign trade affect the output, interest rate, and exchange rate?

12-26
CONCLUSION: “Unholy Trinity”
Capital mobility, fixed exchange rate and independent monetary policy constitute an unholy/impossible trinity.
A government cannot have all three of them at the same time. It has to prioritize them, and choose two of the three.