excessive polyamine generation in keratinocytes promotes self … · 9 derived from five healthy...
TRANSCRIPT
1
Excessive Polyamine Generation in Keratinocytes Promotes Self-RNA 1
Endosomal Sensing by Dendritic Cells in Psoriasis 2
3
Fangzhou LOU1,7, Yang SUN1,7, Zhenyao XU1, Liman NIU1, Zhikai WANG1, Siyu 4 DENG1, Zhaoyuan LIU1, Hong ZHOU1, Jing BAI1, Qianqian YIN1, Xiaojie CAI1, Libo 5 SUN1, Hong WANG1, Zhouwei WU2, Xiang CHEN3, Yuling SHI4, Wufan TAO5, 6 Florent GINHOUX1,6,*, and Honglin WANG1,8,* 7
1Shanghai Institute of Immunology, Department of Immunology and Microbiology, 8 Institute of Translational Medicine, Shanghai General Hospital, Key Laboratory of Cell 9 Differentiation and Apoptosis of Chinese Ministry of Education, Shanghai Jiao Tong 10 University School of Medicine (SJTU-SM), Shanghai 200025, China 11
2Department of Dermatology, Shanghai General Hospital, SJTU-SM, Shanghai 200080, 12 China 13
3Department of Dermatology, Xiangya Hospital, Central South University, Changsha 14 410008, China 15
4Department of Dermatology, Shanghai Tenth People’s Hospital, Shanghai 200072, 16 China 17
5State Key Laboratory of Genetic Engineering and Institute of Developmental Biology 18 and Molecular Medicine, Fudan University, Shanghai 200433, China 19
6Singapore Immunology Network, Agency for Science, Technology and Research, 20 Singapore 138648, Singapore 21
7These authors contributed equally 22
8Lead Contact 23
*Correspondence to: 24
25 Honglin WANG, Ph.D. 26 Shanghai Institute of Immunology, Shanghai Jiao Tong University School of 27 Medicine (SJTU-SM), 280 South Chongqing Road, 200025 Shanghai, China 28 E-mail: [email protected] 29 30 Florent GINHOUX, Ph.D. 31 Singapore Immunology Network, Agency for Science, Technology and Research, 8A 32 Biomedical Grove Level 3, Immunos Building, Singapore 138648, Singapore 33 E-mail: [email protected] 34
35
.CC-BY-NC-ND 4.0 International licenseauthor/funder. It is made available under aThe copyright holder for this preprint (which was not peer-reviewed) is the. https://doi.org/10.1101/2020.03.09.984658doi: bioRxiv preprint

2
1
SUMMARY 2
3
The mechanisms underlying tissue-specific chronic inflammation are elusive. Here we 4
report that mice lacking Protein Phosphatase 6 in keratinocytes are predisposed to 5
psoriasis-like skin inflammation, with an inordinate urea cycle and enhanced oxidative 6
phosphorylation that supports hyperproliferation. This phenotype is mediated by 7
increased Arginase-1 production resulting from CCAAT/enhancer-binding protein beta 8
activation. Single-cell RNA-seq of the psoriatic epidermis revealed that the 9
rate-limiting enzyme for Arginine biosynthesis, Argininosuccinate synthetase 1, 10
maintains the Arginine pool, which is indispensable for immune responses. 11
Accumulated polyamines branched from the urea cycle promote endosomal 12
Tlr7-dependent self-RNA sensing by myeloid dendritic cells. This process is achieved 13
with the assistance of an RNA-binding peptide that originates from the heterogeneous 14
nuclear ribonucleoprotein A1, a probable autoantigen in psoriasis. Finally, targeting 15
urea cycle wiring with an arginase inhibitor markedly improved skin inflammation in 16
murine and non-human primate models of psoriasis. Our findings suggest that urea 17
cycle alteration and excessive polyamine production by psoriatic keratinocytes 18
promote self-RNA sensing by dendritic cells, which links the hyperproliferation of 19
stationary cells with innate-immune activation in an auto-inflammatory condition. 20
21
.CC-BY-NC-ND 4.0 International licenseauthor/funder. It is made available under aThe copyright holder for this preprint (which was not peer-reviewed) is the. https://doi.org/10.1101/2020.03.09.984658doi: bioRxiv preprint
3
1
INTRODUCTION 2
3
The regulation of immune cell-intrinsic metabolism, or “immunometabolism”, is 4
under extensive investigation. The goal of such research is to identify translational 5
applications of manipulating metabolism to treat immune-mediated diseases. One 6
example is the targeting of oxidative phosphorylation (OXPHOS) to impair T-helper 7
17 (Th17) cell generation in vivo in a mouse model of psoriasis; here, the endogenous 8
metabolite itaconate inhibits the IL-17-IκBζ axis and ameliorates psoriasis-like skin 9
inflammation (Bambouskova et al., 2018; Franchi et al., 2017). Although these 10
therapeutic approaches are effective, psoriasis always relapses and is still incurable in 11
human patients due to our incomplete understanding of the causes of the type 12
17-biased immune responses in the skin. 13
14
As a skin-confined chronic inflammatory condition, psoriasis is characterized by the 15
abnormal interplay between hyperproliferative epidermal keratinocytes and 16
self-reactive immune cells (Lowes et al., 2007). Although psoriasis has long been 17
regarded as a metabolism-associated disorder (Haslam and James, 2005), and is 18
assumed to be fueled by keratinocyte-intrinsic metabolic fluxes, the choreography of 19
metabolic adaptions in psoriasis and the underlying mechanisms are poorly defined. 20
Abnormal amino acid and lipid metabolism was noticed in patients with psoriasis 21
(Gudjonsson et al., 2009; Kamleh et al., 2015; Kang et al., 2017), with dietary 22
saturated fatty acids shown to exacerbate the skin inflammation (Herbert et al., 2018). 23
.CC-BY-NC-ND 4.0 International licenseauthor/funder. It is made available under aThe copyright holder for this preprint (which was not peer-reviewed) is the. https://doi.org/10.1101/2020.03.09.984658doi: bioRxiv preprint

4
Meanwhile, inhibiting glucose transportation in keratinocytes seems to be a novel 1
means for treating psoriasis (Zhang et al., 2018). Whether there exists a tissue-specific 2
metabolic scenario and if so, what the functional significance in the context of 3
inflammation might be, however, is unknown. 4
5
The other aspect of the auto-inflammatory loop in psoriasis pathogenesis is innate 6
immunity activation, which triggers subsequent adaptive immune responses against 7
self-components. LL-37, ADAMTSL5, PLA2G4D and HNRNPA1 are probable 8
psoriasis autoantigens (Arakawa et al., 2015; Cheung et al., 2016; Guarneri et al., 9
2018; Jones et al., 2004; Lande et al., 2014), with LL-37 and HNRNPA1 harboring 10
RNA-binding properties. Given the notion that self-RNA sensing is central to the 11
development of inflammatory diseases like psoriasis and lupus (Celhar et al., 2015; 12
Ganguly et al., 2009), understanding how these RNA-binding proteins are handled by 13
antigen-presenting cells before they become recognized by self-reactive T cells 14
should be addressed. 15
16
We previously reported that a microRNA directly targets Protein Phosphatase 6 (PP6) 17
as a negative cell cycle regulator in psoriatic keratinocytes (Yan et al., 2015). PP6, 18
which consists of one catalytic subunit and two regulatory subunits, is crucial for skin 19
homeostasis (Bonilla et al., 2016; Hodis et al., 2012; Krauthammer et al., 2012). 20
Given the versatility of serine/threonine phosphatases, we aimed to determine the 21
specific functionality of PP6 in keratinocytes. Using a genetic ablation approach, we 22
.CC-BY-NC-ND 4.0 International licenseauthor/funder. It is made available under aThe copyright holder for this preprint (which was not peer-reviewed) is the. https://doi.org/10.1101/2020.03.09.984658doi: bioRxiv preprint

5
discovered that PP6 functions as an essential check point in epidermal metabolic 1
regulation and in psoriasis development. Our delineation of the transcriptional and 2
metabolic rewiring that occurs subsequent to PP6 deficiency might help illuminate the 3
metabolite-facilitated activation of innate immunity in psoriasis and other 4
auto-inflammatory disorders.5
.CC-BY-NC-ND 4.0 International licenseauthor/funder. It is made available under aThe copyright holder for this preprint (which was not peer-reviewed) is the. https://doi.org/10.1101/2020.03.09.984658doi: bioRxiv preprint

6
1
RESULTS 2
3
Epidermis-specific Pp6-deficient mice spontaneously develop psoriasis-like skin 4
inflammation 5
We previously found that PP6 is directly targeted by microRNA-31, one of the most 6
highly overexpressed microRNAs in human psoriatic skin (Xu et al., 2013; Yan et al., 7
2015). We first performed an immunohistochemical analysis of PP6 on skin sections 8
derived from five healthy donors and 117 patients with psoriasis. We found that PP6 9
was ubiquitously expressed in all epidermal layers of the healthy skin but was 10
comparatively reduced in psoriatic lesions (Figure S1A). Notably, we detected a 11
strong negative correlation between PP6 levels and epidermal hyperplasia (Figure 12
S1B). When correlating the Psoriasis Area and Severity Index (PASI) and the PP6 13
expression levels, we found that epidermal PP6 levels in the severe group (PASI > 20) 14
were significantly lower than the levels in the mild and moderate groups (p < 0.05, 15
Figure S1C). We also found decreased PP6 expression in both imiquimod 16
(IMQ)-induced and IL-23-induced mouse models of psoriasis (Figures S1D-S1G). 17
18
We next crossed mice with loxP-flanked Pp6 alleles (Pp6fl/fl) with Keratin 5-Cre (K5) 19
mice to specifically delete Pp6 in keratinocytes (designated K5. Pp6fl/fl, Figures 20
S2A-S2C). K5+ medullary thymic epithelial cells (mTECs) did not express Pp6 21
protein and were likely unaffected by Pp6 genetic ablation (Figure S2D). K5. Pp6fl/fl 22
.CC-BY-NC-ND 4.0 International licenseauthor/funder. It is made available under aThe copyright holder for this preprint (which was not peer-reviewed) is the. https://doi.org/10.1101/2020.03.09.984658doi: bioRxiv preprint

7
mice were viable, and mice younger than 16-week old exhibited no notable skin 1
abnormalities (data not shown). Strikingly, skin lesions spontaneously emerged in K5. 2
Pp6fl/fl mice after 16 weeks of age (Figure 1A). We found scaly plaques on the faces, 3
ears, upper backs and tails of the affected mice (Figure 1B). Histological examination 4
of the skin lesions showed remarkable epidermal hyperplasia (acanthosis) with loss of 5
the granular layer, hyperkeratosis and parakeratosis in the epidermis together with 6
microabscesses that accumulated on the surface of the thickened epidermis and 7
massive cellular infiltrates in the dermis (Figures 1C and 1D). Splenomegaly and 8
lymphadenopathy were also pronounced in the affected K5. Pp6fl/fl mice (Figure 9
S2E). 10
11
We next characterized how skin lesions were initiated in K5. Pp6fl/fl mice. We 12
investigated barrier function [indicated by transepidermal water loss (TEWL)], 13
keratinocyte proliferation (indicated by Ki67+ cell numbers in epidermis), Keratin 6 14
(K6) expression and CD3+ T-cell, CD11c+ dendritic cell (DC), F4/80+ macrophage 15
and Ly6G+ neutrophil infiltration in non-lesional skin from Pp6fl/fl mice, young K5. 16
Pp6fl/fl mice (10~15-week age) and old K5. Pp6fl/fl mice (≥ 16-week age), and lesional 17
skin from old K5. Pp6fl/fl mice (≥ 16-week age). We found that the number of Ki67+ 18
cells was increased in the non-lesional epidermis from K5. Pp6fl/fl mice (both young 19
and old) compared to those of Pp6fl/fl, and in the lesional epidermis from K5. Pp6fl/fl 20
mice compared to the non-lesional epidermis from the same animals (Figures S2F 21
and 1E). Immune infiltration, TEWL and K6 expression were unaltered in the 22
.CC-BY-NC-ND 4.0 International licenseauthor/funder. It is made available under aThe copyright holder for this preprint (which was not peer-reviewed) is the. https://doi.org/10.1101/2020.03.09.984658doi: bioRxiv preprint

8
non-lesional skin from K5. Pp6fl/fl mice (either young or old) but all parameters were 1
increased in the lesional skin from K5. Pp6fl/fl mice compared to Pp6fl/fl controls 2
(Figures S2G, 1F, S2H and S2I). The number of CD80+ activated antigen presenting 3
cells was also increased in the non-lesional and lesional dermis of K5. Pp6fl/fl mice 4
(Figure S2J and S2K) and vascularization (indicated by CD31+ cell percentages) was 5
increased in the skin lesions of K5. Pp6fl/fl mice (Figure 1G). We found that the 6
dermis of K5. Pp6fl/fl mice was enriched in mast cells but lacked eosinophils; the 7
serum IgE levels, however, were consistent with those of Pp6fl/fl mice, suggesting a 8
non-allergic reaction (Figures S2L-S5N). 9
10
We next performed single-cell RNA sequencing (scRNAseq) on epidermal cells 11
derived from the ear skin of young K5. Pp6fl/fl mice and C57BL/6 control mice, and 12
compared the transcriptional profiles of the keratinocyte compartments with and 13
without Pp6 deficiency. Using gene set enrichment analysis (GSEA) of gene ontology 14
(GO) pathways and subsequent enrichment map visualization, we found that 15
Pp6-deficient keratinocytes were highly proliferative and more involved in myeloid 16
cell and T-cell activation processes, as compared with Pp6-intact keratinocytes 17
(Figure 1H). These findings suggest that Pp6-deficient keratinocytes transduce 18
proinflammatory signals to immune cells. Persistent environmental challenges to K5. 19
Pp6fl/fl mice might amplify the resulting inflammatory circuits to a certain threshold 20
and underlie skin lesion development. 21
22
.CC-BY-NC-ND 4.0 International licenseauthor/funder. It is made available under aThe copyright holder for this preprint (which was not peer-reviewed) is the. https://doi.org/10.1101/2020.03.09.984658doi: bioRxiv preprint

9
We next performed transcriptome profiling to study the altered genes in the K5. 1
Pp6fl/fl lesions. Among 18,835 changed genes, 1,619 were differentially expressed 2
genes (DEGs; |log2FC| ≥ 1 and p < 0.05). We identified a notable resemblance 3
between the gene expression patterns in the affected skin from K5. Pp6fl/fl mice and 4
the affected skin from patients with psoriasis, with similar expression profiles of 5
psoriasis “countermark” genes. For example, keratinocyte-derived antimicrobial 6
peptide (AMP) coding genes (S100a7a, S100a8, S100a9, Lcn2 and Defb4) were 7
strongly induced in the inflamed mouse skin (Gudjonsson et al., 2010; Shao et al., 8
2016). Cornified envelope genes (Lce and Sprr family members) and serine protease 9
genes (Serpinb3a and Serpinb3b) were also deregulated in these animals, indicating 10
epidermal barrier dysfunction (Fujimoto et al., 1997; Roberson et al., 2012; Shen et 11
al., 2015). Meanwhile, increased Krt6a, Krt16 and Krt14 expression together with 12
decreased Krt15 and Flg2 expression implicated abnormal keratinocyte differentiation 13
in K5. Pp6fl/fl mice (Alam et al., 2011; Lessard et al., 2013; Shen et al., 2015; Waseem 14
et al., 1999). Conversely, elevated chemokine (Cxcl1, Cxcl2 and Cxcl5) and cytokine 15
(Il1b, Il1f6, Il6, Il17a and Csf3) production suggested the involvement of 16
inflammatory reactions (Figure 1I). 17
18
The GSEA also indicated that the elevated and downregulated transcriptional 19
signatures of K5. Pp6fl/fl skin lesions significantly overlapped with DEGs identified in 20
92 human psoriatic skin samples relative to 82 normal skin samples (Figure 1J). The 21
overlaps between the mouse transcriptional profile and the gene sets from human 22
.CC-BY-NC-ND 4.0 International licenseauthor/funder. It is made available under aThe copyright holder for this preprint (which was not peer-reviewed) is the. https://doi.org/10.1101/2020.03.09.984658doi: bioRxiv preprint

10
patients with atopic dermatitis were much weaker than the overlaps elicited by 1
psoriatic DEGs (Figure S2O). Moreover, pathway enrichment analysis highlighted 2
that TNF and IL-17 signaling is activated in the lesional skin of K5. Pp6fl/fl mice 3
(Figure 1K). These lesions responded well to cortisol (Halometasone) and 4
anti-IL-17A treatment, demonstrating the active participation of the immune system, 5
particularly IL-17A-producing cells, in the disease (Figures S2P and 1L). 6
Semi-quantitative cytokine array further confirmed the elevation of 7
IL-23-T17-associated cytokines in K5. Pp6fl/fl skin, as compared with Pp6fl/fl controls, 8
including IL-23, IL-12p40, IL-22, IL-20, IL-6, TNF-α, IL-17A and IL-17F (Figure 9
1M). Finally, scRNAseq on skin samples derived from diseased K5. Pp6fl/fl mice 10
found that Il17a and Il17f were expressed by both Trac+ αβT and Trdc+ γδT cells, but 11
mainly by γδT cells in the diseased K5. Pp6fl/fl skin (Figure 1N). Collectively, these 12
histological, clinical and gene expression changes observed in K5. Pp6fl/fl skin lesions 13
are consistent with the hallmarks of psoriasis. Impaired PP6 expression in 14
keratinocytes thus seems to be a pivotal event in psoriasis development. 15
16
PP6 ablation promotes ARG1 transcription through C/EBP-β activation in 17
psoriatic keratinocytes 18
We next studied the molecular basis of the dysregulation in keratinocytes as a result 19
of PP6 ablation (Figure 2A). Of note, genes deregulated in the absence of Pp6 20
showed a statistically significant overlap with CCAAT/enhancer-binding protein 21
(C/EBP) target genes (Figure 2B). Specifically, various known C/EBPβ target genes, 22
.CC-BY-NC-ND 4.0 International licenseauthor/funder. It is made available under aThe copyright holder for this preprint (which was not peer-reviewed) is the. https://doi.org/10.1101/2020.03.09.984658doi: bioRxiv preprint
11
including S100a8/9, Arg1, Il1f6, Tnf, Ccl20 and Egr1, were markedly upregulated 1
(Figure 2C). In contrast to Pp6fl/fl mice, we observed enhanced phospho-C/EBPβ 2
(p-C/EBPβ, Thr-188) in the normal (unaffected) skin derived from K5. Pp6fl/fl mice, 3
and even higher levels in the lesional skin (Figure S3A). We noted the same 4
phenomenon in human skin (Figure S3B). Total C/EBPβ was increased in the 5
absence of Pp6 in the epidermis, in both non-lesional and lesional skin (Figure S3C). 6
Importantly, the human psoriatic skin sections showed the identical C/EBP-β 7
expression pattern to that observed in skin sections from diseased K5. Pp6fl/fl mice 8
(Figure S3D), with psoriatic skin expressing increased levels of C/EBP-β target genes 9
as suggested by GSEA (Figure 2D). We confirmed C/EBP-β signaling activation in 10
primary mouse keratinocytes from PP6-deficient mice, and in normal human 11
epidermal keratinocytes (NHEKs) in which we knocked down PP6 by siRNA 12
(Figures S3E and S3F). We also found that C/EBP-β co-immunoprecipitated with 13
PP6 in the nuclear lysates of HaCaT keratinocytes (Figure S3G), suggesting that PP6 14
directly or indirectly interacted with C/EBP-β in nuclei. 15
16
We next generated PP6-/- 293FT cells and investigated the C/EBP-β phosphorylation 17
status in the absence or presence of PP6. Thr-179, Ser-184 and Thr-188 were 18
hyper-phosphorylated in PP6-/- 293FT cells (Figure S3H). PP6 shows 19
de-phosphorylation specificity on “Thr-Pro” and “Ser-Pro” motifs (Rusin et al., 2015), 20
and both Ser-184 and Thr-188 of C/EBP-β meet such criteria. We then generated 21
plasmids expressing WT C/EBP-β, C/EBP-βS184A and C/EBP-βT188A and used 22
.CC-BY-NC-ND 4.0 International licenseauthor/funder. It is made available under aThe copyright holder for this preprint (which was not peer-reviewed) is the. https://doi.org/10.1101/2020.03.09.984658doi: bioRxiv preprint
12
Proximity Ligation Assay (PLA) to investigate the interactions between PP6 and the 1
various C/EBP-β proteins. We found that PP6 interacted with WT C/EBP-β in cell 2
nuclei (Figure S3I). Both PP6-C/EBP-βS184A and PP6-C/EBP-βT188A showed 3
weakened interactions, and C/EBP-β with double mutations of Ser-184 and Thr-188 4
showed a cumulatively weak interaction with PP6 (Figure S3I). These data suggest 5
that both C/EBP-β Ser-184 and Thr-188 are sites that are directly dephosphorylated 6
by PP6 and the activation of C/EBP-β in both K5. Pp6fl/fl mouse keratinocytes and 7
human psoriatic keratinocytes could be a direct consequence of PP6 deficiency. Given 8
that C/EBP-β is a key transcriptional factor downstream of the IL-17 9
receptor-mediated signaling (Song and Qian, 2013), we further investigated whether 10
IL-17 caused PP6 downregulation in keratinocytes. PP6 was markedly reduced in 11
NHEKs treated with IL-17A compared to untreated NHEKs (Figure S3J). 12
13
One of the most abundantly elevated genes in Pp6-deficient keratinocytes was Arg1, 14
which encodes a key enzyme involved in the urea cycle that catalyzes Arginine 15
hydrolysis to Ornithine and Urea. Human ARG1 is highly expressed in the skin and a 16
previous study found that ARG1 ranked first in psoriasis-specific DEGs when 17
compared with DEGs in other skin-confined diseases (Fagerberg et al., 2014; 18
Swindell et al., 2016). Despite these findings, the functional significance of ARG1 in 19
psoriasis is unclear. Here, we found C/EBPβ enrichment in the Arg1 promoter region 20
in K5. Pp6fl/fl keratinocytes as compared with Pp6fl/fl keratinocytes (Figure 2E). Arg1 21
co-localized with p-C/EBPβ in the nuclei of suprabasal keratinocytes in the mouse 22
.CC-BY-NC-ND 4.0 International licenseauthor/funder. It is made available under aThe copyright holder for this preprint (which was not peer-reviewed) is the. https://doi.org/10.1101/2020.03.09.984658doi: bioRxiv preprint
13
epidermis, and elevated Arg1 expression correlated with C/EBPβ activation in both 1
the Pp6-deficient non-lesional and lesional epidermis of K5. Pp6fl/fl mice; this 2
correlation was not evident in Pp6fl/fl controls (Figure 2F). C/EBP-β overexpression 3
in HaCaT keratinocytes led to a 8.49-fold increase in ARG1 transcription (Figure 2G). 4
Consistent with previous reports (Abeyakirthi et al., 2010; Bruch-Gerharz et al., 2003; 5
Schnorr et al., 2005), we also confirmed ARG1 upregulation in the psoriatic 6
epidermis compared to healthy donors (Figure 2H). More importantly, the DEGs that 7
we identified as increased in the psoriatic epidermis overlapped with genes associated 8
with Arginine and Proline metabolism (Figure 2I). Together, these data demonstrate 9
that a PP6 deficiency in psoriatic keratinocytes facilitates C/EBP-β activation via 10
phosphorylation of Ser-184 and Thr-188 sites of C/EBP-β and leads to increased 11
ARG1 expression, which might further affect Arginine metabolism and urea cycle in 12
psoriatic skin. 13
14
Basal keratinocytes in the psoriatic epidermis exhibit de novo Arginine synthesis 15
We next aimed to detect the abundance of the substrates and products of ARG1 in 16
human psoriatic samples using a QqQ-based LC-SRM-MS/MS metabolite 17
quantitation system. Consistent with a previous metabolomics study (Kang et al., 18
2017), we detected an increased abundance of Urea in the sera of patients with 19
psoriasis compared to that in healthy controls (Figure 3A). The serum Arginine and 20
Ornithine levels were comparable between the two groups (Figure 3A). Because we 21
showed that the ARG1 protein levels were increased in the psoriatic epidermis 22
.CC-BY-NC-ND 4.0 International licenseauthor/funder. It is made available under aThe copyright holder for this preprint (which was not peer-reviewed) is the. https://doi.org/10.1101/2020.03.09.984658doi: bioRxiv preprint

14
(Figure 2H), we hypothesized that arginase activity is enhanced in the psoriatic 1
epidermis while a compensatory mechanism likely exists to support local Arginine 2
consumption. To confirm our hypothesis, we generated scRNAseq datasets from 3
samples of the psoriatic epidermis and partitioned the cells according to their 4
countermarks (Figure 3B). We found that basal keratinocytes (labeled by KRT14, 5
KRT15 and CXCL14) uniquely expressed the Arginine biosynthesis rate-limiting 6
enzyme, Argininosuccinate synthetase 1 (ASS1) (Figure 3C). By contrast, these cells 7
did not show specific expression of the Arginine transporters SLC7A1, SLC7A2, 8
SLC7A5, SLC7A7 or SLC3A2 (Figure 3C). Compared to the healthy epidermis, the 9
psoriatic epidermis showed augmented ASS1-expressing region (Figure 3D). We 10
then generated merged scRNAseq datasets of three psoriatic epidermis samples and 11
three healthy epidermis samples to determine “KRT14”, “KRT5”, “KRT10” and 12
“ASS1” expression patterns. We found that ASS1 was strictly expressed in 13
KRT14hiKRT5hiKRT10lo basal keratinocytes (Figure 3E). We then calculated the 14
“ASS1 score” [(ASS1 average expression value of ASS1+ keratinocytes) × (ASS1+ 15
keratinocyte number) / (total keratinocyte number)] for each sample to determine the 16
contribution of de novo Arginine synthesis to Arginine compensation in the epidermis. 17
The psoriatic keratinocytes had a higher ASS1 score than the control keratinocytes 18
(Figure 3F), which is suggestive of a faster urea cycle that refreshes the psoriatic 19
epidermis. 20
21
.CC-BY-NC-ND 4.0 International licenseauthor/funder. It is made available under aThe copyright holder for this preprint (which was not peer-reviewed) is the. https://doi.org/10.1101/2020.03.09.984658doi: bioRxiv preprint

15
We also used scRNAseq to study Arginine compensation mechanisms in 1
Pp6-deficient murine keratinocytes. We partitioned the keratinocytes according to a 2
previous single-cell transcriptome study of the mouse epidermis, where interfollicular 3
(IFE) basal keratinocytes were marked as Krt14hiMt2hi (Joost et al., 2016). IFE basal 4
keratinocytes from both control and K5. Pp6fl/fl mice highly and exclusively expressed 5
Ass1, while the Arginine transporter genes were either undetected or showed no cell 6
specificity (Figure S4). We thus conclude that de novo Arginine synthesis is also a 7
feature of mouse IFE basal keratinocytes. The proportion of Ass1+ cells was increased 8
in the Pp6-deficient epidermis, which suggests that more keratinocytes in this context 9
have Arginine-producing capacity than keratinocytes in the WT epidermis. This effect 10
is likely to support quick Arginine consumption. Taken together, psoriatic 11
keratinocytes rely on de novo Arginine biosynthesis to sustain increased ARG1 12
activity and the subsequent generation of downstream metabolites (Figure 3G). 13
14
Urea cycle rewiring is characteristic of Pp6-deficient keratinocytes 15
Arginase and nitric oxide synthase (NOS) share Arginine as a common substrate. We 16
found that Arg1 augmentation in K5. Pp6fl/fl keratinocytes results in a 50% reduction 17
in cellular NO production compared with Pp6fl/fl controls (Figure 4A). Analogously, 18
we found that psoriatic skin produces an impaired transcriptional response to NO 19
compared to normal skin (Figure 4B). To better understand the metabolic profile of 20
K5. Pp6fl/fl keratinocytes in vivo, we performed an unbiased UPLC-QTOF/MS-based 21
metabolomics analysis of the epidermis derived from K5. Pp6fl/fl and Pp6fl/fl mice. The 22
.CC-BY-NC-ND 4.0 International licenseauthor/funder. It is made available under aThe copyright holder for this preprint (which was not peer-reviewed) is the. https://doi.org/10.1101/2020.03.09.984658doi: bioRxiv preprint

16
two groups showed unique metabolic profiles as indicated by the principal component 1
analysis (PCA; Figure 4C). Specifically, direct comparison of the metabolite levels 2
between the two groups revealed an enrichment in fatty acids including Stearic, Oleic 3
and Palmitic acid derivatives in the epidermis of K5. Pp6fl/fl mice (Figure 4D), and an 4
increase in TCA cycle-anaplerotic reacting amino acids including L-Glutamine, 5
L-Glutamic acid and L-Aspartic acid compared to Pp6fl/fl controls (Figure 4E). In 6
parallel with this molecular rewiring, we found that L-Ornithine, the direct Arg1 7
product, and Ornithine downstream products (Citrulline, Proline, Creatine and 8
Spermidine) were elevated in the epidermis of K5. Pp6fl/fl mice compared to littermate 9
controls (Figure 4E). QqQ-based LC-SRM-MS/MS also revealed that the urea levels 10
were 1.88-fold higher in the K5. Pp6fl/fl epidermis and 1.2-fold higher in the K5. 11
Pp6fl/fl sera compared to Pp6fl/fl mice (Figures 4F and 4G). Combining the 12
transcriptome and metabolomics data, we found that urea cycle reprogramming was a 13
hallmark of K5. Pp6fl/fl keratinocytes (Figures 4H and 4I). 14
15
We then treated IMQ-induced mice with urea cycle-associated metabolites to study 16
their respective effects on psoriasis-like skin inflammation. Among all the tested 17
metabolites, only Spermidine significantly exacerbated epidermal hyperplasia (Figure 18
4J). Correspondingly, the Ornithine decarboxylase (ODC) inhibitor 19
DL-2-(Difluoromethyl)-ornithine hydrochloride (DFMO), which restricts polyamine 20
generation, mitigated IMQ-induced skin inflammation (Figure 4K). Taken together, 21
we propose that loss of Pp6 promotes transcriptional and coordinated metabolic 22
.CC-BY-NC-ND 4.0 International licenseauthor/funder. It is made available under aThe copyright holder for this preprint (which was not peer-reviewed) is the. https://doi.org/10.1101/2020.03.09.984658doi: bioRxiv preprint
17
adaptations in keratinocytes centered on urea cycle rewiring. Spermidine — a 1
polyamine branched from the urea cycle — is a pro-inflammatory factor in 2
psoriasis-like skin inflammation. 3
4
Pp6-deficient keratinocytes show enhanced oxidative phosphorylation 5
NO negatively impacts OXPHOS efficiency by interacting with the mitochondrial 6
Complex I and cytochrome c oxidase (Complex IV) (Sarti et al., 2012)(Figure S5A). 7
We next decided to investigate the OXPHOS status of Pp6fl/fl and K5. Pp6fl/fl 8
keratinocytes, as the latter showed defective NO production (Figure 4A). To do so, 9
we measured the keratinocyte oxygen consumption rate (OCR) after treatment with 10
different electron transport chain (ETC) modulators. As expected, Pp6 deficiency in 11
keratinocytes led to an elevation in the basal respiration level and spare respiratory 12
capacity despite a decrease in non-mitochondrial respiration (Figure S5B). 13
Meanwhile, we identified extended mitochondrial fuel flexibility for glutamine and 14
glucose in K5. Pp6fl/fl keratinocytes, as indicated by the different dependencies on, 15
and capacities to consume, both fuels (Figure S5C). Conversely, K5. Pp6fl/fl 16
keratinocytes showed a subtle decrease in their glycolytic capacity (Figure S5D). We 17
also found that ATP production by K5. Pp6fl/fl keratinocytes was increased 1.24-fold 18
compared to Pp6fl/fl controls, which was attributed to enhanced OXPHOS (Figure 19
S5E). 20
21
.CC-BY-NC-ND 4.0 International licenseauthor/funder. It is made available under aThe copyright holder for this preprint (which was not peer-reviewed) is the. https://doi.org/10.1101/2020.03.09.984658doi: bioRxiv preprint

18
We then detected the protein levels of ETC components in murine and human 1
samples. In mice, we found that Complex II (Succinate dehydrogenase complex, 2
subunit A, Sdha) and Complex IV (cytochrome c oxidase II, mt-Co2 and cytochrome 3
c oxidase subunit 4I1, Cox4i1) were both enriched in K5. Pp6fl/fl keratinocytes 4
compared to Pp6fl/fl controls, supporting the functional phenotype of Pp6-deficient 5
keratinocytes (Figure S5F). In human samples, we only detected COX4I1 in the basal 6
layer of the epidermis of healthy skin, while the psoriatic epidermis showed 7
condensed and extended COX4I1 expression (Figure S5G). 8
9
We finally treated IMQ-induced mice with the OXPHOS inhibitor Oligomycin. Here, 10
we found that topical Oligomycin application significantly alleviated the 11
psoriasis-like phenotype in C57BL/6 mice, as indicated by delayed ear swelling and 12
relieved acanthosis (Figures S5H-5J). These data suggest that OXPHOS, as a 13
deregulated process in keratinocytes with Pp6 deficiency, might be a target for 14
psoriasis therapy. 15
16
Excessive polyamine production by psoriatic keratinocytes enables self-RNA 17
sensing by myeloid DCs 18
Thus far, we have shown that arginase is increased in Pp6-deficient keratinocytes, 19
which endows psoriatic keratinocytes with urea cycle rewiring and enhanced 20
OXPHOS; however, key questions remained as to whether and how the identified 21
metabolic adaptions within psoriatic keratinocytes affects the immune response. 22
.CC-BY-NC-ND 4.0 International licenseauthor/funder. It is made available under aThe copyright holder for this preprint (which was not peer-reviewed) is the. https://doi.org/10.1101/2020.03.09.984658doi: bioRxiv preprint

19
Previous studies unveiled dramatic increases in the levels of polyamines, including 1
Putrescine, Spermine and Spermidine, in the skin and blood of patients with psoriasis 2
compared to those of healthy donors (Broshtilova et al., 2013; Proctor et al., 1975). 3
Because we showed in this study that polyamine supplementation is detrimental in a 4
mouse model of psoriasis (Figure 4J), we next aimed to characterize the possible 5
underlying mechanisms of their effect on skin inflammation. Polyamines are highly 6
charged aliphatic polycations that bind and aggregate nucleic acids, rendering their 7
application in gene transfection (Zavradashvili et al., 2019), which resembles 8
self-RNA internalization in principle. Given that self-RNA internalization is a pivotal 9
pathogenic factor of psoriasis and other chronic inflammatory disorders (Celhar et al., 10
2015; Ganguly et al., 2009), we hypothesized that polyamines might facilitate this 11
process in the context of disease. To test this, we stimulated secondary lymphoid 12
organ-derived DCs with supernatants of UV-irradiated murine keratinocytes, which 13
underwent apoptosis and necrosis with the release of self-nucleotides (Lovgren et al., 14
2004). Supernatants from K5. Pp6fl/fl keratinocytes showed a higher potency to 15
activate DCs than supernatants from Pp6fl/fl keratinocytes; this difference was 16
abrogated when K5. Pp6fl/fl keratinocytes were pre-treated with DFMO for 48 h to 17
eliminate intracellular polyamines or when the dead keratinocyte supernatants were 18
pre-treated with RNase (Figure 5A). These results indicate that polyamines are 19
possibly involved in sensing of keratinocyte-derived self-RNA by DCs. 20
21
.CC-BY-NC-ND 4.0 International licenseauthor/funder. It is made available under aThe copyright holder for this preprint (which was not peer-reviewed) is the. https://doi.org/10.1101/2020.03.09.984658doi: bioRxiv preprint

20
However, we found that polyamines alone could not achieve the intracellular delivery 1
of RNA molecules to cells (Figure S6). We assumed that cargo molecules in complex 2
with polyamines and RNAs might assist with self-RNA internalization in psoriasis. 3
Using an antibody against Spermidine and Spermine, we immunoprecipitated 4
peptides ≤ 3 kilodalton (kD) and proteins > 3 kD that were in a complex with 5
Spermidine or Spermine in the plasmas of patients with psoriasis and healthy donors 6
(Figure 5B). We identified a 12-amino acid peptide (GGFGGSRGGGGY) 7
originating from heterogeneous nuclear ribonucleoprotein A1 (HNRNPA1) that was 8
enriched in the immunoprecipitates from the patients (Figure 5C). This peptide 9
(designated as HNRNPA1226-237) contains an RGG-box that is indispensable for RNA 10
binding of HNRNPA1, which is a probable psoriasis autoantigen (Jones et al., 2004) 11
(Figure 5D). Using an established Spermidine labeling strategy (Wolf et al., 2006), 12
we were able to observe the co-localization of exotic Spermidine with 488-labeled 13
self-RNA and Tetramethylrhodamine (TMR)-labeled Hnrnpa1226-237 within mouse 14
bone marrow-derived DCs (BMDCs). This unmitigated co-localization of these 15
molecules together with murine MHCII informed us about not only the interaction 16
between self-RNA-polyamine-Hnrnpa1226-237 complexes, but also about the 17
immunogenicity of these complexes (Figure 5E). These 18
self-RNA–polyamine–Hnrnpa1226-237 complexes were more internalized by BMDCs 19
than self-RNA alone (Figure S6), suggestive of increased intracellular delivery of 20
self-RNA to BMDCs. 21
22
.CC-BY-NC-ND 4.0 International licenseauthor/funder. It is made available under aThe copyright holder for this preprint (which was not peer-reviewed) is the. https://doi.org/10.1101/2020.03.09.984658doi: bioRxiv preprint

21
By looking into the RNA-seq data of human primary keratinocytes, we also found 1
that the RNA degradation pathway is highly activated in keratinocytes derived from 2
both the uninvolved and involved skin of patients with psoriasis compared with 3
keratinocytes from healthy skin (Figure S7A). Meanwhile, the widespread existence 4
of extracellular RNases restricts the internalization of self-RNA from dying 5
keratinocytes by DCs. Although polyamines supposedly stabilize RNA, their ability 6
to protect self-RNA from nuclease degradation has not been previously investigated. 7
Here, we found that polyamines protect self-RNA from RNase digestion to varying 8
degrees independent of the presence or absence of Hnrnpa1226-237 (Figure 5F). 9
Notably, Spermine showed superior protective capability over Spermidine and 10
Putrescine, while Hnrnpa1226-237 alone could not prevent RNA degradation when 11
digested with RNase (Figure 5F). 12
13
We next detected cytokine production by BMDCs in different settings of stimulation 14
to investigate whether polyamines indeed enabled self-RNA sensing by DCs. 15
Exposure to polyamines or Hnrnpa1226-237 alone could not activate BMDCs (Figures 16
5G and S7B) while polyamine–self-RNA or Hnrnpa1226-237–self-RNA complexes 17
induced equivalent levels of IL-6 and Tnf production by BMDCs compared to 18
self-RNA alone (Figures 5G and S7B). We observed significantly increased IL-6 and 19
Tnf production when stimulating BMDCs with self-RNA–polyamine–Hnrnpa1226-237 20
complexes (Figures 5G and S7B). Similarly, we found that 21
self-RNA–polyamine–Hnrnpa1226-237 complexes could stimulate human monocyte 22
.CC-BY-NC-ND 4.0 International licenseauthor/funder. It is made available under aThe copyright holder for this preprint (which was not peer-reviewed) is the. https://doi.org/10.1101/2020.03.09.984658doi: bioRxiv preprint
22
derived-DCs (moDCs) to produce IL-6, even when the complexes were treated with 1
RNase prior to stimulation (Figure 5H). Interestingly, the different polyamines 2
showed distinct stimulatory efficiencies between murine BMDCs and human moDCs, 3
and moDCs did not produce considerable TNF-α upon RNA-containing complex 4
stimulation except for self-RNA–Spermine–HNRNPA1226-237 (Figure S7C). Together 5
with Hnrnpa1226-237, polyamines did not promote DNA sensing by plasmacytoid DCs 6
(pDCs, Figure S7D). Although we did not identify clonal expansion when naïve 7
CD4+ T cells were co-cultured with BMDCs pre-stimulated with 8
self-RNA–polyamine–Hnrnpa1226-237 complexes (Figure S7E), the percentage of 9
Th17 cells increased in a co-culture system of BMDCs pre-stimulated with 10
self-RNA–Putrescine–Hnrnpa1226-237 complexes (Figure S7F). 11
12
We next investigated whether there existed other cargo peptides that could assist with 13
self-RNA sensing processes. Importantly, we detected a Keratin 10-derived peptide, 14
Krt1017-28 (SGGGGGGGSVRV) in the sera of K5. Pp6fl/fl but not Pp6fl/fl mice (Figure 15
S7G). Similar to HNRNPA1226-237, Krt1017-28 is positively charged at pH 7 and like 16
many RNA-binding proteins, is glycine rich (Mousavi and Hotta, 2005). We next 17
used self-RNA–Krt1017-28–polyamine complexes to stimulate BMDCs and found that 18
BMDCs secreted IL-6 upon stimulation (Figure S7H). Taken together, we conclude 19
that accumulated polyamines from hyper-proliferative keratinocytes promote 20
self-RNA sensing by DCs with the assistance of cargo peptides. 21
22
.CC-BY-NC-ND 4.0 International licenseauthor/funder. It is made available under aThe copyright holder for this preprint (which was not peer-reviewed) is the. https://doi.org/10.1101/2020.03.09.984658doi: bioRxiv preprint

23
Self-RNA sensing facilitated by polyamines depends on endosomal Tlr7 in 1
myeloid DCs 2
TLR7 and TLR8 are pivotal for DCs to sense exogenously delivered RNA molecules 3
in humans (Sioud, 2006), but TLR8 is non-functional in mice (Hemmi et al., 2002). 4
We next tested whether self-RNA–polyamine–Hnrnpa1226-237 sensing by murine 5
BMDCs is Tlr7 dependent by using Tlr7- mice. We found that IL-6 production (as an 6
indicator of DC activation) was agitated in WT BMDCs stimulated with 7
self-RNA-polyamine-Hnrnpa1226-237 complexes, but restored in Tlr7-deficient 8
BMDCs treated with self-RNA-polyamine-Hnrnpa1226-237 complexes (Figure 6A). 9
Because polyamines protect RNA from degradation in vitro (Figure 5F), we 10
questioned whether RNA molecules in complex with polyamines internalized by DCs 11
are protected and retained in endosomes. We thus treated murine BMDCs with 12
self-RNA–polyamine–Hnrnpa1226-237 complexes containing total RNA derived from 13
human HaCaT cells for 4 h. We then extracted endosomal RNA from these BMDCs 14
and measured the human 28S rRNA abundance. We found an elevated level of 15
exogenous RNA molecules retained in the BMDC endosomes when the RNAs were 16
in a complex with a polyamine and Hnrnpa1226-237 compared to when they were free 17
(Figure 6B). IkappaB-ζ is an essential transcription factor involved in 18
Tlr7-downstream signaling and is required for IL-6 generation (Yamamoto et al., 19
2004). We found that IkappaB-ζ was augmented in the nuclei of BMDCs stimulated 20
with self-RNA–polyamine–Hnrnpa1226-237 complexes (Figure 6C). 21
22
.CC-BY-NC-ND 4.0 International licenseauthor/funder. It is made available under aThe copyright holder for this preprint (which was not peer-reviewed) is the. https://doi.org/10.1101/2020.03.09.984658doi: bioRxiv preprint
24
We next directly visualized the internalization of keratinocyte-derived RNA by DCs 1
in psoriasis-like skin lesions. We performed RNAscope-based fluorescence in situ 2
hybridization (FISH) to detect single molecule Krt14 mRNA (exclusively expressed 3
by keratinocytes) combined with immunofluorescent labelling of Tlr7 and 4
Spermidine/Spermine on DCs isolated from murine skin treated or not with IMQ. We 5
detected clear Krt14 mRNA signals in DCs from IMQ-treated mouse skin, which 6
co-localized with Tlr7 and Spermidine/Spermine (Figures 6D and 6E). To gain a 7
deeper insight into the in vivo DC status in psoriasis-like skin lesions, we merged and 8
visualized scRNAseq datasets of DCs from skin samples of diseased K5. Pp6fl/fl mice, 9
untreated C57BL/6 mice (control) and IMQ-treated C57BL/6 mice. We found that 10
DC populations in lesional K5. Pp6fl/fl skin and in IMQ-treated skin were radically 11
different from the DC populations in control skin (Figures S8A and S8B). 12
Specifically, Lyz1 was highly expressed by DCs in untreated mouse skin; Cd301b 13
(Mgl2)+Sirpa+Cd11b (Itgam)+ cDC2 cells were dominant in IMQ-treated skin; and 14
Cd301b (Mgl2)-Sirpa+Cd11b (Itgam)+Mafb+ DCs (cDC2 or monocyte-derived DCs) 15
were dominant in lesional K5. Pp6fl/fl skin (Figure S8C). Further analysis of the 16
scRNAseq datasets generated from dermal immune cells of patients with psoriasis and 17
healthy donors showed that TLR7 signaling was activated in psoriatic CD1C+SIRPA+ 18
cDC2 or moDC subsets, but not in the CLEC9A+WDFY4+ cDC1 subset (Figure 6F). 19
Of note, Tlr7 signaling was activated in skin DCs from lesional K5. Pp6fl/fl skin 20
compared to normal dermal DCs (Figure 6F). Altogether, these data support that 21
.CC-BY-NC-ND 4.0 International licenseauthor/funder. It is made available under aThe copyright holder for this preprint (which was not peer-reviewed) is the. https://doi.org/10.1101/2020.03.09.984658doi: bioRxiv preprint

25
self-RNA–polyamine–Hnrnpa1226-237 complexes activate endosomal Tlr7 in myeloid 1
DCs of psoriasiform skin lesions. 2
3
Restoring the urea cycle in keratinocyte alleviates psoriasis-like skin 4
inflammation 5
Based on the mechanistic information we had gathered thus far, we finally 6
hypothesized that targeting key nodes of the reprogrammed keratinocyte metabolic 7
network might improve psoriasis-like skin inflammation. Because increased Arg1 is 8
the feature of psoriatic epidermis and the direct cause of urea cycle rewiring, we 9
decided to use nor-NOHA to inhibit Arg1 enzymatic activity. We topically injected 10
C57BL/6 mice with nor-NOHA (100 μg/mouse/day) and smeared 5% IMQ cream on 11
the ear daily for 6 consecutive days. Inhibiting Arg1 delayed ear swelling and 12
alleviated the inflammatory phenotype (erythema, thickness and scaling) in 13
IMQ-treated mice compared to vehicle (PBS)-treated mice (Figures 7A and 7B). 14
Histological analysis showed that nor-NOHA remarkably suppressed epidermal 15
hyperplasia (Figures 7C and 7D). Mitigated DC activation as indicated by decreased 16
expression levels of CD80, CD86 and MHCII on cell surface was detected in the 17
dermis and draining lymph nodes of mice treated with nor-NOHA or DFMO 18
compared to vehicle-treated mice on Day 3 of IMQ induction (Figure 7E). To better 19
evaluate the translational potential of inhibiting arginase activity to treat psoriasis, we 20
also exposed cynomolgus monkeys to IMQ on the back-shoulders to induce 21
psoriasis-like skin inflammation; we then monitored the effects of nor-NOHA on 22
.CC-BY-NC-ND 4.0 International licenseauthor/funder. It is made available under aThe copyright holder for this preprint (which was not peer-reviewed) is the. https://doi.org/10.1101/2020.03.09.984658doi: bioRxiv preprint

26
inflammation. nor-NOHA treatment significantly reduced the clinical scores and 1
acanthosis of the skin inflammation as well as the infiltration of CD4+ and CD11C+ 2
cells, as compared with vehicle-treated controls (Figures 7F-7J). 3
4
To test the effects of nor-NOHA, DFMO and Oligomycin, which inhibit arginase 5
activity, polyamine synthesis and OXPHOS respectively, on the dispersed skin 6
lesions of K5. Pp6fl/fl mice, we injected these compounds intraperitoneally to the 7
diseased mice every other day for 2 weeks. nor-NOHA and DFMO treatment 8
significantly reduced the PASI of the diseased mice but Oligomycin had no notable 9
therapeutic effects (Figures 7K-M). These data support that preventing urea cycle 10
rewiring rescues formed skin lesions of K5. Pp6fl/fl mice. OXPHOS might be a 11
pathogenic factor of disease development but not maintenance in K5. Pp6fl/fl mice. 12
13
.CC-BY-NC-ND 4.0 International licenseauthor/funder. It is made available under aThe copyright holder for this preprint (which was not peer-reviewed) is the. https://doi.org/10.1101/2020.03.09.984658doi: bioRxiv preprint
27
1
DISCUSSION 2
3
Pioneering genetic mouse models have used gene overexpression approaches to 4
agitate the inflammatory response. By contrast, we used a knockout strategy in this 5
study to break the intrinsic balance of epidermis homeostasis and achieve a 6
predisposed disease status. Specifically, we deleted Pp6 in keratinocytes, which 7
resulted in coordinated transcriptional and metabolic rewiring of urea cycle in 8
keratinocytes. We also found that keratinocyte-derived polyamines trigger self-RNA 9
endosomal sensing, and for the first time identified a direct link between keratinocyte 10
hyperproliferation and innate immune responses in psoriasis maintenance. These 11
findings provide a step forward in the mechanistic delineation of chronic 12
inflammation. Targeting nodal points (arginase activity, polyamine generation and 13
OXPHOS) in these metabolic adaptations elicited by Pp6 ablation might constitute a 14
novel strategy to improve psoriasis and other chronic inflammatory diseases in 15
affected patients (Figure S8). 16
17
In 2016, Swindell et al. performed a “cross-disease” RNA-seq meta-analysis on 18
psoriasis and other skin-confined disorders (Swindell et al., 2016). Their findings led 19
to the notion that psoriasis shares most DEGs with many other skin conditions while 20
psoriasis-specific DEGs are expressed by keratinocytes and are induced by IL-17A 21
(Swindell et al., 2016). Here, we show that IL-17A downregulates PP6 in 22
.CC-BY-NC-ND 4.0 International licenseauthor/funder. It is made available under aThe copyright holder for this preprint (which was not peer-reviewed) is the. https://doi.org/10.1101/2020.03.09.984658doi: bioRxiv preprint
28
keratinocytes and that Pp6-deficient keratinocytes harbor DEGs that overlap with 1
genes that are transcriptionally activated by C/EBPβ, a key transcriptional factor 2
involved in IL-17 receptor-mediated signaling (Song and Qian, 2013). Concomitantly, 3
ARG1 is highly expressed upon C/EBP-β activation due to PP6 ablation in 4
keratinocytes; this gene was also the most psoriasis-specific gene identified in the 5
previous “cross-disease” study. Together, these findings suggest that impaired PP6 6
expression in psoriatic keratinocytes is a pivotal molecular event that transduces 7
IL-17 signaling in a keratinocyte-intrinsic fashion. By generating a 8
psoriasis-predisposed mouse model, we were able to elucidate this previously 9
neglected axis. 10
11
ARG1 is an M2 macrophage marker that is well-known for restricting NO generation. 12
An intriguing study on patients with psoriasis showed that an NO-donating gel 13
significantly mitigated psoriatic plaques (Abeyakirthi et al., 2010). This finding 14
supports that arginase is overactive in the psoriatic epidermis and infers the potential 15
of metabolic manipulation in psoriasis treatment. Despite this advance, the direct 16
effects of arginase-mediated metabolic fluxes were still ill-defined in both M2 17
macrophages and in the broader context of immune regulation. 18
19
Cellular metabolites can have a profound influence on physiological and pathological 20
processes through their interactions with big molecules, or more specifically, through 21
protein structure modifications (Li et al., 2010). For example, Succinate induces IL-1β 22
.CC-BY-NC-ND 4.0 International licenseauthor/funder. It is made available under aThe copyright holder for this preprint (which was not peer-reviewed) is the. https://doi.org/10.1101/2020.03.09.984658doi: bioRxiv preprint

29
secretion by stabilizing HIF-1α in macrophages (Tannahill et al., 2013) and 1
L-Arginine supports T-cell survival by interacting with three nuclear proteins (Geiger 2
et al., 2016). Here, we reveal the functional significance of another aspect of 3
metabolite–big molecule interactions by studying nucleic acids in complex with 4
metabolites. In the context of chronic inflammation, we show these interactions affect 5
the intercellular crosstalk between psoriatic keratinocytes and DCs. Given the central 6
role of nucleic acid sensing in the pathogenesis of various auto-inflammatory diseases, 7
our findings extend our understanding of keratinocyte-featured metabolic scenario 8
and a pro-inflammatory role of keratinocyte-derived metabolites to activate DCs in 9
psoriasis. 10
11
Reduced Arginine availability results in T-cell anergy or death (Geiger et al., 2016); 12
we were thus interested in the effects of Arginine consumption by psoriatic 13
keratinocytes on T-cell activity. In this study, K5. Pp6fl/fl mice showed equivalent 14
Arginine levels in the epidermis when compared to littermate controls. Similarly, we 15
found no difference in the serum Arginine abundance between patients with psoriasis 16
and healthy individuals. scRNAseq analysis, however, found that basal keratinocytes 17
from the psoriatic epidermis highly expressed ASS1, the key enzyme required for de 18
novo Arginine generation. We assume, therefore, that basal keratinocytes act as a 19
source of cutaneous Arginine, which is the “master and commander” of innate 20
immune responses (Morris, 2010). 21
22
.CC-BY-NC-ND 4.0 International licenseauthor/funder. It is made available under aThe copyright holder for this preprint (which was not peer-reviewed) is the. https://doi.org/10.1101/2020.03.09.984658doi: bioRxiv preprint

30
To assess the contributions of metabolic rewiring to psoriasis pathology, we used 1
small molecules, including Oligomycin, DFMO and nor-NOHA, to target different 2
metabolic nodes identified from K5. Pp6fl/fl keratinocytes to treat IMQ-induced 3
psoriasis-like skin inflammation. From the perspective of disease mechanism 4
delineation, the validity of these molecules demonstrates the involvement of 5
OXPHOS, polyamine biosynthesis and arginase as pathogenic factors in psoriasis-like 6
inflammation. From the metabolic network perspective, we suggest that increased 7
arginase activity in the psoriatic epidermis is a causative factor for inordinate 8
polyamine generation and decreased NO levels, the latter directly affecting OXPHOS 9
capacity. Phase 1 and phase 2 clinical trials for coronary artery disease (Kovamees et 10
al., 2014) have shown that nor-NOHA is safe and efficient in human patients at both 11
restraining polyamine synthesis and restoring NO production (Li et al., 2016; Moon et 12
al., 2014). We propose that nor-NOHA is a promising drug candidate for psoriasis 13
treatment as its specific target arginase is central in the metabolic adaptation of 14
psoriatic keratinocytes. 15
16
In summary, our new mouse model of psoriasis with keratinocyte metabolic rewiring 17
has helped us elucidate the metabolite-facilitated activation of innate immunity. This 18
study presents a previously unrecognized scenario based on self-RNA sensing in 19
chronic skin inflammation. Going forward, a mouse model with impaired 20
polyamine-producing activity in keratinocytes should be generated to investigate the 21
precise contribution of polyamines to self-RNA sensing in psoriasis. Further 22
.CC-BY-NC-ND 4.0 International licenseauthor/funder. It is made available under aThe copyright holder for this preprint (which was not peer-reviewed) is the. https://doi.org/10.1101/2020.03.09.984658doi: bioRxiv preprint

31
pre-clinical studies on the therapeutic efficacy of nor-NOHA delivered orally or 1
intravenously to treat psoriasis are needed, so as contrastive researches on nor-NOHA 2
tested together with other anti-psoriasis drugs. 3
4
.CC-BY-NC-ND 4.0 International licenseauthor/funder. It is made available under aThe copyright holder for this preprint (which was not peer-reviewed) is the. https://doi.org/10.1101/2020.03.09.984658doi: bioRxiv preprint
32
1
METHODS 2
3
Human subjects 4
Psoriatic skin samples were obtained by punch biopsy from patients who were under 5
local lidocaine anesthesia. Normal adult human skin specimens were taken from 6
healthy donors who were undergoing plastic surgery. Serum samples were collected 7
from patients diagnosed with psoriasis vulgaris and healthy donors. Human peripheral 8
blood mononuclear cells (PBMCs) were obtained from blood buffy coats of healthy 9
donors. Patient information is provided in Supplementary Table 1. All participants 10
provided written informed consent. The study was performed in accordance with the 11
principles of the Declaration of Helsinki and approved by the Research Ethics Board 12
of Xiangya Hospital of Central South University, Shanghai General Hospital, 13
Shanghai Tenth People's Hospital and Changhai Hospital (No. 201311392 and No. 14
2018KY239). 15
16
Immunohistochemical and histological analysis 17
Skin specimens were embedded in paraffin and sectioned at the Histology Core of the 18
Shanghai Institute of Immunology. For immunohistochemical staining, the sections 19
were deparaffinized and washed in phosphate-buffered saline (PBS). Antigen retrieval 20
was performed by heating the sections in 10 mM sodium citrate buffer (pH = 6.0). 21
The sections were washed in PBS after cooling, incubated in 3% hydrogen peroxide 22
for 10 min at room temperature (RT) and then washed again in PBS. The sections 23
.CC-BY-NC-ND 4.0 International licenseauthor/funder. It is made available under aThe copyright holder for this preprint (which was not peer-reviewed) is the. https://doi.org/10.1101/2020.03.09.984658doi: bioRxiv preprint
33
were blocked in PBS containing 1% bovine serum albumin (BSA) for 1 h at RT and 1
stained in blocking buffer containing primary antibody (anti-PP6C, Merck Millipore 2
cat. 07-1224, 1:50 dilution; anti-mouse Ki67, Servicebio cat. GB13030-2, 1:100 3
dilution) overnight at 4℃. On the following day, the sections were warmed to RT for 4
1 h, washed three times in PBS and stained with an HRP-polymer complex for 20 min, 5
which was followed by incubation with secondary antibody for 20 min. The sections 6
were washed three times in PBS, developed with DAB reagent (Peroxidase Substrate 7
Kit, ZSGB-BIO cat. ZLI-9018) and counterstained with hematoxylin. The sections 8
were washed with tap water and then subsequent washes of increasing ethanol 9
concentration for dehydration. Once mounted and air-dried, the slices were viewed 10
under a Zeiss Axio Scope.A1 light microscope equipped with an AxioCam MRc 11
digital camera and analyzed with Axiovision software. Epidermal hyperplasia 12
(acanthosis) was assessed as a histological feature. The pixel size of the epidermal 13
area was measured using the lasso tool in Adobe Photoshop CS4. The absolute area of 14
the epidermis (100 times magnification) was calculated using the following formula: 15
area (mm2) = 1.012 × pixels/106. To quantify the expression levels of PP6, the 16
histochemistry score (H score) was applied to evaluate the positive cases, in which 17
both the intensity and the percentage of positivity were considered using the 18
following formula: H score = 3 × (strong intensity) × % + 2 × (moderate intensity) 19
× % + 1 × (mild intensity) × %. 20
21
Animals 22
.CC-BY-NC-ND 4.0 International licenseauthor/funder. It is made available under aThe copyright holder for this preprint (which was not peer-reviewed) is the. https://doi.org/10.1101/2020.03.09.984658doi: bioRxiv preprint
34
Pp6fl/fl mice were provided by Dr. Wufan Tao (State Key Laboratory of Genetic 1
Engineering and Institute of Developmental Biology and Molecular Medicine, Fudan 2
University, Shanghai, China) (Ye et al., 2015). Keratin 5-Cre transgenic mice were 3
provided by Dr. Xiao Yang (State Key Laboratory of Proteomics, Genetic Laboratory 4
of Development and Disease, Institute of Biotechnology, Beijing, China) (Mao et al., 5
2003). Toll-like receptor 7 targeted mutation (Tlr7-) mice were obtained from The 6
Jackson Laboratory (Lund et al., 2004). IL17-GFP mice were provided by Dr. Zhinan 7
Yin (The First Affiliated Hospital, Biomedical Translational Research Institute and 8
Guangdong Province Key Laboratory of Molecular Immunology and Antibody 9
Engineering, Jinan University) (MGI: J:184819). The mice were bred and maintained 10
under specific pathogen-free (SPF) conditions. Age-matched and sex-matched mice 11
were used for all of the experiments in accordance with the National Institutes of 12
Health Guide for the Care and Use of Laboratory Animals with the approval 13
(SYXK-2003-0026) of the Scientific Investigation Board of Shanghai Jiao Tong 14
University School of Medicine in Shanghai, China. To ameliorate any suffering that 15
the mice observed throughout these experimental studies, the mice were euthanized 16
by CO2 inhalation. Healthy Cynomolgus monkeys, ranging in age from 3 to 5 years, 17
were raised in the monkey breeding base of Changchun Biotechnology Development 18
Co., Ltd. (SYXK Gui 2015-0001), Guangxi, China. The managing protocols of the 19
monkeys were carried out in accordance with the standard procedures of Shanghai 20
Hekai Biotechnology Co., Ltd., referring to the Guide for Care and Use of Laboratory 21
.CC-BY-NC-ND 4.0 International licenseauthor/funder. It is made available under aThe copyright holder for this preprint (which was not peer-reviewed) is the. https://doi.org/10.1101/2020.03.09.984658doi: bioRxiv preprint
35
Animal (2010) and the principles on Animal Welfare Management (Public Law 1
99-198). 2
3
Animal models of psoriasis and treatment 4
For the IMQ-induced mouse model of psoriasis, male C57BL/6 mice (7 weeks-of-age) 5
purchased from Shanghai SLAC Laboratory Animal Co. (Shanghai, China) were 6
maintained under SPF conditions. The mice were subjected to a daily topical dose of 7
62.5 mg IMQ cream (5%) (MedShine cat. 120503) on the shaved back or 20 mg per 8
ear for six consecutive days. On the indicated days, the skin thickness was measured 9
with a micrometer (Schieblehre). The control mice were treated with an equivalent 10
dose of vehicle cream. For the metabolite treatment, L-Arginine (Sangon Biotech cat. 11
A600205, 5 mg/ml), L-Ornithine (Sigma-Aldrich cat. O6503, 4 mg/ml), L-Proline 12
(Sangon Biotech cat. A600923, 4 mg/ml), Creatine (Sangon Biotech cat. A600326, 10 13
mg/ml), L-Citrulline (Sangon Biotech cat. A604057, 5 mg/ml) and Spermidine 14
(Sigma-Aldrich cat. S0266, 2 mg/ml) were added to the drinking water 7 days prior to 15
the IMQ application and the treatment lasted until the end of model establishment. 16
For the therapeutic experiments, 25 μl PBS containing DFMO (Sigma-Aldrich cat. 17
D193, 4 μg/μl), nor-NOHA (Cayman cat. 1140844-63-8, 4 μg/μl) and Oligomycin 18
(Abcam cat. 141829, 0.2 μg/μl) were intradermally injected to the dorsal side of the 19
mouse ears daily prior to the IMQ treatment. For the IL-23-mediated mouse model of 20
psoriasis, the ears of the mice were intradermally injected with 500 ng recombinant 21
mouse IL-23 (R&D Systems cat. 1887-ML-010) dissolved in 25 μl PBS into one ear 22
.CC-BY-NC-ND 4.0 International licenseauthor/funder. It is made available under aThe copyright holder for this preprint (which was not peer-reviewed) is the. https://doi.org/10.1101/2020.03.09.984658doi: bioRxiv preprint

36
and 25 μl PBS into the contralateral ear. The injections were continued every other 1
day for a total of eight injections. The ears were collected for analysis on day 16. To 2
treat K5. Pp6fl/fl mice, an intraperitoneal injection of 100 μl PBS containing 3
nor-NOHA (2 μg/μl) or DFMO (1 μg/μl) or Oligomycin (0.1 μg/μl) was performed 4
every other day for 2 weeks. All procedures were approved and supervised by 5
Shanghai Jiao Tong University School of Medicine Animal Care and Use Committee. 6
For the IMQ-induced non-human primate model of psoriasis, the Cynomolgus 7
monkeys were depilated on the back shoulders and subjected to a daily dose of 120 8
mg IMQ cream in the morning for 10 days. An intradermal injection of 50 μl PBS 9
containing nor-NOHA (10 μg/μl) was performed every afternoon post-IMQ 10
application. An equal volume of PBS was injected to the contralateral shoulder of the 11
monkey. The clinical scores of the skin phenotype were graded according to Lattice 12
System Physician’s Global Assessment (Langley and Ellis, 2004). 13
14
Immunoprecipitation and immunoblotting 15
For PP6 immunoprecipitation, nuclear and cytoplasmic extracts from HaCaT cells 16
were prepared with a Nuclear Protein Extraction Kit (Beyotime cat. P0027) 17
supplemented with a protease inhibitor cocktail (Bimake cat. B14001). The lysates 18
were incubated with anti-PPP6C (Abcam cat. 131335, 1:50) or rabbit IgG (Abcam cat. 19
172730) overnight at 4℃, followed by binding of protein A/G magnetic beads (Merck 20
Millipore cat. LSKMAGAG02) for 4 h at 4℃. The beads were rinsed three times with 21
a wash buffer and then eluted with SDS loading buffer. The immunoprecipitates were 22
.CC-BY-NC-ND 4.0 International licenseauthor/funder. It is made available under aThe copyright holder for this preprint (which was not peer-reviewed) is the. https://doi.org/10.1101/2020.03.09.984658doi: bioRxiv preprint

37
then subjected to immunoblotting. For Spermidine/Spermine immunoprecipitation, 1
anti-Spermine (Abcam cat. 26975) or rabbit IgG was cross-linked to protein A/G 2
magnetic beads (Bimake cat. B23202) using dimethyl pimelimidate (ThermoFisher 3
Scientific cat. 21667). Plasma samples from psoriasis patients and healthy donors 4
were pre-cleared with rabbit IgG and protein A/G magnetic beads, and then incubated 5
with the antibody-cross-linked beads overnight at 4℃. The beads were rinsed three 6
times with a wash buffer and eluted with 50 mM Glycine (pH = 2.8). The 7
immunoprecipitates were neutralized with 1 M Tris-HCl (pH = 7.5) and subjected to 8
protein mass spectrometry. For immunoblotting, mouse skins, cultured cells or 9
nuclear fractions were lysed in radioimmunoprecipitation assay buffer containing a 10
protease and phosphatase inhibitor cocktail (ThermoFisher Scientific cat. 78440). 11
Anti-PPP6C (Abcam cat. 131335, 1:1000 dilution), anti-β-actin (Proteintech cat. 12
60008-1-Ig, 1:20000 dilution), anti-C/EBPβ (Santa Cruz cat. 7962, 1:1000 dilution), 13
anti-p-C/EBPβ (Thr188) (Cell Signaling Technology cat. 3084, 1:1000 dilution), 14
anti-ARG1 (Proteintech cat. 66129-1-Ig, 1:1000 dilution), anti-SDHA (Proteintech cat. 15
14865-1-AP, 1:1000 dilution), anti-MTCO2 (Proteintech cat. 55070-1-AP, 1:1000 16
dilution), anti-COX4I1 (Proteintech cat. 11242-1-AP, 1:1000 dilution), 17
anti-IkappaB-ζ (Cell Signaling Technology cat. 93726, 1:1000 dilution), anti-alpha 18
Tubulin (Proteintech cat. 66031-1-Ig, 1:2000 dilution), anti-GAPDH (Proteintech cat. 19
60004-1-Ig, 1:10000 dilution), anti-Histone H3 (Cell Signaling Technology cat. 4620, 20
1:1000 dilution), HRP-labeled goat anti-mouse IgG (H+L) (Beyotime cat. A0216, 21
1:1000 dilution) and HRP-labeled goat anti-rabbit IgG (H+L) (Beyotime cat. A0208, 22
.CC-BY-NC-ND 4.0 International licenseauthor/funder. It is made available under aThe copyright holder for this preprint (which was not peer-reviewed) is the. https://doi.org/10.1101/2020.03.09.984658doi: bioRxiv preprint
38
1:1000 dilution) were used as the antibodies. The signal was detected with ECL 1
Western Blotting Substrate (ThermoFisher Scientific cat. 34095) and an Amersham 2
Imager 600 (GE Healthcare). The images were cropped for presentation. 3
4
Flow cytometry 5
Single cell suspensions generated from the skin of Pp6fl/fl, K5. Pp6fl/fl or C57BL/6 6
(IMQ treated or not) mice were stained with fluorophore-conjugated antibodies. After 7
washing, the cells were assayed with a BD LSRFORTESSA flow cytometer, and the 8
data were analyzed using FlowJo software. Monoclonal antibodies against CD45 9
(clone 30-F11), CD3 (clone 145-2C11), CD11c (clone N418), F4/80 (clone BM8), 10
Ly6G (clone 1A8-Ly6g), CD31 (clone PECAM-1), CD80 (clone 16-10A1), CD86 11
(clone GL1), MHC Class II (clone M5/114.15.2) which were obtained from 12
eBioscience, were used in the flow cytometry analyses. 13
14
Immunofluorescence 15
Cryosections (10 �m) of mouse or monkey skin were cut using a cryostat (Leica, 16
CM1950) and fixed in ice-cold acetone for 15 min. Human paraffin sections were 17
dewaxed and antigen unmasked. The slices were blocked with 1% BSA/PBS for 1 h 18
and stained with anti-Krt5 (Invitrogen cat. MA5-17057, 1:100 dilution), anti-PPP6C 19
(Abcam cat. 131335, 1:50 dilution), anti-mouse Ki67 (Servicebio cat. GB13030-2, 20
1:50 dilution), anti-Krt6 (Proteintech cat. 10590-1-AP, 1:2000 dilution), anti-mouse 21
CD80 (BioLegend cat. 104702, 1:50 dilution), anti-eosinophil peroxidase (EPX, Santa 22
.CC-BY-NC-ND 4.0 International licenseauthor/funder. It is made available under aThe copyright holder for this preprint (which was not peer-reviewed) is the. https://doi.org/10.1101/2020.03.09.984658doi: bioRxiv preprint

39
Cruz cat. 19148, 1:50 dilution), anti-C/EBPβ (Santa Cruz cat. 7962, 1:100 dilution), 1
anti-p-C/EBPβ (Thr235) (Cell Signaling Technology cat. 3084, 1:100 dilution), 2
anti-ARG1 (Proteintech cat. 66129-1-Ig, 1:1000 dilution), anti-COX4I1 (Proteintech 3
cat. 11242-1-AP, 1:100 dilution), anti-ASS1 (Proteintech cat. 16210-1-AP, 1:100 4
dilution), anti-human CD4 (BioLegend cat. 317402, 1:50 dilution) and anti-human 5
Integrin α-X (Santa Cruz cat. 1185, 1:50 dilution) overnight at 4℃. Thereafter, the 6
slices were rinsed three times in PBS and stained with fluorochrome-conjugated 7
secondary antibodies (all from Life Technologies) at a 1:500 dilution for 1 h at RT in 8
the dark. DAPI (BD Biosciences cat. 564907) incubation at a 1:2,000 dilution at RT 9
for 5 min was used for nuclei staining. After being washed in PBS, the slices were 10
mounted with a fluorescent mounting medium (Dako cat. S3023) and visualized 11
under a confocal microscope (Leica, TCS SP8). 12
13
TEWL measurement 14
TEWL measurements were carried out at RT and at a humidity level of 50 ± 20%. 15
The experiments were performed in triplicate for each spot using a gpskin™ Barrier 16
Light skin barrier function measurement device. 17
18
Cell culture 19
To isolate primary murine keratinocytes, the skin from the tails of adult mice was cut 20
into small pieces and then suspended on Dispase II (Sigma-Aldrich cat. D4693, 2 21
mg/ml) overnight at 4℃. The following day, the epidermis was peeled and placed 22
.CC-BY-NC-ND 4.0 International licenseauthor/funder. It is made available under aThe copyright holder for this preprint (which was not peer-reviewed) is the. https://doi.org/10.1101/2020.03.09.984658doi: bioRxiv preprint
40
into 0.05% trypsin-EDTA (Gibco cat. 25300062) for 10 min at 37℃ with gentle 1
shaking. The cell suspension was added to a cold trypsin neutralization solution and 2
then centrifuged at 400 g for 10 min. The cells were cultured in Medium 154CF 3
(Gibco cat. M154CF500) supplemented with 0.05 mM calcium chloride and human 4
keratinocyte growth supplement (Gibco cat. S0015). HaCaT cells and NIH3T3 cells 5
were cultured in DMEM/high glucose (HyClone cat. SH30022.01) containing 10% 6
fetal bovine serum (FBS). Normal Human Epidermal Keratinocytes (NHEKs; Lifeline 7
Cell Technology, cat. FC-0007) stored in liquid nitrogen were defrosted and cultured 8
in serum-free basal medium with growth factors (Lifeline Cell Technology, cat. 9
LL-0007). The medium was refreshed every 2 days and the cells were sub-cultured 10
according to the cell fusion. Cells at passage 2-6 were used for subsequent 11
experiments. Immature BMDCs were harvested from femurs and tibias of 12
8-to12-week-old mice and cultured in the presence of recombinant mouse GM-CSF 13
(R&D Systems cat. 415-ML, 20 ng/ml) and IL-4 (R&D Systems cat. 404-ML, 10 14
ng/ml) in RPMI 1640 medium (Gibco cat. 11875093) supplemented with 10% FBS 15
and 2-Mercaptoethanol (Gibco cat. 21985023) for 6 days. Immature human moDCs 16
were generated from PBMCs using CD14 Microbeads (Miltenyi Biotec cat. 17
130-050-201) and cultured for 6 days with recombinant GM-CSF (R&D Systems cat. 18
215-GM, 50 ng/ml) and IL-4 (R&D Systems cat. 204-IL, 35 ng/ml) in RPMI 1640 19
medium supplemented with 10% FBS and 2-Mercaptoethanol. Mouse pDCs were 20
generated in the presence of 200 ng/mL recombinant Flt3l (PeproTech cat. 250-31L) 21
.CC-BY-NC-ND 4.0 International licenseauthor/funder. It is made available under aThe copyright holder for this preprint (which was not peer-reviewed) is the. https://doi.org/10.1101/2020.03.09.984658doi: bioRxiv preprint
41
from bone marrow cells and purified by fluorescence-activated cell sorting (FACS) 1
for B220+CD317+ cells. 2
3
RNA-seq and qPCR 4
Skin biopsy specimens were snap-frozen in liquid nitrogen and pulverized. HaCaT 5
cells were rinsed with PBS. Total RNA was isolated using TRIzol Reagent 6
(Invitrogen cat. 15596026) and quantified with a NanoDrop spectrophotometer. For 7
RNA-seq, a cDNA library was prepared using a TruSeq RNA sample preparation kit 8
(Illumina cat. FC-122-1001) according to the manufacturer’s instructions. The 9
samples were quantified using a TBS-380 microfluorometer with Picogreen reagent, 10
clustered with a TruSeq paired-end cluster kit v3-cBot-HS (Illumina cat. PE-401-3001) 11
and sequenced on an Illumina HiSeq2000 platform (100 bp, TruSeq SBS kit v3-HS, 12
200 cycles). The adaptor sequences were trimmed from the raw paired-end reads, and 13
RNA de novo assembly was achieved using TopHat (http://tophat.cbcb.umd.edu/). 14
The read counts were further normalized into FPKM values, and the fold changes 15
were calculated using Cufflinks (http://cole-trapnell-lab.github.io/cufflinks/). DEGs 16
were identified using Cuffdiff (http://cole-trapnell-lab.github.io/cufflinks/cuffdiff/). 17
Cross-species analyses were joined by case-insensitive gene symbol matching. For the 18
psoriasis analysis, the RNA-seq data set from 82 normal skin samples and 92 19
psoriasis skin samples (accession no. GSE54456) was used. For the atopic dermatitis 20
analysis, 30 human skin samples (15 samples from subjects with atopic dermatitis and 21
15 samples from healthy subjects) were obtained from arrays (accession no. 22
.CC-BY-NC-ND 4.0 International licenseauthor/funder. It is made available under aThe copyright holder for this preprint (which was not peer-reviewed) is the. https://doi.org/10.1101/2020.03.09.984658doi: bioRxiv preprint
42
GSE12511). Pathway enrichment analysis was performed using the clusterProfiler 1
package (DOI: 10.18129/B9.bioc.clusterProfiler). 2
3
For qPCR detection of ARG1, total RNA from HaCaT cells was reverse-transcribed 4
into cDNA using an M-MLV First-Strand Synthesis Kit (Invitrogen cat. C28025-021) 5
with oligo(dT) primers. qPCR was conducted with the FastStart Universal SYBR 6
Green Master (Roche cat. 04913914001) in a ViiA 7 Real-Time PCR system (Applied 7
Biosystems). The relative expression of target genes was confirmed using the quantity 8
of target gene/quantity of GAPDH. For qPCR detection of human 28S rRNA, 9
endosomes from mouse BMDCs treated with RNA complexes for 4 h were collected 10
using a Minute™ Endosome Isolation and Cell Fractionation Kit (Invent Biotech cat. 11
ED-028) and endosomal RNA was extracted and then reversed-transcribed with 12
random primers. The following primers were used: GAPDH forward: 13
TGCACCACCAACTGCTTAGC, GAPDH reverse: 14
GGCATGGACTGTGGTCATGAG; ARG1 forward: 15
CCCTGGGGAACACTACATTTTG, ARG1 reverse: 16
GCCAATTCCTAGTCTGTCCACTT; human 28S rRNA forward: 17
GCTACCCACCCGACCCGTCT, human 28S rRNA reverse: 18
GCGCCGGCCTTCACCTTCAT. 19
20
Semi-quantitative cytokine array 21
.CC-BY-NC-ND 4.0 International licenseauthor/funder. It is made available under aThe copyright holder for this preprint (which was not peer-reviewed) is the. https://doi.org/10.1101/2020.03.09.984658doi: bioRxiv preprint
43
The cytokine levels in mouse skin were measured with a Mouse Cytokine Array 1
GS4000 (RayBiotech cat. GSM-CAA-4000-1) according to the manufacturer’s 2
instructions. The fluorescein-labeled array was visualized using an InnoScan 300 3
Microarray Scanner. Data were extracted by GenePix Pro 5.1 software and analyzed 4
with RayBiotech Q-Analyzer software. 5
6
ELISA 7
The serum IgE levels of the mice were measured using Mouse IgE ELISA MAX™ 8
Deluxe (BioLegend cat. 432404) according to the manufacturer’s instructions. To 9
detect murine IL-6 and Tnf in BMDC cultures, a Mouse IL-6 ELISA kit 10
(NeoBioscience cat. EMC004.96) and a Mouse TNF-α ELISA kit (NeoBioscience cat. 11
EMC102a.96) was used. To detect human IL-6 and TNF-α in moDC cultures, a 12
Human IL-6 ELISA Kit (MultiSciences cat. 70-EK106/2-96) and a Human TNF-α 13
High Sensitivity ELISA Kit (MultiSciences cat. 70-EK182HS-96) was used. To 14
detect murine Ifn-α in pDC cultures, a Mouse IFN-alpha ELISA Kit (R&D Systems 15
cat. 42120-1) was used. 16
17
Halometasone painting and IL-17A neutralization treatment 18
Halometasone cream (50 mg; Bright Future Pharmaceutical Laboratories Limited) 19
was topically painted onto the plaques of affected K5. Pp6fl/fl mice every other day for 20
2 weeks. Then, 100 μg anti-mouse IL-17A (BioxCell cat. BE0173) or isotype control 21
.CC-BY-NC-ND 4.0 International licenseauthor/funder. It is made available under aThe copyright holder for this preprint (which was not peer-reviewed) is the. https://doi.org/10.1101/2020.03.09.984658doi: bioRxiv preprint

44
(BioxCell cat. BE0083) was intraperitoneally injected into the affected K5. Pp6fl/fl 1
mice once each week for a month. 2
3
RNA interference 4
Small interfering RNA (siRNA) targeting human PPP6C was synthesized by 5
GenePharma: sense: CUAAAUGGCCUGAUCGUAU, anti-sense: 6
AUACGAUCAGGCCAUUUAG. The siRNA molecules were transfected using a 7
TransIT-X2 Dynamic Delivery System (Mirus cat. MIR 6000). 8
9
ChIP-qPCR 10
ChIP was performed using the SimpleCHIP enzymatic chromatin 11
immunoprecipitation kit (Cell Signaling Technology cat. 9002) according to the 12
manufacturer's instruction with minor modifications. In brief, primary mouse 13
keratinocytes were harvested and cross-linked with 1% (v/v) formaldehyde for 10 min 14
at RT. Subsequently, the nuclei were isolated by lysing the cytoplasmic fraction, and 15
chromatin was digested into fragments of 150–900 bp with micrococcal nuclease for 16
20 min at 37℃, followed by ultrasonic disruption of the nuclear membrane using a 17
standard microtip and a Branson W250D Sonifier (four pulses, 60% amplitude and 18
duty cycle 40%). The sonicated nuclear fractions were divided for input control and 19
for overnight incubation at 4℃ with 10 μg of either anti-C/EBPβ (Abcam cat. 32358) 20
or the negative control IgG. After incubation with 30 μl ChIP grade protein G-agarose 21
beads for 2 h at 4 °C, the Ab-protein-DNA complexes were eluted from the beads and 22
.CC-BY-NC-ND 4.0 International licenseauthor/funder. It is made available under aThe copyright holder for this preprint (which was not peer-reviewed) is the. https://doi.org/10.1101/2020.03.09.984658doi: bioRxiv preprint

45
digested by proteinase K (40 μg) for 2 h at 65 ℃, followed by spin column-based 1
purification of DNA. Finally, genomic DNA recovered from the ChIP were qPCR 2
amplified with primers specific to the C/EBPβ binding elements of the Arg1 promoter 3
region. The primers used to detect the Arg1 promoter sequence were as follows: 4
forward: CCCAAAGTGGCACAACTCAC, reverse: 5
GCAGAAGGCTTTGTCAGCAG. The signals were expressed as a percentage of the 6
total input chromatin. 7
8
ScRNAseq 9
Fresh skin was placed in saline at 4℃ until further processing. Single cell suspensions 10
were generated by enzyme digestion and subjected to FACS to exclude doublets, 11
debris and DAPI-positive dead cells. Sorted cells were centrifuged and resuspended in 12
0.04% BSA in PBS. Chromium Single Cell 3’ v3 (10X Genomics) library preparation 13
was conducted by the Sequencing Core at the Shanghai Institute of Immunology, 14
according to the manufacturer’s instructions. The resulting libraries were sequenced 15
with an Illumina HiSeq 4000 platform. Raw data were processed using Cell Ranger 16
(version 3.0) and further filtered, processed and analyzed using the Seurat package 17
(Satija et al., 2015). 18
19
Proximity Ligation Assay (PLA) 20
HaCaT cells were seeded on glass coverslips and transfected with plasmids 21
overexpressing WT C/EBP-β, C/EBP-βS184A, C/EBP-βT188A, and double mutant 22
.CC-BY-NC-ND 4.0 International licenseauthor/funder. It is made available under aThe copyright holder for this preprint (which was not peer-reviewed) is the. https://doi.org/10.1101/2020.03.09.984658doi: bioRxiv preprint

46
C/EBP-β for 24 h. The cells were fixed and permeabilized with 4% PFA in PBS for 1
15 min at RT. PLA was performed using Duolink® In Situ Red Starter Kit 2
Mouse/Rabbit (Sigma-Aldrich cat. DUO92101-1KT) according to manufacturer’s 3
instructions. Briefly, blocking was performed with blocking solution for 30 min at 4
37℃, and primary antibodies against PP6 (Abcam cat. 131335, 1:50 dilution) and 5
Flag-tag (MBL cat. M185-3L, 1:10000 dilution) were incubated overnight at 4℃. The 6
PLA Probe anti-mouse PLUS and PLA Probe anti-rabbit MINUS were incubated for 7
1 h at 37℃. Ligation and amplification were performed using Detection Reagents 8
Red. Duolink® Mounting Medium with DAPI was used for nuclear staining and 9
mounting. 10
11
NO quantification 12
Intracellular NO levels were quantified using an OxiSelect™ Intracellular Nitric 13
Oxide (NO) Assay Kit (Cell Biolabs cat. STA-800). Primary mouse keratinocytes 14
were incubated with medium containing Nitric Oxide Fluorometric Probe at a 1:1000 15
dilution at 37℃ for 30 min. The cells were rinsed, digested and analyzed on a BD 16
FACSCanto II cell analyzer using FITC filter set. 17
18
Extracellular flux analysis 19
Oxygen consumption rate (OCR) and extracellular acidification rate (ECAR) 20
measurements were performed using an XFe96 Extracellular Flux analyzer (Seahorse 21
Bioscience) according to the manufacturer’s instructions. Briefly, keratinocytes were 22
.CC-BY-NC-ND 4.0 International licenseauthor/funder. It is made available under aThe copyright holder for this preprint (which was not peer-reviewed) is the. https://doi.org/10.1101/2020.03.09.984658doi: bioRxiv preprint

47
seeded into an XFe96 polystyrene cell culture plate at a density of 5 × 10⁴ cells/well 1
and allowed for attachment overnight. Prior to the assay, the growth medium was 2
exchanged with the appropriate assay medium, and the cells were incubated in a 3
37℃/non-CO2 incubator for 1 h. Three baseline measurements were taken, and three 4
response measurements were taken after the addition of an indicated compound. OCR 5
and ECAR were reported as absolute rates (pmoles/min for OCR and mpH/min for 6
ECAR), normalized against the protein concentrations measured by BCA method. For 7
the mitochondrial fuel flexibility assessment, Seahorse XF Mito Fuel Flex Test Kit 8
(Agilent Technologies cat. 103260-100) was used according to the manufacturer’s 9
instructions. The results were calculated according to the formulas: Dependency% = 10
((Baseline OCR – Target inhibitor OCR) / (Baseline OCR – All inhibitors OCR)) × 11
100; Capacity% = (1 – (Baseline OCR – Other inhibitors OCR) / (Baseline OCR – All 12
inhibitors OCR) × 100; Flexibility% = Capacity% – Dependency%. 13
14
ATP measurement 15
The keratinocyte ATP content was measured using the ENLITEN® ATP Assay 16
System (Promega cat. FF2000). Primary mouse keratinocytes were seeded at a density 17
of 104 cells/well in a 96-well plate and allowed for attachment overnight. The cells 18
were lysed with 20 μl 0.5% trichloroacetic acid and shaken for 5 min at RT before 19
neutralization with 80 μl Tris-acetate (pH = 7.8). The extract was mixed with rL/L 20
Reagent and the ATP level was measured using a luminescent plate reader (BioTek). 21
.CC-BY-NC-ND 4.0 International licenseauthor/funder. It is made available under aThe copyright holder for this preprint (which was not peer-reviewed) is the. https://doi.org/10.1101/2020.03.09.984658doi: bioRxiv preprint
48
A standard curve of ATP was made, and the protein concentrations were measured by 1
BCA method using extra cells. 2
3
Unbiased metabolomics analysis 4
Epidermis samples from the tail skin of eight Pp6fl/fl and twelve K5. Pp6fl/fl mice were 5
collected. The samples were snap frozen and metabolites were extracted with 80% 6
ice-cold methanol. Liquid chromatography-mass spectrometry (LC-MS) was 7
performed on an Ultimate 3000-Velos Pro system equipped with a binary solvent 8
delivery manager and a sample manager, coupled with an LTQ Orbitrap Mass 9
Spectrometer equipped with an electrospray interface (ThermoFisher Scientific). The 10
raw data were processed with progenesis QI (Waters Corporation) and Principal 11
component analysis (PCA) and hierarchical clustering of metabolites were analyzed. 12
13
Targeted metabolite quantitation 14
The sera were loaded onto an ACQUITY UPLC HSS T3 Column (2.1 × 100 mm, 1.8 15
μm, Waters Corporation), and separated with mobile phase A (10 mM NH4COOH) 16
and mobile phase B (100% acetonitrile) at a flow rate of 0.3 ml/min with column 17
temperature set at 40℃. Monitoring of the analytes and their respective internal 18
standards was achieved using an UltiMate 3000 UHPLC/TSQ Vantage LC-MS/MS 19
system (ThermoFisher Scientific) equipped with a heated electrospray ionization 20
source (HESI). The instrument was operated in selected reaction monitoring (SRM) 21
mode. The mass analyzer settings were as follows: Vaporizer temperature, 300°C; 22
.CC-BY-NC-ND 4.0 International licenseauthor/funder. It is made available under aThe copyright holder for this preprint (which was not peer-reviewed) is the. https://doi.org/10.1101/2020.03.09.984658doi: bioRxiv preprint
49
spray voltage, positive polarity 3000 V/negative polarity 2500 V; capillary 1
temperature, 300 °C; sheath gas pressure, 40; aux gas pressure, 10; ion sweep gas 2
pressure, 0; collision gas pressure (mTorr), 1.5; Q1 Peak width (FWHM), 0.7; Q3 3
Peak width (FWHM), 0.7; cycle time (s), 0.4 s. 4
5
Protein mass spectrometry 6
The immunoprecipitates pulled down with anti-Spermidine/Spermine or Rabbit IgG 7
from human plasma samples and sera samples from mice were filtered with Amicon® 8
Ultra Centrifugal Filters to segregate ingredients ≤ 3 kD or > 3 kD. Samples ≤ 3 kD 9
were left untreated until lyophilization. Samples > 3 kD were dissolved in a 10
denaturation buffer (8 M Urea, 0.1 M Tris-HCl, pH = 8.5) and centrifuged at 14,000 g 11
for 20 min at 20℃ in YM-10 filter units three times. Mixed protein lysates were 12
reduced with 10 mM dithiothreitol (DTT) for 1 h at RT and then alkylated with 55 13
mM iodoacetamide (IAA) for 1 h at RT in the dark. The urea solvent of the protein 14
mixtures was exchanged with 50 mM NH4HCO3 by centrifugation at 14,000 g for 20 15
min at 20℃ three times, followed by protein digestion with sequencing grade 16
modified trypsin (Promega, cat. V5111) at a protein-to-enzyme ratio of 50:1 at 37℃ 17
overnight. Tryptic peptides were collected by centrifugation at 14,000 g for 20 min at 18
20 ℃. The Tryptic peptides were treated with 1% trifluoroacetic acid (TFA) and 19
purified using the C18 Ziptips and eluted with 0.1% TFA in 50~70% acetonitrile. The 20
eluted peptides and the untreated samples ≤ 3 kD were lyophilized using a SpeedVac 21
(ThermoSavant) and resuspended in 10 μl 1% formic acid/5% acetonitrile. All mass 22
.CC-BY-NC-ND 4.0 International licenseauthor/funder. It is made available under aThe copyright holder for this preprint (which was not peer-reviewed) is the. https://doi.org/10.1101/2020.03.09.984658doi: bioRxiv preprint
50
spectrometric experiments are performed on a QE-Plus mass spectrometer connected 1
to an Easy-nLC 2000 via an Easy Spray (ThermoFisher Scientific). The peptide 2
mixtures were loaded onto a 15 cm column with 0.075 mm inner diameter packed 3
with C18 2-μm Reversed Phase resins (PepMap RSLC), and separated within a 60 4
min-linear gradient from 95% solvent A (0.1% formic acid / 2% acetonitrile / 98% 5
water) to 28% solvent B (0.1% formic acid / 80% acetonitrile) at a flow rate of 300 6
nl/min. The spray voltage was set to 2.1 KV, with the temperature of ion transfer 7
capillary set at 275℃, and the RF lens was 60%. The mass spectrometer was operated 8
in positive ion mode and employed in the data-dependent mode to automatically 9
switch between MS and MS/MS using the Tune and Xcalibur 4.0.27.19 software 10
package. One full MS scan from 350 to 1,500 m/z was acquired at high resolution R = 11
70,000 (defined at m/z=400), followed by fragmentation of the 20 most abundant 12
multiply charged ions (singly charged ions and ions with unassigned charge states 13
were excluded), for ions with charge states 2–7 and collision energy of 27% ± 5%. 14
Dynamic exclusion was used automatically. All MS/MS ion spectra were analyzed 15
using PEAKS 8.0 (Bioinformatics Solutions) for processing, de novo sequencing and 16
database searching. The resulting sequences were searched through the UniProt 17
Human Proteome database (downloaded on May 5th, 2018) with the mass error 18
tolerance set at 10 ppm and 0.02 Da for parent and fragment, respectively. FDR 19
estimation was enabled. Peptides were filtered for −log10P ≥ 20, and the proteins were 20
filtered for −log10P ≥ 15 plus one unique peptide. For all experiments, these settings 21
gave an FDR of < 1% at the peptide-spectrum match level. 22
.CC-BY-NC-ND 4.0 International licenseauthor/funder. It is made available under aThe copyright holder for this preprint (which was not peer-reviewed) is the. https://doi.org/10.1101/2020.03.09.984658doi: bioRxiv preprint
51
1
DC stimulation 2
Synthetic HNRNPA1226-237 and Tetramethylrhodamine (TMR)-labeled 3
HNRNPA1226-237 (purity > 95%) were purchased from GeneScript. Mouse BMDCs 4
were seeded in 96-well plates at a density of 105/well. Total mouse RNA (self-RNA) 5
was extracted from NIH3T3 cell line. Self-RNA (5 μg/ml as a final concentration) 6
was premixed with the indicated reagents (all at 1 μg/ml as final concentrations) in 7
RPMI 1640 medium for 20 min at RT and then added to the BMDC cultures. Human 8
moDCs were seeded in 96-well plates at a density of 5 × 10⁴/well. Total human RNA 9
(self-RNA) was extracted from HaCaT cell line. Self-RNA (10 μg/ml as a final 10
concentration) was premixed with the indicated reagents (all at 2 μg/ml as final 11
concentrations) in RPMI 1640 medium for 20 min at RT and then added to the moDC 12
cultures. Mouse pDCs were seeded in 96-well plates at a density of 5 × 10⁴/well. 13
Mouse DNA (self-DNA) was extracted from NIH3T3 cell line. Self-DNA (5 μg/ml as 14
a final concentration) was premixed with the indicated reagents (all at 1 μg/ml as final 15
concentrations) in RPMI 1640 medium for 20 min at RT and then added to the pDC 16
cultures. For ELISA, the supernatants were collected after overnight culture. For 17
microscopic imaging, self-RNA was labeled using a Label IT® Nucleic Acid 18
Labeling Kit (Mirus cat. MIR7125), and Spermidine was labeled with 19
2-(methylamino) benzoic acid (Wolf et al., 2006). BMDCs were collected after 4 20
h-incubation, fixed with 4% paraformaldehyde and stained with anti-MHC Class II 21
(eBioscience cat. 47-5321-80). For flow cytometric analysis of RNA internalization, 22
.CC-BY-NC-ND 4.0 International licenseauthor/funder. It is made available under aThe copyright holder for this preprint (which was not peer-reviewed) is the. https://doi.org/10.1101/2020.03.09.984658doi: bioRxiv preprint
52
BMDCs were treated with 488-labeled self-RNA for 4 h. For flow cytometric analysis 1
of DC activation markers, DCs were isolated from spleens and lymph nodes of 2
C57BL/6 mice using a MojoSort™ Mouse Pan Dendritic Cell Isolation Kit 3
(BioLegend cat. 480097). DCs were cultured with supernatants of necrotic 4
keratinocytes generated by an overnight culture of UV-irradiated (2 J/m2/s for 40 min) 5
keratinocytes derived from Pp6fl/fl and K5. Pp6fl/fl mice. After overnight culture, 6
CD80, CD86 and MHC class II levels of CD11c+ DCs were detected. 7
8
RNase protection assay 9
Suspensions containing indicated self-RNA-polyamine-Hnrnpa1226-237 complexes 10
were incubated with Ribonuclease A (Sigma-Aldrich cat. R6513, 1 ng/ml) at 37°C for 11
5 min and then run on a 1% agarose gel. 12
13
DC and T-cell co-culture 14
BMDCs were treated with different combinations of self-RNA, polyamines and 15
Hnrnpa1226-237 for 3 h. In the meantime, naïve CD4+ T cells were isolated from the 16
spleens of C57BL/6 mice or IL17-GFP mice using a MojoSort™ Mouse CD4 Naïve 17
T Cell Isolation Kit (BioLegend cat. 480040). T cells from C57BL/6 mice were 18
further labeled with CellTrace™ Violet (Invitrogen cat. C34557). BMDCs were 19
washed three times and co-cultured with naïve CD4+ T cells at a ratio of 1:10 for 72 h. 20
To detect IL17-GFP, cells were stimulated with 750 ng/ml ionomycin (Sigma-Aldrich 21
cat. I9657), 50 ng/ml phorbol 12-myristate 13-acetate (PMA) (Sigma-Aldrich cat. 22
.CC-BY-NC-ND 4.0 International licenseauthor/funder. It is made available under aThe copyright holder for this preprint (which was not peer-reviewed) is the. https://doi.org/10.1101/2020.03.09.984658doi: bioRxiv preprint

53
79346) and GolgiPlug (BD Biosciences cat. 555029) for another 4 h at 37 ℃. The 1
cells were then collected, stained with antibodies against CD4 (eBioscience cat. 2
17-0041-82) and CD44 (eBioscience cat. 12-0441-82) and analyzed on a BD 3
FACSCanto II cell analyzer. 4
5
RNAscope combined with immunofluorescence 6
Cell suspensions from C57BL/6 mouse skin treated with IMQ for 3 days or not were 7
subjected to Percoll™-facilitated gradient separation. DCs were isolated from the 8
resulted mononuclear cells using a MojoSort™ Mouse Pan Dendritic Cell Isolation 9
Kit (BioLegend cat. 480097). Single molecule FISH experiments were carried out 10
using an RNAscope® Multiplex Fluorescent Assay v2 along with an RNAscope® 11
Probe-Mm-Krt14-C2 (ACD cat. 422521-C2). Immunofluorescence was then 12
performed using antibodies against Tlr7 (Novus cat. NBP2-27332, 1:50 dilution) and 13
Spermidine/Spermine (Novus cat. NB100-1847, 1:50 dilution). 14
15
Statistical analysis 16
The data were analyzed using GraphPad Prism 7 and are presented as the means ± 17
SEM. A Student’s t-test was used to compare two conditions, and an analysis of 18
variance (ANOVA) with Bonferroni or Newman-Keuls correction was used for 19
multiple comparisons. A simple linear regression model was used to analyze the 20
correlation between PP6 expression and H score. The probability values of < 0.05 21
were considered statistically significant, and two-sided Student’s t-tests and ANOVA 22
.CC-BY-NC-ND 4.0 International licenseauthor/funder. It is made available under aThe copyright holder for this preprint (which was not peer-reviewed) is the. https://doi.org/10.1101/2020.03.09.984658doi: bioRxiv preprint

54
were performed. *p < 0.05; **p < 0.01; ***p < 0.001; ****p < 0.0001; ns: not 1
significant. The error bars depict the SEM. 2
3
Data Availability 4
The data that support the findings of this study are available from the corresponding 5
author upon reasonable request. RNA-Seq datasets were deposited in GEO under the 6
accession numbers: GSE123019 and GSE122665. 7
8
.CC-BY-NC-ND 4.0 International licenseauthor/funder. It is made available under aThe copyright holder for this preprint (which was not peer-reviewed) is the. https://doi.org/10.1101/2020.03.09.984658doi: bioRxiv preprint

55
REFERENCES 1
2
Abeyakirthi, S., Mowbray, M., Bredenkamp, N., van Overloop, L., Declercq, L., Davis, P.J., Matsui, 3 M.S., and Weller, R.B. (2010). Arginase is overactive in psoriatic skin. Br J Dermatol 163, 193-196. 4 Alam, H., Sehgal, L., Kundu, S.T., Dalal, S.N., and Vaidya, M.M. (2011). Novel function of keratins 5 5 and 14 in proliferation and differentiation of stratified epithelial cells. Mol Biol Cell 22, 4068-4078. 6 Arakawa, A., Siewert, K., Stohr, J., Besgen, P., Kim, S.M., Ruhl, G., Nickel, J., Vollmer, S., Thomas, 7 P., Krebs, S., et al. (2015). Melanocyte antigen triggers autoimmunity in human psoriasis. J Exp Med 8 212, 2203-2212. 9 Bambouskova, M., Gorvel, L., Lampropoulou, V., Sergushichev, A., Loginicheva, E., Johnson, K., 10 Korenfeld, D., Mathyer, M.E., Kim, H., Huang, L.H., et al. (2018). Electrophilic properties of itaconate 11 and derivatives regulate the IkappaBzeta-ATF3 inflammatory axis. Nature 556, 501-504. 12 Bonilla, X., Parmentier, L., King, B., Bezrukov, F., Kaya, G., Zoete, V., Seplyarskiy, V.B., Sharpe, H.J., 13 McKee, T., Letourneau, A., et al. (2016). Genomic analysis identifies new drivers and progression 14 pathways in skin basal cell carcinoma. Nat Genet 48, 398-406. 15 Broshtilova, V., Lozanov, V., and Miteva, L. (2013). Polyamine metabolism changes in psoriasis. 16 Indian J Dermatol 58, 306-309. 17 Bruch-Gerharz, D., Schnorr, O., Suschek, C., Beck, K.F., Pfeilschifter, J., Ruzicka, T., and 18 Kolb-Bachofen, V. (2003). Arginase 1 overexpression in psoriasis: limitation of inducible nitric oxide 19 synthase activity as a molecular mechanism for keratinocyte hyperproliferation. Am J Pathol 162, 20 203-211. 21 Celhar, T., Hopkins, R., Thornhill, S.I., De Magalhaes, R., Hwang, S.H., Lee, H.Y., Yasuga, H., Jones, 22 L.A., Casco, J., Lee, B., et al. (2015). RNA sensing by conventional dendritic cells is central to the 23 development of lupus nephritis. Proc Natl Acad Sci U S A 112, E6195-6204. 24 Cheung, K.L., Jarrett, R., Subramaniam, S., Salimi, M., Gutowska-Owsiak, D., Chen, Y.L., Hardman, 25 C., Xue, L., Cerundolo, V., and Ogg, G. (2016). Psoriatic T cells recognize neolipid antigens generated 26 by mast cell phospholipase delivered by exosomes and presented by CD1a. J Exp Med 213, 2399-2412. 27 Fagerberg, L., Hallstrom, B.M., Oksvold, P., Kampf, C., Djureinovic, D., Odeberg, J., Habuka, M., 28 Tahmasebpoor, S., Danielsson, A., Edlund, K., et al. (2014). Analysis of the human tissue-specific 29 expression by genome-wide integration of transcriptomics and antibody-based proteomics. Mol Cell 30 Proteomics 13, 397-406. 31 Franchi, L., Monteleone, I., Hao, L.Y., Spahr, M.A., Zhao, W., Liu, X., Demock, K., Kulkarni, A., 32 Lesch, C.A., Sanchez, B., et al. (2017). Inhibiting Oxidative Phosphorylation In Vivo Restrains Th17 33 Effector Responses and Ameliorates Murine Colitis. J Immunol 198, 2735-2746. 34 Fujimoto, W., Nakanishi, G., Arata, J., and Jetten, A.M. (1997). Differential expression of human 35 cornifin alpha and beta in squamous differentiating epithelial tissues and several skin lesions. J Invest 36 Dermatol 108, 200-204. 37 Ganguly, D., Chamilos, G., Lande, R., Gregorio, J., Meller, S., Facchinetti, V., Homey, B., Barrat, F.J., 38 Zal, T., and Gilliet, M. (2009). Self-RNA-antimicrobial peptide complexes activate human dendritic 39 cells through TLR7 and TLR8. J Exp Med 206, 1983-1994. 40 Geiger, R., Rieckmann, J.C., Wolf, T., Basso, C., Feng, Y., Fuhrer, T., Kogadeeva, M., Picotti, P., 41 Meissner, F., Mann, M., et al. (2016). L-Arginine Modulates T Cell Metabolism and Enhances Survival 42 and Anti-tumor Activity. Cell 167, 829-842 e813. 43
.CC-BY-NC-ND 4.0 International licenseauthor/funder. It is made available under aThe copyright holder for this preprint (which was not peer-reviewed) is the. https://doi.org/10.1101/2020.03.09.984658doi: bioRxiv preprint
56
Guarneri, C., Aguennouz, M., Guarneri, F., Polito, F., Benvenga, S., and Cannavo, S.P. (2018). 1 Autoimmunity to heterogeneous nuclear ribonucleoprotein A1 in psoriatic patients and correlation with 2 disease severity. J Dtsch Dermatol Ges 16, 1103-1107. 3 Gudjonsson, J.E., Ding, J., Johnston, A., Tejasvi, T., Guzman, A.M., Nair, R.P., Voorhees, J.J., 4 Abecasis, G.R., and Elder, J.T. (2010). Assessment of the psoriatic transcriptome in a large sample: 5 additional regulated genes and comparisons with in vitro models. J Invest Dermatol 130, 1829-1840. 6 Gudjonsson, J.E., Ding, J., Li, X., Nair, R.P., Tejasvi, T., Qin, Z.S., Ghosh, D., Aphale, A., Gumucio, 7 D.L., Voorhees, J.J., et al. (2009). Global gene expression analysis reveals evidence for decreased lipid 8 biosynthesis and increased innate immunity in uninvolved psoriatic skin. J Invest Dermatol 129, 9 2795-2804. 10 Haslam, D.W., and James, W.P. (2005). Obesity. Lancet 366, 1197-1209. 11 Hemmi, H., Kaisho, T., Takeuchi, O., Sato, S., Sanjo, H., Hoshino, K., Horiuchi, T., Tomizawa, H., 12 Takeda, K., and Akira, S. (2002). Small anti-viral compounds activate immune cells via the TLR7 13 MyD88-dependent signaling pathway. Nat Immunol 3, 196-200. 14 Herbert, D., Franz, S., Popkova, Y., Anderegg, U., Schiller, J., Schwede, K., Lorz, A., Simon, J.C., and 15 Saalbach, A. (2018). High-Fat Diet Exacerbates Early Psoriatic Skin Inflammation Independent of 16 Obesity: Saturated Fatty Acids as Key Players. J Invest Dermatol 138, 1999-2009. 17 Hodis, E., Watson, I.R., Kryukov, G.V., Arold, S.T., Imielinski, M., Theurillat, J.P., Nickerson, E., 18 Auclair, D., Li, L., Place, C., et al. (2012). A landscape of driver mutations in melanoma. Cell 150, 19 251-263. 20 Jones, D.A., Yawalkar, N., Suh, K.Y., Sadat, S., Rich, B., and Kupper, T.S. (2004). Identification of 21 autoantigens in psoriatic plaques using expression cloning. J Invest Dermatol 123, 93-100. 22 Joost, S., Zeisel, A., Jacob, T., Sun, X., La Manno, G., Lonnerberg, P., Linnarsson, S., and Kasper, M. 23 (2016). Single-Cell Transcriptomics Reveals that Differentiation and Spatial Signatures Shape 24 Epidermal and Hair Follicle Heterogeneity. Cell Syst 3, 221-237 e229. 25 Kamleh, M.A., Snowden, S.G., Grapov, D., Blackburn, G.J., Watson, D.G., Xu, N., Stahle, M., and 26 Wheelock, C.E. (2015). LC-MS metabolomics of psoriasis patients reveals disease severity-dependent 27 increases in circulating amino acids that are ameliorated by anti-TNFalpha treatment. J Proteome Res 28 14, 557-566. 29 Kang, H., Li, X., Zhou, Q., Quan, C., Xue, F., Zheng, J., and Yu, Y. (2017). Exploration of candidate 30 biomarkers for human psoriasis based on gas chromatography-mass spectrometry serum metabolomics. 31 Br J Dermatol 176, 713-722. 32 Kovamees, O., Shemyakin, A., and Pernow, J. (2014). Effect of arginase inhibition on 33 ischemia-reperfusion injury in patients with coronary artery disease with and without diabetes mellitus. 34 PLoS One 9, e103260. 35 Krauthammer, M., Kong, Y., Ha, B.H., Evans, P., Bacchiocchi, A., McCusker, J.P., Cheng, E., Davis, 36 M.J., Goh, G., Choi, M., et al. (2012). Exome sequencing identifies recurrent somatic RAC1 mutations 37 in melanoma. Nat Genet 44, 1006-1014. 38 Lande, R., Botti, E., Jandus, C., Dojcinovic, D., Fanelli, G., Conrad, C., Chamilos, G., Feldmeyer, L., 39 Marinari, B., Chon, S., et al. (2014). The antimicrobial peptide LL37 is a T-cell autoantigen in 40 psoriasis. Nat Commun 5, 5621. 41 Langley, R.G., and Ellis, C.N. (2004). Evaluating psoriasis with Psoriasis Area and Severity Index, 42 Psoriasis Global Assessment, and Lattice System Physician's Global Assessment. J Am Acad Dermatol 43 51, 563-569. 44
.CC-BY-NC-ND 4.0 International licenseauthor/funder. It is made available under aThe copyright holder for this preprint (which was not peer-reviewed) is the. https://doi.org/10.1101/2020.03.09.984658doi: bioRxiv preprint

57
Lessard, J.C., Pina-Paz, S., Rotty, J.D., Hickerson, R.P., Kaspar, R.L., Balmain, A., and Coulombe, P.A. 1 (2013). Keratin 16 regulates innate immunity in response to epidermal barrier breach. Proc Natl Acad 2 Sci U S A 110, 19537-19542. 3 Li, H., Meininger, C.J., Bazer, F.W., and Wu, G. (2016). Intracellular sources of ornithine for 4 polyamine synthesis in endothelial cells. Amino Acids 48, 2401-2410. 5 Li, X., Gianoulis, T.A., Yip, K.Y., Gerstein, M., and Snyder, M. (2010). Extensive in vivo 6 metabolite-protein interactions revealed by large-scale systematic analyses. Cell 143, 639-650. 7 Lovgren, T., Eloranta, M.L., Bave, U., Alm, G.V., and Ronnblom, L. (2004). Induction of 8 interferon-alpha production in plasmacytoid dendritic cells by immune complexes containing nucleic 9 acid released by necrotic or late apoptotic cells and lupus IgG. Arthritis Rheum 50, 1861-1872. 10 Lowes, M.A., Bowcock, A.M., and Krueger, J.G. (2007). Pathogenesis and therapy of psoriasis. Nature 11 445, 866-873. 12 Lund, J.M., Alexopoulou, L., Sato, A., Karow, M., Adams, N.C., Gale, N.W., Iwasaki, A., and Flavell, 13 R.A. (2004). Recognition of single-stranded RNA viruses by Toll-like receptor 7. Proc Natl Acad Sci U 14 S A 101, 5598-5603. 15 Mao, C.M., Yang, X., Cheng, X., Lu, Y.X., Zhou, J., and Huang, C.F. (2003). [Establishment of 16 keratinocyte-specific Cre recombinase transgenic mice]. Yi Chuan Xue Bao 30, 407-413. 17 Moon, J., Do, H.J., Cho, Y., and Shin, M.J. (2014). Arginase inhibition ameliorates hepatic metabolic 18 abnormalities in obese mice. PLoS One 9, e103048. 19 Morris, S.M., Jr. (2010). Arginine: master and commander in innate immune responses. Sci Signal 3, 20 pe27. 21 Mousavi, A., and Hotta, Y. (2005). Glycine-rich proteins: a class of novel proteins. Appl Biochem 22 Biotechnol 120, 169-174. 23 Proctor, M.S., Fletcher, H.V., Jr., Shukla, J.B., and Rennert, O.M. (1975). Elevated spermidine and 24 spermine levels in the blood of psoriasis patients. J Invest Dermatol 65, 409-411. 25 Roberson, E.D., Liu, Y., Ryan, C., Joyce, C.E., Duan, S., Cao, L., Martin, A., Liao, W., Menter, A., and 26 Bowcock, A.M. (2012). A subset of methylated CpG sites differentiate psoriatic from normal skin. J 27 Invest Dermatol 132, 583-592. 28 Rusin, S.F., Schlosser, K.A., Adamo, M.E., and Kettenbach, A.N. (2015). Quantitative 29 phosphoproteomics reveals new roles for the protein phosphatase PP6 in mitotic cells. Sci Signal 8, 30 rs12. 31 Sarti, P., Forte, E., Giuffre, A., Mastronicola, D., Magnifico, M.C., and Arese, M. (2012). The 32 Chemical Interplay between Nitric Oxide and Mitochondrial Cytochrome c Oxidase: Reactions, 33 Effectors and Pathophysiology. Int J Cell Biol 2012, 571067. 34 Satija, R., Farrell, J.A., Gennert, D., Schier, A.F., and Regev, A. (2015). Spatial reconstruction of 35 single-cell gene expression data. Nat Biotechnol 33, 495-502. 36 Schnorr, O., Schuier, M., Kagemann, G., Wolf, R., Walz, M., Ruzicka, T., Mayatepek, E., Laryea, M., 37 Suschek, C.V., Kolb-Bachofen, V., and Sies, H. (2005). Arginase-1 overexpression induces cationic 38 amino acid transporter-1 in psoriasis. Free Radic Biol Med 38, 1073-1079. 39 Shao, S., Cao, T., Jin, L., Li, B., Fang, H., Zhang, J., Zhang, Y., Hu, J., and Wang, G. (2016). Increased 40 Lipocalin-2 Contributes to the Pathogenesis of Psoriasis by Modulating Neutrophil Chemotaxis and 41 Cytokine Secretion. J Invest Dermatol 136, 1418-1428. 42 Shen, C., Gao, J., Yin, X., Sheng, Y., Sun, L., Cui, Y., and Zhang, X. (2015). Association of the late 43 cornified envelope-3 genes with psoriasis and psoriatic arthritis: a systematic review. J Genet 44
.CC-BY-NC-ND 4.0 International licenseauthor/funder. It is made available under aThe copyright holder for this preprint (which was not peer-reviewed) is the. https://doi.org/10.1101/2020.03.09.984658doi: bioRxiv preprint
58
Genomics 42, 49-56. 1 Sioud, M. (2006). Innate sensing of self and non-self RNAs by Toll-like receptors. Trends Mol Med 12, 2 167-176. 3 Song, X., and Qian, Y. (2013). The activation and regulation of IL-17 receptor mediated signaling. 4 Cytokine 62, 175-182. 5 Swindell, W.R., Sarkar, M.K., Liang, Y., Xing, X., and Gudjonsson, J.E. (2016). Cross-Disease 6 Transcriptomics: Unique IL-17A Signaling in Psoriasis Lesions and an Autoimmune PBMC Signature. 7 J Invest Dermatol 136, 1820-1830. 8 Tannahill, G.M., Curtis, A.M., Adamik, J., Palsson-McDermott, E.M., McGettrick, A.F., Goel, G., 9 Frezza, C., Bernard, N.J., Kelly, B., Foley, N.H., et al. (2013). Succinate is an inflammatory signal that 10 induces IL-1beta through HIF-1alpha. Nature 496, 238-242. 11 Waseem, A., Dogan, B., Tidman, N., Alam, Y., Purkis, P., Jackson, S., Lalli, A., Machesney, M., and 12 Leigh, I.M. (1999). Keratin 15 expression in stratified epithelia: downregulation in activated 13 keratinocytes. J Invest Dermatol 112, 362-369. 14 Wolf, M., Bauder-Wust, U., Pipkorn, R., Eskerski, H., and Eisenhut, M. (2006). Fluorophor-labeled 15 spermidine derivatives as fluorescent markers in optical tumor imaging. Bioorg Med Chem Lett 16, 16 3193-3196. 17 Xu, N., Meisgen, F., Butler, L.M., Han, G., Wang, X.J., Soderberg-Naucler, C., Stahle, M., Pivarcsi, A., 18 and Sonkoly, E. (2013). MicroRNA-31 is overexpressed in psoriasis and modulates inflammatory 19 cytokine and chemokine production in keratinocytes via targeting serine/threonine kinase 40. J 20 Immunol 190, 678-688. 21 Yamamoto, M., Yamazaki, S., Uematsu, S., Sato, S., Hemmi, H., Hoshino, K., Kaisho, T., Kuwata, H., 22 Takeuchi, O., Takeshige, K., et al. (2004). Regulation of Toll/IL-1-receptor-mediated gene expression 23 by the inducible nuclear protein IkappaBzeta. Nature 430, 218-222. 24 Yan, S., Xu, Z., Lou, F., Zhang, L., Ke, F., Bai, J., Liu, Z., Liu, J., Wang, H., Zhu, H., et al. (2015). 25 NF-kappaB-induced microRNA-31 promotes epidermal hyperplasia by repressing protein phosphatase 26 6 in psoriasis. Nat Commun 6, 7652. 27 Ye, J., Shi, H., Shen, Y., Peng, C., Liu, Y., Li, C., Deng, K., Geng, J., Xu, T., Zhuang, Y., et al. (2015). 28 PP6 controls T cell development and homeostasis by negatively regulating distal TCR signaling. J 29 Immunol 194, 1654-1664. 30 Zavradashvili, N., Sarisozen, C., Titvinidze, G., Otinashvili, G., Kantaria, T., Tugushi, D., Puiggali, J., 31 Torchilin, V.P., and Katsarava, R. (2019). Library of Cationic Polymers Composed of Polyamines and 32 Arginine as Gene Transfection Agents. Acs Omega 4, 2090-2101. 33 Zhang, Z., Zi, Z., Lee, E.E., Zhao, J., Contreras, D.C., South, A.P., Abel, E.D., Chong, B.F., 34 Vandergriff, T., Hosler, G.A., et al. (2018). Differential glucose requirement in skin homeostasis and 35 injury identifies a therapeutic target for psoriasis. Nat Med 24, 617-627. 36
37
38
.CC-BY-NC-ND 4.0 International licenseauthor/funder. It is made available under aThe copyright holder for this preprint (which was not peer-reviewed) is the. https://doi.org/10.1101/2020.03.09.984658doi: bioRxiv preprint
59
1
ACKNOWLEDGMENTS 2
The authors would like to thank Ms. C. Gao, Ms. M. Zhang, Ms. L. Ding and Dr. L. 3
Chen (Sequencing Core of Shanghai Institute of Immunology) for single-cell cDNA 4
library generation; Dr. L. Xia and Dr. L. Meng (Proteomics Core of College of Basic 5
Medical Sciences, SJTU-SM) for protein LC-MS analyses; Dr. D. Han and Dr. J. Fang 6
(Metabolomics Core of College of Basic Medical Sciences, SJTU-SM) for metabolite 7
quantitation analyses; and Insight Editing London for proofreading the manuscript 8
prior to publication. This work was supported by grants from the National Natural 9
Science Foundation of China (No: 81725018, No: 31330026, No: 31570922 and No: 10
81803123), the National Program on Key Basic Research Project (973 program, No: 11
2014CB541905) and the Shanghai Municipal Commission (No: 201740063). 12
13
AUTHOR CONTRIBUTIONS 14
F.L., Y.S. and HL.W. designed the study and prepared the manuscript. F.L. and Y.S. 15
conducted the experiments and analyzed the data. HL.W. and F.G. supervised the 16
research. Z.X., L.N., Z.W., S.D., Z.L., H.Z., J.B., Q.Y., X.C., L.S. and H.W. helped 17
with experimental details. Z.W., X.C., Y.S. and W.T. reviewed and edited the 18
manuscript. 19
20
DECLARATION OF INTERESTS 21
.CC-BY-NC-ND 4.0 International licenseauthor/funder. It is made available under aThe copyright holder for this preprint (which was not peer-reviewed) is the. https://doi.org/10.1101/2020.03.09.984658doi: bioRxiv preprint

60
The authors declare no competing interests. 1
2
.CC-BY-NC-ND 4.0 International licenseauthor/funder. It is made available under aThe copyright holder for this preprint (which was not peer-reviewed) is the. https://doi.org/10.1101/2020.03.09.984658doi: bioRxiv preprint

61
1 FIGURE LEGENDS 2
3
Figure 1│Mice lacking Pp6 in the epidermis show hallmarks of psoriasis. (A) The 4
incidence of skin lesions in K5. Pp6fl/fl mice and Pp6fl/fl mice over time (n = 10). (B) 5
Macroscopic views of the face, ear, upper back and tail skin from an 18-week-old K5. 6
Pp6fl/fl mouse. Scaly plaques are marked by arrowheads. (C) H&E staining of the skin 7
lesions from the upper back of a K5. Pp6fl/fl mouse. a, acanthosis; b, increased 8
proliferative basal layer epidermal keratinocytes; d, dermal cell infiltrates; k, 9
hyperkeratosis; p, parakeratosis; g, loss of stratum granulosum; m, Munro's 10
microabscess. The dotted line indicates the border between the epidermis and the 11
dermis; scale bar represents 100 μm. (D) Acanthosis of diseased K5. Pp6fl/fl skin 12
compared to Pp6fl/fl skin (n = 4). (E) Quantitation of Ki67+ epidermal cells in mouse 13
skin sections (n = 6). (F) Statistics of the flow cytometric analysis of immune 14
cell-specific markers in mouse skin (n = 5~6). The boxes show the 25th to 75th 15
percentiles; the whiskers show the minimum to maximum; and the lines show the 16
medians. (G) Flow cytometric analysis of CD31+ cell percentages in the CD45- cell 17
compartments in mouse skin (n = 5~6). The boxes show the 25th to 75th percentiles; 18
the whiskers show the minimum to maximum; and the lines show the medians. (H) 19
GSEA of Gene ontology (GO) pathways identified by scRNAseq of Pp6-deficient 20
keratinocytes compared to WT keratinocytes. p value Cutoff = 0.005; FDR Q-value 21
Cutoff = 0.1. Networks with > 3 nodes are shown. (I) Heat map of selected genes 22
based on RNA-seq data from the skin of K5. Pp6fl/fl and Pp6fl/fl mice (p < 0.05, 23
Log2FC > 1.2, n = 2). The GO categories are indicated. (J) GSEA of DEGs in K5. 24
Pp6fl/fl skin relative to Pp6fl/fl skin with upregulated (Pso Up) or downregulated (Pso 25
Down) DEGs in human psoriatic skin (GSE54456) enriched. (K) Kyoto Encyclopedia 26
.CC-BY-NC-ND 4.0 International licenseauthor/funder. It is made available under aThe copyright holder for this preprint (which was not peer-reviewed) is the. https://doi.org/10.1101/2020.03.09.984658doi: bioRxiv preprint

62
of Genes and Genomes (KEGG) pathway enrichment of upregulated DEGs in K5. 1
Pp6fl/fl skin relative to Pp6fl/fl skin. p value cutoff = 0.01; gene numbers enriched in 2
each pathway are indicated by the sizes of the circles; the adjusted p values are 3
indicated by the continuous color. (L) Macroscopic views of skin lesions in a 4
representative K5. Pp6fl/fl mouse before or after anti-IL-17A treatment (upper panel). 5
Changes in PASI of diseased K5. Pp6fl/fl mice on indicated time-point after 6
anti-IL-17A treatment (lower panel). (M) IL-23-T17-associated cytokine levels 7
detected by semiquantitative cytokine array of K5. Pp6fl/fl and Pp6fl/fl mouse skin. (N) 8
Feature-plots of Il17a, Il17f, Trac and Trdc expression in T cells derived from K5. 9
Pp6fl/fl skin analyzed by scRNAseq. The data (B and C) are representative of > 8 mice. 10
The data (L) are representative of two independent experiments with two mice in each 11
group. Pp6fl/fl, healthy skin sample from control mice; K5. Pp6fl/fl-N, unaffected skin 12
from K5. Pp6fl/fl mice; K5. Pp6fl/fl-L, affected skin from K5. Pp6fl/fl mice. *p < 0.05, 13
**p < 0.01, ***p < 0.001, ****p < 0.0001, two-tailed Student’s t-test (means ± 14
SEM). 15
16
Figure 2│PP6 deficiency promotes C/EBP-β-mediated ARG1 transcription in 17
psoriatic keratinocytes. (A) Cultured murine keratinocytes derived from Pp6fl/fl and 18
K5. Pp6fl/fl mouse tails were subjected to RNA-seq. (B) Transcriptional comparison of 19
K5. Pp6fl/fl and Pp6fl/fl keratinocytes and enrichment of CEBP downstream signatures. 20
(C) Volcano plot of the K5. Pp6fl/fl versus the Pp6fl/fl keratinocyte gene expression 21
profiles. C/EBPβ target genes are indicated. (D) GSEA of DEGs in human psoriatic 22
skin (GSE54456) with C/EBP-β target signatures enriched. (E) qPCR detection of the 23
abundance of the Arg1 promoter that immunoprecipitated with C/EBPβ in primary 24
.CC-BY-NC-ND 4.0 International licenseauthor/funder. It is made available under aThe copyright holder for this preprint (which was not peer-reviewed) is the. https://doi.org/10.1101/2020.03.09.984658doi: bioRxiv preprint

63
murine keratinocytes derived from Pp6fl/fl and K5. Pp6fl/fl mice (n = 5). The signals 1
are presented as a percent of the total input chromatin. The boxes show the 25th to 2
75th percentiles; the whiskers show the minimum to maximum; and the lines show 3
the medians. (F) Immunofluorescent labelling of p-C/EBPβ and Arg1 in mouse skin 4
samples. (G) qPCR detection of ARG1 in HaCaT cells transfected with an empty 5
vector or a C/EBP-β overexpression plasmid (n = 6). The data are presented as the 6
ratio of ARG1 to GAPDH relative to that in vector-transfected HaCaT cells. (H) 7
Immunofluorescent labelling of p-C/EBP-β and ARG1 in human skin samples. (I) 8
GSEA of DEGs in human psoriatic skin (GSE54456) with Arginine and Proline 9
metabolism-associated genes enriched. For (F and H), the dotted lines indicate the 10
border between the epidermis and the dermis; e, epidermis; d, dermis; Pp6fl/fl, healthy 11
skin sample from control mice; K5. Pp6fl/fl-N, unaffected skin from K5. Pp6fl/fl mice; 12
K5. Pp6fl/fl-L, affected skin from K5. Pp6fl/fl mice; Nor, normal human skin; Pso, 13
psoriatic human skin; scale bars represent 50 μm. Data (F and H) are representative 14
of > 5 samples in each group. Data (E and G) are representative of three independent 15
experiments. *p < 0.05, ****p < 0.0001, two-tailed Student’s t-test (means ± SEM). 16
17
Figure 3│De novo Arginine synthesis is featured in basal keratinocytes of 18
psoriatic epidermis. (A) Relative quantitation of Arginine, Ornithine and Urea levels 19
in the sera of patients with psoriasis and healthy donors (n = 10). (B) Representative 20
t-SNE plot of scRNAseq of epidermal cells derived from a patient with psoriasis (n = 21
3). Basal keratinocyte, spinous keratinocyte, hair follicle (HF), melanocyte (Mel) and 22
immune cell (immune) compartments are encircled. (C) Violin plots of the indicated 23
.CC-BY-NC-ND 4.0 International licenseauthor/funder. It is made available under aThe copyright holder for this preprint (which was not peer-reviewed) is the. https://doi.org/10.1101/2020.03.09.984658doi: bioRxiv preprint
64
gene expression levels distributed across distinct cell compartments. (D) 1
Immunofluorescent labelling of ASS1 in skin sections derived from healthy donors 2
and patients with psoriasis. The data are representative of > 5 samples in each group. 3
The dotted lines indicate the border between the epidermis and the dermis; e, 4
epidermis; d, dermis; Nor, normal human skin; Pso, psoriatic human skin; scale bars 5
represent 50 μm. (E) Feature-plots of indicated genes in merged scRNAseq datasets 6
of three healthy epidermal samples and three psoriatic epidermal samples. (F) ASS1 7
score of keratinocytes from 3 healthy donors and 3 patients with psoriasis, calculated 8
using the formula: (ASS1 average expression value of ASS1+ keratinocytes) × 9
(ASS1+ keratinocyte number) / (total keratinocyte number). (G) Urea cycle 10
reprogramming in psoriatic keratinocytes. *p < 0.05, **p < 0.01, two-tailed Student’s 11
t-test (means ± SEM). 12
13
Figure 4│The urea cycle undergoes rewiring in Pp6-deficient keratinocytes. (A) 14
Flow cytometric analysis of NO levels in Pp6fl/fl and K5. Pp6fl/fl keratinocytes (n = 3). 15
(B) GSEA of DEGs in human psoriatic skin (GSE54456) with NO-responsive genes 16
enriched. (C) PCA of the epidermal metabolites derived from Pp6fl/fl (n = 8) and K5. 17
Pp6fl/fl (n = 12) mice. (D) Relative quantification of the indicated fatty acids extracted 18
from the epidermis of Pp6fl/fl and K5. Pp6fl/fl mice. (E) Relative quantitation of urea 19
cycle-associated metabolites based on a metabolomics analysis of the K5. Pp6fl/fl and 20
Pp6fl/fl epidermis. The boxes show the 25th to 75th percentiles; the whiskers show the 21
minimum to maximum; and the lines the show medians. (F and G) Relative 22
quantitation of Urea levels in the epidermis (F) and sera (G) of Pp6fl/fl and K5. Pp6fl/fl 23
mice (n = 6). (H) Quantitative enrichment analysis of the metabolites derived from 24
.CC-BY-NC-ND 4.0 International licenseauthor/funder. It is made available under aThe copyright holder for this preprint (which was not peer-reviewed) is the. https://doi.org/10.1101/2020.03.09.984658doi: bioRxiv preprint
65
Pp6fl/fl and K5. Pp6fl/fl mice using MetaboAnalyst 3.0. (I) Urea cycle-associated 1
metabolites altered with Pp6 ablation in the epidermis of K5. Pp6fl/fl mice, relative to 2
those of Pp6fl/fl controls. The fold changes of the metabolites are indicated by the 3
continuous color. Hollow circles with light blue edges indicate the undetected 4
metabolites. KEGG reaction numbers are marked between the contiguous metabolites. 5
(J) Degree of acanthosis of IMQ-induced psoriasis-like skin inflammation treated 6
with the indicated urea cycle-associated metabolites (n = 4~5) according to the 7
indicated study protocol (top panel). (K) Acanthosis of IMQ-induced psoriasis-like 8
skin inflammation treated with vehicle or DFMO (n = 5); the function of DFMO is 9
illustrated in the left-hand panel. The data (A, J and K) are representative of three 10
independent experiments. *p < 0.05, **p < 0.01, ***p < 0.001, ****p < 0.0001, 11
two-tailed Student’s t-test (means ± SEM). 12
13
Figure 5│Polyamines enable self-RNA sensing by myeloid DCs. 14
(A) Statistics of the flow cytometric analysis of DCs cultured overnight in dead 15
keratinocyte supernatants generated from Pp6fl/fl and K5. Pp6fl/fl mice (n = 3). (B) 16
Study protocol to identify proteins or peptides in a complex with Spermidine or 17
Spermine in human blood plasma samples. (C) LC-MS/MS-based detection of the 18
abundance of HNRNPA1226-237 in the immunoprecipitates pulled by 19
anti-Spermidine/Spermine from the blood plasma of patients with psoriasis (n = 3, 20
Pso) and healthy donors (n = 3, Nor). Immunoprecipitates pulled by rabbit IgG from 21
the blood plasma of patients with psoriasis (n = 3, IgG) served as negative controls. 22
.CC-BY-NC-ND 4.0 International licenseauthor/funder. It is made available under aThe copyright holder for this preprint (which was not peer-reviewed) is the. https://doi.org/10.1101/2020.03.09.984658doi: bioRxiv preprint
66
The MS chromatogram verifies the presence and sequence of HNRNPA1226-237. UD, 1
undetected. (D) The human HNRNPA1 protein functional domains described in 2
UniProt. (E) Confocal microscopic images of mouse BMDCs treated with 3
488-labeled RNA, TMR-labeled Hnrnpa1226-237 and 2-(methylamino) benzoic 4
acid-labeled Spermidine, with the cells co-stained with MHCII. (F) Agarose gel 5
showing the degradation of RNA treated with the indicated reagents. (G) ELISA 6
quantification of IL-6 levels in mouse BMDC cultures stimulated with the indicated 7
reagents (n = 3). (H) ELISA quantification of IL-6 in human moDC cultures 8
stimulated with the indicated reagents (n = 5). The data (A and E-H) are 9
representative of three independent experiments. *p < 0.05, **p < 0.01, ***p < 0.001, 10
two-tailed Student’s t-test (means ± SEM). 11
12
Figure 6│Polyamine-mediated self-RNA sensing requires endosomal Tlr7. 13
(A) ELISA quantification of IL-6 in WT and Tlr7-deficient BMDC cultures 14
stimulated with the indicated reagents (n = 3). (B) qPCR detection of human 28S 15
rRNA in endosomes isolated from mouse BMDCs treated with the indicated reagents 16
(n = 7). The fold changes relative to the self-RNA group are presented. (C) 17
Immunoblot analysis of IkappaB-ζ expression in nuclear fractions of BMDCs treated 18
with the indicated reagents for 4 h. (D and E) RNAscope-based FISH of Krt14 19
combined with immunofluorescent labelling of Tlr7 and Spermidine/Spermine on 20
DCs isolated from mouse skin treated with IMQ or untreated (UT). Scale bars 21
represent 100 μm (D) or 3 μm (E). (F) GSEA of all genes in CLEC9A+WDFY4+ 22
.CC-BY-NC-ND 4.0 International licenseauthor/funder. It is made available under aThe copyright holder for this preprint (which was not peer-reviewed) is the. https://doi.org/10.1101/2020.03.09.984658doi: bioRxiv preprint

67
cDC1 and in CD1C+ SIRPA+ cDC2/moDC from human psoriatic skin relative to 1
healthy skin with the genes induced in R848 stimulated DCs enriched (GSE2706). 2
GSEA of skin DCs in lesional K5. Pp6fl/fl skin relative to normal mouse skin with the 3
genes induced in R848 stimulated DCs enriched (GSE2706). The data (A-E) are 4
representative of two independent experiments. *p < 0.05, **p < 0.01, two-tailed 5
Student’s t-test (means ± SEM). 6
7
Figure 7│Targeting keratinocyte metabolic rewiring alleviates psoriasis-like skin 8
inflammation in mice and non-human primates. (A) Phenotypic representation of 9
mouse ears of IMQ-induced C57BL/6 mice treated with vehicle and nor-NOHA (n = 10
5). (B) Ear thickness changes of IMQ-induced C57BL/6 mice treated with vehicle and 11
nor-NOHA. (C) Representative H&E staining of mouse ears of IMQ-induced 12
C57BL/6 mice treated with vehicle and nor-NOHA. (D) Acanthosis of mouse ears of 13
IMQ-induced C57BL/6 mice treated with vehicle and nor-NOHA. (E) Statistics of the 14
flow cytometric analysis of dermal DCs and DCs in skin draining lymph nodes from 15
3-day-IMQ-induced C57BL/6 mice treated with vehicle, nor-NOHA or DFMO (n = 16
6). (F) Phenotypic representation of untreated (UT) and IMQ-induced Cynomolgus 17
monkey skin treated with vehicle or nor-NOHA (n = 7). (G) Clinical score changes of 18
IMQ-induced Cynomolgus monkey skin treated with vehicle or nor-NOHA. (H) 19
Representative H&E staining of UT and IMQ-induced Cynomolgus monkey skin 20
treated with vehicle or nor-NOHA. (I) Acanthosis of IMQ-induced Cynomolgus 21
monkey skin treated with vehicle or nor-NOHA. (J) Representative CD4 and CD11C 22
.CC-BY-NC-ND 4.0 International licenseauthor/funder. It is made available under aThe copyright holder for this preprint (which was not peer-reviewed) is the. https://doi.org/10.1101/2020.03.09.984658doi: bioRxiv preprint
68
immunofluorescent labelling of UT and IMQ-induced Cynomolgus monkey skin 1
treated with vehicle or nor-NOHA. Diseased K5. Pp6fl/fl mice were treated with 2
nor-NOHA (K), DFMO (L) or Oligomycin (Oligo, M) every other day for 2 weeks. 3
Changes in PASI before and after treatment were calculated. For (C, H and J), the 4
dotted lines indicate the border between the epidermis and the dermis; e, epidermis; d, 5
dermis; the scale bars represent 100 μm. The data (A-E) are representative of three 6
independent experiments. The data (F-J) are representative of two independent 7
experiments. The data (K-M) are representative of two independent experiments with 8
two mice in each group. *p < 0.05, ***p < 0.001, ****p < 0.0001, two-way ANOVA 9
(A) and two-tailed Student’s t-test (means ± SEM). 10
11
Figure S1│PP6 is diminished in the epidermis of psoriasis and its mouse models. 12
(A) Immunohistochemical staining for PP6 in five healthy and five psoriatic human 13
skin sections. Nor, normal skin; Pso, psoriatic skin. (B) Linear regression analysis of 14
PP6 expression levels and acanthosis of 117 psoriatic skin biopsies (x axis: PP6 15
staining score; y axis: acanthosis of the skin section; r = -0.603). (C) The 117 16
psoriatic skin samples were separated into three groups according to the patient PASI. 17
The PP6 staining score was compared between these groups. (D and E) 18
Immunoblotting and immunohistochemical analysis of Pp6 expression in mouse skin 19
derived from mice treated with vehicle (Ctr) or IMQ (n = 4). (F and G) 20
Immunoblotting and immunohistochemical analysis of Pp6 expression in mouse ears 21
injected with PBS (Ctr) or IL-23 (n = 2). For (A, E and G), the dotted lines indicate 22
the border between the epidermis and the dermis; e, epidermis; d, dermis; scale bars 23
.CC-BY-NC-ND 4.0 International licenseauthor/funder. It is made available under aThe copyright holder for this preprint (which was not peer-reviewed) is the. https://doi.org/10.1101/2020.03.09.984658doi: bioRxiv preprint

69
represent 50 μm (A) or 20 μm (E and G). The data (D-G) are representative of three 1
independent experiments. *p < 0.05, two-tailed Student’s t-test (means ± SEM). 2
3
Figure S2│Characterization of skin lesions observed in K5. Pp6fl/fl mice. (A) 4
Schematic of Pp6 deletion in K5. Pp6fl/fl mice. (B) Pp6 genotyping of the indicated 5
tissue samples derived from WT, Pp6fl/fl and K5. Pp6fl/fl mice. The red arrow shows 6
K5-Cre-mediated epidermal-specific deletion of Pp6. (C) Immunoblot analysis of Pp6 7
expression in primary murine keratinocytes from Pp6fl/fl and K5. Pp6fl/fl mice. (D) 8
Immunofluorescent staining of Krt5 and Pp6 in thymic sections from Pp6fl/fl and K5. 9
Pp6fl/fl mice. The dotted lines indicate the border between the cortex and the medulla; 10
the scale bars represent 50 μm. (E) Phenotypic representation of splenomegaly and 11
lymphadenopathy observed from diseased K5. Pp6fl/fl mice in contrast to Pp6fl/fl 12
controls. (F) Immunofluorescent labelling of Ki67 in mouse skin samples. (G) Flow 13
cytometric analysis of immune cell-specific markers in mouse skin (n = 5~6). (H) 14
TEWL of mouse skin (n = 4). (I) Immunofluorescent labelling of Krt6 in mouse skin 15
samples. (J and K) Immunofluorescent staining and quantitation of dermal CD80+ 16
cells of mouse skin samples (n = 4). (L) Toluidine blue staining for mast cells in skin 17
sections from Pp6fl/fl and K5. Pp6fl/fl mice. (M) Eosinophil peroxidase (EPX) staining 18
for eosinophils in skin sections from Pp6fl/fl and K5. Pp6fl/fl mice. A skin section from 19
a patient diagnosed with atopic dermatitis (AD) served as a positive control. (N) 20
Serum IgE levels in Pp6fl/fl and K5. Pp6fl/fl mice, as measured by ELISA (n = 11~12). 21
Boxes show twenty-fifth to seventy-fifth percentiles; whiskers show minimum to 22
maximum; and lines show medians; ns: not significant, two-tailed Student’s t-test. (O) 23
GSEA of DEGs in K5. Pp6fl/fl skin relative to Pp6fl/fl skin with upregulated (AD UP) 24
or downregulated (AD DOWN) DEGs in human AD (GSE12511) enriched. (P) H&E 25
.CC-BY-NC-ND 4.0 International licenseauthor/funder. It is made available under aThe copyright holder for this preprint (which was not peer-reviewed) is the. https://doi.org/10.1101/2020.03.09.984658doi: bioRxiv preprint
70
staining of skin sections from K5. Pp6fl/fl mice treated with Halometasone or vehicle. 1
Pp6fl/fl, healthy skin sample from control mice; K5. Pp6fl/fl-N, unaffected skin from 2
K5. Pp6fl/fl mice; K5. Pp6fl/fl-L, affected skin from K5. Pp6fl/fl mice. The data (D, E, I, 3
L and M) are representative of > 5 mice in each group. The data (P) are representative 4
of two independent experiments with two mice in each group. For (F, I, J, L, M and 5
P), the dotted lines indicate the border between the epidermis and the dermis; e, 6
epidermis; d, dermis; the scale bars represent 50 μm (F, I, J, M and P) or 100 μm (L). 7
*p < 0.05, ***p < 0.001, ****p < 0.0001, ns: not significant, two-tailed Student’s 8
t-test (means ± SEM). 9
10
Figure S3│Loss of PP6 in keratinocytes activates C/EBP-β. (A and B) 11
Immunofluorescent labeling of p-C/EBP-β in mouse (A) and human (B) skin sections. 12
(C and D) Immunofluorescent labeling of C/EBPβ in mouse (C) and human (D) skin 13
sections. (E) Immunoblot analysis of p-C/EBPβ, C/EBPβ and Pp6 expression in 14
primary murine keratinocytes derived from Pp6fl/fl and K5. Pp6fl/fl mice cultured in 15
vitro for 3 days. (F) Immunoblot analysis of p-C/EBP-β, C/EBP-β and PP6 expression 16
in NHEKs transfected with a scrambled siRNA (Ctr) or with PP6 siRNA (si-PP6) for 17
48 h. (G) Nuclear and cytoplasmic extracts from HaCaT keratinocytes were 18
immunoprecipitated with an anti-PP6 antibody. The immunoprecipitates were 19
immunoblotted with anti-PP6 and anti-C/EBP-β. (H) LC-MS/MS-based detection of 20
phosphorylation sites on C/EBP-β immunoprecipitated from WT 293FT cells and 21
PP6-/- 293FT cells. (I) Confocal visualization of PLA signals in HaCaT cells 22
over-expressing WT C/EBP-β, C/EBP-βS184A, C/EBP-βT188A or C/EBP-βS184A, plus 23
.CC-BY-NC-ND 4.0 International licenseauthor/funder. It is made available under aThe copyright holder for this preprint (which was not peer-reviewed) is the. https://doi.org/10.1101/2020.03.09.984658doi: bioRxiv preprint

71
C/EBP-βT188A (double mut). (J) Immunoblot analysis of PP6 expression in NHEKs 1
stimulated with recombinant IL-17A for 12 h or un-stimulated (Ctr). For (A-D), the 2
dotted lines indicate the border between the epidermis and the dermis; Pp6fl/fl, healthy 3
skin sample from control mice; K5. Pp6fl/fl-N, unaffected skin from K5. Pp6fl/fl mice; 4
K5. Pp6fl/fl-L, affected skin from K5. Pp6fl/fl mice; Nor, normal human skin; Pso, 5
psoriatic human skin; the scale bars represent 50 μm in (A-D) and 5 μm in (I). The 6
data (A-D) are representative of > 5 samples in each group. The data (E-G, I and J) 7
are representative of three independent experiments. 8
9
Figure S4│Mouse IFE basal keratinocytes uniquely and highly express Ass1. 10
Feature-plots of the indicated genes in merged scRNAseq datasets of epidermal cells 11
from C57BL/6 mice and K5. Pp6fl/fl mice. IFE, interfollicular epidermis; HF, hair 12
follicle. 13
14
Figure S5│Pp6-deficiency keratinocytes show enhanced OXPHOS capacity. (A) 15
The inhibitory molecules that target ETC components. (B) OCR of Pp6fl/fl and K5. 16
Pp6fl/fl keratinocytes sequentially treated with the indicated reagents (n = 5-6). (C) 17
Mitochondrial fuel dependency and capacity of Pp6fl/fl and K5. Pp6fl/fl keratinocytes. 18
The difference between the dependency and capacity for each fuel represents 19
flexibility (n = 4). (D) ECAR of Pp6fl/fl and K5. Pp6fl/fl keratinocytes sequentially 20
treated with indicated reagents (n = 5-6). (E) Cellular ATP levels in Pp6fl/fl and K5. 21
Pp6fl/fl keratinocyte measured by luminescence-based quantification (n = 10). (F) 22
.CC-BY-NC-ND 4.0 International licenseauthor/funder. It is made available under aThe copyright holder for this preprint (which was not peer-reviewed) is the. https://doi.org/10.1101/2020.03.09.984658doi: bioRxiv preprint
72
Immunoblot analysis of ETC components in Pp6fl/fl and K5. Pp6fl/fl keratinocytes. (G) 1
Immunofluorescent labeling of COX4I1 in human skin sections. The data are 2
representative of > 5 samples in each group. (H) Changes in ear thickness in 3
IMQ-induced C57BL/6 mice treated with vehicle or Oligomycin (n = 8). (I) 4
Representative H&E staining of mouse ears from IMQ-induced C57BL/6 mice treated 5
with vehicle or Oligomycin. (J) Acanthosis of mouse ears from IMQ-induced 6
C57BL/6 mice treated with vehicle or Oligomycin. For (G and I), the dotted lines 7
indicate the border between the epidermis and the dermis; Nor, normal human skin; 8
Pso, psoriatic human skin; scale bars represent 100 μm. Oligo, Oligomycin; FCCP, 9
Trifluoromethoxy carbonyl cyanide phenylhydrazone; A/R, Antimycin and Rotenone; 10
2-DG, 2-Deoxy-D-glucose. The data (B, D and E) are normalized to the total protein 11
content of each sample. The data (B-J) are representative of three independent 12
experiments. *p < 0.05, **p < 0.01, ***p < 0.001, ****p < 0.0001, two-way ANOVA 13
(h) and two-tailed Student’s t-test (means ± SEM). 14
15
Figure S6│Self-RNA-polyamine-Hnrnpa1226-237 complexes are internalized by 16
BMDCs. Flow cytometric analysis of BMDCs treated with 488-labeled RNA in 17
complex with the indicated molecules. The data are representative of two independent 18
experiments. 19
20
Figure S7│Self-RNA-polyamine-cargo peptide complexes activate BMDCs and 21
induce subsequent T17 cell polarization. (A) GSEA of all the genes sequenced from 22
.CC-BY-NC-ND 4.0 International licenseauthor/funder. It is made available under aThe copyright holder for this preprint (which was not peer-reviewed) is the. https://doi.org/10.1101/2020.03.09.984658doi: bioRxiv preprint
73
cultured human keratinocytes (GSE107871) derived from healthy skin (NN KC), 1
uninvolved skin of patients with psoriasis (PN KC) and involved skin of patients with 2
psoriasis (PP KC) with genes involved in the RNA degradation pathway enriched. (B) 3
ELISA quantification of Tnf in mouse BMDC cultures stimulated with the indicated 4
reagents (n = 3). (C) ELISA quantification of TNF-α in human moDC cultures 5
stimulated with the indicated reagents (n =3~5). (D) ELISA quantification of Ifn-α in 6
mouse pDC cultures stimulated with the indicated reagents (n = 4). (E) Statistics of 7
T-cell proliferation rates (indicated by CD4+CD44+Violet- cell percentages) in 8
co-culture with BMDCs pre-treated with the indicated reagents (n = 3). (F) Statistics 9
of IL-17a+ cell percentages in co-culture with BMDCs pre-treated with the indicated 10
reagents (n = 6). (G) LC-MS/MS-based detection of Krt1017-28 abundance in the sera 11
of Pp6fl/fl mice (n = 4) and K5. Pp6fl/fl mice (n = 4); UD, undetected. (H) ELISA 12
quantification of IL-6 in mouse BMDC cultures stimulated with the indicated reagents 13
(n = 3). The data (B-F and H) are representative of three independent experiments. *p 14
< 0.05, **p < 0.01, ***p < 0.001, two-tailed Student’s t-test (means ± SEM). 15
16
Figure S8│Dominant DC populations in diseased K5. Pp6fl/fl skin and 17
IMQ-treated mouse skin. (A-B) t-SNE plots of merged scRNAseq datasets of skin 18
DCs derived from diseased K5. Pp6fl/fl mice, untreated C57BL/6 mice (UT) and 19
C57BL/6 mice treated with IMQ (IMQ), colored separately by samples (A) or cell 20
sub-clusters (B). (C) Feature-plots of the indicated genes in merged scRNAseq 21
.CC-BY-NC-ND 4.0 International licenseauthor/funder. It is made available under aThe copyright holder for this preprint (which was not peer-reviewed) is the. https://doi.org/10.1101/2020.03.09.984658doi: bioRxiv preprint
74
datasets of skin DCs derived from diseased K5. Pp6fl/fl mice, UT C57BL/6 mice and 1
IMQ C57BL/6 mice. 2
3
Figure S9│Summary of the study. Hyperproliferating keratinocytes upregulate 4
ARG1 and undergo urea cycle rewiring, leading to local polyamine accumulation. In 5
complex with HNRNPA1226-237 identified in the blood plasma of patients with 6
psoriasis, polyamines aggregate self-RNA that is released by psoriatic keratinocytes, 7
facilitating self-RNA endosomal sensing by myeloid dendritic cells and initiating 8
downstream inflammatory cascades. Inhibiting ARG1, a critical regulator of the urea 9
cycle, markedly improves psoriasis-like skin inflammation in mice and non-human 10
primates. 11
.CC-BY-NC-ND 4.0 International licenseauthor/funder. It is made available under aThe copyright holder for this preprint (which was not peer-reviewed) is the. https://doi.org/10.1101/2020.03.09.984658doi: bioRxiv preprint
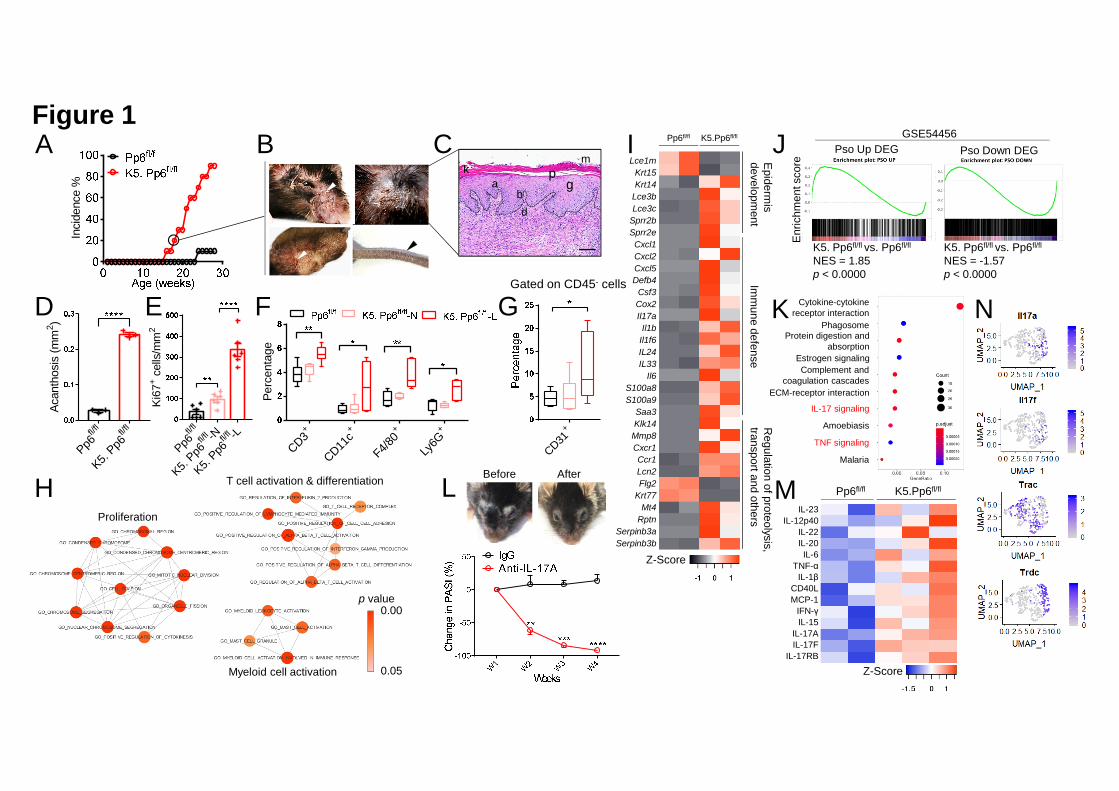
K5. Pp6fl/fl vs. Pp6fl/fl
NES = 1.85p < 0.0000
Lce1mKrt15Krt14
Lce3bLce3c
Sprr2bSprr2eCxcl1Cxcl2Cxcl5Defb4
Csf3Cox2Il17aIl1b
Il1f6IL24IL33
Il6S100a8S100a9
Saa3Klk14
Mmp8Cxcr1Ccr1Lcn2Flg2
Krt77Mt4
RptnSerpinb3aSerpinb3b
p value0.00
0.05
Proliferation
T cell activation & differentiation
Myeloid cell activation
K5.Pp6fl/flPp6fl/fl
Inci
denc
e %
BA CFigure 1
abd
k pg
m
Pp6fl/f
l
K5. Pp6
fl/fl
Acan
thos
is (m
m2 )
Pp6fl/f
l
K5. Pp6
fl/fl -N
K5. Pp6
fl/fl -L
Ki67
+ cel
ls/m
m2
CD3+
CD11c+
F4/80+
Ly6G
+
Perc
enta
ge
CD31+
D E F GEpiderm
is developm
entIm
mune defense
Gated on CD45- cells
I J
Enric
hmen
t sco
re
GSE54456
GSE54456
K5. Pp6fl/fl vs. Pp6fl/fl
NES = -1.57p < 0.0000
Pp6fl/fl K5.Pp6fl/fl
Pso Up DEG Pso Down DEG
ECM-receptor interaction
Complement and coagulation cascades
Estrogen signaling
Protein digestion and absorption
Phagosome
IL-17 signaling
Amoebiasis
TNF signaling
Malaria
Cytokine-cytokine receptor interactionK
IL-23IL-12p40
IL-22IL-20IL-6
TNF-αIL-1β
CD40LMCP-1
IFN-γIL-15
IL-17AIL-17F
IL-17RB
HBefore After
M
N
L
Regulation of proteolysis,
transport and others
Z-Score
Z-Score
.CC-BY-NC-ND 4.0 International licenseauthor/funder. It is made available under aThe copyright holder for this preprint (which was not peer-reviewed) is the. https://doi.org/10.1101/2020.03.09.984658doi: bioRxiv preprint
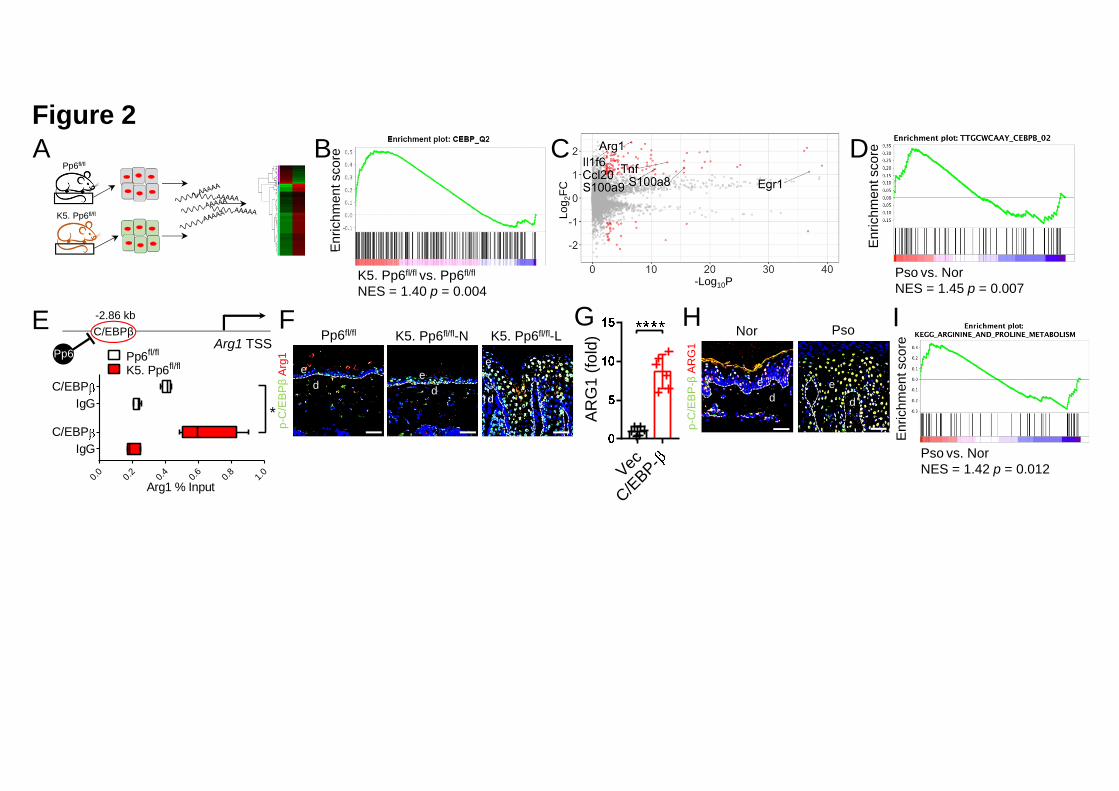
Figure 2B
Vec
C/EBP-
ARG
1 (fo
ld)
Pp6fl/fl
K5. Pp6fl/fl
A
G
Pso vs. Nor NES = 1.45 p = 0.007
Enric
hmen
t sco
reD
I
Pso vs. NorNES = 1.42 p = 0.012
Enric
hmen
t sco
re
0.0 0.2 0.4 0.6 0.8 1.0
IgGC/EBP
IgGC/EBP
Pp6fl/fl
K5. Pp6fl/fl
Arg1 % Input
*
E C/EBPβArg1 TSS
-2.86 kb
Pp6
-Log10P
Log 2
FC
FPp6fl/fl K5. Pp6fl/fl-N K5. Pp6fl/fl-L
p-C
/EBP
βAr
g1
de
de
d
e
Nor PsoH
p-C
/EBP
-βAR
G1
de
de
C
Enric
hmen
t sco
re
K5. Pp6fl/fl vs. Pp6fl/fl
NES = 1.40 p = 0.004
.CC-BY-NC-ND 4.0 International licenseauthor/funder. It is made available under aThe copyright holder for this preprint (which was not peer-reviewed) is the. https://doi.org/10.1101/2020.03.09.984658doi: bioRxiv preprint
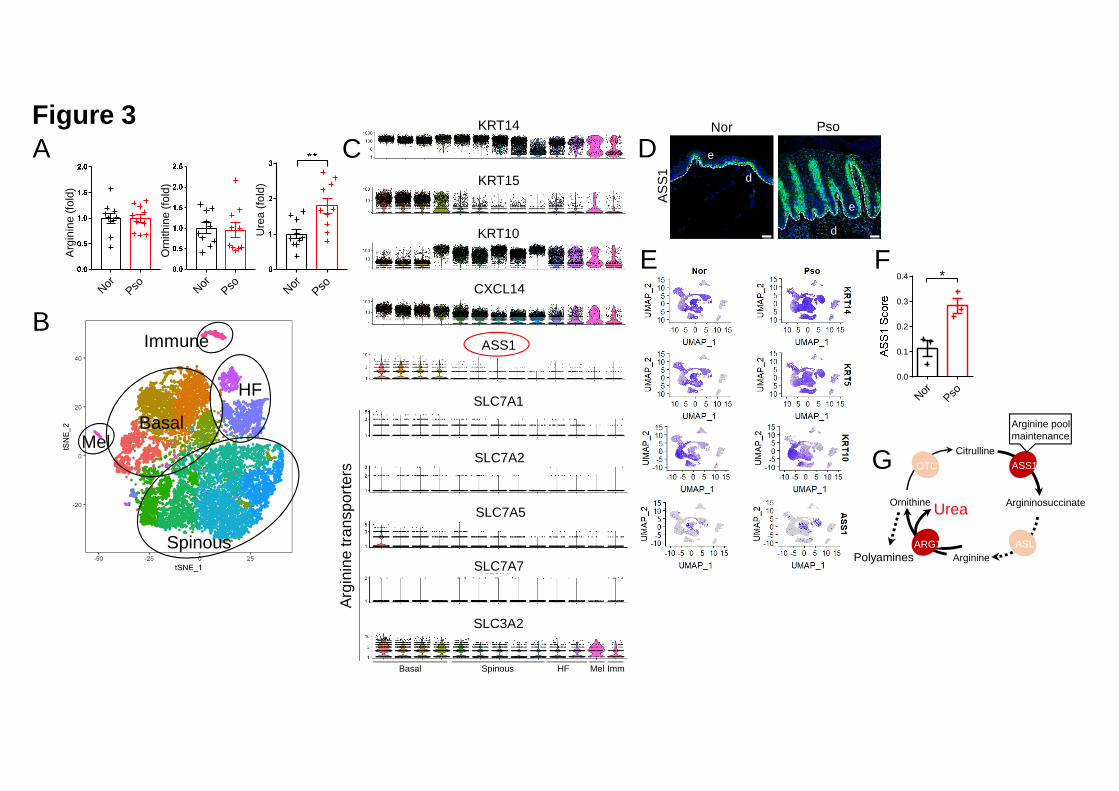
Figure 3
Nor PsoNor Pso Nor Pso
D
E
Arginine
Ornithine Argininosuccinate
CitrullineOTC ASS1
ASLARG1
Urea
Polyamines
Arginine pool maintenance
Argi
nine
(fol
d)
Orn
ithin
e (fo
ld)
Ure
a (fo
ld)
Basal
Immune
HF
Spinous
Mel
Spinous
C
Basal HF ImmMel
Argi
nine
tran
spor
ters
KRT14
KRT15
KRT10
CXCL14
ASS1
SLC7A1
SLC7A2
SLC7A5
SLC7A7
SLC3A2
ASS1
Nor Pso
d
e
d
e
A
B
G
Nor Pso0.0
0.1
0.2
0.3
0.4 *F
.CC-BY-NC-ND 4.0 International licenseauthor/funder. It is made available under aThe copyright holder for this preprint (which was not peer-reviewed) is the. https://doi.org/10.1101/2020.03.09.984658doi: bioRxiv preprint
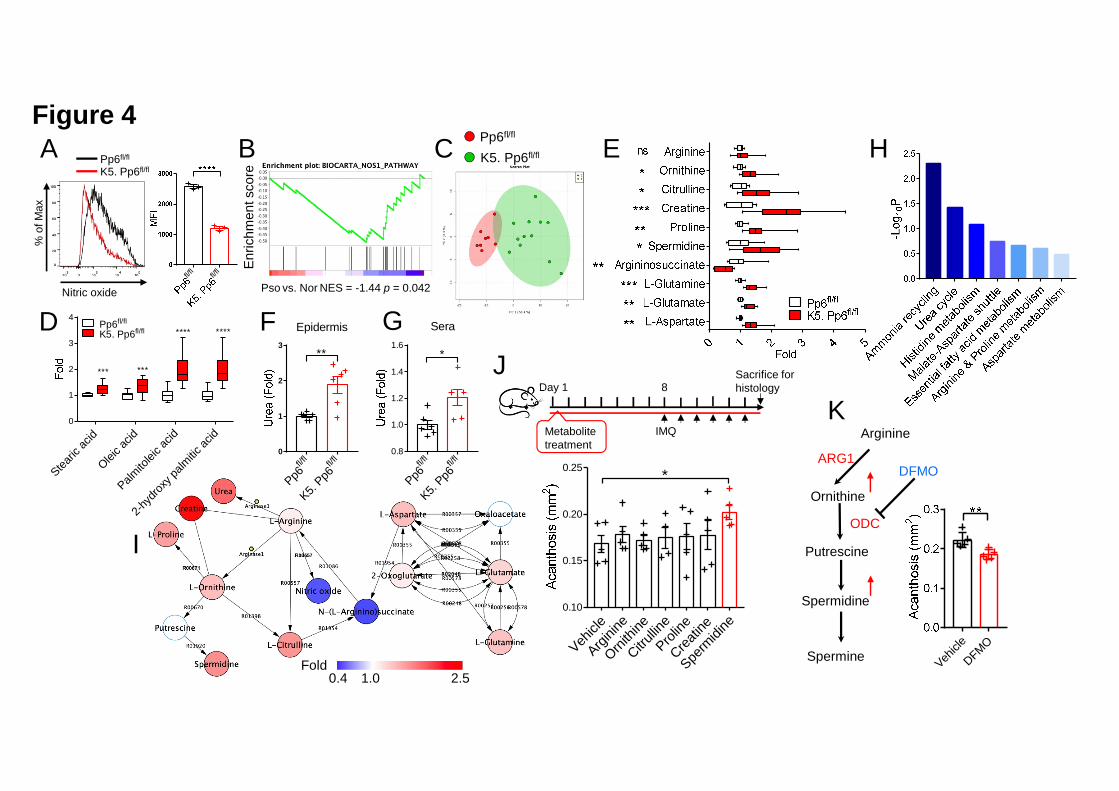
Fold0.4 2.51.0
Pp6fl/f
l
K5. Pp6
fl/fl
0.8
1.0
1.2
1.4
1.6
Sera
*
Figure 4
Day 1 8
IMQ
Sacrifice for histology
A Pp6fl/fl
K5. Pp6fl/fl
Nitric oxide
fl/fl
fl/fl
Vehicle
Arginin
e
Ornithi
ne
Citrullin
e
Proline
Creatin
e
Sperm
idine
0.10
0.15
0.20
0.25 *
E
J
Vehicle
DFMO
B
Pso vs. Nor NES = -1.44 p = 0.042
Enric
hmen
t sco
re
Metabolite treatment
Arginine
Ornithine
Putrescine
Spermidine
ARG1
Spermine
ODC
DFMO
K
% o
f Max
K5. Pp6fl/fl
Pp6fl/fl
Stearic
acid
Oleic a
cid
Palmito
leic a
cid
2-hyd
roxy p
almitic
acid
0
1
2
3
4Pp6fl/fl
K5. Pp6fl/fl
*** ***
**** ****
Pp6fl/f
l
K5. Pp6
fl/fl
0
1
2
3
Epidermis
**
C H
D F G
I
.CC-BY-NC-ND 4.0 International licenseauthor/funder. It is made available under aThe copyright holder for this preprint (which was not peer-reviewed) is the. https://doi.org/10.1101/2020.03.09.984658doi: bioRxiv preprint
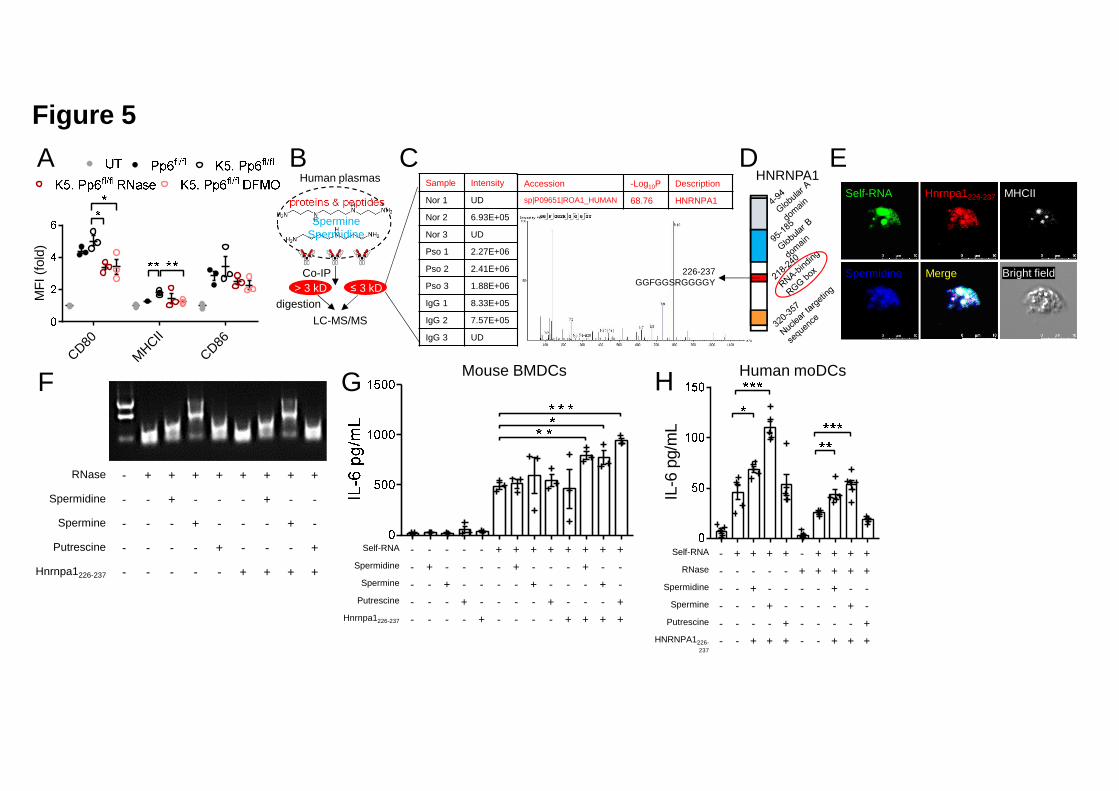
IL-6
pg/
mL
CD80MHCII
CD86
MFI
(fol
d)
Figure 5
Accession -Log10P Description
sp|P09651|ROA1_HUMAN 68.76 HNRNPA1
Sample Intensity
Nor 1 UD
Nor 2 6.93E+05
Nor 3 UD
Pso 1 2.27E+06
Pso 2 2.41E+06
Pso 3 1.88E+06
IgG 1 8.33E+05
IgG 2 7.57E+05
IgG 3 UD
Human plasmasC
226-237GGFGGSRGGGGY> 3 kD ≤ 3 kD
Co-IP
proteins & peptides
B
digestionLC-MS/MS
SpermidineSpermine
DHNRNPA1
Self-RNA Hnrnpa1226-237 MHCII
Spermidine Merge
E
Bright field
RNase - + + + + + + + +
Spermidine - - + - - - + - -
Spermine - - - + - - - + -
Putrescine - - - - + - - - +
Hnrnpa1226-237 - - - - - + + + +
Self-RNA - - - - - + + + + + + + +Spermidine - + - - - - + - - - + - -
Spermine - - + - - - - + - - - + -Putrescine - - - + - - - - + - - - +
Hnrnpa1226-237 - - - - + - - - - + + + +
G H
Self-RNA - + + + + - + + + +RNase - - - - - + + + + +
Spermidine - - + - - - - + - -Spermine - - - + - - - - + -
Putrescine - - - - + - - - - +HNRNPA1226-
237- - + + + - - + + +
Mouse BMDCs Human moDCs
A
F
.CC-BY-NC-ND 4.0 International licenseauthor/funder. It is made available under aThe copyright holder for this preprint (which was not peer-reviewed) is the. https://doi.org/10.1101/2020.03.09.984658doi: bioRxiv preprint

0
5
10
15
**
**
Self-RNA + + + +Spermidine - + - -
Spermine - - + -Putrescine - - - +
Hnrnpa1226-237 - + + +
Self-RNA - + + + +Spermidine - - + - -
Spermine - - - + -Putrescine - - - - +
Hnrnpa1226-237 - - + + +
IkappaB-ζ
H3
Self-RNA-polyamine-Hnrnpa1226-237 complexes
Total RNA from HaCaT cells
Endosome isolation
qPCR detection for human 28S rRNA
Mouse BMDC
Figure 6A
0
500
1000
1500
*
**
Tlr7-WT
Mouse BMDCs B
Self-RNA - + + + + - + + + +Spermidine - - + - - - - + - -
Spermine - - - + - - - - + -Putrescine - - - - + - - - - +
Hnrnpa1226-237 - - + + + - - + + +
C BMDC nuclei
Mouse skin DCsMergeTlr7Krt14 RNA Spd/Spm DAPI
UT
IMQ
D
E Krt14 RNA Tlr7
Spd/Spm DAPI
Merge
Pso vs. Nor NES = 0.97 p = 1.00
Enric
hmen
t sco
re
Pso vs. Nor NES = 1.81 p < 0.0000
Enric
hmen
t sco
re
Enric
hmen
t sco
re
K5. Pp6fl/fl vs. WTNES = 1.39 p = 0.016
Human skinCLEC9A+WDFY4+ cDC1
Human skinCD1C+ SIRPA+
cDC2/moDCMouse skin DC
Average gene expression from scRNAseq datasets
F
.CC-BY-NC-ND 4.0 International licenseauthor/funder. It is made available under aThe copyright holder for this preprint (which was not peer-reviewed) is the. https://doi.org/10.1101/2020.03.09.984658doi: bioRxiv preprint
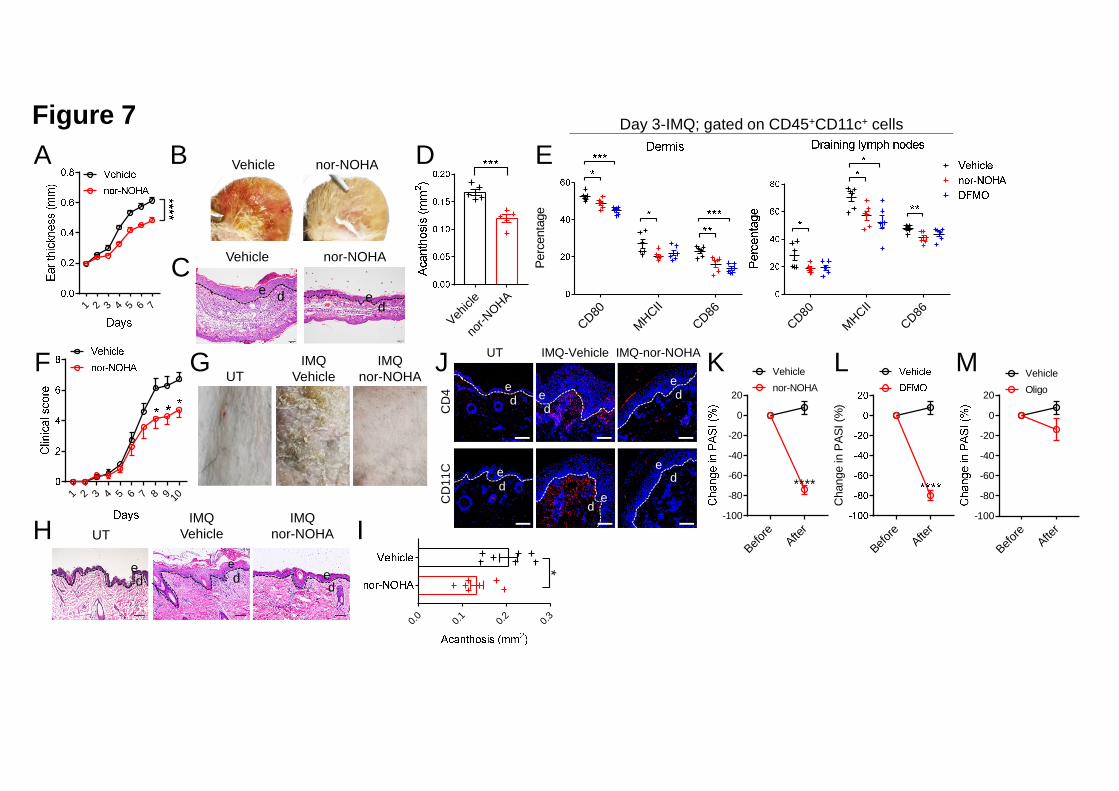
1 2 3 4 5 6 7 8 9 10
Figure 7
Vehicle
nor-N
OHA1 2 3 4 5 6 7
Vehicle nor-NOHAA
C
DB
FUT
IMQVehicle
IMQnor-NOHA
0.0 0.1 0.2 0.3
*d
ed
e
de
Vehicle nor-NOHA
ded
e
UT IMQ-Vehicle IMQ-nor-NOHA
CD
4C
D11
C
de
de d
e
de
de
de
Before
After
Cha
nge
in P
ASI (
%)
Before
After
-100
-80
-60
-40
-20
0
20
Vehiclenor-NOHA
****
Before
After
-100
-80
-60
-40
-20
0
20
VehicleOligo
KCD80
MHCIICD86
Perc
enta
ge
CD80MHCII
CD86
Day 3-IMQ; gated on CD45+CD11c+ cells
E
G
UTIMQ
VehicleIMQ
nor-NOHAH I
J L M
.CC-BY-NC-ND 4.0 International licenseauthor/funder. It is made available under aThe copyright holder for this preprint (which was not peer-reviewed) is the. https://doi.org/10.1101/2020.03.09.984658doi: bioRxiv preprint

Nor-1 Nor-4 Nor-5
Pso-1 Pso-2
ANor-2 Nor-3
Pso-4 Pso-5Pso-3
C
Br = -0.603p < 0.0001n = 117
Acan
thos
is (m
m2 )
H Score
H S
core
PASI
*
*
F
β-ac
tinPp
6
Ctr IMQD Ctr IL-23
β-ac
tinPp
6
EIMQ
d e
Ctrd e
Ctr IL-23
d e
G
d e
d
e
d
e
d
e
d
e
d
e
d
e
d
ed
e
d
e
d
e
n = 86
n = 21
n = 10
Figure S1
.CC-BY-NC-ND 4.0 International licenseauthor/funder. It is made available under aThe copyright holder for this preprint (which was not peer-reviewed) is the. https://doi.org/10.1101/2020.03.09.984658doi: bioRxiv preprint
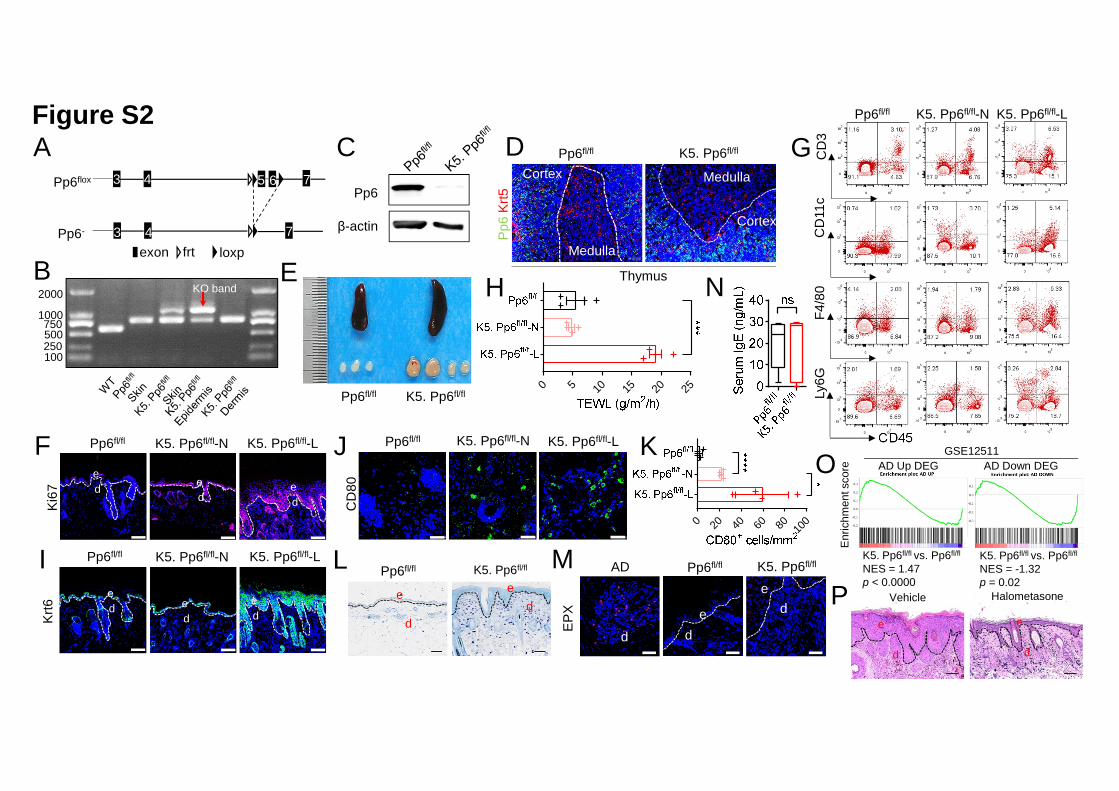
K5. Pp6fl/fl vs. Pp6fl/fl
NES = 1.47p < 0.0000
K5. Pp6fl/fl vs. Pp6fl/fl
NES = -1.32p = 0.02
G
frtexon
Figure S2
Pp6
β-actin
C
B
4 6 75
3 4 7
Pp6flox
Pp6-
3
loxp
A Pp6fl/fl
Pp6
Krt5
Cortex
Medulla
K5. Pp6fl/fl
Cortex
Medulla
D
Thymus
Pp6fl/fl K5. Pp6fl/fl
E
CD45
CD
11c
Ly6G
CD
3F4
/80
Pp6fl/fl K5. Pp6fl/fl-N K5. Pp6fl/fl-L
Pp6fl/fl K5. Pp6fl/fl-N
1000
2000
750500 250100
KO band
K5. Pp6fl/fl-LFde
de
de
Ki67
de
de
de
Pp6fl/fl K5. Pp6fl/fl-N K5. Pp6fl/fl-LI
0 5 10 15 20 25
H
J
CD
80
Pp6fl/fl K5. Pp6fl/fl-N K5. Pp6fl/fl-L
Krt6
0 20 40 60 80 100
L Pp6fl/fl K5. Pp6fl/fl
d
ed
eEP
XAD
K5. Pp6fl/fl
d d
de e
Pp6fl/fl K5. Pp6fl/fl
de
M
Enric
hmen
t sco
reOGSE12511
AD Up DEG AD Down DEG
Vehicle HalometasoneP
d
e
d
e
N
K
.CC-BY-NC-ND 4.0 International licenseauthor/funder. It is made available under aThe copyright holder for this preprint (which was not peer-reviewed) is the. https://doi.org/10.1101/2020.03.09.984658doi: bioRxiv preprint

Figure S3E
G
p-C/EBPβ
C/EBPβ
Pp6
β-actin
Pp6fl/flK5. Pp6fl/fl
Peptide Site(s) WT PP6-/-
R.AYLGYQAVPSGSSGSLST(p)SSSSS(p)PPGTPSPAD
AK.A
T179, S184 0 2.14E+05
R.AYLGYQAVPSGSSGSLSTSSSSS(p)PPGT(p)PSPAD
AK.A
S184, T188 0 8.29E+05
L.ST(p)SSSSSPPGT(p)PS
PADAK.A
T179, T188 0 2.22E+05
C/EBP-β
PP6
Input IgG IP: PP6
Input IgG IP: PP6
Cytoplasm
Nucleus
C/EBP-β
PP6
p-C/EBP-β
Ctr si-PP6
C/EBP-β
PP6
GAPDH
WT
S184A
T188
A
Double m
ut
C
C/E
BP-β
d
PsoNorPp6fl/fl K5. Pp6fl/fl-N K5. Pp6fl/fl-L
de
de
deC
/EBP
β
de
de
D
Pp6fl/fl K5. Pp6fl/fl-N K5. Pp6fl/fl-L Nor Pso
p-C
/EBP
β
de d
ed
e
ed
ep-C
/EBP
-β
d
A B F
H
Tub
Ctr IL-17AJPP6
I
.CC-BY-NC-ND 4.0 International licenseauthor/funder. It is made available under aThe copyright holder for this preprint (which was not peer-reviewed) is the. https://doi.org/10.1101/2020.03.09.984658doi: bioRxiv preprint

Figure S4
IFE differentiatedH
F
Ctr K5.Pp6fl/fl Ctr K5.Pp6fl/fl
IFE basal
.CC-BY-NC-ND 4.0 International licenseauthor/funder. It is made available under aThe copyright holder for this preprint (which was not peer-reviewed) is the. https://doi.org/10.1101/2020.03.09.984658doi: bioRxiv preprint
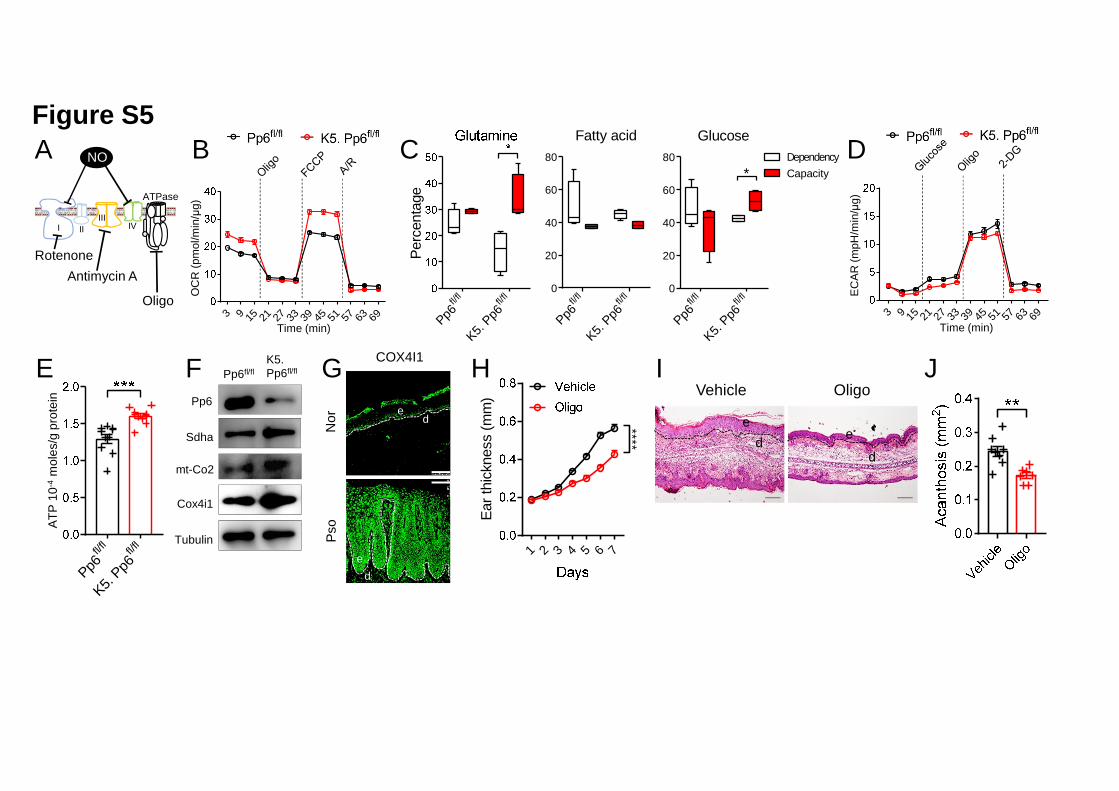
Figure S5
Pp6fl/f
l
K5. Pp6
fl/fl0
20
40
60
80
GlucoseDependencyCapacity*
3 9 15 21 27 33 39 45 51 57 63 69Time (min)
OC
R (p
mol
/min
/μg)
Pp6fl/flK5. Pp6fl/fl
Pp6
Sdha
mt-Co2
Cox4i1
Tubulin
B
Pp6fl/f
l
K5. Pp6
fl/fl
ATP
10-4
mol
es/g
pro
tein
F G
D
3 9 15 21 27 33 39 45 51 57 63 69
ECAR
(mpH
/min
/μg)
Time (min)Pp6fl/f
l
K5. Pp6
fl/fl
Perc
enta
ge
Pp6fl/f
l
K5. Pp6
fl/fl0
20
40
60
80
Fatty acidC
E
1 2 3 4 5 6 7
Ear t
hick
ness
(mm
)****
Vehicle OligoH I J
de
de
F6
Oligo
Antimycin ARotenone
IIII
IV
NO
II
ATPase
A
e d
COX4I1
Nor
Pso
de
d
ed
.CC-BY-NC-ND 4.0 International licenseauthor/funder. It is made available under aThe copyright holder for this preprint (which was not peer-reviewed) is the. https://doi.org/10.1101/2020.03.09.984658doi: bioRxiv preprint

% o
f Max
488
Self-RNA
RNA + Hnrnpa1226-237+ Putrescine
Untreated
RNA + Hnrnpa1226-237+ Spermidine
RNA + Hnrnpa1226-237+ Spermine
RNA + Hnrnpa1226-237
RNA + Spermidine RNA + Spermine RNA + Putrescine
Figure S6
.CC-BY-NC-ND 4.0 International licenseauthor/funder. It is made available under aThe copyright holder for this preprint (which was not peer-reviewed) is the. https://doi.org/10.1101/2020.03.09.984658doi: bioRxiv preprint
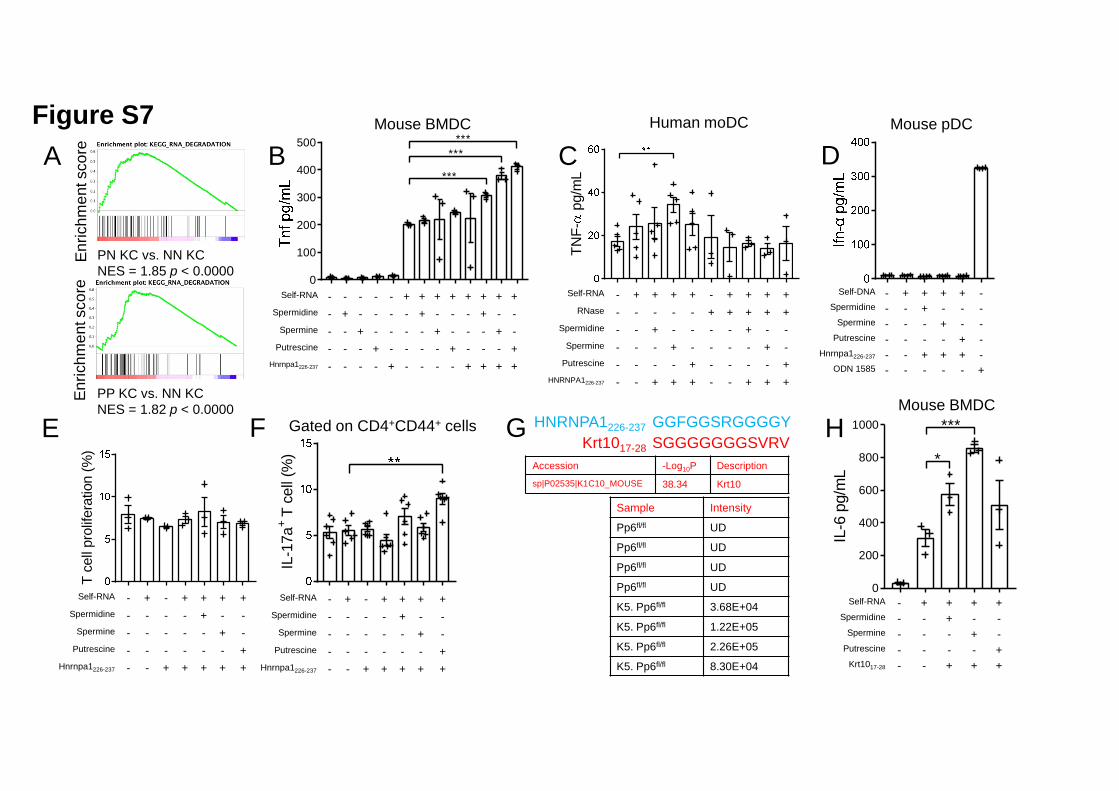
0
100
200
300
400
500 ******
***
Figure S7A
TNF-
pg/
mL
B
Self-RNA - - - - - + + + + + + + +Spermidine - + - - - - + - - - + - -
Spermine - - + - - - - + - - - + -Putrescine - - - + - - - - + - - - +
Hnrnpa1226-237 - - - - + - - - - + + + +
Self-RNA - + + + + - + + + +RNase - - - - - + + + + +
Spermidine - - + - - - - + - -Spermine - - - + - - - - + -
Putrescine - - - - + - - - - +HNRNPA1226-237 - - + + + - - + + +
CMouse BMDC Human moDC
Self-DNA - + + + + -Spermidine - - + - - -
Spermine - - - + - -Putrescine - - - - + -
Hnrnpa1226-237 - - + + + -ODN 1585 - - - - - +
Mouse pDC
D
T ce
ll pr
olife
ratio
n (%
)
Self-RNA - + - + + + +Spermidine - - - - + - -
Spermine - - - - - + -Putrescine - - - - - - +
Hnrnpa1226-237 - - + + + + +
IL-1
7a+
T ce
ll (%
)
Self-RNA - + - + + + +Spermidine - - - - + - -
Spermine - - - - - + -Putrescine - - - - - - +
Hnrnpa1226-237 - - + + + + +
Gated on CD4+CD44+ cellsE F
PN KC vs. NN KC NES = 1.85 p < 0.0000
PP KC vs. NN KC NES = 1.82 p < 0.0000
Enric
hmen
t sco
reEn
richm
ent s
core
0
200
400
600
800
1000
IL-6
pg/
mL
*
***
Self-RNA - + + + +Spermidine - - + - -
Spermine - - - + -Putrescine - - - - +
Krt1017-28 - - + + +
Krt1017-28 SGGGGGGGSVRVHNRNPA1226-237 GGFGGSRGGGGY
Accession -Log10P Description
sp|P02535|K1C10_MOUSE 38.34 Krt10
Sample Intensity
Pp6fl/fl UD
Pp6fl/fl UD
Pp6fl/fl UD
Pp6fl/fl UD
K5. Pp6fl/fl 3.68E+04
K5. Pp6fl/fl 1.22E+05
K5. Pp6fl/fl 2.26E+05
K5. Pp6fl/fl 8.30E+04
G HMouse BMDC
.CC-BY-NC-ND 4.0 International licenseauthor/funder. It is made available under aThe copyright holder for this preprint (which was not peer-reviewed) is the. https://doi.org/10.1101/2020.03.09.984658doi: bioRxiv preprint
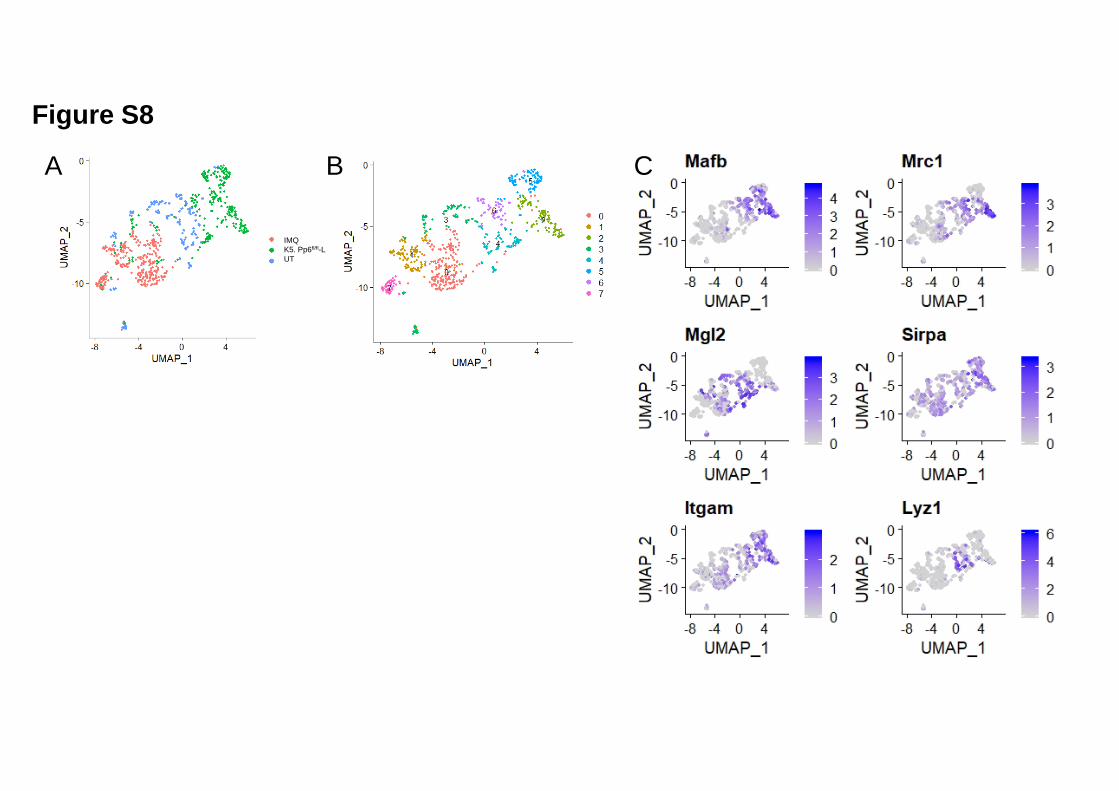
Figure S8
A C
IMQK5. Pp6fl/fl-LUT
B
.CC-BY-NC-ND 4.0 International licenseauthor/funder. It is made available under aThe copyright holder for this preprint (which was not peer-reviewed) is the. https://doi.org/10.1101/2020.03.09.984658doi: bioRxiv preprint

Figure S9
Self-RNA
L-arginine
L-ornithine
PP6
Urea+
ARG1
NOATP
OXPHOS
Ac-CoATCAcycle
mDC
C/EBP-β
Cargo peptides
T17
Cytokines
Rel
ieve
d sk
in
infla
mm
atio
n
IL-17A, IL-17F and others
KeratinocytesEpidermis
Dermis
Psoriasis Maintenance
polyamines TLR7
.CC-BY-NC-ND 4.0 International licenseauthor/funder. It is made available under aThe copyright holder for this preprint (which was not peer-reviewed) is the. https://doi.org/10.1101/2020.03.09.984658doi: bioRxiv preprint