excess heat and nuclear products by d o/pd electrolysis ... · pdf file1 takahashi, a., et...
TRANSCRIPT

1
Takahashi, A., et al., Excess heat and nuclear products by D2O/Pd electrolysis and multibody fusion. Int. J. Appl.Electromagn. Mater., 1992. 3: p. 221.
Excess heat and nuclear products by D2O/Pd electrolysis andmultibody fusion
Akito Takahashi, Toshiyuki Iida, Takayuki Takeuchi and Akimasa MegaDepartment of Nuclear Engineering, Osaka University, Yamadaoka 2-1, Suita, Osaka, Japan
Received 25 May 1992
Presented at the fourth International Symposium on Nonlinear Phenomena in ElectromagneticFields, Nagoya, Japan, January 26-29, 1992.
An excess heat of 100 W/cc level, 1.7 times the input power in average, and 160MJ in total was observed for about two months by the L-H mode pulseelectrolysis of a D2O/Pd cell with plane-symmetric configuration of D-loadinginto the Pd cathode. Very weak neutron emission was detected to show aninversely proportional correlation to the excess heat variation. To explain theobserved anomalous results including our past results, the theoretical model ofcompeting multibody deuteron fusions in transient PdDx lattice has been extended.It can explain most experimental results. Cold fusion may be the multibody fusionof hydrogen isotopes in the metal lattice.
1. IntroductionSince the amazing announcements [1,2], many positive results have been obtained worldwide
[3-5] these years, and the existence of cold fusion phenomena is becoming clear. Major resultscan be summarized as follows: (1) very weak neutron emission, (2) anomalous tritiumproduction, and (3) excess heat generation of typically 20 MJ. However, the results are chaoticand difficult to be reproduced; some authors found excess heat without neutrons, some othersfound neutrons and no heat, and so on. What is the reason for this sporadicity? “Unusual fusion”has been suggested [3], but what is unusual fusion? Mechanisms of observed anomalousphenomena are yet to be solved. This paper tries to give an answer for solving the puzzle, anddescribes the detail of our previous work [6].
Since June 1989, we have carried out many experiments in Osaka based on pulse electrolysiswith open cells [7-10]. The results are summarized as follows.
Experiment A [7]: Biased-pulse electrolysis with cast Pd rods in D2O + 1 M Li2SO4 was doneto observe neutrons. Weak emission of 2.45 MeV neutrons, 1-5 n/s/cc-metal, was observed. Theloading condition of deuterons was low; the volume-averaged D/Pd ratio was less than 0.3.
Experiment B [8,9]: Biased-pulse electrolysis with D2O + 0.3 M LiOD with a Pd (0.1% Ag)disk (8 mm diameter, 5 mm thick) and a cold-worked pure Pd rod (10 mm diameter, 30 mmlong) was done for about one month per each Pd cathode. Peculiar neutron emission spectrahaving two components, 2.45 MeV and 3-7 MeV, were accidentally observed. The spectralshape changed time-dependently. The maximum neutron yield was 15 n/s/cc.

2
Experiment C [10]: Electrolysis of D2O + 0.3 M LiOD was done by the low-high (L-H) pulsecurrent mode with a long (12 h) repetition period for more than one month per each Pd cathode.Cold-worked pure Pd metals were used for cathodes. A large Pd rod (20 mm diameter, 30 mmlong) gave neutron spectra with the two components of 2.45 MeV and 3-7 MeV, and asignificant amount of tritium production. We obtained a yield ratio between neutron and tritium,i.e., the n/t ratio, of 10-5 ≈ 10-6. The theoretical model of the competing process between two-body and three-body (d-d-d) fusions in PdDx lattice could explain these experimental resultsconsistently. A cold worked pure Pd plate (1 mm thick, 25 × 25 mm) gave similar neutronspectra. Since this experiment gave us a hint for controlling the “cold fusion reaction”, we havetried to improve it in experiment D which is described in the following.
2. Experiment DIn the last Como Conference [5], it was suggested [11,12] that attaining a high D/Pd ratio
(more than 0.9 in average of Pd cathode volume) was the key to meet excess heat and tritiumgenerations. We have considered that the plane-symmetric and homogeneous D-loading intoboth sides of the Pd plate cathode is needed to enhance the D/Pd ratio significantly. Releasingand reloading deuterons by the L-H current mode electrolysis [13] may be effective. This ideawas tried in this experiment [6].
The newly made electrolysis cell and its external cooling system are shown in fig. 1. Anextended figure of the electrode unit is given in fig. 2 (upper graph). A 1 mm thick, 25 mmsquare Pd plate of 99.99% purity is used for the cathode which is supported by two smallpolyethylene bricks and surrounded with Pt anode wires (7 turns with 5 mm pitch) keeping theminimum anode-cathode distances to be 10 mm for both sides. The Pt leading wire to thecathode and the anode leading wire (Pt) are covered with Teflon tape wrapping to makeelectrical isolation. The electrolyte is 700 ml D2O plus 0.3 mol/l LiOD. The electrolyte is alwayscooled with an external cooling system through a spiral glass tube, temperature-regulated (20°C)ordinary water flow with constant flow-rate (10 l/min nominal). The cell temperature ismonitored by a thermocouple in a small glass tube filled with fresh D2O, which was set up at themiddle point between the electrode unit and the water-cooling coil of spiral glass. The cellcontainer (120 × 75 mm, 110 mm high) is made of 5 mm thick acrylite plates.
Fig. 1. Schematic view of electrolysis cell and external cooling system.

3
The control system of pulse electrolysis and neutron measurements is described in detail in ref.[7]. We used a constant current power supply for the electrolysis. Following the initial testoperation for an hour to check the voltage-current condition (50 ≈ 100 W Joule heating byelectrolysis) and cooling safety, we started the “preloading phase” with the “sawtooth currentmode” (0.25 A minimum current, 5 A maximum current, linear increment from minimum tomaximum, and 20 min cycling period, see fig. 2 lower) and continued it for 7 days (Exp. 114). Inthe 5th to 7th day, we could notice a slight (≈1 n/s) excess neutron emission and a trend of celltemperature increase. Therefore, we decided to switch to the L-H current mode operation(repeating the cycle of 0.25 A for 6 h (L) and 4.2 A for 6 h (H): see fig. 2 lower) from the 8thday to start Exp. 115. For either the L- or H-period, the electrolysis current was kept constant.The supplied voltage was almost constant for the L-periods, about 5 V, and varied from about 27V (early cycles) to 20 V (later cycles) for the H-periods for a one “week” run. Once a “week” (4-8 days depending on the procedure; see fig. 3) we added 200-250 ml fresh D2O, and sampled 1ml electrolyte for the tritium measurement [10].
Fig. 2. Configuration of electrode unit for experiment D (upper) and current operation modes (lower).
In about two weeks for the L-H operation, we started to notice anomalous increases in the celltemperature. Typical wave forms of the cell temperature are shown in fig. 4, together with the
4
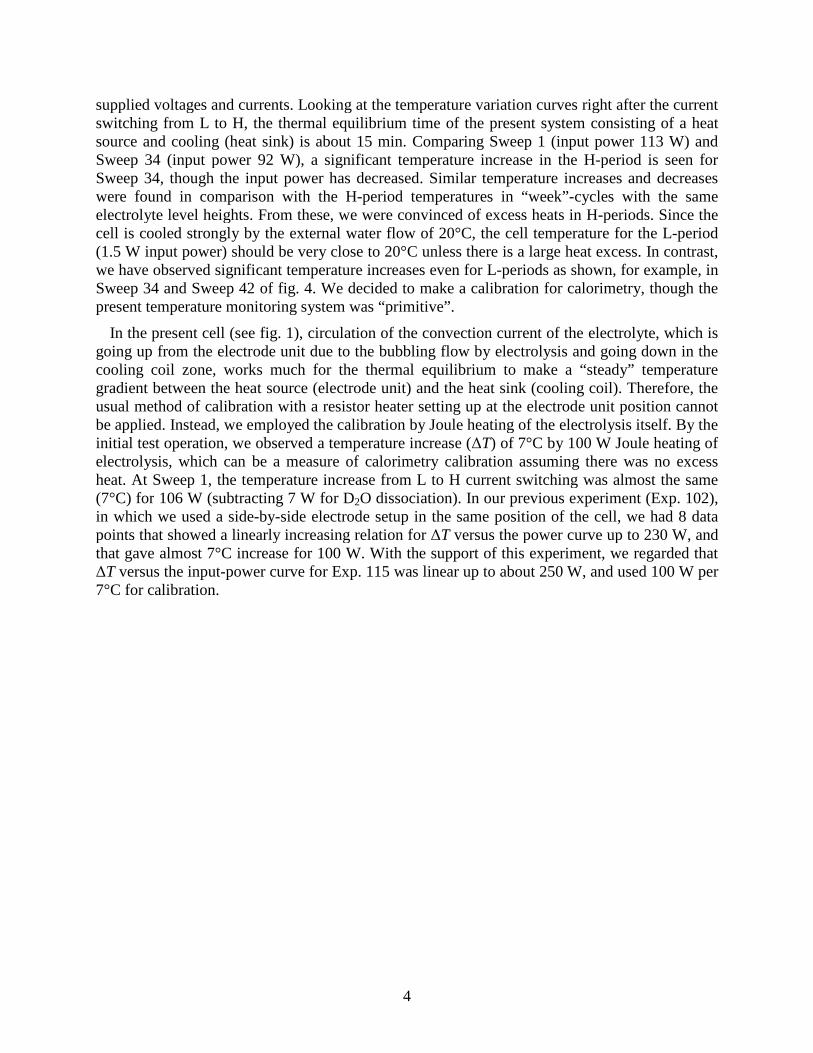
supplied voltages and currents. Looking at the temperature variation curves right after the currentswitching from L to H, the thermal equilibrium time of the present system consisting of a heatsource and cooling (heat sink) is about 15 min. Comparing Sweep 1 (input power 113 W) andSweep 34 (input power 92 W), a significant temperature increase in the H-period is seen forSweep 34, though the input power has decreased. Similar temperature increases and decreaseswere found in comparison with the H-period temperatures in “week”-cycles with the sameelectrolyte level heights. From these, we were convinced of excess heats in H-periods. Since thecell is cooled strongly by the external water flow of 20°C, the cell temperature for the L-period(1.5 W input power) should be very close to 20°C unless there is a large heat excess. In contrast,we have observed significant temperature increases even for L-periods as shown, for example, inSweep 34 and Sweep 42 of fig. 4. We decided to make a calibration for calorimetry, though thepresent temperature monitoring system was “primitive”.
In the present cell (see fig. 1), circulation of the convection current of the electrolyte, which isgoing up from the electrode unit due to the bubbling flow by electrolysis and going down in thecooling coil zone, works much for the thermal equilibrium to make a “steady” temperaturegradient between the heat source (electrode unit) and the heat sink (cooling coil). Therefore, theusual method of calibration with a resistor heater setting up at the electrode unit position cannotbe applied. Instead, we employed the calibration by Joule heating of the electrolysis itself. By theinitial test operation, we observed a temperature increase (ΔT) of 7°C by 100 W Joule heating ofelectrolysis, which can be a measure of calorimetry calibration assuming there was no excessheat. At Sweep 1, the temperature increase from L to H current switching was almost the same(7°C) for 106 W (subtracting 7 W for D2O dissociation). In our previous experiment (Exp. 102),in which we used a side-by-side electrode setup in the same position of the cell, we had 8 datapoints that showed a linearly increasing relation for ΔT versus the power curve up to 230 W, andthat gave almost 7°C increase for 100 W. With the support of this experiment, we regarded thatΔT versus the input-power curve for Exp. 115 was linear up to about 250 W, and used 100 W per7°C for calibration.
5
(a)
(b)
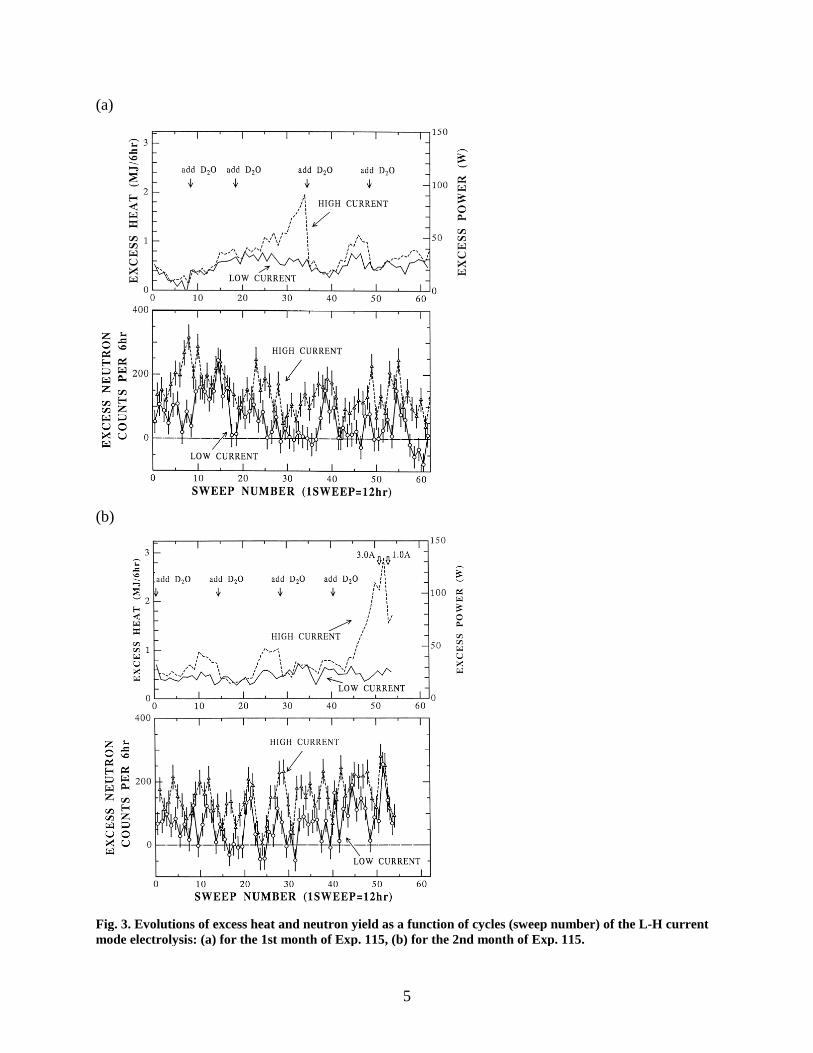
Fig. 3. Evolutions of excess heat and neutron yield as a function of cycles (sweep number) of the L-H currentmode electrolysis: (a) for the 1st month of Exp. 115, (b) for the 2nd month of Exp. 115.

6
Fig. 4. Typical data of cell temperature, voltage, and current in Exp. 115.
To calibrate the “zero power” line (equivalent to the 20°C line) rigorously for the two monthslong run of experiments, we had to make corrections for compensating the effect of roomtemperature variations on the cell temperature measurements due to the very slowly varying driftof the used thermocouple output. The correlation of this drift and room temperature change wasobserved for about two weeks to obtain correction factors to zero power levels on all days of thetwo months for Exp. 115. Because of this drift effect on the zero-power level, we decided todeduce only integrated heat or averaged power within the L- or H-mode. Corrections by thiseffect varied from -20 W to +5 W around the ideal constant zero-power line and drew cycle(day) dependent zero-power curve. The step difference of temperatures by switching from the L-to H-mode is independent of this drift effect, because of only 15 min thermal equilibrium time.
Monitoring the excess neutron emission and its energy spectrum was done with an NE213liquid scintillator system, which is a well established technique [7]. The NE213 detector was setup as close to the electrode unit as possible, at 3 cm from the cell surface. Except for the detectorhead and the high voltage supply, the electronics modules were located in a separate air-conditioned room for monitoring the total neutron counts every 4 min, the recoil-proton energyspectra for L and H periods, and the n-γ pulse shape distribution. For crosschecking variations inthe total neutron counts, the count integral within the 3He(n, p) sum peak of a 3He detector,which was located at about 20 cm distance from the cell surface, was monitored every 6 h, andshowed reasonable correlation with neutron counts by the NE213 system [7]. There was nocorrelation found between the excess neutron counts and the room temperature change for 60days of Exp. 115. Backgrounds were measured by removing the Pd cathode.

7
Evolutions of the excess power (heat) and excess neutron counts thus obtained in Exp. 115 areshown in figs. 3a and 3b, which show the relation between the excess heat and neutron emission.An overall trend shows that the excess neutron yield decreases as the excess power levelincreases, as we see relatively clear in the earlier one month run ignoring fluctuations bystatistics. However, excess neutron counts in H-periods are slightly larger than those in L-periodswhere the excess powers are small. If the observed excess heat was attributed to the usual d-dfusions, we should have observed “detector-killingly intense” neutrons, i.e., 1013 ≈ 1014 n/s/source. In contradiction, the observed neutron yields were in the order of 1 ≈ 2 n/s/source (taking1% detector absolute-efficiency into account), surprisingly small. The neutron energy spectrumintegrated over two months was expected to give the two (2.45 MeV and 3-7 MeV) components,as in the cases of experiments B and C. However, counting the statistics of Exp. 115 was notenough to deduce the clear neutron spectra. Additionally, no detectable increase in the tritiumlevel in the electrolyte was observed in the two months of Exp. 115 in contrast to experiment C[10] which showed a weak trend (≈1 W/cc) of excess heat and a significant tritium generation.
Mysterious depressions of the excess heat curve were mostly found when we added fresh D2O,and lasted 1-2 days. This may suggest the phenomenon occurring near the surface of the Pdcathode. A similar effect is suggested in the tritium generation [14]. Another mysterious butamazing happening was the “surface film boiling” of the electrolyte at the near end of twomonths run (see fig. 3b). From the 55th day, the excess heat level started to increase (run away)in H-periods and on the 56th day “film boiling” on the Pd plate was noticed by a sudden andfrequent fluctuation in the voltage curve (a large (≈350 cc) decrease e of electrolyte in 6 dayswas found later on the 59th day). We decreased the H-current from 4.2 A to 3 A, but the excessheat continued to increase for a day and the electrolyte still boiled. We had to decide to decreasethe H-current drastically to 1 A, and we could stop the boiling. However, an excess power ofabout 90 W was recorded by 15 W (1 A × 15 V) input. By adding fresh D2O after this event, theexcess power level decreased to about 10 W.
The total energy balance for the one week and two months run was as follows: total inputenergy = 250 MJ, total output energy = 410 MJ, and net excess heat = 160 MJ. After one week ofthe sawtooth run, we gave up trying to do calorimetry 1 As the average power of the two monthsfor the L-H operation we obtained: average input power = 50 W, average output power = 85 W,and average excess power = 35 W. The average gain (output/input) = 1.7. We should, therefore,have a “hidden” excess heat source in the cell.
Dissociated D2 and O2 might have recombined in the cell to release heat. In the calibration ofheat, we have already subtracted this energy (1.5 V × current). However, we estimate it again.By electrolysis (average current = 2.23 A), 8.4 × 1024 D2O molecules are dissociated every week,and 2 MJ can be, at maximum, be produced by the “complete recombination”. The observedexcess heat is about 25 MJ per week, and cannot be explained by recombination. Truly,recombination never happened since adding 250 ml of fresh D2O corresponds to 8.4 × 1024 D2Omolecules dissociated, which should have been consumed to go out of the cell. Other possibleheat sources by chemical reactions can be estimated to be too small to explain the observedexcess heat. For example, any exothermic chemical reaction by deuterons in the Pd lattice (1 mlassumed volume) can produce a heat level of the order of 15 kJ. The order of excess heatobserved is about 1000 times greater than the chemical heat sources.
1 Note added in 2009: it was difficult to calibrate the calorimetry for this dynamic operation.
8
Since we have observed in Exp. 115 that there is a relation between excess heat and neutronyield, unknown nuclear reactions as the “hidden” excess heat source would have happened.
We have no in-situ data of the D/Pd ratio in Exp. 115 that may be a key factor. However, wemay speculate that D/Pd = 1.0 to 1.5 was attained in Exp. 115 by referring to Mizuno’s work[13].
3. Multibody fusionTo explain the series of experiments (A, B, C, and D), a hypothetical model is extended in the
following based on the idea in ref. [7].
When all octahedral sites in Pd fcc lattice are filled with deuterons, the D/Pd atomic ratiobecomes 1.0, which may correspond to the reported value of 0.85 as the minimum volumeaveraged D/Pd ratio to produce an anomalous amount of tritium [12]. The reported minimumvalue 0.9 of the volume averaged D/Pd ratio needed to meet the excess heat generation [11] isconsidered to be over this condition and some of the tetrahedral sites may be locally filled withdeuterons. We consider the excitation screening model [7] for D/Pd > 1.0. When all the o- and t-sites are filled with deuterons, D/Pd becomes 3.0 which will be the limit. Cluster formation ispossible up to 5D, because of the three-dimensional periodic condition around a fusion domain(see fig. 5; one o-site at the center is missing in fig. 4 of ref. [7]) with four o-sites and one t-sitewhich together form a tetrahedron with a centered t-site. There are experimental evidences of t-site occupation for high D/Pd ratios, i.e., greater than 1.0. It is considered that trapped deuteronsat t-sites attribute to the very slowly diffusing out component, while o-site deuterons rapidlydiffuse out. The D/Pd > 1.0 condition is considered as unstable in the transient mode due todynamical (probably coherent) motions of deuterons and electrons. In this dynamical condition,the potential well of t-site may be deeper than that of o-site, so that by the vibrational excitationthree deuterons may “fall” into the t-site well where another deuteron trapped more rigidly iswaiting to make a 4D cluster and 4D fusion, in competition with 2D and 3D fusions. Thecompeting process is imagined in the atomic level, looking at the tetrahedron of 4 o-sites and 1 t-site; D-D pair formation is possible in the transient when one o-site D “falls” into the centered t-site (we have 4 combinations for a tetrahedron). 3D cluster formation is possible when two Dsfall into the t-site (6 combinations), 4D cluster (4 combinations) and at last 5D cluster (1combination). We neglect the 5D process in the following because of its low combination.
It is assumed in this hypothetical model that a strong electron screening effect is inducedtransiently when deuterons “fall” into the t-site since attracted “many” electrons can movetoward the t-site. This “coherent” screening effect is not solved yet but is estimated with anarbitrary scaling factor q to define the effective deuteron charge [7]. This scenario isapproximately simulated in the following. The reactions are:
(i) 2D → n + 3He +3.27 MeV,p + t + 4.03 MeV: S2D = 1.1 × 10² keV b
(ii) 3D → d + α + 23.8 MeV,t + 3He + 9.5 MeV: S3D ≈ 108 keV b
(iii) 4D → α + α + 47.6 MeV: S4D ≈ 1011 keV b
Fusion rates are given by:
λND = FNDSND(Vd/Ed) exp(-GN) ,

9
N = 2, 3, 4, (1)
where FND is the cluster or pair formation probability, SND the astrophysical S-value for two-bodyor multibody fusion, Ed the deuteron energy, Vd the deuteron velocity, and exp(-GN) the barrierpenetration probability with the Gamow integral GN [7]. Pair and cluster formation probabilitiesare given by using wave function integrals around a t-site [7]:
sitettttttD PF 20
20
2202 11 , (2)
sitettttttD PF 20
220
203 1 , (3)
sitettttttD PF 220
20
204 , (4)
where Pt-site is the deuteron filling probability for a t-site.
Fig. 5. Face-centered cubic PdD lattice (the deuteron wave function at a highly excited state has eight wingsspreading toward the eight nearest tetrahedral sites of the four surrounding fcc cubes, hence four deuteronsat most meet at a tetrahedral site as indicated by the arrows).
We do not have data for S3D and S4D values. However, we can make rough estimations byextrapolating S-values of p-d, d-d, and d-t reactions as a function of the pion exchange force(PEF). Within the nuclear well potential, neutron and proton exchange pions (π+, π-, π0) and

10
strong p-n coupling holds. However, p-p and n-n are decoupling as we know that 2He anddineutron never exist. We set the relative PEF for p-n to be 1.0, and zero for p-p and n-ninteractions. Then, we obtain PEF of 1, 2, 3, 6, and 12, respectively, for p-d, d-d, d-t, d-d-d, andd-d-d-d simultaneous interactions. We can draw fig. 6 for estimating S-values of multibodyfusions by hydrogen isotopes. The validity of this bold extrapolation has to be further studiedsince p-t and t-t reactions provide much smaller S-values [15] (2.6 × 10⁻³ and 1.6 × 10² keV b),because of Pauli’s exclusion principle to fermion-fermion interactions. Deuteron fusions (d-d, d-t, d-d-d, 4d, d-p-d, d-p-d-d) as boson interactions may have breakup channels to charged particleswith big S-values, which systematics on PEF is independent of that for the fermion-fermionfusions. Estimated S3D and S4D values are three and six orders of magnitude greater than thepreviously used ones [7]. The hatched area in fig. 6 shows ambiguity of the extrapolation. Thesevery large S-values are essential to meet the observable excess heat level [7]. We may call thisthe “multibody fusion resonance at room temperature”.
Details of numerical estimations of formation probabilities and excitation screening byelectrons are given in ref. [7]. A much milder screening condition (q = 1.6) is given in thepresent calculation.
Fig. 6. Extrapolated S-values for multibody fusions of deuteron and deuteron-proton systems.
Results for PdD1.25 (Pt-site = ⅛) are shown in fig. 7. If Pt_site=0.5 (D/Pd = 2.0) the contributionof 3D fusion becomes much higher. For 4D fusion, 1011 f/s/cc corresponds to 1 W/cc. We pickup three typical conditions (a), (b), and (c) as indicated in fig. 7:
Condition (a): Heat level is 1 kW/cc. Neutron yield is about 10 n/s/cc with 3-7 MeV energy(byproduct of 3D fusion [7-10]). The neutron yield per fusion reaction, i.e., the n/f ratio is 10-13 .The n/t ratio is 10-8 to 10-5 depending on the assumed branching ratio of t + 3He and d + 4Hechannels of 3D fusion. This condition can correspond to the results of experiments D,

11
considering that the difference in power level is due to excitation efficiency by pulse electrolysis.When the power level increases, the neutron yield decreases; this explains the overall relationbetween the neutron yield and heat in fig. 3. The reason why the H-current mode gave a largerexcess neutron yield than the L-current in experiment D is not explained with this model. Wehave to further study the electrochemical triggering mechanism of cold fusion. However, thepresent model can explain the overall trend of Exp. 115, as for excess heat and neutron yield. Ifthe 4D fusion was really the major source of excess heat, we should have a significant amount of4He production (≈1014 4He atoms/s), which should be further investigated by mass spectroscopyof the used Pd plate.
Fig. 7. Competing cold fusion rates for 2D, 3D, and 4D reactions as a function of phonon excitation energy forD-in-lattice, calculated by hypothetical excitation screening model for PdDx (x = 1.25).
Condition (b): Heat level is 1 W/cc. Neutron yield is about 100 n/s/cc with two energycomponents (2.45 MeV and 3-7 MeV), additionally assuming that the D(α, n) cross section isless than 1 μb (previously it was assumed 1 mb [10]). The n/f ratio is 10-9. The n/t ratio is 10-5 to10-6. This condition can explain the results of experiment C.
Condition (c): Heat level is less than 1 mW/cc and not detectable. The neutron yield is in theorder of 1 to 103 n/s/cc with 2.45 MeV energy. The n/f ratio is 0.5 to 10-3. The n/t ratio is 1.0 to10-2. Transition between condition (b) and condition (c) explains the results of experiment B.
Chaotic results for heat, tritium, charged particles, and neutrons from other authors can beexplained in the same way. Detection of a large amount of 4He comparable to fusion nuclear

12
heating [16] can also be explained by the present model. Thus, it seems that we have obtainedmany clear evidences to believe in multibody deuteron fusions in a PdDx lattice with selectiveexcitations for deuterons. The above conclusion leads us to the following crazy speculation ofmultibody fusions for H-D systems. Considerable fusion reactions are:
(iv) H + D → 3He + γ + 5.5 MeV:Spd ≈ 10-4 keV b
(v) H + D + H → 3He + p + 5.5 MeV:Spdp ≈ 102keVb
(vi) D + H + D → α + p + 23.8MeV:Sdpd ≈ 4 × 10⁵ keV b
(vii) H + D + H + D → 3He + 3He + 11 MeV:Spdpd ≈ 108keVb
(viii) H + D + D + D → α + 3He + 29.3 MeV:Spddd ≈ 109 keV b
Reactions (v) and (vii) will have to be eliminated due to Pauli’s exclusion to fermion-fermioninteractions. Fusion rates can be estimated for PdDrHy in the same way for D-systems. Wespeculate that cold fusion with 1-100 W/cc power level without neutron and triton productionsmay occur in an electrolysis cell with a mixture of light- and heavy-water. Cold fusion may alsooccur in a cell with ordinary water after a very long run, since 1/6700 of hydrogen atoms aredeuterium and D in metal-lattice might be enriched by repeating absorption and desorption. TheBarrier penetration probability is much enhanced for a proton, compared with a deuteron, so thatthe “trigger” point of cold fusion can be much milder for the H-D mixed system. However,considering the Spddd value of about 2-3 orders of magnitude smaller than S4d, the maximumpower level will be 1 kW/cc for H-D multibody fusion, while 4D fusion may reach the 1 MW/cclevel which is well beyond the explosion condition. The electrolysis experiment with mixedH2O/D2O electrolyte is really expected, since the cold fusion with H-D systems would give usthe ultimately rich and clean nuclear energy source. Some recent reports about heat generationsfrom ordinary water wells might be due to these phenomena. In experiment D, we employed anopen cell for a long (two months) run. There is a reason that several percent of light-water mighthave been contained in the electrolyte during the run of Exp. 115. Therefore, another plausibleexcess heat source in experiment D might be the p-d-d and p-d-d-d fusions which produce noneutrons and no tritium but 4He and 3He.
4. Concluding remarksCold fusion is very likely the multibody fusion of hydrogen isotopes in metal lattice. The
present reported experiments have confirmed that clean power generation, already useful in leveland gain, with extremely low generations of neutron and tritium would really have happened.
The deuteron loading method into Pd was regarded as the key to meet the excess heat andother nuclear products. The L-H current operation of electrolysis and homogeneous loading fromboth sides of the Pd plate showed remarkable effect. Improvement of this method is expected tocontrol the power level and time-variation of cold fusion. However, further confirmationexperiments are of course needed to establish reproducibility (See 2009 note added at the end ofpaper).
Many things are yet left to be solved by further experimental studies, e.g., in-situdetermination of the D/Pd ratio, in-situ and off-line helium analysis, charged-particle

13
spectroscopy for direct confirmation of multibody fusion, condition of metal fabrication, effectof impurity, other metals and alloys than Pd, triggering mechanisms by electrochemical effect oncathode surface and by other methods, and so forth.
The hypothetical model of multibody fusion may give us a great hint to solve the puzzle ofcold fusion. However, the validities of key assumptions, namely, (1) D-cluster formation, (2)strong screening by coherent dynamics of electrons under excitation of D-in-lattice and (3)resonant S-values of multibody fusions, have to be further studied.
References1. M. Fleischmann and S. Pons, Electrically induced nuclear fusion of deuterium, J. Electroanal.
Chem. 261 (1989) 301.2. S. Jones et al., Observation of cold nuclear fusion in condensed matter, Nature 338 (1989)
737.3. E. Storms, Review of experimental observations about the cold fusion effect, Fusion
Technology 20 (1991) 433.4. Provo, Proc. Anomalous Nuclear Effects in Metal/Deuterium Systems, AIP Conf. 228, 1990.5. The Science of Cold Fusion, Proc. ICCF2, Como (Italian Physical Society, Italy, 1992).6. A. Takahashi, Nuclear products by D2O/Pd electrolysis and multibody fusion, in: Proc. Int.
Symp. Nonlinear Phenomena in Electromagnetic Fields (Nagoya, Japan, 1992).7. A. Takahashi et al., Fusion Technology 19 (1991) 380.8. A. Takahashi et al., J. Nucl. Sci. Technol. 27 (1990) 663.9. A. Takahashi et al., Provo, Proc. Anomalous Nuclear Effects in Metal/Deuterium Systems,
AIP Conf. 228, 1990, 323.10. A. Takahashi et al., The Science of Cold Fusion, Proc. ICCF2, Como (Italian Physical
Society, Italy, 1992), 1991, 93.11. M.C.H. McKubre et al., The Science of Cold Fusion, Proc. ICCF2, Como (Italian Physical
Society, Italy, 1992), 1991, 419.12. F.G. Will et al., The Science of Cold Fusion, Proc. ICCF2, Como (Italian Physical Society,
Italy, 1992), 1991, 373.13. T. Mizuno et al., Diffusion rate of deuterium in Pd during cathodic charging, Japan J.
Electrochemistry, 1992.14. J.O’M. Bockris, Private Communication, 1992.15. J. Collis, Private Communication, April 1992.16. B.F. Bush et al., J. Electroanal. Chem. 304 (1991) 271.
Note added by A. Takahashi, July 2009The results reported in this paper were not reproduced well in later runs tried in 1993-1996,except for one reported at ICCF3 (experiment D2, p. 85). However, I remain convinced that theexcess heat we observed in 1992 was real, and not an instrument artifact. The power level wastoo high to be an artifact, and the film boiling was visually observed.
In retrospect, it seems likely that the effect could not be reproduced because nano-structures didnot form on near surface of Pd cathode. The importance of nano-structures and surfaceconditions were not clear at that time.