excerpt from the world energy outlook 2012 · excerpt from the world energy outlook 2012 ... fresh,...
TRANSCRIPT

Water for Energy Is energy becoming a thirstier resource?
Excerpt from the World Energy Outlook 2012

© O
ECD
/IEA
, 201
2
Chapter 17 | Water for energy 501
Chapter 17
Water for energyIs energy becoming a thirstier resource?
Highl ights
• Energy depends on water – for power generation, the extraction, transport and processing of fossil fuels, and the irrigation of biofuels feedstock crops – and is vulnerable to physical constraints on its availability and regulations that might limit access to it. A more water-constrained future, as population and the global economy grow and climate change looms, will impact energy sector reliability and costs.
• Global water withdrawals for energy production in 2010 were estimated at 583 billion cubic metres (bcm), or some 15% of the world’s total water withdrawals. Of that, water consumption – the volume withdrawn but not returned to its source – was 66 bcm. In the New Policies Scenario, withdrawals increase by about 20% between 2010 and 2035, but consumption rises by a more dramatic 85%. These trends are driven by a shift towards higher efficiency power plants with more advanced cooling systems (that reduce withdrawals but increase consumption per unit of electricity produced) and by expanding biofuels production.
• The water requirements for fossil fuel-based and nuclear power plants – the largest users of water in the energy sector – can be reduced significantly with advanced cooling systems, although this entails higher capital costs and reduces plant efficiency. Future water needs for biofuels depend largely on whether feedstock crops come from irrigated or rain-fed lands and the extent to which advanced biofuels – whose feedstock crops tend to be less water-intensive – penetrate markets. Water requirements for fossil fuel production are comparably lower, though potential impacts on water quality are an important concern.
• Energy efficiency, wind and solar PV contribute to a low-carbon energy future without intensifying water demands significantly. Compared with 2010, withdrawals in the 450 Scenario rise by only 4% in 2035, though consumption doubles due to much higher biofuels production. Several low-carbon energy technologies – nuclear power, power plants fitted with carbon capture and storage equipment and certain types of concentrating solar power – can be highly water-intensive.
• Water is growing in importance as a criterion for assessing the physical, economic and environmental viability of energy projects. Among other examples, the availability of and access to water could become an increasingly serious issue for unconventional gas development and power generation in parts of China and the United States, India’s large fleet of water-dependent power plants, Canadian oil sands production and maintaining reservoir pressures to support oil output in Iraq. Such vulnerabilities are manageable, in most cases, but will require deployment of better technology and greater integration of energy and water policies.
499-528_Part d - Chapitre 17weo_27-28.indd 501 18/10/2012 12:11:58
1

© O
ECD
/IEA
, 201
2
502 World Energy Outlook 2012 | Special Topics
IntroductionEnergy and water are valuable resources that underpin human prosperity and are, to a large extent, interdependent. Water is ubiquitous in energy production: in power generation; in the extraction, transport and processing of fossil fuels; and, increasingly, in irrigation to grow feedstock crops used to produce biofuels. Similarly, energy is vital to the provision of water, needed to power systems that collect, transport, distribute and treat it (Box 17.1). Each faces rising demands and constraints in many regions as a consequence of economic and population growth and climate change, which amplify the mutual vulnerability of energy and water. For the energy sector, constraints on water can challenge the reliability of existing operations and the viability of proposed projects, imposing additional costs for necessary adaptive measures.
This chapter addresses water for energy in the context of the WEO-2012 energy scenarios. It provides information on future water requirements for energy production and identifies the particular water resource risks associated with our energy scenarios. The chapter begins with an overview of global water trends and energy sector vulnerabilities to water constraints. It discusses water use in the production of primary energy and electricity. Water use factors are applied to our energy projections to estimate water requirements by scenario, energy source and region. These results are then analysed with respect to water resources in key regions to identify several important stress points that might arise relating to the energy supply figures in our scenarios.
Facing a more water-constrained future
Water is a plentiful resource, but it is not always available for human use in the quantities or at the quality, time and place required. Only about 2.5% of the world’s water is freshwater.1 Of that, less than 1% is accessible via surface sources and aquifers – the rest is locked up in glaciers and ice caps, or is deep underground (Figure 17.1).
Figure 17.1 ⊳ World water resources and human freshwater use
Ice caps and glaciers(70%)
Surface water (0.3%)
Freshwater resources
Freshwater (2.5%)
Total water resources
Saline water (97.5%)
Human freshwater use
Agriculture (70%)
Industrial (19%)
Municipal(11%)
Groundwater(30%)
Sources: Shiklomanov (1993); UN FAO Aquastat database.
1. Unless otherwise noted, the term “water” in this chapter refers to accessible renewable freshwater.
499-528_Part d - Chapitre 17weo_27-28.indd 502 23/10/2012 11:14:15
2

© O
ECD
/IEA
, 201
2
Chapter 17 | Water for energy 503
2
8
5
11
16
1
7
3
9
14
6
12
17
4
10
15
13
18
Freshwater is generally renewable,2 replenished naturally by the water cycle. Its availability, however, is uneven, due to wide differences in climatic patterns, geography and human use. Water resources are abundant in most parts of Brazil, for example, which sees relatively high rainfall. By contrast, many countries in the Middle East and North Africa face chronic water scarcity, receiving minimal rainfall and low water flow from outside their borders. They must therefore turn to other sources of water supply, such as non-renewable aquifers or desalination. The quantity and quality of water resources varies temporally – during summer months, for instance, surface water levels are lowest and temperatures highest. Furthermore, water resources can be adversely (and unexpectedly) affected by extreme events, such as droughts, heat waves and floods.
The extent to which water resources come under strain in a given country or region depends on how human use relates to supply. Globally, agriculture is the principal user of water, accounting for 70% of water use, followed by industry (including mining and power generation) at 19% and municipal networks, which serve the water needs of public and private users, at 11% (UN FAO, 2012). For the purpose of indicating present physical water scarcity, this chapter uses renewable water resources per capita, thus taking into account supply and a proxy for demand (population).3 Significant tracts of almost every continent face water scarcity, stress or some degree of vulnerability (Figure 17.2). Even countries with seemingly ample water availability at a national level may face scarcity in particular regions, such as the southwest United States and non-coastal Australia. Water resources can vary significantly from one water basin to the next and can be located far from areas where demand is greatest.
Climate change coupled with population and economic growth portends a more water-constrained future in many regions. The water and climate cycles are inextricably linked: rising temperatures will accelerate the movement of water, increasing both evaporation and precipitation. Expected impacts include falling average surface water flows (glacier melt being an exception); higher surface water temperatures; a reduction of snowpack and change in the timing of the snowmelt season; sea level rise, which will contaminate freshwater supplies; and droughts, heat waves and floods that are more frequent and more severe (IPCC, 2008). Future water demand is expected to grow with rising populations, urbanisation, higher standards of living and higher food demand, particularly in non-OECD countries as direct water use increases with readier access and there is a dietary shift from plants to (more water-intensive) meat (WWAP, 2012).
2. A country’s renewable water resources include exploitable internal resources, i.e. surface water and groundwater generated from endogenous precipitation, and external resources, i.e. water that enters a country from upstream countries via rivers or aquifers. Both are naturally renewed, but a few sources are non-renewable, e.g. some underground aquifers.3. An index based on renewable water resources per capita (Falkenmark, et al., 1989) is one of the most commonly used measures of water scarcity, cited by UNDP (2006) and UN FAO (2010). Some methodologies also evaluate economic water scarcity, which takes account of limitations by human, institutional and financial capital on water availability (IWMI, 2007).
499-528_Part d - Chapitre 17weo_27-28.indd 503 18/10/2012 12:11:59
3

© O
ECD
/IEA
, 201
2
504 World Energy Outlook 2012 | Special Topics
Figure 17.2 ⊳ Renewable water resources per capita in 2010
500 1 0000
ScarcityAbsolutescarcity
1 700 2 500
Stress Vulnerability
6 000 15 000 70 000
in cubic metres per capita
This map is without prejudice to the status of or sovereignty over any territory, to the delimitation of international frontiers and boundaries and to the name of any territory, city or area.
Source: UN FAO Aquastat database.
Box 17.1 ⊳ Energy for water
The other half of the energy-water nexus concerns the energy requirements for supplying and treating water. Electricity is needed to power pumps that abstract (from ground and surface sources), transport, distribute and collect water. The amount needed depends on the distance to (or depth of) the water source. Water treatment processes, which convert water of various types – fresh, brackish, saline and waste – into water fit for a specific use, require electricity and, sometimes, heat. Desalination, a process that removes salt from water, is the most energy-intensive and expensive option for treating water and is used where alternatives are very limited, such as in the Middle East and Australia. Other energy needs associated with water occur at the point of end-use, often in households, primarily for water heating and clothes washing.
Looking ahead, several trends point to rising demands on energy from the water sector:
• Increasing water demand, as a result of population growth and improved standards of living.
• Scarcer freshwater supplies in the proximity of population centres, due to climate change. This means that water will have to be transported longer distances, pumped from greater depths or undergo additional treatment.
• More stringent standards for water treatment.
• A general shift in irrigation practices from surface or flood (relying on gravity) to pumped methods, which are more water-efficient but require energy for operation.
499-528_Part d - Chapitre 17weo_27-28.indd 504 23/10/2012 10:41:55
4

© O
ECD
/IEA
, 201
2
Chapter 17 | Water for energy 505
2
8
5
11
16
1
7
3
9
14
6
12
17
4
10
15
13
18
Water for energy linkagesWater is required to produce nearly all forms of energy. For primary fuels, water is used in resource extraction, irrigation of biofuels feedstock crops, fuel refining and processing, and transport. In power generation, water provides cooling and other process-related needs at thermal power plants; hydropower facilities harness its movement for electricity production. These uses can, in some cases, entail significant volumes of water. Additionally, they can have adverse effects on water quality via contamination by fluids that contain pollutants or physical alteration of the natural environment (Table 17.1).
Table 17.1 ⊳ Key uses of water for energy and potential water quality impacts
Uses Potential water quality impacts
Primary energy productionOil and gas Drilling, well completion and hydraulic
fracturing.
Injection into the reservoir in secondary and enhanced oil recovery.
Oil sands mining and in-situ recovery.
Upgrading and refining into products.
Contamination by tailings seepage, fracturing fluids, flowback or produced water (surface and groundwater).
Coal Cutting and dust suppression in mining and hauling.
Washing to improve coal quality.
Re-vegetation of surface mines.
Long-distance transport via coal slurry.
Contamination by tailings seepage, mine drainage or produced water (surface and groundwater).
Biofuels Irrigation for feedstock crop growth.
Wet milling, washing and cooling in the fuel conversion process.
Contamination by runoff containing fertilisers, pesticides and sediments (surface and groundwater).
Wastewater produced by refining.
Power generationThermal (fossil fuel, nuclear and bioenergy)
Boiler feed, i.e. the water used to generate steam or hot water.
Cooling for steam-condensing.
Pollutant scrubbing using emissions-control equipment.
Thermal pollution by cooling water discharge (surface water).
Impact on aquatic ecosystems.
Air emissions that pollute water downwind (surface water).
Discharge of boiler blowdown, i.e. boiler feed that contains suspended solids.
Concentrating solar power and geothermal
System fluids or boiler feed, i.e. the water used to generate steam or hot water.
Cooling for steam-condensing.
Thermal pollution by cooling water discharge (surface water).
Impact on aquatic ecosystems.
Hydropower Electricity generation.
Storage in a reservoir (for operating hydro-electric dams or energy storage).
Alteration of water temperatures, flow volume/timing and aquatic ecosystems.
Evaporative losses from the reservoir.
Water use per unit of energy produced is commonly discussed using two distinct measures: withdrawal and consumption. Withdrawal is the volume of water removed from a source; consumption is the volume of water withdrawn that is not returned to the source, i.e. it is
499-528_Part d - Chapitre 17weo_27-28.indd 505 18/10/2012 12:11:59
5

© O
ECD
/IEA
, 201
2
506 World Energy Outlook 2012 | Special Topics
evaporated or transported to another location. Discharge is the volume of water withdrawn that is returned to the source, often degraded by use (altered physically or chemically) and impacting water quality. Water withdrawals are, by definition, always greater than or equal to consumption and are, therefore, the first limit approached at an energy production facility when water availability is constrained. Consumptive use reduces the amount of water available to satisfy demands downstream and is an important consideration where water resources are strained to meet the needs of all users.
Primary energy production
Water needs for fossil fuels production – including the extraction, processing and transport phases of the fuel cycle – vary widely. Conventional natural gas entails minimal water use for drilling and processing and is generally much less water-intensive than producing other fossil fuels or biofuels (Figure 17.3). Shale gas developments use additional water for hydraulic fracturing, a well-stimulation technique that pumps fluids (water and sand, with chemical additives that aid the process) into shale formations at high pressure to crack the rock and release gas. Water requirements for shale gas depend on gas recovery rates, the number of hydraulic fracturing treatments performed and the use of water-recycling technologies. These factors vary from well to well, but can imply water needs many times greater than those for conventional gas. Additionally, public concern exists over potential water contamination risks associated with shale gas development, specifically the leakage of fracturing fluids, hydrocarbons or saline water into groundwater supplies and the handling and disposal of waste water. These hazards, which are also faced in conventional oil and gas development, can be responsibly addressed at a small additional cost using existing technologies and best practices (IEA, 2012).
Coal production uses water mainly for mining activities such as coal cutting and dust suppression. The amount of water needed depends on the characteristics of the mine, i.e. whether it is at the surface or underground, and processing and transport requirements. Washing coal increases its quality, but involves additional water. Washing is presently undertaken mostly only for export-quality grades of coal, but there is large scope for the practice to become more widespread given its potential to raise power plant efficiency, such as in India. Key water quality concerns for coal production are runoff from mine operations and tailings that can pollute surface and groundwater.
The amount of water needed for oil extraction is determined by the recovery technology applied, the geology of the oil field and its production history. Water requirements for conventional oil extraction are relatively minor, similar to those of conventional gas. Secondary recovery techniques that use water flooding to support reservoir pressure can have water needs about ten times those associated with primary recovery, which relies on natural support mechanisms. Producing synthetic crude oil from oil sands is comparatively more water-intensive, though in-situ recovery uses on average less than one-quarter of the amount used in surface mining (see Canada section). Refining crude oil into end-use products requires further water for cooling and chemical processes, the amount varying widely according to technologies employed (the cooling system, for example) and process configuration.
499-528_Part d - Chapitre 17weo_27-28.indd 506 18/10/2012 12:11:59
6

© O
ECD
/IEA
, 201
2
Chapter 17 | Water for energy 507
2
8
5
11
16
1
7
3
9
14
6
12
17
4
10
15
13
18
Figure 17.3 ⊳ Water use for primary energy production
101
Sugarcane ethanol
Corn ethanol
Soybean biodiesel
Rapeseed biodiesel
Palm oil biodiesel
Lignocellulosic ethanol****
Refined oil (EOR)***
Coal-to-liquids
Gas-to-liquids
Refined oil (oil sands)**
Refined oil (conven�onal)*
Shale gas
Coal
Conven�onal gas
litres per toe<1
WithdrawalConsump�on
102 103 104 105 106 107
* The minimum is for primary recovery; the maximum is for secondary recovery. ** The minimum is for in-situ production; the maximum is for surface mining. *** Includes CO2 injection, steam injection and alkaline injection and in-situ combustion. **** Excludes water use for crop residues allocated to food production.
Notes: Ranges shown are for “source-to-carrier” primary energy production, which includes withdrawals and consumption for extraction, processing and transport. Water use for biofuels production varies considerably because of differences in irrigation needs among regions and crops; the minimum for each crop represents non-irrigated crops whose only water requirements are for processing into fuels. EOR = enhanced oil recovery. For numeric ranges, see www.worldenergyoutlook.org.
Sources: Schornagel (2012); US DOE (2006); Gleick (1994); IEA analysis.
Biofuels require water for irrigating feedstock crops and for fuel conversion. Irrigation needs can range widely depending on the crop, the region in which it is grown and the water efficiency of irrigation technologies used. Growing feedstock crops that require minimal water or cultivating them in an area that receives ample rainfall can greatly reduce or eliminate water needs for irrigation. Rain-fed crops grown in Brazil and southeast Asia, for example, generally make lower demands on water resources than irrigated crops grown in parts of the United States. Advanced biofuels derived from waste products require little or no water for their growth as a fuel feedstock, as water used by these crops is allocated to the activity of primary value (food production, for example); water use figures would be higher for advanced biofuels if dedicated crops are grown.
499-528_Part d - Chapitre 17weo_27-28.indd 507 18/10/2012 12:11:59
7

© O
ECD
/IEA
, 201
2
508 World Energy Outlook 2012 | Special Topics
Electricity generation
Thermal power plants – fossil fuel-based and nuclear – require water primarily for cooling. Per unit of energy produced, they are the energy sector’s most intensive users of water. Water needs for thermal plants are determined by plant efficiency, access to alternative heat sinks and, in particular, the cooling system employed. Cooling needs that must be met by water can be reduced with higher plant efficiencies, which minimise the amount of waste heat produced per unit of electricity generated, and access to alternative heat sinks, such as the atmosphere (for example, a cooling tower). The choice of cooling system has the greatest impact on water requirements for a given type of thermal power generation. Two broad categories of cooling system are available: once-through and re-circulating, which is further divided into wet, dry and hybrid systems. Each involves trade-offs in terms of water use, impacts on water quality, plant efficiency and cost (Table 17.2):
Once-through (or open-loop) systems withdraw freshwater (or non-freshwater), pass it through a steam condenser and return it at higher temperature to a nearby water body. A small fraction of the withdrawals are consumed through evaporation. The capital costs of once-through systems are lowest, compared with other cooling systems, but they require considerably higher water withdrawals and the large intake and subsequent discharge downstream at higher temperatures can be detrimental to aquatic life and ecosystems. These environmental impacts have led to increasingly stringent permitting requirements for once-through systems, for example in the United States, where existing systems are gradually being phased out.
Wet re-circulating (or wet closed-loop) systems withdraw freshwater, and pass it through a steam condenser but, instead of being discharged downstream, the heated water is cooled in a wet tower or pond. Water not consumed by evaporation is returned to the steam condenser for reuse. Water withdrawals are much lower than in once-through systems, reducing exposure to risks posed by constrained water resources as well as environmental impacts (though periodic discharges are needed to prevent the accumulation of minerals and dissolved solids). Trade-offs relative to once-through systems include higher water consumption (as opposed to withdrawal) and greater land area requirements. Additionally, the cost of installing these systems is around 40% higher than for once-through systems (US DOE/NETL, 2008).
Dry cooling systems use air flow through a cooling tower to condense steam. Their water requirements are minimal, compared with other systems, and they therefore are therefore better suited to dry climates. Their cost is about 3-4 times higher than for wet tower or pond systems, although the impact on the overall cost of the plant depends on its size and type. Because air is a less effective medium than water for cooling, dry cooling can affect power plant performance, reducing average generation by about 2-7% (more on hot days) depending on the type of plant (US EPA, 2009). Because dry cooling is less effective at high temperatures, it is sometimes installed in tandem with wet tower cooling to have a hybrid system that offers flexibility to operate during warm and cool periods.
499-528_Part d - Chapitre 17weo_27-28.indd 508 18/10/2012 12:11:59
8

© O
ECD
/IEA
, 201
2
Chapter 17 | Water for energy 509
2
8
5
11
16
1
7
3
9
14
6
12
17
4
10
15
13
18
Table 17.2 ⊳ Power plant cooling system trade-offs
Cooling system Advantages Disadvantages
Once-through Low water consumption.Mature technology.Lower capital cost.
High water withdrawals.Impact on ecosystem.Exposure to thermal discharge limits.
Wet tower Significantly lower water withdrawal than once-through.Mature technology.
Higher water consumption than once-through.Lower power plant efficiency.Higher capital cost than once-through
Dry Zero or minimal water withdrawal and consumption.
Higher capital cost relative to once-through and wet tower.Lower plant efficiency, particularly when ambient temperatures are high.Large land area requirements.
Hybrid Lower capital cost than dry cooling.Reduced water consumption compared with wet tower.No efficiency penalty on hot days.Operational flexibility.
Higher capital cost than wet tower.Limited technology experience.
Source: Mielke, et al. (2010).
Water withdrawals per unit of electricity generated are highest for fossil-steam (coal-, gas- and oil-fired plants operating on a steam-cycle) and nuclear power plants with once-through cooling, at 75 000 - 450 000 litres per megawatt-hour (l/MWh) (Figure 17.4).4 This is between 20-80 times higher than if wet tower cooling were used, although such systems increase water consumption. Combined-cycle gas turbines (CCGTs) generate less waste heat per unit of electricity produced thanks to higher thermal efficiency, and therefore require less cooling. Their water withdrawal and consumption are the lowest among thermal power plants, at 570 - 1 100 l/MWh using a wet cooling tower. Water use by CCGTs can be cut further when dry cooling is employed, though this comes at increased cost and a reduction in plant efficiency.
Water requirements for renewable electricity generating technologies range from negligible to comparable with thermal generation using wet tower cooling. Non-thermal renewables, such as wind and solar photovoltaic (PV) may use very small amounts of water, such as for cleaning or panel washing. This makes them well-suited for a future that may be both more carbon- and water-constrained. In addition to lower water use at the site of electricity generation, these renewable technologies have little or no water use associated with the production of fuel inputs and minimal impact on water quality compared to alternatives that discharge large volumes of heated cooling water or contaminants into the environment. Geothermal and concentrating solar power (CSP) technologies (Box 17.2) have water needs that range widely, depending on the particular generating technology and cooling system employed.
4. This range varies widely depending on plant efficiency. It accounts for values reported by operating coal-fired power plants in the United States (NETL, 2007), which can be considerably higher than estimates published in literature.
499-528_Part d - Chapitre 17weo_27-28.indd 509 18/10/2012 12:12:00
9

© O
ECD
/IEA
, 201
2
510 World Energy Outlook 2012 | Special Topics
Figure 17.4 ⊳ Water use for electricity generation by cooling technology
Nuclear
Fossil steam
Gas CCGT
Nuclear
Fossil steam
Gas CCGT
Nuclear
Fossil steam (CCS)
Fossil steam
Coal IGCC (CCS)
Coal IGCC
Gas CCGT (CCS)
Gas CCGT
Gas CCGT
Geothermal**
litres per MWh
Wind
Solar PV
CSP*
Oth
er/n
one
Dry
Cool
ing
tow
erCo
olin
gpo
nd
Onc
e-
thro
ugh
101 <1 102 103 104 105 106
WithdrawalConsump�on
* Includes trough, tower and Fresnel technologies using tower, dry and hybrid cooling, and Stirling technology. ** Includes binary, flash and enhanced geothermal system technologies using tower, dry and hybrid cooling.
Notes: Ranges shown are for the operational phase of electricity generation, which includes cleaning, cooling and other process related needs; water used for the production of input fuels is excluded. Fossil steam includes coal-, gas- and oil-fired power plants operating on a steam cycle. Reported data from power plant operations are used for fossil-steam once-through cooling; other ranges are based on estimates summarised in the sources cited below. Solar PV = solar photovoltaic; CSP = concentrating solar power; CCGT = combined-cycle gas turbine; IGCC = integrated gasification combined-cycle; CCS = carbon capture and storage. For numeric ranges, see www.worldenergyoutlook.org.
Sources: Macknick (2011); US DOE/NETL (2007 and 2011); IEA analysis.
The high water requirements associated with other sources of low-carbon electricity mean that water availability must be strongly considered in plant siting. This applies, in particular, to nuclear plants and to fossil fuel-based plants fitted with carbon capture and storage (CCS) equipment. CCS-fitted power plants require additional water for the carbon dioxide (CO2) capture process and to meet the higher cooling needs associated with reduced power plant
499-528_Part d - Chapitre 17weo_27-28.indd 510 18/10/2012 12:12:00
10
© O
ECD
/IEA
, 201
2
Chapter 17 | Water for energy 511
2
8
5
11
16
1
7
3
9
14
6
12
17
4
10
15
13
18
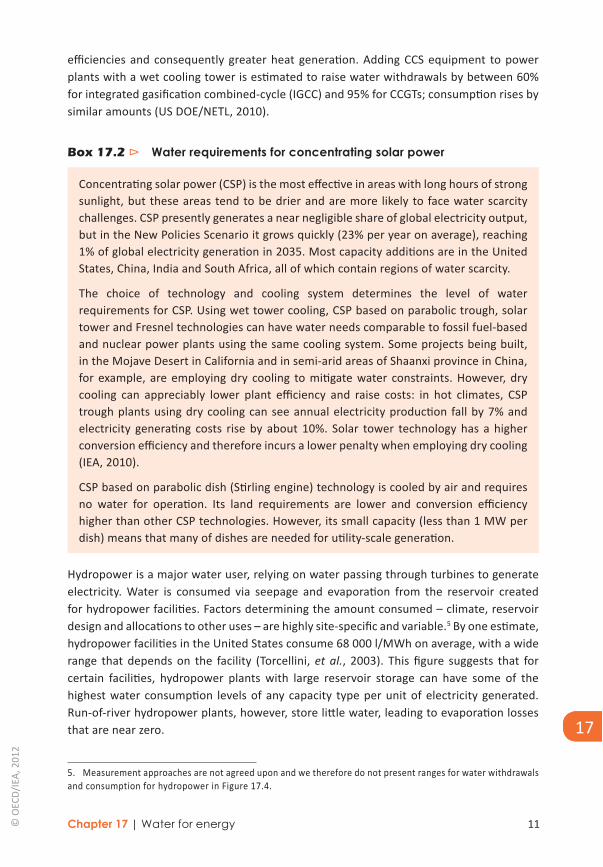
efficiencies and consequently greater heat generation. Adding CCS equipment to power plants with a wet cooling tower is estimated to raise water withdrawals by between 60% for integrated gasification combined-cycle (IGCC) and 95% for CCGTs; consumption rises by similar amounts (US DOE/NETL, 2010).
Box 17.2 ⊳ Water requirements for concentrating solar power
Concentrating solar power (CSP) is the most effective in areas with long hours of strong sunlight, but these areas tend to be drier and are more likely to face water scarcity challenges. CSP presently generates a near negligible share of global electricity output, but in the New Policies Scenario it grows quickly (23% per year on average), reaching 1% of global electricity generation in 2035. Most capacity additions are in the United States, China, India and South Africa, all of which contain regions of water scarcity.
The choice of technology and cooling system determines the level of water requirements for CSP. Using wet tower cooling, CSP based on parabolic trough, solar tower and Fresnel technologies can have water needs comparable to fossil fuel-based and nuclear power plants using the same cooling system. Some projects being built, in the Mojave Desert in California and in semi-arid areas of Shaanxi province in China, for example, are employing dry cooling to mitigate water constraints. However, dry cooling can appreciably lower plant efficiency and raise costs: in hot climates, CSP trough plants using dry cooling can see annual electricity production fall by 7% and electricity generating costs rise by about 10%. Solar tower technology has a higher conversion efficiency and therefore incurs a lower penalty when employing dry cooling (IEA, 2010).
CSP based on parabolic dish (Stirling engine) technology is cooled by air and requires no water for operation. Its land requirements are lower and conversion efficiency higher than other CSP technologies. However, its small capacity (less than 1 MW per dish) means that many of dishes are needed for utility-scale generation.
Hydropower is a major water user, relying on water passing through turbines to generate electricity. Water is consumed via seepage and evaporation from the reservoir created for hydropower facilities. Factors determining the amount consumed – climate, reservoir design and allocations to other uses – are highly site-specific and variable.5 By one estimate, hydropower facilities in the United States consume 68 000 l/MWh on average, with a wide range that depends on the facility (Torcellini, et al., 2003). This figure suggests that for certain facilities, hydropower plants with large reservoir storage can have some of the highest water consumption levels of any capacity type per unit of electricity generated. Run-of-river hydropower plants, however, store little water, leading to evaporation losses that are near zero.
5. Measurement approaches are not agreed upon and we therefore do not present ranges for water withdrawals and consumption for hydropower in Figure 17.4.
499-528_Part d - Chapitre 17weo_27-28.indd 511 18/10/2012 12:12:00
11

© O
ECD
/IEA
, 201
2
512 World Energy Outlook 2012 | Special Topics
The vulnerability of energy to water constraints
Physical constraints on the availability of water for energy sector use span both quantity and quality issues: there may not be enough of it or that which is available may be of insufficient quality. These constraints may be natural or may arise from regulation of water use. Either way, they can pose challenges both to the reliability of existing operations and to proposed projects and, even where surmounted, impose additional costs for necessary adaptive measures. For example:
River flows or reservoir levels can drop near or below water intake structures at thermal (nuclear and fossil fuel-based) power plants and hydropower facilities, curtailing or halting operations. This reduces available generating capacity and can threaten the reliability of the wider electricity system. Utilities may be forced to obtain electricity from other generators at higher cost.
An oil and gas reservoir that requires water flooding to support production yet cannot secure ample water will experience declining field pressure and a fall in output. If water needs go unmet to the point that reservoir damage occurs, ultimate recovery from the reservoir may be lowered (such as in Iraq, see Chapter 14).
Increased temperatures can diminish the effectiveness of water as a medium for cooling in thermal power plants, potentially lowering their thermal efficiency, and thereby lowering electricity output or, forcing the plants to shut down.
Regulations can impose limits on or increase the cost of water use by the energy sector. Depending on water rights, or the system of allocation in a given location, water may become difficult to access, potentially because of its prioritisation for competing uses, such as households or industry.6 Environmental regulations may prohibit certain uses of water, do so under specific circumstances, or impose requirements on use – in containment, handling, treatment, discharge, disposal, etc. – that are more expensive. Shale gas development, for example, may become subject to more stringent regulation at added cost as a result of public concern over the potential of the process to contaminate water resources. Many power plants are required to limit the discharge of water heated in the cooling process when surface water temperatures approach a set threshold, causing the operators to scale-back output or even shut down.
The vulnerability of the energy sector to water constraints is widely spread geographically and across types of energy production (Table 17.3). Regions where water is scarce face obvious risks; but, even regions with ample water resources can face constraints related to droughts, heat waves, seasonal variation, climate change, regulations or some combination of these factors. Countries with a high proportion of their generating capacity in thermal plants with once-through cooling (using freshwater) and hydropower can be particularly exposed to fluctuations in water availability (Figure 17.5).
6. Water rights are typically categorised as: riparian, in which owners of land adjacent to a water source have equal rights of use; prior appropriation, in which water rights are acquired on the basis of beneficial use, rather than land ownership; or a hybrid of the two approaches. More progressive systems are being implemented that account for water’s economic value.
499-528_Part d - Chapitre 17weo_27-28.indd 512 18/10/2012 12:12:00
12

© O
ECD
/IEA
, 201
2
Chapter 17 | Water for energy 513
2
8
5
11
16
1
7
3
9
14
6
12
17
4
10
15
13
18
Table 17.3 ⊳ Examples of water impacts on energy production
Location (Year) Description
Power generation
India (2012) A delayed monsoon raised electricity demand (for pumping groundwater for irrigation) and reduced hydro generation, contributing to blackouts lasting two days and affecting over 600 million people.
China (2011) Drought limited hydro generation along the Yangtze river, contributing to higher coal demand (and prices) and forcing some provinces to implement strict energy efficiency measures and electricity rationing.
Vietnam, Philippines (2010)
The El Niño weather phenomenon caused a drought that lasted several months, reducing hydro generation and causing electricity shortages.
Southeast United States (2007)
During a drought, the Tennessee Valley Authority curtailed hydro generation to conserve water and reduced output from nuclear and fossil fuel-based plants.
Midwest United States (2006)
A heat wave forced nuclear plants to reduce their output because of the high water temperature of the Mississippi River.
France (2003) An extended heat wave forced EdF to curtail nuclear power output equivalent to the loss of 4-5 reactors, costing an estimated €300 million to import electricity.
Primary energy production
China (2008) Dozens of planned coal-to-liquids (CTL) projects were abandoned, due in part to concerns they would place heavy burdens on scare water resources.
Australia, Bulgaria, Canada, France, United States
Public concern about the potential environmental impacts of unconventional gas production (including on water) has prompted additional regulation and, in some jurisdictions, temporary moratoria or bans on hydraulic fracturing.
Figure 17.5 ⊳ Share of power generation capacity with freshwater once-through cooling and hydro in selected countries, 2010
0% 20% 40% 60% 80% 100%
BrazilCanadaFranceRussia
IndiaChina
United StatesJapan
GermanyUnited Kingdom
Middle EastSouth Africa Thermal plants
(once-throughcooling using freshwater) Hydropower
Other
Sources: Platts (2012); IEA analysis.
499-528_Part d - Chapitre 17weo_27-28.indd 513 18/10/2012 12:12:00
13
© O
ECD
/IEA
, 201
2
514 World Energy Outlook 2012 | Special Topics
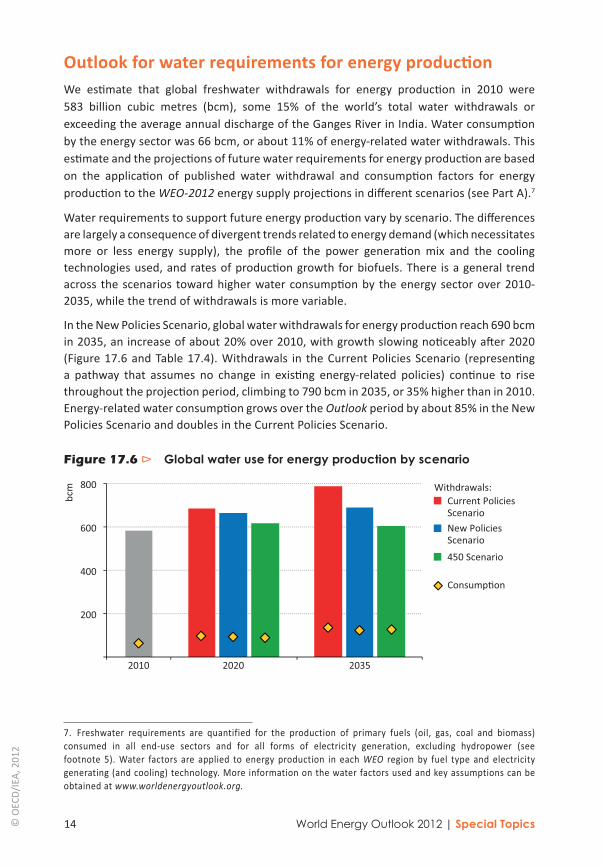
Outlook for water requirements for energy productionWe estimate that global freshwater withdrawals for energy production in 2010 were 583 billion cubic metres (bcm), some 15% of the world’s total water withdrawals or exceeding the average annual discharge of the Ganges River in India. Water consumption by the energy sector was 66 bcm, or about 11% of energy-related water withdrawals. This estimate and the projections of future water requirements for energy production are based on the application of published water withdrawal and consumption factors for energy production to the WEO-2012 energy supply projections in different scenarios (see Part A).7
Water requirements to support future energy production vary by scenario. The differences are largely a consequence of divergent trends related to energy demand (which necessitates more or less energy supply), the profile of the power generation mix and the cooling technologies used, and rates of production growth for biofuels. There is a general trend across the scenarios toward higher water consumption by the energy sector over 2010-2035, while the trend of withdrawals is more variable.
In the New Policies Scenario, global water withdrawals for energy production reach 690 bcm in 2035, an increase of about 20% over 2010, with growth slowing noticeably after 2020 (Figure 17.6 and Table 17.4). Withdrawals in the Current Policies Scenario (representing a pathway that assumes no change in existing energy-related policies) continue to rise throughout the projection period, climbing to 790 bcm in 2035, or 35% higher than in 2010. Energy-related water consumption grows over the Outlook period by about 85% in the New Policies Scenario and doubles in the Current Policies Scenario.
Figure 17.6 ⊳ Global water use for energy production by scenario
200
400
600
800
2010 2020 2035
bcm
Current PoliciesScenarioNew PoliciesScenario450 Scenario
Consump�on
Withdrawals:
7. Freshwater requirements are quantified for the production of primary fuels (oil, gas, coal and biomass) consumed in all end-use sectors and for all forms of electricity generation, excluding hydropower (see footnote 5). Water factors are applied to energy production in each WEO region by fuel type and electricity generating (and cooling) technology. More information on the water factors used and key assumptions can be obtained at www.worldenergyoutlook.org.
499-528_Part d - Chapitre 17weo_27-28.indd 514 18/10/2012 12:12:00
14

© O
ECD
/IEA
, 201
2
Chapter 17 | Water for energy 515
2
8
5
11
16
1
7
3
9
14
6
12
17
4
10
15
13
18
Table 17.4 ⊳ Global water use for energy production in the New Policies Scenario by region (bcm)
Withdrawal Consumption2010 2020 2035 2010-35* 2010 2020 2035 2010-35*
OECD 307 316 302 -0.1% 30 39 46 1.7%Americas 241 253 249 0.1% 21 29 38 2.5%
United States 206 214 212 0.1% 19 26 35 2.5%Europe 61 57 49 -0.9% 8 8 6 -1.4%Asia Oceania 5 6 5 0.1% 1 2 2 1.9%Non-OECD 276 346 388 1.4% 35 56 76 3.1%E. Europe/Eurasia 95 93 95 0.0% 4 5 6 1.5%Asia 157 211 230 1.5% 21 34 43 2.9%
China 106 134 145 1.3% 16 26 30 2.5%India 40 55 58 1.6% 4 6 9 3.5%
Middle East 3 4 5 1.3% 2 3 4 1.5%Africa 5 7 8 1.8% 3 4 4 1.6%Latin America 16 31 52 4.9% 5 11 19 5.6%World 583 662 691 0.7% 66 95 122 2.5%European Union 66 61 56 -0.7% 8 8 6 -1.2%
* Compound average annual growth rate.
Slower energy demand growth in the New Policies Scenario (averaging 1.2% per year, versus 1.5% in the Current Policies Scenario) plays a significant role in its comparatively lower water requirements. Differences in the global fleet of coal-fired power plants are notable in the two scenarios. In the New Policies Scenario, coal-fired generation is some 30% lower at the end of the Outlook period and inefficient plants (that withdraw large quantities of water) are retired more quickly. The power sector sees a continued trend toward wet cooling towers in both scenarios, but because older plants are more often based on traditional once-through systems, the move away from subcritical coal plants in the New Policies Scenario has a greater impact on water withdrawals. The expanded role of renewables, such as wind and solar PV, also reduces water withdrawals in the New Policies Scenario – their generation in 2035 is 25% and 60% higher, respectively, than in the Current Policies Scenario.
In addition to representing a low-carbon pathway, the 450 Scenario could also be a less water-intensive one. Withdrawals by the energy sector in this scenario reach about 600 bcm in 2035, only 4% above 2010 levels; consumption almost doubles. Compared with the New Policies Scenario, the 450 Scenario sees much more modest energy demand growth (averaging 0.6% per year) and a marked shift in the power sector away from coal-fired power plants and towards renewables. The 450 Scenario, nonetheless, widely deploys several technologies – including nuclear power, CCS-fitted power plants and conventional biofuels – whose high water use requirements must be taken into account when siting energy production facilities. Water withdrawals and consumption for biofuels expand the
499-528_Part d - Chapitre 17weo_27-28.indd 515 18/10/2012 12:12:00
15

© O
ECD
/IEA
, 201
2
516 World Energy Outlook 2012 | Special Topics
most in the 450 Scenario, even though the increase after 2020 is stemmed somewhat by penetration of non-irrigated advanced biofuels.
In the New Policies Scenario, water use for power generation – principally for cooling at thermal power plants – accounts for the bulk of water requirements for energy production worldwide, although the needs for biofuels also become much more significant as their production accelerates (Figure 17.7). Withdrawals for power generation in 2010 were some 540 bcm, over 90% of the total for energy production. These slowly rising requirements level off around 2015, before falling to 560 bcm at the end of the Outlook period. There are two counteracting forces at work: a reduction of generation by subcritical coal plants that use once-through cooling, particularly in the United States, China and European Union, cutting global withdrawals by coal-fired plants by almost 10%; and growth in generation from newly built nuclear power plants that use once-through cooling (for instance, some that are constructed inland in China), which expands water withdrawals for nuclear generators by a third. Consumption of water in the world’s power sector rises by almost 40%, boosted by increased use of wet tower cooling in thermal capacity. Increasing shares of gas-fired and renewable generation play a significant role in constraining additional water use in many regions, as global electricity generation grows by some 70% over 2010-2035, much more than water withdrawal or consumption by the sector.
Figure 17.7 ⊳ Global water use for energy production in the New Policies Scenario by fuel and power generation type
0
100
200
300
400
500
600
700
800
2010 2020 2035
bcm
Withdrawal
0
20
40
60
80
100
120
140
2010 2020 2035
bcm
Consump�on
BiofuelsFossil fuels
BioenergyNuclearOilGasCoal
Fuels:
Power:
Energy-related water use rises as a direct consequence of steeply increasing global biofuels supply, which triples in the New Policies Scenario on government policies that mandate the use of biofuels. Water withdrawals for biofuels increase in line with global supply, from 25 bcm to 110 bcm over 2010-2035. However, consumption increases from 12 bcm to almost 50 bcm during that time, equalling the water consumption for power generation by the end of the Outlook period. These higher water requirements for biofuels production stem from the irrigation needs for feedstock crops for ethanol and biodiesel – primarily
499-528_Part d - Chapitre 17weo_27-28.indd 516 18/10/2012 12:12:01
16

© O
ECD
/IEA
, 201
2
Chapter 17 | Water for energy 517
2
8
5
11
16
1
7
3
9
14
6
12
17
4
10
15
13
18
sugarcane, corn and soybean – in major producing regions, such as Brazil, the United States and China. Non-irrigated advanced biofuels from waste crops make inroads into the market after 2020, thereby serving to temper the growth in overall water needs for biofuels production in the New Policies Scenario.
The water-intensity of global withdrawals and consumption for energy production – that is, water withdrawals and consumption per unit of energy produced – head in opposite directions during the Outlook period (Figure 17.8). The withdrawal-intensity of global energy production falls by 23%, whereas consumption-intensity increases by almost 18%. As noted, this is primarily the result of an expected shift in the power sector away from traditional once-through cooling systems towards wet towers (that reduce withdrawals but raise consumption).
Figure 17.8 ⊳ Water intensity of energy production for selected regions in the New Policies Scenario
Withdrawal intensity Consump�on intensity
cubic metres per toe
2010
2035
cubic metres per toe
World
United States
European Union
China
India
Middle East
0 20 4060 80 0186420 001
The largest users of water for energy production on a country and regional basis are the world’s largest electricity generators: the United States, the European Union, China and India (Table 17.4). All have significant inland generating capacity to meet demand away from the coasts. On the other hand, countries such as Japan, Korea and Australia have minimal water requirements for energy because they can site virtually all of their power plants on the coasts and use seawater for cooling. Water scarcity is a major constraint on water use for energy production in the Middle East, where the energy sector’s absolute water use and water intensity are strikingly low and remains so through the Outlook period. The region’s fleet of power plants is adapted to scarce water conditions, employing significant capacity that depends little on freshwater availability, including combined-cycle gas turbines and combined water and power facilities, situated on the coast, to meet demand needs for both energy and freshwater.
499-528_Part d - Chapitre 17weo_27-28.indd 517 18/10/2012 12:12:01
17

518 World Energy Outlook 2012 | Special Topics
Regional stress pointsChina
China’s water resources are set to become more strained with the country’s ongoing urbanisation and economic development. On a national basis China’s renewable water resources per capita were 2 070 cubic metres in 2010, just above the level regarded in this analysis as indicating “water stress”; but resources vary widely across regions (Figure 17.9). Water withdrawals per capita amounted to about 460 cubic metres. Around 65% of China’s water withdrawals are for irrigation, 23% for industry and 12% for municipal use (UN FAO, 2012). China’s water challenges are exacerbated by geographical disparity between supply and demand: water is much more abundant in the south than in the north and west, where the country’s water-intensive agriculture and industry sectors are concentrated. Limited water supplies and widespread pollution of river systems in parts of China have put increasing pressure on groundwater resources (IBRD, 2009).
Figure 17.9 ⊳ Renewable water resources per capita and distribution of water-intensive energy production by type in China
NINGXIA
GANSU
SHANXI SHANDONG
GUANGDONG
HUBEI
HEBEI
TIANJIN
LIAONING
HEILONGJIANG
SHANGHAIANHUI
HENAN JIANGSU
SHAANXI
SICHUAN
INNER MONGOLIA
CHONGGQING
Tarim basin
Sichuanbasin
76
XINJIANG
296
600
594
230
BEIJING
143
136
128
0 500 1 000 1 700 2 500Renewable water resources in cubic metres per capita
ScarcityAbsolutescarcity Stress Vulnerability
Major coal production centres, 2009 (Mt)
High potential for shale gas production
This map is without prejudice to the status of or sovereignty over any territory, to the delimitation of international frontiers and boundaries and to the name of any territory, city or area.
Notes: Although water resources in the Xinjiang Uygher Autonomous Region as a whole are above the national average, they are unevenly distributed. The Tarim Basin, which has high potential for shale gas production, is particularly arid. Sources: Water data from China National Bureau of Statistics; IEA analysis.
18

© O
ECD
/IEA
, 201
2
Chapter 17 | Water for energy 519
2
8
5
11
16
1
7
3
9
14
6
12
17
4
10
15
13
18
The Chinese government has identified water scarcity as a potential bottleneck to economic and social development. In response, it is pushing ahead with water pricing reforms and increasingly stringent regulations and enforcement procedures aimed at improving water conservation. China’s 12th Five-Year Plan, ending in 2015, includes a target to cut water consumption per unit of value-added industrial output by 30%. Water withdrawal caps have been set (635 bcm in 2015 rising to 700 bcm in 2030) and targets have been introduced to raise water-use efficiencies to the level of developed nations by 2030. Alongside these efforts, China is building desalination capacity and developing major water infrastructure projects, most notably the massive south-to-north water transfer project, scheduled for completion in 2050, which is designed to divert 45 bcm per year of water (the annual combined flow of the Tigris and Euphrates Rivers) from southern rivers to the dry north. Notwithstanding these measures, the threat remains that the future of certain water-intensive industries – including some types of energy production – could be constrained in certain water-stressed regions by intense competition for water.
Figure 17.10 ⊳ Water use for energy production in China in the New Policies Scenario
0
20
40
60
80
100
120
140
160
2010 2020 2035
bcm
Withdrawal
BiofuelsFossil fuels
BioenergyNuclearOilGasCoal
Fuels:
Power:
0
5
10
15
20
25
30
35
2010 2020 2035
bcm
Consump�on
In the New Policies Scenario, water withdrawals for energy production in China rise by 38% between 2010 and 2035, or 40 bcm (Figure 17.10). Water consumed by the energy sector rises far more proportionately, 83% (14 bcm), increasing pressure on water resources. Power generation dominates water use in the energy sector. Water withdrawals by coal-fired power plants remain relatively steady, rising by 12% despite their electricity output increasing by about 65%, due to the deployment of increasingly efficient plants and the use of wet cooling towers. However, the use of wet cooling towers is the prime factor pushing up water consumption in the sector. A growing role for natural gas in the power mix tempers water requirements, but the inland expansion of nuclear power raises withdrawals towards the end of the Outlook period. The coal mining sector is another important source of incremental water use: withdrawals are projected to rise by 18% for an equivalent percentage increase in coal production, much of which is expected to come from the country’s rich coal reserves in the dry north and west of the country. Water requirements per tonne of coal produced are expected to rise as coal mining operations move deeper underground and washing becomes more widespread.
499-528_Part d - Chapitre 17weo_27-28.indd 519 18/10/2012 12:12:02
19

© O
ECD
/IEA
, 201
2
520 World Energy Outlook 2012 | Special Topics
Power generation
Water scarcity is already having an impact on power generation in parts of China. In coal-rich arid regions in the north, some power plants have turned to dry cooling rather than wet cooling tower systems. These systems are more expensive and reduce plant efficiency, but (as described earlier) they can sharply reduce the extent of water withdrawals and consumption. Coal is set to remain the cornerstone of China’s electricity mix through the Outlook period, but government targets to diversify the structure of power generation will have implications for water consumption. Plans to install 150 gigawatts (GW) of wind by 2020 should alleviate some water scarcity concerns, particularly if this capacity is built in the north. But there are also targets to significantly expand nuclear capacity, a technology that is extremely water-intensive. While all existing nuclear plants in China use seawater for cooling, future plans include the development of inland nuclear power facilities – three are due to start construction during the course of the 12th Five-Year Plan – that will add to competition for scarce water resources where the plants are sited. China also has ambitions to increase production of CSP, which can be as water-intensive as fossil fuel-based and nuclear plants. As is often the nature of areas well-suited to CSP, China’s sun belt is in a dry region: selection of particular sites will have to take into account the availability of water resources and the case for installing more expensive dry or hybrid dry/wet cooling systems.
Coal production and processing and shale gas
Water use in the coal sector – for mining, processing and cooling power plants – currently accounts for the largest share of industrial water use in China. The country’s coal resources, which are being rapidly tapped to meet the increasing demand for electricity, are concentrated in the western and northern regions, where water is scarce. For example, Shanxi, Shaanxi, Inner Mongolia and Xinjiang hold 74% of China’s total coal resources, but only 7% of the nation’s water resources (IEA, 2008). Water shortages in these regions limit the scope to develop coal-fired power plants there to deliver electricity to demand centres in the east, thereby contributing to capacity bottlenecks in the transport of coal by truck or rail. Water scarcity also helps to explain the low share of China’s coal production that is washed to improve combustion efficiency and reduce sulphur and particulate emissions from coal-fired combustion.
Water scarcity in coal-bearing regions accounts, in part, for the scaling back of China’s plans to expand coal-to-liquids (CTL) production as a means of slowing its rising petroleum imports. Production of CTL is water intensive, the fuel processing phase withdrawing about 1.5 cubic metres of water per barrel of fuel produced (without recycling). This concern prompted the suspension of dozens of CTL projects in 2008. Nonetheless, several plants have gone ahead and other projects are in the start-up phase. In early 2011, China brought on-stream its first commercial CTL facility – the 24 thousand barrels per day (kb/d) Shenhua Group plant in Inner Mongolia – and there are plans to expand production, encouraged by the plant’s performance and profitability.
499-528_Part d - Chapitre 17weo_27-28.indd 520 18/10/2012 12:12:02
20

© O
ECD
/IEA
, 201
2
Chapter 17 | Water for energy 521
2
8
5
11
16
1
7
3
9
14
6
12
17
4
10
15
13
18
At 36 trillion cubic metres (tcm), China is estimated to have the largest technically recoverable shale gas resources in the world.8 Exploration and development is as yet in its infancy, but the government is actively seeking to develop these resources. In March 2012, China’s National Development Reform Commission (NDRC) issued the National Shale Gas Development Plan for 2011-15, which envisions shale gas production reaching 60-100 bcm by 2020. However, some of the most promising basins are located in water scarce regions, which could constrain production growth (or raise developments costs). The Tarim Basin in the Xinjiang Uyghur Autonomous Region, for example, holds some of the country’s largest shale gas deposits but suffers from severe water scarcity. Several other shale gas areas are likely to face strong competition for water, including the Ordos, Qinshui and North China basins. By contrast, most shale gas exploration and development in China has been concentrated in the Sichuan Basin, where water is more abundant.
India
India’s water resources are set to come under further pressure as economic and population growth continue and people move into cities. The country’s renewable water resources per capita were about 1 560 cubic metres in 2010, below the threshold for “water stress”. Water withdrawals per capita totalled about 620 cubic metres. Around 90% of India’s water withdrawal is for agriculture and livestock, with the remainder to municipalities (7%) and industries (2%) (UN FAO, 2012). Although the energy sector (primarily power generation under industry) accounts for only a minor share now, this is expected to increase as India’s energy demand more than doubles over the Outlook period in the New Policies Scenario.
India’s main sources of water – glacier melt and rainfall – are unevenly distributed. Most of the rainfall comes during the summer monsoon from June to September. A delayed or weak monsoon often results in water shortages, with severe drought having occurred in the past few years, particularly in 2009 and in 2012. The northwest and southern regions, which generally receive less rainfall, are especially susceptible, being host to significant power generating capacity that is highly dependent on water (Figure 17.11). Groundwater is pumped to supplement other water resources, a process incentivised by subsidised electricity prices. Withdrawal rates are highest in northern and southern regions. Extensive water pollution from sewage is one factor limiting water availability (for example, the lower stretch of Yamuna River from New Delhi is heavily polluted). River basins spread across states have witnessed interstate disputes over water rights. Following the last amendment, a decade ago, the government is currently drafting a new national water policy.
In the New Policies Scenario, water withdrawals for energy production in India grow by almost 50% between 2010 and 2035, or 19 bcm (Figure 17.12). Water consumption increases at a much faster rate, more than doubling over the period. The power sector, which accounts for the vast bulk of all water use by India’s energy sector at present, remains
8. The estimate cited is by Advanced Resources International (ARI); China’s Ministry of Land and Resources estimates 25 tcm shale gas, but this estimate does not include all provinces. The ARI estimate is used for consistency with our resource methodology for other countries.
499-528_Part d - Chapitre 17weo_27-28.indd 521 18/10/2012 12:12:02
21

© O
ECD
/IEA
, 201
2
522 World Energy Outlook 2012 | Special Topics
the major source of incremental water use: it accounts for 98% of additional withdrawals and 95% of additional consumption during the Outlook period. The increase in withdrawals by coal-fired power plants slows between 2010 and 2035, as India’s fleet of power plants becomes more efficient. Growth in the share of natural gas in power generation tempers water use in the power sector. Some additional water use results from expanding nuclear power output. Biofuels are a small source of incremental water use during the Outlook period.
Figure 17.11 ⊳ Renewable water resources per capita and distribution of water-intensive energy production by type in India
Notes: Per-capita water availability is shown by river basin. The striped area represents the inland drainage area of Rajasthan. Due to data limitations, some areas are not shaded.
Sources: Government of India (2010); Platts (2012); IEA analysis.
499-528_Part d - Chapitre 17weo_27-28.indd 522 18/10/2012 12:12:03
22

© O
ECD
/IEA
, 201
2
Chapter 17 | Water for energy 523
2
8
5
11
16
1
7
3
9
14
6
12
17
4
10
15
13
18
Figure 17.12 Water use for energy production in India in the New Policies Scenario
India relies heavily on coal-fired power plants, many of which employ subcritical technologies and run at low efficiencies of around 30%. India’s warm climate and poor quality domestic coal add to cooling requirements for these plants, though power plant efficiencies could be boosted with greater coal washing. India’s power sector has already faced constraints linked to water availability. Summer water shortages in 2010 caused the 2.3-GW Chandrapur coal-fired power station in Maharashtra to shut down, leading to power outages across the populous state. The plant again faced water shortages, due to the delayed monsoon, in mid-2012. Water shortages in northern India have at times reduced hydropower generation, exacerbating power shortages due to insufficient coal supply to power plants. Moreover, increased groundwater withdrawals (which use electric pumps) to support agriculture during periods of drought put an additional burden on strained electricity supply. To address water shortages, several power plants are now using treated wastewater and seawater for cooling. Under the government’s 12th Five Year Plan over 2012-2017, coal allocations have been linked to water availability and priority is given to new power plants that use seawater, rather than freshwater, for cooling (Government of India, 2009). India’s national solar mission and solar cities development programme foresee higher CSP output during the Outlook period, but some plants are being built in water-stressed areas, such as Rajasthan, where water could be a constraint.
United States
A temperate climate and moderate rainfall underpin renewable water resources in the United States that are well in excess of water use. Per capita annual renewable water resources were close to 10 000 cubic metres in 2010, while total per capita freshwater withdrawals were just over 1 500 cubic metres. Total water withdrawals in the United States more than doubled from 1950 to 1975, but have remained flat since then, despite ongoing
499-528_Part d - Chapitre 17weo_27-28.indd 523 18/10/2012 12:12:03
0
10
20
30
40
50
60
70
2010 2020 2035
bcm
Withdrawal
0
1
2
3
4
5
6
7
8
9
10
2010 2020 2035
bcm
Biofuels
Fossil fuels
Biomass
Nuclear
Oil
Gas
Coal
ConsumptionFuels:
Power:
23

© O
ECD
/IEA
, 201
2
524 World Energy Outlook 2012 | Special Topics
population and economic growth. Total water withdrawals are split between power plant use (49%), irrigation (31%), municipal use (11%) and other (8%) (USGS, 2009).
In the New Policies Scenario, water withdrawals for energy production in the United States increase only slightly from just over 206 bcm in 2010 to just over 210 bcm in 2035 (Figure 17.13). Withdrawals for coal-fired power plants fall substantially with the retirement of old and less efficient stock and the continued phase out of once-through cooling systems. Water consumption for energy production rises by over 80% during the Outlook period, the increase occurring mostly in the next decade due to a substantial increase in the use of energy crops for biofuels production such as corn and soybean crops that generally require irrigation, leading to high water use.
Figure 17.13 ⊳ Water use for energy production in the United States in the New Policies Scenario
0
5
10
15
20
25
30
35
40
2010 2020 2035
bcm
Consump�on
0
50
100
150
200
250
2010 2020 2035
Withdrawal
bcm
BiofuelsFossil fuels
BioenergyNuclearOilGasCoal
Fuels:
Power:
Power generation
Withdrawals for power plants have not increased since 1975, despite electricity generation more than doubling over the same period. This is partially due to a shift towards cooling systems which withdraw less water but consume more, i.e. the replacement of once-through systems with wet cooling towers, a trend that is expected to continue. Growing output from higher-efficiency gas-fired power generation in the past decades has also tempered water withdrawals.
Unlike the general water situation in the United States, water is scarce in the dry southwest and is a key concern for existing power plants as well as new builds. Water use already exceeds sustainable levels in the region, which faces growing water and electricity demand as the population increases. Low water availability has occasioned the reduction of output from coal-fired power plants and hydropower facilities in some cases, and put it seriously at risk in others, threatening blackouts and higher cost electricity. According to the US Energy Information Administration, electricity demand in the region is set to increase more than one-third by 2035 (US DOE/EIA, 2011). The water scarcity means that new generating
499-528_Part d - Chapitre 17weo_27-28.indd 524 18/10/2012 12:12:03
24

© O
ECD
/IEA
, 201
2
Chapter 17 | Water for energy 525
2
8
5
11
16
1
7
3
9
14
6
12
17
4
10
15
13
18
capacity deployed to meet this demand will need to have limited dependence on water, favouring an expansion of gas-fired, wind and solar PV installations and the use of dry and hybrid cooling systems. The deployment of such technologies, backed by energy efficiency efforts, could dramatically cut water withdrawals and consumption by power generation and offer operational flexibility over a range of climatic conditions (Cooley, et al., 2011).
Power generation facilities in other US regions – even where water is typically in ample supply – can be vulnerable to abnormal changes in water availability, such as during a drought or heat wave. For example, although renewable water resources in an average year are close to forty times total water consumption in the US southeast, droughts there in 2007 and 2010 forced operations to be scaled back at hydropower facilities and several coal-fired and nuclear power plants.
Light tight oil and unconventional gas
Water scarcity threatens to constrain burgeoning domestic oil and gas production from shale formations in some parts of the country. US light tight oil production has increased from 11 kb/d in 2005 to 840 kb/d in 2011 and is expected to continue this rapid expansion, reaching over 3.2 mb/d by 2025 in the New Policies Scenario (see Chapter 3, Box 3.3). These bullish prospects are underpinned by significant resources in the Bakken formation, spanning the western states of North Dakota and Montana, and in the Eagle Ford formation, within the state of Texas. In the Bakken, further expansion of production is contingent on water availability. Recent drilling activity has started to approach the limits of available water resources and developers believe that securing ample water will be a key challenge for continued development (MacPherson, 2011). Texas is one of the driest regions of the country and recent extended periods of drought have heightened concerns about water availability.
Concerns about water availability and the effect of production on water quality could also significantly slow the development of shale gas production in the United States. Shale gas production has increased by 45% per year between 2005 and 2011 and in the New Policies Scenario it is projected to grow to about 370 bcm in 2035, up from 193 bcm from in 2011. Hydraulic fracturing is a source of considerable public concern in the United States and some states, such as Vermont, New York, New Jersey and Maryland, have either banned its use or placed a moratorium on the practice while further study is undertaken. A major investigation is underway by the US Environmental Protection Agency to understand the potential impacts of hydraulic fracturing on drinking water sources, with a final report expected in 2014. This could greatly impact the rate of future development of shale gas production in the United States and elsewhere.
Canada
Although Canada is a water-rich country, with annual per capita renewable water resources in excess of 85 000 cubic metres, extensive use of water in the extraction and upgrading of oil sands (or bitumen) in parts of Alberta and Saskatchewan provinces could
499-528_Part d - Chapitre 17weo_27-28.indd 525 18/10/2012 12:12:03
25

© O
ECD
/IEA
, 201
2
526 World Energy Outlook 2012 | Special Topics
have significant implications for the oil production outlook and water resources in the surrounding area. Oil sands production has grown from 0.6 million barrels per day (mb/d) in 2000 to 1.6 mb/d in 2011 and is projected to increase to 4.3 mb/d in 2035 in the New Policies Scenario, making an important contribution to global oil supply and energy security (see Chapter 3).
There are two main techniques for producing oil sands, both of which use water. In mining operations, shallow deposits are extracted and the bitumen separated from the sand using hot water. Deeper deposits are typically produced using in-situ methods, in which steam is injected into the reservoir. Mining accounts for about 51% of oil sands production at present, although in-situ techniques are expected to account for the bulk of the projected increase. In both cases, the bitumen is converted into higher-value synthetic crude oil.
Net of recycling, we estimate that mining (plus upgrading) requires 0.9 cubic metres of water per barrel of synthetic crude oil produced while in-situ recovery requires 0.2 cubic metres of water per barrel produced. The majority of water required for mining operations is withdrawn from the Athabasca River, although the share fluctuates: the percentage was 85% in 2010, up from two-thirds the previous year. In-situ operations sourced just over 80% of their water needs from groundwater (such as deep saline aquifers) in 2010, making no withdrawals from the Athabasca River (CAPP, 2011). Presently, about half of the water withdrawn by in-situ operations is freshwater, but increasingly projects are sourcing water from saline aquifers. Based on expected production trends, we estimate that total water withdrawals for oil sands – including fresh and saline sources – will grow from about 220 million cubic metres (mcm) in 2010 to about 520 mcm in 2035 (Figure 17.14).
Realising large increases in oil sands production depends on reducing freshwater use as well as future water availability. Freshwater use can be cut by increasing reliance on saline aquifers or wastewater for water supply, greater use of water recycling and additional use of steam-less processes. Water availability does not present an immediate risk to operations: withdrawals from the Athabasca River for oil sands mining represent only 0.5% of its average annual flow and are about one-quarter of the amount allocated under existing regulations; and saline aquifers have provided increasing amounts of water as oil sands output has grown. Projected total (saline and fresh) water needs for oil sands production in 2035 would be greater than the existing threshold for withdrawals from the Athabasca River. While much of the water needs could be expected to come from saline aquifers, the implications of increasing withdrawals from these sources have not yet been fully assessed (in terms of aquifer size and ecosystem impact), emphasising the importance of achieving reductions in freshwater use with continued technology improvement. The seasonality of the Athabasca’s flow could also pose operational challenges without careful management of withdrawals. During winter months, its flow can fall to around one-quarter of the summer peak, and mining companies are presently required to adhere to withdrawal limits that are adjusted weekly according to river conditions.
499-528_Part d - Chapitre 17weo_27-28.indd 526 18/10/2012 12:12:03
26

© O
ECD
/IEA
, 201
2
Chapter 17 | Water for energy 527
2
8
5
11
16
1
7
3
9
14
6
12
17
4
10
15
13
18
Figure 17.14 ⊳ Canadian oil sands production and estimated water withdrawal by type in the New Policies Scenario
0
1
2
3
4
5
6
mb/
d
0
100
200
300
400
500
600
mill
ion
cubi
c m
etre
s
In situ
Mining
In situMining
Water withdrawal*(right axis):
2010 2020 2030 2035
Oil produc�on
* Includes fresh and saline water.
Note: Water withdrawals are estimated by applying technology-specific water indicators to projections for mining and in-situ oil sands production.
Source: IEA analysis.
The impact of oil sands’ production on water quality is also a critical issue. The discharge of untreated wastewater into rivers is prohibited, but there is concern that seepage from the vast tailing ponds already used to store degraded water could cause surface and groundwater pollution. For the protection of ecosystems, regulations mandate that rigorous monitoring is performed and prevention systems are in place to guard against seepage.
How serious is the water constraint?The projections set out in WEO-2012 assume that the associated water constraints can be overcome. However, there is no doubt that water is growing in importance as a criterion for assessing the physical, economic and environmental viability of energy projects. In an increasingly water-constrained world, the vulnerability of the energy sector to constraints in water availability can be expected to increase, as can issues around how the quality of water is affected by energy operations. These vulnerabilities and impacts are manageable in most cases, but better technology will need to be deployed and energy and water policies better integrated.
Several opportunities are available to improve the situation. In the power sector, these include greater reliance on renewable energy technologies that have minimal water requirements, such as solar PV and wind; improving the efficiency of power plants, for instance by shifting from subcritical coal to supercritical coal or IGCC plants; and deployment of more advanced cooling systems, including wet cooling towers, and dry and
499-528_Part d - Chapitre 17weo_27-28.indd 527 18/10/2012 12:12:03
27

© O
ECD
/IEA
, 201
2
528 World Energy Outlook 2012 | Special Topics
hybrid cooling. In biofuels production, biomass crops and locations that have the greatest water efficiency will be advantaged. More generally, the energy sector can look to exploit non-freshwater sources – saline water, treated wastewater, storm water and produced water from oil and gas operations – and adopt water re-use technologies. Importantly, assigning precious water resources a more appropriate economic value in regions where it is underpriced or even free would encourage more efficient use, not only in the energy sector but across the economy.
499-528_Part d - Chapitre 17weo_27-28.indd 528 18/10/2012 12:12:03
28

© O
ECD
/IEA
, 201
2
666 World Energy Outlook 2012 | Annexes
Chapter 16: Implications of Iraq’s energy development
Humphreys, M., J. Sachs and J. Stiglitz (eds.) (2007), Escaping the Resource Curse, Columbia University Press, New York.
Mott MacDonald (2010), Supplying the EU Natural Gas Market, Mott MacDonald, Croydon, United Kingdom.
Part D: Special TopicsChapter 17: Water for energy
CAPP (Canadian Association of Petroleum Producers) (2011), Responsible Canadian Energy 2010 Report, CAPP, Calgary, Canada.
Cooley, H., J. Fulton and P. Gleick (2011), Water for Energy: Future Water Needs for Electricity in the Intermountain West, Pacific Institute, Oakland, United States.
Falkenmark, M., J. Lundquist and C. Widstrand (1989), “Macro-scale Water Scarcity Requires Micro-scale Approaches: Aspects of Vulnerability in Semi-Arid Development”, Natural Resources Forum, Vol. 13, No. 4, pp. 258-267.
Gleick, P. (1994), “Water and Energy”, Annual Review of Energy and Environment, Vol. 36, No. 3, Annual Reviews, Palo Alto, United States, pp. 267-299.
Government of India (2009), Coal Linkage Policy for 12th Plan Projects, Ministry of Power, www.powermin.nic.in/whats_new/pdf/Coal_linkage_policy_for_12th_plan_projects.pdf, accessed 17 May 2012.
− (2010), Water and Related Statistics, Central Water Commission, www.cwc.nic.in/ ISO_DATA_Bank/ISO_Home_Page.htm, accessed 4 April 2012.
IBRD (International Bank for Reconstruction and Development) (2009), Addressing China’s Water Scarcity, World Bank, Washington, DC.
IEA (International Energy Agency) (2008), Cleaner Coal in China, OECD/IEA, Paris.
− (2010), Concentrating Solar Power Technology Roadmap, OECD/IEA, Paris.
− (2012), Golden Rules for a Golden Age of Gas: World Energy Outlook Special Report on Unconventional Gas, OECD/IEA, Paris.
IPCC (Intergovernmental Panel on Climate Change) (2008), Climate Change and Water, Technical Paper, IPCC, Geneva.
IWMI (International Water Management Institute) (2007), Water for Food, Water for Life: A Comprehensive Assessment of Water Management in Agriculture, Earthscan and IWMI, London and Colombo, Sri Lanka.
Macknick, J., et al. (2011), A Review of Operational Water Consumption and Withdrawal Factors for Electricity Generating Technologies, National Renewable Energy Laboratory, Golden, United States.
655-670_Annex_d_weo_34.indd 666 18/10/2012 12:13:34
29
References
© O
ECD
/IEA
, 201
2
Annex D | References 667
2
8
5
11
16
1
7
3
9
14
6
12
17
4
10
15
13
D
MacPherson, J. (2011), “Water Key to North Dakota Oil Patch Growth”, Businessweek, Bloomberg, 25 March.
Mielke, E., et al. (2010), Water Consumption of Energy Resource Extraction, Processing and Conversion, Belfer Center for International Affairs, Harvard Kennedy School of government, Cambridge, United States.
Platts (2012), World Electric Power Plants Database, McGraw-Hill Companies, accessed July 2012.
Torcellini, P., N. Long and R. Judkoff (2003), Consumptive Water Use for US Power Production, National Renewable Energy Laboratory, Golden, United States.
Schornagel, J., et al. (2012), “Water Accounting for (Agro) Industrial Operations and its Application to Energy Pathways”, Resources, Conservation and Recycling, Vol. 61, Elsevier, Amsterdam, pp. 1-15.
Shiklomanov, I. (1993), “World Fresh Water Resources”, Water in Crisis: A Guide to the World’s Fresh Water Resources, Gleick, P. (ed.), Oxford University Press, New York.
UNDP (United Nations Development Programme) (2006), Human Development Report 2006, Palgrave Macmillan, New York.
UN FAO (United Nations Food and Agriculture Organization) (2010), The Wealth of Waste: The Economics of Wastewater Use in Agriculture, UN FAO, Rome.
− (2012), Aquastat Database, UN FAO, www.fao.org/nr/water/aquastat/main/index.stm¸ accessed 10 September 2012.
US DOE (US Department of Energy) (2006), Energy Demands on Water Resources, US DOE, Washington, DC.
US DOE/EIA (US Department of Energy/Energy Information Administration) (2011), “WECC – Southwest Region Data”, Annual Energy Outlook 2011, US DOE, Washington, DC.
US DOE/NETL (US Department of Energy/National Energy Technology Laboratory) (2007), 2007 Coal Power Plant Database, NETL, www.netl.doe.gov/energy-analyses/hold/technology.html, accessed 12 April 2012.
− (2008), Water Requirements for Existing and Future Thermoelectric Plant Technologies, NETL, Pittsburgh, United States.
− (2010), Cost and Performance Baseline for Fossil Energy Plants, NETL, Pittsburgh, United States.
− (2011), Estimating Freshwater Needs to Meet Future Thermal Generation Requirements, NETL, Pittsburgh, United States.
USGS (US Geological Survey) (2009), Estimated Use of Freshwater in the United States in 2005, USGS, Washington, DC.
655-670_Annex_d_weo_34.indd 667 18/10/2012 12:13:34
30

© O
ECD
/IEA
, 201
2
668 World Energy Outlook 2012 | Annexes
US EPA (US Environmental Protection Agency) (2009), Clean Water Act – Section 316b Chapter 3, US EPA, Washington, DC.
WWAP (World Water Assessment Programmme) (2012), The United Nations World Water Development Report 4: Managing Water under Uncertainty and Risk, United Nations Educational Scientific and Cultural Organization, Paris.
Chapter 18: Energy for all
Asian Development Bank (2011), Energy for All: Viet Nam’s Success in Increasing Access to Energy through Rural Electrification, Asian Development Bank, Manila, Philippines.
Ghana Energy Commission (2012), Ghana Action Plan for Sustainable Energy for All by 2030, Ghana Energy Commission, Accra, Ghana.
Gómez, M. and S. Silveira (2010), “Rural Electrification of the Brazilian Amazon – Achievements and Lessons”, Energy Policy, Vol. 38, No. 10, Elsevier, Amsterdam, pp. 6251-6260.
Government of India (2012), Census of India 2011, Ministry of Home Affairs, Government of India, New Delhi.
Kooijman-van Dijk, A. and J. Clancy (2010), “Impacts of Electricity Access to Rural Enterprises in Bolivia, Tanzania and Vietnam”, Energy for Sustainable Development, Vol. 14, No. 1, Elsevier, Amsterdam, pp. 14-21.
Ministry of Mines and Energy (2009), Pesquisa Quantitativa Domiciliar de Avaliação – Principais Resultados, Government of Brazil, Brasilia.
− (2010), Light for All: A Historic Landmark, Government of Brazil, Brasilia.
PCIA (Partnership for Clean Indoor Air) (2012), “International Workshop Agreement on Cookstoves Unanimously Approved”, March 2012, PCIA online, www.pciaonline.org/news/ cookstoves-iwa-unanimously-approved, accessed 14 September 2012.
SNV (2011), SNV Newsletter, September 2011, SNV World online, www.snvworld.org/ sites/www.snvworld.org/files/publications/snv_domestic_biogas_newsletter_issue_5_september_2011.pdf, accessed 1 October 2012.
United Nations (2012a), Commitments: Sustainable Energy for All, www.sustainableenergyforall.org/actions-commitments/commitments, accessed 24 September 2012.
− (2012b), “Rio+20: Ban Announces More than 100 Commitments on Sustainable Energy”, 21 June, UN News Centre, www.un.org/apps/news/story.asp?NewsID=42297# .UGqt4ZH _mnB, accessed 19 July 2012.
Winkler, H., et al. (2011), “Access and Affordability of Electricity in Developing Countries”, World Development, Vol. 39, No. 6, Elsevier, Amsterdam, pp. 1037–1050.
655-670_Annex_d_weo_34.indd 668 18/10/2012 12:13:34
31

Secure Sustainable Together
www.iea.org/books
PDF versions at 20% discount
nlinebookshop
Tel: +33 (0)1 40 57 66 90
E-mail: [email protected]
International Energy Agency9 rue de la Fédération
75739 Paris Cedex 15, France