excel techniques in the financial world - · pdf fileexcel techniques in the financial world...
TRANSCRIPT

Excel Techniques in the Financial World
Kevin Kwan CFA, FRM
Desktop Build Group APAC, Bloomberg LP
July 2015

2 | © 2015 Global Association of Risk Professionals. All rights reserved.
The views expressed in the following material are the author’s and do not
necessarily represent the views of the Global Association of Risk
Professionals (GARP), its Membership or its Management.

Getting the data
"An investment in knowledge pays the best interest.“
- Benjamin Franklin
Getting the data
4 | © 2015 Global Association of Risk Professionals. All rights reserved.
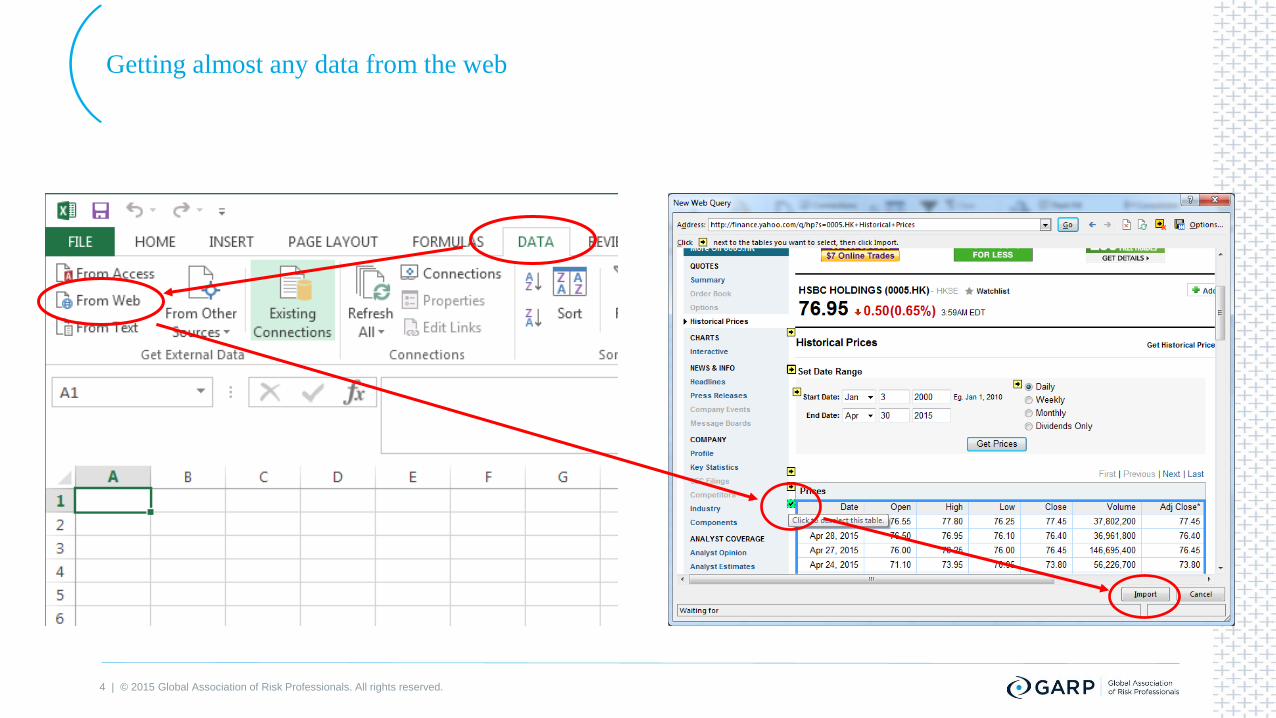
Getting almost any data from the web

5 | © 2015 Global Association of Risk Professionals. All rights reserved.
Getting almost any data from the web

6 | © 2015 Global Association of Risk Professionals. All rights reserved.
Defines which security information you are obtaining (Eg. 5 HK
Equity). Each data vender might have different ticker convention
More formal way to obtain data and Common data request structure
Tickers
Fields Defines what information you are obtaining relating to the above
ticker. Each data vender likely to have different fields convention
Dates
Optional
Parameters
Optional: Defines the point-in-time data or the date range of
historical data
Optional: Defines other data characteristics

7 | © 2015 Global Association of Risk Professionals. All rights reserved.
Using Excel 2013 Webservice formula:
=WEBSERVICE( Data Source s=Ticker & f=Field)
Data Source – http://download.finance.yahoo.com/d/quotes.csv?
Ticker – 0005.HK (0005.HK is the Yahoo ticker for HSBC listed in HKEx)
Field – b2 (b2 is the field name for Ask Price in Yahoo. Refer to Annex)
Example:
=WEBSERVICE("http://download.finance.yahoo.com/d/quotes.csv?s=0005.HK&f=b2")
Getting Yahoo finance data service onto Excel

8 | © 2015 Global Association of Risk Professionals. All rights reserved.
Real time data: =BDP( Ticker , Field , [Optional Parameter(s)] )
Historical data: =BDH( Ticker , Field , Start Date, End Date, [Optional
Parameter(s)] )
Reference data sets: =BDS( Ticker , Field , [Optional Parameter(s)] )
Example: =BDH("5 HK Equity","PX_Last", "20150505", "20150508") returns HSBC
historical price data from 5th May 2015 to 8th May 2015
Getting Bloomberg data onto Excel

9 | © 2015 Global Association of Risk Professionals. All rights reserved.
Drag and drop directly from FLDS to Excel
Bloomberg FLDS<GO>

Optimizing a
Portfolio
“The stock market is filled with individuals who know the price of
everything, but the value of nothing”
- Phillip Fisher

11 | © 2015 Global Association of Risk Professionals. All rights reserved.
Define your trading universe
This example will be benchmarked to HSI Index. Getting HSI members’ ticker and their
weighting, Annual Total Return and Volatility one year from now
Preparing to optimize your portfolio
=BDS("HSI Index", "INDX_MWEIGHT_HIST",
"END_DATE_OVERRIDE=20140526”
=BDP(A4 & " Equity",
"CUST_TRR_RETURN_HOLDING_PER",
"CUST_TRR_START_DT=20130526"),
"CUST_TRR_END_DT=20140526")
=BDH(A4 & " Equity", "VOLATILITY_260D",
"20140526")

12 | © 2015 Global Association of Risk Professionals. All rights reserved.
Yahoo does not provide return volatility data but we could calculate from historical price.
Preparing to optimize your portfolio (Yahoo data)
Return=Close – Previous day Close
=STDEV.S(Return)*SQRT(250)*100

13 | © 2015 Global Association of Risk Professionals. All rights reserved.
Preparing to optimize your portfolio
Create a column to store the weighting
of your new portfolio. Initially could set
to equal weighted. (Eg. 2% each)
Approximated Sharpe Ratio for the
benchmark portfolio
Approximated Sharpe Ratio to be
optimized (this is calculated from the
portfolio weighting in column G)

14 | © 2015 Global Association of Risk Professionals. All rights reserved.
Enabling Solver Add-in in Excel Option
Optimization steps

15 | © 2015 Global Association of Risk Professionals. All rights reserved.
Optimization steps
16 | © 2015 Global Association of Risk Professionals. All rights reserved.
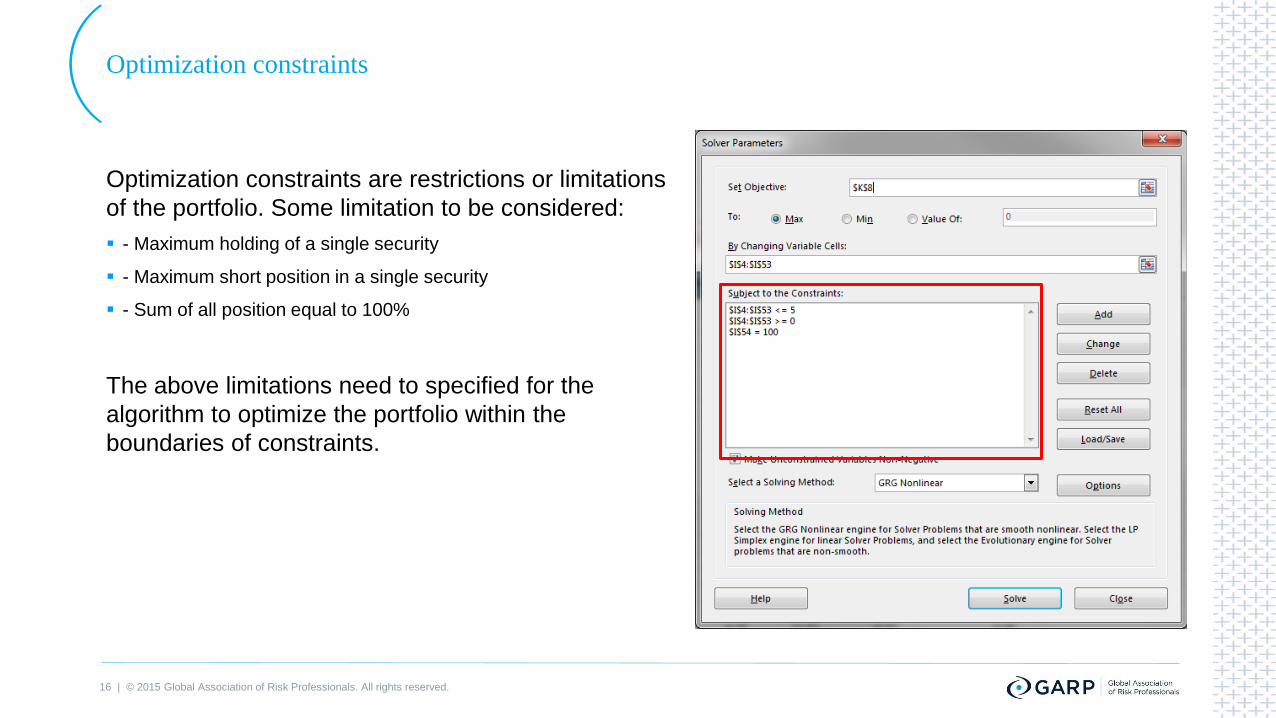
Optimization constraints are restrictions or limitations
of the portfolio. Some limitation to be considered:
- Maximum holding of a single security
- Maximum short position in a single security
- Sum of all position equal to 100%
The above limitations need to specified for the
algorithm to optimize the portfolio within the
boundaries of constraints.
Optimization constraints

17 | © 2015 Global Association of Risk Professionals. All rights reserved.
Optimized portfolio (no short position
allowed) using 12 months data 1 year
from now has a Approximated Sharpe
Ratio of 0.8. Optimized portfolio
suggested to hold:
5% of 11 HK
5% of 1199 HK
5% of 1 HK
etc
Optimized portfolio (no short position)

18 | © 2015 Global Association of Risk Professionals. All rights reserved.
Holding Per 5/27/2014 5/27/2015
HSI New Portfolio
Peroid Rtn% 22.39 31.23
Std. Dev 14.71 16.94
Sharpe 1.52 1.84
Optimized portfolio (no short position)
Return of Optimized Portfolio (no
short position) was 31.2% last
year comparing to HSI Index
return of 23.4%

19 | © 2015 Global Association of Risk Professionals. All rights reserved.
Optimized portfolio (short position
allowed) has a Approximated Sharpe
Ratio of 0.98 over a 12 months period 1
year from now and suggested to hold:
Short 2% of 101 HK
Long 5% of 1044 HK
Short 2% of 1088 HK
etc
**Note: In reality, some stocks are not available for
short selling and need to include these in the
optimization constraints
Optimized portfolio (with short position)

20 | © 2015 Global Association of Risk Professionals. All rights reserved.
Holding Per 5/27/2014 5/27/2015
HSI New Portfolio
Peroid Rtn% 22.39 40.72
Std. Dev 14.71 18.38
Sharpe 1.52 2.22
Optimized portfolio (with short position)
Return of Optimized Portfolio
(with short position) was 40.7%
last year comparing to HSI Index
return of 23.4%

21 | © 2015 Global Association of Risk Professionals. All rights reserved.
To set up a rebalance, add to columns to
define the MAX and MIN weighting of
each member in the new portfolio
For example, new weighting is ± 20% of
the original portfolio
Optimized portfolio (rebalance original weighting)

22 | © 2015 Global Association of Risk Professionals. All rights reserved.
Constraints for each portfolio member:
New Weighting of X <= Max allowed weighting of
X
New Weighting of X >= Min allowed weighting of X
Optimized portfolio (rebalance original weighting)

23 | © 2015 Global Association of Risk Professionals. All rights reserved.
Holding Per 5/27/2014 5/27/2015
HSI New Portfolio
Peroid Rtn% 22.39 28.12
Std. Dev 14.71 15.47
Sharpe 1.52 1.82
Optimized portfolio (rebalance original weighting)
Return of Optimized Portfolio
(with short position) was 28.1%
last year comparing to HSI Index
return of 23.4%

Annex 1: Some useful Excel templates

25 | © 2015 Global Association of Risk Professionals. All rights reserved.
Run XLTP<GO> on terminal
Bloomberg Excel Template Library
Key word search
Topic, Asset Classes, Role, and Geo
Filters
Click to view more details of the
template

Annex 2: Data Fields Tables

27 | © 2015 Global Association of Risk Professionals. All rights reserved.
Pricing Dividends
a: Ask y: Dividend Yield
b: Bid d: Dividend per Share
b2: Ask (Realtime) r1: Dividend Pay Date
b3: Bid (Realtime) q: Ex-Dividend Date
p: Previous Close
o: Open
Date
c1: Change d1: Last Trade Date
c: Change & Percent Change d2: Trade Date
c6: Change (Realtime) t1: Last Trade Time
k2: Change Percent (Realtime)
p2: Change in Percent
Yahoo data fields
Averages
c8: After Hours Change
(Realtime) m5: Change From 200 Day
Moving Average
c3: Commission m6: Percent Change From 200
Day Moving Average
g: Day’s Low m7: Change From 50 Day
Moving Average
h: Day’s High m8: Percent Change From 50
Day Moving Average
k1: Last Trade (Realtime) With
Time m3: 50 Day Moving Average
l: Last Trade (With Time) m4: 200 Day Moving Average
l1: Last Trade (Price Only)
t8: 1 yr Target Price

28 | © 2015 Global Association of Risk Professionals. All rights reserved.
Yahoo data fields (cont.)
Misc
w1: Day’s Value Change g1: Holdings Gain Percent
w4: Day’s Value Change
(Realtime) g3: Annualized Gain
p1: Price Paid g4: Holdings Gain
m: Day’s Range g5: Holdings Gain Percent
(Realtime)
m2: Day’s Range (Realtime) g6: Holdings Gain (Realtime)
52 Week Pricing Symbol Info
k: 52 Week High v: More Info
j: 52 week Low j1: Market Capitalization
j5: Change From 52 Week Low j3: Market Cap (Realtime)
k4: Change From 52 week High f6: Float Shares
j6: Percent Change From 52
week Low n: Name
k5: Percent Change From 52
week High n4: Notes
w: 52 week Range s: Symbol
s1: Shares Owned
x: Stock Exchange
j2: Shares Outstanding
29 | © 2015 Global Association of Risk Professionals. All rights reserved.
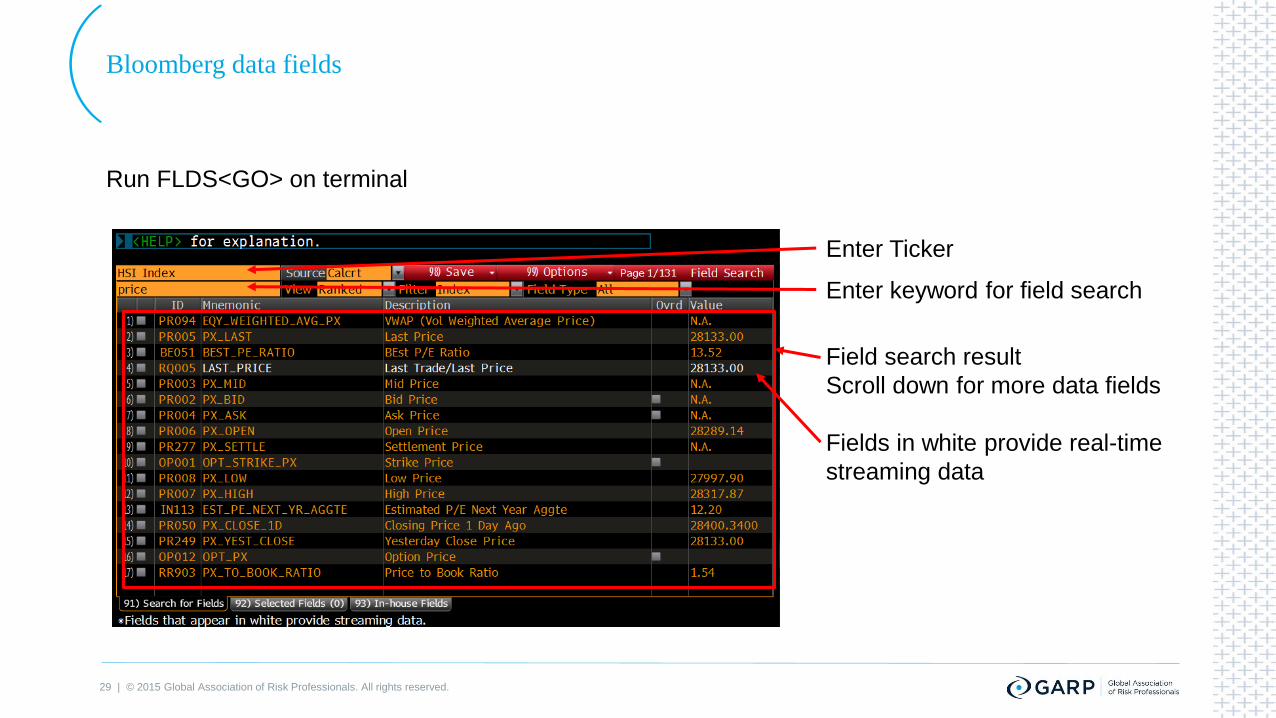
Run FLDS<GO> on terminal
Bloomberg data fields
Enter Ticker
Enter keyword for field search
Field search result
Scroll down for more data fields
Fields in white provide real-time
streaming data
Questions?
“Develop into a lifelong self-learner through voracious reading; cultivate
curiosity and strive to become a little wiser every day”
- Charlie Munger

31 | © 2015 Global Association of Risk Professionals. All rights reserved.
C r e a t i n g a c u l t u r e o f
r i s k a w a r e n e s s ®
Global Association of
Risk Professionals
111 Town Square Place
14th Floor
Jersey City, New Jersey 07310
U.S.A.
+ 1 201.719.7210
2nd Floor
Bengal Wing
9A Devonshire Square
London, EC2M 4YN
U.K.
+ 44 (0) 20 7397 9630
www.garp.org
About GARP | The Global Association of Risk Professionals (GARP) is a not-for-profit global membership organization dedicated to preparing professionals and organizations to make better informed risk decisions. Membership represents over
150,000 risk management practitioners and researchers from banks, investment management firms, government agencies, academic institutions, and corporations from more than 195 countries and territories. GARP administers the Financial Risk
Manager (FRM®) and the Energy Risk Professional (ERP®) Exams; certifications recognized by risk professionals worldwide. GARP also helps advance the role of risk management via comprehensive professional education and training for
professionals of all levels. www.garp.org.