excel-based workbook for quality management …finally the area qpi is calculated corresponding to a...
TRANSCRIPT

Procedia - Social and Behavioral Sciences 174 ( 2015 ) 298 – 304
Available online at www.sciencedirect.com
1877-0428 © 2015 The Authors. Published by Elsevier Ltd. This is an open access article under the CC BY-NC-ND license (http://creativecommons.org/licenses/by-nc-nd/4.0/).Peer-review under responsibility of the Sakarya Universitydoi: 10.1016/j.sbspro.2015.01.661
ScienceDirect
INTE 2014
Excel-based workbook for quality management (EWQM)
Ernesto Nieto Márquez *
aUniversidad de Celaya, Carr. Panamericana km 269 CP 38080. México
Abstract
Since more than a decade, our Quality Management Department has designed and implemented a simple excel-based workbook for quality management (EWQM), which collects values of indicators from the different academic and service areas; it processes them and it finally measures the quality and productivity levels of the academic and service areas of the University.
This system integrates a more complete, accurate, opportune and reliable information, which is processed by the EWQM that calculates the quality and productivity indexes for each academic area and provides feedback to directors on their opportunity areas, which must be considered in their continuous improvement plans © 2014 The Authors. Published by Elsevier Ltd. Peer-review under responsibility of the Sakarya University.
Keywords: Type your keywords here, separated by semicolons ;
1. Introduction
This excel-based workbook for quality management, EWQM, was designed and implemented following the recommendations of the accreditation process for the Federation of Mexican Private Institutions of Higher Education (FIMPES) which the University of Celaya belongs.
According the FIMPES v2, requires the institution to demonstrate that there are planning and evaluation processes that reveal the extent the institution to which meet institutional purposes, mission and vision. This required us to design and implement a system to give fast and reliable responses to these requirements. One of the
* Corresponding author. Tel.: +52 461 6139099 E-mail address: [email protected]
© 2015 The Authors. Published by Elsevier Ltd. This is an open access article under the CC BY-NC-ND license (http://creativecommons.org/licenses/by-nc-nd/4.0/).Peer-review under responsibility of the Sakarya University
299 Ernesto Nieto Márquez / Procedia - Social and Behavioral Sciences 174 ( 2015 ) 298 – 304
strategies of Uniexcel Program, delegated us the responsibility to monitor and evaluate the performance of the University, in order to obtain sufficient and relevant information for decision–making.
This information was later integrated into an Excel workbook, called Excel-based Workbook for Quality Management (EWQM) inspired by the “One Page Management”, in the “Balanced Scorecard” and in the chapter 8 of ISO 9001-2000. (Measurement -Analysis-Improvement)
This instrument integrates performance information (KPI’s) of the different areas of the University, both academic, and services.
The (QMD) operated the Quality Management System in this Excel Workbook has operated for more than 10 years
This system was audited twice by the FIMPES, and other paradigms of quality, without any recommendation or suggestion.
Recently, FIMPES v3 requires the obligation to measure institutional effectiveness and we have stated that our measurement methodology has focused from the beginning on the measurement of the effectiveness to define opportunity or strength areas.
The Director of Planning and Effectiveness, in 2012, delegated to Software Development Department to automate this system, substituting EWQM for a new automated system. But so far this has not been achieved.
2. Objectives Develop and implement an instrument to evaluate the extent to which the educational and educational support
services goals are being achieved. Collect and analyze data and allow to communicate results of relevant outcomes for the improvement of all
university areas. Calculate a quality and productivity index (QPI) to assist as an evaluation criterion of all the academic and service
areas in order to support improvement programs. Identify the main weaknesses of all institutional areas to design their improvement plans. Demonstrate that there are planning and evaluation processes that reveal to what extent the institution fulfills its
purposes, mission and vision. Measure the effectiveness of continuous improvement plans.
3. Methodology
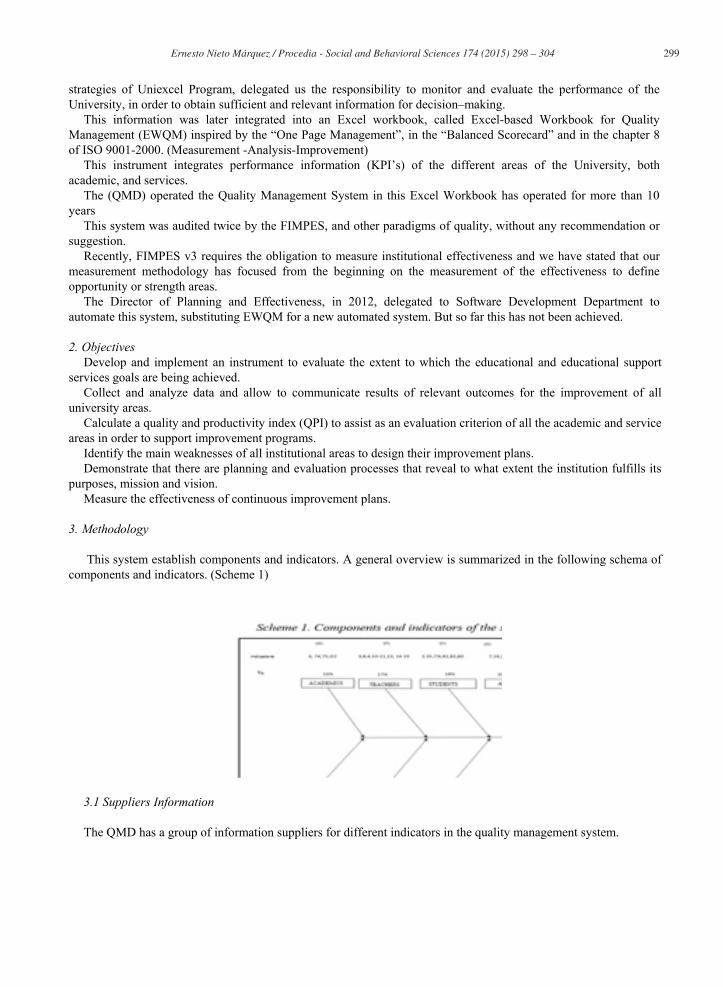
This system establish components and indicators. A general overview is summarized in the following schema of components and indicators. (Scheme 1)
3.1 Suppliers Information
The QMD has a group of information suppliers for different indicators in the quality management system.

300 Ernesto Nieto Márquez / Procedia - Social and Behavioral Sciences 174 ( 2015 ) 298 – 304
These suppliers provide each semester basic information aimed at calculating the values of the different indicators.
Suppliers Information The QMD has a group of information suppliers for different indicators in the quality management system. These suppliers provide each semester basic information aimed at calculating the values of the different
indicators. (Scheme 2)
The indicator values from 2013 were taken directly on a virtual private server (VPS), in order for this information to be completed, well timed and accurate.
The supplier’s information is taken and integrated into a Matrix concentrator, (OPM). (Table1)

301 Ernesto Nieto Márquez / Procedia - Social and Behavioral Sciences 174 ( 2015 ) 298 – 304
On the first page of this Excel Workbook, there is a concentrator matrix in which the columns stand for the different areas of the University and as lines of different indicators to 8 components, specifically: Academics, Teachers, Alumni, Administration, Extension, Research, and Internationalization.
Note that in the blue column we have the institutional goals and column headings the different areas of the institution.
Kaleidoscope with colors, highlights areas of opportunity (in red) and strengths (in green). Table 2.
Area of Opportunity, is considered, when the indicator values that do not meet the institutional goal and green the ones which do meet them.
Thus, with just a glance, you can see globally institutional goals that are being fulfilled. It also allows a preliminary analysis of the areas (columns) and indicators (rows)
3.2 Processing
Each indicator value is subject to a process of calculation, using formulas inspired by the concept of "effectiveness”, as shown in the next flowchart. (Scheme 3)

302 Ernesto Nieto Márquez / Procedia - Social and Behavioral Sciences 174 ( 2015 ) 298 – 304
3.3 Calculation of quality and productivity index (QPI). With the EWQM information, which is integrated the Key Performance Indicators (KPI) the information is
automatically copied to a specific spreadsheet for each area, discarding those items which do not apply. The calculation of QPI considers first the comparison between the institutional goal and the performance
(effectiveness) The score of each indicator is a result of multiplying the effectiveness by the weight. For each academic and service area a sheet with the name of the area is kept. The "personalization” of a sheet for each area, has the advantage that only the indicators that apply will be
considered and no error is introduced QPI final calculation. (Table 3)
Finally the area QPI is calculated corresponding to a quotient, where the denominator is the maximum points and the numerator is the sum of the accumulated points. (Scores)
The maximum value of the QPI for each area that can be reached is 100 points, if the performance achieved in all indicator values equal to or greater than the institutional goal.
This system can easily identify the most important opportunity areas (in red, and in a descending range), which must be taken as the basis for the plans, projects and actions for the improvement process of the following semester.
3.4 Semester summary of quality. At the end of each semester a semiannual quality summary is sent to Rectory. This summary is resultant from
collected and processed information in the EWQM. (Table 4)

303 Ernesto Nieto Márquez / Procedia - Social and Behavioral Sciences 174 ( 2015 ) 298 – 304
4. ResultsThis workbook in Excel, EWQM, shows the following advantages:Emphasizes on the gathering complete, accurate and well-timed indicator values related to each academic and
service area for which suppliers are defined and validated and these provide the required information Identifies strengths and weaknesses for each areas chromatically and direct. Opens an extended period of time for
corrections before sending the final results to Rectory. Its operation is economical because it does not need systemengineers for operation or maintenance.
Quickly calculates quality and productivity indices and provides preliminary QPI accurate, well timed valuessubject to review, correction and updating.
Generates a semiannual quality report to Rectory from the QPI, with which the different areas can be compared and institutional improvement plans can be implemented.
After the failed attempt of Software Development Department, to replace this EWQM with an automaticmanagement system, the advantages of this practical home-made instrument are reasons for reusing this instrument in 2013 and improving its operation with a private web platform.
5. Conclusions
The EWQM, demonstrated to be an effective “one page” quality and productivity administrator” of theinstitutional system. Its usage allowed longitudinal research and presented historical values of relevant indicators andhelped in the strategic planning and continuous improvement of the different areas.
The EWQM, is a summary strategic diagnosis, both: in a quantitative and qualitative approach, area by area,allowing to "measure" with a good level of reliability, the quality and productivity of the university and its different areas, and the degree to which it is meeting institutional objectives and mission.
This instrument allows directors and authorities to easily recognize the quality and productivity index (QPI) andidentify easily numerically and with colors the higher and lower performance to facilitate the improvement processeach semester.
The EWQM, due to its simple design, easiness, and speed for obtaining low cost results showed that it justifies tobe considered as a reliable, standardized, organized quality management system.
It is obvious that this instrument is likely to improve with the support of new technologies of information andcommunication technologies (ICT), but privileging the quality of information, with complete, well-timed, accuratedata and calculation using standardized methods.

304 Ernesto Nieto Márquez / Procedia - Social and Behavioral Sciences 174 ( 2015 ) 298 – 304
This last semester 2013, in order to improve its operability, its standardization and automation we used successfully, a Web platform and select suppliers, who uploaded directly their corresponding indicator values
References FIMPES. (2011). Sistema de acreditación a través del desarrollo y fortalecimiento Institucional. Septiembre 2011. México. Khadem, R y R, Lobert (1991). Administración en una página. Como utilizar la información para lograr sus metas. Edit. Norma. Khadem, R. Recuperado el 10 de junio del 2013, de http://www.riazkhadem.com/sitio/index.php Nieto, G. R. (1992). Balances de operación de los terrenos agrícolas de la Universidad. Universidad de Celaya Nieto, M.E. (2013) Guías para el llenado “LEAD" y “CEAS”. Libros Excel para la autogestión de las áreas académicas de apoyo y servicios.
Universidad de Celaya Nieto, M.E. (2001-2012). LEGC. Libros electrónicos de Gestión de calidad. Dirección de Gestión de Calidad. Universidad de Celaya. Proy-NMX-CC-023-IMNC-2003. Sistemas de Gestión de calidad. Directrices para la aplicación de la Norma NMX-CC-9001-1MNC-2000 en
educación. México.