example interim financial statements - grant … interim financial statements for the half-year...
TRANSCRIPT

Example interim financial statements
Grant Thornton CLEARR Example Ltd For the half-year ended 31 December 2017

Example interim financial statements For the half-year ended 31 December 2017
© 2017 Grant Thornton Australia Limited. All rights reserved. ii
Section Page
Foreword iii
Directors’ Report 1
Auditor’s Independence Declaration 2
Consolidated Statement of Profit or Loss and Other Comprehensive Income 4
Consolidated Statement of Financial Position 7
Consolidated Statement of Changes in Equity 10
Consolidated Statement of Cash Flows 13
Notes to the Condensed Interim Consolidated Financial Statements 15
1 Nature of operations 15
2 General information and basis of preparation 15
3 Significant accounting policies 15
4 Estimates 15
5 Significant events and transactions 16
6 Business combination 16
7 Segment reporting 17
8 Seasonal fluctuations 19
9 Goodwill 19
10 Other intangible assets 20
11 Property, plant and equipment 21
12 Discontinued operations and non-current assets held for sale 21
13 Earnings per share 22
14 Share capital 22
15 Dividends 22
16 Other components of equity 23
17 Provisions 24
18 Contingent liabilities 24
19 Fair value measurement of financial instruments 25
20 Events after the reporting date 27
Directors’ Declaration 29
Independent Auditor’s Review Report 1
Contents

Example interim financial statements For the half-year ended 31 December 2017
© 2017 Grant Thornton Australia Limited. All rights reserved. iii
Welcome to the December 2017 edition of the example interim financial statements. This set of illustrative financial statements is one of many prepared by Grant Thornton to assist you in preparing your own financial statements.
This publication is designed to illustrate the condensed interim financial statements for a listed public company in
line with Australian financial reporting and regulatory requirements. It is based on the activities and results of a
fictitious ASX listed IT entity, Grant Thornton CLEARR Example Ltd, which prepares Australian general purpose
financial statements.
The period ending 31 December 2017 marks the end of relative calm that businesses in Australia have enjoyed
in recent years. With two major new accounting standards on revenue recognition and financial instruments
kicking in from 1 January 2018 and the new leases and income of not-for-profits standards coming into effect
from 1 January 2019, the next couple of years represent enormous change and challenge for Australian entities.
The global push for increasing tax transparency is also having a significant impact on Australian financial
reporting with Significant Global Entities (entities within a group with a consolidated global income of $1 billion or
more) now being required to prepare and lodge general purpose financial statements with the Australian
Taxation Office (ATO) which will then be put on public record by the Australian Securities and Investments
Commission. Furthermore, in July 2017 the Australian Accounting Standards Board published Interpretation 23
Uncertainty over Income Tax Treatments which requires uncertainties relating to income tax treatments to be
reflected in income tax accounting and disclosure of such uncertainties as significant accounting judgements and
estimates. All these changes add to the already complex financial reporting requirements and it is critical that
entities take a proactive approach to navigate through this challenging period.
Our objective in preparing the example financial statements was to illustrate one possible approach to financial
reporting by an entity engaging in transactions that are ‘typical’ across a range of non-specialist sectors.
However, as with any example, this illustration does not envisage every possible transaction and cannot
therefore be regarded as comprehensive.
Likewise, as a reference tool, this publication illustrates disclosures for many common scenarios without
removing disclosures based on materiality. We strongly encourage businesses to get rid of immaterial
disclosures and tailor disclosures to their specific circumstances.
An entity complying with AASB 134 Interim Financial Reporting has a choice of preparing a condensed set of
interim financial statements or a complete set of financial statements. This publication illustrates a condensed set
of interim financial statements.
We have reviewed and updated these financial statements to reflect changes in Australian Accounting Standards
that are effective for the year ending 31 December 2017. However, no account has been taken of any new
developments published after 28 October 2017. The Grant Thornton website contains any updates that are
relevant for 31 December 2017 financial statements, including our Technical Accounting Alerts on “What’s new
for December 2017” and “Accounting standards issued but not yet effective for December 2017”.
We trust this publication will help you work through the upcoming December 2017 reporting season. We
welcome your feedback on the format and content of this publication. Please contact us via email to
[email protected] or get in touch with your local Grant Thornton representative to let us
know your thoughts.
Matt Adam-Smith National Head of Audit & Assurance Grant Thornton Australia Limited November 2017
Foreword

Example interim financial statements For the half-year ended 31 December 2017
© 2017 Grant Thornton Australia Limited. All rights reserved. 1
The Directors of Grant Thornton CLEARR Example Ltd (Grant Thornton CLEARR) present their Report together
with the financial statements of the Consolidated Entity, being Grant Thornton CLEARR (the Company) and its
Controlled Entities (the Group) for the half-year ended 31 December 2017.
Director details
The following persons were Directors of Grant Thornton CLEARR during or since the end of the financial half-
year:
Mr Blake Smith
Ms Beth King
Mr Simon Murphy
Mrs Alison French
Mr William Middleton (appointed 28 November 2017)
Review of operations and financial results
The operating result of the Group has increased to $13.9m (2016: $5.5m); this is mainly due to the cost control
measures implemented during the period which have allowed increased revenue with a lower proportionate cost
base.
Earnings per share have increased during the period to $0.93 (2016: $0.45) which has allowed a dividend to be
declared.
Additional capital raising activities were undertaken during the period which raised $20.3m and allowed the
Group to fund the Sysmagic Limited (Sysmagic) acquisition via a cash settlement as well as positioning the
Group in a strong cash position for 2018 to allow for future acquisitions, if appropriate opportunities arise.
This acquisition that has occurred during the period is in line with the Group’s strategy to increase online sales
capacity.
Goodwill of $2.5m arising on acquisition of Sysmagic (as described in Note 6) is primarily related to the
substantial skill and expertise of Sysmagic’s workforce and expected cost synergies.
A copy of the Auditor’s Independence Declaration as required under s307C of the Corporations Act 2001 is
included on page 2 of this financial report and forms part of this Directors’ Report.
Rounding of amounts
Grant Thornton CLEARR is a type of Company referred to in ASIC Corporations (Rounding in Financial /
Directors’ Reports) Instrument 2016/191 and therefore the amounts contained in this report and in the financial
report have been rounded to the nearest $1,000, or in certain cases, to the nearest dollar.
Signed in accordance with a resolution of the Directors.
Blake Smith
Director
28 February 2018
Directors’ Report
CA 302(a)
CA 306(1)(b)
CA 306 (1)(a)
ASIC Corporations (Rounding in Financial/ Directors’ Reports) Instrument 2016/191
CA 306(3)(a)
CA 306(3)(c)
CA 306(3)(b)

Example interim financial statements For the half-year ended 31 December 2017
© 2017 Grant Thornton Australia Limited. All rights reserved. 2
Level 17, 383 Kent Street
Sydney NSW 2000
Correspondence to:
Locked Bag Q800
QVB Post Office
Sydney NSW 1230
T +61 2 8297 2400
F +61 2 9299 4445
W www.grantthornton.com.au
Auditor’s Independence Declaration to the Directors of Grant Thornton CLEARR Example Ltd In accordance with the requirements of section 307C of the Corporations Act 2001, as lead auditor for the
audit of Grant Thornton CLEARR Example Ltd for the year ended 31 December 2017, I declare that, to
the best of my knowledge and belief, there have been:
a No contraventions of the auditor independence requirements of the Corporations Act 2001 in relation
to the audit; and
b No contraventions of any applicable code of professional conduct in relation to the audit.
Grant Thornton Audit Pty Ltd
Chartered Accountants
AB Partner
Partner - Audit & Assurance
Sydney, 28 February 2018
grantthornton.com.au
Grant Thornton Audit Pty Ltd ACN 130 913 594 a subsidiary or related entity of Grant Thornton Australia Ltd ABN 41 127 556 389 ‘Grant Thornton’ refers to the brand under which the Grant Thornton member firms provide assurance, tax and advisory services to their clients and/or refers to one or more member firms, as the context requires. Grant Thornton Australia Ltd is a member firm of Grant Thornton International Ltd (GTIL). GTIL and the member firms are not a worldwide partnership. GTIL and each member firm is a separate legal entity. Services are delivered by the member firms. GTIL does not provide services to clients. GTIL and its member firms are not agents of, and do not obligate one another and are not liable for one another’s acts or omissions. In the Australian context only, the use of the term ‘Grant Thornton’ may refer to Grant Thornton Australia Limited ABN 41 127 556 389 and its Australian subsidiaries and related entities. GTIL is not an Australian related entity to Grant Thornton Australia Limited.
Liability limited by a scheme approved under Professional Standards Legislation.
Auditor’s Independence
Declaration

Example interim financial statements For the half-year ended 31 December 2017
© 2017 Grant Thornton Australia Limited. All rights reserved. 3
g
Guidance Note: Consolidated Statement of Profit or Loss and Other Comprehensive
Income In accordance with AASB 101, the statement of profit or loss and other comprehensive income may be presented in
one of the following ways:
in a single statement: statement of profit or loss and other comprehensive income; or
in two statements: a statement of profit or loss and a statement of comprehensive income
The Example Financial Statements illustrate a statement of profit or loss and other comprehensive income (i.e., a
single statement). A two (2) statement presentation is shown in the Appendices of the Listed Public Example
Financial Statements for the financial year ending 31 December 2017.
AASB 101.82(a)-(ea) provides a list of the minimum items to be presented on the face of the statement of profit or loss
and other comprehensive income. Where relevant, references to AASB 101 and other AASB requirements are
included on the left hand side of the consolidated statement of profit or loss and other comprehensive income. There
may be situations where additional line items, headings and subtotals need to be included. AASB 101.85 requires an
entity to present such additional items on the face of the statement of profit or loss and other comprehensive income
when such presentation is relevant to an understanding of the entity’s financial performance.
AASB 101 allows an entity to use either the ‘nature of expense’ or the ‘function of expense’ format, whichever is
reliable and more relevant (AASB 101.99). This publication provides an example of the ‘nature of expense’ format.
AASB 134.11 requires the presentation of both basic and diluted earnings per share on the face of the statement that
presents the components of profit or loss. Where an entity presents a statement of profit or loss and statement of
comprehensive income, the basic and diluted earnings per share figures should be presented on the face of the
statement of profit or loss (AASB 134.11A).
AASB 134 does not specifically require earnings per share figures separately for continuing, discontinued and total
operations. AASB 133 Earnings per Share requires the annual financial statements to show, on the face of the
statement of profit or loss and other comprehensive income, the basic and diluted earnings per share for continuing
operations and the total from continuing and discontinued operations (AASB 133.66). The figure for discontinued
operations is required to be shown, in the annual financial statements, either on the face of the statement of profit or
loss and other comprehensive income or in the notes to those financial statements (AASB 133.68). Where an entity
presents items of profit or loss in a separate statement, it presents basic and diluted earnings per share for the
discounted operations in that separate statement or in the notes (AASB 133.86A).
AASB 134 does not specify which figures should be reported. However in our opinion it should be the earnings per
share figures for total operations (as a minimum). Where the Directors decide to show earnings per share from
continuing or discontinued operations on the face of the statement of profit or loss and other comprehensive income,
in our opinion the earnings per share figures for total operations should also be shown on the face of the statement of
profit or loss and other comprehensive income.
AASB 101.82A requires an entity to present line items for amounts of other comprehensive income in the period,
classified by nature (including share of the other comprehensive income of associates and joint ventures accounted
for using the equity method).
AASB 101 also requires items of Other Comprehensive Income (OCI) to be grouped into what will not be reclassified
subsequently to profit or loss and those that may be reclassified subsequently to profit or loss when specific conditions
are met (AASB 101.82A).
According to AASB 101.90, an entity discloses the amount of income tax relating to each component of other
comprehensive income, either on the face of the statement of comprehensive income or in the notes. If an entity
chooses the second alternative, it shall allocate the tax between the items that might be reclassified subsequently to
the profit or loss section and those that will not be reclassified subsequently to the profit or loss section
(AASB 101.91).

Example interim financial statements For the half-year ended 31 December 2017
© 2017 Grant Thornton Australia Limited. All rights reserved. 4
For the half-year ended 31 December 2017
AASB 101.51(c) Notes 31 Dec 2017 31 Dec 2016
AASB 101.51(d-e) $’000 $’000
AASB 101.82(a) Revenue 8 116,846 89,063
AASB 101.85 Other income 202 185
AASB 101.85 Changes in inventories (5,066) (3,148)
AASB 101.85 Costs of material (23,403) (18,638)
AASB 101.85 Employee benefits expense (61,532) (51,076)
AASB 101.85 Change in fair value of investment property 55 125
AASB 101.85 Depreciation, amortisation and impairment of non-financial assets (3,906) (3,158)
AASB 101.85 Other expenses (4,879) (5,848)
18,317 7,505
AASB 101.82(c) Share of profit from equity accounted investments 45 29
AASB 101.82(b) Finance costs (1,547) (1,585)
AASB 101.85 Finance income 1,050 465
AASB 101.85 Other financial items 1,878 1,583
Profit before tax 19,743 7,997
AASB 101.82(d) Tax expense (5,945) (2,458)
Profit for the period from continuing operations 13,798 5,539
AASB 101.82(ea) Profit/(loss) from the period from discontinued operations 12 96 8
AASB 101. 81A(a) Profit for the period 13,894 5,547
AASB 101.82(g) Other comprehensive income:
AASB 101.82A(a) Items that will not be reclassified subsequently to profit or loss:
Re-measurement of net defined benefit liability (1,771) 1,915
Income tax on items that will not be reclassified subsequently to profit or loss 16 531 (575)
AASB 101.82A(b) Items that may be reclassified subsequently to profit or loss
Cash flow hedging:
AASB 7.23(c-d) current year gains / (losses) 215 287
AASB 101.92 reclassification to profit or loss 157 178
Available-for-sale financial assets:
AASB 7.20(a)(ii) current year gains / (losses) 35 (22)
AASB 1.92 reclassification to profit or loss 24 (32)
AASB 121.52(b) Exchange differences on translating foreign operations (575) (414)
AASB 101.90 Income tax on items that may be reclassified subsequently to profit or loss 16 173 125
Other comprehensive income for the period, net of tax 16 (1,211) 1,462
AASB 101.82(i) Total comprehensive income for the period 12,683 7,009
Consolidated Statement of Profit or Loss and Other Comprehensive
Income

Example interim financial statements For the half-year ended 31 December 2017
© 2017 Grant Thornton Australia Limited. All rights reserved. 5
For the half-year ended 31 December 2017
AASB 101.51(c), Notes 31 Dec 2017 31 Dec 2016 AASB 101.51(d-e) $’000 $’000
Profit for the period attributable to:
AASB 101.83(a)(i) non-controlling interest 67 57
AASB 101.83(a)(ii) owners of the parent 13,827 5,490
13,894 5,547
Total comprehensive income for the period attributable to:
AASB 101.83(b)(i) non-controlling interest 67 57
AASB 101.83(a)(ii) owners of the parent 12,616 6,952
12,683 7,009
Notes 31 Dec 2017 31 Dec 2016 $ $
AASB 134.11, 11A Earnings per share 13
AASB 133.67A Basic earnings per share
AASB 133.66 Earnings from continuing operations 0.92 0.45
AASB 133.68A Earnings from discontinued operations 0.01 -
AASB 133.66 Total 0.93 0.45
AASB 133.67A Diluted earnings per share
AASB 133.66 Earnings from continuing operations 0.92 0.45
AASB 133.68A Earnings from discontinued operations 0.01 -
AASB 133.66 Total 0.93 0.45
Consolidated Statement of Profit or Loss and Other Comprehensive
Income (continued)

Example interim financial statements For the half-year ended 31 December 2017
© 2017 Grant Thornton Australia Limited. All rights reserved. 6
Guidance Note: Statement of Financial Position As set out in paragraph 8, AASB 134 Interim Financial Reporting requires that condensed interim financial statements
contain as a minimum:
a condensed statement of financial position
a condensed statement of profit or loss and other comprehensive income, presented either as a condensed single
statement or a condensed separate statement of profit or loss and a condensed statement of comprehensive
income
a condensed statement of changes in equity
a condensed statement of cash flows; and
selected explanatory notes
According to AASB 134.20, the interim financial statements (condensed or complete) shall include:
a statement of financial position as at the end of the current interim period and a comparative statement of financial
position as at the end of the immediately preceding financial year
either:
two (2) separate statements, being a statement of profit or loss and statement of comprehensive income for the
current interim period and cumulatively for the current financial year to date, with comparatives for the
comparable interim period (i.e., comparable interim period and financial year to date); or
a single statement of profit or loss and other comprehensive income for the current interim period, and
cumulatively for the current financial year to date, with comparatives for the comparable interim period (i.e.,
comparable interim period and financial year to date)
a statement of changes in equity showing changes in equity cumulatively for the current financial year to date, with
a comparative statement for the comparable year-to-date period of the immediately preceding financial year; and
a statement of cash flows for the current financial year to date, with a comparative statement for the comparable
year-to-date period of the immediately preceding financial year
AASB 101 Presentation of Financial Statements requires an additional statement of financial position at the start of the
comparative period in certain circumstances (AASB 101.39). AASB 134 does not require, and therefore these
Example Interim Financial Statements do not include, a statement of financial position.
Presentation of the interim statement of profit or loss and other comprehensive income either as a single statement or
two (2) separate statements should follow the presentation in the annual financial statements (AASB 134.8A). The
Group presents a single consolidated statement of profit or loss and other comprehensive income in its annual
financial statements. In addition, the Group’s consolidated statement of profit or loss and other comprehensive
income illustrates an example of the ‘nature of expense format’. Accordingly, these Example Financial Statements
follow the same approach. The alternative methods of presenting two (2) separate statements being a statement of
profit or loss and a statement of comprehensive income, presenting a statement of profit or loss illustrating the
‘function of expense format’ are included as appendices to the Example Listed Public Financial Statements for the
financial year ending 31 December.
AASB 134.10 requires the interim statement to include, as a minimum, each of the headings and subtotals that were
included in the most recent annual financial statements.
AASB 101.54 provides a list of the minimum items to be presented on the face of the statement of financial position.
Where relevant, references to AASB 101 and Australian Accounting Standards are included on the left hand side of
the consolidated statement of financial position. There may be situations where additional line items, headings and
subtotals may also need to be included. AASB 101.55 requires an entity to present additional items on the face of the
statement of financial position when such presentation is relevant to an understanding of the entity’s financial position.

Example interim financial statements For the half-year ended 31 December 2017
© 2017 Grant Thornton Australia Limited. All rights reserved. 7
As at 31 December 2017
Notes 31 Dec 2017 30 Jun 2017 AASB 101.51(c) $’000 $’000
AASB 101.51(d-e) Assets
AASB 101.66 Current
AASB 101.54(i) Cash and cash equivalents 42,539 34,789
AASB 101.54(h) Trade and other receivables 28,746 33,629
AASB 101.54(g) Inventories 32,586 18,548
AASB 101.55 Derivative financial instruments 598 582
AASB 101.54(d) Other short-term financial assets 689 655
105,158 88,203
AASB 101.54(j) Assets and disposal group classified as held for sale 12 - 103
AASB 101.60 Current assets 105,158 88,306
AASB 101.66 Non-current
AASB 101.57 Goodwill 9 7,397 5,041
AASB 101.54(c) Other intangible assets 10 25,950 17,424
AASB 101.54(a) Property, plant and equipment 11 26,281 22,439
AASB 101.54(e), AASB 128.38 Investments accounted for using the equity method 475 430
AASB 101.54(b) Investment property 12,732 12,662
AASB 101.54(d) Other long-term financial assets 3,802 3,765
AASB 101.60 Non-current assets 76,637 61,761
AASB 101.55 Total assets 181,795 150,067 The accompanying notes form part of these financial statements.
Consolidated Statement of Financial
Position

Example interim financial statements For the half-year ended 31 December 2017
© 2017 Grant Thornton Australia Limited. All rights reserved. 8
As at 31 December 2017
AASB 101.57 Notes 31 Dec 2017 30 Jun 2017
AASB 101.51(d-e) $’000 $’000
AASB 101.51(c) Liabilities
AASB 101.60, AASB 101.69 Current
AASB 101.54(k) Trade and other payables 10,466 9,059
AASB 101.54(m) Borrowings 3,986 4,815
AASB 101.54(l) Provisions 17 615 1,215
AASB 101.55 Pension and other employee obligations 1,625 1,467
AASB 101.54(n) Current tax liabilities 3,325 3,102
AASB 101.55 Other liabilities 3,286 2,758
23,303 22,416
AASB 101.54(p), AASB 5.38 Liabilities included in disposal group held for sale - -
Current liabilities 23,303 22,416
AASB 101.60, AASB 101.69 Non-current
AASB 101.54(k) Trade and other payables 5,142 8,424
AASB 101.54(m) Borrowings 19,768 21,000
AASB 101.55 Pension and other employee obligations 11,788 10,386
AASB 101.54(o), AASB 101.56 Deferred tax liabilities 6,241 1,907
AASB 101.55 Other liabilities 1,854 2,020
Non-current liabilities 44,793 43,737
AASB 101.55 Total liabilities 68,096 66,153
Net assets 113,699 83,914
Equity
Equity attributable to owners of the parent:
AASB 101.54(r) Share capital 14 55,865 33,415
AASB 101.54(r) Share option reserve 1,031 764
AASB 101.78(e) Other components of equity 16 650 621
AASB 101.54(r) Retained earnings 55,373 48,401
112,919 83,201
AASB 101.54(q) Non-controlling interest 780 713
Total equity 113,699 83,914
The accompanying notes form part of these financial statements.
Consolidated Statement of Financial
Position (continued)

Example interim financial statements For the half-year ended 31 December 2017
© 2017 Grant Thornton Australia Limited. All rights reserved. 9
Guidance Note: Consolidated Statement of Changes in Equity AASB 134.10 requires the interim statement to include, as a minimum, each of the headings and subtotals that were
included in the most recent annual financial statements.
AASB 101.106 provides a list of the required items to be presented on the face of the statement of changes in equity.
Where relevant, references to AASB 101 and other Australian Accounting Standards requirements are included on the
left hand side of the consolidated statement of changes in equity.
AASB 101.106 provides that entities have a choice to present the required reconciliations for each component of other
comprehensive income (OCI) either:
a In the statement of changes in equity; or
b In the notes to the financial statements (AASB 101.106(d)(ii) and AASB 101.106A).
These Example Financial Statements present the reconciliations for each component of other comprehensive
income in the notes to the financial statements. This reduces duplicated disclosures and presents more clearly the
overall changes in equity.
Example interim financial statements For the half-year ended 31 December 2017
© 2017 Grant Thornton Australia Limited. All rights reserved. 10
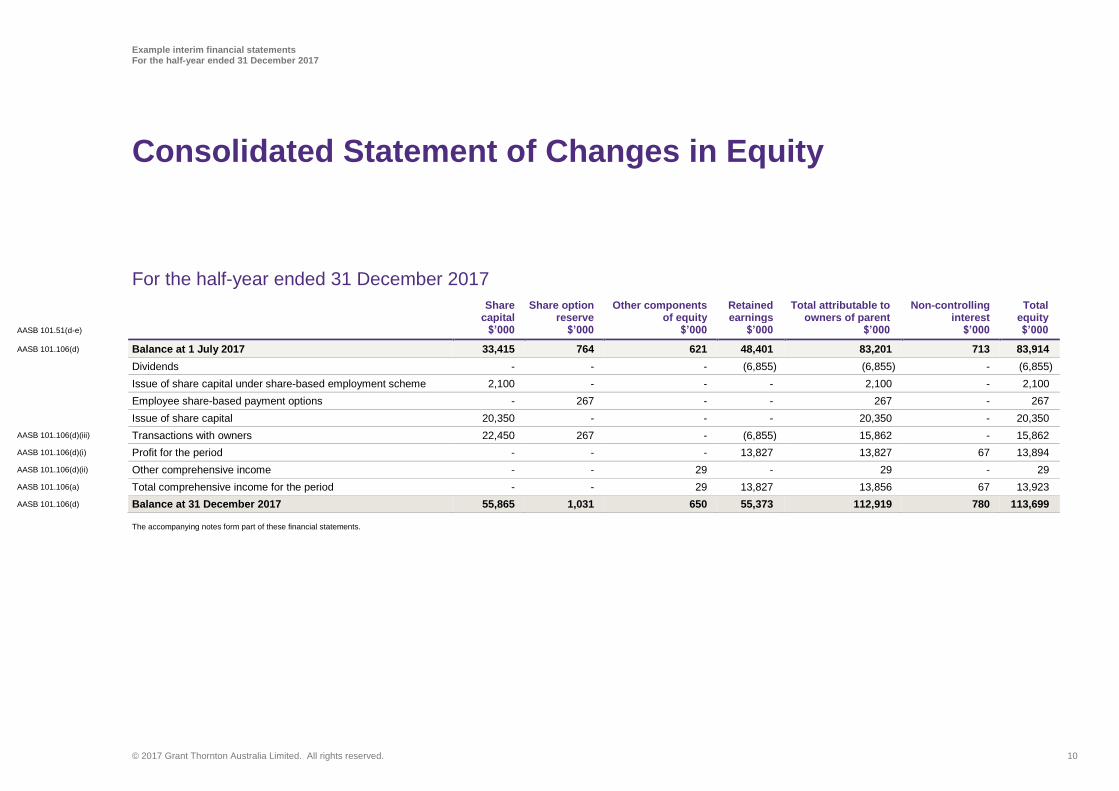
For the half-year ended 31 December 2017
Share
capital Share option
reserve Other components
of equity Retained earnings
Total attributable to owners of parent
Non-controlling interest
Total equity
AASB 101.51(d-e) $’000 $’000 $’000 $’000 $’000 $’000 $’000
AASB 101.106(d) Balance at 1 July 2017 33,415 764 621 48,401 83,201 713 83,914
Dividends - - - (6,855) (6,855) - (6,855)
Issue of share capital under share-based employment scheme 2,100 - - - 2,100 - 2,100
Employee share-based payment options - 267 - - 267 - 267
Issue of share capital 20,350 - - - 20,350 - 20,350
AASB 101.106(d)(iii) Transactions with owners 22,450 267 - (6,855) 15,862 - 15,862
AASB 101.106(d)(i) Profit for the period - - - 13,827 13,827 67 13,894
AASB 101.106(d)(ii) Other comprehensive income - - 29 - 29 - 29
AASB 101.106(a) Total comprehensive income for the period - - 29 13,827 13,856 67 13,923
AASB 101.106(d) Balance at 31 December 2017 55,865 1,031 650 55,373 112,919 780 113,699
The accompanying notes form part of these financial statements.
Consolidated Statement of Changes in Equity
Example interim financial statements For the half-year ended 31 December 2017
© 2017 Grant Thornton Australia Limited. All rights reserved. 11
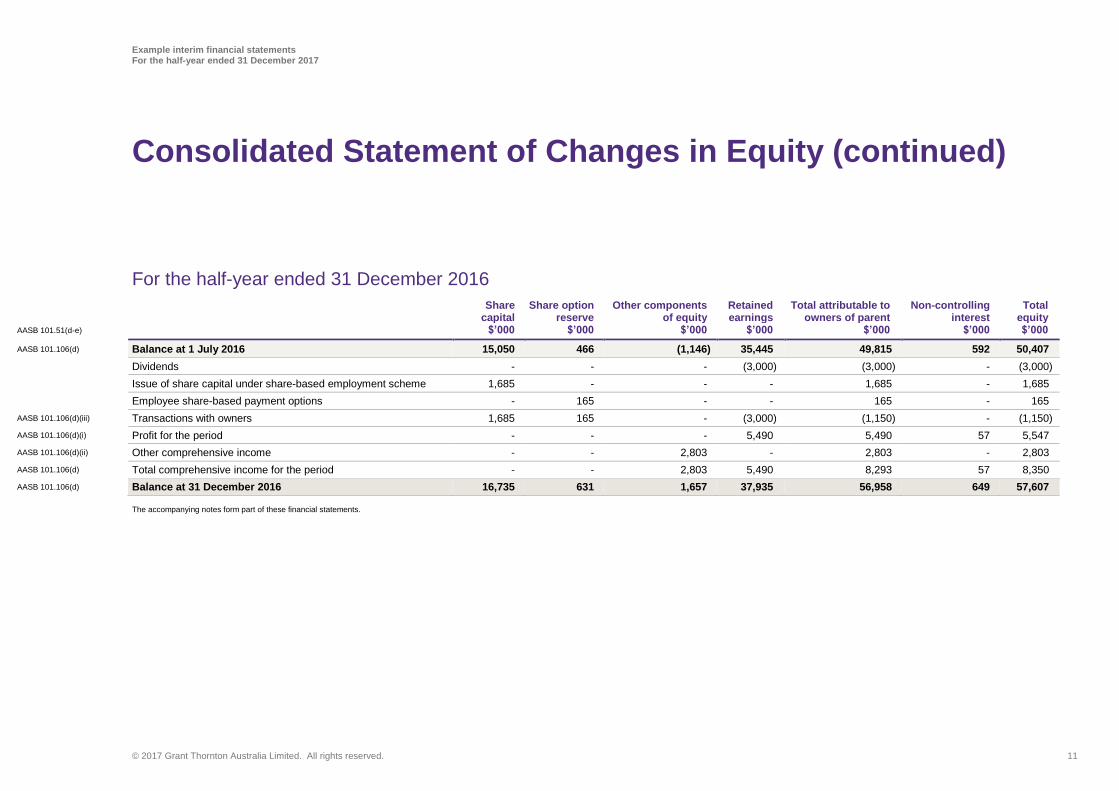
For the half-year ended 31 December 2016
Share
capital Share option
reserve Other components
of equity Retained earnings
Total attributable to owners of parent
Non-controlling interest
Total equity
AASB 101.51(d-e) $’000 $’000 $’000 $’000 $’000 $’000 $’000
AASB 101.106(d) Balance at 1 July 2016 15,050 466 (1,146) 35,445 49,815 592 50,407
Dividends - - - (3,000) (3,000) - (3,000)
Issue of share capital under share-based employment scheme 1,685 - - - 1,685 - 1,685
Employee share-based payment options - 165 - - 165 - 165
AASB 101.106(d)(iii) Transactions with owners 1,685 165 - (3,000) (1,150) - (1,150)
AASB 101.106(d)(i) Profit for the period - - - 5,490 5,490 57 5,547
AASB 101.106(d)(ii) Other comprehensive income - - 2,803 - 2,803 - 2,803
AASB 101.106(d) Total comprehensive income for the period - - 2,803 5,490 8,293 57 8,350
AASB 101.106(d) Balance at 31 December 2016 16,735 631 1,657 37,935 56,958 649 57,607
The accompanying notes form part of these financial statements.
Consolidated Statement of Changes in Equity (continued)

Example interim financial statements For the half-year ended 31 December 2017
© 2017 Grant Thornton Australia Limited. All rights reserved. 12
Guidance Note: Consolidated Statement of Cash Flows AASB 134.10 requires the interim statement to include, as a minimum, each of the headings and subtotals that were
included in the most recent annual financial statements. Consistent with the Group’s annual financial statements, the
interim consolidated statement of cash flows is prepared using the direct method in accordance with AASB 107.18(a).
The statement of cash flows can also be prepared using the indirect method (AASB 107.18(b)). This alternative
method is included in the appendices to Example Listed Public Financial Statements for the financial year ending
31 December 2017.
Where relevant, references to AASB 107 and other Australian Accounting Standards are included on the left hand
side of the consolidated statement of cash flows.
Example interim financial statements For the half-year ended 31 December 2017
© 2017 Grant Thornton Australia Limited. All rights reserved. 13
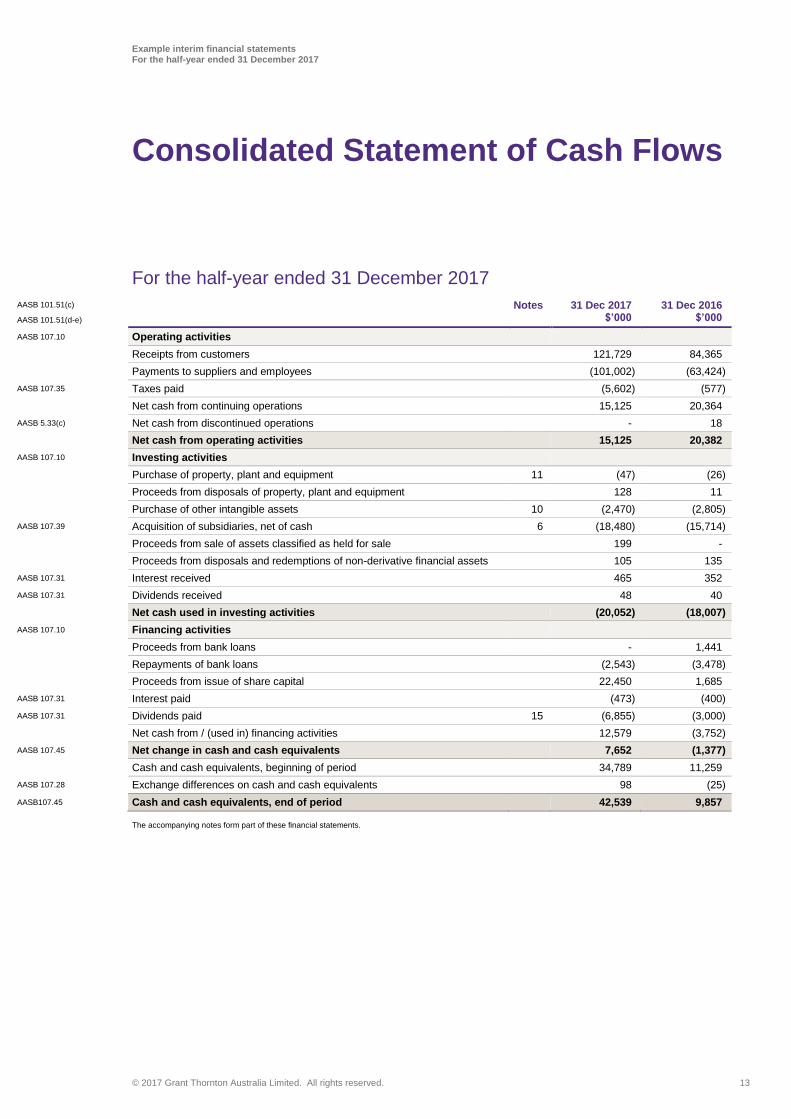
For the half-year ended 31 December 2017
AASB 101.51(c) Notes 31 Dec 2017 31 Dec 2016
AASB 101.51(d-e) $’000 $’000
AASB 107.10 Operating activities
Receipts from customers 121,729 84,365
Payments to suppliers and employees (101,002) (63,424)
AASB 107.35 Taxes paid (5,602) (577)
Net cash from continuing operations 15,125 20,364
AASB 5.33(c) Net cash from discontinued operations - 18
Net cash from operating activities 15,125 20,382
AASB 107.10 Investing activities
Purchase of property, plant and equipment 11 (47) (26)
Proceeds from disposals of property, plant and equipment 128 11
Purchase of other intangible assets 10 (2,470) (2,805)
AASB 107.39 Acquisition of subsidiaries, net of cash 6 (18,480) (15,714)
Proceeds from sale of assets classified as held for sale 199 -
Proceeds from disposals and redemptions of non-derivative financial assets 105 135
AASB 107.31 Interest received 465 352
AASB 107.31 Dividends received 48 40
Net cash used in investing activities (20,052) (18,007)
AASB 107.10 Financing activities
Proceeds from bank loans - 1,441
Repayments of bank loans (2,543) (3,478)
Proceeds from issue of share capital 22,450 1,685
AASB 107.31 Interest paid (473) (400)
AASB 107.31 Dividends paid 15 (6,855) (3,000)
Net cash from / (used in) financing activities 12,579 (3,752)
AASB 107.45 Net change in cash and cash equivalents 7,652 (1,377)
Cash and cash equivalents, beginning of period 34,789 11,259
AASB 107.28 Exchange differences on cash and cash equivalents 98 (25)
AASB107.45 Cash and cash equivalents, end of period 42,539 9,857
The accompanying notes form part of these financial statements.
Consolidated Statement of Cash Flows

Example interim financial statements For the half-year ended 31 December 2017
© 2017 Grant Thornton Australia Limited. All rights reserved. 14
Guidance Note: Notes to the Consolidated Interim Financial Statements Where an entity’s interim financial report is in compliance with AASB 134 that fact shall be disclosed (AASB 134.19).
Where a condensed set of financial statements is prepared, the basis of preparation will need to refer to the fact that
these interim financial statements are ‘condensed’. An interim financial report shall not be described as complying with
Australian Accounting Standards unless it complies with all of the requirements of Australian Accounting Standards.
Interim financial reports are prepared assuming that the users of such reports have access to the most recent annual
financial report of the entity. Consequently, disclosures in the interim financial report need not duplicate previously
reported information (AASB 134.6). The information to be disclosed in the notes to the condensed interim financial
statements is set out in AASB 134.16A.
In addition, AASB 134.15 requires disclosure of events and transactions that are significant to an understanding of the
changes in the financial position and performance of an entity since the end of the last annual reporting period. The
guidance clarifies this requirement and adds some examples of events and transactions which may require disclosure,
if significant (AASB 134.15B).
This example interim report presents selected explanatory notes that are intended to assist users in understanding the
results of operations of the Group for the current interim period. As with any example, it does not envisage every
possible transaction and cannot therefore be regarded as comprehensive. Also, depending on the circumstances,
certain of these disclosures might be regarded either as voluntary or as necessary to meet the general requirements
of AASB 134.
The disclosures in the example notes to the interim financial statements follow the format of the disclosures in the
Group’s annual financial statements in so far as these disclosures are required by AASB 134. Where relevant,
references to AASB 134 and other Australian Accounting Standards are included on the left hand side of the
disclosures.

Example interim financial statements For the half-year ended 31 December 2017
© 2017 Grant Thornton Australia Limited. All rights reserved. 15
1 Nature of operations
Grant Thornton CLEARR Example Ltd and Subsidiaries’ (the Group) principal activities include the development,
consulting, sale and service of customised IT and telecommunication systems.
The Group provides phone and intranet based in-house applications including the integration of mobile end
devices into new and existing IT and telecommunication structures. By integrating these activities the Group acts
as a one-stop-shop for modern day communication requirements of small to medium sized companies. Services
include consulting activities that concentrate on the design of combined IT and telecommunication systems for
clients. The Group also delivers IT and telecommunication solutions specifically designed for the customer
through modification of complex equipment. The Group sells the hardware and software products of the Group’s
business partners and delivers extensive after-sale service and maintenance for these products. Refer to Note 7
for further information about the Group’s operating segments.
2 General information and basis of preparation
The condensed interim consolidated financial statements (the interim financial statements) of the Group are for
the six months ended 31 December 2017 and are presented in Australian Dollars ($AUD), which is the functional
currency of the Parent Company. These general purpose interim financial statements have been prepared in
accordance with the requirements of the Corporations Act 2001 and AASB 134 Interim Financial Reporting. They
do not include all of the information required in annual financial statements in accordance with Australian
Accounting Standards, and should be read in conjunction with the consolidated financial statements of the Group
for the year ended 30 June 2017 and any public announcements made by the Group during the half-year in
accordance with continuous disclosure requirements arising under the Australian Securities Exchange Listing
Rules and the Corporations Act 2001.
The interim financial statements have been approved and authorised for issue by the Board of Directors on
28 February 2018.
3 Significant accounting policies
The interim financial statements have been prepared in accordance with the same accounting policies1 adopted
in the Group’s last annual financial statements for the year ended 30 June 2017.
The accounting policies have been applied consistently throughout the Group for the purposes of preparation of
these interim financial statements.
4 Estimates
When preparing the interim financial statements, management undertakes a number of judgements, estimates
and assumptions about recognition and measurement of assets, liabilities, income and expenses. The actual
results may differ from the judgements, estimates and assumptions made by management, and will seldom equal
the estimated results.
1 AASB 134.28 requires the use of the discrete period approach. This requires that items of income and expenses should be recognised and measured on a basis
consistent with that used in preparing the annual financial statements, and that no adjustments should be made for events expected to occur subsequent to the end of the interim period. AASB 134.28 notes that the frequency of an entity’s reporting should not affect its annual results. There are however some situations where annual reporting can be altered. One example is impairment of goodwill. Interpretation 10 Interim Financial Reporting and Impairment notes that an entity shall not reverse an impairment loss recognised in a previous interim period even if the impairment loss would not have been recognised had the impairment assessment been made only at the end of the annual reporting period (Interpretation 10.8). The discrete period approach is also problematic in the context of income taxes, which are generally measured based on the taxable profit of an annual period. Accordingly, AASB 134 requires that interim period income tax is accrued using the tax rate that would be applicable to expected total annual earnings. The estimated average annual effective income tax rate is applied to the pre-tax income of the interim period (AASB 134.B12).
Notes to the Condensed Interim
Consolidated Financial Statements
AASB 101.51 (a) AASB 101.51 (b)
AASB 101.138 (b)
AASB 134.3 AASB 134.19
AASB 110.17
AASB 134.16A(a) AASB 108.28
AASB 134.41 AASB 134.16A(d)

Example interim financial statements For the half-year ended 31 December 2017
© 2017 Grant Thornton Australia Limited. All rights reserved. 16
The judgements, estimates and assumptions applied in the interim financial statements, including the key
sources of estimation uncertainty were the same as those applied in the Group’s last annual financial statements
for the year ended 30 June 2017. The only exception is the estimate of the provision for income taxes which is
determined in the interim financial statements using the estimated average annual effective income tax rate
applied to the pre-tax income of the interim period.
5 Significant events and transactions
The Group’s management believes that the Group is well positioned despite the continuing difficult economic
circumstances. Factors contributing to the Group’s strong position are:
no significant decline in order intake experienced on larger projects; further, the Group has several long-term
contracts with a number of its customers
the Group does not expect to need additional borrowing facilities in the next 12 months as a result of its
significant financial resources, existing facilities and strong liquidity reserves. The Group has significant
headroom to comply with its debt covenants
the Group’s major customers have not experienced financial difficulties. Credit quality of trade receivables as
at 31 December 2017 is considered to be good.
Overall, the Group is in a strong position despite the current economic environment, and has sufficient capital
and liquidity to service its operating activities and debt. The Group’s objectives and policies for managing capital,
credit risk and liquidity risk are described in its recent annual financial statements.
6 Business combination
On 5 October 2017, the Group acquired 100% of the issued share capital and voting rights of Sysmagic Limited
(Sysmagic), a Company based in the United Kingdom that operates within the service segment. The objective of
the acquisition is to further increase the Group’s market share in providing customised IT and telecommunication
systems services.
Details of the business combination are as follows:
$’000
AASB 3.B64(f) Fair value of consideration transferred
AASB3.B64(f)(i) Amount settled in cash 18,500
AASB 107.40(a), AASB 3.B64(i) Recognised amounts of identifiable net assets
AASB 107.40(d) Property, plant and equipment 5,818
Intangible assets 8,585
Total non-current assets 14,403
Inventories 7,500
Trade and other receivables 4,449
AASB 107.40(c) Cash and cash equivalents 324
Total current assets 12,273
Borrowings (2,543)
Deferred tax liabilities (1,335)
Total non-current liabilities (3,878)
Provisions (780)
Other liabilities (1,855)
Trade and other payables (4,165)
Total current liabilities (6,800)
AASB 134.28 AASB 134.B12
AASB 134.15 AASB 134.15C
AASB 134.16A(i) AASB 3.B64(a)-(d)

Example interim financial statements For the half-year ended 31 December 2017
© 2017 Grant Thornton Australia Limited. All rights reserved. 17
$’000
Identifiable net assets 15,998
Goodwill on acquisition 2,502
AASB 107.40(b) Consideration transferred settled in cash 18,500
AASB 107.40(c) Cash and cash equivalents acquired (324)
AASB 107.42 Net cash outflow on acquisition 18,176
Acquisition costs charged to expenses 304
Net cash paid relating to the acquisition 18,480
6.1 Consideration transferred
Acquisition-related costs amounting to $304,000 are not included as part of consideration transferred and have
been recognised as an expense in the consolidated statement of profit or loss and other comprehensive income,
as part of other expenses.
6.2 Identifiable net assets
The fair values of the identifiable intangible assets have been determined provisionally at 31 December 2017,
because the acquisition was completed late in the period. The Group is currently obtaining the information
necessary to finalise its valuation.
The fair value of the trade and other receivables acquired as part of the business combination amounted to
$4,449,000, with a gross contractual amount of $4,569,000. As of the acquisition date, the Group’s best estimate
of the contractual cash flow not expected to be collected amounted to $120,000.
6.3 Goodwill
The goodwill that arose on the combination can be attributed to the synergies expected to be derived from the
combination and the value of the workforce of Sysmagic which cannot be recognised as an intangible asset.
Goodwill has been allocated to cash-generating units at 31 December 2017 and is attributable to the service
segment. The goodwill that arose from this business combination is not expected to be deductible for tax
purposes.
6.4 Sysmagic’s contribution to the Group’s results
Sysmagic contributed $12,232,000 and $1,954,000 to the Group’s revenues and profits, respectively from the
date of the acquisition to 31 December 2017. Had the acquisition occurred on 1 July 2017, the Group’s revenue
for the period to 31 December 2017 would have been $128,386,000 and the Group’s profit for the period would
have been $15,726,000.
7 Segment reporting
Management identifies its operating segments based on the Group’s service lines, which represent the main
products and services provided by the Group. The Group’s three (3) main operating segments are:
consulting: engaged in the sale, customisation and integration of IT and telecommunication systems
service: involved in the maintenance of telecommunication systems
retail segment: engaged in the sale of hardware and software products through the internet
Each of these operating segments is managed separately as each service line requires different technologies
and other resources, as well as marketing approaches. These operating segments are monitored and strategic
decisions are made on the basis of adjusted segment operating results.
AASB 3.B64(m)
AASB 3.B67(a)
AASB 3.B64(h)(ii)
AASB 3.B64(e) AASB 136.133 AASB 3.B64(k)
AASB 3.B64 (q)(i-ii)
AASB 134.16A(g)

Example interim financial statements For the half-year ended 31 December 2017
© 2017 Grant Thornton Australia Limited. All rights reserved. 18
In addition, two minor operating segments, for which the quantitative thresholds for separate disclosures have
not been met, are currently combined below under ‘other’. The main sources of revenue for these operating
segments are sale and disposal of used IT equipment.
During the six month period to 31 December 2017, there have been no changes from prior periods in the
measurement methods used to determine operating segments and reported segment profit or loss.
The revenues and profit generated by each of the Group’s operating segments and segment assets are
summarised as follows:
Six months to 31 December 2017 Consulting Service Retail Other Total 2017 2017 2017 2017 2017 $’000 $’000 $’000 $’000 $’000
Revenue
AASB 8.23(a) From external customers 56,216 21,435 36,576 2,069 116,296
Discontinued operations - - - - -
AASB 8.23(b) From other segments 346 - - - 346
Segment revenues 56,562 21,435 36,576 2,069 116,642
AASB 8.23 Segment operating profit 16,977 2,827 2,175 112 22,091
AASB 8.23 Segment assets 73,817 28,146 48,028 3,037 153,028
Six months to 31 December 2016 Consulting Service Retail Other Total 2016 2016 2016 2016 2016 $’000 $’000 $’000 $’000 $’000
Revenue
AASB 8.23(a) From external customers 47,843 7,832 31,129 1,761 88,565
Discontinued operations - - 7,832 - 7,832
AASB 8.23(b) From other segments 145 - - - 145
Segment revenues 47,988 7,832 38,481 1,761 96,062
Segment operating profit 10,171 (281) 1,333 (24) 11,199
Segment assets 60,192 9,854 39,164 2,216 111,426
The Group’s segment operating profit reconciles to the Group’s profit before tax as presented in its financial
statements as follows:
Six months to 31 Dec 2017
Six months to 31 Dec 2016
$’000 $’000
AASB 8.28(b) Profit or loss
Total reporting segment operating profit 21,979 11,223
Other segment profit 112 (24)
Rental income from investment property 550 498
Change in fair value of investment property 55 125
Share-based payment expenses (267) (165)
Post-employment benefit expenses (3,150) (2,850)
Research and development costs (986) (1,250)
Other income not allocated 202 185
Other expenses not allocated (97) (165)
Operating profit of discontinued operations - (54)
Elimination of intersegment profits (81) (18)
Group operating profit 18,317 7,505
AASB 134.16A(g)(v)
AASB 134.16A(g)(i-iv)

Example interim financial statements For the half-year ended 31 December 2017
© 2017 Grant Thornton Australia Limited. All rights reserved. 19
Six months to 31 Dec 2017
Six months to 31 Dec 2016
$’000 $’000
Share of profit from equity accounted investments 45 29
Finance costs (1,547) (1,585)
Finance income 1,050 465
Other financial items 1,878 1,583
Group profit before tax 19,743 7,997
8 Seasonal fluctuations
The demand for maintenance and installation of IT and telecommunication systems and equipment (part of the
consulting and service segments) is subject to seasonal fluctuations. Historically, peak demand is in the second
half of each financial year. Revenues for maintenance and installation for the six months ended 31 December
2017 represented 66% (six months ended 31 December 2016: 43%) of the annual level of these revenues for the
year ended 31 December 2017.
The percentage of the six months revenues in 2017 is higher than 2016 due to the effect of the full six months
revenue contribution in 2017 of the subsidiary acquired by the Group in March 2017 and the additional three
months revenues contributed by a new subsidiary acquired in 2017 (see Note 6). Excluding these items, the
revenues for the six months ended 31 December 2017 represent approximately 45% of the annual level of
maintenance and installation revenues for the year ended 31 December 2017.
9 Goodwill
The following table shows the movements in goodwill2:
Six months to
31 Dec 2017 Year to
30 June 2017
$’000 $’000
AASB 3.B67(d) Gross carrying amount
Balance, beginning of period 6,030 3,727
AASB 3.B67(d)(i) Acquired through business combination 2,502 2,438
AASB 3.B67(d)(ii) Net exchange difference (146) (135)
AASB 3.B67(d)(vi) Balance, end of the period 8,386 6,030
AASB 3.B67(d)(viii) Accumulated impairment
Balance, beginning of the period (989) (190)
AASB 3.B67(d)(i) Impairment loss recognised - (799)
AASB 3.B67(d)(v) Net exchange difference - -
AASB 3.B67(d)(vi) Balance, end of the period (989) (989)
AASB 3.B67(d)(viii) Carrying amount at the end of the period 7,397 5,041
2 In addition to the requirement of AASB 134.16A(c) to disclose the nature and amount of items affecting assets that are unusual because of their nature, size or
incidence, this disclosure is also part of the required disclosure under AASB 3 Business Combinations for the business combination that occurred in the current interim period.
AASB 134.16A(b)

Example interim financial statements For the half-year ended 31 December 2017
© 2017 Grant Thornton Australia Limited. All rights reserved. 20
10 Other intangible assets
The following tables show the movements in intangible assets3:
Acquired software licenses
Internally generated
software Brand names
Customer lists Total
$’000 $’000 $’000 $’000 $’000
AASB 138.118 Gross carrying amount
Balance at 1 July 2017 16,469 18,046 975 1,761 37,251
AASB 138.118(e)(i) Addition, separately acquired 320 - - - 320
Addition, internally developed - 2,150 - - 2,150
Acquisition through business combination 5,850 - 1,250 1,485 8,585
AASB 138.118(e)(vii) Net exchange differences (75) (65) - - (140)
Balance at 31 December 2017 22,564 20,131 2,225 3,246 48,166
Amortisation and impairment
Balance at 1 July 2017 (7,739) (11,602) (287) (199) (19,827)
AASB 138.118(e)(vi) Amortisation (1,283) (764) (115) (129) (2,291)
AASB 138.118(e)(iv) Impairment losses - - - - -
AASB 138.118(e)(vii) Net exchange differences (52) (46) - - (98)
Balance at 31 December 2017 (9,074) (12,412) (402) (328) (22,216)
Carrying amount at 31 December 2017 13,490 7,719 1,823 2,918 25,950
AASB 138.118 Gross carrying amount
Balance at 1 July 2016 13,608 14,794 760 374 29,536
AASB 138.118(e)(i) Addition, separately acquired 440 - - - 440
Addition, internally developed - 3,306 - - 3,306
Acquisition through business combination 3,653 - 215 1,387 5,255
AASB 138.118(e)(ii) Disposals (1,159) - - - (1,159)
AASB 138.118(e)(vii) Net exchange differences (73) (54) - - (127)
Balance at 31 December 2016 16,469 18,046 975 1,761 37,251
Amortisation and impairment
Balance at 1 July 2016 (6,063) (9,381) (162) (89) (15,695)
Amortisation (1,978) (1,315) (125) (110) (3,528)
Impairment losses - (870) - - (870)
Disposals 350 - - - 350
Net exchange differences (48) (36) - - (84)
Balance at 31 December 2016 (7,739) (11,602) (287) (199) (19,827)
Carrying amount at 31 December 2016 8,730 6,444 688 1,562 17,424
3 In this publication, this information is considered a necessary disclosure because of the significant additions and the impact of the business combination. Depending
on the circumstances, this type of disclosure might be regarded either as voluntary or as necessary to meet the requirements of AASB 134.15C and AASB 134.16A(c). Other examples of events and transactions where AASB 134 requires disclosures are included in AASB 134.15B.

Example interim financial statements For the half-year ended 31 December 2017
© 2017 Grant Thornton Australia Limited. All rights reserved. 21
11 Property, plant and equipment
The following tables show the movements in property, plant and equipment4:
Land Buildings
IT equipment
Other equipment Total
$’000 $’000 $’000 $’000 $’000
Gross carrying amount
AASB 116.73(d) Balance at 1 July 2017 8,709 20,177 7,806 2,905 39,597
AASB 116.73(e)(i) Additions - - 35 12 47
AASB 116.73(e)(iii) Acquisition through business combination - 2,435 2,527 856 5,818
AASB 116.73(e)(ii) Disposals - - - (456) (456)
AASB 116.73(e)(viii) Net exchange differences (15) (65) (62) (46) (188)
AASB 116.73(d) Balance at 31 December 2017 8,694 22,547 10,306 3,271 44,818
Depreciation and impairment
AASB 116.73(d) Balance at 1 July 2017 - (13,213) (2,446) (1,499) (17,158)
AASB 116.73(e)(ii) Disposals - - - 385 385
AASB 116.73(e)(viii) Net exchange differences - (46) (55) (48) (149)
AASB 116.73(e)(vii) Depreciation - (710) (602) (303) (1,615)
AASB 116.73(d) Balance at 31 December 2017 - (13,969) (3,103) (1,465) (18,537)
Carrying amount at 31 December 2017 8,694 8,578 7,203 1,806 26,281
Gross carrying amount
AASB 116.73(d) Balance at 1 July 2016 7,697 19,362 5,579 2,594 35,232
AASB 116.73(e)(i) Additions - 76 - - 76
AASB 116.73(e)(iii) Acquisition through business combination 730 1,221 2,306 365 4,622
AASB 116.73(e)(ii) Disposals - (401) - - (401)
AASB 116.73(e)(iv) Revaluation increase 303 - - - 303
AASB 116.73(e)(viii) Net exchange differences (21) (81) (79) (54) (235)
AASB 116.73(d) Balance at 31 December 2016 8,709 20,177 7,806 2,905 39,597
Depreciation and impairment
AASB 116.73(d) Balance at 1 July 2016 - (12,159) (1,503) (923) (14,585)
AASB 116.73(e)(ii) Disposals - 315 - - 315
AASB 116.73(e)(viii) Net exchange differences - (54) (53) (36) (143)
AASB 116.73(e)(vii) Depreciation - (1,315) (890) (540) (2,745)
AASB 116.73(d) Balance at 31 December 2016 - (13,213) (2,446) (1,499) (17,158)
Carrying amount at 31 December 2016 8,709 6,964 5,360 5,360 22,439
12 Discontinued operations and non-current assets held for sale
The amounts presented in the Statement of Profit or Loss and Other Comprehensive Income under discontinued
operations relate to Highstreet Ltd (Highstreet). Most of its assets were sold on 30 March 2017. The remaining
storage facility was sold in August 2017 and a gain of $96,000 is presented as discontinued operations for the
period ended 31 December 2017.
4 In this publication, this information is considered a necessary disclosure because of the significant additions and the impact of the business combination. Depending
on the circumstances, this type of disclosure might be regarded either as voluntary or as necessary to meet the requirements of AASB 134.15C and AASB 134.16A(c). Other examples of events and transactions where AASB 134 requires disclosures are included in AASB 134.15B.
AASB 134.16A(c)
AASB 134.16A(i)

Example interim financial statements For the half-year ended 31 December 2017
© 2017 Grant Thornton Australia Limited. All rights reserved. 22
13 Earnings per share
Both the basic and diluted earnings per share have been calculated using the profit attributable to shareholders
of the Parent Company (Grant Thornton CLEARR) as the numerator, i.e., no adjustments to profits were
necessary during the six months period to 31 December 2017 and 31 December 20165.
The weighted average number of shares for the purposes of the calculation of diluted earnings per share can be
reconciled to the weighted average number of ordinary shares used in the calculation of basic earnings per share
as follows:
Six months to
31 Dec 2017 Six months to
31 Dec 2016 $‘000s $‘000s
Weighted average number of shares used in basic earnings per share 14,970 12,270
AASB 133.70(b) Shares deemed to be issued for no consideration in respect of share-based payments 14 16
Weighted average number of shares used in diluted earnings per share 14,984 12,286
14 Share capital
During the first six months of 2017, 350,000 shares were issued to satisfy share options previously granted under
the Group’s employee share option scheme. During this period, the weighted average share price at the date of
exercise was $11.97 (during the last six months of 2016: $11.19).
The Group also issued 1,700,000 shares on 1 October 2017 for cash, corresponding to 13.9% of total shares
issued. Each share has the same right to receive dividends and the repayment of capital and represents one
vote at the shareholders’ meeting of Grant Thornton CLEARR. Shares issued and authorised are summarised as
follows:
Six months to 31 Dec 2017
Year to 30 June 2017
$‘000s $‘000s
Amounts in thousand shares
AASB 101.79(a)(iv) Shares issued and fully paid:
beginning of the period 13,770 12,000
issued under share-based payment plans 350 270
share issue 1,700 1,500
AASB 101.79(a)(ii) Shares issued and fully paid 15,820 13,770
Shares authorised for share based payments 600 600
AASB 101.79(a)(i) Total shares authorised at the end of the period 16,420 14,370
15 Dividends
During the second half of 2017, Grant Thornton CLEARR paid dividends of $6,855,000 to its equity shareholders
(second half of 2016: $3,000,000). This represents a payment of $0.50 per share (second half of 2016: $0.25).
No dividends were paid on new shares issued in 2017 pursuant to the Group’s share-based payment scheme.
5 In this publication, this information is considered a necessary disclosure because of the significant additions and the impact of the business combination. Depending
on the circumstances, this type of disclosure might be regarded either as voluntary or as necessary to meet the requirements of AASB 134.15C and AASB 134.16A(c). Other examples of events and transactions where AASB 134 requires disclosures are included in AASB 134.15B.
AASB 134.16A(c)
Example interim financial statements For the half-year ended 31 December 2017
© 2017 Grant Thornton Australia Limited. All rights reserved. 23
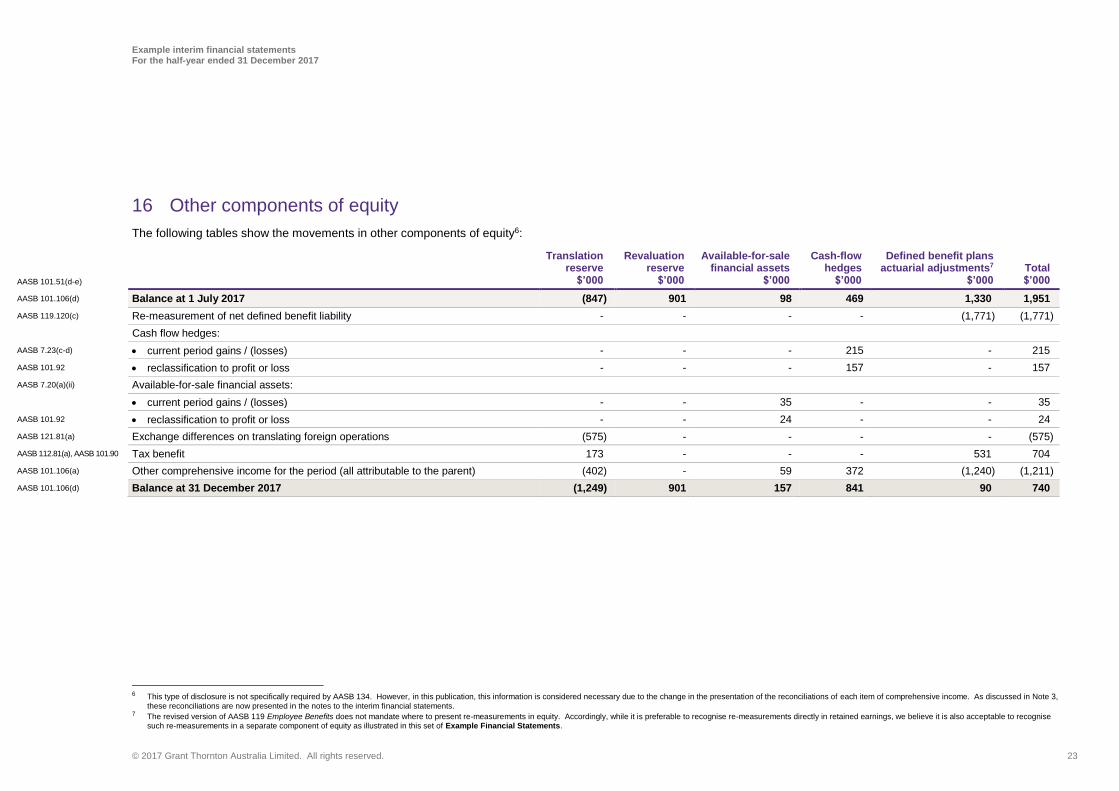
16 Other components of equity
The following tables show the movements in other components of equity6:
Translation
reserve Revaluation
reserve Available-for-sale
financial assets Cash-flow
hedges Defined benefit plans
actuarial adjustments7 Total
AASB 101.51(d-e) $’000 $’000 $’000 $’000 $’000 $’000
AASB 101.106(d) Balance at 1 July 2017 (847) 901 98 469 1,330 1,951
AASB 119.120(c) Re-measurement of net defined benefit liability - - - - (1,771) (1,771)
Cash flow hedges:
AASB 7.23(c-d) current period gains / (losses) - - - 215 - 215
AASB 101.92 reclassification to profit or loss - - - 157 - 157
AASB 7.20(a)(ii) Available-for-sale financial assets:
current period gains / (losses) - - 35 - - 35
AASB 101.92 reclassification to profit or loss - - 24 - - 24
AASB 121.81(a) Exchange differences on translating foreign operations (575) - - - - (575)
AASB 112.81(a), AASB 101.90 Tax benefit 173 - - - 531 704
AASB 101.106(a) Other comprehensive income for the period (all attributable to the parent) (402) - 59 372 (1,240) (1,211)
AASB 101.106(d) Balance at 31 December 2017 (1,249) 901 157 841 90 740
6 This type of disclosure is not specifically required by AASB 134. However, in this publication, this information is considered necessary due to the change in the presentation of the reconciliations of each item of comprehensive income. As discussed in Note 3,
these reconciliations are now presented in the notes to the interim financial statements. 7 The revised version of AASB 119 Employee Benefits does not mandate where to present re-measurements in equity. Accordingly, while it is preferable to recognise re-measurements directly in retained earnings, we believe it is also acceptable to recognise
such re-measurements in a separate component of equity as illustrated in this set of Example Financial Statements.

Example interim financial statements For the half-year ended 31 December 2017
© 2017 Grant Thornton Australia Limited. All rights reserved. 24
Translation
reserve Revaluation
reserve Available-for-sale
financial assets Cash-flow
hedges Defined benefit plans actuarial adjustments Total
$’000 $’000 $’000 $’000 $’000 $’000
AASB 101.106(d) Balance at 1 July 2016 (359) 689 35 (160) (1,351) (1,146)
AASB 119.120(c) Re-measurement of net defined benefit liability - - - - 1,915 1,915
Cash flow hedges:
AASB 7.23(c-d) current period gains / (losses) - - - 287 - 287
AASB 101.92 reclassification to profit or loss - - - 178 - 178
AASB 7.20(a)(ii) Available-for-sale financial assets:
current period gains / (losses) - - (22) - - (22)
AASB 101.92 reclassification to profit or loss - - (32) - - (32)
AASB 121.81(a), Exchange differences on translating foreign operations (414) - - - - (414)
AASB 101.90 Tax benefit 125 - - - (575) (450)
AASB 101.106(a) Other comprehensive income for the period (all attributable to the parent) (289) - (54) 465 1,340 1,462
AASB 101.106(d) Balance at 31 December 2016 (648) 689 (19) 305 11 316
17 Provisions
A restructuring provision was recognised by the Group in its annual financial statements as at 30 June 2017 in relation to the ‘Phoenix Program’, amounting to $1,215,000. The
estimate of the restructuring provision was reduced by $455,000 in the six months ended 31 December 2017 due to a positive outcome of claims brought against the Group by
former employees. The Group’s management still expects to settle the remaining termination remuneration by 30 June 2018, predominantly through out of court settlements.
18 Contingent liabilities
During the prior year, various warranty and legal claims were brought against the Group. At 31 December 2017, management considered these claims to be unjustified and no
provision had been recognised. During the current period, the counterparties withdrew their claims against the Group.
AASB 134.15B(c)
AASB 134.15B(m)

Example interim financial statements For the half-year ended 31 December 2017
© 2017 Grant Thornton Australia Limited. All rights reserved. 25
19 Fair value measurement of financial instruments
19.1 Fair value hierarchy
AASB 13 requires disclosure of fair value measurements by level of the fair value hierarchy, as follows:
Level 1: quoted prices (unadjusted) in active markets for identical assets or liabilities
Level 2: inputs other than quoted prices included within Level 1 that are observable for the asset or liability,
either directly (i.e., as prices) or indirectly (i.e., derived from prices)
Level 3: inputs for the asset or liability that is not based on observable market data (unobservable inputs)
The Group’s financial assets and financial liabilities measured and recognised at fair value at 31 December 2017
and 31 December 2016 on a recurring basis are as follows:
AASB 13.93(a) Level 1 Level 2 Level 3 Total $’000 $’000 $’000 $’000
31 December 2017
Assets
Listed securities and debentures 598 - - 598
Money market funds 689 - - 689
US-Dollar contracts:
cash flow hedge - 841 - 841
other forward exchange contracts held-for-trading - 94 21 115
Total 1,287 935 21 2,243
Liabilities
US-Dollar loans - (7,950) - (7,950)
Total - (7,950) - (7,950)
Net fair value 1,287 (7,015) 21 (5,707)
AASB 13.93(a) Level 1 Level 2 Level 3 Total $’000 $’000 $’000 $’000
31 December 2016
Assets
Listed securities and debentures 582 - - 582
Money market funds 655 - - 655
US-Dollar contracts:
cash flow hedge - 469 - 469
other forward exchange contracts held-for-trading - 94 28 122
Total 1,237 563 28 1,828
Liabilities
US-Dollar loans - (8,220) - (8,220)
Total - (8,220) - (7,950)
Net fair value 1,237 (7,657) 28 (6,392)
AASB 13.76,81,86
AASB 134.15B(h) AASB 134.15C

Example interim financial statements For the half-year ended 31 December 2017
© 2017 Grant Thornton Australia Limited. All rights reserved. 26
19.2 Measurement of fair value of financial instruments
The methods and valuation techniques used for the purpose of measuring fair value are unchanged compared to
the previous reporting period.
a Listed securities, debentures and money market funds
Fair values have been determined by reference to their quoted bid prices at the reporting date.
b Foreign currency forward contracts
The Group’s foreign currency forward contracts are not traded in active markets. The fair values of most of these
contracts are estimated using a valuation technique that maximises the use of observable market inputs (e.g.,
market exchange and interest rates) and are included in Level 2 of the fair value hierarchy. However, a few of the
Group’s derivative positions in foreign currency forward contracts relate to currencies for which markets are less
developed and observable market data are not available. For these contracts, management uses its best
estimate about the assumptions that market participants would make. These contracts are therefore classified
within Level 3.
The Group’s policy is to recognise transfers into and transfers out of fair value hierarchy levels as at the end of
the reporting period.
c US-Dollar loans
The fair value of the US-Dollar loans is estimated using a valuation technique. All significant inputs into the model
are based on observable market prices (e.g., market interest rates of similar loans with similar risk). The interest
rate used for this calculation is 3.9%.
The Group did not measure any financial assets or financial liabilities at fair value on a non-recurring basis as at
31 December 2017.
19.3 Level 3 fair value measurements
The following table presents the changes in financial instruments classified within Level 3:
Foreign currency forward contracts
2017 2016 $’000 $’000
Opening balance 28 34
Gains or losses recognised in:
profit or loss a 23 18
other comprehensive income - -
Settlements (30) (24)
Closing balance 21 28
a Gains or losses recognised in profit or loss for the period are presented in ‘finance income’ and can be
attributed as follows:
2017 2016 $’000 $’000
Assets held at the end of the reporting period 21 28
Assets not held at the end of the reporting 2 (10)
Total gains or losses 23 18
AASB 13.93(d)
AASB 13.95
AASB 13.93(a),(b),(d)
AASB 134.15B(k) AASB 134.15C

Example interim financial statements For the half-year ended 31 December 2017
© 2017 Grant Thornton Australia Limited. All rights reserved. 27
There have been no transfers between the levels of the fair value hierarchy during the six months to 31
December 2017.
Changing inputs to the Level 3 valuations to reasonably possible alternative assumptions would not change
significantly amounts recognised in profit or loss, total assets or total liabilities or total equity.
The valuation process is managed by a team in the Group’s finance department which performs the valuations of
non-property assets required for financial reporting purposes (including Level 3 fair values). The Valuation Team
then report to the Group’s Chief Financial Officer (CFO) and the Audit and Risk Committee. Discussions on
valuation processes and outcomes are held between the Valuation Team, CFO and the Audit and Risk
Committee every six months.
19.4 Fair values of other financial assets and financial liabilities
The Group also has number of financial instruments which are not measured at fair value in the statement of
financial position. These had the following fair values as at 31 December 2017:
Fair value Carrying amount $’000 $’000
Non-current borrowings
Other bank borrowings 4,400 4,565
Non-convertible bond 2,200 2,253
Subordinated shareholder loan 4,975 5,000
11,575 11,818
Non-current trade and other payables
Finance lease liabilities 4,208 4,096
4,208 4,096
The carrying amounts of the current receivables, current payables and current borrowings are considered to be a
reasonable approximation of their fair value.
20 Events after the reporting date8
On 29 January 2018, the Group acquired 100% of the issued share capital of Servers.com Limited
(Servers.com), a Company based in Australia. The objective of the acquisition is to expand the operations of the
Group’s retail segment.
The acquisition was settled in cash and by issuing 500,000 shares of Grant Thornton CLEARR. The purchase
agreement also provides for an additional consideration of $1,500,000 payable if the average profits of
Servers.com for 2018 and 2019 exceed a target level agreed by both parties. Any additional consideration will be
paid on 3 April 2020.
The fair value of the consideration transferred is as follows:
$’000
AASB 3.B64(iv) Fair value of equity shares issued 6,250
AASB 3.B64(i) Amount settled in cash 7,000
AASB 3.B64(g)(i) Fair value of contingent consideration 680
Total 13,930
8 AASB 134.16A(h) requires disclosure of events after the interim period that have not been reflected in the interim financial statements. AASB 134 does not specify
the level of detail required. This example illustrates the disclosures required by AASB 3 Business Combinations for combinations arising after the reporting date. Other approaches may also be acceptable.
AASB 13.93(h)(ii)
AASB 13.93(d)
AASB 13.93(g)
AASB 134.16A(j) AASB 7.25
AASB 7.29(a)
AASB 134.16A(h)
AASB 3.B66
AASB 3.B64(a-d)
AASB 3B64(f)(i, iii ,iv)
AASB 3.B66
AASB 3.B64(g)(ii)
AASB 3.B64(f)

Example interim financial statements For the half-year ended 31 December 2017
© 2017 Grant Thornton Australia Limited. All rights reserved. 28
The fair value of the equity shares issued was based on the market value of the Group’s traded equity shares at
the date of acquisition.
The fair value of the contingent consideration represents the Group’s estimate of the probable cash outflows
(i.e., reflecting management’s estimate of a 50% probability that the targets will be achieved) discounted using an
interest rate of 5%.9
The Group is in the process of determining the fair values of the acquired assets and assumed liabilities of
Servers.com and therefore disclosure of the fair values of the net identifiable assets and the goodwill arising from
the acquisition cannot be made. Finalisation of the valuation is expected to be completed before year-end.
9 The determination of the acquisition-date fair value of the contingent consideration should consider the expected outcome of the contingency. This example
illustrates one possible approach to estimating the fair value of the contingent consideration.
AASB 3.B64(f)(iv)
AASB 3.B64(g)(iii)
AASB 3.B66

Example interim financial statements For the half-year ended 31 December 2017
© 2017 Grant Thornton Australia Limited. All rights reserved. 29
1 In the opinion of the Directors of Grant Thornton CLEARR Example Ltd:
a The consolidated financial statements and notes of Grant Thornton CLEARR Example Ltd are in
accordance with the Corporations Act 2001, including:
i Giving a true and fair view of its financial position as at 31 December 2017 and of its performance for
the half-year ended on that date; and
ii Complying with Accounting Standard AASB 134 Interim Financial Reporting; and
b There are reasonable grounds to believe that the Company will be able to pay its debts as and when they
become due and payable.
Signed in accordance with a resolution of the Directors.
Director
Blake Smith
Dated the 28th day of February 2018
Directors’ Declaration
CA 303(4)(d)(ii)
CA 303(4)(d)(i)
CA 303(4)(c)
CA 303(5)(a)
CA 303(5)(c)
CA 303(5)(b)

www.grantthornton.com.au The information contained herein is of a general nature and is not intended to address the circumstances of any particular individual or entity. Although we endeavour to provide accurate and timely information, there can be no guarantee that such information is accurate as of the date it is received or that it will continue to be accurate in the future. No one is entitled to rely on this information and no one should act on such information without appropriate professional advice obtained after a thorough examination of the particular situation.
‘Grant Thornton’ refers to the brand under which the Grant Thornton member firms provide assurance, tax and advisory services to their clients and/or refers to one or more member firms, as the context requires. Grant Thornton Australia Ltd is a member firm of Grant Thornton International Ltd (GTIL). GTIL and the member firms are not a worldwide partnership. GTIL and each member firm is a separate legal entity. Services are delivered by the member firms. GTIL does not provide services to clients. GTIL and its member firms are not agents of, and do not obligate one another and are not liable for one another’s acts or omissions. In the Australian context only, the use of the term ‘Grant Thornton’ may refer to Grant Thornton Australia Limited ABN 41 127 556 389 and its Australian subsidiaries and related entities. GTIL is not an Australian related entity to Grant Thornton Australia Limited.
Liability limited by a scheme approved under Professional Standards Legislation.
© 2017 Grant Thornton Australia Ltd. All rights reserved.
An independent auditor’s report will be prepared by the entity’s auditor in accordance with Australian Auditing
Standards. This publication does not include an illustrative report as the wording of the report may differ between
entities.
Independent Auditor’s Review Report