examining the role of transportation in the liquefied …...transportation policy research centerii...
TRANSCRIPT
Policy Research CENTER
TRANSPORTATION
Moving Texas ExportsExamining the role of transportation in the liquefied natural gas export supply chain
TRANSPORTATION Policy Research CENTER
ii
Moving Texas ExportsExamining the role of transportation in the liquefied natural gas export
supply chainby
JOLANDA PROZZIResearch Scientist
Texas A&M Transportation Institute
MEGAN KENNEYAssistant Transportation Researcher
Texas A&M Transportation Institute
CONTENTS
Introduction ....................................................................................................... 1
Background .................................................................................................................2
Low Cost U.S. Natural Gas ................................................................................ 4
Federal Regulations ............................................................................................ 5
LNG Export Facilities .......................................................................................... 5
Liquefied Natural Gas Export Supply Chain ................................................. 6
Transportation Issues ....................................................................................... 8
Complex Regulatory Process .................................................................................8
Lack of Pipeline Capacity ........................................................................................8
Panama Canal Expansion ........................................................................................9
Inadequate LNG Tanker Fleet ..............................................................................10
Key Findings ..................................................................................................... 11
References ........................................................................................................ 12
The Texas A&M University System College Station, Texas 77843-3135
Published: March 2016

1
The freight transportation system of a state has a direct and indirect impact on international trade. The mode of transportation has a direct impact on the cost, efficiency, and reliability of moving export products to overseas markets. So too does the capacity of the transportation infra-structure. Freight infrastructure investments that increase system capaci-ty could reduce travel times and costs, which can translate into increased economic productivity, as well as enhanced labor and market access. Better labor and market access, in turn, could contribute to increased
IntroductionIn 2014, U.S. exports of goods and services amounted to $2.34 trillion, with Texas accounting for $289 billion of that amount (1). Furthermore, in 2013, Texas’ exports supported approximately 1.1 million jobs (2). There is no doubt that Texas’ transportation system—its roads, rail, ports, pipelines, airports, and border crossings—facilitates export trade.
economic competitiveness (3), which can result in increased exports. The Organization for Economic Cooperation and Development reported that most countries with high-quality infrastruc-ture rank high in the world index for overall competitiveness (4). Specifically, quality infrastructure is a key indicator of international economic competitiveness because it determines the scale, volume, and efficiency of international trade.
The objective of this series of papers is to describe the supply chains for six of Texas’ major export commodities and identify the role of transportation in the supply chain. The study examined the transportation concerns of exporters, transportation policies and regulations affecting the costs of exports, and infrastructure concerns. This is the fifth paper in the series and documents the role of transportation in the liquefied natural gas export supply chain and key transportation issues and concerns that were documented and shared with the study team.
The objective of this series of papers is to describe the supply chains for six of Texas’ major export commodities and identify the role of transportation in the supply chain.
TRANSPORTATION Policy Research CENTER
2
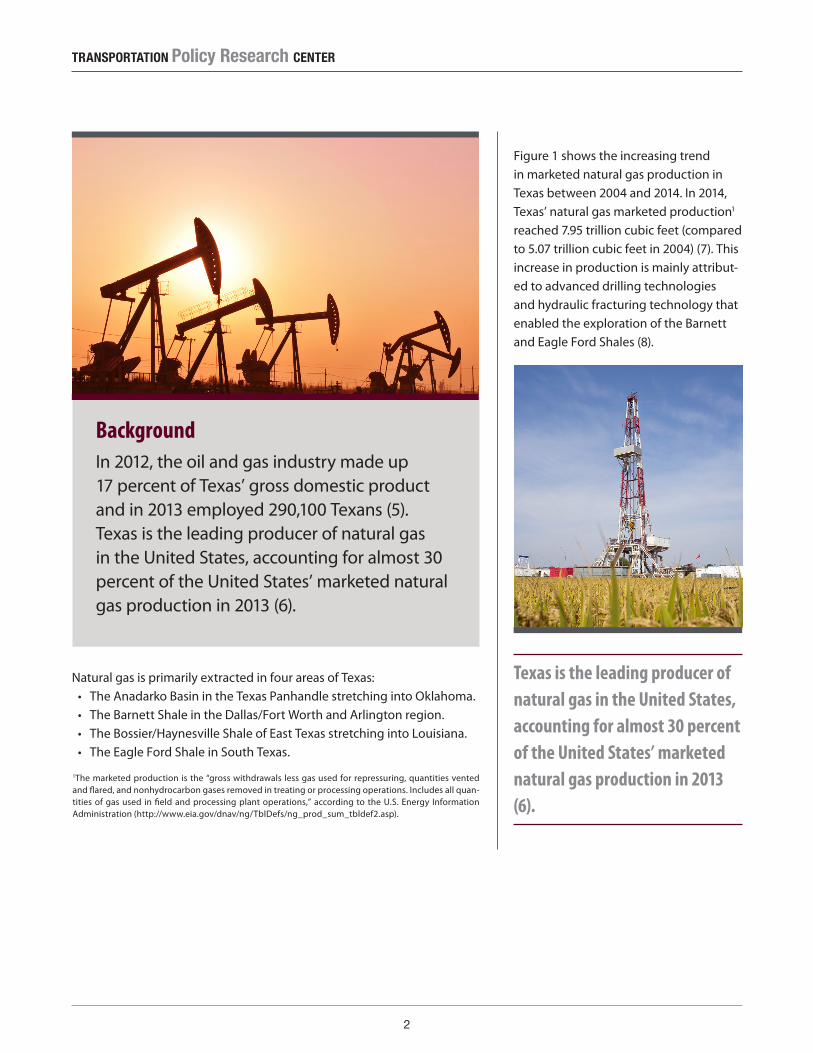
BackgroundIn 2012, the oil and gas industry made up 17 percent of Texas’ gross domestic product and in 2013 employed 290,100 Texans (5). Texas is the leading producer of natural gas in the United States, accounting for almost 30 percent of the United States’ marketed natural gas production in 2013 (6).
Natural gas is primarily extracted in four areas of Texas:• The Anadarko Basin in the Texas Panhandle stretching into Oklahoma.• The Barnett Shale in the Dallas/Fort Worth and Arlington region.• The Bossier/Haynesville Shale of East Texas stretching into Louisiana.• The Eagle Ford Shale in South Texas.
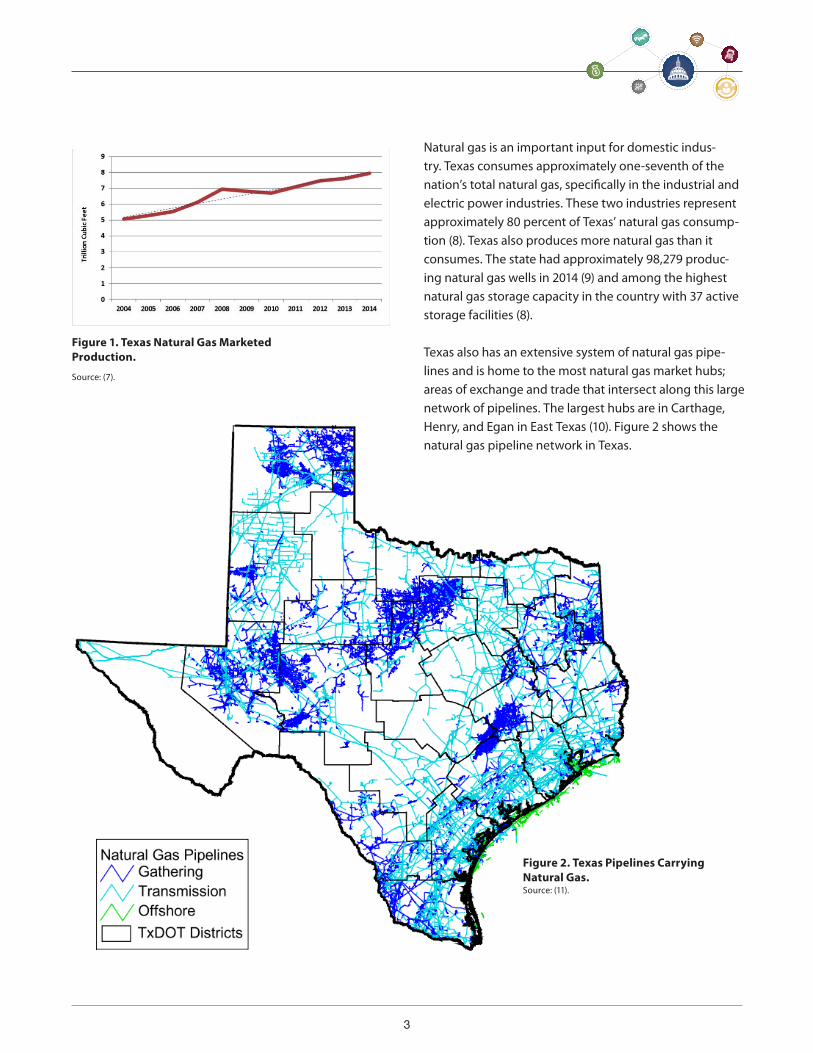
Figure 1 shows the increasing trend in marketed natural gas production in Texas between 2004 and 2014. In 2014, Texas’ natural gas marketed production1 reached 7.95 trillion cubic feet (compared to 5.07 trillion cubic feet in 2004) (7). This increase in production is mainly attribut-ed to advanced drilling technologies and hydraulic fracturing technology that enabled the exploration of the Barnett and Eagle Ford Shales (8).
Texas is the leading producer of natural gas in the United States, accounting for almost 30 percent of the United States’ marketed natural gas production in 2013 (6).
1The marketed production is the “gross withdrawals less gas used for repressuring, quantities vented and flared, and nonhydrocarbon gases removed in treating or processing operations. Includes all quan-tities of gas used in field and processing plant operations,” according to the U.S. Energy Information Administration (http://www.eia.gov/dnav/ng/TblDefs/ng_prod_sum_tbldef2.asp).
3
Source: (7).
Figure 1. Texas Natural Gas Marketed Production.
Natural gas is an important input for domestic indus-try. Texas consumes approximately one-seventh of the nation’s total natural gas, specifically in the industrial and electric power industries. These two industries represent approximately 80 percent of Texas’ natural gas consump-tion (8). Texas also produces more natural gas than it consumes. The state had approximately 98,279 produc-ing natural gas wells in 2014 (9) and among the highest natural gas storage capacity in the country with 37 active storage facilities (8). Texas also has an extensive system of natural gas pipe-lines and is home to the most natural gas market hubs; areas of exchange and trade that intersect along this large network of pipelines. The largest hubs are in Carthage, Henry, and Egan in East Texas (10). Figure 2 shows the natural gas pipeline network in Texas.
Figure 2. Texas Pipelines Carrying Natural Gas.Source: (11).
TRANSPORTATION Policy Research CENTER
4
The export of LNG involves several government agencies that must approve the transfer and delivery of natural gas as an export commodity.
Source: (12).
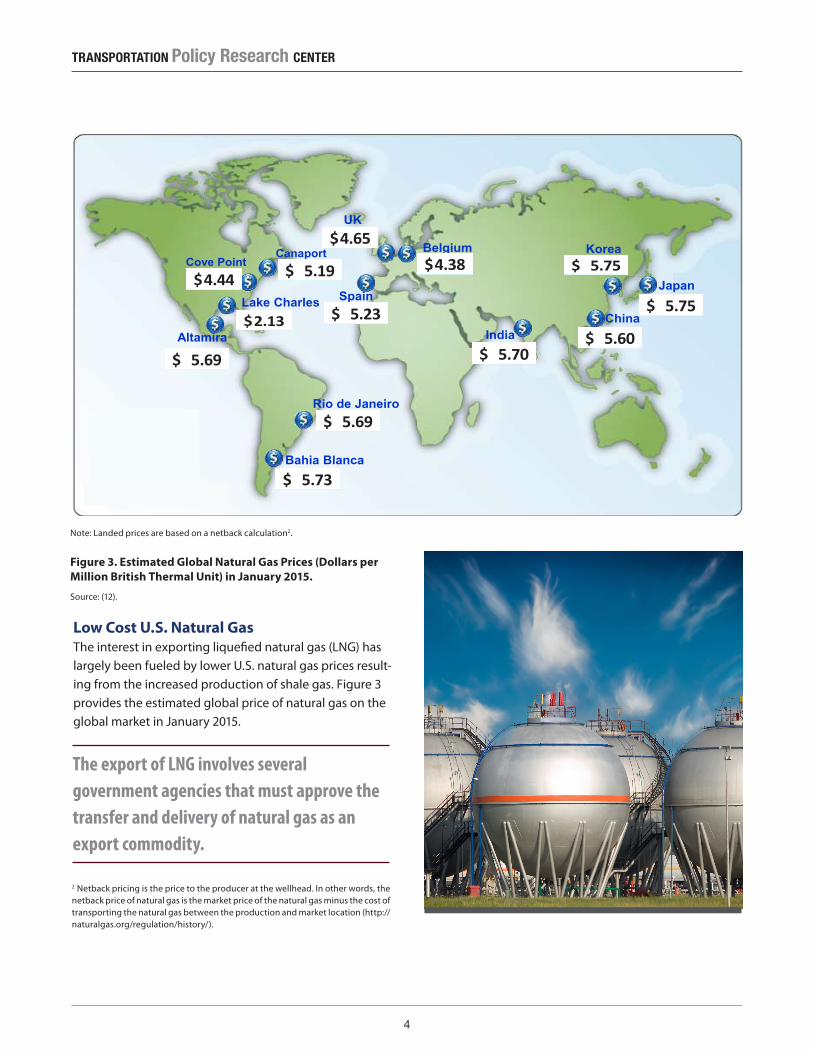
Figure 3. Estimated Global Natural Gas Prices (Dollars per Million British Thermal Unit) in January 2015.
Low Cost U.S. Natural GasThe interest in exporting liquefied natural gas (LNG) has largely been fueled by lower U.S. natural gas prices result-ing from the increased production of shale gas. Figure 3 provides the estimated global price of natural gas on the global market in January 2015.
Federal Energy Regulatory Commission • Market Oversight • www.ferc.gov/oversight
Source: Waterborne Energy, Inc. Data in $US/MMBtu. Landed prices are based on a netback calculation. Note: Includes information and Data supplied by IHS Global Inc. and its affiliates (“IHS”); Copyright (publication year) all rights reserved. Prices are the monthly average of the weekly landed prices for the given month.
World LNG Estimated January 2016 Landed Prices
National Natural Gas Market Overview: World LNG Landed Prices
Cove Point $4.50
India $11.55
UK $8.75
Spain $9.05
Belgium $8.84
Japan $12.40
Korea $12.40
Lake Charles $3.96
Altamira $4.60
Cove Point $4.40
India $11.55
UK $8.75
Spain $9.15
Belgium $8.99
Japan $13.10
Korea $13.10
Lake Charles $3.93
Altamira $4.57
Cove Point $4.50
India $11.55
UK $8.75
Spain $9.05
Belgium $8.84
Japan $12.40
Korea $12.40
Lake Charles $3.96
Altamira $4.60
Cove Point
India
UK
Spain
Belgium
Japan
Korea
Lake Charles
Altamira
Rio de Janeiro
Bahia Blanca
Canaport
China
5.69$
5.73$
5.23$
5.19$ 4.44$
5.70$ 5.60$
5.75$
4.65$
2.13$
5.69$
5.75$
4.38$
Updated: Feb-16Note: Landed prices are based on a netback calculation2.
2 Netback pricing is the price to the producer at the wellhead. In other words, the netback price of natural gas is the market price of the natural gas minus the cost of transporting the natural gas between the production and market location (http://naturalgas.org/regulation/history/).
5
Federal RegulationsThe export of LNG involves several government agencies that must approve the transfer and delivery of natural gas as an export commodity. Section 3 of the Natural Gas Act (15 U.S. Code Section 717b) stipulates that the Department of Energy’s (DOE’s) Office of Fossil Energy must approve export of the commodity, and the Federal Energy Regulatory Commission (FERC) must approve the related facilities. For LNG exports, FERC must approve the construction of liquefaction facilities, the expansion of existing LNG terminals, and any storage tanks, compres-sors, piping, and other equipment used in the export of LNG.
These permit approvals by DOE and FERC are federal actions that are subject to environmental review under the National Environmental Policy Act. Some of the other agencies that may have a role in considering the environ-mental impacts of proposed LNG export facilities include:
• U.S. Environmental Protection Agency.• State environmental protection agencies.• U.S. Fish and Wildlife Service.• U.S. Army Corps of Engineers.• U.S. Coast Guard.• Advisory Council on Historic Preservation.• State Historic Preservation Office.
Because of safety and security concerns, the following agencies may also be involved:
• U.S. Department of Homeland Security.• Pipeline and Hazardous Materials Safety Administra-
tion.• National Fire Protection Association.• Federal Emergency Management Agency (13).
LNG Export FacilitiesAs of January 2015, 48 permit applications are pending FERC approval for constructing either liquefaction facili-ties at existing LNG import facilities (also termed regasifi-cation facilities) or new LNG export facilities (10).
As of August 6, 2015, two FERC-approved LNG export terminals are under construction in Freeport and Corpus Christi. The liquefaction and export terminal in Freeport will allow for the export of 1.8 billion cubic feet of LNG per day (14). The estimated benefits of the $14 billion investment in the Freeport facility are:
• Employment for 3,500 workers during a four- to five-year construction period.
• Employment opportunities during the production of natural gas.
• Between $5.1 billion and $7.4 billion in total annual economic benefits to the United States.
• A reduction of approximately 1 percent in the U.S. foreign trade imbalance resulting from LNG (15).
DOE approved U.S.-produced LNG exports from the Freeport facility to non-Free Trade Agreement countries (10). Two countries that present substantial markets for LNG exports that have not entered into a Free Trade Agreement with the United States are Japan and China (16).3
The Chenier LNG facility currently under construction in Corpus Christi will have an export capacity of 2.14 billion cubic feet of LNG per day upon completion (12).
A number of LNG export terminals are proposed in Texas and are pending application (i.e., Lavaca Bay, Sabine Pass, and Freeport) or are projects in pre-filing (i.e., Brownsville, Port Arthur, Freeport, and Corpus Christi) (17). Texas will thus be well positioned to serve the growing global de-mand for LNG in Asia (specifically China) (18).
3Japan is one of 12 countries that are currently in negotiations to finalize the Trans-Pacific Partnership agreement. It is unclear when the agreement will be finalized.
TRANSPORTATION Policy Research CENTER
6
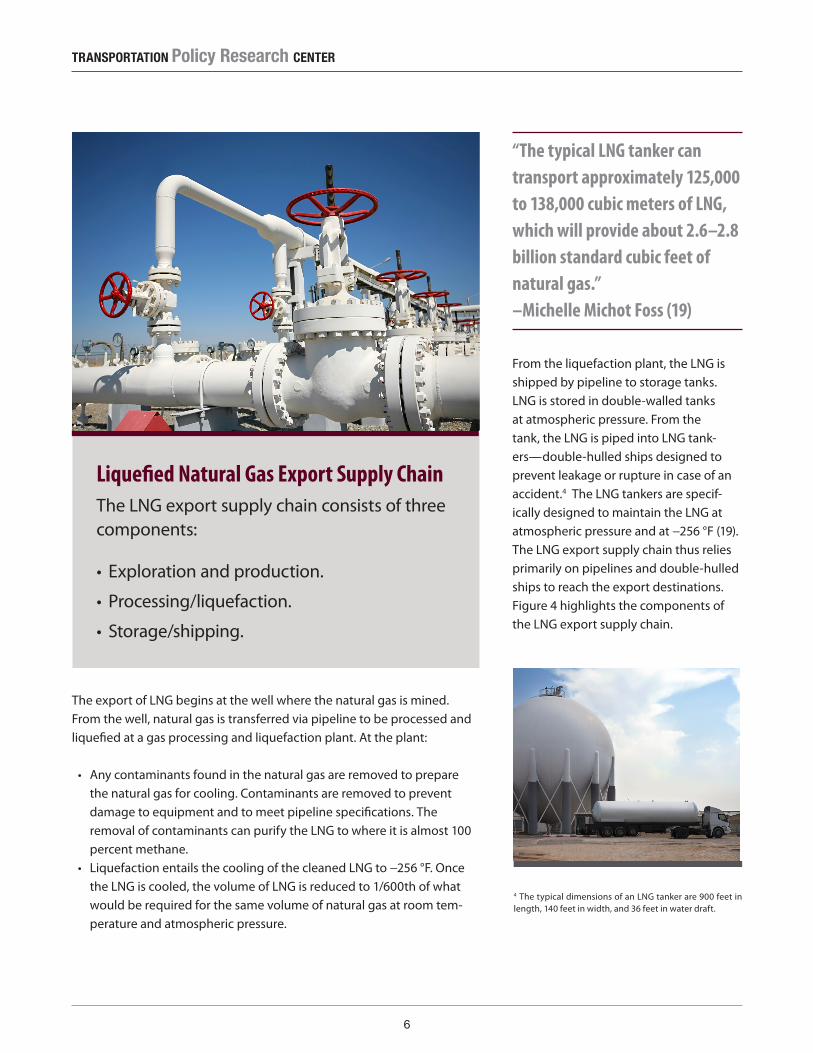
Liquefied Natural Gas Export Supply ChainThe LNG export supply chain consists of three components:
• Exploration and production.
• Processing/liquefaction.
• Storage/shipping.
The export of LNG begins at the well where the natural gas is mined. From the well, natural gas is transferred via pipeline to be processed and liquefied at a gas processing and liquefaction plant. At the plant:
• Any contaminants found in the natural gas are removed to prepare the natural gas for cooling. Contaminants are removed to prevent damage to equipment and to meet pipeline specifications. The removal of contaminants can purify the LNG to where it is almost 100 percent methane.
• Liquefaction entails the cooling of the cleaned LNG to −256 °F. Once the LNG is cooled, the volume of LNG is reduced to 1/600th of what would be required for the same volume of natural gas at room tem-perature and atmospheric pressure.
“The typical LNG tanker can transport approximately 125,000 to 138,000 cubic meters of LNG, which will provide about 2.6–2.8 billion standard cubic feet of natural gas.” –Michelle Michot Foss (19)
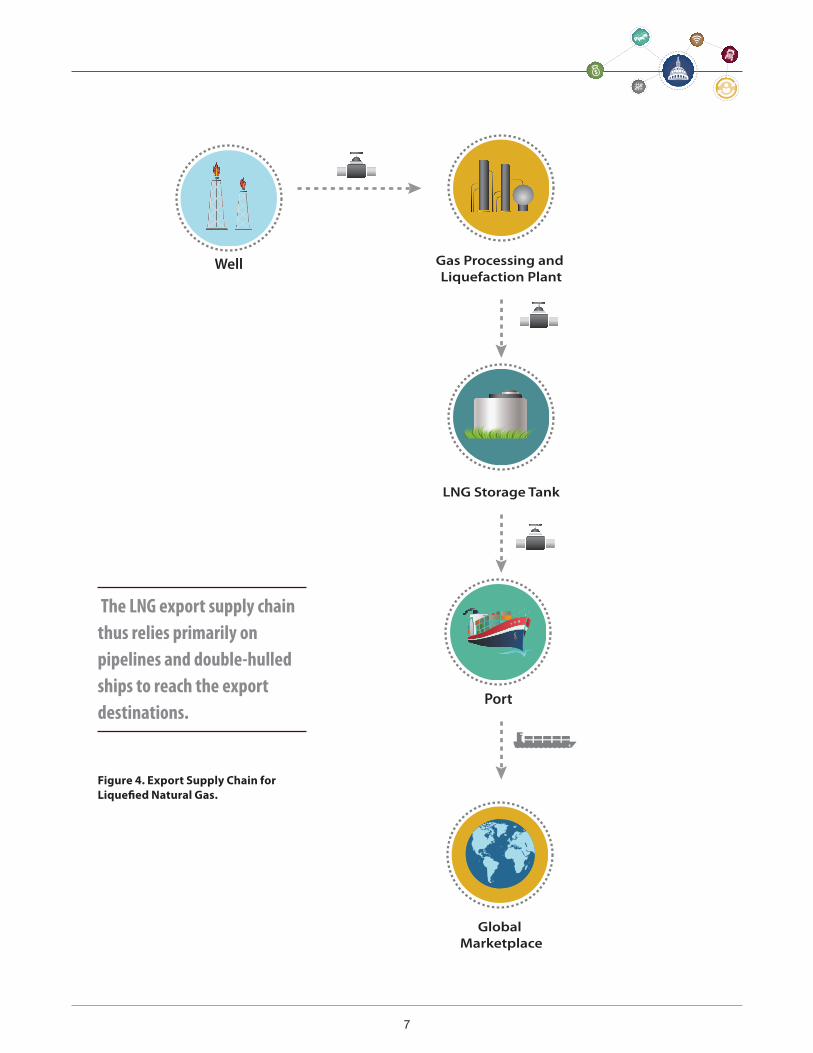
From the liquefaction plant, the LNG is shipped by pipeline to storage tanks. LNG is stored in double-walled tanks at atmospheric pressure. From the tank, the LNG is piped into LNG tank-ers—double-hulled ships designed to prevent leakage or rupture in case of an accident.4 The LNG tankers are specif-ically designed to maintain the LNG at atmospheric pressure and at −256 °F (19). The LNG export supply chain thus relies primarily on pipelines and double-hulled ships to reach the export destinations. Figure 4 highlights the components of the LNG export supply chain.
4 The typical dimensions of an LNG tanker are 900 feet in length, 140 feet in width, and 36 feet in water draft.
7
Figure 4. Export Supply Chain for Liquefied Natural Gas.
Well Gas Processing and Liquefaction Plant
LNG Storage Tank
Global Marketplace
Port
The LNG export supply chain thus relies primarily on pipelines and double-hulled ships to reach the export destinations.
TRANSPORTATION Policy Research CENTER
8
Lack of Pipeline CapacityWhile Texas’ natural gas pipeline network is extensive (see Figure 4), pipeline capac-ity is a concern given the development of Texas’ shale formations (specifically the Eagle Ford Shale). Concern has also been expressed about insufficient pipeline capacity serving Texas ports (18).
The Railroad Commission of Texas (RRC) has authority over pipelines that orig-inate and end within Texas (intrastate pipelines),5 for pipeline safety, and for pipeline rate regulation (20). In Texas, the pipeline owner or operator can be a gas utility or a private company. If the owner is a private company, the pipeline can be operated as a common carrier or a private pipeline. According to RRC, “common carrier pipelines are those that transport oil, oil products, gas, carbon dioxide, salt brine, sand, clay, liquefied minerals or other mineral solutions” (20). In general, common carrier pipelines in Texas have a statutory right of eminent domain, but RRC does not determine which pipelines are common carriers or regulate any “pipelines with respect to the exercise of their eminent domain powers” (20). In Texas, there are no per-mit requirements for building intrastate pipelines. The fixed cost to build a pipe-line is, however, very high and is typically recovered over the 60- to 70 year life of the pipeline (18). The exercise of eminent domain and the condemnation of pri-vate property for pipelines can be a very lengthy process. Inadequate pipeline infrastructure creates bottlenecks in the supply chain of natural gas, which add costs to the supply chain and increase the price of LNG exports.
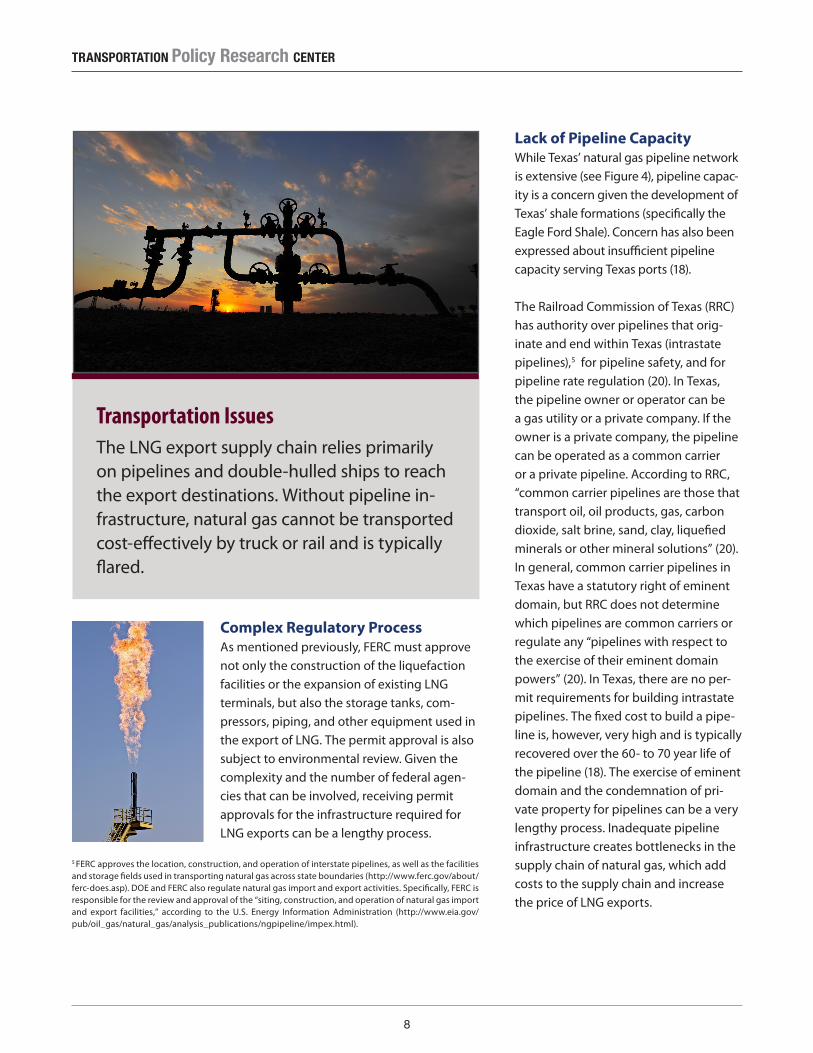
Transportation IssuesThe LNG export supply chain relies primarily on pipelines and double-hulled ships to reach the export destinations. Without pipeline in-frastructure, natural gas cannot be transported cost-effectively by truck or rail and is typically flared.
5 FERC approves the location, construction, and operation of interstate pipelines, as well as the facilities and storage fields used in transporting natural gas across state boundaries (http://www.ferc.gov/about/ferc-does.asp). DOE and FERC also regulate natural gas import and export activities. Specifically, FERC is responsible for the review and approval of the “siting, construction, and operation of natural gas import and export facilities,” according to the U.S. Energy Information Administration (http://www.eia.gov/pub/oil_gas/natural_gas/analysis_publications/ngpipeline/impex.html).
Complex Regulatory ProcessAs mentioned previously, FERC must approve not only the construction of the liquefaction facilities or the expansion of existing LNG terminals, but also the storage tanks, com-pressors, piping, and other equipment used in the export of LNG. The permit approval is also subject to environmental review. Given the complexity and the number of federal agen-cies that can be involved, receiving permit approvals for the infrastructure required for LNG exports can be a lengthy process.
9
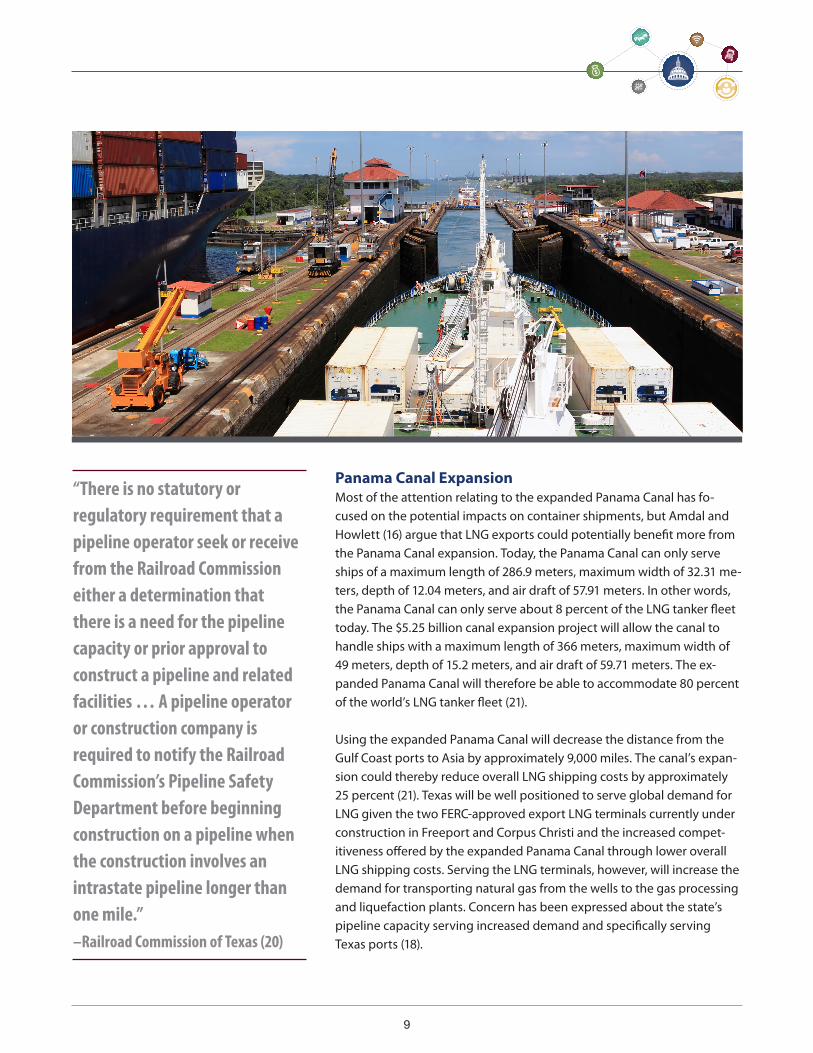
Panama Canal ExpansionMost of the attention relating to the expanded Panama Canal has fo-cused on the potential impacts on container shipments, but Amdal and Howlett (16) argue that LNG exports could potentially benefit more from the Panama Canal expansion. Today, the Panama Canal can only serve ships of a maximum length of 286.9 meters, maximum width of 32.31 me-ters, depth of 12.04 meters, and air draft of 57.91 meters. In other words, the Panama Canal can only serve about 8 percent of the LNG tanker fleet today. The $5.25 billion canal expansion project will allow the canal to handle ships with a maximum length of 366 meters, maximum width of 49 meters, depth of 15.2 meters, and air draft of 59.71 meters. The ex-panded Panama Canal will therefore be able to accommodate 80 percent of the world’s LNG tanker fleet (21).
Using the expanded Panama Canal will decrease the distance from the Gulf Coast ports to Asia by approximately 9,000 miles. The canal’s expan-sion could thereby reduce overall LNG shipping costs by approximately 25 percent (21). Texas will be well positioned to serve global demand for LNG given the two FERC-approved export LNG terminals currently under construction in Freeport and Corpus Christi and the increased compet-itiveness offered by the expanded Panama Canal through lower overall LNG shipping costs. Serving the LNG terminals, however, will increase the demand for transporting natural gas from the wells to the gas processing and liquefaction plants. Concern has been expressed about the state’s pipeline capacity serving increased demand and specifically serving Texas ports (18).
“There is no statutory or regulatory requirement that a pipeline operator seek or receive from the Railroad Commission either a determination that there is a need for the pipeline capacity or prior approval to construct a pipeline and related facilities … A pipeline operator or construction company is required to notify the Railroad Commission’s Pipeline Safety Department before beginning construction on a pipeline when the construction involves an intrastate pipeline longer than one mile.” –Railroad Commission of Texas (20)
TRANSPORTATION Policy Research CENTER
10
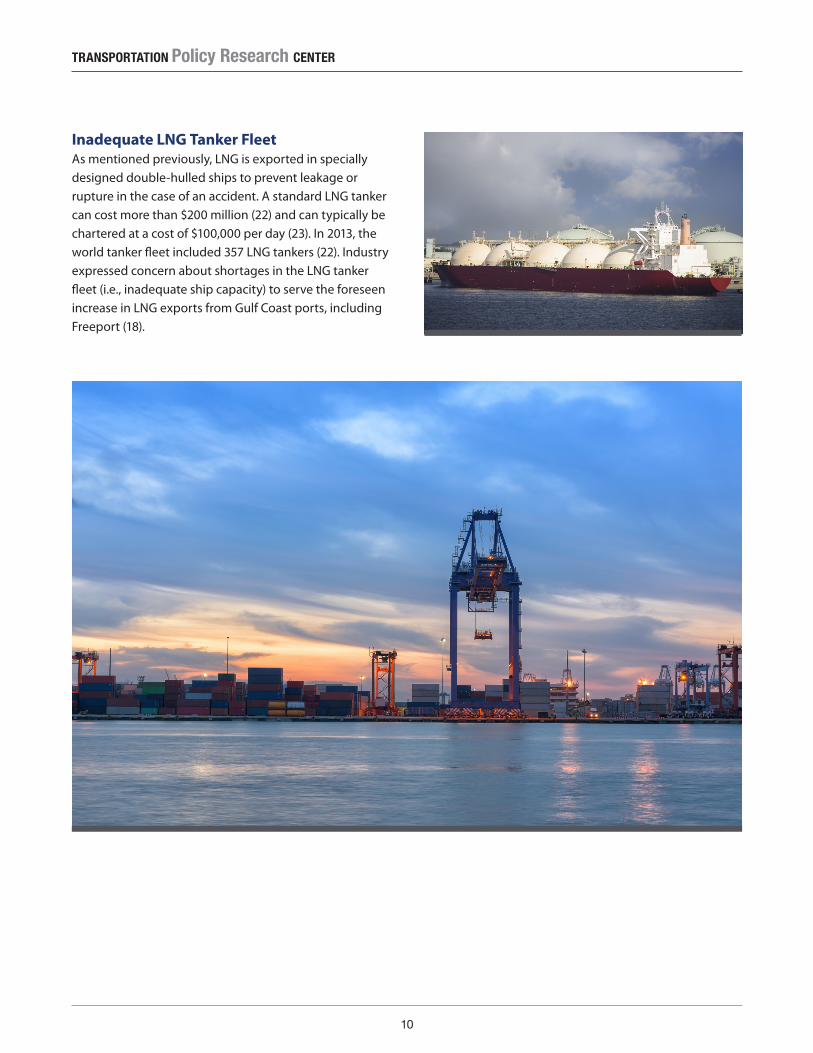
Inadequate LNG Tanker FleetAs mentioned previously, LNG is exported in specially designed double-hulled ships to prevent leakage or rupture in the case of an accident. A standard LNG tanker can cost more than $200 million (22) and can typically be chartered at a cost of $100,000 per day (23). In 2013, the world tanker fleet included 357 LNG tankers (22). Industry expressed concern about shortages in the LNG tanker fleet (i.e., inadequate ship capacity) to serve the foreseen increase in LNG exports from Gulf Coast ports, including Freeport (18).
11
Key FindingsThe following are the key findings from this research:
• Receiving permit approvals can be a lengthy process because of the complexity and number of federal agencies that can be involve in the approval of LNG exports and the infrastructure required for LNG ex-ports.
• Pipeline capacity is a concern given the development of Texas’s shale formations. Specifically, concern has been expressed about insufficient pipeline capacity serving Texas ports.
• An expanded Panama Canal will be able to handle 80 percent of the world’s tanker fleet (as opposed to 8 percent currently), thereby reducing overall LNG shipping costs by approximately 25 percent.
• Industry expressed concern about shortages in the LNG tanker fleet (i.e., inadequate ship capacity) to serve the foreseen increase in LNG exports from Gulf Coast ports, including Freeport.
TRANSPORTATION Policy Research CENTER
12
References1. Office of Trade and Economic Analysis. Texas Ex-
ports, Jobs, and Foreign Investment. International Trade Administration, U.S. Department of Com-merce, July 2015. http://www.trade.gov/mas/ian/statereports/states/tx.pdf.
2. Office of the United States Trade Representative. Fact Sheet: Unlocking Economic Opportunity for Texans through Trade. Executive Office of the President, October 2014. https://ustr.gov/about-us/policy-offices/press-office/fact-sheets/2014/Octo-ber/FACT-SHEET-Unlocking-Economic-Opportuni-ty-for-Texans-Through-Trade.
3. Horsley, J. AASHTO Freight Transportation Bottom Line. Presented to a Meeting of the Modes, Florida Transportation Commission, February 13, 2007. http://www.ftc.state.fl.us/documents/Presenta-tions/AASHTO-Freight_Transportation_Bottom_Line_%282-13-07%29.pdf.
4. Organization for Economic Cooperation and Development. Strategic Transport Infrastruc-ture Needs to 2030: Main Findings. International Futures Programme, OECED Futures Project on Transcontinental Infrastructure Needs to 2030/50, 2011. http://www.oecd.org/futures/infrastructure-to2030/49094448.pdf.
5. Railroad Commission of Texas. Railroad Commission of Texas Strategic Plan: Fiscal Years 2015–2019. July 2014.
6. U.S. Energy Information Administration. Natural Gas Gross Withdrawals and Production. Data Series: Marketed Production. http://www.eia.gov/dnav/ng/ng_prod_sum_a_EPG0_VGM_mmcf_a.htm.
7. U.S. Energy Information Administration. Natural Gas Wellhead Value and Marketed Production. http://www.eia.gov/dnav/ng/ng_prod_whv_dcu_stx_a.htm
8. U.S. Energy Information Administration. Texas: Profile Analysis. Updated November 20, 2014. http://www.eia.gov/state/analysis.cfm?sid=TX.
9. U.S. Energy Information Administration. Number of Producing Gas Wells. http://www.eia.gov/dnav/ng/ng_prod_wells_s1_a.htm.
10. U.S. Energy Information Administration. Natural Gas Pipelines in the Southwest Region. (Based on data through 2007/2008.) http://www.eia.gov/pub/oil_gas/natural_gas/analysis_publications/ngpipe-line/southwest.html.
11. Bujanda, A. and J.C. Villa. Texas International Trade Corridor Plan. Texas A&M Transportation Institute, The Texas A&M University System, College Station, Texas, 2012. http://ftp.dot.state.tx.us/pub/txdot-in-fo/tpp/misc/itcp.pdf
12. Federal Energy Regulatory Commission. National Natural Gas Market Overview. December 2015. http://www.ferc.gov/market-oversight/mkt-gas/overview/ngas-ovr-lng-wld-pr-est.pdf
13. Ratner, M., P. W. Parfomak, L. Luther, and I. F. Fer-gusson. U.S. Natural Gas Exports: New Opportuni-ties, Uncertain Outcomes. Congressional Research Service, January 28, 2015. https://www.fas.org/sgp/crs/misc/R42074.pdf.
14. Federal Energy Regulatory Commission. North American LNG Import/Export Terminals Approved. August 6, 2015. http://www.ferc.gov/industries/gas/indus-act/lng/lng-approved.pdf .
15. Freeport LNG. Liquefaction Project: Freeport LNG’s Liquefaction and Export Project. http://www.free-portlng.com/Liquefaction_Project.asp.
16. Amdal, J. R., and M. Howlett. Beyond Container Volumes: Panama Canal Expansion, Bulk Commodi-ty Exports, and the U.S. Gulf Coast. Paper submitted to the 2014 Transportation Research Board Annual Meeting. Uno Transportation Institute, University of New Orleans, 2014.
17. Federal Energy Regulatory Commission. North American LNG Export Terminals Proposed. August 6, 2015. http://www.ferc.gov/industries/gas/in-dus-act/lng/lng-proposed-export.pdf.
18. Personal communication with Port of Freeport, June 25, 2015.
13
19. Foss, M. M. Introduction to LNG: An Overview on Liquefied Natural Gas (LNG), Its Properties, Orga-nization of the LNG Industry and Safety Consid-erations. Center for Energy Economics, Bureau of Economic Geology, Jackson School of Geosciences, The University of Texas at Austin, 2007. http://www.beg.utexas.edu/energyecon/lng/documents/CEE_INTRODUCTION_TO_LNG_FINAL.pdf.
20. Railroad Commission of Texas. Pipeline Eminent Domain and Condemnation. http://www.rrc.state.tx.us/about-us/resource-center/faqs/pipeline-safe-ty-faqs/faq-pipeline-eminent-domain-and-con-demnation/.
21. Amdal, J. R., and M. Howlett. Use of Containers to Carry Bulk and Break Bulk Commodities and Its Im-pact on Gulf Region Ports and International Trade. Report No. SWUTC/14/600451-00105-1, Department of Planning and Urban Studies, University of New Orleans, August 2014.
22. Chen, X. Y. Investing in Liquefied Natural Gas Carri-ers: The Future of Natural Gas. Market Realist, May 22, 2014. http://marketrealist.com/2014/05/working-overview-of-investing-in-lng-carriers-future-of-nat-ural-gas/.
23. International Gas Union. World LNG Report—2014 Edition. Sponsored by Total. http://www.igu.org/sites/default/files/node-page-field_file/IGU%20-%20World%20LNG%20Report%20-%202014%20Edition.pdf.