examining the effects of fair value measurements on ... the effects of fair value measurements on...
TRANSCRIPT

Journal of Finance and Accountancy Volume 22
Examining the effects, Page 1
Examining the Effects of Fair Value Measurements on Financial
Reporting Quality and the Cost of Equity
Joseph D Reid
North Carolina A&T State University
ABSTRACT
This study examines whether the implementation of FASB Accounting Standards
Codification on Fair Value Measurements (ASC 820-10) improves financial reporting quality
and the cost of equity capital. ASC 820-10 was designed and implemented under the premise that
it would improve financial reporting quality and comparability of fair value measurements in
financial reports by requiring firms to disclose any activity within and between the three-distinct
fair value measurement levels. This study examines the annual and quarterly filings of firms with
level 2 and level 3 fair value activity from 2007 through 2012. Results reveal that financial
reporting quality increased as a result of ASC 820-10 adoption. Results signal to standard setters,
investors and regulators that the increased mandatory disclosures around the measurement of
unobservable inputs (i.e. level 3 securities) are value relevant and economically significant. This
study extends the literature fair value relevance, information asymmetry and information
precision in fair value measurements. Furthermore, this study provides increased evidence on the
use of earnings forecasts generated by a cross sectional model as an acceptable alternative to
analysts’ forecasts in implied cost of capital models.
Keywords: Fair value, Cost of Capital, Disclosure, Valuation, Financial Reporting
Copyright statement: Authors retain the copyright to the manuscripts published in AABRI
journals. Please see the AABRI Copyright Policy at http://www.aabri.com/copyright.html

Journal of Finance and Accountancy Volume 22
Examining the effects, Page 2
INTRODUCTION
The collapse of Bear Stearns coupled with the increased volatility in the market, reignited
the debate around the relevancy of fair value measurements and subsequently led to revision of
fair value accounting and disclosure policies, Accounting Standards Codification 820-10
(hereafter referred to as ASC 820-10), in 2009. ASC 820-10 required the disclosure of activities
within and between the three distinct fair value measurement levels. Extant literature on the
economic impact of increased disclosure is mixed at best (Botosan and Plumlee 2002; Chen et
al., 2010; Callahan et al. 2012). Furthermore, prior literature concerning the relevancy of level 2
and level 3 fair value measurement inputs and their relation to financial reporting quality is
inconsistent (Whalen 2008; Song et al.,2010). The fundamental research objective of this study is
to determine whether the increased disclosure mandated by ASC 820-10 improves financial
reporting quality by examining and evaluating the relation between ASC 820-10, the cost of
equity and financial reporting quality.
This study examines the annual and quarterly filings of firms with level 2 and level 3 fair
value activity from 2007 through 2012 and identifies a sample of 216 firms with disclosed
transfer activity and 284 firms without material transfer activity. The overall results reveal that
financial reporting quality (cost of equity capital) increased (decreased) as a result of ASC 820-
10 adoption and the effect is significantly different for firms affected relative to firms not
materially affected by ASC 820-10.
ASC 820-10 was adopted with the intent to increase financial statement transparency and
comparability surrounding fair value measurements. Critics of fair value accounting and some
practitioners believed that compliance would be “…too onerous, operationally challenging, and
would not provide useful information.” Theoretically, increased disclosure that reduces
information asymmetry (risk) will increase financial statement readability and decrease the cost
of capital. The efforts of the International Accounting Standards Board (IASB) and Financial
Accounting Standards Board (FASB) for the past two decades have in some part included efforts
to increase financial statement readability through transparent disclosure. This however assumes
that the disclosed information is precise and therefore reduces the uncertainty between the
informed and uninformed investor. If the disclosed information lacks precision, the value of the
information is discounted and its effect on investor perception becomes ambiguous (Bean and
Irvine, 2015). The majority of academic literature on the cost of capital effects of increased
disclosure documents a negative relationship however that relationship does not always hold and
the effect, if any, is a function of a perceived reduction in information asymmetry and future cash
flow effects. .” ASC 820-10 attempts to remove some of the ambiguity surrounding fair value
estimates by improving the disclosures concerning the activity within and between levels. The
impact of these disclosures and whether information asymmetry is reduced remains an open
empirical question.
Overall, the results of this study conclude that the mandatory disclosure requirement of
ASC 820-10 does increase financial reporting quality and provides useful information to
investors, despite managerial opposition to its adoption. This paper makes three contributions.
First these results signal to standard setters that the increased mandatory disclosures around the
measurement of unobservable inputs (i.e. level 3 securities) are value relevant and economically
significant. Secondly, this study extends the literature on the relation between fair value
relevance, information asymmetry and information precision and contributes to the debate on the
efficacy of unobservable units in fair value measurements. Lastly, this study provides increased

Journal of Finance and Accountancy Volume 22
Examining the effects, Page 3
evidence on the use of earnings forecasts generated by a cross sectional model as an acceptable
alternative to analysts’ forecasts in implied cost of capital models.
The remainder of this paper proceeds as follows: section two discusses the relevant background,
prior research and presents hypotheses; sections three and four describe the sample selection
process and research methodology, respectively; section five presents the results and section six
concludes the study with a discussion of the results.
BACKGROUND AND HYPOTHESES DEVELOPMENT
Statement of Financial Accounting Standards No. 157, “Fair Value Measurements,”
(SFAS 157) was implemented by the Financial Accounting Standards Board (FASB) for
financial statements issued for fiscal years beginning after November 15, 2007, and interim
periods within those fiscal years. SFAS 157 clearly defined fair value, instituted a framework for
measuring fair value according to generally accepted accounting principles (GAAP), and
expanded disclosures about fair value measurements in an effort to provide more relevant
financial information and increase consistency and comparability in fair value measurements.
SFAS 157 defined fair value as the exchange price in an orderly transaction between
market participants to sell an asset or transfer a liability in the market in which the reporting
entity would transact for the asset or liability. The focus is on the exit price-that is the price that
would be received to sell the asset or paid to transfer the liability. SFAS 157 did not require any
new fair value measurements but did provide guidance for determining the fair values of assets
and liabilities and required the disclosure of information about (1) the use of fair value to
measure assets and the extent to which companies measure assets and liabilities at fair value; (2)
the information used to measure fair value; and (3) the effect that fair-value measurements have
on earnings. SFAS 157 also established a three-tiered framework for measuring fair value and
dictated that the fair value of all assets and liabilities be disclosed into one of the following
categories based on the inputs to measure fair values:
(1) Level 1-observable prices in active markets for identical assets and liabilities that the
reporting entity has the ability to access at the measurement date. An active market
for the asset or liability is a market in which transactions for the asset or liability
occur with sufficient frequency and volume to provide pricing information on an
ongoing basis. An example would be the unadjusted quoted price of an actively
traded “blue chip” security on a nationally recognized stock exchange.
(2) Level 2-observable inputs other than quoted prices included within level 1 that are
observable for the asset or liability, either directly or indirectly. Level 2 inputs include:
a) Quoted prices for similar assets or liabilities in active markets.
b) Quoted prices for identical or similar assets or liabilities in markets that
are not active, the prices are not current or price quotations vary
substantially either over time or among market makers (for example,
some brokered markets), or in which little information is released publicly
(for example, principal-to-principal market).
c) Inputs other than quoted prices that are observable for the asset or liability
(for example interest rates and yield curves observable at commonly
quoted intervals)
Journal of Finance and Accountancy Volume 22
Examining the effects, Page 4
d) Inputs that are derived principally from or corroborated by observable
market data by correlation or other means (market-corroborated inputs).
(3) Level 3- unobservable inputs for the asset or liability and shall be used to measure fair
value to the extent that observable inputs are not available (FASB 2006).
During 2008, amid the most recent financial crisis (2007-2009), the utility and efficiency
of fair value accounting came under intense public scrutiny. The considerable amount of public
objection to fair value prompted action from policy makers and regulators. The Securities and
Exchange Commission’s Division of Corporation Finance issued letters to some public
companies encouraging additional disclosures in the MD&A section of their SEC filings about
the application of the fair value measurement standards in U.S GAAP. Congress passed The
Emergency Stabilization Act of 2008 which granted authority to the SEC to suspend by rule,
regulation, or order, the application of SFAS 157 for any issuer or with respect to any class or
category of transaction if the SEC determined that it is necessary or appropriate in the public
interest and is consistent with the protection of investors. In addition, the Act required the SEC
to study fair value accounting and report on: (1) the effects of such accounting standards on a
financial institution’s balance sheet; (2) the impact of such accounting on bank failures in 2008;
(3) the impact of such standards on the quality of financial information available to investors; (4)
the process used by the FASB in developing accounting standards; (5) the advisability and
feasibility of modifications to such standards; and (6) alternative accounting standards to those
provided in SFAS 157. The SEC was required to submit to Congress a report of the study within
a 90-day period containing the findings and determinations of the SEC, including any
administrative and legislative recommendations. The report concluded that more detailed
information about the holdings of specific financial assets (e.g. Level 2 and Level 3) as well as
the methods by which they are valued be required and disclosed.
In response to the developments summarized above, the FASB issued an update to Fair
Value Measurements and Disclosures (ASC 820-10) of the FASB Accounting Standards
Codification (originally issued as FASB Statement No. 157, Fair Value Measurements) in
February 2010. The main provisions of this amendment require improved disclosures
concerning: (1) Transfers in and out of Levels 1 and 2. A reporting entity should disclose
separately the amounts of significant transfers in and out of level 1 and level 2 fair value
measurements and describe the reasons for the transfers. (2) Activity in level 3 fair value
measurements. In reconciliation for fair value measurements using significant unobservable
inputs (level 3), a reporting entity should present separately information about purchases, sales,
issuances, and settlements (that is on a gross rather than net basis). The amendment also
provided clarification concerning existing disclosures as follows: (1) level of disaggregation. A
reporting entity should provide fair value measurement disclosures for each class of assets and
liabilities. A class is often a subset of assets or liabilities within a line item in the statement of
financial position. A reporting entity needs to use judgment in determining the appropriate
classes of assets and liabilities. (2) Disclosures about inputs and valuation techniques. A
reporting entity should provide disclosures about the valuation techniques and inputs used to
measure fair value for both recurring and nonrecurring fair value measurements. Those
disclosures are required for fair value measurements that fall in either level 2 or level 3. Most
recently, the utility of fair value accounting has become a heated debate among standard setters,
policy makers and market participants. Penman (2007) and other proponents of fair value

Journal of Finance and Accountancy Volume 22
Examining the effects, Page 5
accounting assert that the fair values of assets or liabilities reflect current market conditions and
provide more timely information and increase transparency when compared to historical cost
accounting. Critics argue that fair value accounting is not relevant or misleading for assets held
to maturity and contributed extensively to the financial crisis (Benston, 2008; Whalen, 2008;
Forbes, 2009). However, recent studies have shown that fair value information is value relevant
and there were myriad factors that contributed to the financial crisis. Ryan (2008) finds that
“...the subprime crisis is not and could not be the fault of any one set of parties. The entire
economic ecosystem failed to appreciate the risks of the rapid growth in risk-layered subprime
mortgages, the inevitable end of house price appreciation, and unprecedented global market
liquidity.” Ryan (2008) further concludes that …”Users of financial reports need better
disclosures about the critical estimates underlying level 3 fair values and how sensitive fair
values are to those estimates.” Bean and Irvine (2015) examine the decision-usefulness of annual
derivative disclosures and find that generally disclosures were criticized for “not providing
sufficient insight into companies risk and risk management strategies.” ASC 820-10 attempts to
remove some of the ambiguity surrounding fair value estimates by improving the disclosures
concerning the activity within and between levels. ASC 820-10 provides academic researchers
with the opportunity to empirically examine the relation between disclosure, financial reporting
quality and cost of equity capital within an illiquid market context. The next logical step for
accounting academic researchers was to explore the value relevance of fair value measurements
with respect to the disaggregation of level information demanded by the new standard.
Accounting information is considered to be value relevant when it has the predicted association
with market value of equity (Barth et al., 2001). Several studies support the FASBs assertion that
fair value information is relevant but varies with the source of information (i.e. type of security).
Barth (1994) results suggest that the fair values of investment securities of banks and property
insurers are value relevant, while Petroni and Wahlen (1995) find that fair values for equities and
Treasury securities are value relevant, but fair values of municipal and corporate bonds are not.
The findings by Petroni and Wahlen (1995) suggest that securities actively traded in the market
are more reliably associated with market value of equity. In the same vein, Kolev (2009) and
Song et al. (2010) find that all Level information is value relevant; however level 3 fair value
estimates of assets and liabilities are valued less than level 1 or level 2 by investors, irrespective
of security type. This suggests that investors recognize the inherent bias of level 3 estimates in
financial reporting and adjust their investment decisions accordingly. Overall, these results
suggest that fair value estimates are reliable and value relevant despite the fact that investors are
likely to decrease the value placed on level 3 fair value measurements relative to level 1 and 2.
Financial reporting quality is a multidimensional construct that encompasses such dimensions as
earnings quality, shareholder relations, financial disclosures and non-financial disclosures (Gu
and Li, 2007). Consistent with SFAC No. 1 and prior literature (DeChow et al., 2010), financial
reporting quality is defined as follows:
Higher quality financial reporting provides more information about the firms’
performance relevant to a specific decision by a specific decision maker.
The above definition implies that financial reporting quality is dependent on the
informativeness of information relevant to financial performance. Extending this implication in
conjunction with the empirical evidence on fair value measurements suggests that transfers
between categories will likely have differential effects on financial reporting quality and cost of

Journal of Finance and Accountancy Volume 22
Examining the effects, Page 6
equity capital. Extant literature has employed many different empirical proxies for financial
reporting quality including but not limited to: earnings persistence and predictability, residuals
from accrual models, earnings smoothness, timely loss recognition and earnings response
coefficient (Callahan et al., 2002; Dechow et al., 2010; Ng, 2011).
Botosan (1997), Botosan and Plumlee (2002) and Francis et al. (2004) document a
significant association between financial reporting quality and both the ex-ante cost of equity
capital and the ex post cost of equity capital. Botosan (1997) examines the effect of disclosure
level on the cost of equity capital for 122 manufacturing firms in 1990. The results of this study,
after controlling for size and beta, suggest that greater disclosure is associated with a lower cost
of equity capital for firms with low analyst following, while there is no significant relationship
observed for firms with high analyst following. This suggests that disclosure has an
incrementally greater effect for firms where perceived information asymmetry is greatest. This
finding is directly relevant to fair value level estimates as there is greater information asymmetry
for level 3 estimates relative to level 1 and 2, respectively. Extending the Botosan (1997)
findings, Botosan and Plumlee (2002) find that the type (10-Q, 8-K, Other, etc.) and frequency
(annual versus quarterly) of disclosure determines its effect on the cost of equity capital.
Consistent with the findings of Botosan (1997), Botosan and Plumlee finds that greater
disclosure in annual statements results in a difference of about a 0.7 percentage point in cost of
equity capital between the most and least forthcoming firms. Results also indicate, contrary to
theoretical and empirical studies on the effect of increased disclosure on the cost of equity
capital, that more timely disclosures increase the cost of equity capital.
Analytical research from Easley and O’Hara (2004) and empirical evidence from Francis
et al. (2004) demonstrate that firm specific information risk is priced and cannot be diversified
away. Easley and O’Hara (2004) develop an asset pricing model that incorporates the effect of
public and private information on asset returns. This model provides a link between information
structure (disclosure policies) and cost of equity capital that shows that private information
increases systematic risk and investors must be compensated for bearing this risk. Francis et al.
(2004) examines the relationship between seven attributes of earnings (accrual quality,
persistence, predictability, smoothness, value relevance, timeliness and conservatism) and cost of
equity capital. Results suggest that accounting-based attributes have a greater effect of cost of
equity capital than market-based attributes with accrual quality having the most pronounced
effect. This implies that investors recognize and price the subjectivity of accruals when
considering investment choices. This implication is important for fair value estimates,
specifically level 2 and level 3, as both contain at the minimum, a moderate level of managerial
subjectivity in formulating estimates. The above research provides theoretical motivation and
support for the link between cost of equity capital and financial reporting quality.
Financial reporting quality can be directly linked to the cost of equity capital through the
theories of incomplete information, estimation risk, information asymmetry, and impacts on
future cash flows (Legoria et al., 2008; Ng, 2011). Incomplete information (Merton, 1987) arises
when investors are unaware of all investment opportunities, which results in a smaller investor
base and lower stock price. Estimation risk is affected when investors are uncertain about the
return distribution parameters which lead investors to demand higher required rates of return
(Barry and Brown, 1984). Information asymmetry risk (Easley & O’Hara, 2004) occures when
informed investors exploit their informational advantage to earn trading gains at the expense of
less informed investors. Amihud and Mendelson (1986) find a positive association between bid-
ask spreads and stock returns and Brennan and Subrahmanyam (1996) show a positive relation

Journal of Finance and Accountancy Volume 22
Examining the effects, Page 7
between stock returns and inverse market depth. Overall, these studies indicate that investors
demand a premium for holding illiquid stocks and lower market liquidity impacts the cost of
equity capital. Financial reporting quality is thus indirectly linked to the cost of capital (via its
effects on spreads and depth) to the extent that higher reporting quality reduces information
asymmetry and cost of capital (Callahan et al., 2002; Legoria et al., 2008; Ng. 2011). In
summary, the aforementioned theories and empirical and analytical evidence predict that
increased mandatory disclosure from compliance with ASC 820-10 should (1) reduce incomplete
information, (2) reduce estimation risk, (3) reduce information asymmetry, and/or (4) impact
expected future cash flows. Based on the above discussion, I hypothesize:
H1: There is no relation between financial reporting quality and transfers of level 3 fair
value measurements.
H2: There is no relation between cost of equity capital and transfers of level 3 fair value
measurements.
SAMPLE SELECTION AND DESCRIPTION
The sample was compiled using a combination of hand gathered procedures and available
data from Compustat and I/B/E/S databases. First, all firms with any activity in level 2 and level
3 from 2007 to 2012 were identified in Compustat resulting in 816 firms. Next, the number of
firms in the initial sample was reduced by 238 because of missing Compustat data and 76 firms
because of missing price data in CRSP. The above procedures results in a final sample of 502
firms and 8,416 firm-quarter observations for the 2007 through 2012 period.
To gather disclosure data on selected firms, 10-K Wizard search engine was employed to
search quarterly and annual reports filed beginning in Q3 2009. Transfers between fair value
hierarchical levels were identified with a keyword search for all occurrences of “transfers
to/from level 3 (III)” and “Level 2 (3) reclassification” in quarterly and annual financial
statements. This process produced a subsample of 218 firms with transfers between level 2 and
level 3 and 284 firms that reported “no material activity between levels” and/or “adoption of
ASC 820-10 does not materially affect the financial statements.” Panel A of Table 1 (Appendix)
describes the final sample of 502 firms and subsample of firms with (218) and without (284)
transfer activity while Panel B of Table 1 (Appendix) reports level 3 transfer activity.
RESEARCH METHODOLOGY AND EMPIRICAL PROXIES
To examine the effect of the increased disclosure around fair value estimates on financial
reporting quality and cost of equity, this study utilizes a difference in difference comparative
statistical methodology (Muller et al., 2011; Callahan et al., 2012; Reid, 2016). The most
significant “revision” of fair value accounting disclosures, FAS 157, was implemented and
effective for interim and annual periods beginning after November 15, 2007. The amendment to
FAS 157, ASC 820-10, became effective for interim and annual periods beginning December 15,
2009. Figure 1 (Appendix) provides a graphical depiction of the 33 month period reviewed from
the fourth quarter of 2009 through the second quarter of 2012. Prior academic literature is split
on the definition and measurement of financial reporting quality (DeChow et al., 2010). The list
of acceptable proxies for financial reporting quality is extensive and yet there is no superior

Journal of Finance and Accountancy Volume 22
Examining the effects, Page 8
measure for all decision models. In this study, the proxy for financial reporting quality is
motivated by prior research (Dichev et al., 2012; Ng , 2011; Reid, 2016).
Control Variables
Following prior literature (Barth et al., 2008), the following control variables are used to
test the relation between financial reporting quality and ASC 820-10.
Variable definitions:
size = log of market value of equity at the end of the previous period
growth = percentage change in sales
eissue = percentage change in common stock
dissue = percentage change in total liabilities
leverage = short-term debt divided by market value of equity
cashflow = quarterly net cash flow from operating activities divided by end of quarter
total assets
auditor = 1 if audited by one of the Big Four firms, 0 otherwise
alv1 (alv2, alv3) = total quarterly assets in levels 1, 2 and 3 respectively
llv1 (llv2, llv3) = total quarterly liabilities in levels 1, 2 and 3 respectively
lv3change = change in level 3 assets over the previous qtr.
ni = net income for the quarter
roe = return on equity for the quarter
Prior research documents the difficulty in accurately estimating the cost of capital as
evidenced by the use of multiple measures in research studies (Dhaliwal et al., 2006;
Bhattacharya et al., 2012; Callahan et al., 2012; Fu et al., 2012). To ensure that results are robust
to methodological choice, this study uses multiple measures to estimate the implied cost of
equity capital (Ogneva et al., 2010; Chen et al., 2010). Following prior literature, this study uses
a special case of the Gordon growth model, the PEG ratio and a modified residual income
valuation model developed by Gebhardt et al. (2001) in addition to the average of the three
proxies as implied cost of capital measures (Hou et al., 2012).
Control Variables
Prior literature (Hughes et al., 2009) suggests that studies that utilize implied cost of
equity as a dependent variable should control for factors associated with cash flow volatility,
leverage, beta and growth and as such I include these variables as controls in the base model.
Variable definitions:
alv1 (alv2, alv3) = total quarterly assets in levels 1, 2 and 3 respectively
llv1 (llv2, llv3) = total quarterly liabilities in levels 1, 2 and 3 respectively
level3 = total quarterly level 3 fair value measurements, log transformed
leverage = short-term debt divided by market value of equity
ubeta = unlevered beta based on a single factor model
sdocf = standard deviation of operating cash flows over previous five years plus 1, log
transformed
sdbeta = standard deviation of beta values over previous year plus 1, log transformed

Journal of Finance and Accountancy Volume 22
Examining the effects, Page 9
oigrowth = operating income this quarter divided by operating income in previous quarter
size = log of market value of equity at the end of the previous period
Panel A of Table 2 (Appendix) displays the descriptive statistics for sample firms by time
period while Panel B of Table 2 (Appendix) provides descriptive statistics by category of transfer
activity. Firms without material level 3 transfer activity generally had smoother earnings than
transfer firms. The difference in the implied cost of capital estimates for the two categories are
marginally significant for rgls and rmpeg while rgdn and ravg show no difference between the
categories. Overall, Panel B of Table 2 (Appendix) indicates that firms with material transfers
have more volatile earnings, issue more debt and have faster growth when compared to firms
without material transfer activity.
Models for Tests of Financial Reporting Quality (H1) and Cost of Capital (H2)
To test H1, the following model is used:
Yit = β0it + β1ascit + β2fv3_trnsit + β3asc x fv3_trnsit + β4sizeit + β5growthit + β6eissueit + β7dissueit
+ β8leverageit + β9cashflowit + β10auditorit + β11alv1it + β12alv2it + β13alv3it + β14llv1it + β15llv2it +
β16lv3it + β17lv3changeit + β18niit + β19roeit + eit (1)
where Yit indicates one of the proxies for financial reporting quality, Smoothness,
Consensus and Frquality, detailed above. ASC is a dummy variable coded as 1 if
calendar quarter is after Q4 2009, 0 otherwise; fv3_trns is a dummy variable coded as 1 if
transfer activity to/from level 3, 0 otherwise; asc x fv3_trns is the interaction term coded
1 if both asc and fv3_trns equal 1, 0 otherwise.
This study uses earnings forecasts generated from a cross sectional model to proxy for
analysts’ forecasts in the estimation of implied cost of capital. Earnings forecasts are used in lieu
of analysts’ forecasts because prior literature finds that analyst forecasts are generally bias
resulting in valuation errors (Abarbanell and Bushee, 1997; McNichols and O’Brien, 1997;
Francis et al., 2000). Secondly, analyst data obtained from IBES database is dominated by large
and financially stable firms. Small or distressed firms are not likely to have analyst data available
while many of those firms that are followed by analysts do not have long term growth forecasts
necessary to compute the implied cost of capital in some models. Following Hou et al., (2012)
earnings forecasts, estimated for five years from time t, are used to calculate the implied cost of
capital in the various models from 1992-2011.
To test H2 using the implied cost of capital measures, the following model is used:
rit = β0it + β1ascit + β2fv3_trnsit + β3asc x fv3_trnsit + β4alv1it + β5alv2it + β6alv3it + β7llv1it +
β8llv2it + β9llv3it + β10highfrqit + β11lowfrqit + β12asc x highfrqit + β13asc x lowfrqit +
β14leverageit +β15ubetait + β16sdocfit + β17sdbetait + β18oigrowthit + β19sizeit + eit (2)
where re indicates one of the proxies for implied cost of capital, ravg, rgdn, rmpeg or rgls
referenced above and detailed in Chart 1 (Appendix). ASC is a dummy variable coded as
1 if calendar quarter is after Q4 2009, 0 otherwise; fv3_trns is a dummy variable coded as
1 if transfer activity to/from level 3, 0 otherwise; asc x fv3_trns is the interaction term
coded 1 if both asc and fv3_trns equal 1, 0 otherwise. highfrq is the high financial

Journal of Finance and Accountancy Volume 22
Examining the effects, Page 10
reporting quality proxy dummy coded as 1 if in top quartile of each financial reporting
quality proxy, 0 otherwise; lowfrq is the low financial reporting quality proxy dummy
coded as 1 if in bottom quartile of each financial reporting quality proxy, 0 otherwise; asc
x highfrq is the interaction term coded 1 if both asc and highfrq equal 1, 0 otherwise; asc
x lowfrq is the interaction term coded 1 if both asc and lowfrq equal 1, 0 otherwise;
RESULTS
Table 3 (Appendix) presents the correlation coefficients for the financial reporting
quality proxies and associated control variables. Table 4 (Appendix) presents the results for
the analysis of the relation between financial reporting quality and ASC 820-10. The
significant negative coefficient for asc, fv3_trns and asc x fv3 when financial reporting
quality is proxied by smoothness and frquality indicate that financial reporting quality
increased. The Cconsensus proxy did not return any significant results and may be the result
of analysts discounting the information and not including it in earnings expectations.
Furthermore, the results found in Table 4 (Appendix) reflect the mean effect of ASC 820-10
on financial reporting quality and assumes the effect is the same for all firms. This is an
erroneous assumption as the perceived effect will vary depending on the existing
information environment of the firm. To analyze how ASC 820-10 affects firms differently,
the sample was split into quartiles based on financial reporting quality. The first (fourth)
quartile represents the firms with the highest (lowest) financial reporting quality as
calculated by smoothness, consensus and frquality.
Table 5 (Appendix) presents the regression results of the relation between financial
reporting quality and ASC 820-10 for fourth quartile. In Table 5 (Appendix) the significant
negative coefficient for smoothness (-.1617) and consensus (-4.867) indicates that the
release of ASC 820-10 increased financial reporting quality for those firms affected. This is
not surprising as financial analysts are more sophisticated and privy to more precise and
private information than most investors. Therefore, it is reasonable to assume that the
release of ASC 820-10 likely provided some informational advantage to analysts and
therefore had a negative effect of financial statement transparency. Overall, results provide
support for H1 and indicate that for the full sample ASC 820-10 increases financial
reporting quality for the average investor but decreases for more sophisticated investors (i.e.
analysts). Additionally, the results indicate that for firms within the fourth quartile the
concentration of fair value assets and liabilities of all levels significantly impact financial
reporting quality. This is an important distinction as this effect is not realized for firms in
the first, second and third quartiles.
Table 6 (Appendix) presents the correlation coefficients for the implied cost of capital
proxies and associated control variables. The results follow expectations and prior literature
with the risk proxies being significantly related to the implied cost of capital measures,
leverage and size. To test the relationship between financial reporting quality and ASC 820-
10 the sample was sorted by financial reporting quality and placed into two groups, highfrq
and lowfrq. The highfrq group represents firms in the top quartile and the lowfrq represents
firms in the bottom quartile of financial reporting quality as measured by smoothness,
consensus and frquality. Analyzing the data in this manner provides clear evidence of the
relative impact of ASC 820-10 on firms with varying information environments. Table 7
(Appendix) presents the results for the regression analysis of implied cost of capital proxies

Journal of Finance and Accountancy Volume 22
Examining the effects, Page 11
on ASC 820-10 for the full sample. Results in Table 7 (Appendix) indicate that there is a
significant relationship between implied cost of capital (rmpeg) and asc but for no other
measure of implied cost of capital. However, these results are on the full sample of firms.
For additional analysis, the sample was bifurcated into those firms with material
transfers of level 3 fair value measurements and those without. Data was also gathered
concerning the type (asset/liability) and direction (transfer into/out level 3) of the level 3
fair value transfers to provide further clarity on the relationship between implied cost of
capital and illiquid securities. Table 8 (Appendix) presents the results for the regression
analysis of implied cost of capital proxies on firms with material transfer activity. Results
indicate that transfers into level 3 by firms with low financial reporting quality do not have
a significant negative relationship with implied cost of capital. In addition, firms with
transfers into level 3 fair value measurements report both a significant negative and positive
relationship with implied cost of capital. These results are consistent with the implication
expressed above that ASC 820-10 provides limited information advantage, if any, for those
firms with high financial reporting quality or those firms with poorer informational
environments. Overall, these results support H2. In additional analysis I test the sensitivity
of these results by various measures of size (total sales; # employees and; total assets) and
found that the aforementioned results held; The disclosure requirement did improve the
financial reporting quality of those firms affected, however its affect on the implied cost of
capital is sensitive to its measurement.
CONCLUSION AND EXPECTED CONTRIBUTIONS
Overall this study concludes that the mandatory disclosure requirements of Subtopic 820-
10 does increase financial reporting quality and provides useful information to investors, despite
managerial opposition to its adoption. These results may be used by financial analysts, investors,
creditors, and suppliers as a proxy for managerial stewardship, consideration of investment
decisions by these various stakeholders and by regulators evaluating the efficacy of the reporting
standard. These results signal to standard setters that the increased mandatory disclosures around
the measurement of unobservable inputs (i.e. level 3 securities) are value relevant and
economically significant. This study extends the literature on the relation between fair value
relevance, information asymmetry and information precision and contributes to the debate on the
efficacy of unobservable units in fair value measurements. Furthermore, this study provides
increased evidence on the use of earnings forecasts generated by a cross sectional model as an
acceptable alternative to analysts’ forecasts in implied cost of capital models.
The results of this study should be interpreted with the consideration of its limitations.
First, it is unclear if and how these results would change if restricted to a specific industry (i.e.
banking, insurance) and/or an increased sample period. Second, the validity of FAS 157 when
market liquidity is low (e.g., time period from which the sample was taken) is unclear and its
effects unknown. These limitations offer adequate avenues for future research.

Journal of Finance and Accountancy Volume 22
Examining the effects, Page 12
REFERENCES
Abarbanell, J., and B. Bushee, 1997, “Fundamental Analysis, Future Earnings, and Stock
Prices,” Journal of Accounting Research, 35, 1-24.
Aboody, D., M. E. Barth, and R. Kasznik. 2006. Do firms understate stock option-based
compensation expense disclosed under FAS 123? Review of Accounting Studies 11 (4).
Affleck-Graves, John, Carolyn M. Callahan and Niranjan Chipalkatti. 2002. Earnings
Predictability, Information Asymmetry and Market Liquidity. The Journal of Accounting
Research 40, (3) (Jun.): pp. 561-583.
Affleck-Graves, John, Shantaram P. Hedge, and Robert E. Miller. 1994. Trading mechanisms
and the components of the bid-ask spread. The Journal of Finance 49 (4) (Sep.).
Altman, E. I., Distressed Securities: Analyzing and Evaluating Market Potential and Investment
Risk, 2nd ed., Beard Books, 1999.
Altman, E. I., Bankruptcy, Credit Risk and High Yield Junk Bonds, Blackwell Publishers, 2001.
Amihud, Y. and H. Mendelson. 1986.Asset pricing and the bid–ask spread. Journal of Financial
Economics 17 (3): 223–249.
Acharya, V.,Pedersen, L.H.. 2005. Asset Pricing with liquidity risk. The Journal of Financial
Economics 77, pp. 375-410.
Barry C. and S. Brown. 1984. Differential information and the small firm effect. Journal of
Financial Economics 13, pp. 283–294.
Barth, Mary E. 1994. Fair value accounting: Evidence from investment securities and the market
valuation of banks. The Accounting Review 69, (1) (Jan.): pp. 1-25.
Barth, Mary E., William H. Beaver, and Wayne R. Landsman. 2001. The relevance of the value
relevance literature for financial accounting standard setting: Another view. Journal of
Accounting and Economics 31, (1-3) (9): 77-104.
Barth, Mary E., Wayne R. Landsman, and Mark H. Lang. 2008. International Accounting
Standards and Accounting Quality. Journal of Accounting Research 46, (9): 467-498.
Bartov, E., P. Mohanram, and D. Nissim. 2007. Managerial discretion and the economic
determinants of the disclosed volatility parameter for valuing ESOs. The Review of
Accounting Studies 12. Pp. 155-179.
Beaver, W.H., 1966. Financial Ratios as Failure, Supplement Supplement to Journal of
Accounting Research. Pp. 71-111.
Beaver W., M. McNichols and J. Rhie, ‘Have Financial Statements Become Less Informative?
Evidence From the Ability of Financial Ratios to Predict Bankruptcy’, Review of Accounting
Studies, March 2005.
Bebchuk, Lucian, Alma Cohen, and Allen Ferrell. 2005. The costs of entrenched boards. Journal
of Financial Economics 78 (2), 409– 433.
Bebchuk, Lucian, Alma Cohen, and Allen Ferrell.. 2009. What matters in corporate governance?
The Review of Financial Studies 22, (2) (Feb.): pp. 783-827.
Belsley, D.A., E. Kuh and R.E. Welsch. 1980. Regression diagnostics: Identifying influential
data and sources of collinearity. John Wiley & Sons. New York, NY (1980).
Bens, Daniel A., and Steven J. Monahan. 2004. Disclosure quality and the excess value of
diversification. Journal of Accounting Research 42, (4) (Sep.): pp. 691-730.
Benston, G. J. 2008. The shortcomings of fair-value accounting described in SFAS 157. Journal
of Accounting and Public Policy, 27, 101–114.

Journal of Finance and Accountancy Volume 22
Examining the effects, Page 13
Bhattacharya, N.; E. Black; T. Christensen; and C. Larson. Assessing the Relative
Informativeness and Permanence of Pro Forma Earnings and GAAP Operating
Earnings. Journal of Accounting and Economics 36 (2003): 285–319.
Bhattacharya, N., F. Ecker, P.M. Olsson and K. Schipper. 2012. Direct and Mediated
Associateions among Earnings Quality, Information Asymmetry, and the Cost of Equity.
The Accounting Review 87 (2):449-482.
Black, F. 1971. Towards a fully automated exchange, Part 1, Financial Analysts Journal (27).
Bollen, Nicolas P. B., Tom Smith, and Robert E. Whaley. 2004. Modeling the bid/ask spread:
Measuring the inventory-holding premium. Journal of Financial Economics 72, (1) 97-141.
Botosan, Christine A. 1997. Disclosure level and the cost of equity capital. The Accounting
Review 72, (3) (Jul.): pp. 323-349.
Botosan, Christine A., and Marlene A. Plumlee. 2002. A re-examination of disclosure level and
the expected cost of equity capital. Journal of Accounting Research 40, (1) (Mar.): 21-40.
Botosan, C., and M. Plumlee. 2008. Are Information Attributes Priced? Working paper,
University of Utah.
Brennan, Michael J., and Avanidhar Subrahmanyam. 1996. Market microstructure and asset
pricing: On the compensation for illiquidity in stock returns. Journal of Financial
Economics 41, (3) (7): 441-64.
Brennan, Michael J., and Avanidhar Subrahmanyam. 1995. Investment analysis and price
formation in securities markets. Journal of Financial Economics 38, (3) (7): 361-81.
Brockman, P., Martin, X., Unlu, E., 2010. Executive compensation and the maturity structure of
corporate debt. Journal of Finance 65, 1123-1161.
Brown, S., S. Hillegeist, and K. Lo. 2004. Conference calls and information asymmetry. Journal
of Accounting and Economics 37 (3): 343–366.
Callahan, C., C.M. Lee, and T.L. Yohn. 1997. Accounting Information and Bid-Ask Spreads.
Accounting Horizons 11 (4): 50-60.
Callahan, C., R.E. Smith, and A.W. Spencer. 2012. An examination of the Cost of Capital
Implications of FIN 46. The Accounting Review 87 (4). 1105-1134.
Charitou, A., N. Lambertides and L. Trigeorgis. 2007. Earnings Behavior of Financially
Distressed Firms: The Role of Institutional Ownership. ABACUS 43 (3): 271-296.
Chiang, Raymond, and P. C. Venkatesh. 1988. Insider holdings and perceptions of information
asymmetry: A note. The Journal of Finance 43, (4) (Sep.): pp. 1041-1048.
Coller, Maribeth, and Teri Lombardi Yohn. 1997. Management forecasts and information
asymmetry: An examination of bid-ask spreads. Journal of Accounting Research 35, (2)
(Autumn): pp. 181-191.
Copeland, Thomas E., and Dan Galai. 1983. Information effects on the bid-ask spread. The
Journal of Finance 38, (5) (Dec.): pp. 1457-1469.
Daniel, Kent, David Hirshleifer, and Avanidhar Subrahmanyam. 1998. Investor psychology and
security market under- and overreactions. The Journal of Finance 53, (6) (Dec.): pp.
DeAngelo, H., L. DeAngelo and D. J. Skinner, ‘Accounting Choice in Troubled Companies’,
Journal of Accounting and Economics, Vol. 17, Nos 1/2, 1994.
Dechow, P., and C. Shakespeare. 2009. Do Managers time securitization transactions to obtain
accounting benefits?. The Accounting Review 89, pp. 99-132.
Dechow, P., Ge, W., Schrand, C. 2010. Understanding earnings quality: a review of the proxies,
their determinants and their consequences. The Journal of Accounting and Economics 50,
(2-3) pp. 344-401.

Journal of Finance and Accountancy Volume 22
Examining the effects, Page 14
DeFond, M. and J. Jiambalvo. 1994. Debt covenant violation and the manipulation of accruals.
Journal of Accounting and Economics 17: 113-143.
Dhaliwal, D., L. Krull, O. Li, and W. Moser. 2005. Dividend taxes and implied cost of equity
capital. Journal of Accounting Research 43 (5): 675–708.
Diamond, D and R. Verrecchia. 1991. Disclosure, Liquidity and the Cost of Capital. The Journal
of Finance 46 (4): 1325-1359
Dichev, I., Tang, V., 2009. Earnings volatility and earnings predictability. The Journal of
Accounting and Economics 47, pp. 160-181.
Dichev, I.,J.R. Graham, C.R.Harvey and S. Rajgopal. 2012. Earnings Quality: Evidence from the
Field. Working paper, Emory University.
Easley, David, and Maureen O'hara. 2004. Information and the cost of capital. The Journal of
Finance 59, (4) (Aug.): pp. 1553-1583.
Easley, David, Maureen O'Hara, and Joseph Paperman. 1998. Financial analysts and
information-based trade. Journal of Financial Markets 1, (2) (8/1): 175-201.
Easley, D., S. Hvidkjær, and M. O’Hara. 2002. Is information risk a determinant of asset returns?
Journal ofFinance 57 (5): 2185–2221.
Easton, P. 2004. PE ratios, PEG ratios, and estimating the implied expected rate of return on
equity capital.The Accounting Review 79 (1): 73–95.
Fama, Eugene F., and Kenneth R. French. 1992. The cross-section of expected stock returns. The
Journal of Finance 47, (2) (Jun.): pp. 427-465.
Financial Accounting Standards Board (FASB). 2006. Statement of Financial Accounting
Standards No. 157. FASB: Norwalk, Connecticut.
Financial Accounting Standards Board (FASB). 2010. Improving Disclosures about Fair Value
Measurements. An Amendment of the FASB Accounting Standards Codification. FASB:
Norwalk, Connecticut.
Flagg, J.C., G.A. Giroux and C.E. Wiggins, Jr., 1991. Predicting Corporate Bankruptcy Using
Failing Firms. Review of Financial Economics 1 (1):67-78.
Forbes, S. (2009). End mark-to-market. Forbes.com. March 29, 2009.
Fox, J. 1991. Regression Diagnostics. Newbury Park, CA, Sage.
Francis, Jennifer, Ryan LaFond, Per M. Olsson, and Katherine Schipper. 2004. Costs of equity
and earnings attributes. The Accounting Review 79, (4) (Oct.): pp. 967-1010.
Francis, J., P. Olsson, and D. Oswald, 2000, “Comparing the Accuracy and Explainability of
Dividend, Free Cash Flow, and Abnormal Earnings Equity Value Estimates,” Journal of
Accounting Research, 38, 45-70.
Francis, J. R., and M. Yu. 2009. The Effect of Big Four office size on audit quality. The
Accounting Review 84 (5): 521-1552
Gebhardt, W., C. Lee, and B. Swaminathan. 2001. Toward an implied cost of capital. Journal of
Accounting Research 39 (1): 135–176.
George, Thomas J., Gautam Kaul, and M. Nimalendran. 1991. Estimation of the bid-ask spread
and its components: A new approach. The Review of Financial Studies 4, (4): pp. 623-656.
Gillan, S.L. 2006. Recent Developments in Corporate governance: An Overview. Journal of
Finance, 12 (1): 381-402.
Glosten, Lawrence R., and Lawrence E. Harris. 1988. Estimating the components of the bid/ask
spread. Journal of Financial Economics 21, (1) (5): 123-42.
Glosten, Lawrence R., and Paul R. Milgrom. 1985. Bid, ask and transaction prices in a specialist
market with heterogeneously informed traders. Journal of Financial Economics 14, (1) (3).

Journal of Finance and Accountancy Volume 22
Examining the effects, Page 15
Goh, B., J. Ng, and K. Yong. 2009. Market pricing of banks’ fair value assets reported under
SFAS 157 during the 2008 economic crisis. Singapore Management University.
Goyal, J., and P. Santa-Clara. 2003. Idiosyncratic risk matter!. Journal of Finance 58, 975-1008.
Greenstein, Marilyn Magee, and Heibatollah Sami. 1994. The impact of the SEC's segment
disclosure requirement on bid-ask spreads. The Accounting Review 69, (1) (Jan.).
Gu, Feng, and Jonh Q. Li. 2007. The credibility of voluntary disclosure and insider stock
transactions. Journal of Accounting Research 45, (4) (Sep.): pp. 771-810.
Healy, P.M., A. Hutton and K. Palepu. 1999. Stock performance and intermediation changes
surrounding sustained increases in disclosure. Contemporary Accounting Research (16):
485–520.
Hou, K.,M.A.Dijk and Y. Zhang. 2012. The implied cost of capital: A new approach. Journal of
Accounting and Economics(53): 504–526.
Huang, Roger D., and Hans R. Stoll.. 1996. Dealer versus auction markets: A paired comparison
of execution costs on NASDAQ and the NYSE. Journal of Financial Economics 41, (3).
Huang, Roger D., and Hans R. Stoll. 1997. The components of the bid-ask spread: A general
approach. The Review of Financial Studies 10, (4) (Winter): pp. 995-1034.
Hughes, J., J. Liu, and J. Liu. 2009. On the relations between expected returns and implied cost
of capital. Review of Accounting Studies 14: 246–259.
Jensen, M.C. and Meckling, W.H. 1976. Theory of the Firm: Managerial Behavior, agency costs
and ownership structure. Journal of Financial Economics (3) (4): 305-360.
Kolev, K. 2009. Do Investors perceive marking-to-model as marking-to-myth? Early evidence
from FAS 157 disclosure. Working paper. New York University.
Kyle, Albert S. 1985. Continuous auctions and insider trading. Econometrica 53, (6) (Nov.).
Laux, C. and C. Leuz. 2009. The crisis of fair-value accounting: Making sense of the recent
debate. Accounting, Organizations and Society 34: 826-834.
Legoria, Joseph, Jeff Boone, and William W. Stammerjohan. 2008. The economic benefits of
FASB's recommended disclosures: Evidence from the pharmaceutical industry. Advances in
Accounting 24, (2) (12): 202-12.
Leland, H., ‘Predictions of Expected Default Probabilities in Structural Models of Debt’, Journal
of Investment Management, Vol. 2, No. 2, 2004.
Leuz, Christian, and Robert E. Verrecchia. 2000. The economic consequences of increased
disclosure. Journal of Accounting Research 38, (Supplement: Studies on Accounting
Information and the Economics of the Firm): pp. 91-124.
Leuz, C., D. Nanda, and P. Wysocki. 2003. Earnings management and investor protection: An
international comparison. Journal of Financial Economics. 69: 505–527.
Lin, Ji-Chai, Gary C. Sanger, and G. Geoffrey Booth. 1995. Trade size and components of the
bid-ask spread. The Review of Financial Studies 8, (4) (Winter): pp. 1153-1183.
Manne, Henry G. 1965. Mergers and the market for corporate control. The Journal of Political
Economy 73, (2) (Apr.): pp. 110-120.
MacKay, Peter. 2003. Real Flexibility and Financial Structure: An Empirical Analysis. The
Society for Financial Studies 16, (4) (Winter): pp. 1131-1165.
Merton, Robert C. 1987. A simple model of capital market equilibrium with incomplete
information. The Journal of Finance 42, (3, Papers and Proceedings of the Forty-Fifth
Annual Meeting of the American Finance Association, New Orleans, Louisiana, December
28-30, (1986) (Jul.): pp. 483-510.

Journal of Finance and Accountancy Volume 22
Examining the effects, Page 16
Mohanram, P., and S. Rajgopal. 2009. Is PIN priced risk? Journal of Accounting and Economics
47 (3): 226–243.
Muller, K., E. J. Riedl and T. Selhorn. 2011. Mandatory Fair Value Accounting and Information
Asymmetry: Evidence from the European Real Estate Market. Journal of Management
Science 57 (6): 1138-1153.
Neal, Robert, and Simon M. Wheatley. 1998. Adverse selection and bid–ask spreads: Evidence
from closed-end funds. Journal of Financial Markets 1, (1) (4/30): 121-49.
Ness, Bonnie F. Van, Robert A. Van Ness, and Richard S. Warr. 2001. How well do adverse
selection components measure adverse selection? Financial Management 30, (3) (Autumn):
pp. 77-98.
Nissim, D. 2003. Reliability of Banks’ Fair Value Disclosure for Loans. Review of Quantitative
Finance and Accounting 20 pp. 355-384.
Ng, J,. 2011. The Effect of Information Quality on Liquidity Risk. Journal of Accounting and
Economics, (52): pp. 126-143
Ohlson, J., and B. Juettner-Nauroth. 2005. Expected EPS and EPS growth as determinants of
value. Review of Accounting Studies 10: 349-365.
Pastor, L., Stambaugh, R.,2003. Liquidity risk and expected stock returns. Journal of Political
Economy, (111): pp. 642-685.
Penman, S. H. 2007. Financial reporting quality: Is fair value a plus or a minus? Accounting and
Business Research (Special Issue: International Accounting Policy Forum): 33-44.
Petersen, M. 2009. Estimating standard errors in finance panel data sets: Comparing approaches.
Review of Financial Studies, 22 (1): 435-480.
Petroni, K. and J. M. Wahlen. 1995. Fair values of equity and debt securities and share prices of
property-liability insurer. Journal of Risk and Insurance 62 (4): 719-737.
Rajgopal, M and M.Venkatachalam. 2011. Financial reporting quality and idiosyncratic return
volatility. Journal of Accounting and Economics. (51): pp. 1-20.
Reinstein, A. and G. Lander. 2004. Implementing the impairment of assets requirements of
SFAS No. 144: An empirical analysis. Managerial Auditing Journal. (19) 3; p. 400.
Reid, J. 2016. Fair Value Disclosure Regulation and the Manufacturing Sector. Journal of
Finance and Accountancy (21).
Riedl, E. J. and Serafeim, G. 2011. Information risk and fair values: an examination of equity
betas. Journal of Accounting Research, 49(4): 1083–1122.
Rosner, R., ‘Earnings Manipulation in Failing Firms’, Contemporary Accounting Research, Vol.
20, No. 2, 2003.
Ryan, S. 2008. Accounting in and for the Subprime Crisis. The Accounting Review, 83 (6): 1605-
1638.
Saleh, N.M., and K. Ahmed. 2005. Earnings management of distressed firms during debt
renegotiation. Accounting and Business Research 35 (1) pp. 69-86.
Shadow Financial Regulatory Committee Report. 2008. Statement No. 266 (Fair Value
Accounting). Chicago, Illinois.
Song, C.J., W. Thomas and H. Yi. 2010. Value Relevance of FAS 157 Fair Value Hierarchy
Information and the Impact of Corporate Governance Mechanisms. The Accounting Review
85 (4): 1375-1410.
Stewart, D. 1981. The application and misapplication of factor analysis in marketing research.
Journal of Marketing Research 18 (1): 51-62.

Journal of Finance and Accountancy Volume 22
Examining the effects, Page 17
Stoll, Hans R. 1989. Inferring the components of the bid-ask spread: Theory and empirical tests.
The Journal of Finance 44, (1) (Mar.): pp. 115-134.
Stoll, Hans R. 1978. The pricing of security dealer services: An empirical study of Nasdaq
stocks. The Journal of Finance 33, (4) (Sep.): pp. 1153-1172.
Stoll, Hans R. 1978. The supply of dealer services in securities markets. The Journal of Finance
33, (4) (Sep.): pp. 1133-1151.
Welker, M. 1995. Disclosure policy, information asymmetry, and liquidity in equity markets.
Contemporary Accounting Research 11 (2):801–827.
Whalen, R. C. 2008. The subprime crisis – causes, effect and consequences. Networks Financial
Institute, March 2008. <http://ssrn.com/abstract=1113888>.
Williamson, O.E. 1988. Corporate Finance and Corporate Governance. The Journal of Finance
43 (3) (Jul.): pp. 567-591.
Wittenberg-Moerman, R. 2011. The role of information asymmetry and financial reporting
quality in debt trading: Evidence from the secondary loan market. Journal of Accounting
and Economics 46 (2) (Dec.): pp. 240-260.
Wooldridge, J. 2002. Econometric Analysis of Cross Section and Panel Data. The MIT Press:
Cambridge, MA.

Journal of Finance and Accountancy Volume 22
Examining the effects, Page 18
APPENDIX
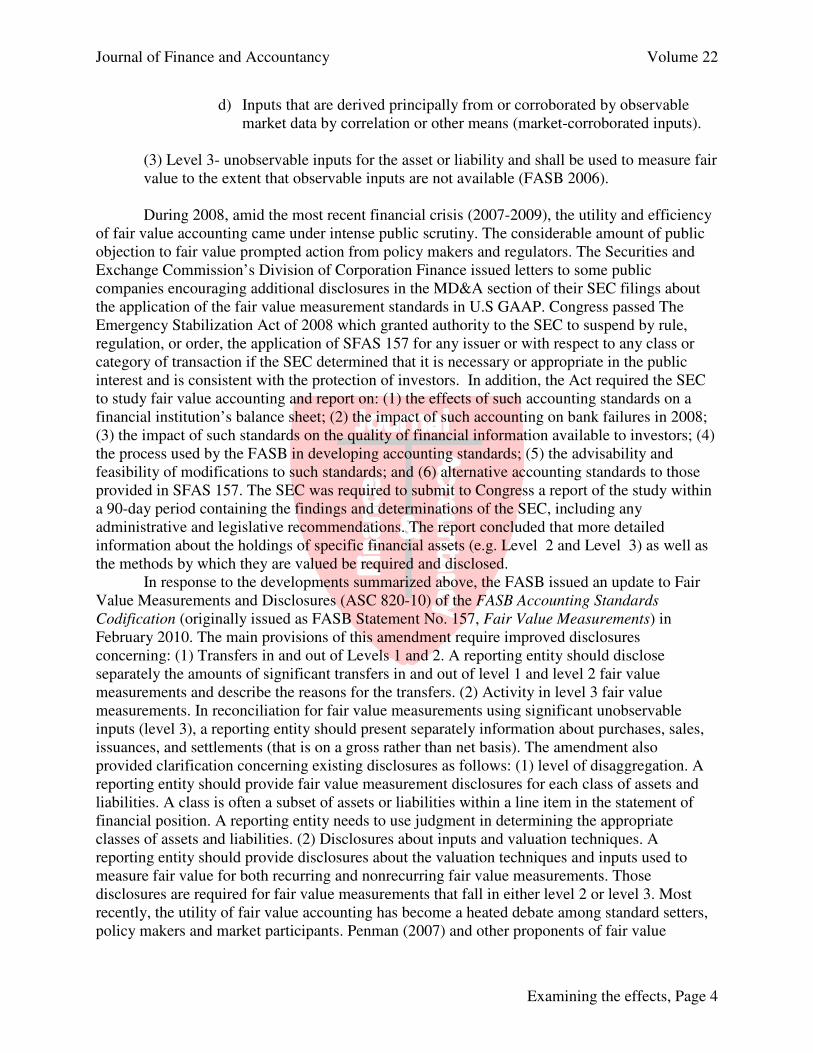
Figure 1
Timeline of significant events surrounding adoption of ASC 820-10
Hou
sing
Bub
ble 'b
urst'
FAS 1
57 A
doptio
n
Ado
ption o
f ASC
820
-10
US
Cre
dit dow
ngrad
e
2006
2007
2008
2009
2010
2011
2012
Pre-ASC 820-10 Period Post-ASC 820-10 Period
This timeline graphically represents significant events occurring prior to and subsequent to the release and adoption of ASC 820-10. The
pre-ASC 820-10 period is defined as the 24 months immediately preceding mandatory adoption of ASC 820-10, beginning in the fourth
quarter of 2007 and ending in the third quarter of 2009. The ASC 820-10 time period is defined as the 33 month period from the fourth
quarter of 2009 through the second quarter of 2012.

Journal of Finance and Accountancy Volume 22
Examining the effects, Page 19
Panel A: Sample Reconciliation # of Firms
All Firms in Compustat database with Level 2 and Level 3 fair value activity 816
Less firms with missing financial data from Compustat database (238)
Less firms with missing price data from CRSP database (76)
Final Sample 502
Firms reporting no material activity between fair value levels 284
Firms reporting material activity between fair value levels 218
Panel B: Type of Transfer Activity
Level 3 Activity n Percent n Percent n Percent
Transfer In 595 52% 84 63% 679 53%
Transfer Out 559 48% 50 37% 609 47%
Totals 1,154 100% 134 100% 1,288 100%
TABLE 1
Description of Sample Firms and Transfer Activity Type
Assets Liabilities Total
Panel A displays the sample reconcilitation to determine final sample and sub-samples. Panel B shows the type of level 3
transfer activity taken by firms materially affected by ASC 820-10.

Journal of Finance and Accountancy Volume 22
Examining the effects, Page 20
Variable Mean Std. Dev Q1 Q3 Mean Std. Dev Q1 Q3
smoothness 5.49 62.28 0.37 3.90 6.18 114.94 0.40 3.87
consensus 1.00 8.51 0.00 0.31 1.02 14.28 0.00 0.31
frquality 0.32 1.41 0.01 0.13 0.23 1.38 0.01 0.11
ravg 0.11 0.03 0.09 0.12 0.10 0.03 0.09 0.12
rgdn 0.10 0.07 0.07 0.11 0.11 0.05 0.08 0.12
rmpeg 0.11 0.04 0.09 0.12 0.10 0.05 0.07 0.11
rgls 0.11 0.04 0.09 0.12 0.11 0.05 0.08 0.12
alv1 1.00 8.52 0.00 0.32 1.04 14.31 0.02 0.34
alv2 0.33 1.41 0.02 0.14 0.25 1.40 0.04 0.13
alv3 0.11 0.03 0.09 0.12 0.12 0.05 0.11 0.14
llv1 0.11 0.07 0.07 0.12 0.13 0.07 0.10 0.14
llv2 0.11 0.04 0.09 0.12 0.12 0.07 0.09 0.13
llv3 0.11 0.05 0.09 0.13 0.13 0.07 0.10 0.14
lv3change 3.17 2.45 1.18 4.64 3.15 2.41 1.18 4.55
growth 7.23 28.06 -3.19 12.53 15.45 24.69 -2.10 11.69
eissue 34.53 143.00 0.00 2.27 16.05 2.98 0.00 3.07
dissue 11.51 52.14 -3.75 14.47 76.86 215.00 -3.82 12.29
leverage 0.15 0.58 0.01 0.32 0.13 0.34 0.01 0.31
cash flow 0.02 0.04 0.00 0.04 0.03 0.05 0.00 0.04
auditor 0.77 0.42 1.00 1.00 0.78 0.42 1.00 1.00
ubeta 0.57 0.51 0.14 0.87 0.64 0.62 0.15 0.96
sdocf 3.89 2.13 2.21 5.40 4.12 2.02 2.62 5.52
sdbeta 0.22 0.43 0.08 0.25 0.06 0.20 0.02 0.06
oigrowth 0.61 5.67 0.65 1.16 0.79 7.35 0.77 1.21
size 7.06 2.28 5.56 8.63 7.07 2.26 5.57 8.64
ni 2.29 0.03 0.00 4.46 2.91 0.05 0.00 4.65
roe 0.15 0.68 0.00 0.33 0.13 0.29 0.00 0.39
Post-ASC 820-10 (n = 1,989)
TABLE 2
Descriptive Statistics
Panel A of Table 2 displays descript ive stat ist ics for sample firms by time period. Variables Defined: smoothness = std dev. of
core earnings over the previous year, log transformed; consensus = std dev of EPS forecasts scaled by stock price; frquality =
sum of std dev. of each FRQ proxy; ravg = average of three measures of implied cost of capital (ICC); rgdn = ICC based on
Gordon and Gordon (1997); rmpeg = ICC based on Easton (2004); rgls = ICC based on Gebhardt et al. (2001); alv1 (alv2, alv3)
= total quarterly assets in levels 1, 2 and 3 respectively; llv1 (llv2, llv3) = total quarterly liabilities in levels 1, 2 and 3
respectively; lv3change = total quarterly change in level 3 fair value measurements; growth = % change in sales; ni = net
income for the quarter; eissue = percentage change in common stock; dissue = percentage change in total liabilities; leverage =
long-term debt divided by market value of equity; cash flow = quarterly net cash flow from operat ing act ivities divided by end
of quarter total assets; auditor = 1 if audited by a big four firm, 0 otherwise; ubeta = unlevered beta based on a single factor
model; sdocf = standard deviation of operat ing cash flows over previous five years plus 1, log transformed; sdbeta = standard
deviation of beta values over previous year plus 1, log transformed; oigrowth = operating income this quarter divided by
operating income in previous quarter; size = log of market value of equity at the end of the previous period; ni = net income
for the quarter; roe = return on equity for the quarter.
Pre-ASC 820-10 (n =2,195)

Journal of Finance and Accountancy Volume 22
Examining the effects, Page 21
Firms With Level 3 Activity
Variable Mean Median Mean Median Diff.
smoothness 4.647 2.059 6.771 2.156 ***
consensus 1.234 0.129 0.841 0.127 **
frquality 0.306 0.040 0.259 0.038 **
ravg 0.105 0.100 0.105 0.0995 ns
rgdn 0.105 0.091 0.105 0.092 ns
rmpeg 0.102 0.097 0.101 0.097 *
rgls 0.108 0.102 0.109 0.101 *
alv1 3.128 2.950 3.180 2.996 ns
alv2 2.901 3.121 2.865 3.222 *
alv3 2.664 2.596 2.542 2.550 **
llv1 0.990 1.465 1.213 1.548 ***
llv2 0.085 0.901 0.099 1.001 *
llv3 0.074 0.087 0.070 0.071 ns
lv3change 0.556 0.501 0.696 0.690 ***
growth 9.031 3.883 13.137 4.066 ***
eissue 39.455 0.240 15.398 0.250 ***
dissue 19.798 3.345 63.156 3.674 ***
leverage 0.222 0.203 0.231 0.324 ns
cash flow 0.022 0.019 0.023 0.019 ns
auditor 0.783 1.000 0.769 1.000 ns
ubeta 0.633 0.511 0.593 0.474 *
sdocf 3.923 3.713 4.081 3.986 ns
sdbeta 0.137 0.067 0.146 0.071 ns
oigrowth 0.703 0.993 0.705 0.978 ns
size 7.079 7.223 7.048 7.174 ns
ni 3.211 3.456 3.001 3.396 *
roe 0.221 0.200 0.232 0.314 *
n 1,701 2,483
Panel B: Descriptive Statistics by Sub-Sample
TABLE 2
Descriptive Statistics
Firms Without Level 3 Activity
*, **, *** indicate significance at the 10 percent, 5 percent and 1 percent levels, respectively. Panel B
displays the mean and median for the two t ime periods by firm activity.Variables Defined: smoothness =
standard deviation of core earnings over the previous year, log transformed; consensus = standard deviation of
EPS forecasts scaled by stock price; quality = sum of standard deviation of each financial reporting quality
proxy; ravg = average of three measures of implied cost of capital (ICC); rgdn = ICC based on Gordon and
Gordon (1997); rmpeg = ICC based on Easton (2004); rgls = ICC based on Gebhardt et al. (2001); alv1 (alv2,
alv3) = total quarterly assets in levels 1, 2 and 3 respectively; llv1 (llv2, llv3) = total quarterly liabilities in
levels 1, 2 and 3 respectively; lv3change = total quarterly level 3 fair value measurements; growth =
percentage change in sales; ni = net income for the quarter; roe = return on equity for the quarter; eissue =
percentage change in common stock; dissue = percentage change in total liabilit ies; leverage = long-term debt
divided by market value of equity; cash flow = quarterly net cash flow from operat ing activit ies divided by end
of quarter total assets; auditor = 1 if audited by one of the big four firms, 0 otherwise; ubeta = unlevered beta
based on a single factor model; sdocf = standard deviat ion of operat ing cash flows over previous five years plus
1, log transformed; sdbeta = standard deviat ion of beta values over previous year plus 1, log transformed;
oigrowth = operat ing income this quarter divided by operating income in previous quarter; size = log of market
value of equity at the end of the previous period; ni = net income for the quarter; roe = return on equity for
the quarter.

Journal of Finance and Accountancy Volume 22
Examining the effects, Page 22
(1) (2) (3) (4) (5) (6) (7) (8) (9) (10) (11) (12) (13) (14) (15) (16) (17) (18) (19) (20) (21) (22)
(1) smoothness 1
(2) consensus -0.015 1
(3) frquality 0.285 0.705 1
(4) asc -0.061 -0.019 -0.071 1
(5) fv3_trns -0.023 -0.011 -0.009 0.001 1
(6) asc x fv3 -0.048 -0.017 -0.043 0.555 0.676 1
(7) size 0.016 0.009 0.007 0.052 -0.015 0.023 1
(8) growth 0.006 -0.008 -0.006 0.030 0.013 0.030 -0.002 1
(9) eissue 0.002 0.000 -0.003 -0.028 -0.023 -0.015 0.011 0.000 1
(10) dissue -0.019 0.002 -0.001 0.019 0.016 0.027 -0.032 0.007 0.000 1
(11) leverage -0.003 -0.002 -0.004 -0.010 0.022 0.005 -0.090 -0.002 -0.001 0.000 1
(12) cashflow -0.019 0.032 0.020 -0.191 0.031 -0.069 -0.008 -0.026 0.004 0.007 -0.001 1
(13) auditor 0.464 -0.011 0.068 0.003 -0.009 -0.007 0.016 0.011 0.011 0.002 -0.021 0.011 1
(14) alv1 0.257 -0.011 0.251 -0.035 -0.001 -0.022 0.002 0.008 -0.003 -0.002 -0.001 -0.033 0.082 1
(15) alv2 0.237 -0.009 0.304 -0.024 -0.002 -0.011 -0.002 -0.001 -0.003 -0.002 -0.002 -0.013 0.071 0.846 1
(16) alv3 0.279 -0.009 0.369 -0.047 -0.005 -0.030 0.007 0.005 -0.003 -0.002 -0.002 -0.024 0.080 0.757 0.809 1
(17) llv1 0.243 -0.009 0.302 -0.049 0.007 -0.021 -0.006 0.000 -0.002 -0.002 -0.001 -0.036 0.065 0.841 0.839 0.717 1
(18) llv2 0.205 -0.007 0.273 -0.021 -0.002 -0.009 -0.002 -0.003 -0.002 -0.001 -0.002 -0.012 0.058 0.827 0.987 0.744 0.825 1
(19) llv3 0.235 -0.007 0.301 -0.053 0.006 -0.025 0.003 0.001 -0.001 -0.001 -0.002 -0.017 0.069 0.840 0.800 0.783 0.798 0.796 1
(20) lv3change 0.012 0.000 0.069 -0.052 -0.017 -0.031 0.009 -0.001 0.001 0.000 0.000 0.000 0.001 0.113 0.062 0.077 0.148 0.080 0.169 1
(21) ni 0.180 -0.005 -0.016 0.045 -0.010 0.031 -0.016 -0.003 -0.002 0.000 -0.003 -0.007 0.086 0.241 0.145 0.014 0.175 0.149 0.117 0.035 1
(22) roe 0.012 0.001 0.003 0.020 0.016 0.011 0.024 0.007 0.000 0.001 0.000 -0.012 -0.007 0.002 0.002 0.002 0.002 0.002 0.002 0.000 0.006 1
Table 3 displays the Pearson correlation coefficients. Bold text indicate significance at the 5 percent and 1 percent levels, respectively. Variables previously defined.
TABLE 3
Correlations Between Variables

Journal of Finance and Accountancy Volume 22
Examining the effects, Page 23
Yit = β0it + β1ascit + β2fv3_trnsit + β3asc x fv3_trnsit + β4sizeit + β5growthit + β6eissueit +
β7dissueit + β8leverageit + β9cashflowit + β10auditorit + β11alv1it + β12alv2it + β13alv3it +
β14llv1it + β15llv2it + β16lv3it + β17lv3changeit + β18niit + β19roeit + eit
Predicted
Variable Sign smoothness consensus frquality
asc - -0.2025 ** -0.7049 -0.0956 *
(0.1021) (0.5420) (0.0565)
fv3_trns - 0.0002 -0.3855 0.0061
(0.1114) (0.5917) (0.0617)
asc x fv3 +/- -0.0988 ** 0.3488 -0.0131
(0.1336) (0.7092) (0.0740)
size + 0.0122 0.0603 0.0048
(0.0128) (0.0682) (0.0071)
growth + -0.0005 -0.0006 0.0000
(0.0003) (0.0018) (0.0002)
eissue + 0.0000 0.0000 0.0000
(0.0000) (0.0000) (0.0000)
dissue + 0.0000 0.0000 0.0000
(0.0000) (0.0002) (0.0000)
leverage + 0.0000 0.0000 0.0000
(0.0000) (0.0000) (0.0000)
cashflow + -0.8818 6.9176 * 0.8251 **
(0.6976) (3.7041) (0.3863)
auditor + 2.3442 *** -0.3142 0.0828 **
(0.0724) (0.3842) (0.0401)
alv1 +/- 0.0000 ** 0.0000 0.0000 ***
(0.0000) (0.0000) (0.0000)
alv2 +/- 0.0000 *** 0.0000 0.0000 ***
(0.0000) (0.0000) (0.0000)
alv3 +/- 0.0000 0.0000 0.0000 ***
(0.0000) (0.0001) (0.0000)
llv1 +/- 0.0000 *** 0.0000 0.0000 ***
(0.0000) (0.0000) (0.0000)
llv2 +/- 0.0000 *** 0.0000 0.0000 ***
(0.0000) (0.0000) (0.0000)
llv3 +/- 0.0001 *** 0.0000 0.0001 ***
(0.0000) (0.0001) (0.0000)
lv3change +/- 0.0000 0.0000 0.0000 ***
(0.0000) (0.0001) (0.0000)
ni +/- 0.0006 *** -0.0001 0.0000
(0.0000) (0.0002) (0.0000)
roe + 0.0000 0.0000 0.0000
(0.0000) (0.0000) (0.0000)
Constant 0.0975 1.1837 * 0.1251 *
(0.1369) (0.7270) (0.0758)
Observations 4,184 4,184 4,184
Adj R2
30.79% 2.20% 15.21%
TABLE 4
Regression Analysis of Financial Reporting Quality on ASC 820-10 (H1)
*, **, *** indicate significance at the 10 percent, 5 percent and 1 percent levels, respectively. Robust standard errors adjusted
for intrafirm correlation with clustered standard errors are in parentheses.Variables previously defined.
Dependent Variables

Journal of Finance and Accountancy Volume 22
Examining the effects, Page 24
Predicted
Sign smoothness consensus frquality
asc - -0.1617 * -4.8666 ** -0.1632
(0.0960) (2.6704) (0.1498)
fv3_trns - 0.0494 -5.8549 ** -0.2451 *
(0.1029) (2.9372) (0.1641)
asc x fv3 +/- -0.0286 7.3865 ** 0.2959 *
(0.1262) (3.4815) (0.1949)
size + -0.0107 -0.0313 0.0089
(0.0126) (0.3391) (0.0184)
growth + -0.0008 0.0071 0.0000
(0.0007) (0.0145) (0.0003)
eissue + 0.0000 -0.0017 0.0000
(0.0000) (0.0075) (0.0001)
dissue + 0.0004 * -0.0001 0.0000
(0.0002) (0.0012) (0.0001)
leverage + -0.0001 -0.0002 0.0000
(0.0001) (0.0014) (0.0000)
cashflow + 0.4888 46.4299 *** 2.0032 **
(0.5996) (17.637) (1.0449)
auditor + 0.4186 *** -1.6941 -0.0748
(0.1719) (1.6861) (0.0938)
alv1 +/- 0.0000 *** 0.0001 0.0000
(0.0000) (0.0003) (0.0000)
alv2 +/- 0.0000 ** -0.0001 0.0000
(0.0000) (0.0002) (0.0000)
alv3 +/- 0.0000 * -0.0002 0.0000
(0.0000) (0.0012) (0.0001)
llv1 +/- 0.0000 *** -0.0006 0.0000
(0.0000) (0.0018) (0.0001)
llv2 +/- 0.0000 ** 0.0002 0.0000
(0.0000) (0.0007) (0.0000)
llv3 +/- 0.0000 ** 0.0009 -0.0001
(0.0000) (0.0032) (0.0001)
lv3change +/- 0.0000 0.0000 0.0000
(0.0000) (0.0007) (0.0000)
ni +/- 0.0001 ** 0.0003 0.0001
(0.0000) (0.0037) (0.0002)
roe + 0.0005 *** 0.0000 0.0000
(0.0002) (0.0000) (0.0000)
Constant 4.5843 *** 5.6208 * 0.2205
-0.2049 (3.4263) (0.1930)
Observations 972 577 1,069
Adj R2
26.55% 0.77% 0.90%
Fourth Quartile Analysis of Financial Reporting Quality on ASC 820-10 (H1)
TABLE 5
β14llv1it + β15llv2it + β16lv3it + β17lv3changeit + β18niit + β19roeit + eit
Dependent Variables
*, **, *** indicate significance at the 10 percent, 5 percent and 1 percent levels, respectively. Robust standard errors
adjusted for intrafirm correlation with clustered standard errors are in parentheses.
Variables previously defined.
Yit = β0it + β1ascit + β2fv3_trnsit + β3asc x fv3_trnsit + β4sizeit + β5growthit + β6eissueit +
β7dissueit + β8leverageit + β9cashflowit + β10auditorit + β11alv1it + β12alv2it + β13alv3it +

Journal of Finance and Accountancy Volume 22
Examining the effects, Page 25
(1) (2) (3) (4) (5) (6) (7) (8) (9) (10) (11) (12) (13) (14) (15) (16) (17) (18)
(1) ravg 1
(2) rgdn 0.671 1
(3) rmpeg 0.483 -0.015 1
(4) rgls 0.551 0.003 -0.010 1
(5) asset 0.061 0.003 0.084 0.048 1
(6) transin -0.060 -0.044 0.017 -0.070 -0.068 1
(7) alv1 -0.009 -0.006 0.014 -0.022 0.342 -0.030 1
(8) alv2 0.002 -0.006 0.020 -0.009 0.263 -0.057 0.833 1
(9) alv3 -0.014 -0.011 -0.001 -0.011 0.144 -0.104 0.756 0.823 1
(10) llv1 0.003 -0.013 0.026 -0.003 0.326 -0.070 0.854 0.826 0.726 1
(11) llv2 0.002 -0.006 0.019 -0.006 0.271 -0.040 0.810 0.989 0.764 0.798 1
(12) llv3 -0.012 -0.011 0.006 -0.013 0.166 -0.031 0.816 0.796 0.811 0.775 0.788 1
(13) leverage 0.032 0.003 0.029 0.028 -0.024 -0.042 -0.003 -0.003 -0.004 -0.002 -0.003 -0.004 1
(14) ubeta -0.058 -0.027 -0.030 -0.046 -0.145 -0.330 -0.026 -0.027 -0.019 -0.030 -0.028 -0.009 -0.039 1
(15) sdocf 0.011 -0.012 0.010 0.024 -0.013 -0.055 0.047 0.029 0.014 0.043 0.029 0.008 0.064 -0.343 1
(16) sdbeta 0.016 0.008 0.020 0.002 0.019 0.003 0.011 0.002 0.005 0.011 0.002 0.015 -0.003 -0.066 -0.003 1
(17) oigrowth -0.008 -0.006 -0.002 -0.006 0.075 0.032 0.002 0.013 0.006 0.008 0.013 0.004 -0.002 0.008 -0.007 -0.005 1
(18) size 0.003 -0.017 0.019 0.009 0.090 0.011 0.003 -0.002 0.001 -0.001 -0.005 -0.003 -0.105 0.381 -0.001 0.002 0.017 1
Table 6 displays the Pearson correlation coefficients. Bold text indicate significance at the 5 percent and 1 percent levels, respectively. Variables previously defined.
Correlations Between Variables
TABLE 6

Journal of Finance and Accountancy Volume 22
Examining the effects, Page 26
Pred.
Variable Sign ravg rgdn rmpeg rgls
asc +/- -0.003 -0.003 -0.006 ** -0.001
(0.002) (0.005) (0.003) (0.003)
fv3_trns +/- 0.001 -0.002 0.003 0.001
(0.002) (0.004) (0.003) (0.003)
asc x fv3 +/- -0.001 -0.001 -0.003 0.001
(0.003) (0.006) (0.004) (0.004)
alv1 +/- 0.000 * 0.000 0.000 0.000 **
(0.000) (0.000) (0.000) (0.000)
alv2 +/- 0.000 0.000 0.000 * 0.000 *
(0.000) (0.000) (0.000) (0.000)
alv3 +/- 0.000 * 0.000 0.000 ** 0.000
(0.000) (0.000) (0.000) (0.000)
llv1 +/- 0.000 0.000 0.000 0.000 ***
(0.000) (0.000) (0.000) (0.000)
llv2 +/- 0.000 0.000 0.000 * 0.000 *
(0.000) (0.000) (0.000) (0.000)
llv3 +/- 0.000 0.000 0.000 0.000
(0.000) (0.000) (0.000) (0.000)
highfrq +/- -0.001 0.000 -0.003 -0.001
(0.003) (0.008) (0.004) (0.003)
lowfrq +/- -0.006 ** -0.016 ** -0.004 0.004
(0.003) (0.007) (0.004) (0.004)
asc x high +/- 0.002 0.000 0.002 0.005
(0.004) (0.010) (0.007) (0.006)
asc x low +/- 0.005 0.014 ** 0.006 -0.007
(0.003) (0.008) (0.005) (0.006)
leverage + 0.000 *** 0.000 0.000 *** 0.000 ***
(0.000) (0.000) (0.000) (0.000)
ubeta + -0.005 *** -0.009 *** -0.002 -0.004 **
(0.001) (0.002) (0.001) (0.002)
sdocf + 0.000 -0.001 * 0.000 0.000
(0.000) (0.001) (0.000) (0.001)
sdbeta + 0.001 0.004 0.002 -0.004 **
(0.002) (0.005) (0.004) (0.002)
oigrowth - 0.000 0.000 0.000 0.000
(0.000) (0.000) (0.000) (0.000)
size - 0.000 0.000 0.000 0.000
(0.000) (0.001) (0.000) (0.000)
Constant 0.109 *** 0.119 *** 0.101 *** 0.109 ***
(0.002) (0.006) (0.003) (0.004)
Observations 2,998 2,998 2,998 2,998
Adj R2 1.32% 0.92% 1.03% 0.73%
TABLE 7
*, **, *** indicate significance at the 10 percent, 5 percent and 1 percent levels, respectively. Robust standard errors
adjusted for intrafirm correlation with clustered standard errors are in parentheses. Variables previously defined.
β14leverageit +β15ubetait + β16sdocfit + β17sdbetait + β18oigrowthit + β19sizeit + eit
Dependent Variables
Analysis of Implied Cost of Capital on ASC 820-10
Yit = β0it + β1ascit + β2fv3_trnsit + β3asc x fv3_trnsit + β4alv1it + β5alv2it + β6alv3it +
β7llv1it + β8llv2it + β9llv3it + β10highfrqit + β11lowfrqit + β12asc x highfrqit + β13asc x lowfrqit +

Journal of Finance and Accountancy Volume 22
Examining the effects, Page 27
Predicted
Variable Sign ravg rgdn rmpeg rgls
asset +/- -0.0138 -0.0594 ** -0.0130 0.0050
(0.0099) (0.0256) (0.0098) (0.0109)
transin +/- -0.0214 *** -0.0733 *** -0.0148 *** -0.0057
(0.0088) (0.0259) (0.0057) (0.0068)
asset x transin +/- 0.0143 0.0616 ** -0.0156 -0.0032
(0.0126) (0.0331) (0.0153) (0.0133)
highfrq +/- -0.0007 0.0148 -0.0001 -0.0167
(0.0083) (0.0249) (0.0092) (0.0106)
lowfrq +/- 0.0090 0.0288 -0.0032 0.0013
(0.0163) (0.0463) (0.0070) (0.0135)
asset x highfrq +/- -0.0040 -0.0263 -0.0061 0.0203
(0.0122) (0.0273) (0.0158) (0.0237)
asset x lowfrq +/- -0.0010 -0.0215 0.0114 0.0070
(0.0206) (0.0453) (0.0270) (0.0244)
transin x lowfrq +/- 0.0112 -0.0071 -0.0124 0.0533
(0.0156) (0.0299) (0.0318) (0.0371)
alv1 +/- 0.0000 * 0.0000 *** 0.0000 0.0000
(0.0000) (0.0000) (0.0000) (0.0000)
alv2 +/- 0.0000 0.0000 0.0000 ** 0.0000
(0.0000) (0.0000) (0.0000) (0.0000)
alv3 +/- 0.0000 0.0000 0.0000 * 0.0000
(0.0000) (0.0000) (0.0000) (0.0000)
llv1 +/- 0.0000 * 0.0000 * 0.0000 0.0000
(0.0000) (0.0000) (0.0000) (0.0000)
llv2 +/- 0.0000 0.0000 0.0000 0.0000
(0.0000) (0.0000) (0.0000) (0.0000)
llv3 +/- 0.0000 0.0000 0.0000 0.0000
(0.0000) (0.0000) (0.0000) (0.0000)
leverage + 0.0000 *** 0.0000 *** 0.0000 0.0000
(0.0000) (0.0000) (0.0000) (0.0000)
ubeta + -0.0008 -0.0065 -0.0004 0.0044
(0.0114) (0.0295) (0.0134) (0.0125)
sdocf + 0.0009 0.0062 ** -0.0030 * -0.0006
(0.0012) (0.0030) (0.0016) (0.0015)
sdbeta + 0.0183 * 0.0320 0.0059 0.0172 ***
(0.0118) (0.0285) (0.0097) (0.0064)
oigrowth - -0.0003 * -0.0012 *** 0.0001 0.0000
(0.0002) (0.0004) (0.0002) (0.0005)
size - -0.0016 -0.0001 -0.0018 -0.0027
(0.0014) (0.0032) (0.0018) (0.0020)
Constant 0.1191 *** 0.1244 *** 0.1099 *** 0.1230 ***
(0.0101) (0.0239) (0.0122) (0.0134)
Observations 148 148 148 148
Adj R2
17.54% 19.63% 20.60% 16.15%
Analysis of Implied Cost of Capital on Firms with Transfer Activity
*, **, *** indicate significance at the 10 percent, 5 percent and 1 percent levels, respectively. Robust standard errors adjusted for intrafirm correlat ion with clustered
standard errors are in parentheses. Variables previously defined.
TABLE 8
Dependent Variables
β8transin x lowfrqit + β9alv1it + β10alv2it + β11alv3it + β12llv1it + β13llv2it + β14llv3it
β15leverageit + β16ubetait + β17sdocfit + β18sdbetait + β19oigrowthit + β20sizeit + eit
Yit = β0it + β1assetit + β2transinit + β3asset x transinit + β4highfrqit + β5lowfrqit + β6asset x highfrqit + β7asset x lowfrqit +

Journal of Finance and Accountancy Volume 22
Examining the effects, Page 28
Chart 1
Implied Cost of Capital Measures
Gebhardt et al. (2001) employs a version of the residual income model that assumes the
abnormal earnings growth rate reverts to the industry mean after the fifth year.
Pt = Bt = ��������(� ) �� + ��������(� )� �� � + ��
where Pt equals the market price, Bt equals book value per share, re is the cost of equity
capital, FROE equals the forecasted return on equity and TV, the terminal value, is
estimated as:
�� = � FROE� � − r�(1 + r�)�!��
"#$�� "�� + %&'(� ! − )*(1 + )*)!�� �� !��
The second proxy used to calculate the cost of equity capital was developed by Easton
(2004) and is as follows:
re = +(,-./ − ,-.�)/-)12,3)
where eps1 and eps2 are earnings per share forecasts of eps at the end of each calendar
quarter for fiscal years t+1 and t+2, respectively and P0 equals market price at the end of
the quarter.
The third proxy for cost of equity capital was developed by Gordon and Gordon (1997):
4� = (�((� � ))
where Mt equals market value at the end of each calendar quarter, r is the implied cost of
capital, and Et is earnings expectations in year t while Et+1 are expectation in year t + 1.