examining our survey data for 2006-07
DESCRIPTION
Examining Our Survey Data for 2006-07. USE YOUR VOICE!. ¡USA TU VOZ!. 檢查我們的調查問卷數據. May 2007. How many people participated in the Survey?. Who participated in the Survey?. Overall Rating (1 of 2). Overall Rating (2 of 2). Data-Driven Practice Meaningful Youth Participation - PowerPoint PPT PresentationTRANSCRIPT

Examining Our Survey Datafor 2006-07
May 2007
Cole

2006-2007 USE YOUR VOICE! SURVEY
2
Cole
Data not reported for items with less than 6 respondents.
How many people participated in the Survey?
Total Number or Respondants
Percentage of Total Possible
RespondentsMiddle Schools (w/o
Alt.)
Percentage of Total Possible
Respondents (District-Wide)
Parents 5 2% 15% 31%Students 186 82% 78% 61%Teachers 10 91% 65% 56%Staff 1
Participation Rates
2%
82%
91%
15%
78%
65%
31%
61%56%
0%
10%
20%
30%
40%
50%
60%
70%
80%
90%
100%
Parent Student Teacher
Cole Middle Middle Schools (w/o Alt.) District Overall
2006-2007 USE YOUR VOICE! SURVEY
3
Cole
Data not reported for items with less than 6 respondents.
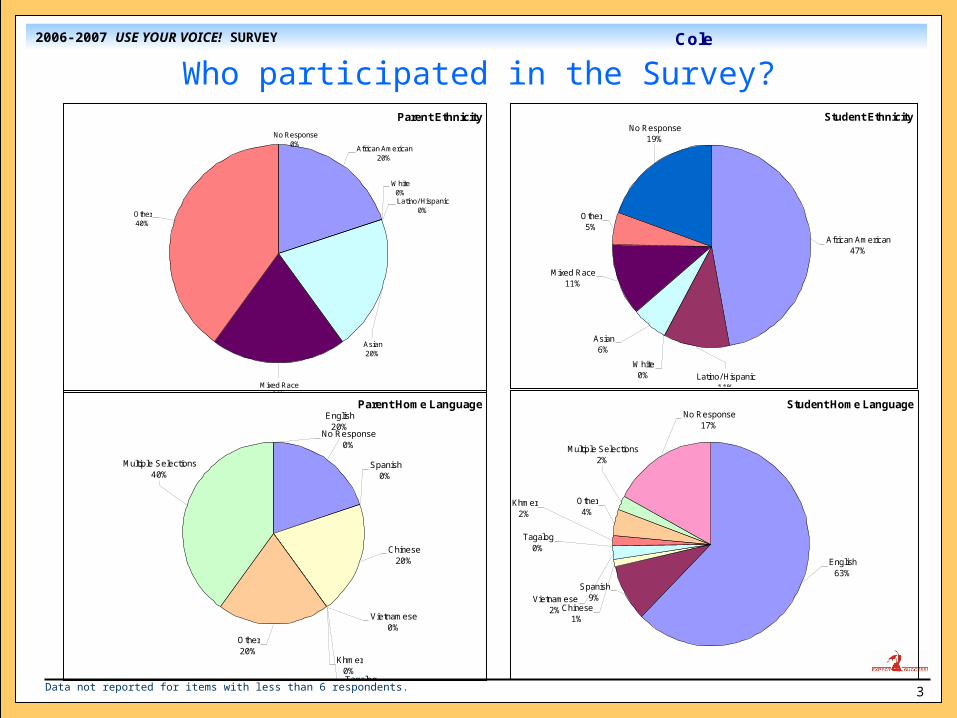
Who participated in the Survey?Parent Ethnicity
Mixed Race20%
White0%
Other40%
Asian20%
African American20%
Latino/ Hispanic0%
No Response0%
Parent Home Language
Khmer0%
Other20%
Vietnamese0%
Chinese20%
Tagalog0%
Spanish0%
English20%
No Response0%
Multiple Selections40%
Student Ethnicity
Mixed Race11%
White0%
Asian6%
African American47%
Other5%
No Response19%
Latino/ Hispanic11%
Student Home Language
Khmer2%
Tagalog0%
Other4%
Chinese1%
Vietnamese2%
Spanish9%
No Response17%
Multiple Selections2%
English63%

2006-2007 USE YOUR VOICE! SURVEY
4
Cole
Data not reported for items with less than 6 respondents.
Overall Rating (1 of 2)
64%
45%
20%
33%
52%
70%
3%
3%
10%
Overall, I am satisfied withmy child's TEACHERS.
Overall, I am satisfied withmy TEACHER.
Overall, I am satisfied withmy child's SCHOOL.
Overall, I am satisfied withmy SCHOOL.
Overall, I am satisfied withmy school.
Overall, I am satisfied withmy school.
Pa
ren
tS
tud
en
tP
are
nt
Stu
de
nt
Te
ach
er
Sta
ff
Strongly Agree/ Agree Strongly Disagree/ Disagree No Response/I Don't Know
# StronglyAgree or Agree/# Respondents
N=5
N=119/186
N=5
N=83/186
N=2/10
N=1

2006-2007 USE YOUR VOICE! SURVEY
5
Cole
Data not reported for items with less than 6 respondents.
20%
100%
60% 20%
Would you recommendthis school to other
families?
Do you plan to re-enrollyour child in this school
again next year?
Par
ent
Par
ent
Strongly Agree/Agree No Response/I Don't Know Strongly Disagree/Disagree
Overall Rating (2 of 2)
# StronglyAgree or Agree/# Respondents
N=5
N=5
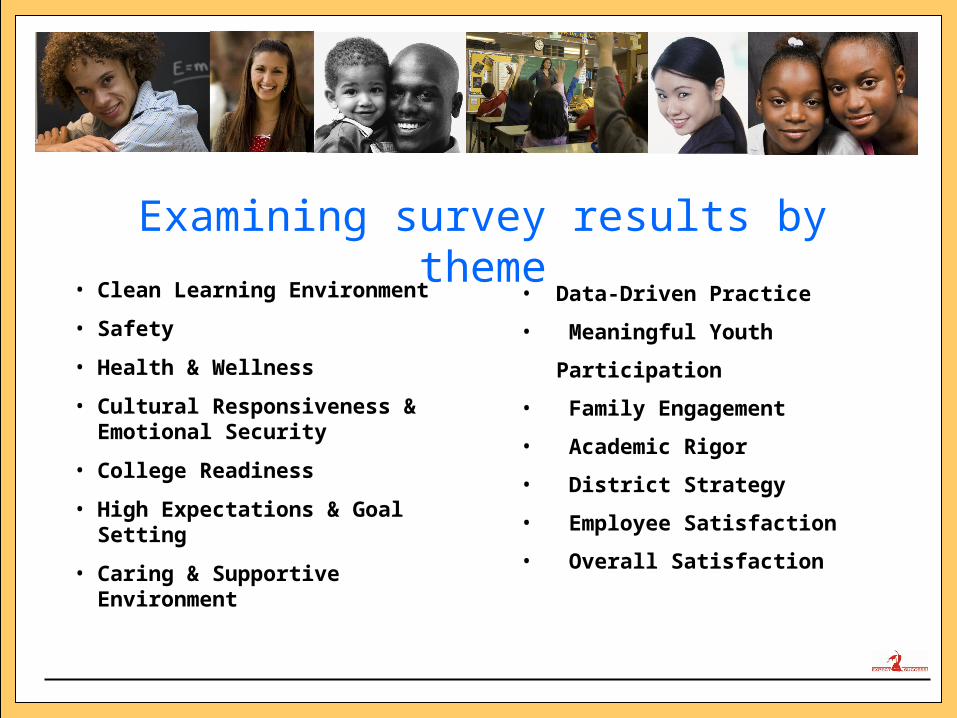
Examining survey results by theme
• Clean Learning Environment
• Safety
• Health & Wellness
• Cultural Responsiveness & Emotional Security
• College Readiness
• High Expectations & Goal Setting
• Caring & Supportive Environment
• Data-Driven Practice
• Meaningful Youth Participation
• Family Engagement
• Academic Rigor
• District Strategy
• Employee Satisfaction
• Overall Satisfaction

2006-2007 USE YOUR VOICE! SURVEY
7
Cole
Data not reported for items with less than 6 respondents.
Results-Based Questions
What does this THEME mean to me?
What patterns do I SEE in the responses?
What QUESTIONS do the responses raise for me?
What 1 or 2 QUESTIONS/IDEAS about this theme might we consider in our site plan for student achievement?
For each of the data slides, please consider the following questions to guide your discussions, decisions, or policies:

2006-2007 USE YOUR VOICE! SURVEY
8
Cole
Data not reported for items with less than 6 respondents.
Clean Learning Environment
21%
50%
15%
90%
78%
40%
85%
10%
1%
10%
1%
Buildings and grounds at myschool are clean most of the
time
Buildings and grounds at mychild's school are clean
most of the time
Buildings and grounds at myschool are clean most of the
time
Buildings and grounds at myschool are clean most of the
time
Bathrooms at my school areclean most of the time
Faculty bathrooms at myschool are clean most of the
time
Staff bathrooms at myschool are clean most of the
time
Stu
dent
Par
ent
Tea
cher
Sta
ffS
tude
ntT
each
erS
taff
Strongly Agree/Agree Disagree/Strongly Disagree No Response/I Don't Know
# StronglyAgree or Agree/# Respondents
N=39/186
N=5
N=5/10
N=1
N=27/186
N=9/10
N=1
2006-2007 USE YOUR VOICE! SURVEY
9
Cole
Data not reported for items with less than 6 respondents.
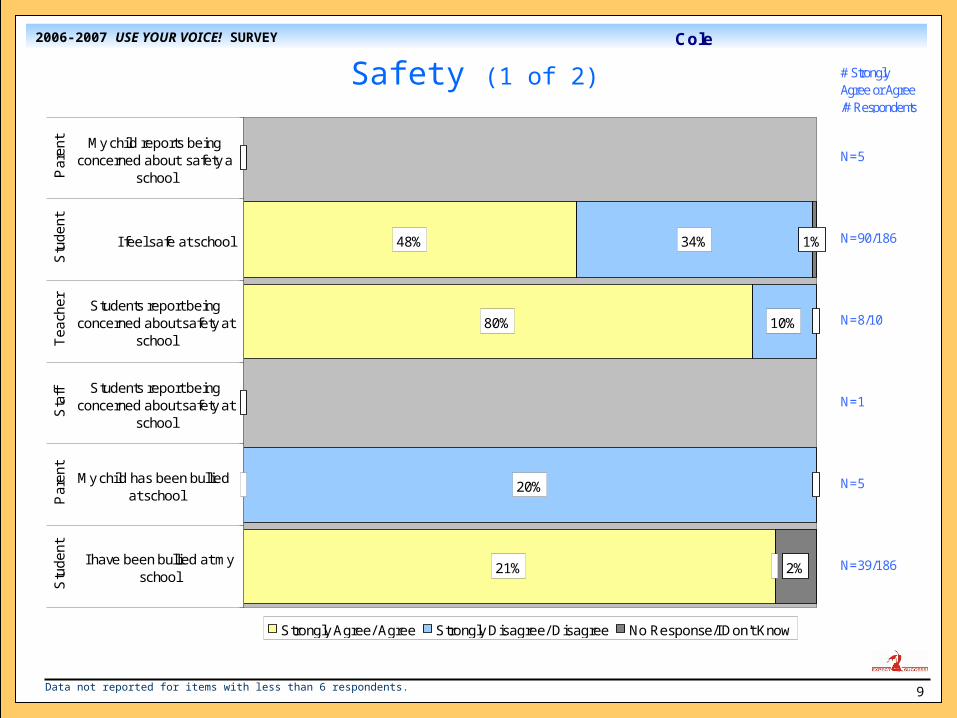
Safety (1 of 2)
48%
80%
21%
34%
10%
20%
1%
2%
My child reports beingconcerned about safety a
school
I feel safe at school
Students report beingconcerned about safety at
school
Students report beingconcerned about safety at
school
My child has been bullied at school
I have been bullied at myschool
Pa
ren
tS
tud
en
tT
ea
che
rS
taff
Pa
ren
tS
tud
en
t
Strongly Agree/ Agree Strongly Disagree/ Disagree No Response/I Don't Know
# StronglyAgree or Agree/# Respondents
N=5
N=90/186
N=8/10
N=1
N=5
N=39/186
2006-2007 USE YOUR VOICE! SURVEY
10
Cole
Data not reported for items with less than 6 respondents.
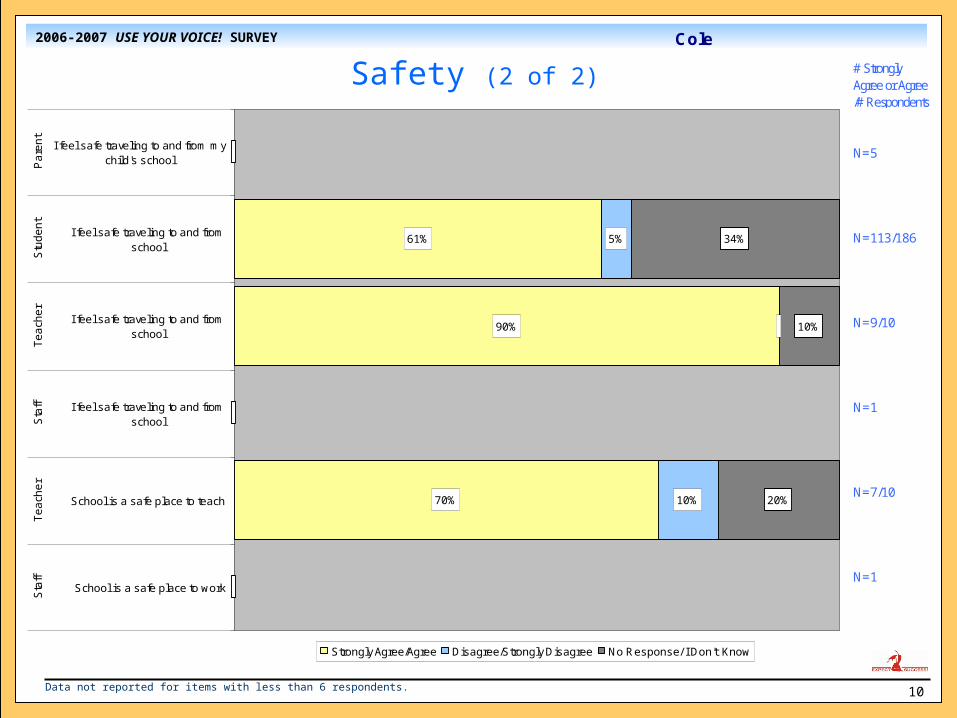
Safety (2 of 2)
61%
90%
70%
5%
10%
34%
10%
20%
I feel safe traveling to and from mychild's school
I feel safe traveling to and fromschool
I feel safe traveling to and fromschool
I feel safe traveling to and fromschool
School is a safe place to teach
School is a safe place to work
Pa
ren
tS
tud
en
tT
ea
che
rS
taff
Te
ach
er
Sta
ff
Strongly Agree/Agree Disagree/Strongly Disagree No Response/ I Don't Know
# StronglyAgree or Agree/# Respondents
N=5
N=113/186
N=9/10
N=1
N=7/10
N=1

2006-2007 USE YOUR VOICE! SURVEY
11
Cole
Data not reported for items with less than 6 respondents.
70% 30%
This school feels like acaring and supportive
environment
This school feels like acaring and supportive
environment
This school feels like acaring and supportive
environment
Par
ent
Teac
her
Sta
ff
Strongly Agree/ Agree Strongly Disagree/ Disagree No Response/I Don't Know
Caring and Support (1 of 3)
# StronglyAgree or Agree/# Respondents
N=5
N=7/10
N=1

2006-2007 USE YOUR VOICE! SURVEY
12
Cole
Data not reported for items with less than 6 respondents.
Caring and Support (2 of 3)
70%
90%
75%
100%
28%
10%
25%
2%
1%
At least one adult my child cango to for good advice and
support
At least one adult at my school Ican go to for good advice and
support
Most students know at leastone adult at this school theycan go to for good advice and
support
Most students know at leastone adult at this school theycan go to for good advice and
support
Teachers and staff help studentsto solve student conflicts
Teachers and staff help studentsto solve student conflicts
Teachers and staff help studentsto solve student conflicts
Par
ent
Stu
dent
Tea
cher
Sta
ffS
tude
ntT
each
erS
taff
Strongly Agree/ Agree Strongly Disagree/ Disagree No Response/I Don't Know
# StronglyAgree or Agree/# Respondents
N=5
N=131/186
N=9/10
N=1
N=139/186
N=10/10
N=1

2006-2007 USE YOUR VOICE! SURVEY
13
Cole
Data not reported for items with less than 6 respondents.
Caring and Support (3 of 3)
80%
100%
80%
67%
19%
17%
31%
1%
3%
3%
My child's teachers takethe time to help when mychild doesn't understand
something
My teacher takes the timeto help me when I don’tunderstand something
I take the time to helpstudents when they don'tunderstand something
My teachers believe I canbe successful in school
I feel appreciated for thework that I do
Pa
ren
tS
tud
en
tT
ea
ch
er
Stu
de
nt
Stu
de
nt
Strongly Agree/ Agree Strongly Disagree/ Disagree No Response/I Don't Know
# StronglyAgree or Agree/# Respondents
N=5
N=148/186
N=10/10
N=149/186
N=124/186

2006-2007 USE YOUR VOICE! SURVEY
14
Cole
Data not reported for items with less than 6 respondents.
Meaningful Youth Participation
73%
80%
44%
90%
90%
68%
24%
20%
53%
10%
10%
29%
3%
4%
3%
My child is given opportunitiesto help make decisions in class
My teacher lets students helpmake decisions in class
I often let students help makedecisions in class
Students are given opportunitiesto make decisions in school
I understand the standard ofschool work that teachers
expect
My teacher makes it cleareveryday what I am supposed to
learn
I clearly and consistentlycommunicate the work students
are expected to do
Students have opportunities toparticipate in school activities
I am involved in at least oneschool-sponsored activity
Par
ent
Stu
dent
Tea
cher
Sta
ffP
aren
tS
tude
ntT
each
erT
each
erS
tude
nt
Strongly Agree/ Agree Strongly Disagree/ Disagree No Response/I Don't Know
# StronglyAgree or Agree/# Respondents
N=5
N=136/186
N=8/10
N=1
N=5
N=81/186
N=9/10
N=9/10
N=127/186

2006-2007 USE YOUR VOICE! SURVEY
15
Cole
Data not reported for items with less than 6 respondents.
High Expectations (1 of 2)
86%
72%
50%
12%
28%
50%
2%
1%
I make school andhomework high priorities
My parents/guardiansmake school and
homework high priorities
I work with my child'steacher to set and review
child's learning goals
I work with my teachersand parents to set and
review goals for mylearning
I work with parents to helpstudents set and review
goals for learning
Teachers and parentscollaborate to help
students set and reviewgoals for learning
Pa
ren
tS
tud
en
tP
are
nt
Stu
de
nt
Te
ach
er
Sta
ff
Strongly Agree/ Agree Strongly Disagree/ Disagree No Response/I Don't Know
# StronglyAgree or Agree/# Respondents
N=5
N=160/186
N=5
N=133/186
N=5/10
N=1
2006-2007 USE YOUR VOICE! SURVEY
16
Cole
Data not reported for items with less than 6 respondents.
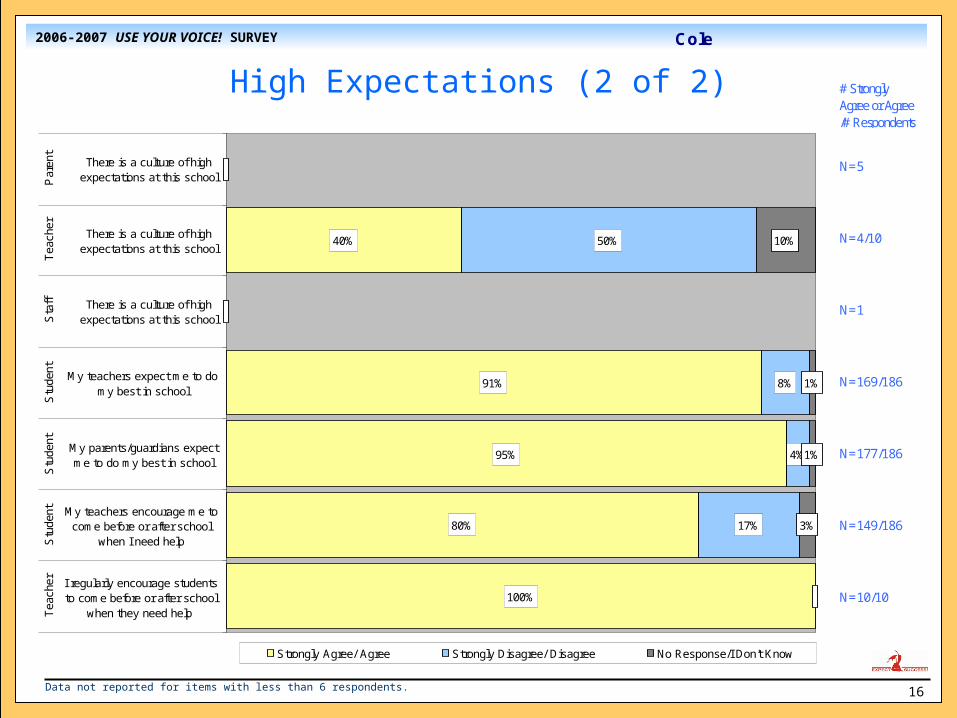
High Expectations (2 of 2)
40%
91%
95%
80%
100%
50%
8%
4%
17%
10%
1%
1%
3%
There is a culture of highexpectations at this school
There is a culture of highexpectations at this school
There is a culture of highexpectations at this school
My teachers expect me to domy best in school
My parents/guardians expectme to do my best in school
My teachers encourage me tocome before or after school
when I need help
I regularly encourage studentsto come before or after school
when they need help
Par
ent
Tea
cher
Sta
ffS
tude
ntS
tude
ntS
tude
ntT
each
er
Strongly Agree/ Agree Strongly Disagree/ Disagree No Response/I Don't Know
# StronglyAgree or Agree/# Respondents
N=5
N=4/10
N=1
N=169/186
N=177/186
N=149/186
N=10/10

2006-2007 USE YOUR VOICE! SURVEY
17
Cole
Data not reported for items with less than 6 respondents.
Academic Rigor (1 of 2)
74%
90%
76%
90%
70%
70%
23%
20%
20%
10%
3%
10%
4%
10%
10%
20%
My child receives challengingand rigorous instruction
My teacher challenges me toshare my opinions and ideas
I challenge students to sharetheir opinions and ideas
My teacher uses differentways that help me learn
I regularly use a variety ofstrategies to help students
learn
I regularly use a variety ofstrategies to check forstudent understanding
I regularly have studentscollaborate on lessons and
projects
Par
ent
Stu
dent
Tea
cher
Stu
dent
Tea
cher
Tea
cher
Tea
cher
Strongly Agree/ Agree Strongly Disagree/ Disagree No Response/I Don't Know
# StronglyAgree or Agree/# Respondents
N=5
N=138/186
N=9/10
N=141/186
N=9/10
N=7/10
N=7/10
2006-2007 USE YOUR VOICE! SURVEY
18
Cole
Data not reported for items with less than 6 respondents.
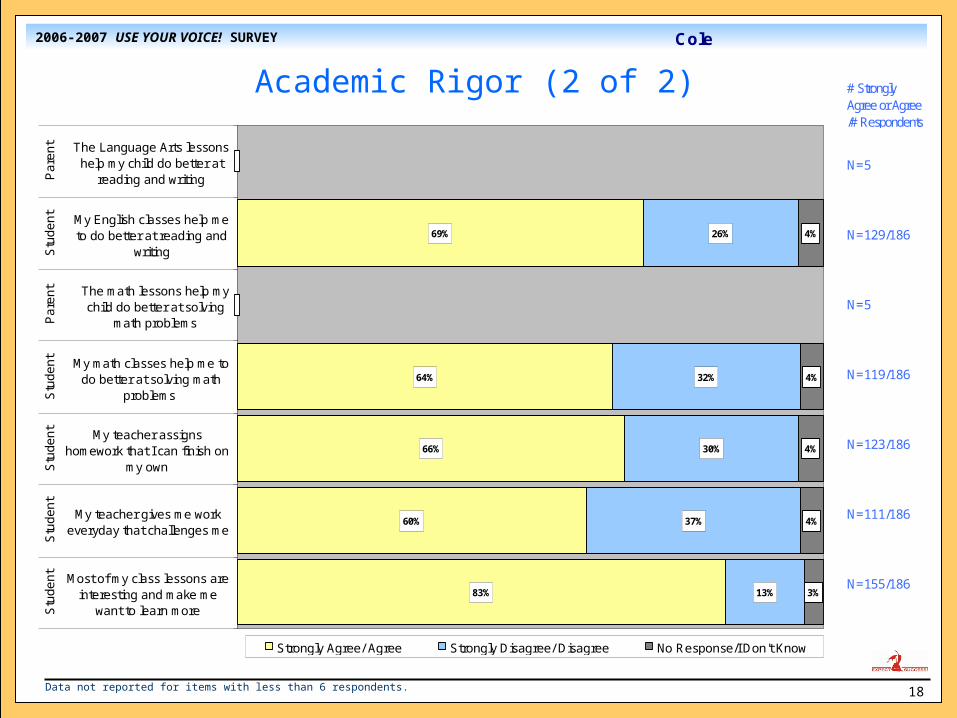
Academic Rigor (2 of 2)
69%
64%
66%
60%
83%
26%
32%
30%
37%
13%
4%
4%
4%
4%
3%
The Language Arts lessonshelp my child do better at
reading and writing
My English classes help meto do better at reading and
writing
The math lessons help mychild do better at solving
math problems
My math classes help me todo better at solving math
problems
My teacher assignshomework that I can finish on
my own
My teacher gives me workeveryday that challenges me
Most of my class lessons areinteresting and make me
want to learn more
Pa
ren
tS
tud
en
tP
are
nt
Stu
de
nt
Stu
de
nt
Stu
de
nt
Stu
de
nt
Strongly Agree/ Agree Strongly Disagree/ Disagree No Response/I Don't Know
# StronglyAgree or Agree/# Respondents
N=5
N=129/186
N=5
N=119/186
N=123/186
N=111/186
N=155/186
2006-2007 USE YOUR VOICE! SURVEY
19
Cole
Data not reported for items with less than 6 respondents.
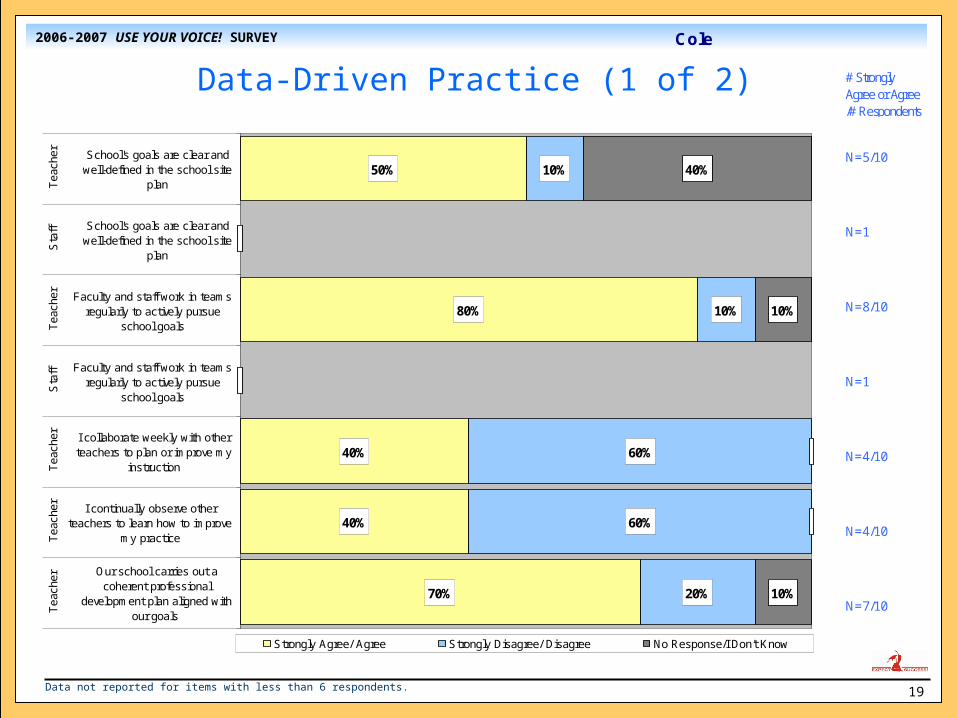
Data-Driven Practice (1 of 2)
50%
80%
40%
40%
70%
10%
10%
60%
60%
20%
40%
10%
10%
School's goals are clear andwell-defined in the school site
plan
School's goals are clear andwell-defined in the school site
plan
Faculty and staff work in teamsregularly to actively pursue
school goals
Faculty and staff work in teamsregularly to actively pursue
school goals
I collaborate weekly with otherteachers to plan or improve my
instruction
I continually observe otherteachers to learn how to improve
my practice
Our school carries out acoherent professional
development plan aligned withour goals
Tea
cher
Sta
ffT
each
erS
taff
Tea
cher
Tea
cher
Tea
cher
Strongly Agree/ Agree Strongly Disagree/ Disagree No Response/I Don't Know
# StronglyAgree or Agree/# Respondents
N=5/10
N=1
N=8/10
N=1
N=4/10
N=4/10
N=7/10

2006-2007 USE YOUR VOICE! SURVEY
20
Cole
Data not reported for items with less than 6 respondents.
Data-Driven Practice (2 of 2)
80%
80%
60%
100%
20%
20%
40%
I have access to useful, timelydata on student performance to
help guide teaching
I regularly use studentachievement data to makedecisions about teaching
I have a good understanding ofhow to use data tools
I have a good understanding ofthe state curriculum standardsfor the grade/course(s) I teach
I understand how to interpret mychild's standardized test scores
I understand how to interpret mychild's transcripts and report
cards
I make decisions about mychild's learning based on his/her
report card
Tea
cher
Tea
cher
Tea
cher
Tea
cher
Par
ent
Par
ent
Par
ent
Strongly Agree/ Agree Strongly Disagree/ Disagree No Response/I Don't Know
# StronglyAgree or Agree/# Respondents
N=8/10
N=8/10
N=6/10
N=10/10
N=5
N=5
N=5

2006-2007 USE YOUR VOICE! SURVEY
21
Cole
Data not reported for items with less than 6 respondents.
Family Engagement (1 of 2)
61%
20%
80%
35%
70%
20%
3%
10%
I have attended teacher-parent night/school meetings at leastonce this year
My parents came to teacher-parent night/school meetings atleast once this year
Most of my students' parents have come to see me at leastonce this year
I feel encouraged to participate in school activities or meetings
I feel encouraged to participate in school activities or meetings
I feel encouraged to participate in school activities or meetings
The school provides accommodations so that I can participatein school activities or meetings
My child's teachers include me in decisions that affect him/her
Pa
ren
tS
tud
en
tT
ea
che
rP
are
nt
Te
ach
er
Sta
ffP
are
nt
Pa
ren
t
Strongly Agree/ Agree Strongly Disagree/ Disagree No Response/I Don't Know
# StronglyAgree or Agree/# Respondents
N=5
N=114/186
N=2/10
N=5
N=8/10
N=1
N=5
N=5
2006-2007 USE YOUR VOICE! SURVEY
22
Cole
Data not reported for items with less than 6 respondents.
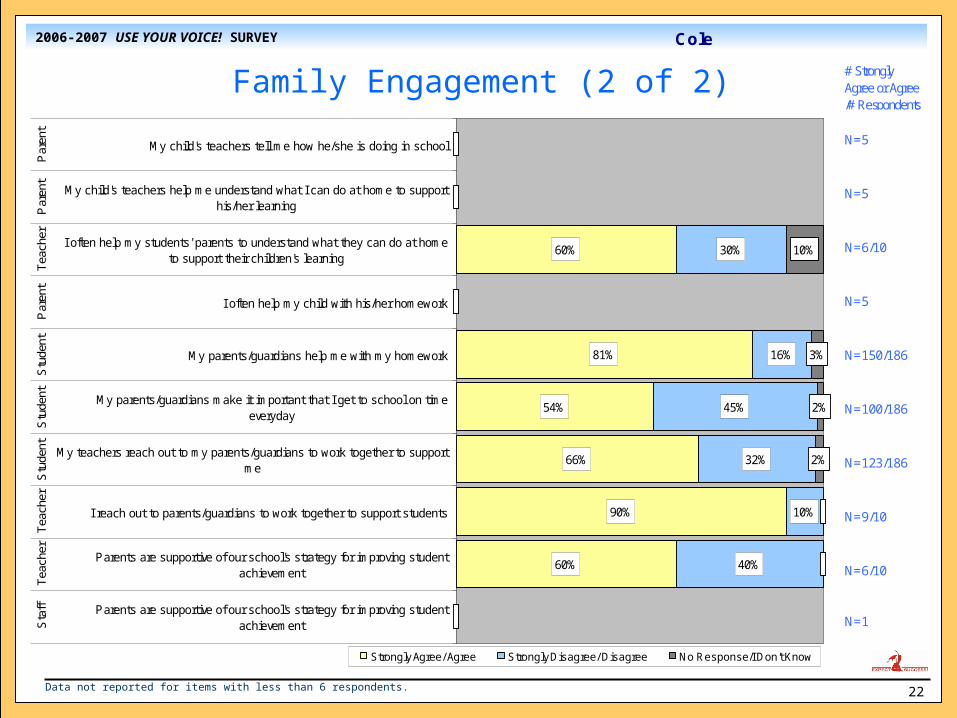
Family Engagement (2 of 2)
60%
81%
54%
66%
90%
60%
30%
16%
45%
32%
10%
40%
10%
3%
2%
2%
My child's teachers tell me how he/she is doing in school
My child's teachers help me understand what I can do at home to supporthis/her learning
I often help my students' parents to understand what they can do at hometo support their children's learning
I often help my child with his/her homework
My parents/guardians help me with my homework
My parents/guardians make it important that I get to school on timeeveryday
My teachers reach out to my parents/guardians to work together to supportme
I reach out to parents/guardians to work together to support students
Parents are supportive of our school's strategy for improving studentachievement
Parents are supportive of our school's strategy for improving studentachievement
Par
ent
Par
ent
Tea
cher
Par
ent
Stu
dent
Stu
dent
Stu
dent
Tea
cher
Tea
cher
Sta
ff
Strongly Agree/ Agree Strongly Disagree/ Disagree No Response/I Don't Know
# StronglyAgree or Agree/# Respondents
N=5
N=5
N=6/10
N=5
N=150/186
N=100/186
N=123/186
N=9/10
N=6/10
N=1
2006-2007 USE YOUR VOICE! SURVEY
23
Cole
Data not reported for items with less than 6 respondents.
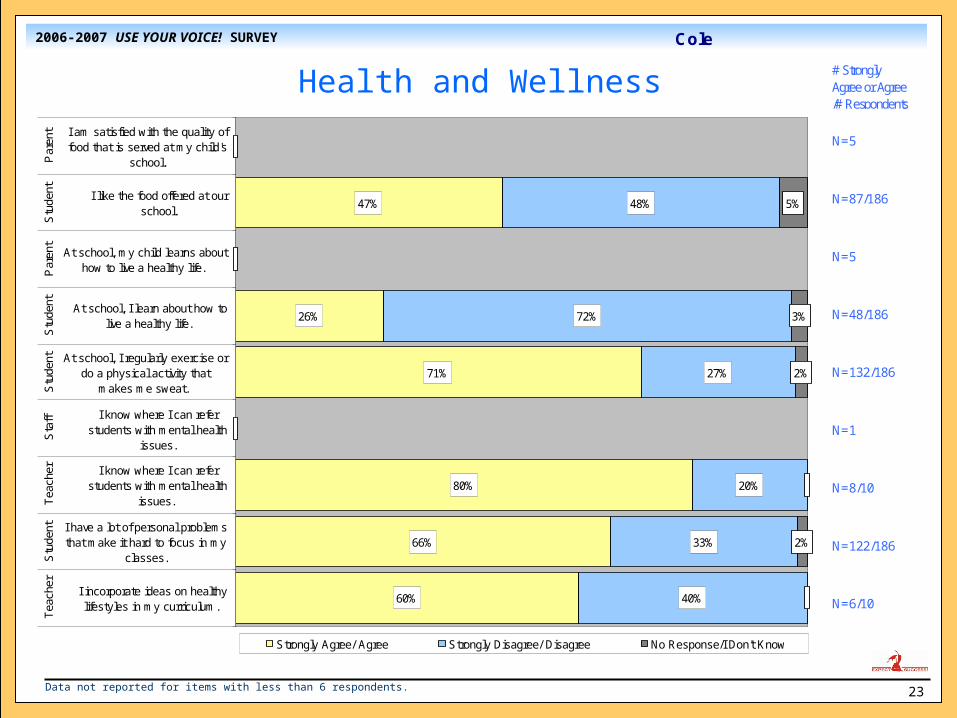
Health and Wellness
47%
26%
71%
80%
66%
60%
48%
72%
27%
20%
33%
40%
5%
3%
2%
2%
I am satisfied with the quality offood that is served at my child's
school.
I like the food offered at ourschool.
At school, my child learns abouthow to live a healthy life.
At school, I learn about how tolive a healthy life.
At school, I regularly exercise ordo a physical activity that
makes me sweat.
I know where I can referstudents with mental health
issues.
I know where I can referstudents with mental health
issues.
I have a lot of personal problemsthat make it hard to focus in my
classes.
I incorporate ideas on healthylifestyles in my curriculum.
Par
ent
Stu
dent
Par
ent
Stu
dent
Stu
dent
Sta
ffT
each
erS
tude
ntT
each
er
Strongly Agree/ Agree Strongly Disagree/ Disagree No Response/I Don't Know
# StronglyAgree or Agree/# Respondents
N=5
N=87/186
N=5
N=48/186
N=132/186
N=1
N=8/10
N=122/186
N=6/10
2006-2007 USE YOUR VOICE! SURVEY
24
Cole
Data not reported for items with less than 6 respondents.
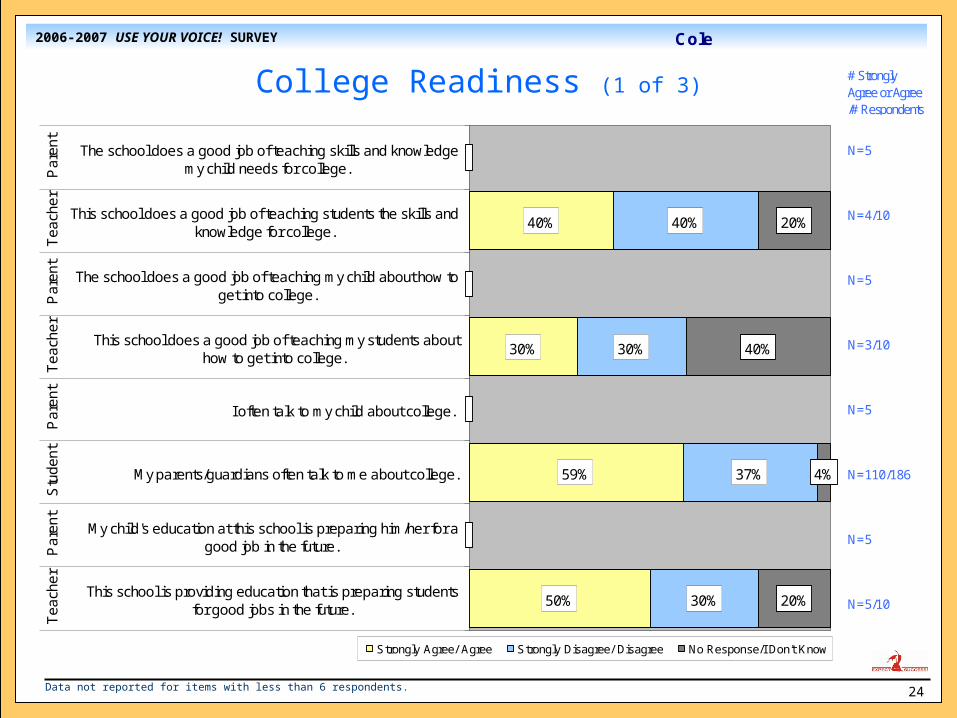
College Readiness (1 of 3)
40%
30%
59%
50%
40%
30%
37%
30%
20%
40%
4%
20%
The school does a good job of teaching skills and knowledgemy child needs for college.
This school does a good job of teaching students the skills andknowledge for college.
The school does a good job of teaching my child about how toget into college.
This school does a good job of teaching my students abouthow to get into college.
I often talk to my child about college.
My parents/guardians often talk to me about college.
My child's education at this school is preparing him/her for agood job in the future.
This school is providing education that is preparing studentsfor good jobs in the future.
Par
ent
Tea
cher
Par
ent
Tea
cher
Par
ent
Stu
de
nt
Par
ent
Tea
cher
Strongly Agree/ Agree Strongly Disagree/ Disagree No Response/I Don't Know
# StronglyAgree or Agree/# Respondents
N=5
N=4/10
N=5
N=3/10
N=5
N=110/186
N=5
N=5/10
2006-2007 USE YOUR VOICE! SURVEY
25
Cole
Data not reported for items with less than 6 respondents.
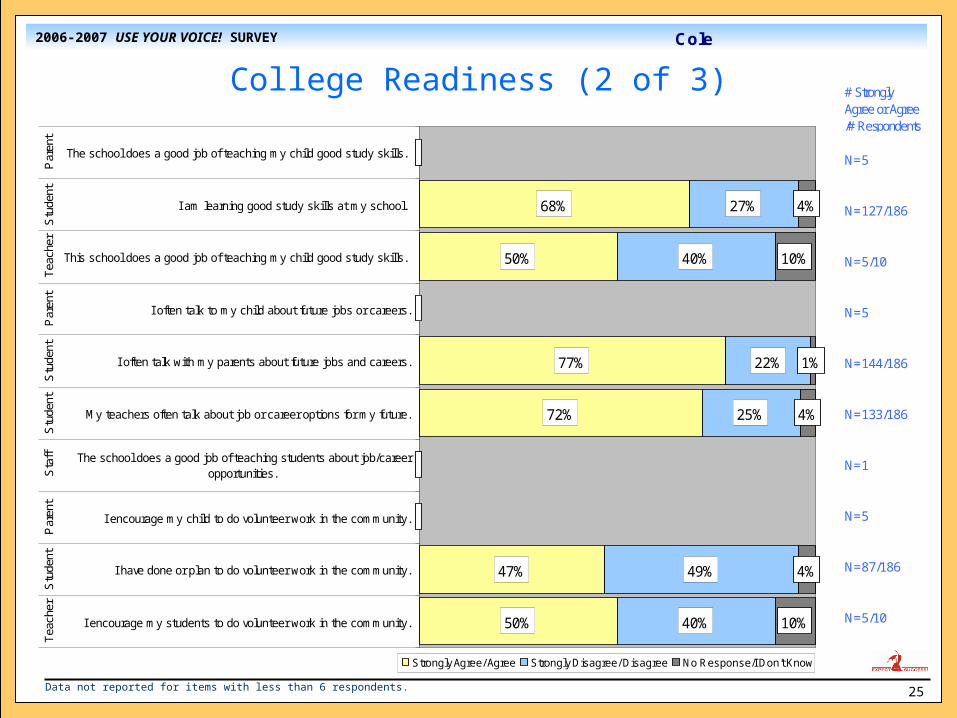
College Readiness (2 of 3)
68%
50%
77%
72%
47%
50%
27%
40%
22%
25%
49%
40%
4%
10%
1%
4%
4%
10%
The school does a good job of teaching my child good study skills.
I am learning good study skills at my school.
This school does a good job of teaching my child good study skills.
I often talk to my child about future jobs or careers.
I often talk with my parents about future jobs and careers.
My teachers often talk about job or career options for my future.
The school does a good job of teaching students about job/careeropportunities.
I encourage my child to do volunteer work in the community.
I have done or plan to do volunteer work in the community.
I encourage my students to do volunteer work in the community.
Par
ent
Stu
dent
Tea
cher
Par
ent
Stu
dent
Stu
dent
Sta
ffP
aren
tS
tude
ntT
each
er
Strongly Agree/ Agree Strongly Disagree/ Disagree No Response/I Don't Know
# StronglyAgree or Agree/# Respondents
N=5
N=127/186
N=5/10
N=5
N=144/186
N=133/186
N=1
N=5
N=87/186
N=5/10
2006-2007 USE YOUR VOICE! SURVEY
26
Cole
Data not reported for items with less than 6 respondents.
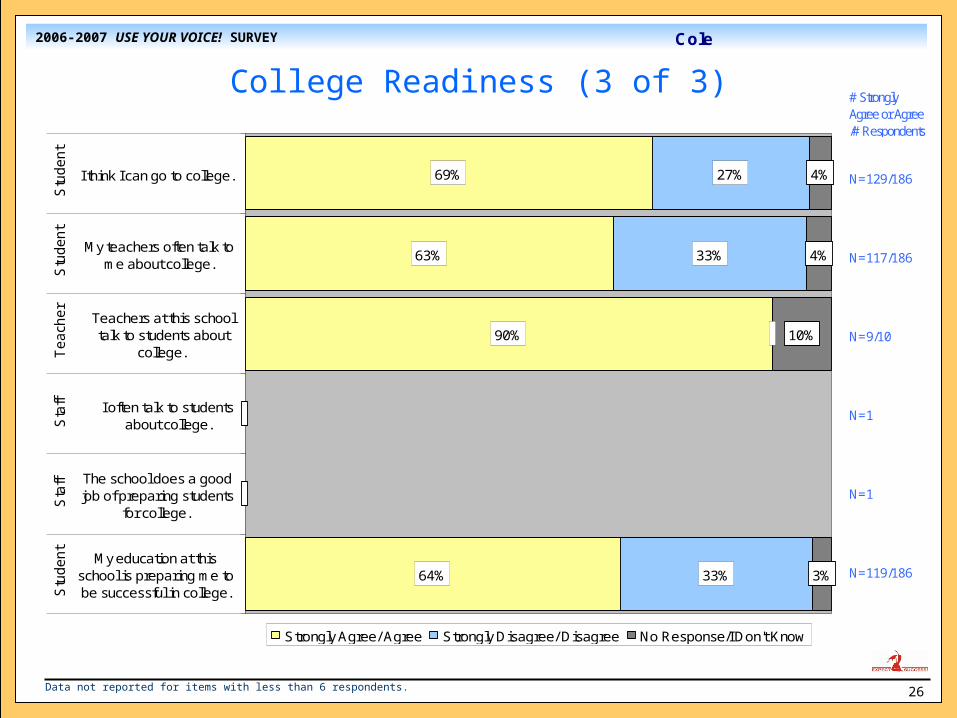
College Readiness (3 of 3)
69%
63%
90%
64%
27%
33%
33%
4%
4%
10%
3%
I think I can go to college.
My teachers often talk tome about college.
Teachers at this schooltalk to students about
college.
I often talk to studentsabout college.
The school does a goodjob of preparing students
for college.
My education at thisschool is preparing me tobe successful in college.
Stu
de
nt
Stu
de
nt
Te
ach
er
Sta
ffS
taff
Stu
de
nt
Strongly Agree/ Agree Strongly Disagree/ Disagree No Response/I Don't Know
# StronglyAgree or Agree/# Respondents
N=129/186
N=117/186
N=9/10
N=1
N=1
N=119/186
2006-2007 USE YOUR VOICE! SURVEY
27
Cole
Data not reported for items with less than 6 respondents.
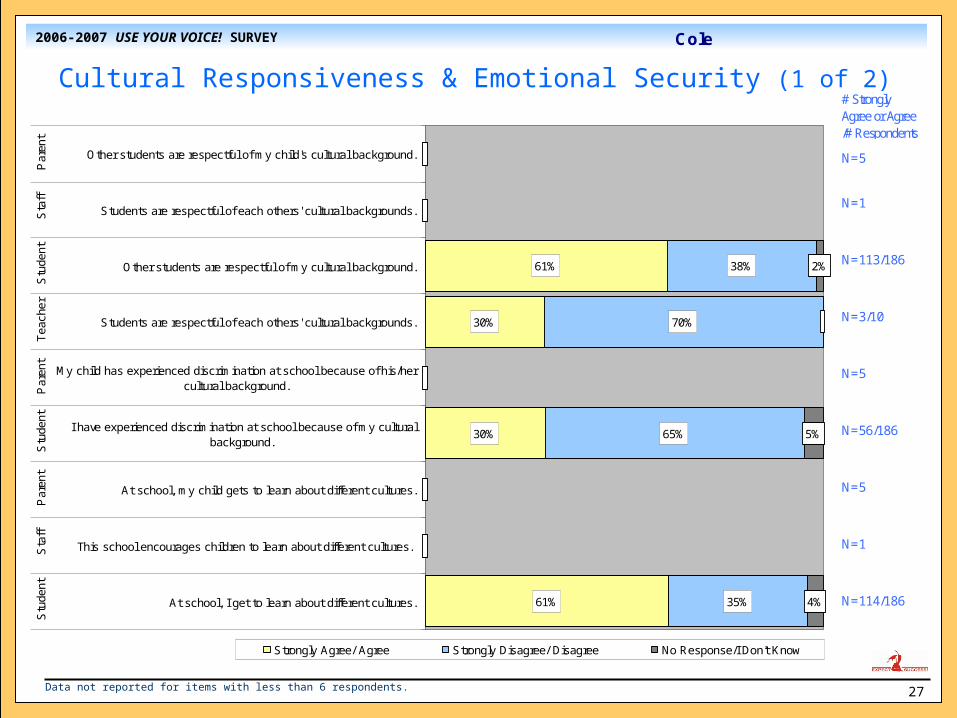
Cultural Responsiveness & Emotional Security (1 of 2)
61%
30%
30%
61%
38%
70%
65%
35%
2%
5%
4%
Other students are respectful of my child's cultural background.
Students are respectful of each others' cultural backgrounds.
Other students are respectful of my cultural background.
Students are respectful of each others' cultural backgrounds.
My child has experienced discrimination at school because of his/hercultural background.
I have experienced discrimination at school because of my culturalbackground.
At school, my child gets to learn about different cultures.
This school encourages children to learn about different cultures.
At school, I get to learn about different cultures.
Par
ent
Sta
ff S
tude
ntT
each
erP
aren
t S
tude
ntP
aren
t S
taff
Stu
dent
Strongly Agree/ Agree Strongly Disagree/ Disagree No Response/I Don't Know
# StronglyAgree or Agree/# Respondents
N=5
N=1
N=113/186
N=3/10
N=5
N=56/186
N=5
N=1
N=114/186
2006-2007 USE YOUR VOICE! SURVEY
28
Cole
Data not reported for items with less than 6 respondents.
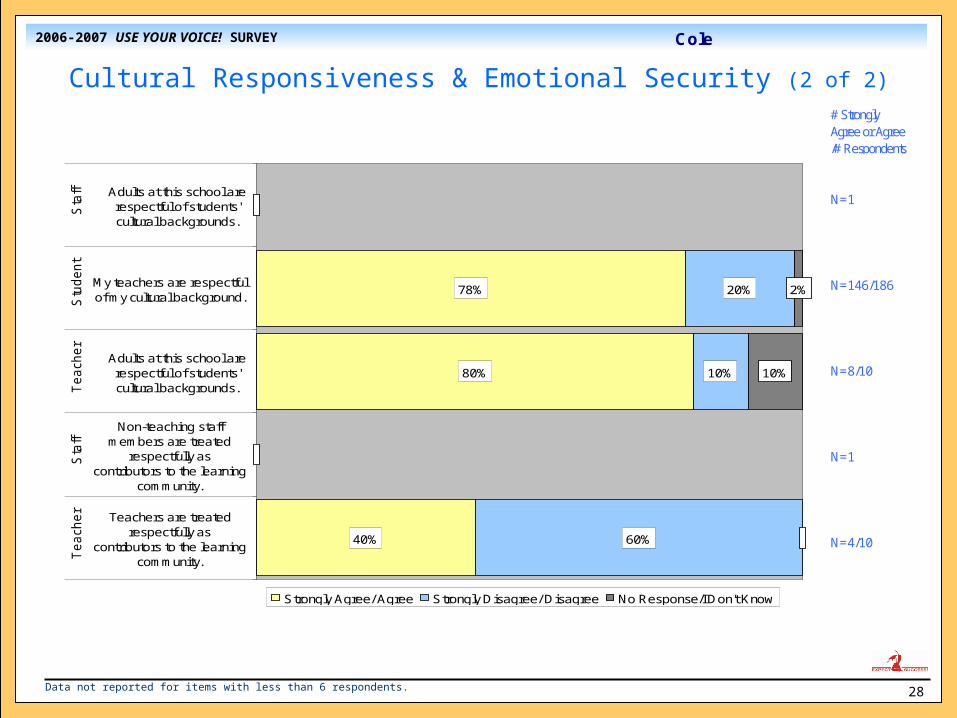
Cultural Responsiveness & Emotional Security (2 of 2)
78%
80%
40%
20%
10%
60%
2%
10%
Adults at this school arerespectful of students'cultural backgrounds.
My teachers are respectfulof my cultural background.
Adults at this school arerespectful of students'cultural backgrounds.
Non-teaching staffmembers are treated
respectfully ascontributors to the learning
community.
Teachers are treatedrespectfully as
contributors to the learningcommunity.
Sta
ff S
tud
en
tT
ea
ch
er
Sta
ffT
ea
ch
er
Strongly Agree/ Agree Strongly Disagree/ Disagree No Response/I Don't Know
# StronglyAgree or Agree/# Respondents
N=1
N=146/186
N=8/10
N=1
N=4/10
2006-2007 USE YOUR VOICE! SURVEY
29
Cole
Data not reported for items with less than 6 respondents.
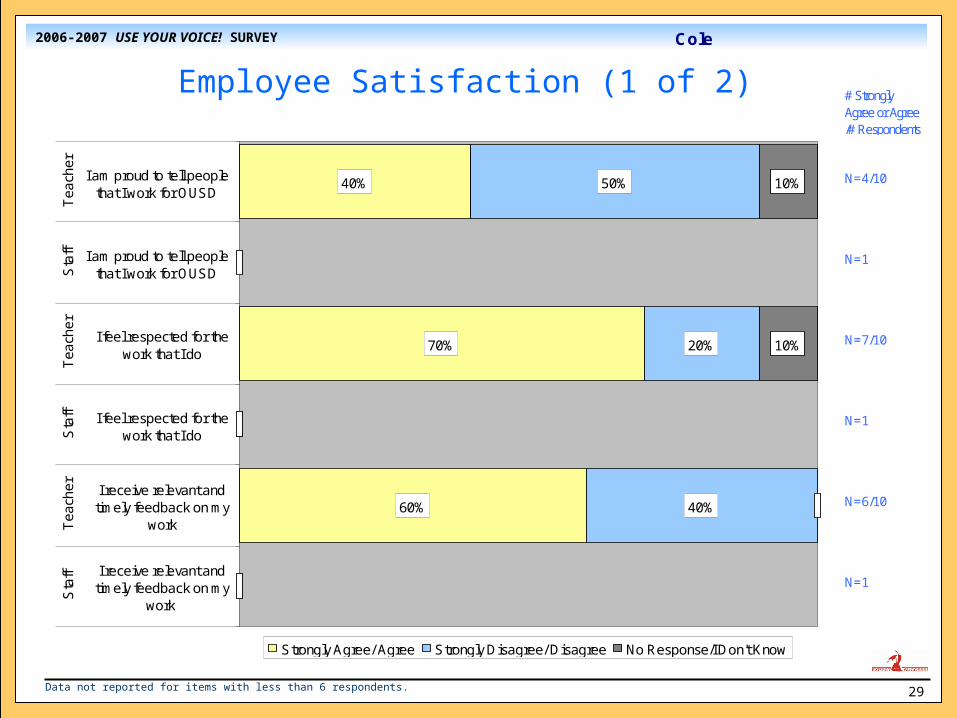
Employee Satisfaction (1 of 2)
40%
70%
60%
50%
20%
40%
10%
10%
I am proud to tell peoplethat I work for OUSD
I am proud to tell peoplethat I work for OUSD
I feel respected for thework that I do
I feel respected for thework that I do
I receive relevant andtimely feedback on my
work
I receive relevant andtimely feedback on my
work
Te
ach
er
Sta
ffT
ea
che
rS
taff
Te
ach
er
Sta
ff
Strongly Agree/ Agree Strongly Disagree/ Disagree No Response/I Don't Know
# StronglyAgree or Agree/# Respondents
N=4/10
N=1
N=7/10
N=1
N=6/10
N=1

2006-2007 USE YOUR VOICE! SURVEY
30
Cole
Data not reported for items with less than 6 respondents.
Employee Satisfaction (2 of 2)
70%
60%
50%
30%
30%
40%
10%
10%
The formal (contractual)evaluation process is auseful tool for improving
my work
The formal (contractual)evaluation process is auseful tool for improving
my work
The district providesadequate training and
professional development
The district providesadequate training and
professional development
Overall, I am satisfiedworking for OUSD
Overall, I am satisfiedworking for OUSD
Te
ach
er
Sta
ffT
ea
che
rS
taff
Te
ach
er
Sta
ff
Strongly Agree/ Agree Strongly Disagree/ Disagree No Response/I Don't Know
# StronglyAgree or Agree/# Respondents
N=7/10
N=1
N=6/10
N=1
N=5/10
N=1
2006-2007 USE YOUR VOICE! SURVEY
31
Cole
Data not reported for items with less than 6 respondents.
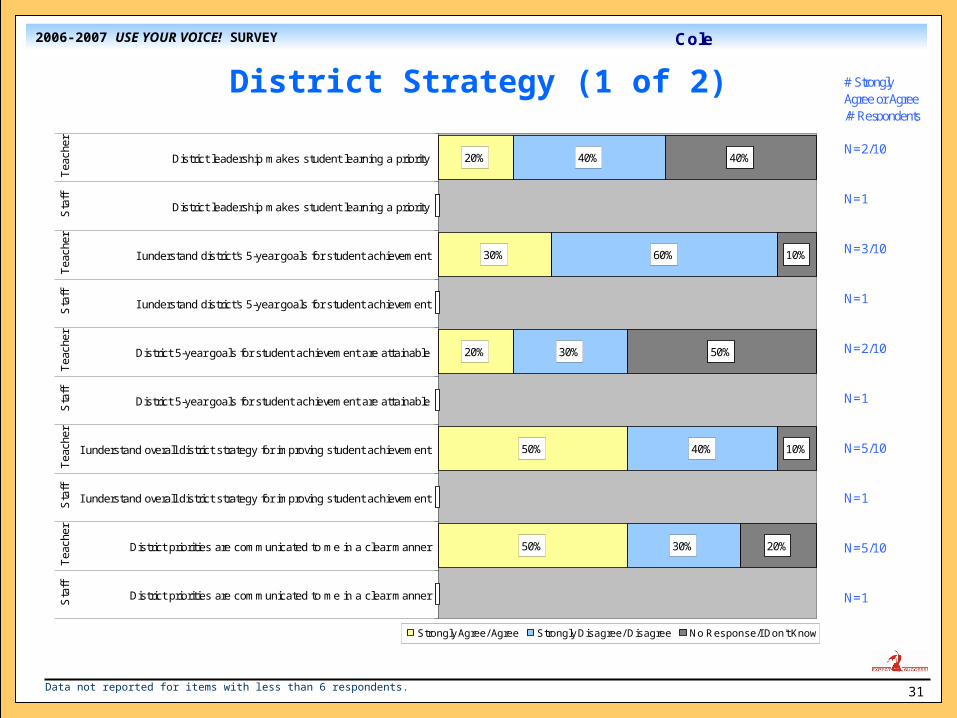
District Strategy (1 of 2)
20%
30%
20%
50%
50%
40%
60%
30%
40%
30%
40%
10%
50%
10%
20%
District leadership makes student learning a priority
District leadership makes student learning a priority
I understand district's 5-year goals for student achievement
I understand district's 5-year goals for student achievement
District 5-year goals for student achievement are attainable
District 5-year goals for student achievement are attainable
I understand overall district strategy for improving student achievement
I understand overall district strategy for improving student achievement
District priorities are communicated to me in a clear manner
District priorities are communicated to me in a clear manner
Tea
cher
Sta
ffT
each
erS
taff
Tea
cher
Sta
ffT
each
erS
taff
Tea
cher
Sta
ff
Strongly Agree/ Agree Strongly Disagree/ Disagree No Response/I Don't Know
# StronglyAgree or Agree/# Respondents
N=2/10
N=1
N=3/10
N=1
N=2/10
N=1
N=5/10
N=1
N=5/10
N=1
2006-2007 USE YOUR VOICE! SURVEY
32
Cole
Data not reported for items with less than 6 respondents.
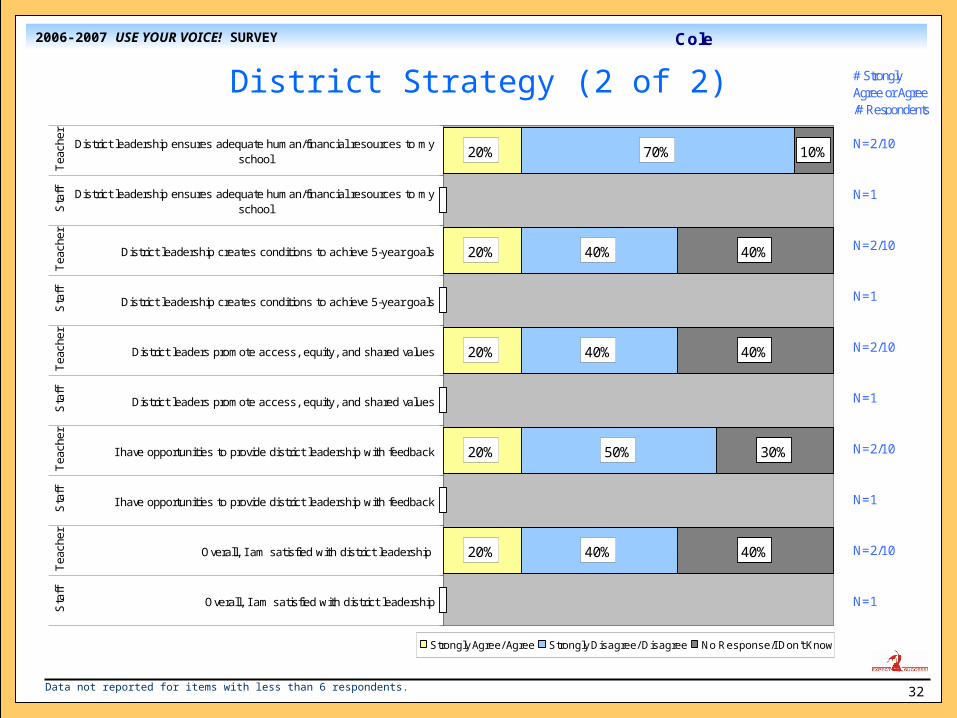
District Strategy (2 of 2)
20%
20%
20%
20%
20%
70%
40%
40%
50%
40%
40%
10%
40%
30%
40%
District leadership ensures adequate human/financial resources to myschool
District leadership ensures adequate human/financial resources to myschool
District leadership creates conditions to achieve 5-year goals
District leadership creates conditions to achieve 5-year goals
District leaders promote access, equity, and shared values
District leaders promote access, equity, and shared values
I have opportunities to provide district leadership with feedback
I have opportunities to provide district leadership with feedback
Overall, I am satisfied with district leadership
Overall, I am satisfied with district leadership
Tea
cher
Sta
ffT
each
erS
taff
Tea
cher
Sta
ffT
each
erS
taff
Tea
cher
Sta
ff
Strongly Agree/ Agree Strongly Disagree/ Disagree No Response/I Don't Know
# StronglyAgree or Agree/# Respondents
N=2/10
N=1
N=2/10
N=1
N=2/10
N=1
N=2/10
N=1
N=2/10
N=1