examinees’ perceptions about an online …etd.lib.metu.edu.tr/upload/12608698/index.pdf ·...
TRANSCRIPT

EXAMINEES’ PERCEPTIONS ABOUT AN ONLINE ASSESSMENT CENTER AND AN ONLINE ASSESSMENT TOOL: A CASE STUDY
A THESIS SUBMITTED TO THE GRADUATE SCHOOL OF NATURAL AND APPLIED SCIENCES
OF MIDDLE EAST TECHNICAL UNIVERSITY
BY
ALİ YILMAZ
IN PARTIAL FULFILLMENT OF THE REQUIREMENTS FOR
THE DEGREE OF MASTER OF SCIENCE IN
COMPUTER EDUCATION AND INSTRUCTIONAL TECHNOLOGIES
SEPTEMBER 2007
Approval of the thesis:
EXAMINEES’ PERCEPTIONS ABOUT AN ONLINE ASSESSMENT CENTER AND AN ONLINE ASSESSMENT TOOL: A CASE STUDY
submitted by ALİ YILMAZ in partial fulfillment of the requirements for the degree of Master of Science in Computer Education and Instructional Technologies Department, Middle East Technical University by, Prof. Dr. Canan ÖZGEN _____________________ Dean, Graduate School of Natural and Applied Sciences Prof. Dr. M. Yaşar ÖZDEN _____________________ Head of Department, Computer Education and Instructional Technologies Dept., METU Prof. Dr. M. Yaşar ÖZDEN _____________________ Supervisor, Computer Education and Instructional Technologies Dept., METU Examining Committee Members: Prof. Dr. Ata TEZBAŞARAN _____________________ Educational Sciences Dept., Mersin University Prof. Dr. M. Yaşar ÖZDEN _____________________ Computer Education and Instructional Technologies Dept., METU Assoc. Prof. Dr. M. Settar KOÇAK _____________________ Physical Education and Sports Dept., METU Dr. Hasan KARAASLAN _____________________ Computer Education and Instructional Technologies Dept., METU Dr. Ömer DELİALİOĞLU _____________________ Computer Education and Instructional Technologies Dept., METU
Date: 03.09.2007

iii
I hereby declare that all information in this document has been obtained and presented in accordance with academic rules and ethical conduct. I also declare that, as required by these rules and conduct, I have fully cited and referenced all material and results that are not original to this work.
Name, Last name : Ali YILMAZ
Signature :

iv
ABSTRACT
EXAMINEES’ PERCEPTIONS ABOUT AN ONLINE ASSESSMENT
CENTER AND AN ONLINE ASSESSMENT TOOL: A CASE STUDY
Yılmaz, Ali
M.S., Department of Computer Education and Instructional Technology
Supervisor: Prof. Dr. M. Yaşar ÖZDEN
September 2007, 126 Pages
This study investigated the examinees’ perceptions about an online assessment
tool and an online assessment center. In this study, a computer literacy exam
(Bilişim Seviye Tespit Sınavı, BSTS) was delivered in purposively designed
environment, an online assessment center, at CEC, METU (Continuing Education
Center, Middle East Technical University).
The data were collected from 117 participants through the “User evaluation
questionnaire”, in depth interviews with 43 examinees and 7 experts. 7
participants and the experts were interviewed individually while the rest 36
participants were interviewed in 6 focus groups (composed of 6 examinees).
Descriptive statistics, frequency distributions and comments of participants and
experts were used to express the results of the study.

v
The results showed that the examinees perceived the online assessment tool and
the online assessment center suitable for delivering online assessments. However,
both participants and experts reported that a few changes could be done to the
interface of online assessment tool. They also suggested that the computer literacy
assessments be more authentic.
Keywords: Computer literacy assessment, online assessment, computer based
assessment, online assessment center.
vi
ÖZ
ÇEVRİMİÇİ SINAV MERKEZİ VE ÇEVRİMİÇİ DEĞERLENDİRME
ARACI HAKKINDAKİ KULLANICI ALGILARI: DURUM ÇALIŞMASI
Yılmaz, Ali
Yüksek Lisans, Bilgisayar ve Öğretim Teknolojileri Eğitimi Bölümü
Tez Yöneticisi: Prof. Dr. M. Yaşar ÖZDEN
Eylül 2007, 126 sayfa
Bu çalışmada, sınava girenlerin çevrimiçi sınav merkezi ve bir çevrimiçi
değerlendirme aracı hakkında algıları araştırılmıştır. Katılımcılar ODTÜ SEM
(Orta Doğu Teknik Üniversitesi Sürekli Eğitim Merkezi)’de bir bilgisayar
yetkinlik sertifika sınavına (Bilişim Seviye Tespit Sınavı, BSTS) bu amaca
yönelik tasarlanmış bir çevrimiçi sınav merkezinde girmişlerdir.
Veriler 117 katılımcı ve 7 uzmandan toplanmıştır. 117 katılımcı “Kullanıcı
Değerlendirme Anketi”ni doldurmuş, 117 katılımcının 43’ü ve 7 uzman ile
görüşmeler yapılmıştır. Bu görüşmeler, 7 katılımcı ve 7 uzman ile yüz yüze, kalan
36 katılımcı ile odak grup görüşmesi (6 katılımcıdan oluşan) olarak
gerçekleştirilmiştir. Araştırma sonuçları betimsel istatistik, frekans dağılımları ve
katılımcı ve uzman görüşleri aracılığı ile sunulmuştur.

vii
Araştırma sonuçları göstermiştir ki sınava girenler, çevrimiçi sınavı ve çevrimiçi
sınav merkezini sınav vermek için uygun olarak algılamışladır. Ancak, hem
katılımcılar, hem de uzmanlar çevrimiçi sınav aracının kullanıcı arayüzünde
değişiklikler yapılmasını önermişlerdir. Ayrıca, Bilişim Seviye Tespit Sınavı’nın
da daha gerçekçi olmasını önermişlerdir.
Anahtar Kelimeler: Bilişim seviye tespit sınavı, çevrimiçi sınav, bilgisayar
tabanlı sınav, çevrimiçi sınav merkezi.

viii
To my dear wife…
ix
ACKNOWLEDGEMENTS
Firstly and the foremost, I would like express my deep appreciation to my thesis
supervisor Prof. Dr. M. Yaşar Özden for his guidance, support and encouragement
throughout the study.
I would like to express my sincere gratitude to the examination committee
members, Prof. Dr. Ata Tezbaşaran, Assoc. Prof .Dr. M Settar Koçak, Dr. Hasan
Karaaslan and Dr. Ömer Delialioğlu.
I would like to thank Prof. Dr. Ata Tezbaşaran, Assoc. Prof. Dr. Ercan Kiraz,
Assist. Prof. Dr. S. Sadi Seferoğlu, Dr. Halil Yurdugül, Dr. Yüksel Göktaş, and
Nuray Temur for their assistance in preparing the instrument of the study.
I would like to thank Levent Durdu his great help, support and comments
throughout the study.
I also would like to thank Halil Ersoy, M. Banu Gündoğan, Levent Bayram, and
Dr. Cengiz S. Askun for their participation in the interviews and comments.
Finally, I would like to express my love and deep gratitude to my wife for her
patience, encouragement and for their unwavering faith in me.

x
TABLE OF CONTENTS
ABSTRACT ....................................................................................................... iv
ÖZ ...................................................................................................................... vi
ACKNOWLEDGEMENTS ................................................................................ ix
TABLE OF CONTENTS ..................................................................................... x
LIST OF TABLES ............................................................................................ xiv
LIST OF FIGURES .......................................................................................... xvi
CHAPTERS
1. INTRODUCTION ........................................................................................... 1
1.1. Background of the Study ........................................................................... 1
1.2. Purpose of the Study ................................................................................. 3
1.3. Research Questions ................................................................................... 3
1.4. Significance of the Study ........................................................................... 4
1.5. Definition of Terms ................................................................................... 4
2. LITERATURE REVIEW ................................................................................. 6
2.1. Computer Literacy .................................................................................... 6
2.2. Assessment ............................................................................................. 12
2.2.1. Purpose of the Assessment ............................................................... 12
2.2.2. Key Concepts in Assessment ............................................................ 14
2.2.3. Types of Assessment ........................................................................ 15
2.2.3.1. Essay ......................................................................................... 16
2.2.3.2. Project ....................................................................................... 17
2.2.3.3. Types of Examination ................................................................ 17
2.2.3.4. Group Work ............................................................................... 19
2.2.3.5. Portfolio .................................................................................... 21
xi
2.2.3.6. Authentic (Performance) Assessment ......................................... 22
2.2.4. Technology and Assessment ............................................................. 24
2.3. Computer Based Assessment ................................................................... 26
2.4. Assessment Center .................................................................................. 28
2.5. Summary of Literature Review ................................................................ 30
3. METHODOLOGY ........................................................................................ 32
3.1. Research Questions ................................................................................. 32
3.2. Design of the Study ................................................................................. 33
3.3. BSTS ...................................................................................................... 34
3.4. IS100MAN ............................................................................................. 35
3.4.1. The General Appearance .................................................................. 36
3.4.1.1. The General Rules (Genel Kurallar) Page .................................. 37
3.4.1.2. The Announcements (Duyurular) Page ...................................... 37
3.4.1.3. The Help (Yardım) Page ............................................................ 37
3.4.1.4. The About (Hakkında) Page ....................................................... 38
3.4.2. Starting the Exam ............................................................................. 38
3.4.3. The Exam Page ................................................................................ 40
3.5. Exam Questions Preparation .................................................................... 41
3.5.1. Multiple-Choice Questions ............................................................... 43
3.5.2. Simulation Questions ........................................................................ 43
3.6. Online Assessment Center ....................................................................... 44
3.7. Participants ............................................................................................. 47
3.8. Instruments ............................................................................................. 48
3.8.1. User evaluation questionnaire ........................................................... 49
3.8.2. User interview questions ................................................................... 51
3.8.3. Expert interview questions ................................................................ 51
3.9. Data Collection ....................................................................................... 52
3.10. Data Analysis ........................................................................................ 53
xii
3.11. Assumption ........................................................................................... 55
3.12. Limitations ............................................................................................ 55
4. RESULTS ...................................................................................................... 57
4.1. Characteristics of the Participants ............................................................ 57
4.2. User evaluation questionnaire .................................................................. 60
4.2.1. Examinees’ Previous Computer and Online Assessment Experiences 61
4.2.2. Examinees’ Perceptions about the Online Assessment Center ........... 63
4.2.2.1. Examinees’ Perceptions about the Online Assessment Center’s
Physical Environment ............................................................................. 64
4.2.2.2. Examinees’ Perceptions about Taking Exam in the Online
Assessment Center ................................................................................. 69
4.2.3. Examinees’ Perceptions about Online Assessment Tool ................... 71
4.2.3.1. Examinees’ Perceptions about Online Assessment Tool’s User
Interface ................................................................................................. 72
4.2.3.2. Examinees’ Perceptions about Online Computer Literacy Exams
............................................................................................................... 76
4.3. In Depth Interviews with Participants ...................................................... 79
4.4. Interviews with Experts ........................................................................... 88
5. DISCUSSIONS, CONCLUSIONS, IMPLICATIONS AND
RECOMMENDATIONS ................................................................................... 92
5.1. Discussion ............................................................................................... 92
5.1.1. Perceptions about Online Assessment Center .................................... 93
5.1.1.1. Perceptions about online assessment center’s physical
environment ........................................................................................... 93
5.1.1.2. Perceptions about taking exam in online assessment center ........ 95
5.1.2. Perceptions about online assessment tool .......................................... 96
5.1.2.1. Perceptions about online assessment tool’s user interface ........... 96
5.1.2.2. Perceptions about online computer literacy exams ..................... 98
xiii
5.2. Conclusions ............................................................................................. 99
5.3. Implications for Practice ........................................................................ 101
5.4. Recommendations for Future Research ................................................. 103
REFERENCES ................................................................................................ 104
APPENDICES
A. USER EVALUATION QUESTIONNAIRE ........................................... 115
B. PARTICIPANT INTERVIEW QUESTIONS ......................................... 123
C. EXPERT INTERVIEW QUESTIONS .................................................... 125

xiv
LIST OF TABLES
TABLES
Table 3.1: Total Number of the Questions .......................................................... 42
Table 3.2: Education Levels of the Participants .................................................. 48
Table 3.3: User Evaluation Questionnaire Reliability Statistics ......................... 51
Table 3.4: Research Questions and Method of Data Collection .......................... 53
Table 3.5: Research Questions and Method of Data Collection .......................... 54
Table 4.1: Distribution of the Participants Education Levels (In accordance with
last graduated school) ................................................................................. 59
Table 4.2: Job Distribution of the Participants .................................................... 60
Table 4.3: Participants’ Previous Computer and Online Assessment Experiences
.................................................................................................................. 61
Table 4.4: Descriptive Statistics of Examinees’ Perceptions about Online
Assessment Center ..................................................................................... 64
Table 4.5: Distribution of Responses about the Online Assessment Center’s
Physical Environment in Percentages ......................................................... 65
Table 4.6: Distribution of Responses about Taking Exam in the Online
Assessment Center in Percentages .............................................................. 69
Table 4.7: Descriptive Statistics of Examinees’ Perceptions about Online
Assessment Tool ........................................................................................ 72
Table 4.8: Distribution of Responses about Online Assessment Tool in
Percentages ................................................................................................ 73
Table 4.9: Distribution of Responses about Online Computer Literacy
Assessments in Percentages........................................................................ 76

xv
Table 4.10: Frequency Distribution of the Interviewees’ Years of Computer Use
.................................................................................................................. 80
Table 4.11: Reported Computer Competency Levels of the Interviewees ........... 81

xvi
LIST OF FIGURES
FIGURES
Figure 3.1: IS100MAN’s Interface (In Turkish) ................................................. 35
Figure 3.2: The Menu ........................................................................................ 36
Figure 3.3: Exam Information Screen ................................................................. 39
Figure 3.4: The Exam Screen ............................................................................. 40
Figure 3.5: The Online Assessment Center ......................................................... 47
Figure 4.1: The Participants’ Gender Distribution .............................................. 58
Figure 4.2: The Participants’ Age Group Distribution ........................................ 58
Figure 4.4: Reported Computer Competency Levels .......................................... 82

1
CHAPTER 1
INTRODUCTION
1.1. Background of the Study
With the decreasing costs and increasing capabilities, use of computers has grown
rapidly. As computers become more widely used, the need for computer courses
highly emerged. With those in mind, the term computer literacy arose (Neil,
1977). People’s perception of computer literacy was different in those days.
People, who could write computer programs, were called computer literate,
however, with the advents of new technologies and programs, the definition has
changed.
There are numerous computer courses around the world. However, the
international standard was determined by CEPIS (Council of European
Professional Informatics Societies) (Council of European Professional Informatics
Societies, 2007). They called the standard as ECDL (European Computer Driving
License) for European Countries, ICDL (International Computer Driving License)
for others. ECDL Foundation has been continuously developing new standards
according to needs.
2
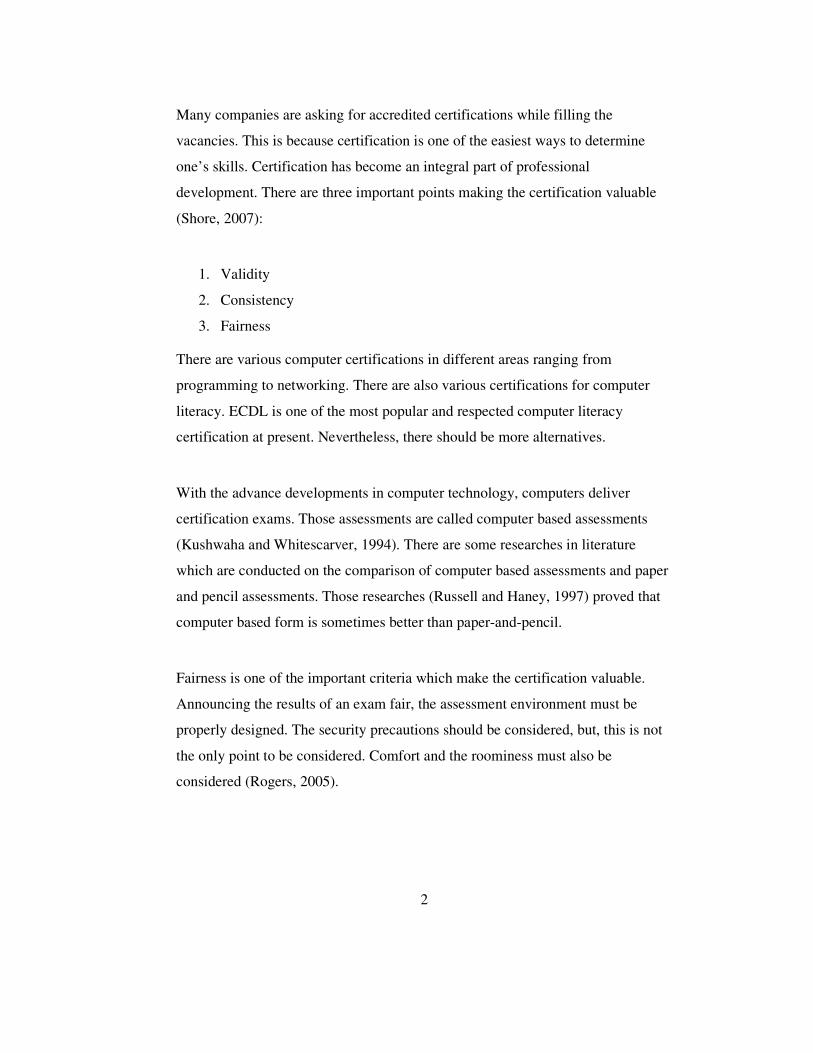
Many companies are asking for accredited certifications while filling the
vacancies. This is because certification is one of the easiest ways to determine
one’s skills. Certification has become an integral part of professional
development. There are three important points making the certification valuable
(Shore, 2007):
1. Validity
2. Consistency
3. Fairness
There are various computer certifications in different areas ranging from
programming to networking. There are also various certifications for computer
literacy. ECDL is one of the most popular and respected computer literacy
certification at present. Nevertheless, there should be more alternatives.
With the advance developments in computer technology, computers deliver
certification exams. Those assessments are called computer based assessments
(Kushwaha and Whitescarver, 1994). There are some researches in literature
which are conducted on the comparison of computer based assessments and paper
and pencil assessments. Those researches (Russell and Haney, 1997) proved that
computer based form is sometimes better than paper-and-pencil.
Fairness is one of the important criteria which make the certification valuable.
Announcing the results of an exam fair, the assessment environment must be
properly designed. The security precautions should be considered, but, this is not
the only point to be considered. Comfort and the roominess must also be
considered (Rogers, 2005).

3
1.2. Purpose of the Study
The computer literacy certification exams can be delivered via computers. When,
delivered by the computers, the results would be objective and accurate. As
mentioned above, to produce respected exam results, the assessment has to be
delivered under a secure environment where examinees cannot cheat.
The purpose of this study is to investigate examinees’ perceptions about online
assessment tool and online assessment center. The aim is to see if any correction
could be made to online assessment tool and online assessment center.
1.3. Research Questions
1. What are the participants’ perceptions about an online assessment center?
a. What are the participants’ perceptions about online assessment
center’s physical environment?
b. What are the participants’ perceptions about taking an exam at
online assessment center?
2. What are the participants’ perceptions about an online assessment tool?
a. What are the participants’ perceptions about online assessment
tool’s user interface?
b. What are the participants’ perceptions about online computer
literacy exam?
4
1.4. Significance of the Study
This research study examined the volunteer examinees’ perceptions about an
online assessment tool, online computer literacy exams, online assessment center
and taking exam at online assessment center. The results of this study will shed
the lights on designing an online assessment tool. Moreover, the results of this
study will give information when preparing online computer literacy assessment.
On the other hand, the results of the study will show alternative ways when
building up an online assessment center. The study revealed that there are still
many things to do’s. The exams assessing computer literacy can be more
authentic. The questions could address to a real world problem, and the volunteer
examinees could solve the problems on their own ways in the simulation or
directly on a computer.
1.5. Definition of Terms
Computer Literacy: In this study, computer literacy is considered as the basic
knowledge and skills necessary for use of computers and common applications for
accessing, organizing, and presenting data and communication.
Evaluation: Evaluation is the process of examining a subject and rating it based
on its important features.
Assessment: Any variety of procedures used to obtain information about
individual performance. It includes tests, assignments, observations, homework,
portfolios, etc. Assessment answers the question “How well does the individual
perform?” (Linn and Gronlund, 1995)
5
Computer Based Assessment: Any types of assessment delivered by computer.
Online Assessment: Online assessment is a method to assess student learning in
an online environment.
Online Assessment Center: A place where computers are available to deliver
computer based assessments.
Online Assessment Tool: The computer software prepared to deliver assessments
online.
Internet: Network of networks. Internet is the global network that consists of a
large collection of interconnected computers around the world.
Examinee: Someone who is tested.
Interface: A program that controls a display for the user (usually on a computer
monitor), and allows the user to interact with the system.
Software: Written programs or procedures or rules, and associated documentation
pertaining to the operation of a computer system.
Multiple-choice question: A type of question offering several alternative
answers, from which the correct one is to be chosen.
Simulation: The technique of representing the real world by a computer program.
6
CHAPTER 2
LITERATURE REVIEW
In this chapter, review of the literature related to computer literacy, assessment,
online assessment, assessment center and summary of the literature will be
presented.
2.1. Computer Literacy
We are living in information age. Computers are the driving force of the
information age. Today, computers are almost in every part of our life. Computers
are so widely used since they make the things much easier and faster. Everybody
has to know how to use computers to catch the time. Computers are in every piece
of our life. Computers are used in business, education, factories, museums, banks,
markets, automobiles, planes, ships, etc. 87.76% of the companies in Turkey use
computers (Turkish Statistical Institute, 2005). As a result of this wide use of
computers, each individual has to learn how to use computers. Otherwise, people
who refuse to learn how to use computers are going to be the digital slaves.

7
As the computers got involved in our life, the need to learn basic computer skills
became mandatory. Courses were developed to teach basic computer skills which
are called computer literacy courses. When we search the history of computers,
we see that the computer literacy courses show a great parallelism in the advance
of computer technology (Hoffman and Blake, 2003).
The very first computer literacy course appeared in 1970s. In those days,
computer literacy course topics were about the learning of hardware, software,
applications, and implications for society and individuals (Neil, 1977). In 1980s,
the PCs (personal computers) come to the stage. PCs made the computers more
widely available to the public. In late 80s, word processing, spreadsheets, business
and presentation graphics, and file management became the core computer
literacy topics (Johnson, 1987). In 90s, the internet arose, and use of internet and
ethical issues were discussed (Turk and Wiley, 1997). Since then, computers have
been used more widely.
The computer literacy definition has changed with the improvements in
computers. In 1976, Nevison said that a person who could write a computer
program should be called a computer literate. As Mason and Morrow (2006)
indicated, the term computer literacy covered two separate components:
awareness and competence.
In 1974, Austing emphasized the awareness by saying “These are the people most
often affected by the computers’ impact on society yet who do not have enough
knowledge about the computer to understand what is happening to them.” (p. 15).
In the 1980s, computer literacy definition shifted from awareness to competence
with the occurrence of software packages (Mason and Morrow, 2006).

8
Mason and Morrow (2006) had been developing two computer literacy courses.
One of them considered awareness, and the other one considered competence. The
outlines are given below:
The authors are developing a course that will focus on important
awareness topics. The course will attempt to cover past, current, and
future issues associated with the use of a computer by persons at work
and at play. The course topics include but are not limited to:
• History of computer development
• Why/how things developed as they did
• Ethics
• Security (for government, work place, and personal)
• Economic issues (such as RFID tracking, E-commerce, Spam,
Cookies)
• World Wide Web usage and electronic mail
• Legal and current issues
• Networks and communication issues
• The use of computers in many fields of study varying from medical
to visual entertainment
…
The competence course will focus on gaining and improving competence
in the following areas:
• Use of PC and server application software
• Basic knowledge of computer hardware
• Internet research tools

9
• Facilities and features associated with integrated software
applications
• Facilities and features associated with integrated hardware and
available tools
• Discussions on computer mobility and issues associated with
wearable and wireless hardware and the software that drives this
new freedom
(p. 98)
However, today with the advancements, and according to people’s needs, other
literacy types are observed such as; cyber literacy, technology literacy, IT
(Information Technology) literacy. This change is obviously seen in a study
conducted in Quinnipiac University in the USA by Hoffman at all. (2005). The
research indicated that students learn applications such as word processing, e-
mail, etc with family support.
In Turkey, computer literacy training is delivered in two ways: public and private.
There are private courses which give certificates after the completion of training.
Those private courses are under the control of Turkish Ministry of Education. The
public education is delivered through primary, elementary and higher education.
The first computer literacy course was given in Turkey in 1984 (Odabaşı, 1998).
Then, the importance of the computers was understood, and investments were
done by the Turkish Ministry of Education. Until the end of 1990, the total
number of computers in schools reached 5000 all around Turkey (Odabaşı, 1998).
Following that, a lot of investments were done on computers by the Turkish
Ministry of Education. In 2003, Ministry of Education signed a protocol the Turk

10
Telecom Company to provide internet connection to all the schools in Turkey
(MoE, 2007).
In 1998, Turkish government signed the “Basic Education Program Loan
Agreement, First Phase” with the World Bank. This agreement declared that 2834
information technology classrooms would be established in the primary schools
(MoE, 2002). That action accelerated the computer literacy education in Turkey.
Completing the first phase of the agreement, up the second phase was signed in
2002. This second agreement supported the computer literacy education starting
from the 4th grade in primary schools (Projects Coordination Unit, MoE, 2007).
Nowadays, in Turkey, computer literacy courses exits at all levels of education,
primary education, elementary education and higher education. In primary
education level, the first computer literacy course outline was released in 1998 by
Board of Education. With the changing needs, it was revised in 2006. The primary
education in Turkey lasts for 8 years. In 2006 primary education computer literacy
curriculum, computer literacy course was divided into 8 steps (General Directory
of Primary Education, MoE, 2006). The computer literacy topics covered in
primary education is listed as a summary below:
• Basic Computer Terminology
• Word Processing
• Image Editing
• Presentation
• Spreadsheets
• Databases
• Creating Web Pages
11
• Programming
• Internet and Communication
In elementary education in Turkey, it is possible to find a similar outline in
computer literacy course (Board of Education, MoE, 2005).
In higher education in Turkey, universities define their computer literacy courses’
outline. To illustrate it with, an example, there is a must computer literacy course
called IS100, Introduction to Information Technologies and Applications
(Informatics Institute, 2007).
In the world, the most common accepted standard for computer literacy is
International Computer Driving License (ICDL). In European countries, ICDL is
known as ECDL (European Computer Driving License). ICDL is the most
available computer literacy certification, available in 146 countries (ECDL
Foundation, 2007b).
In 1995, CEPIS (Council of European Professional Informatics Societies) created
a task force to examine how to raise the IT levels in industry throughout the
Europe. The work of the CEPIS Task Force was supported by a funding from the
European Commission through the ESPRIT research program. As a result, ECDL
Foundation was founded in 1997. CEPIS is in charge of the ECDL (Council of
European Professional Informatics Societies, 2007). ECDL offers a variety of
computer certifications at different levels. The most common one is ECDL/ICDL.
ECDL consists of seven major modules which are listed below (ECDL
Foundation, 2006):
• Module 1 – Concepts of Information Technology (IT)

12
• Module 2 – Using the Computer and Managing Files
• Module 3 – Word Processing
• Module 4 – Spreadsheets
• Module 5 – Database
• Module 6 – Presentation
• Module 7 – Information and Communication
2.2. Assessment
Assessment is about making a judgment, identifying the strengths and
weaknesses, the good and the bad, and the right and the wrong in some cases
(Rust, 2002). It is generally used because people need a ranking when selecting
one thing among many others. It can be said that it is a kind of classification.
2.2.1. Purpose of the Assessment
According to the aim, assessment can be grouped in two distinct areas (National
Research Council, 2001):
• To assist learning (formative assessment)
• To observe the individual achievement (summative assessment)
The first type of assessment is used to decide on the instruction strategies of day-
to-day, month-to-month steps in accordance with the students’ progress.
Formative assessment gives a great deal of information about the progress of the

13
students. According to the progress, instructor can make decisions what to do
next. One common way of formative assessment is to give a quiz but other
methods can also be applied.
The second type of assessment, summative assessment, is used to determine if the
students reached a certain level of competency. Summative assessment is usually
conducted at the end of instruction. This assessment can also be carried out to find
out the competency level of the students so that the decision about the instruction
is given. These assessments are large scale assessments. At the end of each
assessment, a letter grade is given.
However, Lambert and Lines (2001) added two more purposes to the list.
• To provide means for selecting by qualification (certification)
• To contribute to the information on which judgments are made concerning
the effectiveness or quality of individuals and institutions in the system as
a whole (evaluation)
The most important part might be the measuring. The assessment was judged
using either of the following ways (Lambert and Lines, 2001):
• Norm referenced
• Criterion referenced
When evaluating an assessment according to norm reference model, the examiner
sets the average based on the performance of the volunteer examinees. The grades
are relative and directly related with the volunteer examinees. When criterion
reference model is used, the evaluation criteria are predetermined.

14
2.2.2. Key Concepts in Assessment
The results of any assessments must be confident. As Black (1998) states,
reliability and validity are the two key concepts in assessment. An assessment is
said to be valid when the assessment assesses what it sets out to test. A valid
assessment does not necessitate knowledge or skills that are unrelated to what is
actually aimed to assess.
The second main concept in assessment is reliability. “A test will be reliable if the
result is exactly the same across all occasions, tasks, observations and settings”
Lambert and Lines (2001, p.11).
Validity and reliability are interconnected. When compared, validity wins in terms
of importance. That is there is no point in doing a test that is not valid. Black
(1998) explained the importance of interconnection between validity and
reliability:
A test giving scores which are reproducible over a wide variety of
conditions (i. e. a reliable test) would nevertheless be of no value if
the attainment that it measures is irrelevant to (say) the learning
being explored, or if that attainment is too narrow an aspect of the
whole to be of any significance (i. e. an invalid test). A set of test
items which clearly reflect the aims of a course and can be seen to
evoke the type of performance that the course aims to promote (i. e.
a valid test) is of little value if it turns out that examiners cannot
agree on how to mark the outcome, or if a different set of
apparently comparable items would produce very different scores
with the same pupils on a different occasion (i.e. an unreliable
15
test). If it turned out that there was no correlation between a test
score and the future attainment that it was designed to predict, then
it could be that either or both of the reliability and the validity of
the test were defective.
(pp. 48-49)
There are other key points in assessment. Those are (Lambert and Lines, 2001):
• Clarity of purpose
• Manageability
• Transparency
Clarity of purpose indicates that the reason why the assessment is being conducted
should be clear at the beginning. The examiner should decide whether the
assessment is formative or summative.
Manageability is another key point. The assessment should be manageable. It
should not load too much administrative work to examiners.
Transparency is informing all the stakeholders (parents, examines, governors,
etc.) about the assessment content, the criteria, and the awards.
2.2.3. Types of Assessment
There are different methods to assess students. There is no correct way. Every
other method can be an advantage for some volunteer examinees while it is a

16
disadvantage for some others. The aim here should be to assess volunteer
examinees fairly and without biases. When deciding the assessment method, the
aim of assessment should be clearly stated. On the other hand, the expected
outcome of the training or education should be taken into consideration. The
followings are some common methods for assessments.
2.2.3.1. Essay
Essays are the answers to a question in the form of a continuous prose. Essays
give opportunity to the examinee to develop and extend the argument. The
examinee has the chance of expressing himself in detail. Essay assessment also
gives opportunity to develop capacity to interpret, translate, apply, criticize and
evaluate.
In spite of the advantages mentioned above, there are also some limitations. One
of them is, it consumes too much time both for the examinee and examiner. It is
highly subjective. It is very suitable for plagiarism.
Essays could be very useful when there is enough time and consideration. Essay
assessment need to be carefully read and provide feedback to the examinee.
However, this is very time consuming.

17
2.2.3.2. Project
Project is an extended investigation on a topic. Projects can be prepared by
individuals or groups. Projects are authentic. The practices are done on real world
tasks. Another advantage of projects is that, they capture students’ interest since
the projects are generally decided both by the teacher and the student. Students
feel the responsible for the results of the project. They investigate something and
reach a result. Projects give students the feeling of achievement, doing something
by themselves.
The main disadvantage of projects is their time consuming in preparation.
Sometimes, projects might take too much time to evaluate the projects. They are
also subjective. The evaluation process of projects can be problematic. The
students sometimes cannot express themselves clearly in projects. And
sometimes, the project can be too subjective. However, it is obvious that projects
give more freedom to students. Projects let students show their creativity. The last
part of the project assessment is presenting the project. It might be one of the most
important parts of the project assessment. Everyone is wondering what is
prepared. The presenter should explain the critical points of the project so clearly
that all the audience can understand.
2.2.3.3. Types of Examination
Examination may take different forms. The most common factors are its being
done under time limitation and its being performed in an observed area ensuring
the work completed by the students. Although there are different forms of

18
assessment which is done under different conditions such as take home exams.
Rust (2002) explained the different forms of examinations as follows:
• Seen: Where the questions to be answered are given at a pre-
specified date beforehand. The intention is to reduce the need for
‘question-spotting’, to reduce the anxiety, and to increase the emphasis
on learning.
• Open-book: During the exam students have access to specified
texts and/or their notes. The intention is to reduce the emphasis on
memorizing facts, to reduce anxiety and allows more demanding
questions to be set.
• Unseen: Arguably makes the student revise the whole syllabus
because anything may appear on the paper (although in practice may do
the opposite as the student may ‘question-spot’ and gamble on certain
topics coming up).
• MCQ: Objective tests asking multiple-choice questions (MCQ)
where the student simply selects from a bank of potential answers. Easy
to mark (can be done by a machine or even administered on a computer)
and can ensure students revise the complete syllabus. However, it is
arguably difficult, if not impossible, to assess higher order skills, and
writing good questions is very difficult. If you can find an appropriate US
textbook there will probably be a bank of questions which come with it on
disk.
(p. 4)

19
Examination is done commonly to measure the recognition. But, it can also be
useful when measuring analysis, and application skills (Counselling Services –
University of Victoria, 2003).
2.2.3.4. Group Work
Bandura (1977) states that: "Learning would be exceedingly laborious, not to
mention hazardous, if people had to rely solely on the effects of their own actions
to inform them what to do. Fortunately, most human behavior is learned
observationally through modeling: from observing others one forms an idea of
how new behaviors are performed, and on later occasions this coded information
serves as a guide for action." (p. 22). Social learning theory explains human
behavior in terms of continuous reciprocal interaction between cognitive,
behavioral, an environmental influences.
Students learn better when they are a part of the action. Researchers indicate that,
despite from the subject matter, students working in small groups tend to learn
more of what is taught and retain it longer than when the same content is
presented in other instructional systems. Students who work in collaborative
groups also seem more satisfied with their classes (Chickering and Gamson,
1991).
Different names have been given to this kind of teaching, and there are some
characteristics among these: cooperative learning, collaborative learning,
collective learning, learning communities, peer teaching, peer learning, reciprocal
learning, team learning, study circles, study groups, and work groups. However all

20
in all, there are three general types of group work: informal learning groups,
formal learning groups, and study teams (Johnson, Johnson, and Smith, 1991).
Hackbert (2004) discriminated learning groups under three distinct categories
given below:
• Informal learning groups are ad hoc temporary clustering of
students within a single class session. Informal learning groups can be
initiated, for example, by asking students to turn to a neighbor and spend
two minutes discussing a question you have posed. You can also form
groups of three to five to solve a problem or pose a question. You can
organize informal groups at any time in a class of any size to check on
students' understanding of the material, to give students an opportunity to
apply what they are learning, or to provide a change of pace.
• Formal learning groups are teams established to complete a
specific task, such as perform a lab experiment, write a report, carry out
a project, or prepare a position paper. These groups may complete their
work in a single class session or over several weeks. Typically, students
work together until the task is finished, and their project is graded.
• Study teams are long-term groups (usually existing over the course
of a semester) with stable membership whose primary responsibility is to
provide members with support, encouragement, and assistance in
completing course requirements and assignments. Study teams also
inform their members about lectures and assignments when someone has
missed a session. The larger the class and the more complex the subject
matter, the more valuable study teams can be.
(pp. 39-40)
21
Group work is a beneficial type of assessment, but one point to consider is there
might be parasites in the group. The examiner has to take action about this case.
One way could be to make peer evaluation. Another could be asking detailed
questions about the group work. The second way is more difficult because the
examiner must be totally aware of the group work.
2.2.3.5. Portfolio
A portfolio is a collection of a student’s work and related materials that show a
student's activities, accomplishments, and achievements in one or more school
subjects. The collection should include confirmation of student reflection and self-
evaluation, guidelines for selecting the portfolio contents, and criteria for judging
the quality of the work. The goal is to assist students to collect portfolios which
illustrate their talents, represent their writing capabilities, and tell their stories of
school achievement (Venn, 2000).
There are various advantages of portfolio assessment. Some of them are listed
below (Venn, 2000):
• Promoting student self-evaluation, reflection, and critical thinking. • Measuring performance based on genuine samples of student work. • Providing flexibility in measuring how students accomplish their learning goals. • Enabling teachers and students to share the responsibility for setting learning goals and for evaluating progress toward meeting those goals.

22
• Giving students the opportunity to have extensive input into the learning process. • Facilitating cooperative learning activities, including peer evaluation and tutoring, cooperative learning groups, and peer conferencing. • Providing a process for structuring learning in stages. • Providing opportunities for students and teachers to discuss learning goals and the progress toward those goals in structured and unstructured conferences. • Enabling measurement of multiple dimensions of student progress by including different types of data and materials.
There exist also some disadvantages:
• Requiring extra time to plan an assessment system and conduct the assessment. • Gathering all of the necessary data and work samples can make portfolios bulky and difficult to manage. • Developing a systematic and deliberate management system is difficult, but this step is necessary in order to make portfolios more than a random collection of student work. • Scoring portfolios involves the extensive use of subjective evaluation procedures such as rating scales and professional judgment, and this limits reliability. • Scheduling individual portfolio conferences is difficulty and the length of each conference may interfere with other instructional activities. (p. 538)
2.2.3.6. Authentic (Performance) Assessment
“A form of assessment in which students are asked to perform real-world tasks
that demonstrate meaningful application of essential knowledge and skills”
(Mueller, 2006)

23
An assessment is called authentic when the performance is assessed. Wiggins
(1990) compared authentic assessment with traditional assessment to clearly
explain what authenticity meant:
• Authentic assessments require students to be an active participant.
• Authentic assessments enable the students to use various strategies while
conventional tests are usually limited to paper-and-pencil, one- answer
questions.
• Authentic assessments attend to whether the student can craft polished,
thorough and justifiable answers, performances or products. Conventional
tests typically only ask the student to select or write correct responses--
irrespective of reasons.
• Authentic assessment achieves validity and reliability by emphasizing and
standardizing the appropriate criteria for scoring such (varied) products
while traditional testing standardizes objective "items" and, hence, the
(one) right answer for each.
• Authentic tasks involve "ill-structured" problems and roles that help
students rehearse for the complex ambiguities of the "game". Traditional
tests are more like drills.
Authentic assessment might be good to assess students’ performance but it is
difficult to assess. To overcome this, rubrics are suggested to use. Rubrics are a
tool designed to simulate real life activity. It is a formative type of assessment.
Students are involved in the assessment process themselves, they also evaluate
their peers. (Pickett and Dodge, 2007)
Pickett and Dodge (2007) listed the advantages of using rubrics:

24
Rubrics,
• make assessment to be more objective and reliable
• focus the teacher to state his/her criteria in clearly
• clearly explain the examinees what is expected from them
• promote student awareness of about the criteria to use peer
assessment
• provide functional comment regarding the effectiveness of the
instruction
• provide standards against which to measure and document
progress
2.2.4. Technology and Assessment
As the computers are making our life easier, they could be used to ease the
assessments. Assessing progress and performance are essentials of education and
training. However, they are too much time consuming. There are two main tasks
in assessment process, preparing the assessment and evaluating (grading) them. If
computers could help, life would be easier for the teachers. There are various
studies in the USA (United States of America). USA Board of Testing and
Assessment conducted a workshop to determine how the technology could be
integrated to the assessment.
Gitomer and Bennett (2002) say that enhanced score reporting, automatic item
generation, and evidence-centered design applications could help integration
technology with assessment and instruction. Clearly, these design, item creation,
and reporting tools do not guarantee good assessment, but they can help to reduce
the time consumption spent on the preparation of objective assessments.

25
The recent National Research Council publication ‘Knowing What Students
Know’ (2001) asserts that “Developers of educational curricula and classroom
assessments should create tools that will enable teachers to implement high-
quality instructional and assessment practices, consistent with modern
understanding of how students learn and how such learning can be measured” (p.
306).
Fletcher (2002) says that e-learning is increasing its emphasis on learner, as
opposed to teacher, classroom, or school, productivity. Learners are expected to
be self-motivated, self-guided, and self-regulating in the Webbed world of
lifelong learning. Such activity benefits the individual seeking to achieve his or
her potential, the organizations depending for their success on human competence,
and the nations competing in the global marketplace. All these ends are likely to
be well served by tools placed in learners’ hands to help them assess progress
toward their goals. Technology seems to be the key in developing these
assessment tools and making them available anytime and anywhere to those who
need them.
Obviously, there is a tremendous amount of work that must be done before
available learning systems can adequately meet assessment needs (Russell, 2002).
On the other hand, it is clear that automated systems will make teachers’ life
easier. Moreover, the assessments will be more valid and reliable with the less
effort of examiners.
26
2.3. Computer Based Assessment
Computer based assessment covers any kind of computer use in the process of
assessing knowledge, skills and abilities of individuals (Kushwaha and
Whitescarver, 1994).
The origins of computer based testing goes back to the Alfred Binet (1905, cited
in Linacre, 2000)’s studies about intelligence tests. Linacre (2000) stated that,
Binet realized he could adapt the test to the individual by a trick - rank ordering
the questions in terms of simplicity. If the candidate succeeded, Binet proceeded
to give successively harder questions until the candidate failed repeatedly. If the
candidate failed the initial questions, then Binet would give successively easier
questions until the candidate succeeded repeatedly. From the results of these
questions, Binet could estimate the examinee’s ability level. Binet's method is
easy to implement with a computer.
Vale (1977, cited in McBride, 1997) used computers in simulation studies to
compare diverse adaptive testing policies. Lord's (1980, cited in Linacre, 2000)
Flexilevel testing procedure and its variants, such as Henning's (1987, cited in
Linacre, 2000) Step procedure and Lewis and Sheehan's (1990, cited in Linacre,
2000) Testlets, are a modification of Binet's method. These can be easily operated
by a computer.
There are many different naming for computer based assessment. Few of them
are: Computer aided assessment, computer assisted assessment, technology
based/aided/assisted assessment, computer delivered assessment, online
assessment. They have slight differences in definitions, but mostly used similarly.

27
In a broader sense, researchers in this field agree that the term computer aided
assessment includes the use of computers to deliver, score and evaluate
assignments or examinations, to keep a record of assessment and to provide
feedback (Greenberg, 1998; Lingard, 2004; McKenna and Bull, 2000).
Individuals also prefer the use of computer based assessment. In research done by
Landry and Hartman (2006), 73% of the participants preferred the use of
computer based assessment. A five year study is conducted to compare students’
performance when online assessment is used. Results showed that online testing
of students’ practical skills provides a more accurate measure of student efficacy.
(Woit and Mason, 2003).
There are various advantages of using computer based assessment. One of them is
the results are consistent and fair when grading hundreds of examinees unlike
human (Prior, 2003). On the other hand, self-assessment tools confirmed to be
effective ways to support independent learning and it ensured accountability
(Williams, Bialac and Liu, 2006). Moreover, computer based assessment reduced
the workload of teachers (Amelung, Piotrowski, Rösner, 2006).
Lawson (2002) lists some more benefits of computer based assessment:
• Availability – examinee is free to take exam whenever
he wants
• Immediate feedback – as the exam ends, students learn
their grades and feedback is given when needed.
28
• Repeated practice – provided a question bank of
similar questions has been authored, students can take tests
on the same topic repeatedly to develop their skills; and
• Anonymity – some students feel more secure giving
answers to an inanimate machine than to a human being -
there is less embarrassment in giving a foolish answer when
it is only the machine that 'knows'.
2.4. Assessment Center
Students behave differently in diverse instructional environments - sound versus
silence, bright versus soft lighting, warm versus cool temperatures, and formal
versus informal seating (Dunn and Dunn, 1992). So, the instructional environment
should be designed according to individual needs and preferences (Burke and
Burke-Samide, 2004).
Key concepts in designing a learning environment are listed below (Rogers, 2005,
Burke and Burke-Samide, 2004, Butin, 2000).
• Furniture • Lighting • Simplicity • Sound • Temperature
Each furniture should be selected considering ergonomics. The desks are the
working area, so the height should be average since it is difficult to place
29
adjustable desks. Chairs should be adjustable so that different people with
different heights can adjust the height (Butin, 2000). Research shows that
individuals cannot sit still and concentrate for more than 50 minutes in
noncushioned chairs (Bullock and Foster-Harrison, 1997).
Another concern should be about the lighting. The natural lighting is the best of
all. Fluorescent lighting is recommended (North Carolina State Board of
Education, 2003).
Simplicity is another key issue. When the environment is simple, the attention is
given to what is being done. The environment should not be very colorful. Light
colors show the environment wide. On the other hand, there should not be cables
around or too many things to investigate in instructional environments (Rogers,
2005).
Sound plays a very important role in terms of distracters. The environmental
sound should be minimized (Burke and Burke-Samide, 2004). If possible, the
assessment center should be built where there is low traffic (NCS Pearson,
2007b).
Research on the environmental element of temperature reveals that most students
prefer a warm yet comfortable instructional climate. Even a marginal preference
for a particular climate had an effect on achievement (Murrain, 1983, cited at
Burke and Burke-Samide, 2004).
If the aim of the instructional environment is to assess someone, then the
designers have to think about cheating. There are various ways to audit cheating.

30
One of the most effective ways is to disable examinees see each other, but, when
the technology is used in the assessment, alternative ways cheating appear. A
research revealed that 79% (among 77 students) said that they observed another
student cheating during the assessment (Woit and Mason, 2003). Another study
(Schemo, 2001) of 791 undergraduates found that 90% of the students would not
report cheating by others, but an observer walking around would distract the
examinee. Then, the best solution may be placing cameras.
2.5. Summary of Literature Review
Computer literacy has been on the stage since 1970’s around the world. Neil
(1977) stated that those who could write a computer program were called as
computer literate. With the technological advances, the definition has changed
(Hoffman and Blake, 2003). Today, computer literacy is defined as the degree to
which individuals are familiar with computer operating systems and applications
(Information Technologies Group Center for International Development at
Harvard University, 2007). The first computer literacy course was given in
Turkey in 1984 (Odabaşı, 1998). In 1998, Turkish Ministry of Education signed
an agreement (Basic Education Program Loan Agreement, First Phase) with The
World Bank about innovating education in Turkey. With this agreement, 2834
information technology classrooms were established (Projects Coordination Unit,
MoE, 2007).
All the training can be assessed to make judgment about the success of the
treatment (Rust, 2002). There were various ways of assessments. However,
validity and reliability of an assessment are the two main concepts to consider

31
(Black, 1998). On the other hand, it is clear that assessment has a load on the
instructors. At this point, computers come to scene. As Russell (2002) stated,
technology can make teachers’ life easier. Computer or technology based
assessment is the name given to the technology integration.
Computer based assessment can be observed in 1970s with adaptive testing (Vale,
1977, cited in McBride, 1997). Computer based assessment had many advantages
with disadvantages (Lawson, 2002). One of the main disadvantages of computer
based assessment is its being open to cheating. To prevent cheating, controlled
environments, assessment centers, can be built, but while building such places,
there are points to consider not only in educational wise but also in industrial wise
(Burke and Burke-Semide, 2004, NCS Pearson, 2007b).
32
CHAPTER 3
METHODOLOGY
In this chapter, the research questions, the design of the study, the IS100MAN
assessment tool, the exam questions preparation, the online assessment center, the
participants, the instruments, the data collection, the data analysis, the
assumptions and the limitations of the study will be presented.
3.1. Research Questions
The purpose of this study was to investigate the examinees’ perceptions about
online assessment center and an online assessment tool (IS100MAN online
assessment tool).
This study tried to answer the following main and sub research questions:
1. What are the examinees’ perceptions about an online assessment center?
a. What are the examinees’ perceptions about online assessment
center’s physical environment?

33
b. What are the examinees’ perceptions about taking an exam at
online assessment center?
2. What are the participants’ perceptions about an online assessment tool?
a. What are the participants’ perceptions about online assessment
tool’s user interface?
b. What are the examinees’ perceptions about online computer
literacy exam?
3.2. Design of the Study
This study was a descriptive study, which was conducted with both qualitative
and quantitative data collection methods at METU CEC (Middle East Technical
University Continuing Education Center). METU CEC prepared to deliver an
online assessment, BSTS (Bilişim Seviye Tespit Sınavı), to certify people’s
computer competency levels. BSTS was delivered in a purposively designed
room, online assessment center.
Volunteer examinees were invited to online assessment center to take BSTS. The
researcher delivered BSTS for 75 days. In the meantime, 117 volunteer examinees
took the BSTS. Before volunteer examinees started the BSTS, the researcher
asked 5 questions about their prior computer use and online assessment
experiences. Then, they took BSTS. After completing BSTS, user evaluation
questionnaire was delivered.
The researcher conducted in depth interviews with 7 volunteers individually and 6
focus groups. Each focus group consisted of 6 volunteers.

34
3.3. BSTS
BSTS is an online assessment that is prepared to assess computer competency
level. There is only one certification currently planned to be available at METU
CEC, basic computer skills certification. BSTS used IS100MAN course tool to
deliver exams. BSTS was developed as an alternative to existing computer
literacy certifications in Turkey.
IS100MAN was software which was created to deliver courses in English. Yet,
the computer competency certification assessment had to be in Turkish. So, the
interface of IS100MAN was translated into Turkish. Also, there was need for new
questions in Turkish. The new questions were prepared in Turkish by a group of
experts for the basic level computer competency certification.
BSTS basic level certificate covered the ECDL/ICDL 4.0 syllabus (ECDL
Foundation, 2007a). Topics covered by ECDL/ICDL 4.0 syllabus are given
below:
• Concepts of Information Technology (IT)
• Using the Computer and Managing Files
• Word Processing
• Spreadsheets
• Database
• Presentation
• Information and Communication

35
3.4. IS100MAN
IS100MAN had been used to deliver an online computer literacy course, IS100
(Introduction to Information Technologies and Applications). IS100 was a
computer literacy course aimed to make all students at METU gain basic
computer skills. The course material was delivered online by the IS100MAN
(Informatics Institute, 2007). IS100MAN was capable of both presenting the
lecture notes and delivering the assessments. BSTS had used just the assessment
capabilities of IS100MAN (Figure 3.1).
Figure 3.1: IS100MAN’s Interface (In Turkish)
36
3.4.1. The General Appearance
When the IS100MAN was started, a username and a password were asked to
authenticate. Authentication was required to keep track of the examinee. After
entering the username and password, the examinee faced the screen shown on
Figure 3.1. There was a toolbar on the top of the exam interface. This toolbar
contained the navigation button, back and forward, and the buttons for the general
rules, help, about and announcements.
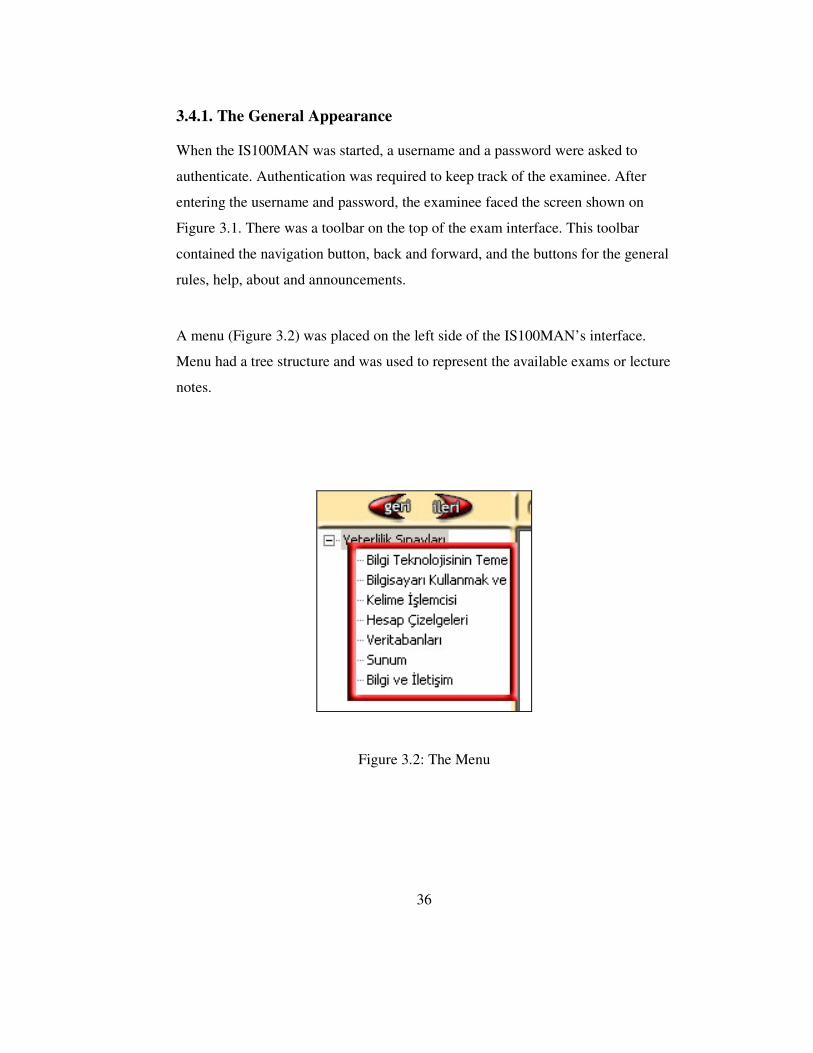
A menu (Figure 3.2) was placed on the left side of the IS100MAN’s interface.
Menu had a tree structure and was used to represent the available exams or lecture
notes.
Figure 3.2: The Menu

37
3.4.1.1. The General Rules (Genel Kurallar) Page
General rules page was the first page displayed when logged on. This page
included a notification about the buttons on the top, an informational explanation
about the grading policy, and lastly, the procedure to start an exam.
3.4.1.2. The Announcements (Duyurular) Page
The announcements page was to announce everything about the BSTS. It might
be an update or a new policy about the exam.
3.4.1.3. The Help (Yardım) Page
The help page was prepared to give information about the use assessment tool and
the questions. This page consisted of six parts:
1. How to start an exam
2. Assessment tool interface
3. Multiple-choice questions
4. Simulation questions
5. The active buttons during the exam
6. The results page
The help page included valuable information about exams, tool’s interface, and
exam questions. This page should be read by the examinee before starting the
exam.

38
3.4.1.4. The About (Hakkında) Page
The about page contained information about the owner of the assessment tool.
The contact information could also be found here.
3.4.2. Starting the Exam
The examinee used the left menu (Figure 3.2) to navigate among the available
exams. To start an exam, the examinee chose one of the available exams (i.e.
Kelime İşlemciler). Then, a log on pop-up is displayed. This second
authentication enabled the exam administrator control if the examinee was about
to take the intended exam. After the exam administrator confirmed that the
examinee was about to take the correct exam, the exam administrator entered the
administrator’s username and password. Right after entering the administrator’s
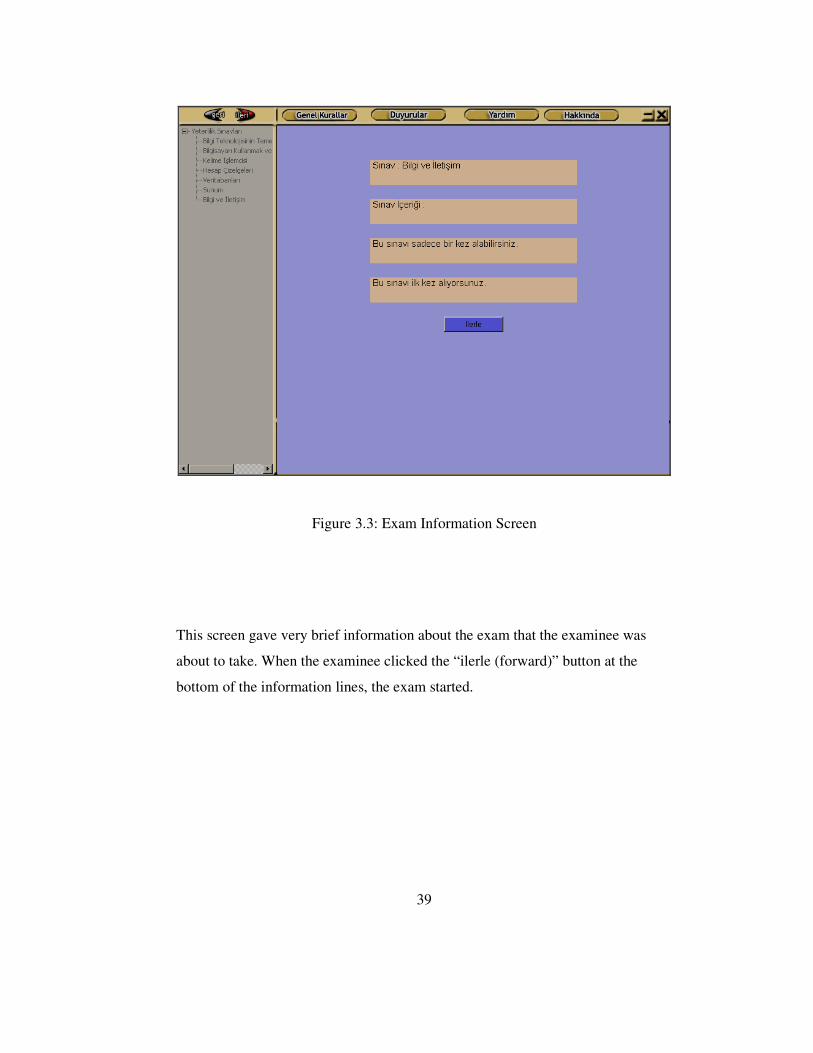
username and password, the exam information screen (Figure 3.3) was displayed.
39
Figure 3.3: Exam Information Screen
This screen gave very brief information about the exam that the examinee was
about to take. When the examinee clicked the “ilerle (forward)” button at the
bottom of the information lines, the exam started.

40
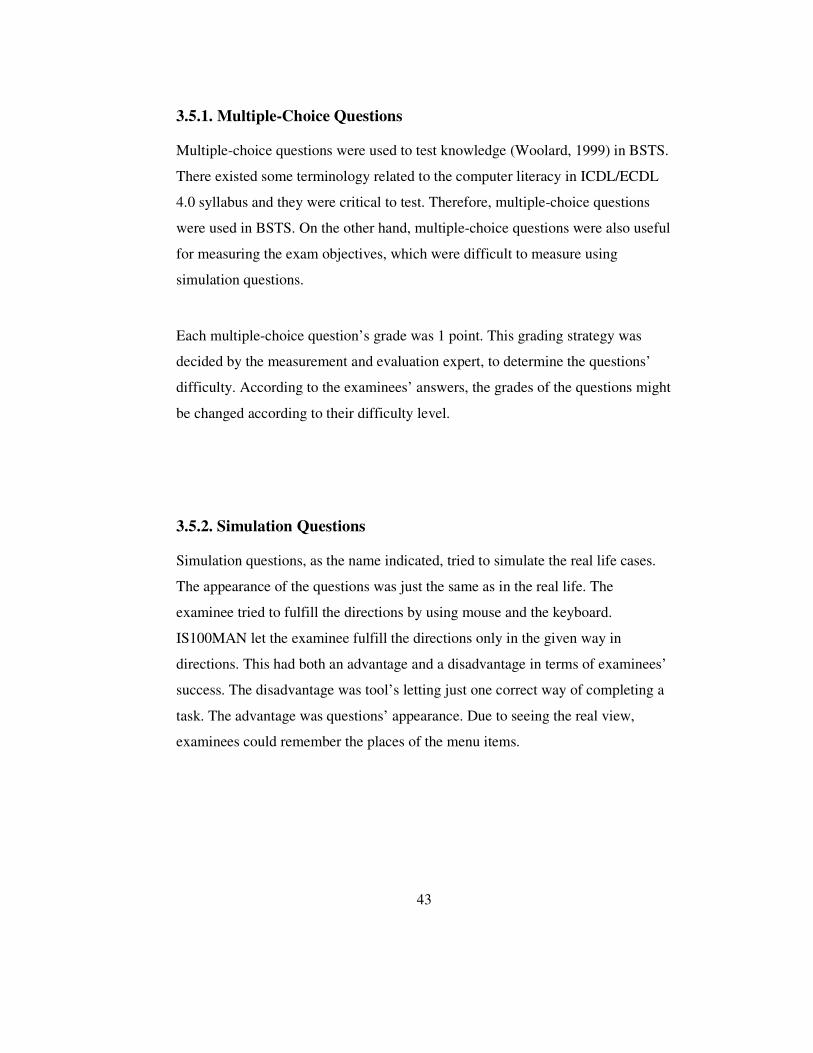
3.4.3. The Exam Page
The exam page was designed as simple as possible. The buttons on the top of the
interface were disabled during the exam. Disabling those buttons had both an
advantage and a disadvantage. The advantage was, seeing fewer available buttons
prevented the examinee from being frustrated. The disadvantage was disabling the
examinee to reach those functions (i.e. see help) when s/he wanted to view. As
seen on Figure 3.4, the exam screen was very simple.
Figure 3.4: The Exam Screen

41
The simulation questions were demonstrated on the right side of the screen, under
the top bar and next to the menu. Just below this area, simulation questions’
directions were presented. This area was pretty much smaller than the area where
simulation questions are displayed. In this area, the directions that the examinees
were going to follow were presented. The top bar buttons, except next (ileri),
minimize and close buttons, were disabled during the exam.
3.5. Exam Questions Preparation
The questions used in this study were prepared in accordance with the
ICDL/ECDL 4.0 syllabus (ECDL Foundation, 2007a). The reason for using this
syllabus was its being widely accepted basic computer certification. ICDL/ECDL
had been accepted by 50 computer societies and 250,000 professionals around the
globe as the computer literacy standard (ECDL Foundation, 2007b).
A group of experts prepared the questions. This group consisted of 9 people. 4 of
them were master students (one of them is the researcher) at the department of
Computer Education and Instructional Technology, 1 of them was a doctoral
student at the same department, two of the group members were master students at
the Informatics Institute and IS100 course assistants at the same time. And the last
member had a degree in foreign language education and helped translation of the
questions into Turkish.
Questions in the IS100 course question pool were examined by the expert group.
The questions that matched the ICDL/ECDL syllabus’s objectives were selected.
A measurement and evaluation expert (Prof. Dr. Ata Tezbaşaran) did item

42
analysis on the selected existing questions to discriminate the nonworking
questions. The question preparation group prepared several sample questions and
they were examined by the measurement and evaluation expert. According to his
suggestions, questions’ directions were rewritten. The entire existing questions
which had been selected for use in BSTS were renewed for MS Windows XP and
MS Office 2003 since they had been prepared for the MS Windows 98 operating
system and MS Office 2000.
The IS100MAN supported types of questions: Multiple-choice questions and
simulation questions. At the end of question preparation phase, total number of
questions reached 539 (Table 3.1). New questions were prepared because the
selected existing question did not cover the whole ECDL/ICDL 4.0 syllabus.
Table 3.1: Total Number of the Questions
Questions Simulation Multiple-choice
Existing 207 125
New 169 31
Total 373 156
Grand Total 539
43
3.5.1. Multiple-Choice Questions
Multiple-choice questions were used to test knowledge (Woolard, 1999) in BSTS.
There existed some terminology related to the computer literacy in ICDL/ECDL
4.0 syllabus and they were critical to test. Therefore, multiple-choice questions
were used in BSTS. On the other hand, multiple-choice questions were also useful
for measuring the exam objectives, which were difficult to measure using
simulation questions.
Each multiple-choice question’s grade was 1 point. This grading strategy was
decided by the measurement and evaluation expert, to determine the questions’
difficulty. According to the examinees’ answers, the grades of the questions might
be changed according to their difficulty level.
3.5.2. Simulation Questions
Simulation questions, as the name indicated, tried to simulate the real life cases.
The appearance of the questions was just the same as in the real life. The
examinee tried to fulfill the directions by using mouse and the keyboard.
IS100MAN let the examinee fulfill the directions only in the given way in
directions. This had both an advantage and a disadvantage in terms of examinees’
success. The disadvantage was tool’s letting just one correct way of completing a
task. The advantage was questions’ appearance. Due to seeing the real view,
examinees could remember the places of the menu items.

44
Grading strategy of simulation questions had been similar to the multiple-choice
questions. Each step was graded for 1 point. After collecting enough data to run
statistics, the grading strategy might change.
3.6. Online Assessment Center
Online assessment center (Figure 3.5) was essential for making the BSTS results
reliable and secure. 11 examinees could take an assessment simultaneously in the
center. While designing the exam center, Pearson Vue (NCS Pearson, Inc.) and
Thomson Prometric (Thomson Corporation) standards had been taken into
consideration. Pearson Vue has been one of the respected worldwide electronic
testing company which was founded to provide clients with an alternative test
delivery solution that incorporated state of the art technology and unparalleled
service (NCS Pearson, 2007a). Thomson Prometric has been another electronic
testing company especially working with ETS (Educational Testing Services) to
deliver online tests (Thomson Prometric, 2007a). The standards listed by Pearson
Vue and Thomson Prometric are for the exam room listed below:
• Provide an enclosed, professional environment that is clean, comfortable,
smoke-free and conducive for testing.
• Provide adequate lighting, ventilation and comfortable seating and work
surfaces. Place testing workstations on a clean surface that is
approximately four feet (1.2 meters) wide, with no obstructions overhead
or underneath.
45
• Monitor positions should be adjustable in order to allow each candidate to
establish a comfortable testing position.
• Room lighting should provide sufficient light for keyboard and erasable
noteboard while avoiding screen glare.
• Separate candidates within the testing room. Separate testing stations using
walls or privacy partitions, or at least four feet (1.2 meters) of empty space
on all sides.
• Provide a clear glass viewing window or wall, video surveillance system
or seating for a test administrator within the testing room. Whichever
surveillance method is used, it must allow an unobstructed view of each
candidate within the testing room.
• Provide a quiet testing environment.
• Location of testing area: Place the exam delivery workstations in a
dedicated room that can be closed off from the rest of the office space. It
should be in a low traffic area away from any training rooms in use, to
avoid the sounds of students talking and moving to and from the
classroom. Also avoid placing the testing room near an area where people
gather, such as a student cafeteria or busy corridor.
• Insulation: Insulate the testing room to minimize noise. In addition to
insulated walls, an insulated ceiling will help minimize noise. Using
fabriccovered partitions between workstations will create privacy and will
also absorb sound.
To meet the standards listed above, the METU CEC did the following:
46
• Lighting: fluorescent bulbs were used with the white lighting. The bulbs
were placed behind the examinee so that the light comes from backwards.
• Ventilation: An air conditioner was mounted on the wall.
• Seating: Chairs were without wheels and nonadjustable.
• Work surfaces: Each work surface was at least 113 cm. The surface was
smooth and the color was mat and light (maple was used for the furniture).
• Monitor: LCD monitors were selected so that the examinee can see the
screen better and his/her eyes did not get tired. The monitor screen was
also adjustable.
• Separating candidates: Wooden walls were placed between the work
surfaces so that the examinees neither could see each other’s monitor nor
each other.
• Test administrator’s place: Test administrator could see the examinees
behind a window. At the same time, two ip cameras are mounted on the
walls of the exam room so that the administrator can view the examinees
from the ip cameras. The ip cameras also had the capability to bring the
sound. And additionally, the cameras would be recording during the
exams.
• Quiet testing environment: The testing center was located at Continuing
Education Center at METU. It is located in a silent place away from the
city center. Also, the testing room was placed away from the offices in the
building.

47
Figure 3.5: The Online Assessment Center
3.7. Participants
The intended audience was all the adults who wanted to get a basic computer
competency certificate (BSTS). The majority of the participants were from the
university (mainly from METU) students (Table 3.2). The sampling method used
in this study was convenient sampling. The reason for using convenient sampling
was the difficulty of encouraging people to come to the online assessment center.
One of the main limitations was finding volunteer examinees. As Yıldırım and
Şimşek (2005) indicated, this sampling method had been used when the researcher
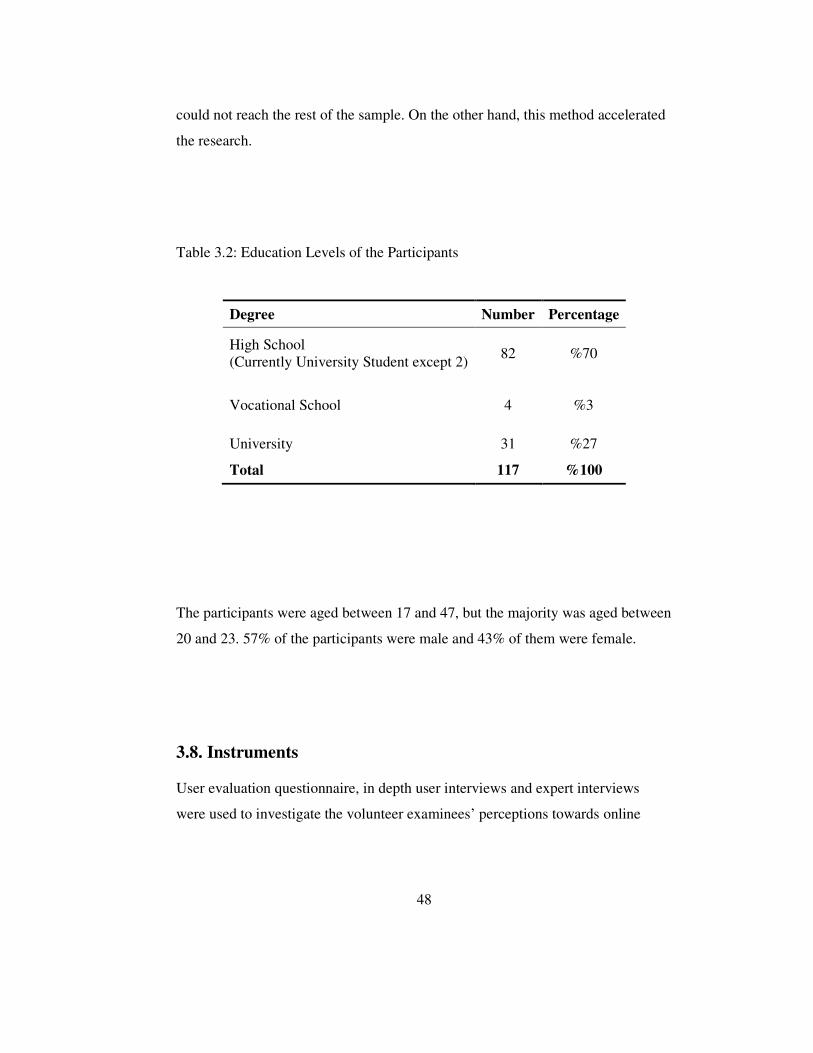
48
could not reach the rest of the sample. On the other hand, this method accelerated
the research.
Table 3.2: Education Levels of the Participants
Degree Number Percentage
High School (Currently University Student except 2)
82 %70
Vocational School 4 %3
University 31 %27
Total 117 %100
The participants were aged between 17 and 47, but the majority was aged between
20 and 23. 57% of the participants were male and 43% of them were female.
3.8. Instruments
User evaluation questionnaire, in depth user interviews and expert interviews
were used to investigate the volunteer examinees’ perceptions towards online
49
exam and online assessment center. Each tool used in this study is described
briefly as follows:
3.8.1. User evaluation questionnaire
A questionnaire was developed by the researcher for the study. While developing
the questionnaire, first, the researcher examined the questionnaire, which was
developed by Şanlı (2003) for his master’s thesis. Şanlı’s questionnaire did not
meet the purpose of this study, nevertheless some items were useful. Useful items
were selected into the item pool of the user evaluation questionnaire.
After the item pool was formed, peer evaluation was done by three doctoral
students from the department of Computer Education and Instructional
Technology of METU. According to their suggestions, the improvements and
corrections were done. The raw user evaluation questionnaire was delivered to
five volunteer examinees to see if there was any item, which was not clear or
difficult to understand. Following that, the researcher realized that some of the
items were not clear due to the use of some technical terms (i.e. interface, user
interface). Those terms were placed with clearer ones.
Next, two test construction experts and six subject area experts examined the
questionnaire to assure its accuracy, clarity and validity. According to the
feedbacks, some questions were deleted and some positive items converted into
negative while some remained.

50
The final user evaluation questionnaire consisted of two parts and five sub-scales
(Appendix A):
1. Part 1: Demographics, prior experiences and online assessment tool
a. Sub-scale A: Previous experiences on online assessment and
online courses. Contained 5 items. Type: Checklist
b. Sub-scale B: Online assessment tool evaluation. 8 items. Type:
Rating Scale
c. Sub-scale C: Online assessment questions evaluation. Contained 9
items. Type: Rating Scale
2. Part 2: Online assessment center evaluation
a. Sub-scale A: Evaluation of physical placement of the online
assessment center. Contained 12 items. Type: Rating Scale
b. Sub-scale B: Perceptions about taking exam in a special
environment, online assessment center. Contained 4 items. Type:
Rating Scale
A free place was reserved for the volunteer examinees to express their additional
ideas. Likert’s type five-point scaling method – Strongly agree, Agree, Neutral,
Disagree, Strongly disagree – was used in rating scales. The reliability coefficient
(Cronbach’s Alpha) for the part 1 sub-scales B and C, and part 2 sub-scales A and
B were calculated (Table 3.3). As Garson (2007) indicates, an alpha value of 0.70
is widely accepted in social sciences.
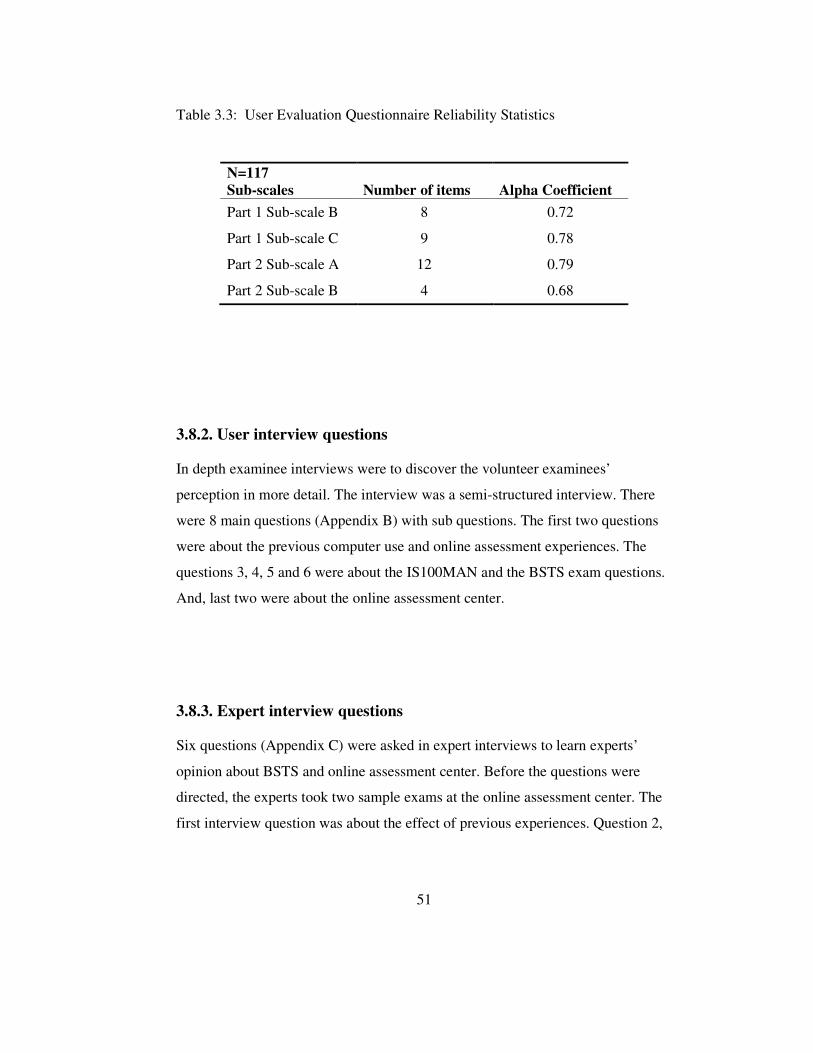
51
Table 3.3: User Evaluation Questionnaire Reliability Statistics
N=117 Sub-scales Number of items Alpha Coefficient
Part 1 Sub-scale B 8 0.72
Part 1 Sub-scale C 9 0.78
Part 2 Sub-scale A 12 0.79
Part 2 Sub-scale B 4 0.68
3.8.2. User interview questions
In depth examinee interviews were to discover the volunteer examinees’
perception in more detail. The interview was a semi-structured interview. There
were 8 main questions (Appendix B) with sub questions. The first two questions
were about the previous computer use and online assessment experiences. The
questions 3, 4, 5 and 6 were about the IS100MAN and the BSTS exam questions.
And, last two were about the online assessment center.
3.8.3. Expert interview questions
Six questions (Appendix C) were asked in expert interviews to learn experts’
opinion about BSTS and online assessment center. Before the questions were
directed, the experts took two sample exams at the online assessment center. The
first interview question was about the effect of previous experiences. Question 2,

52
3 and 4 were about the IS100MAN and the BSTS exam questions. The last two
questions were about the online assessment center.
3.9. Data Collection
The volunteer examinees were invited to the online assessment center. The pilot
exam took about 30-45 minutes. Before starting, the participants signed an
agreement undertaking voluntarily participating in the study. Next, the researcher
asked 5 questions which were in the part 1 sub-scale A of the user evaluation
questionnaire. This checklist was filled by the researcher. Then, the researcher
informed the volunteer examinee that the cameras would be recording during the
exam. After completing the exam, the user evaluation questionnaire was delivered
to the volunteer examinee to fill.
Volunteer examinees’ ideas, which were not revealed in the user evaluation
questionnaire, were investigated throughout in depth interviews. Interview
questions are given in Appendix B. The interviews were conducted after
completing the questionnaire with 43 volunteer examinees out of 117. 7 of
volunteer examinees were interviewed individually while the others (36 volunteer
examinees) were interviewed in 6 focus groups. Each focus group consisted of 6
members.
Lastly, the researcher interviewed with 7 experts to learn their perception of
online assessment tool and online assessment center. Expert interview questions
are given in Appendix C. Table 3.4 illustrates each research question and the
corresponding methodology used to get the relevant response.

53
Table 3.4: Research Questions and Method of Data Collection
RESEARCH QUESTIONS DATA COLLECTION
Q.1. What are the examinees’ perceptions about an online assessment center?
User Evaluation Questionnaire In Depth Interviews with Participants Interviews with Experts
Q.2. What are the participants’ perceptions about an online assessment tool?
User Evaluation Questionnaire In Depth Interviews with Participants Interviews with Experts
3.10. Data Analysis
The descriptive statistics of the data was used. For the questionnaire, the mean
scores were calculated for overall and sub-scales.
The responds of the examinees were coded before entering into the SPSS.
According to the coding, 5 is used for strongly agree, 4 stood for agree, 3 for
neutral, 2 for disagree and 1 for strongly disagree. While coding the checklist, the
answers of participants saying ‘Yes’ were represented with 1 and ‘No’s were
represented with 0.

54
When interpreting the results, perception was stated as negative if the mean score
of an item or a sub-scale was below 2.59, as neutral if between 2.60 and 3.39, and
as positive if above 3.40 out of 5.
Miles and Huberman (1984, cited in Lancy, 1993) suggested that when a theme or
pattern identified in a qualitative data, there was an important point to consider.
Therefore, the individual and focus-group interviews were listened carefully and
answers were grouped together. The classified data were presented. The following
table gives a summary of data types and analysis methods used.
Table 3.5: Research Questions and Method of Data Collection
Method of Analysis
Stages Description of the Process Used
Quantitative
Coding Data were coded into SPSS.
Descriptive Statistics
Descriptive analysis of mean, frequency, percentage, and standard deviation for each item were calculated using SPSS.
Display Charts and tables were created.
Conclusion Drawing
Interpretations were made on the tables and charts developed and then conclusions were drawn.
Qualitative Coding
Data from the interviews and questionnaires were coded into categories in terms of relevance to the research questions.

55
3.11. Assumption
For this study, following assumption was made:
• The participants responded the questions honestly.
• The data were recorded and analyzed accurately.
3.12. Limitations
The following limitations resided in this study:
• The results and conclusions are limited to the case investigated.
• The study was conducted with volunteer participants.
Table 3.4: (Cont’d) Research Questions and Method of Data Collection
Ordering and Displaying
Patterns and themes were determined, and data were organized into display.
Conclusion Drawing
Decisions about the meaning of the data were made.

56
• Majority of the participants were computer literate.
• Most of the participants had taken IS100 course before, so they were
familiar with the tool interface.
• Validity is limited to the honesty of the subjects’ responses to the
instruments used in this study.

57
CHAPTER 4
RESULTS
In this chapter, detailed statistical results of the participant characteristics, the user
evaluation questionnaire, the interviews with the participants and the experts will
be presented. The frequency distributions and descriptive statistics were
performed by using SPSS 13.
4.1. Characteristics of the Participants
In this part, detailed information about the participants (i.e. gender, age, education
level and job) will be given. These demographics were collected through the user
evaluation questionnaire. In Figure 4.1 the gender distribution of the participants
is presented. Out of 117 participants, 43% were female and 57% were male.
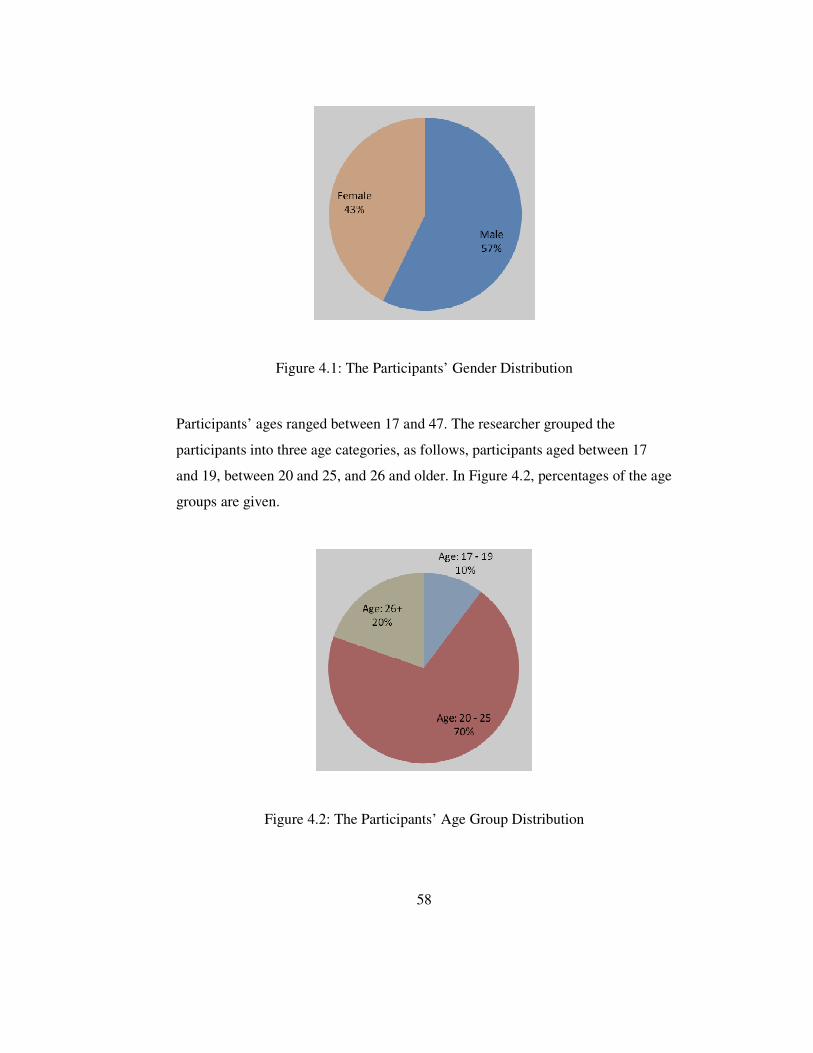
58
Figure 4.1: The Participants’ Gender Distribution
Participants’ ages ranged between 17 and 47. The researcher grouped the
participants into three age categories, as follows, participants aged between 17
and 19, between 20 and 25, and 26 and older. In Figure 4.2, percentages of the age
groups are given.
Figure 4.2: The Participants’ Age Group Distribution

59
The next characteristic of the participants’ is education level. Education levels of
the participants were grouped into 3 categories. Those are:
1. High School Graduate
2. Vocational School Graduate
3. University Graduate
It was mentioned before that most of the participants were the university students
(Table 4.1). Only 2 out of 82 high school graduates were not university students.
There were no primary school or secondary school graduates among the
participants.
Table 4.1: Distribution of the Participants Education Levels (In accordance with
last graduated school)
Last Graduated School Frequency Percentage
High School Graduate 82 70.1
Vocational School Graduate 4 3.4
University Graduate 31 26.5
Total 117 100.0

60
And lastly, the jobs of the participants are given in Table 4.2. As mentioned
above, most of the participants were undergraduate students.
Table 4.2: Job Distribution of the Participants
Jobs Frequency Percentage
Army Officer 8 6.84
Biologist 1 0.85
Businessman 2 1.71
Computer Technical Support Personnel 1 0.85
Engineer 7 5.98
Expert 1 0.85
Graduate Student 5 4.27
Retired 1 0.85
Sales Representative 2 1.71
Secretary 1 0.85
Tourism Related 1 085
Undergraduate Student 82 70.09
Unemployed 5 4.27
Total 117 100.00
4.2. User evaluation questionnaire
This questionnaire was the main data source to find out volunteer examinees
perceptions about the online assessment center and taking exam in the online

61
assessment center. In the light of the results the research questions will be
answered. The questionnaire consists of two main parts. First Part of the user
evaluation questionnaire consisted of three sub-scales and the second part
consisted of two sub-scales. The detailed statistical analysis of those four sub-
scales is given below.
4.2.1. Examinees’ Previous Computer and Online Assessment
Experiences
This part of the questionnaire was filled by the researcher. 5 questions were asked
to the participants about their previous online assessment and computer usage
experiences (Table 4.3).
Table 4.3: Participants’ Previous Computer and Online Assessment Experiences
Questions Frequency Percentage
Yes No Yes No
Q.1 Have you ever taken any online course?
103 14 88.0 12.0
Q.2 Have you ever taken any online assessment (i.e. TOEFL, GRE, IS100, MCSA, CISCO etc.)?
109 8 93.2 6.8
Q.3 Have you ever taken any course related to computers or required to use computers?
111 6 94.9 5.1

62
Table 4.3: (Cont’d) Participants’ Previous Computer and Online Assessment
Experiences
Q.4 Have you ever taken any computer based assessment without connecting the internet?
39 78 33.3 66.7
Q.5 Do you have a personal computer?
102 15 87.2 12.8
The first question which was asked to the volunteer examinees was “whether they
had ever taken any online courses before”. 88% of the volunteer examinees
responded that they had an online course before while 14% of the participants did
not have any online experience.
In the 2nd question, the volunteer examinees were asked whether they had ever
taken any online assessment (i.e. TOEFL, GRE, IS100, MCSA, CISCO etc.)
before. 93% of the participants had taken an online assessment before. Most of
them attended to the IS100 course, while a few of them has taken TOEFL, GRE
or others.
The 3rd question asked to the volunteer examinees was whether they had ever
taken any course which is related to computer programming or a course which
required using computers. 94% of the volunteer examinees responded that they
had taken such a courses before.

63
The 4th question was asked to the volunteer examinees if they had ever taken any
computer based assessment without connecting the internet. 33% of the
participants stated that they had taken a computer based assessment without the
internet connection while 66% of them had no such experience.
The last question was about the personal computer ownership. 87% of the
participants said that they owned a personal computer.
4.2.2. Examinees’ Perceptions about the Online Assessment Center
The second part of the user evaluation questionnaire was used to gather
quantitative data about their perceptions of the online assessment center.
Main Research Question 1: What are examinees’ perceptions about an online
assessment center?
As can be seen from the Table 4.4, the examinees perceived the online assessment
center’s physical environment fine and suitable (Mean= 4.34). Examinees also
perceived taking exam in online assessment center

64
Table 4.4: Descriptive Statistics of Examinees’ Perceptions about Online
Assessment Center
N = 117
Sub-scales Number of
Items Mean St. Dev. Reliability Coefficient
Perceptions About the Online Assessment Center’s Physical Environment
12 4.34 0.91 0.79
Perceptions About Taking Exam in the Online Assessment Center
4 3.88 1.10 0.68
4.2.2.1. Examinees’ Perceptions about the Online Assessment Center’s
Physical Environment
The questions in this sub-scale were aimed to investigate the participants’
perceptions about the online assessment center’s physical environment. 12 items
existed in this sub-scale (Table 4.5). The mean score for this sub-scale was found
as 4.34. It can be stated that the volunteer examinees have perceived online
assessment center fine and appropriate.
Sub-Research Question 1.a: What are participants’ perceptions about online
assessment center’s physical environment?

65
Table 4.5: Distribution of Responses about the Online Assessment Center’s
Physical Environment in Percentages
Items
SA % (N)
A % (N)
N % (N)
D % (N)
SD % (N) Mn.
St. Dev.
Q.1 The lighting was appropriate for taking exam.
65.0 (76)
33.3 (39)
1.7 (2)
0.0 (0)
0.0 (0)
4.63 0.52
Q.2 The work surface allocated for the exam (the desk’s surface area between two walls) was appropriate.
65.8 (77)
33.3 (39)
0.0 (0)
0.0 (0)
0.9 (1)
4.63 0.58
Q.3 Air-conditioning was appropriate.
40.2 (47)
48.7 (57)
6.8 (8)
2.6 (3)
1.7 (2)
4.23 0.82
Q.4 The assessment center was silent.
55.6 (65)
37.6 (44)
3.4 (4)
3.4 (4)
0.0 (0)
4.45 0.73
Q.5 The wooden walls between the working surfaces were appropriate for preventing cheating.
43.6 (51)
28.2 (33)
0.9 (1)
12.8 (15)
12.8 (15)
3.71 1.52
Q.6 Settlement was appropriate.
44.4 (52)
46.2 (54)
4.3 (5)
2.6 (3)
2.6 (3)
4.27 0.87
Q.7 The height of the desk was appropriate.
47.9 (56)
48.7 (57)
1.7 (2)
0.9 (1)
0.0 (0)
4.41 0.71
Q.8 The screen of the monitor could be seen easily.
59.0 (69)
40.2 (47)
0.0 (0)
0.0 (0)
0.0 (0)
4.56 0.65
Q.9 The keyboard was appropriate.
48.7 (57)
40.2 (47)
5.1 (6)
3.4 (4)
2.6 (3)
4.29 0.91
Q.10 The mouse was appropriate.
49.6 (58)
42.7 (50)
2.6 (3)
2.6 (3)
2.6 (3)
4.34 0.86
Q.11 The colors used in the assessment center were appropriate.
44.4 (52)
44.4 (52)
7.7 (9)
1.7 (2)
0.9 (1)
4.27 0.86

66
Table 4.5: (Cont’d) Distribution of Responses about the Online Assessment Center’s
Physical Environment in Percentages
Q.12 The wooden walls between the work surfaces were appropriate to disable seeing the neighbors’ screen.
51.3 (60)
38.5 (45)
0.9 (1)
4.3 (5)
4.3 (5)
4.26 1.08
In the 1st item, the volunteer examinees were asked whether the lighting was
appropriate. 98.3% of the volunteer examinees strongly agreed or agreed with the
statement with a mean score of 4.63. It can be concluded that the lighting in the
online assessment center was good enough and appropriate.
The 2nd item was about the work surface allocated for the participant for use
during the exam. Almost all of the volunteer examinees were strongly agreed
(65.8%) or agreed (33.3%) with the statement. The mean score was found to be
4.63. It can be stated that the area allocated for the examinee during the exam was
appropriate.
3rd item asked whether the air conditioning was appropriate. 88.9% of the
volunteer examinees strongly agreed or agreed with the statement. The mean
score was 4.23. It can be said that the air conditioning was appropriate.
The 4th item asked the volunteer examinees whether the online assessment center
was a silent place. 93.2% of the participants strongly agreed or agreed with this
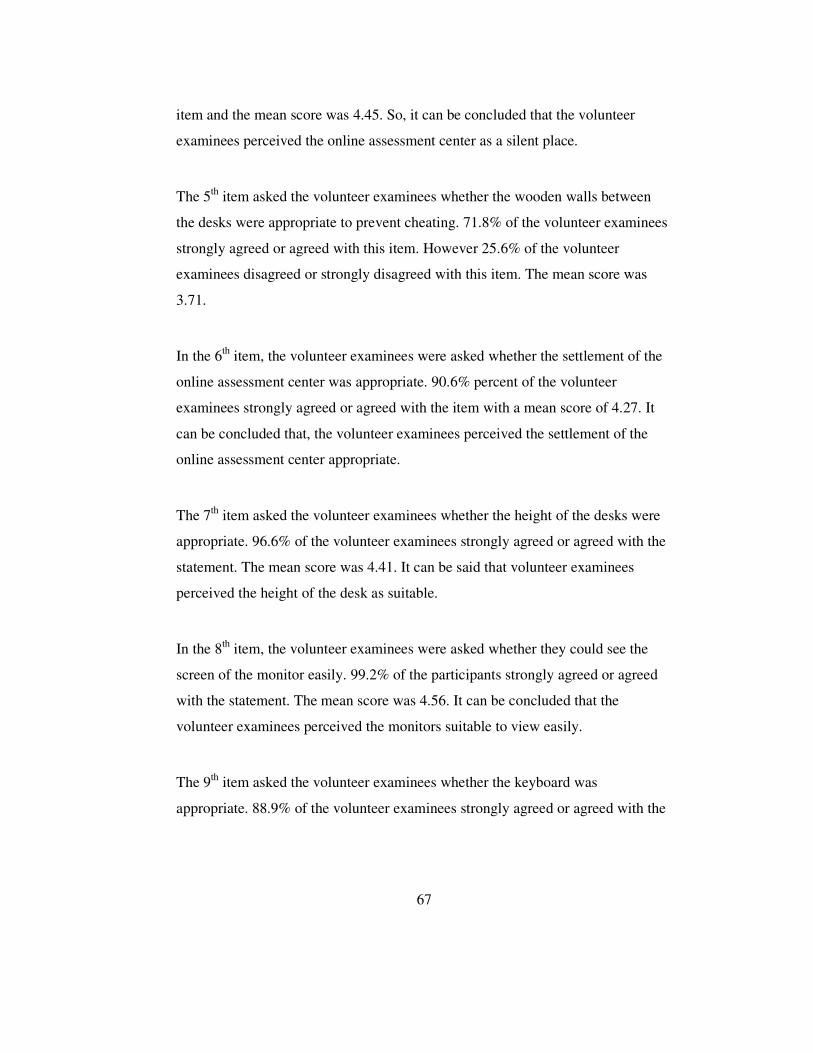
67
item and the mean score was 4.45. So, it can be concluded that the volunteer
examinees perceived the online assessment center as a silent place.
The 5th item asked the volunteer examinees whether the wooden walls between
the desks were appropriate to prevent cheating. 71.8% of the volunteer examinees
strongly agreed or agreed with this item. However 25.6% of the volunteer
examinees disagreed or strongly disagreed with this item. The mean score was
3.71.
In the 6th item, the volunteer examinees were asked whether the settlement of the
online assessment center was appropriate. 90.6% percent of the volunteer
examinees strongly agreed or agreed with the item with a mean score of 4.27. It
can be concluded that, the volunteer examinees perceived the settlement of the
online assessment center appropriate.
The 7th item asked the volunteer examinees whether the height of the desks were
appropriate. 96.6% of the volunteer examinees strongly agreed or agreed with the
statement. The mean score was 4.41. It can be said that volunteer examinees
perceived the height of the desk as suitable.
In the 8th item, the volunteer examinees were asked whether they could see the
screen of the monitor easily. 99.2% of the participants strongly agreed or agreed
with the statement. The mean score was 4.56. It can be concluded that the
volunteer examinees perceived the monitors suitable to view easily.
The 9th item asked the volunteer examinees whether the keyboard was
appropriate. 88.9% of the volunteer examinees strongly agreed or agreed with the

68
statement. Only 6% of the volunteer examinees found the keyboard unsuitable.
The mean score was found to be 4.29.
In the 10th item, the volunteer examinees were asked whether the mouse was
appropriate. 92.3% of the volunteer examinees strongly agreed or agreed with the
statement. 2.6% of the volunteer examinees were neutral and 5.2% of the
volunteer examinees disagreed or strongly disagreed with the item. The mean
score was 4.34.
The 11th item asked whether the colors used in the online assessment center were
appropriate. 88.8% of the volunteer examinees strongly agreed or agreed with the
statement. 7.7% of the volunteer examinees were neutral and 2.6% of the
volunteer examinees disagreed or strongly disagreed with the statement. The
mean score was found to be 4.27.
The last item of this sub-scale of the use evaluation questionnaire asked whether
the wooden walls between the work surfaces were appropriate to disable the
examinees to see the neighbors’ screen. 89.8% of the volunteer examinees
strongly agreed or agreed with the item. The mean score for this item is 4.26. It
can be said that the volunteer examinees found the wooden walls good enough to
disable to see neighbors’ screen.

69
4.2.2.2. Examinees’ Perceptions about Taking Exam in the Online
Assessment Center
The questions in this sub-scale were about the perceptions of volunteer examinees
about taking exam in the online assessment center. There existed 4 items (Table
4.6) and the mean score for this sub-scale was 3.88. It can be stated that the
volunteer examinees have felt okay about taking exam in the online assessment
center.
Sub-Research Question 1.b: What are participants’ perceptions about taking an
exam in online assessment center?
Table 4.6: Distribution of Responses about Taking Exam in the Online
Assessment Center in Percentages
Items
SA % (N)
A % (N)
N % (N)
D % (N)
SD % (N) Mn.
St. Dev.
Q.1 I felt comfortable about taking exam in an environment which is separated with wooden walls.
32.5 (38)
45.3 (53)
11.1 (13)
6.0 (7)
5.1 (6)
3.94 1.07
Q.2 Taking exam in online assessment center was not more stressful than taking exam in any other place (i.e. regular classroom, computer lab)
31.6 (37)
47.0 (55)
8.5 (10)
9.4 (11)
3.4 (4)
3.94 1.04

70
Table 4.6: (Cont’d) Distribution of Responses about Taking Exam in the Online Assessment Center in Percentages Q.3 Being recorded by the
cameras did not make me anxious.
19.7 (23)
44.4 (52)
14.5 (17)
14.5 (17)
6.0 (7)
3.55 1.19
Q.4 I think that the exam results will be fair since the examinees were separated by the wooden walls.
38.5 (45)
48.7 (57)
3.4 (4)
4.3 (5)
5.1 (5)
4.11 1.02
The 1st item asked the volunteer examinees whether if they felt comfortable about
taking exam in an environment which is separated with wooden walls. 77.8% of
the volunteer examinees strongly agreed or agreed with the statement. 11% of the
volunteer examinees were neutral and 11.1% of them disagreed or strongly
disagreed with the statement. The mean score for this item was 3.94.
In the 2nd item, the volunteer examinees were asked whether taking exam in the
online assessment center was more stressful than taking exam in any other place.
78.6% of the volunteer examinees agreed or strongly agreed with the statement.
8.5% of the volunteer examinees were neutral and 12.8% of them said that taking
exam at online assessment center was more stressful taking exam in online
assessment center than taking exam in any other place. The mean score was found
to be 3.94.
The 3rd item asked the volunteer examinees whether being recorded by the
cameras made them anxious. 64.1% of the volunteer examinees were not anxious
about being recorded by the cameras during the exam. However, 20.5% of the

71
volunteer examinees were anxious about being recorded during the exam. The
mean score of this item was 3.55.
The 4th items asked the volunteer examinees whether they thought that the exam
results would be fair due to using wooden walls to separate the volunteer
examinees. 87.2% of the volunteer examinees strongly agreed or agreed with the
statement with a mean score of 4.11. It can be said that volunteer examinees
perceived the exam results for which the exam is took place in the online
assessment center as fair.
4.2.3. Examinees’ Perceptions about Online Assessment Tool
This part of the user evaluation questionnaire was aimed to collect quantitative
data about examinees perceptions of online assessment center.
Main Research Question 2: What are participants’ perceptions about an online
assessment tool?
As the quantitative data revealed (Table 4.7), examinees perceived the online
assessment tool’s user interface fine and suitable. They also perceived the online
computer literacy exams suitable.

72
Table 4.7: Descriptive Statistics of Examinees’ Perceptions about Online
Assessment Tool
N = 117
Sub-scales Number of Items Mean St. Dev.
Reliability Coefficient
Perceptions About the Online Assessment Tool’s User Interface
8 4.00 1.07 0.72
Perceptions About Online Computer Literacy Exams
9 4.34 0.91 0.78
4.2.3.1. Examinees’ Perceptions about Online Assessment Tool’s User
Interface
There existed 8 items and the mean score for this sub-scale was found to be 4.00.
Table 4.8 gives detailed statistical results of the sub-scale.
Sub-Research Question 2.a: What are participants’ perceptions about IS100MAN
online assessment tool?
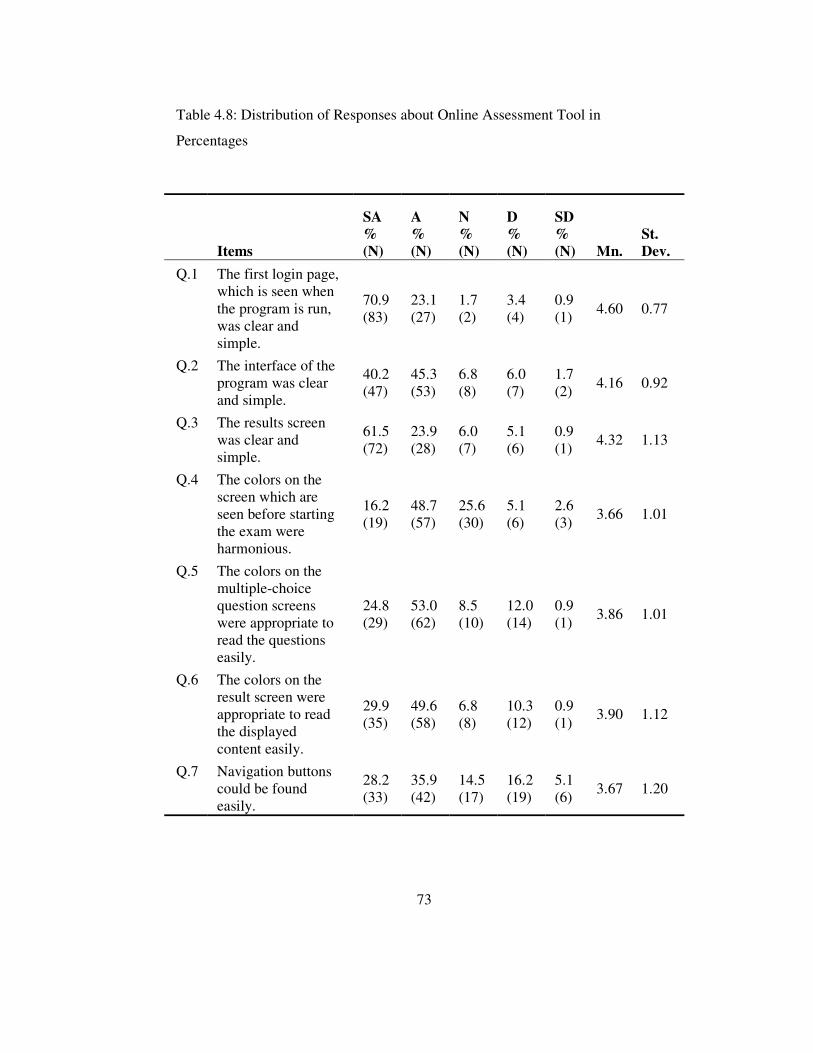
73
Table 4.8: Distribution of Responses about Online Assessment Tool in
Percentages
Items
SA % (N)
A % (N)
N % (N)
D % (N)
SD % (N) Mn.
St. Dev.
Q.1 The first login page, which is seen when the program is run, was clear and simple.
70.9 (83)
23.1 (27)
1.7 (2)
3.4 (4)
0.9 (1)
4.60 0.77
Q.2 The interface of the program was clear and simple.
40.2 (47)
45.3 (53)
6.8 (8)
6.0 (7)
1.7 (2)
4.16 0.92
Q.3 The results screen was clear and simple.
61.5 (72)
23.9 (28)
6.0 (7)
5.1 (6)
0.9 (1)
4.32 1.13
Q.4 The colors on the screen which are seen before starting the exam were harmonious.
16.2 (19)
48.7 (57)
25.6 (30)
5.1 (6)
2.6 (3)
3.66 1.01
Q.5 The colors on the multiple-choice question screens were appropriate to read the questions easily.
24.8 (29)
53.0 (62)
8.5 (10)
12.0 (14)
0.9 (1)
3.86 1.01
Q.6 The colors on the result screen were appropriate to read the displayed content easily.
29.9 (35)
49.6 (58)
6.8 (8)
10.3 (12)
0.9 (1)
3.90 1.12
Q.7 Navigation buttons could be found easily.
28.2 (33)
35.9 (42)
14.5 (17)
16.2 (19)
5.1 (6)
3.67 1.20

74
Table 4.8: (Cont’d) Distribution of Responses about Online Assessment Tool in Percentages
Q.8 I could follow the directions of the questions easily.
29.9 (35)
41.9 (49)
14.5 (17)
12.0 (14)
1.7 (2)
3.86 1.03
The 1st item asked the volunteer examinees whether the first login page was clear
and simple. 94.0% of the volunteer examinees strongly agreed or agreed with the
statement. The mean score was 4.60. It can be said that the volunteer examinees
perceived the first login page as clear and simple.
In the 2nd item, the volunteer examinees were asked whether the interface of the
program was clear and simple. 85.5% of the volunteer examinees strongly agreed
or agreed with the item with a mean score of 4.16. 7.7% of the volunteer
examinees disagreed or strongly disagreed with the statement.
The 3rd item asked the volunteer examinees whether the results screen was clear
and simple. 85.4% of the students strongly agreed or agreed with the statement.
The mean score was found to be 4.32. It can be concluded that the volunteer
examinees perceived the results screen simple and clear.
In the 4th item, volunteer examinees were asked whether the colors on screen
which were seen before the starting the exam, were harmonious. Only 64.9% of
the volunteer examinees strongly agreed or agreed with the statement. 25.6% of
the volunteer examinees were neutral. 7.7% of the volunteer examinees strongly
disagreed or disagreed with the item. The mean score of this item was 3.66.

75
The 5th item asked the volunteer examinees whether the colors on the multiple-
choice question screens were appropriate to read the questions easily. 24.8% of
the volunteer examinees strongly agreed and 53% agreed with the statement.
12.9% of the volunteer examinees strongly disagreed or disagreed with the item.
The mean score for this item was 3.86.
In the 6th item, the volunteer examinees were asked whether the colors on the
result screen were appropriate to read the displayed content easily. 29.9% of the
volunteer examinees strongly agreed with the statement and 49.6% of them agreed
with the item.11.2% of the volunteer examinees strongly disagreed or disagreed
with the item. The mean score for this item was 3.90. It can be said that the
volunteer examinees thought that the colors on the results screen were alright.
The 7th item asked the volunteer examinees whether they could find the navigation
buttons easily. 28.2% of the volunteer examinees strongly agreed with the
statement while 35.9% of them agreed. 14.5% of the volunteer examinees were
neutral. 21.3% of the volunteer examinees strongly disagreed or disagreed with
this item. The mean score was 3.67.
The last item in this subscale asked the volunteer examinees whether s/he could
follow the directions of the questions easily. 29.9% of the volunteer examinees
strongly agreed with the item while 41.9 agreed. 13.7% of the volunteer
examinees strongly disagreed or disagreed with the statement. The mean score
was found to be 3.86 for this item.

76
4.2.3.2. Examinees’ Perceptions about Online Computer Literacy Exams
In this sub-scale, questions were about the volunteer examinees’ perceptions
about online assessments. There existed 9 items and the overall mean score for
this sub-scale was 4.34. Table 4.9 gives details about the volunteer examinees’
responses.
Sub-Research Question 2.a: What are participants’ perceptions about online
computer literacy exam?
Table 4.9: Distribution of Responses about Online Computer Literacy
Assessments in Percentages
Items
SA % (N)
A % (N)
N % (N)
D % (N)
SD % (N) Mn.
St. Dev.
Q.1 Multiple-choice questions were appropriate for assessing computer skills and knowledge.
17.9 (21)
61.5 (72)
15.4 (18)
2.6 (3)
2.6 (3)
3.90 0.81
Q.2 The directions of multiple-choice questions were clear to understand.
24.8 (29)
56.4 (66)
10.3 (12)
8.5 (10)
0.0 (0)
3.97 0.84
Q.3 Simulation questions were appropriate for assessing computer skills and knowledge.
19.7 (23)
53.8 (63)
13.7 (16)
12.0 (14)
0.9 (1)
3.79 0.92
Q.4 The directions of simulation questions were clear to understand.
22.2 (26)
57.3 (67)
13.7 (16)
5.1 (6)
1.7 (2)
3.93 0.85

77
Table 4.9: (Cont’d) Distribution of Responses about Online Computer Literacy
Assessments in Percentages
Q.5 It was easy to follow the steps in simulation questions.
12.0 (14)
53.0 (62)
8.5 (10)
20.5 (24)
5.1 (6)
3.44 1.18
Q.6 It was good being immediately informed after a wrong step in simulation questions.
20.5 (24)
30.8 (36)
18.8 (22)
16.2 (19)
12.8 (15)
3.27 1.35
Q.7 It was good skipping to the next step automatically after a wrong action in simulation questions.
13.7 (16)
25.6 (30)
10.3 (12)
29.9 (35)
16.2 (19)
2.78 1.45
Q.8 It had a positive effect that the simulation questions looked like the real case.
29.9 (35)
53.8 (63)
11.1 (13)
3.4 (4)
0.9 (1)
4.06 0.87
Q.9 The operation of the assessment tool was smooth.
23.1 (27)
56.4 (66)
7.7 (9)
9.4 (11)
3.4 (4)
3.86 0.99
The first item in this sub-scale asked the volunteer examinees whether the
multiple-choice questions were appropriate for assessing computer skills and
knowledge. 79.4% of the volunteer examinees strongly agreed or agreed with this
statement. 15.4% of the volunteer examinees were neutral and 5.2% of them
strongly disagreed or disagreed with the item. The mean score for this item was
3.90. It can be said that the volunteer examinees perceived the multiple-choice
questions as appropriate for assessing computer skills and knowledge.

78
In the 2nd item, the volunteer examinees were asked whether the directions of
multiple-choice questions were clear to understand. 81.2% of the volunteer
examinees strongly agreed or agreed with the statement. It can be stated that the
volunteer examinees thought that the directions of multiple-choice questions were
clear to understand. The mean score was found to be 3.97.
The 3rd item asked the volunteer examinees whether the simulation questions were
appropriate for assessing computer skills and knowledge. 73.5% of the volunteer
examinees strongly agreed or agreed with the statement. 13.7% of the volunteer
examinees were neutral and 12.9% of the volunteer examinees strongly disagreed
or disagreed with the statement. The mean score for this item was 3.79.
The 4th item asked the volunteer examinees whether the directions of simulation
questions were clear to understand. 22.2% of the volunteer examinees strongly
agreed while 53.8% agreed with the statement. 13.7% of the volunteer examinees
were neutral and 6.8% of them strongly disagreed or disagreed with the item. The
mean score for this item was found to be 3.93.
In the 5th item, the volunteer examinees were asked whether it was easy to follow
the steps in simulation questions. 65% of the volunteer examinees found
following steps in simulation question as easy while 29% of them found it
difficult. The mean score was 3.44.
The 6th item asked whether the volunteer examinees found it good being
immediately informed after a wrong step in simulation questions. 51.3% of the
volunteer examinees strongly agreed or agreed with the statement while 29% of

79
them strongly disagreed or disagreed. 18% of the volunteer examinees were
neutral about the statement. The mean score for this item was 3.27.
The 7th item asked the volunteer examinees whether it was good passing to the
next step after a wrong action in simulation questions. 46.1% of the volunteer
examinees found it not good passing to the next step automatically after a wrong
action. 49.3% of the volunteer examinees found it good. The mean score was
2.78.
The 8th item asked the volunteer examinees whether it had a positive effect that
the simulation questions looked like the real case. Most of the volunteer
examinees strongly agreed or agreed (83.7%) with the statement with a mean
score of 4.06. Table 4.8 gives detailed information about the responses.
In the 9th item, the volunteer examinees were asked whether the operation of the
assessment tool was smooth. 79.5% of the volunteer examinees strongly agreed or
agreed with the statement with a mean score of 3.86. It can be said that most of
the volunteer examinees perceived the operation of the assessment tool as smooth.
4.3. In Depth Interviews with Participants
Interviews were conducted to investigate volunteer examinees’ perceptions in
depth. 7 volunteer examinees were interviewed individually and six focus groups
(6 membered) were formed and interviewed.
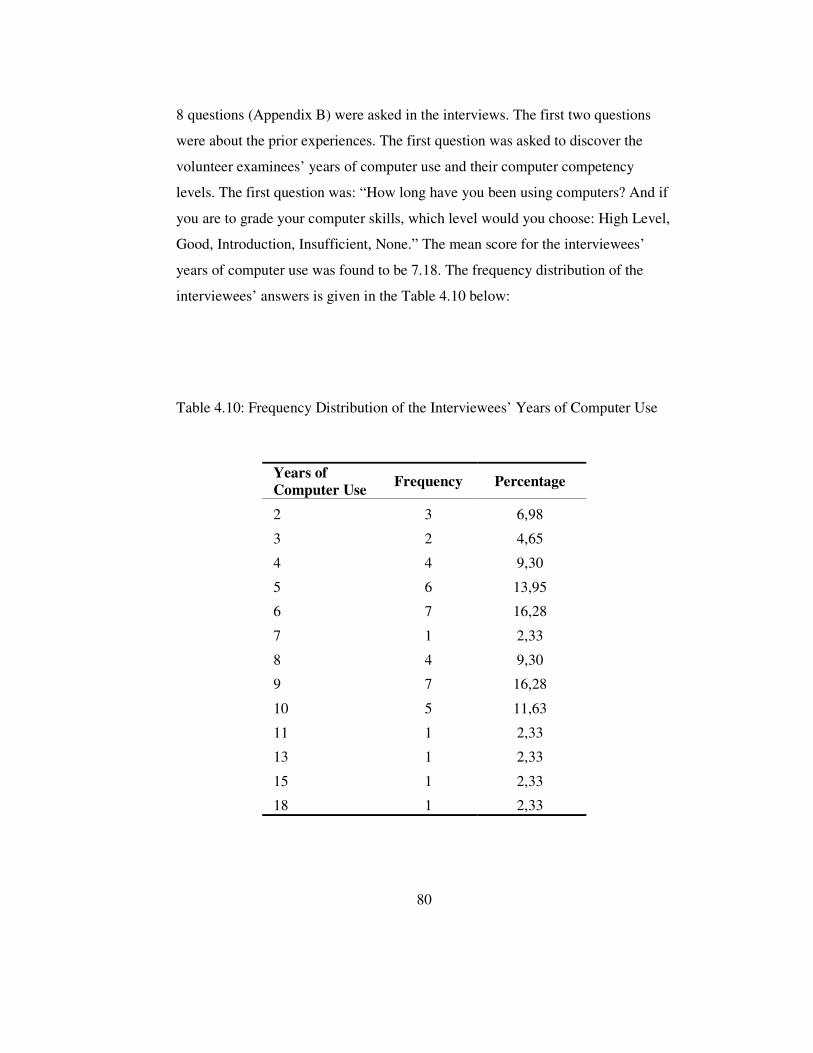
80
8 questions (Appendix B) were asked in the interviews. The first two questions
were about the prior experiences. The first question was asked to discover the
volunteer examinees’ years of computer use and their computer competency
levels. The first question was: “How long have you been using computers? And if
you are to grade your computer skills, which level would you choose: High Level,
Good, Introduction, Insufficient, None.” The mean score for the interviewees’
years of computer use was found to be 7.18. The frequency distribution of the
interviewees’ answers is given in the Table 4.10 below:
Table 4.10: Frequency Distribution of the Interviewees’ Years of Computer Use
Years of Computer Use
Frequency Percentage
2 3 6,98
3 2 4,65
4 4 9,30
5 6 13,95
6 7 16,28
7 1 2,33
8 4 9,30
9 7 16,28
10 5 11,63
11 1 2,33
13 1 2,33
15 1 2,33
18 1 2,33

81
The reported computer competency levels of the interviewees are given in the
Table 4.11 below:
Table 4.11: Reported Computer Competency Levels of the Interviewees
Levels Frequency Percentage
High Level 4 9,30
Good 27 62,79
Introduction 11 25,58
Insufficient 1 2,33
None 0 0,00
Total 43 100
As can be seen from the Figure 4.4 below, the majority of the interviewees (89%)
reported their computer skills as “Good” and “Introduction”.
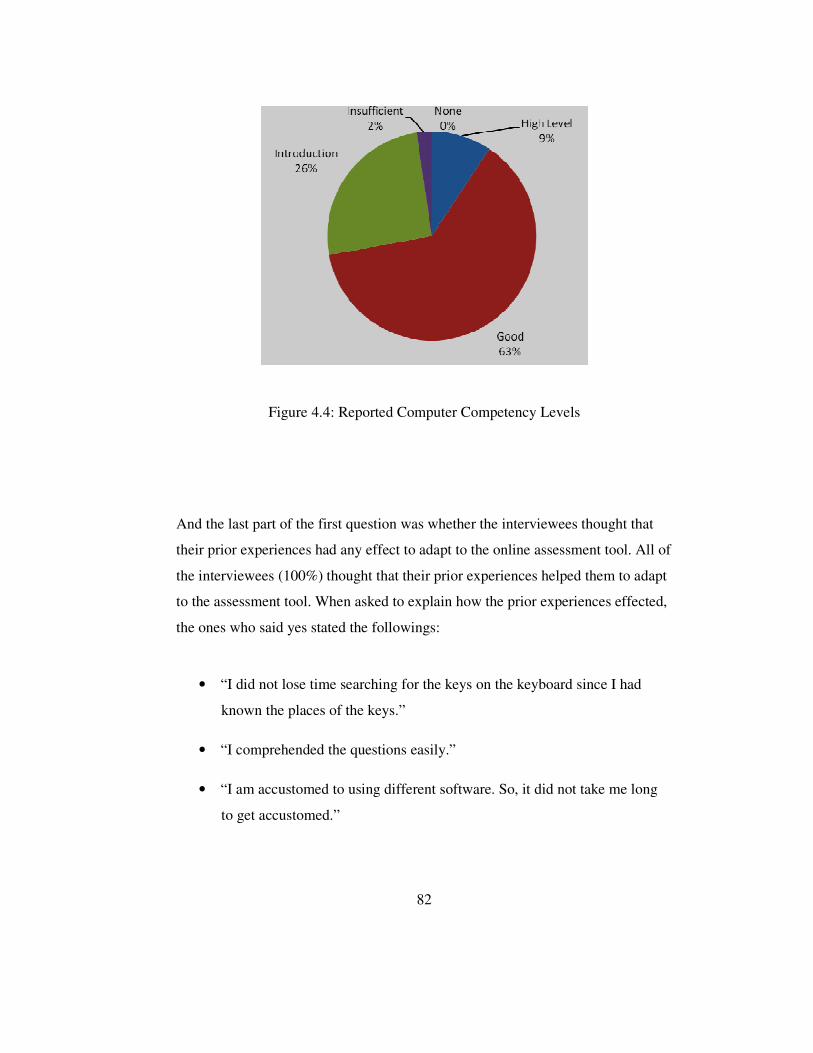
82
Figure 4.4: Reported Computer Competency Levels
And the last part of the first question was whether the interviewees thought that
their prior experiences had any effect to adapt to the online assessment tool. All of
the interviewees (100%) thought that their prior experiences helped them to adapt
to the assessment tool. When asked to explain how the prior experiences effected,
the ones who said yes stated the followings:
• “I did not lose time searching for the keys on the keyboard since I had
known the places of the keys.”
• “I comprehended the questions easily.”
• “I am accustomed to using different software. So, it did not take me long
to get accustomed.”

83
• “I took IS100 course before, so I was familiar with the interface of the
tool.”
• “Since I had known different ways of the solution, I answered the
questions easily.”
The 2nd interview question was “Have you ever taken an online assessment
before? If, yes which ones did you take? And if you have taken any online
assessment, did it have any effect in this online assessment?”
All 43 of the participants had taken online exam before. The following list gives
the online assessments they had taken before:
• IS100
• TOEFL
• GRE
• Various online quizzes and assessment (including only multiple-choice
questions)
When the effect of previous online assessment experiences was asked, various
answers were reported. They are given in the below list:
• “Since I had taken IS100, I remembered the interface immediately.”
• “The interface is very similar to GRE assessment tool’s interface.”

84
• “Since I had known the online assessment procedures, I got accustomed
easily. For example, I had known to click something to pass to the next
question.”
• “Yes, it helped me because I had known where to pay attention when
answering the questions.”
The 3rd question asked the interviewees how they found the online assessment tool
and whether they had any recommendations to make the online assessment tool
better. The volunteer examinees found the operation of the online assessment tool
fine but they thought that the design of the interface was not good. One of the
participants said that better colors could have been better. Most of the
interviewees (70%) complained about the navigation buttons. 30 of 43
participants said that they could not find the “Next (İleri)” button which was
required to pass to the next question.
Some more suggestions were made. They are mentioned in the following list:
• “Next button could be bigger or the position of the button could change.”
• “The tool should show the progress; which of the assessments was
completed and on which assessment the examinee was at that moment.”
• “I wish I could navigate between the questions. I wish there was a submit
button to finalize the question. So that I could recheck the questions.”
• “The interface could be more user-friendly.”
• “I wished to see my mistakes and the correct way to do the questions at the
end of the exam.”

85
• “I have looked for the ‘Next’ button on the right corner of the screen as I
got accustomed. It should be placed there.”
• “The directions could be highlighted. I had difficulty following the
directions.”
The 4th question was “Did you encounter any problems while answering the
multiple-choice questions? Are there any unclear points?” 41 out of 43
participants reported that they did not face any problems. Two of them said that
the colors made their eyes tired. They also stated that the colors on the question
area could be more contrasted and lighter and a nicer page could be designed.
Secondly, all of the participants reported that there were no unclear points.
In the 5th question, the interviewees were asked whether they encountered any
problems while answering the simulation questions and whether they had
encountered any difficulty following the steps. 16% of the interviewees said that
they did not face any problems. However the rest of the interviewees reported that
they faced problems in following the steps of simulation questions. Other
problems the interviewees encountered were also reported:
• “The main problem is that there is only one true solution of the question
in the simulation. There should be alternatives.”
• “I could not know what to do when the warning message saying that
‘wrong answer, passing to the next step’ was on the screen.”
• “I could not do the questions that were done by using the keyboard.”
• “I wished there were one or two more chances to do the questions before
passing to the next step.”

86
• “The simulations were not realistic.”
• “I lost time when entering the text. I could not complete entering the text.”
• “I had problem with the language. I am accustomed to English interface
and terminology, so I had difficulty.”
The 6th question was “Do you have any suggestions to make the questions any
better? If yes, what can be done?” The suggestions given by the interviewees are
listed below:
• “There should be alternative way to solve the problem.”
• “Directions could be clearer.”
• “I wished to go back to revise the questions. There could be a finalize
button to submit the question.”
• “A better simulation of the questions could be performed.”
• “There could be 2 or 3 chances to complete the task given in the
direction.”
• “I could not learn my mistakes in multiple-choice questions.”
The 7th and 8th questions were about the online assessment center. The 7th question
was “What do you think about the settlement of the online assessment center? Is
there anything that disturbed you? Do you have any suggestions to make the
online assessment center any better?”
All of the 43 interviewees (100%) found the online assessment center’s settlement
very well. Some of them even made comments about it which are given below:

87
• “I liked the wooden walls that separated the examinees.”
• “I think the wooden walls make the results fairer since they prevented
cheating.”
• “It is impossible to cheat.”
• “The widest of all the assessment centers I have ever experienced.”
• “Very well and roomy.”
• “Airy.”
• “Ideal.”
Some recommendations were also made for the online assessment center to make
it better. One said that the air conditioning could be better. Another interviewee
complained about the chairs. He wished to sit on an adjustable chair. Keyboard
and the mouse should not be cordless said five of the interviewees. One said the
ceiling could be higher. And one said I wished there were a mouse pad.
The last question asked to the interviewees was whether they got anxious because
of taking exam in an online assessment center and how they felt during the exam.
All of the 43 interviewees said that they did not become anxious due to taking
exam in the online assessment center. On the contrary, they reported that the
wooden walls enabled them to concentrate on the exam questions better. They
also said that they did not feel anything negative about taking exam in the online
assessment center.

88
4.4. Interviews with Experts
7 experts were interviewed one by one to discover their ideas about online
assessment tool and online assessment center. 6 questions (Appendix C) were
directed to the experts. The answers are explained below.
The first question asked to the experts was whether the examinees’ previous
computer use and online assessment experiences would have any effect on
examinees’ taking online assessment and using online assessment tool. All of the
seven experts said that prior experiences would have positive and negative effects
both on the taking online assessment and using the online assessment tool. Their
comments are grouped below in terms of positive effects and negative effects:
Positive effects:
• Knowing the logic and the procedures of online assessment results in
faster adaption
• Comprehending what is meant in the directions
• Previous computer use experiences on the assessed programs (i.e. MS
Word) makes the examinee answer the questions easily
• With the help of computer usage habits, the examinee can find the places
of the buttons and functions easily
• Previous online assessment experiences would result in faster adaption to
the online assessment tool
• Even the interface did not look similar, knowing the structure of the online
assessment tool will help to use the online assessment tool easily
Negative effects:
• Habits might direct the examinee into the undesired solutions

89
• Reading the directions carelessly might result in lost points
The second interview question asked the experts if they thought that there were
any defects about the online assessment tool. The experts stated that the interface
of the tool was simple but contained design problems. 6 out of 7 experts
complained about the place of the “Next” button. They stated that, they had
difficulty in finding the “Next” button. Their suggestion was to place the “Next”
button adjacent to the question directions. Another suggestion was about the place
of the directions window. They said that directions window should be placed on
top of the screen. Another point that experts agreed on was that they wished to be
able to recheck the questions before finalizing the exam. One of the experts
suggested not using red color on the screen since the red indicated warning.
The 3rd and 4th questions were about the BSTS questions. The 3rd question was
what they thought about the multiple-choice questions. All of the experts found
the multiple-choice questions okay except the colors. Two of the experts
suggested using light colors on background and a contrasting color in the question
direction and choices. One of the experts suggested using radio buttons instead of
check buttons in multiple-choice questions.
The 4th question asked the expert what they thought about the simulation
questions. And all the 7 experts said that simulation questions restricted the
examinee by just allowing solving the question in accordance with the directions
(i.e. using the menu bar). However, in real life, there were alternative ways of
doing the same task. So, they wished the simulations were more realistic. Three of
the experts stated that the help should be available during the exam. And two of
the experts said that the directions of the questions must be highlighted since the
question direction area was on bottom right corner of the interface. And one more

90
thing was the language. They reported that they had difficulty in understanding
the directions due to Turkish language. They were accustomed to English
terminology and interfaces.
The 5th and 6th questions were about the online assessment center. In the 5th
question, the experts were asked whether there were anything, which made them
uncomfortable. All of the 7 experts found the online assessment center wide and
fine. However, they made some suggestions which are given in the below list:
• “The walls of the building should have a sound isolation.”
• “The chairs’ height should be adjustable.”
• “There should be earphones to isolate the noises which will come from
inside of the online assessment center. The other examinees could make
noises.”
• “The chairs should have wheels so that the examinee could move the chair
easily.”
• “There could be a webcam in each cabinet to track the examinee.”
The 6th question asked the experts whether it would make the volunteer examinees
more stressful taking exam in that online assessment center. All of the experts
stated that it would not. Furthermore, they said that they would prefer to take
exam in such an environment.
At the end of the interview, the researcher asked each expert whether s/he had
anything to add. One of the experts said that there should be no login screens. He

91
wished to directly start the exam when he sat down in front of the computer. He
added that the exam administrator should choose which exam the examinee was
going the take.
92
CHAPTER 5
DISCUSSIONS, CONCLUSIONS, IMPLICATIONS AND
RECOMMENDATIONS
In this chapter, the discussions on findings, conclusions, implications and
recommendations are presented.
5.1. Discussion
The purpose of the study was to investigate the examinees’ perceptions about
online assessment center and an online assessment tool. The case study was
conducted with 117 volunteer examinees and 7 experts. The data was collected
through user evaluation questionnaire and interviews with 43 of the participants
and 7 experts.

93
5.1.1. Perceptions about Online Assessment Center
5.1.1.1. Perceptions about online assessment center’s physical environment
After taking the exam in the online assessment center, the user evaluation
questionnaire was administered to the volunteer examinees to obtain information
about their perceptions about the physical environment of the online assessment
center. The overall mean score calculated was 4.34 for this sub-scale. It is clearly
seen that most of the volunteer examinees have positive perceptions about the
physical environment of the online assessment center. In order to understand
volunteer examinees’ perceptions clearly the interviews were carried out with the
participants. The results obtained also showed that they liked to take assessment
in such an environment. Both the volunteer examinees and the experts found the
online assessment center airy and roomy. In fact, the online assessment center is
not so large, it was about 28m2 for 11 examinees. The walls were very light
yellow, the furniture was maple, the lighting was just as needed and the wooden
walls did not reach the ceiling.
Volunteer examinees did not complain anything about the online assessment
center but they made some suggestions. As Bullock and Foster-Harrison (1997)
stated, three of the volunteer examinees suggested:
• To place sound isolation material on the walls so that the outside sourced
noise would not disturb the examinees.
• To change the chairs with the wheeled ones so that volunteer examinees
could move freely without making any noise.

94
• To change the chairs with adjustable ones so that examinees could adjust
the height
Moreover, experts found the online assessment center suitable for delivering
online assessments. All 7 of them stated that there was nothing uncomfortable.
But, they also made some suggestions similar to the volunteer examinees. Two of
the experts suggested that the chairs should be wheeled and adjustable. A study
conducted by Veltri, Banning and Davies (2006) revealed that students cannot
concentrate in inappropriately and uncomfortable environments. In addition, one
expert said there should be sound isolation on the walls. Wall sound isolation is
required to block the noise that might come from the outside (NCS Pearson,
2007b).
In the questionnaire, 9th and 10th questions were about the mouse and keyboard.
88.9% of the participants perceived the keyboard as suitable and 92.3% perceived
the mouse as suitable. On the contrary, 6% of the participants did not find the
keyboard suitable, and 5.2% did not find the mouse. In depth interviews revealed
that the examinees did not trust the wireless mouse and keyboard would operate
without problems. They added, if it was a real case, they would not prefer using
wireless mouse and keyboard during the exam. Also, one of the experts said that
he did not trust the wireless mouse and keyboard since they did not operate well
normally. He added that, during the exam in online assessment center, he did not
encounter any problems with the operation of mouse or keyboard.
Items 5 and 12 were about the function of wooden walls. Most of the examinees
(71.8%) agreed that the walls would prevent cheating. In the same way, 89.8% of
the participants reported the wooden walls blocked the neighbors screen. In depth
interviews showed that volunteer examinees liked the wooden walls and they

95
thought that they were good for fairness. Also the experts stated similar arguments
about the wooden walls.
5.1.1.2. Perceptions about taking exam in online assessment center
In the user evaluation questionnaire, the volunteer examinees also depicted their
perception about taking exam in online assessment center. The mean score for
taking exam in online assessment center was 3.88 and this score showed that
taking exam in online assessment center was perceived as comfortable and fair.
The reason for not being anxious might be that the exam was just a pilot exam.
There were no carrot or stick. This was expressed by most of the volunteer
examinees at the end of the exam to the researcher.
Most of the students (77.8%) stated that wooden walls were not disturbing. Only
22.2% were indecisive about that. The mean score was 3.94. Moreover, according
to the interview results and comments on the questionnaires showed that the
volunteer examinees found the wooden walls useful for ensuring security. In
addition to that, they reported that those wooden walls increased their
concentration during the exam. Most of the participants said that they would like
to take all of their exams in environments similar to online assessment center. All
of the experts said that they did not think that the online assessment center would
make the volunteer examinees anxious. They said that volunteer examinees could
be anxious for taking an online exam but the online assessment center itself has no
effect. Also experts stated that the wooden blocks created a special working place
for the examinee. Since there were no distracters, concentrating on the exam was
easier.

96
More than half of the volunteer examinees (64.1%) perceived the cameras were
essential for security and they did not feel anxious due to recording cameras
(M=3.55). Moreover, they perceived the online assessment center served more
fair results due to wooden walls (M=4.11). The interviews confirmed that the
participants were not distracted by the cameras. Even some of the interviewees
stated that they had forgotten about the cameras. In addition to that, experts
agreed that the cameras were essential to provide security. Moreover, being
recorded by cameras was better than being observed by an observer walking
around.
5.1.2. Perceptions about online assessment tool
5.1.2.1. Perceptions about online assessment tool’s user interface
More than half of the volunteer examinees (M=4.00) perceived that the online
assessment tool was good and suitable for the assessment. In general; the interface
of an assessment tool should be as simple as possible (Dantin, 2005) to make the
examinee concentrate on the exam. However, some problems were reported about
the interface design of the online assessment tool during the interview and in the
comments part of the user evaluation questionnaire. A considerable number of the
participants (35.9%) could not find the navigation buttons (M=3.67). The
remaining (64.1%) could find. The high percentage of ease of finding the
navigation button could be due to taking the IS100 course before. 65.8% had
taken IS100 course. The navigation buttons were placed on the upper left corner.
The interviewees reported that they had serious difficulties in finding the “Next”
button to pass to the next question. During the exam, most of the volunteer
examinees asked the researcher the place of the “Next” button. In addition to that,

97
5 out of the 7 experts reported negative comments about the place of “Next”
button. They said that it should be placed next to the question or on the bottom
right corner. The place of the navigation buttons might be changed so that the
users can easily find them (Jones, 1989).
The second critique was about the colors used on the interface and multiple-
choice questions. In the interviews, the volunteer examinees suggested to change
the colors used on the interface. They said that more appealing colors could be
used on the interface. The interviewees also complained about the colors of the
multiple-choice questions. They said that more contrasting but light colors should
be used for the multiple-choice questions. Similar findings were also reported in
the literature (Ambler, 2004; Cooper and Reimann, 2003). The experts also agreed
with those comments. They said that the interface of the online assessment tool
should be redesigned. While redesigning, the placement of the navigation buttons
and colors used had to be judged. But they all agreed with the simplicity of the
interface. The simplicity provided aesthetic and functional benefits (Mullet and
Sano, 1995).
14.5% of the participants were neutral about following the direction of the
questions and 13.7% disagreed. In the interviews, the difficulty in following the
directions was also emphasized. In addition, the experts stated that the directions
should be on the top of the screen so that the attention is gained. May be the most
important part of an assessment is its directions. If directions could not be read
easily, the examinee faced difficulty and lost time (Dantin, 2005).
10 participants wished to be informed about their progress, which exam they were
taking. This feature might be added to the assessment tool. As Jones (1989)
indicated that it is good to inform the user about where they are.

98
5.1.2.2. Perceptions about online computer literacy exams
In the last part of the questionnaire, the volunteer examinees depicted their
perception about the online computer literacy exam. Most of the volunteer
examinees reported in the questionnaire that the exams suitable to assess the
computer skills (M=4.34).
79.4% of the participants perceived the multiple-choice questions suitable and
73.5% of them found the simulation questions suitable for assessing computer
literacy. On the contrary, in depth interviews covered that they wished the
simulations were more authentic. As Wiggins (1990) mentioned, authentic type of
examination had many advantage over the traditional. The problem which the
interviewees encountered was they had only one chance of clicking in each step.
They reported they knew how to do the task but they could not do it in the
simulation. This might be due to the participants’ lack of knowledge about
computer terminology or attention. Because, some of the interviewees reported
that the directions were clear enough to understand which way to choose for the
solution. On the contrary, the experts also found it problematic of solving the
simulation questions only in one way. They also reported that they had difficulty
about the language. Some of them even said that the directions were not clear. In
fact, the directions were clear saying “print the document using the standard tools
bar”. If a little more explanation were given, then the questions would be too easy.
In addition to that, 46.1% of the volunteer examinees reported in the user
evaluation questionnaire that they found it bad skipping to the next step
automatically after the wrong action. In the interviews, they stated that they
wished they had 1 or 2 more chances to try before skipping. That would make the
online assessment tool more authentic. Similarly experts also suggested that the

99
simulations were more authentic. Jerrard (1993) stated that when writing a
computer program, the degree of real process should always be questioned.
29% of the volunteer examinees perceived being informed immediately after a
wrong action as bad while 18.8% were undecided (M=2.78). They reported in the
interviews that viewing a pop up saying “You did an incorrect action!”
demotivated them. Both in the in depth interviews and in the user evaluation
questionnaires’ comments they wished to be informed at the end of the exam and
have a detailed feedback. Also, two of the experts agreed with the interviewees’
argument.
5.2. Conclusions
Starting with the first research question, “What are the examinees’ perceptions
about the online assessment center” the questionnaire and the interviews showed
that
• They liked the physical layout of online assessment center.
• They found the online assessment center suitable for delivering online
assessment.
• They reported a few changes could be done but they were not fatal.
• They perceived taking exam in online assessment center fine. Moreover,
they wanted to take all their exams in such an environments.
• They were not anxious about taking exam in online assessment center.

100
• The precautions for stopping cheating are perceived as good by the
examinees.
• The volunteer examinees reported that the precaution such as cameras and
wooden walls required for fairness of exam.
For the second research question stated that “What are examinees’ perceptions
about the online assessment tool”, the questionnaire and the interviews revealed
that
• The examinees perceived the assessment tool simple and easy to use.
• They complained about the navigation buttons on the user interface. They
recommended changing the place or increasing the size of the buttons.
• The volunteer examinees and experts also said that the color choices of the
assessment tool were not suitable. They recommended changing the color
used in the user interface.
• The volunteer examinees complained about the questions having only one
correct way for the answer. They wished the simulation questions were
more authentic.
• They were not very happy with the warning message and skipping to the
next step. They wanted to have 1 or 2 more chances to find the correct
answer.

101
5.3. Implications for Practice
From the results of this study, following suggestions are made for developing an
online assessment center or online assessment tool.
1. The online assessment center should guarantee the fairness of the results.
The fair results can be ensured with various security precautions. The very
first one is placing security cameras in the center to record during the
exam. The second could be placing wooden walls to separate the
examinees so that they cannot see each other. But the wooden walls should
not reach the ceiling. Walls reaching the ceiling make the center
suffocating. Another security issue is the exam administrator. An
administrator should be watching the exam.
2. The online assessment center should be airy and roomy. There are many
design considerations when building up an online assessment center. One
of them is colors to use. Light colors should be chosen. The ventilation is
another important point. The adequate ventilation has to be supported. The
next point to consider can be the wooden separation walls. They should
reach the ceiling.
3. The online assessment center should be silent during the exam. While
choosing computers, the ones with the lowest fan noise should be
preferred. The online assessment center’s building should be preferable not
too close to the city center. The walls of the center should be sound
isolated with special materials. The floor should be covered with plastic
material or carpet to lessen the noise.

102
4. Monitors should be adjustable and easy to view. The selection about the
monitor is also another important point. The monitor should be adjustable
so that the examinees can adjust according to their best view. Also, their
screen should not glare due to lights.
5. Adjustable chairs give the examinee to adjust the height and roam easily.
The height of the participants will of course vary. Since it is very difficult
to adjust the height of the desks, the chairs should be adjustable.
6. Tool’s interface could be as simple as possible. Using less buttons will
prevent the examinee to be frustrated during the exam. Placing just the
relevant button on the suitable places will help the examinee adapt to the
tool easily.
7. Navigation buttons could be placed next to the directions or on the bottom
right corner of the screen. Placing the navigation button next to the
directions will enable the examinees find the button easily which will
prevent them losing time.
8. The interface should be astatically appealing. The screen view of the
assessment tool should be nice. The colors used on the screen should be
light colors, which make reading and viewing easy.
103
5.4. Recommendations for Future Research
There is a continuous need for further research to make the computer literacy
assessment tool more effective. Some recommendations are listed below for those
who want to conduct a similar research:
• The study could be conducted with more participants.
• The similar research should be repeated in a real life conditions.
• The questions of the computer literacy exam should be checked in terms of
reliability and validity.
• The assessment tool supported only two types of questions, multiple-
choice and simulation. Different type of question support can be added to
the tool.
• The tool used in this system should be developed having such properties
i.e., an agent that keeps track of the actions of the examinee in a real
environment.
• The tool should keep detailed information about the answer of the
examinees so that statistics could be run to calculate reliability and
validity.
104
REFERENCES
Ambler, S. W. (2004). The Object Primer 3rd Edition: Agile Model Driven
Development with UML 2. New York: Cambridge University Press.
Amelung, M., Piotrowski, M. and Rösner, D. (2006, June). EduComponents:
Experiences in E-Assessment in Computer Science Education. Paper
presented at ITiCSE’06, Bologne, Italy.
Austing, R. (1974). The Role of Professional Societies in Computer Science
Education. SIGCSE Bulletin, vol. 6, issue 4, pp. 15-20.
Bandura, A. (1977). Social Learning Theory. New York: General Learning Press.
Black, P. (1998). Testing: Friend or Foe? Theory and Practice of Assessment and
Testing. London: Falmer Press.
Board of Education, MoE. (2005). Orta Öğretim Kurumları Bilgi ve İletişim
Teknolojisi Dersi Öğretim Programı. Ankara: MEB.
Bullock, A. A., and Foster-Harrison, E. (1997). Making the Best Decisions:
Designing for Excellence. Schools in the Middle, vol.
November/December, pp. 37-39, 60.61.

105
Burke, K., and Burke-Samide, B. (2004). Required changes in the classroom
environment: it's a matter of design. The Clearing House, vol. 77, pp.
236-239.
Butin, D. (2000). Classrooms. National Clearinghouse for Educational Facilities.
Washington, DC.
Chickering, A. W, and Gamson, Z. F (eds.). (1991). Applying the Seven Principles
for Good Practice in Undergraduate Education. New Directions for
Teaching and Learning, no .47. San Francisco: Jossey-Bass Publishers.
Cooper, A. & Reimann, R. 2003, About Face 2.0: The Essentials of Interaction
Design. Indianapolis: Wiley Publishing Inc.
Council of European Professional Informatics Societies (CEPIS). (2007). Council
of European Professional Informatics Societies: ECDL/EUCIP.
Retrieved on August 16, 2007, from
http://www.cepis.org/index.jsp?andpID=636andnID=640.
Dantin, U. (2005). Application of Personas in User Interface Design for
Educational Software. Paper presented at Australasian Computing
EducationConference 2005, Newcastle, Australia.
Dunn, R., and Dunn, K. (1992). Teaching Elementary Students Through Their
Individual Learning Styles. Boston: Allyn and Bacon.
106
ECDL Foundation. (2006). European Computer Driving License Syllabus Version
4.0. Dublin, Ireland: The European Computer Driving Licence
Foundation Ltd.
ECDL Foundation. (2007a). Europen Computer Driving Licence Foundation -
Products. Retrieved on July 24, 2007, from
http://www.ecdl.com/products/index.jsp?b=0-
102andpID=108andnID=204
ECDL Foundation. (2007b). Corporate and Societal Skills Certification, Retrieved
on August 6, 2007, from
http://www.ecdl.com/publisher/index.jsp?andpID=93andnID=99
Fletcher, J. D. (2002). Is It Worth It? Some Comments on Research and
Technology in Assessment and Instruction, Technology and
Assessment: Thinking Ahead - Proceedings from a Workshop.
Washington, DC, USA: National Academies Press.
Garson, G. David. (2007). Scales and Standard Measures. Retrieved on August 8,
2007, from http://www2.chass.ncsu.edu/garson/pa765/standard.htm .
General Directory of Primary Education, MoE. (2006). İlköğretim Bilgisayar
Dersi (1-8. Sınıflar) Öğretim Programı. Ankara: MEB.
Gitomer, D. H. and Bennett, R. E. (2002). Unmasking Constructs Through New
Technology, Measurement Theory, and Cognitive Science, Technology

107
and Assessment: Thinking Ahead -- Proceedings from a Workshop (p
10). Washington, DC, USA: National Academies Press
Greenberg, R. (1998). Techniques. Alexandria, vol. 73, issue 3, pp. 26-28.
Hackbert, P. H. (2004). Building Entrepreneurial Teamwork Competencies in
Collaborative Learning via Peer Assessments. Journal of College
Teaching & Learning. vol. 1, issue 12, pp. 39-55.
Hoffman, M., Blake, J., McKeon, J and Leone, S. (2005). A Critical Computer
Literacy Course. Journal of Computing Sciences in Colleges, vol. 20,
issue 5, pp. 163-175.
Hoffman, M. and Blake, J. (2003). Computer Literacy: Today and Tomorrow.
Journal of Computing Sciences in Colleges, vol. 18, issue 5, pp. 221-
233.
Informatics Institute, M. (2007). IS100 Introduction to Information Technologies
and Applications. Retrieved on July 20, 2007, from
http://www.ii.metu.edu.tr/is100/Syllabus/information.html
Information Technologies Group Center for International Development at Harvard
University (2007). Glossary, Retrieved August 20, 2007, from
http://cyber.law.harvard.edu/readinessguide/glossary.html.
Jerrard, R. (1993). Person-System Interaction and Designing: Re-Establishing
Values. Design Issues, vol. 9, pp. 20-31.
108
Johnson, D. W., Johnson, R. T., and Smith, K. A. (1991). Cooperative Learning:
Increasing College Faculty Instructional Productivity. ASHE-FRIC
Higher Education Report No.4. Washington, D.C.: School of Education
and Human Development, George Washington University.
Johnson, J.T. (1987). Goals for and Lessons from a Computer Literacy Course.
Paper presented at Technical Symposium on Computer Science
Education, St. Louis.
Jones, M. K. (1989). Human-computer interaction: A design guide. Englewood
Cliffs, NJ: Educational Technology Publications.
Kushwaha, R. and Whitescarver, J. (1994, August). Integration of Virtual
Classroom and Multimedia on the Information Superhighway. Paper
presented at ISMM International Conference on Distributed Media
Systems Applications, Hawaii.
Lambert, D. and Lines, D. (2001). Understanding Assessment: Purposes,
Perceptions, Practice. London: Falmer Press.
Lancy, D. F. (1993). Qualitative research in education . New York: Longman
Publishing Group
Landry, B. J. L. and Hartman, S. J. (2006). Engaging students with online
assignments: a replacement for digital dropboxes and paper
assignments. British Journal of Educational Technology, vol. 37, no 5,
pp. 803-805.

109
Lawson, D. (2002). Computer-aided assessment in mathematics: Panacea or
propaganda? CAL-laborate, vol. 9. Retrieved on 17 August, 2007, from
http://science.uniserve.edu.au/pubs/callab/vol9/lawson.html.
Linacre, J. M. (2000). Computer-Adaptive Testing: A Methodology Whose Time
Has Come. Chae, S., Kang, U., Jeon, E. and Linacre, J. M. (2000)
Development of Computerized Middle School Achievement Test [in
Korean]. Seoul, South Korea: Komesa Press.
Lingard, M. (2004). Introducing CAA: Considerations for the New Practitioner,
OET Coursework. London: Online Education and Training.
Linn, R. L. and Gronlund, N. E. (1995). Measurement and Assessment in
Teaching. New Jersey: Prentice Hall.
Mason, J. and Morrow, R. M. (2006, March). YACLD (Yet Another Computer
Literacy Definition. Paper presented at Consortium for Computing
Sciences in Colleges: Mid-South Conference, Memphis, TN.
McKenna, C. and Bull, J. (2000). Quality Assurance of computer-assisted
assessment: practical and strategic issues. Quality Assurance in
Education, vol. 8, issue 1, pp. 24-31. Retrieved on May 5, 2005, from
http://proquest.umi.com.
MoE. (2002). 2002 Yılı Başında Milli Eğitim, Eğitim Sisteminde Yenilikler.
Retrieved on September 4, 2007, from
http://www.meb.gov.tr/Stats/Apk2002/502.htm.

110
MoE. (2007). MEB İnternete Erişim Projesi. Retrieved on August 15, 2007, from
http://www.meb.gov.tr/ADSL/adsl_index.html.
Mueller, J. (2006). Authentic Assessment Toolbox: What is Authentic
Assessment, Retrieved on August 17, 2007, from
http://jonathan.mueller.faculty.noctrl.edu/toolbox/whatisit.htm#names.
Mullet, K. and Sano, D. 1995, Designing Visual Interfaces: Communication
Oriented Techniques. Englewood Cliffs, NJ: Sunsoft Press, Prentice
Hall.
National Research Council. (2001). Knowing what students know: The science
and design of educational assessment. Committee on the Foundations
of Assessment. J. Pellegrino, N. Chudowsky, and R. Glaser (Eds.).
Board on Testing and Assessment, Center for Education. Division of
Behavioral and Social Sciences and Education. Washington, DC:
National Academy Press.
NCS Pearson, I. (2007a). About Pearson VUE. Retrieved on July 25, 2007, from
http://www.vue.com/about/history/
NCS Pearson, I. (2007b). Pearson VUE® Authorized Test Centers. Retrieved on
July 25, 2007, from http://www.vue.com/pvtc/facility_reqs.pdf.
Neill, M.J. (1977). Some Thoughts on Reasons, Definitions and Tasks to
Achieve"Functional" Literacy. ACM SIGCSE Bulletin, vol. 9, pp. 175-
177.

111
Nevison, J. M. (1976). Computing in the Liberal Arts College, Science, vol. 194,
Issue 4263, pp. 396-402.
North Carolina State Board of Education. (2003). Facilities Guidelines. Public
Schools of North Carolina, State Board of Education, Department of
Public Instruction. North Carolina.
Odabaşı, F. (1998). Bilgisayar Destekli Eğitim. In Y. Hoşcan (Ed.), Bilgisayar
(pp. 133-147). Eskişehir: Anadolu Üniversitesi Yayınları.
Pickett, N. and Dodge, B. (2007). Rubrics for Web Lessons. Retrieved on August
17, 2007, from http://webquest.sdsu.edu/rubrics/weblessons.htm.
Prior, J. C. (2003). Online Assessment of SQL Query Formulation Skills. Paper
presented at Australian Computing Education Conference, Adelaide,
Australia.
Projects Coordination Unit, MoE. (2007). Temel Eğitim Projesi II. Faz İkraz
Antlaşması. Retrieved on September 4, 2007, from
http://projeler.meb.gov.tr/tep_faz2.html.
Rogers, V. (2005). Some efficient and effective classroom designs that
accommodate technology for promoting learning. Retrieved on 18
August, 2007, from
http://www.coe.uga.edu/sdpl/sdplcontents/technology/technologyclassr
ooms.html.

112
Russell, J. D. (2002). How Computer-Based Technology Can Disrupt the
Technology of Testing and Assessment Technology and Assessment:
Thinking Ahead -- Proceedings from a Workshop. Washington, DC,
USA: National Academies Press.
Russell, M. and Haney, W. (1997). Testing Writing on Computers. An
Experiment Comparing Student Performance on Tests Conducted via
Computers and via Paper-and-pencil. Educational Policy Analysis
Archives [Online], vol. 5, no 3. Available:
http://epaa.asu.edu/epaa/v5n3.html.
Rust, C. (2002). Purposes and principles of assessment. Retrieved on August 16,
2007, from
http://www.brookes.ac.uk/services/ocsd/2_learntch/briefing_papers/p_p
_assessment.pdf.
McBride, J. R. (1997). Research Antecedents of Applied Adaptive Testing. In
Sands, W. A. (Ed), In Waters, B. K. (Ed), In McBride, J. R. (Ed),
Computerized Adaptive Testing: From Inquiry to Operation (p. 55).
Washington, DC: American Psychological Association.
Schemo, D.J. (2001). Degree of Dishonour. Melbourne: The Age.
Shore, J. (2007). Why Certification?: The Applicability of IT Certifications to
College and University Curricula. IT Certification and Academia, vol.
3. Retrieved on 15 June, 2007, from
http://sysdoc.doors.ch/IBM/WhyCertification.pdf.

113
Şanlı, R. (2003). Student's Perceptions About Online Assessment: A Case Study.
Computer Education and Instructional Technology. Unpublished
Master’s Thesis. Middle East Technical University. Turkey.
Thomson Prometric. (2007a). About Us. Retrieved on 25.07.2007, 2007, from
http://www.ets.org/portal/site/ets/menuitem.c988ba0e5dd572bada20bc4
7c3921509/?vgnextoid=3fabaf5e44df4010VgnVCM10000022f95190R
CRDandvgnextchannel=4ab65784623f4010VgnVCM10000022f95190
RCRD
Thomson Prometric. (2007b). Application to become an ETS iBT Testing Center.
Retrieved on July 25, 2007, from
http://www.prometric.com/TestiBT/default.htm#process
Turk, J. and Wiley, S. (1997). Teaching Social and Ethical Issues in the Literacy
Course. Paper presented at Technical Symposium on Computer Science
Education, San Jose.
Turkish Statistical Institute. (2005). Türkiye İstatistik Kurumu: Bilim, Teknoloji
ve Bilişim, Grişimlerde Bilişim Teknolojileri Kullanımı. Retrieved on
September 02, 2007 from http://www.tuik.gov.tr/VeriBilgi.do.
Veltri, S., Banning, J. H., and Davies, T. G. (2006). The Community College
Classroom Environment: Student Perceptions. College Student Journal,
vol. 40, no: 3, p517-527. Retrieved on September 6, 2007, from
http://search.ebscohost.com/login.aspx?direct=true&db=eric&AN=EJ7
65350&site=ehost-live.

114
Venn, J. J. (2000). Assessing students with special needs (2nd ed.). Upper Saddle
River, NJ: Merrill.
Wiggins, G. (1990). The case for authentic assessment. Practical Assessment,
Research and Evaluation, vol. 2, no 2. Retrieved on August 17, 2007
from http://PAREonline.net/getvn.asp?v=2andn=2.
Williams, G. C., Bialac, R. and Liu, Y. (2006). Using Online Self-Assessment in
Introductory Programming Classess. Journal of Computing Sciences in
Colleges, vol. 22, issue 2, pages 115-122.
Woit, D. and Mason, D. (2003, February). Effectiveness of Online Assessment.
Paper presented at SIGCSE’03 Technical Symposium on Computer
Science Education. Reno, Nevada.
Woolard, Donna. (1999). Prepraxis.com: Understanding Multiple Choice
Questions, Retrieved on August 7, 2007, from
http://www.pepraxis.com/0091/understandmc.htm
Yıldırım, A. and Şimşek, H. (2005). Sosyal Bilimlerde Nitel Araştırma
Yöntemleri. Ankara: Seçkin Yayıncılık.

115
APPENDIX A: USER EVALUATION QUESTIONNAIRE
GÖNÜLLÜ KATILIM FORMU
Bu çalışma, Orta Doğu Teknik Üniversitesi’nde görevli Prof. Dr. M. Yaşar
ÖZDEN danışmanlığında, Araş. Gör. Ali YILMAZ tarafından hazırlanan bir yüksek
lisans (master) tezi çalışmasıdır. Çalışmanın amacı, katılımcıların çevrimiçi (online) sınav
sistemi ve çevrimiçi sınav merkezine yönelik tutum ve eğilimleriyle ilgili bilgi
toplamaktır. Katılımcılardan çevrimiçi sınav merkezinde sınava girmeleri ve sınav
sonucunda anket doldurmaları beklenmektedir. Katılımcılardan bazılarıyla mülakat da
yapılacaktır. Bu sürecin yaklaşık 30–45 dakika arasında sürmesi beklenmektedir.
Çalışmaya katılım tamamıyla gönüllülük temelinde olmalıdır. Ankette, sizden kimlik
belirleyici hiçbir bilgi istenmemektedir. Cevaplarınız tamamıyla gizli tutulacak ve sadece araştırmacılar tarafından değerlendirilecektir; elde edilecek bilgiler bilimsel yayımlarda
kullanılacaktır.
Anket, genel olarak kişisel rahatsızlık verecek soruları içermemektedir. Ancak, katılım sırasında sorulardan ya da herhangi başka bir nedenden ötürü kendinizi rahatsız
hissederseniz cevaplama işini yarıda bırakıp çıkmakta serbestsiniz. Böyle bir durumda
anketi uygulayan kişiye, anketi tamamlamadığınızı söylemek yeterli olacaktır. Anket
sonunda, bu çalışmayla ilgili sorularınız cevaplanacaktır. Bu çalışmaya katıldığınız için şimdiden teşekkür ederiz. Çalışma hakkında daha fazla bilgi almak için araştırma
görevlisi Ali YILMAZ (ODTÜ Sürekli Eğitim Merkezi; Oda: 109; Tel: 210 3540; E-
posta: [email protected]) ile iletişim kurabilirsiniz.
Bu çalışmaya tamamen gönüllü olarak katılıyorum ve istediğim zaman yarıda
kesip çıkabileceğimi biliyorum. Verdiğim bilgilerin bilimsel amaçlı yayımlarda
kullanılmasını kabul ediyorum. (Formu doldurup imzaladıktan sonra uygulayıcıya geri
veriniz).
Ad, Soyad Tarih
İmza ----/----/-----

116
KULLANICI DEĞERLENDİRME ANKETİ
BÖLÜM 1
Kişisel Bilgiler
Cinsiyet : � Bay � Bayan
Yaş : ………
Eğitim durumu: � İlkokul � Orta Okul � Lise � Yüksekokul � Üniversite
Yüksekokul ya da üniversite öğrencisi / mezunu ise
Bölümü : ……………………………………
Yaptığı iş : ……………………………………
A. Geçmiş Deneyimler
Lütfen şimdi soracağım, geçmiş bilgisayar deneyimlerinize ait soruları cevaplayınız.
Evet Hayır
1 İnternet üzerinden çevrimiçi (online) ders(ler) aldınız mı ya da alıyor musunuz?
2 Daha önce çevrimiçi (online) sınava (TOEFL, GRE, IS100, CCNA, MCSA, vb. herhangi başka bir çevrimiçi sınav) girdiniz mi ya da çevrimiçi anket doldurdunuz mu?
3 Şu ana kadar, bilgisayar ile ilgili ya da bilgisayar kullanmayı gerektiren bir ders aldınız mı?
4 Daha önce bilgisayar kullanarak, internete bağlanmadan (hazırlık sınavı alma gibi) sınava girdiniz mi / sınav oldunuz mu?
5 Bilgisayarınız var mı?
Anket devam ediyor, lütfen
sayfayı çeviriniz ��������

117
B. Çevrimiçi (Online) Değerlendirme Aracı Hakkında
Aşağıda çevrimiçi değerlendirme aracının arayüzü ve işleyişi ile ilgili ifadeler bulunmaktadır. Lütfen bu ifadeler hakkındaki düşüncelerinizi en iyi ifade eden kutucuğu işaretleyiniz (�)
Kes
inli
kle
K
atıl
ıyor
um
Kat
ılıy
oru
m
Kar
arsı
zım
Kat
ılm
ıyor
um
Kes
inli
kle
K
atıl
mıy
oru
m
1 Sınav programı ilk açıldığında gelen, kullanıcı adının ve şifrenin girildiği pencere anlaşılır ve basitti.
2 Sınav programının genel görünümü (arayüzü) anlaşılır ve basitti.
3 Sınav sonuç ekranı anlaşılır ve basitti.
4 Sınav almaya başlamadan önce görünen ekrandaki renkler uyumsuzdu.
5 Çoktan seçmeli soruların bulunduğu penceredeki renkler, soruların okunabilmesi için uygun değildi.
6 Sınav sonuç ekranındaki renkler, sınav sonucunu bildiren yazıların okunabilmesi için uygun değildi.
7 Dolaşım (İleri, geri, yardım) düğmeleri kolayca bulunabiliyordu.
8 Soruların yönergeleri sorunsuz takip edilebiliyordu.
Çevrimiçi (online) değerlendirme aracı ile ilgili yukarıda bahsedilmeyen ancak eklemek istediğiniz unsurlar varsa lütfen anketin sonunda ayrılan alana yazınız.
Anket devam ediyor, lütfen
sayfayı çeviriniz ��������

118
C. Çevrimiçi (Online) Sınavlar Hakkında
Aşağıda çevrimiçi sınav soruları ile ilgili ifadeler bulunmaktadır. Bu ifadelerden görüşünüzü en iyi yansıtan seçeneği işaretleyiniz (�)
Kes
inli
kle
K
atıl
ıyor
um
Kat
ılıy
orum
Kar
arsı
zım
Kat
ılm
ıyor
um
Kes
inli
kle
K
atıl
mıy
orum
1 Çoktan seçmeli sorular temel bilgisayar bilgi/becerilerini ölçmek için uygundu.
2 Çoktan seçmeli soruların yönergeleri anlaşılırdı.
3 Uygulama soruları temel bilgisayar bilgi/becerilerini ölçmek için uygundu.
4 Uygulama sorularındaki yönergeler anlaşılırdı.
5 Uygulama sorularında basamakları takip etmede zorluk çektim.
6 Uygulama sorularında hatalı işlem yapıldığında anında uyarıda bulunması uygun değildi.
7 Uygulama sorularında, hatalı bir işlem yapıldığında bir sonraki adıma geçilmesini uygun değildi.
8 Sınavda uygulama sorularındaki benzetimlerle (simülasyon), gerçek görünümün (arayüz) benzeyişi olumluydu.
9 Genel olarak sınavın yapısı ve işleyişi akıcı değildi.
Çevrimiçi sınav soruları hakkında eklemek istediğiniz bir şey varsa lütfen anketin sonunda ayrılan alana yazınız.
Anket devam ediyor, lütfen
sayfayı çeviriniz ��������
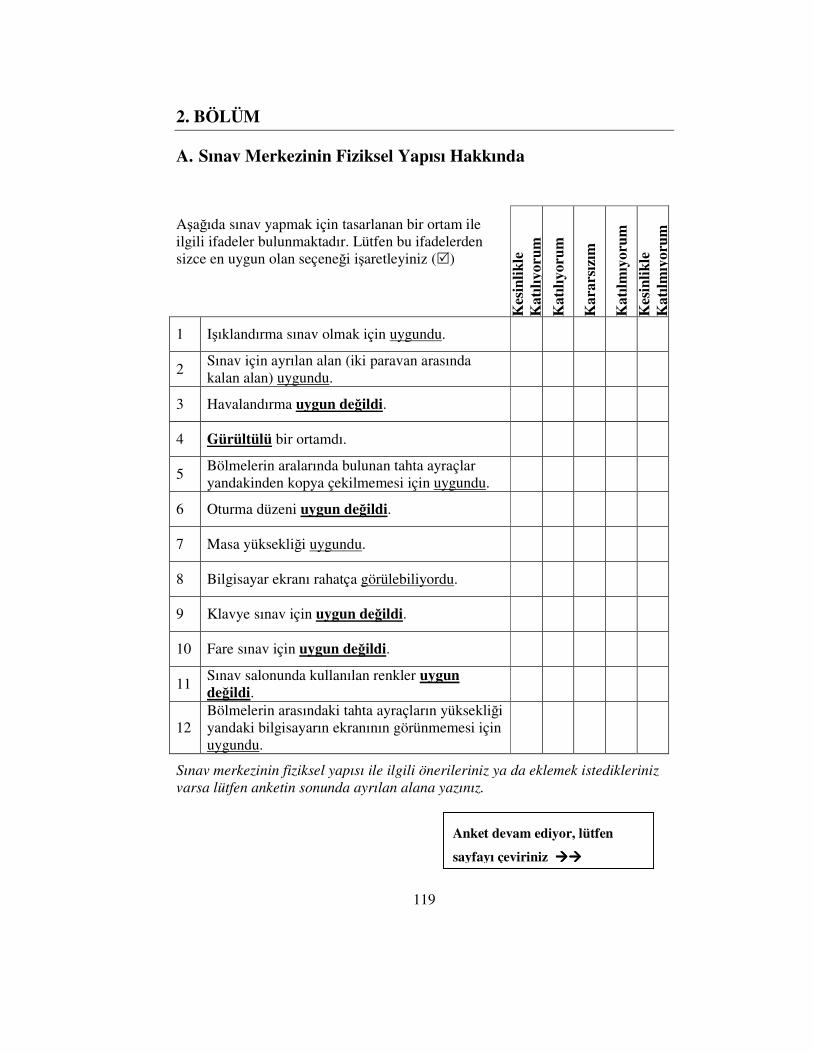
119
2. BÖLÜM
A. Sınav Merkezinin Fiziksel Yapısı Hakkında
Aşağıda sınav yapmak için tasarlanan bir ortam ile ilgili ifadeler bulunmaktadır. Lütfen bu ifadelerden sizce en uygun olan seçeneği işaretleyiniz (�)
Kes
inli
kle
Kat
ılıy
oru
m
Kat
ılıy
oru
m
Kar
arsı
zım
Kat
ılm
ıyor
um
Kes
inli
kle
Kat
ılm
ıyor
um
1 Işıklandırma sınav olmak için uygundu.
2 Sınav için ayrılan alan (iki paravan arasında kalan alan) uygundu.
3 Havalandırma uygun değildi.
4 Gürültülü bir ortamdı.
5 Bölmelerin aralarında bulunan tahta ayraçlar yandakinden kopya çekilmemesi için uygundu.
6 Oturma düzeni uygun değildi.
7 Masa yüksekliği uygundu.
8 Bilgisayar ekranı rahatça görülebiliyordu.
9 Klavye sınav için uygun değildi.
10 Fare sınav için uygun değildi.
11 Sınav salonunda kullanılan renkler uygun değildi.
12 Bölmelerin arasındaki tahta ayraçların yüksekliği yandaki bilgisayarın ekranının görünmemesi için uygundu.
Sınav merkezinin fiziksel yapısı ile ilgili önerileriniz ya da eklemek istedikleriniz varsa lütfen anketin sonunda ayrılan alana yazınız.
Anket devam ediyor, lütfen
sayfayı çeviriniz ��������

120
B. Sınav Merkezinde Sınava Girmek Hakkında
Aşağıda sınav merkezinde sınav alırken yaşanabilecek durumlar sıralanmıştır. Lütfen sizin hissettiklerinizi en iyi ifade eden kutucuğu işaretleyiniz (�)
Kes
inli
kle
K
atıl
ıyor
um
Kat
ılıy
oru
m
Kar
arsı
zım
Kat
ılm
ıyor
um
Kes
inli
kle
K
atıl
mıy
oru
m
1 Tahta ayraçlarla bölünmüş bölmelerde sınava girmek rahatsızlık vericiydi.
2 Sınav merkezinde sınava girmek diğer ortamlarda (sınıf, laboratuar vb.) sınava girmekten daha stresliydi.
3 Kameralarla izleniyor olmak rahatsızlık verici değildi.
4 Bölmelerin olduğu bir ortamda sınava girildiği için sınav sonuçlarının adaletli olduğunu düşünüyorum.
Sınav alırken hissettiğiniz ve yukarıda bahsedilmeyen bir şeyler varsa lütfen anketin sonunda ayrılan alana yazınız.
Anket devam ediyor, lütfen
sayfayı çeviriniz ��������
121
Eklemek İstedikleriniz
Bölüm 1. B. Çevrimiçi (Online) Değerlendirme Aracı Hakkında
………………………………………………………………………………………
………………………………………………………………………………………
………………………………………………………………………………………
………………………………………………………………………………………
………………………………………………………………………………………
………………………………………………………………………………………
………………………………………………………………………………………
………………………………………………………………………………………
………………………………………………………………………………………
Bölüm 1. C. Çevrimiçi (Online) Sınavlar Hakkında
………………………………………………………………………………………
………………………………………………………………………………………
………………………………………………………………………………………
………………………………………………………………………………………
………………………………………………………………………………………
………………………………………………………………………………………
………………………………………………………………………………………
………………………………………………………………………………………
………………………………………………………………………………………
Anket devam ediyor, lütfen
sayfayı çeviriniz ��������

122
Bölüm 2. A. Sınav Merkezinin Fiziksel Yapısı Hakkında
………………………………………………………………………………………
………………………………………………………………………………………
………………………………………………………………………………………
………………………………………………………………………………………
………………………………………………………………………………………
………………………………………………………………………………………
………………………………………………………………………………………
………………………………………………………………………………………
………………………………………………………………………………………
Bölüm 2. B. Sınav Merkezinde Sınava Girmek Hakkında
………………………………………………………………………………………
………………………………………………………………………………………
………………………………………………………………………………………
………………………………………………………………………………………
………………………………………………………………………………………
………………………………………………………………………………………
………………………………………………………………………………………
………………………………………………………………………………………
………………………………………………………………………………………
Anket soruları burada bitiyor. Çalışmaya katılımınız için teşekkür ederim.

123
APPENDIX B: PARTICIPANT INTERVIEW QUESTIONS
KATILIMCI MÜLAKAT SORULARI
1. Kaç yıldır bilgisayar kullanıyorsunuz? Eğer bilgisayar becerilerinizi
İleri Seviye | İyi | Giriş | Yetersiz | Hiç Bilmiyorum
olarak derecelendirecek olsanız kendinizi nasıl nitelendirirdiniz? Sizce
geçmiş bilgisayar kullanma deneyimlerinizin burada ki çevrimiçi (online)
sınav aracına adapte olmanıza bir faydası oldu mu? Evetse ne yönde
faydası oldu? Hayırsa neden olmadı?
2. Daha önce hiç çevrimiçi (online) sınav aldınız mı? Evetse, hangi
çevrimiçi (online) sınavları aldınız? Almış olduğunuz çevrimiçi (online)
sınavların, buradaki çevrimiçi sınavı alırken etkisi oldu mu?
3. Çevrimiçi (online) sınav aracını nasıl buldunuz? Aracın geliştirilmesi için
önermek istediğiniz bir şey var mı?
4. Çoktan seçmeli sorularda herhangi bir sorun yaşadınız mı?
Anlayamadığınız bir bölüm oldu mu?

124
5. Uygulama sorularında herhangi bir sorun yaşadınız mı? Takip etmekte
zorlandığınız, canınızı sıkan bir bölüm var mıydı?
6. Sorulara herhangi bir iyileştirme yapılabilir mi? Ne yapılabilir?
7. Sınav merkezinin yerleşimi hakkında ne düşünüyorsunuz? Çevrimiçi
sınav alırken sizi rahatsız eden bir şey oldu mu? Sınav merkezini daha iyi
hale getirmek için öneriniz var mı?
8. Sınav merkezinde sınav almaktan rahatsız oldunuz mu? Sınavı alırken
neler hissettiniz? Bu hislerinize böyle bir sınav merkezinde sınavı alıyor
olmanızın etkisi var mıydı?
Çevrimiçi (online) sınav, sınav soruları ve sınav merkezi ile ilgili,
bahsetmediğimiz ancak sizin aklınıza gelen, eklemek istediğiniz bir şey
var mı?

125
APPENDIX C: EXPERT INTERVIEW QUESTIONS
UZMAN MÜLAKAT SORULARI
1. Katılımcıların geçmiş bilgisayar kullanma ve çevrimiçi sınav alma
deneyimlerinin, çevrimiçi sınavı alırlarken ve çevrimiçi sınav aracını
kullanırlarken etkisi olmuş mudur? Cevabınız evet ise, nasıl etkisi
olmuştur? Hayır ise, neden olmamıştır?
2. Çevrimiçi (online) sınav aracında eksik ya da hatalı olduğunu
düşündüğünüz bir unsur var mı? Varsa, nedir? Bu eksiklik / hata
konusunda ne yapılabilir?
3. Çoktan seçmeli sorular hakkında ne düşünüyorsunuz?
4. Uygulama soruları hakkında ne düşünüyorsunuz?
5. Çevrimiçi sınav merkezinde sizi rahatsız eden bir unsur var mı? Varsa
nedir? Neden rahatsız oldunuz?
126
6. Böyle bir ortamda sınav almak, sınava girenler üzerinde baskı yaratabilir
ya da rahatsız edebilir mi? Cevabınız evet ise, neden?
Çevrimiçi sınav aracı, sınav soruları ve sınav merkezi ile ilgili,
bahsetmediğimiz ancak sizin eklemek istediğiniz bir şey var mı?