examination of the potential exposure of royal …€¦ · the authors of this report wish to...
TRANSCRIPT

EXAMINATION OF THE POTENTIAL EXPOSURE OF ROYALAUSTRALIAN NAVY (RAN) PERSONNEL TO POLYCHLORINATED
DIBENZODIOXINS AND POLYCHLORINATED DIBENZOFURANS VIADRINKING WATER
A REPORT TO THE DEPARTMENT OF VETERAN AFFAIRS, AUSTRALIA
THE NATIONAL RESEARCH CENTRE FOR ENVIRONMENTALTOXICOLOGY (ENTOX)
QUEENSLAND HEALTH SCIENTIFIC SERVICES (QHSS)

Watervolatility of PCDD/Fs
ii
EXAMINATION OF THE POTENTIAL EXPOSURE OF RAN PERSONNELTO POLYCHLORINATED DIBENZODIOXINS AND POLYCHLORINATED
DIBENZOFURANS VIA DRINKING WATER
A REPORT TO:
THE DEPARTMENT OF VETERAN AFFAIRS, AUSTRALIA
This report is dedicated to
Ralph Hayden Spooner
EX Ran Warrant Officer

Watervolatility of PCDD/Fs
iii
Acknowledgements
The authors of this report wish to acknowledge the assistance of many
Australian Vietnam Veterans who told us their stories.
The authors are particularly in debt to Yvonne Bence and her family
Further, this study would have been impossible without the continuous support
of Dr Keith Horsley (DVA).
Finally, we acknowledge the contributions of Katie Bundred, Tina Heuermann,
Katri Baeckman, Stefan Hartkopp and Joelle Prange (all ENTOX) who carried
out substantial parts of the laboratory work and discussed the project;
Geoff Johnson and the team of Mary Hodge, in particular Nigel Dennison, (all
Queensland Health) who continued to provide practical support to the study.

Watervolatility of PCDD/Fs
iv
By:
Dr Jochen Müller - National Research Centre for Environmental Toxicology
Ms Caroline Gaus – National Research Centre for Environmental Toxicology
Mr Vincent Alberts– Queensland Health Scientific Services
Prof. Michael Moore – Queensland Health Scientific Services
Corresponding Address:
Dr Jochen MüllerNational Research Centre for Environmental Toxicology39 Kessels RdCoopers PlainsBRISBANE 4108Telephone: (07) 30009197Fax : (07) 3274-9003Email: [email protected]: 12 December 2002

Watervolatility of PCDD/Fs
1
TABLE OF CONTENTS
LIST OF FIGURES .....................................................................................................2
LIST OF TABLES .......................................................................................................3
COMPOUND ABBREVIATIONS.............................................................................4
EXECUTIVE SUMMARY .........................................................................................5
INTRODUCTION........................................................................................................9
MATERIALS AND METHODS ..............................................................................11
DISTILLATION EXPERIMENTS WITH DIOXINS AND OTHER ORGANOCHLORINES.........11CHEMICALS TESTED..................................................................................................11LABORATORY DISTILLATION PLANT.........................................................................13DISTILLATION EXPERIMENTS - VARIATIONS OF PARAMETERS..................................13FORMATION EXPERIMENTS .......................................................................................17
RESULTS AND DISCUSSION ................................................................................20BLANKS – DISTILLATION EXPERIMENTS ...................................................................20CO-DISTILLATION OF DIOXINS AND ORGANOCHLORINES FROM PURE WATER..........20EFFECT OF SALINITY ON CO-DISTILLATION OF ORGANOCHLORINES .........................22EFFECT OF SORPTION COMPARTMENTS IN THE WATER ON CO-DISTILLATION OFCHEMICALS...............................................................................................................25PHASE II – EVALUATION OF CO-DISTILLATION OF DIMETHYLARSENIC ACID – AGENTBLUE.........................................................................................................................30
Background to Agent Blue – dimethyl arsenic acid (DMA) ................................30Compound Properties ..........................................................................................30
FORMATION STUDY ..................................................................................................32PRELIMINARY ESTIMATION OF DIOXIN EXPOSURE UPTAKE BY SAILORS FROM WATER..................................................................................................................................33COMPARISON OF EXPOSURE DATA WITH EFFECTS....................................................35
CONCLUSION ..........................................................................................................38
REFERENCES...........................................................................................................39
APPENDIX I ..............................................................................................................42
APPENDIX II: ...........................................................................................................51

Watervolatility of PCDD/Fs
2
LIST OF FIGURES
Figure 1: Schematic diagram of the distillation unit on board RAN vessels…….…14
Figure 2: Schematic representation of the laboratory distillation unit.……….……..14
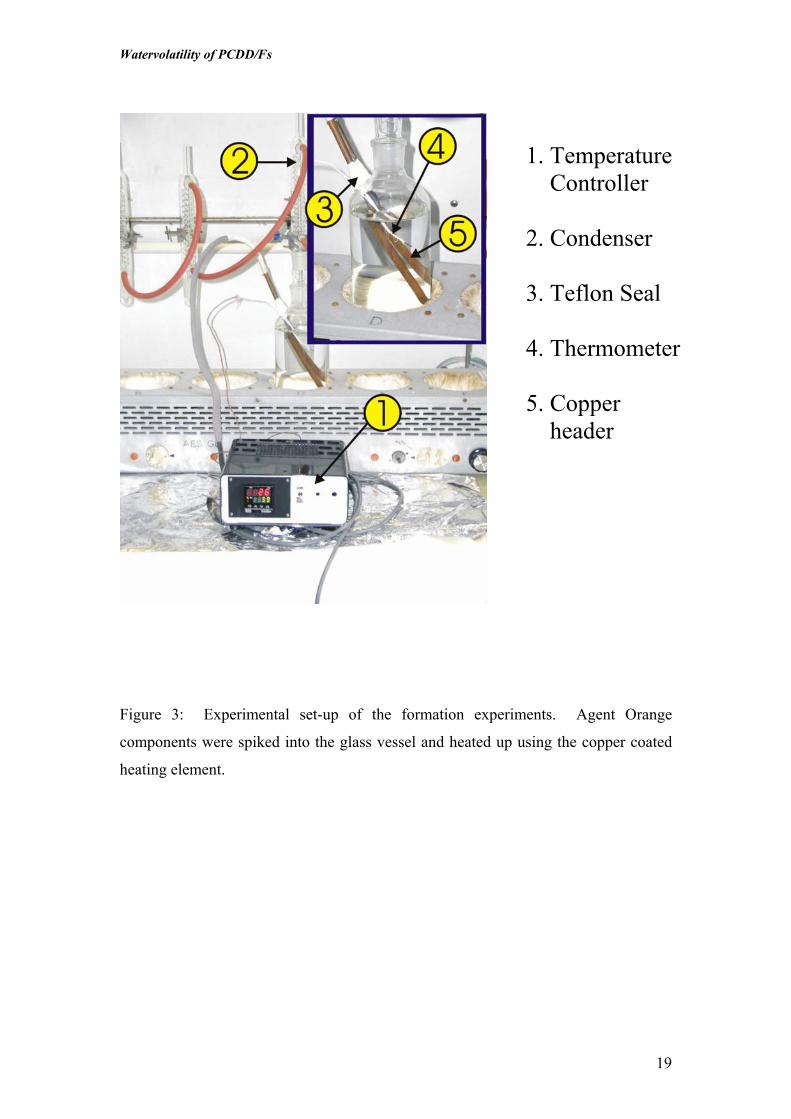
Figure 3: Experimental set-up of the formation experiments. Agent Orangecomponents were spiked into the glass vessel and heated up using the copper coatedheating element…………………………………………………………………..…..19
Figure 4: Co-distillation of organochlorines from pure RO water when 14 % (141mL of 1000 mL) was distilled. The values represent the quantity in the samplesdistillate relative to the total quantity in a control of spiked but non-distilled water...21
Figure 5: Plot of the relative retention times of organochlorines and PCDD/Fs versusthe % co-distilled in F1 at various NaCl concentrations (DVA1-1: 0g NaCl L-1;DVA1-2: 15g NaCl L-1 ; DVA1-3: 30 g NaCl L-1)…………………………………..23
Figure 6: Plot of the relative retention times of organochlorines and PCDD/Fs versusthe ratio of chemical co-distilled in F1 and F2 normalised to the respective wateramount distilled (log 10 scale). Data from DVA2-9 with 30 g NaCl L-1 and no TSSadded…………………………………………………………………………………24
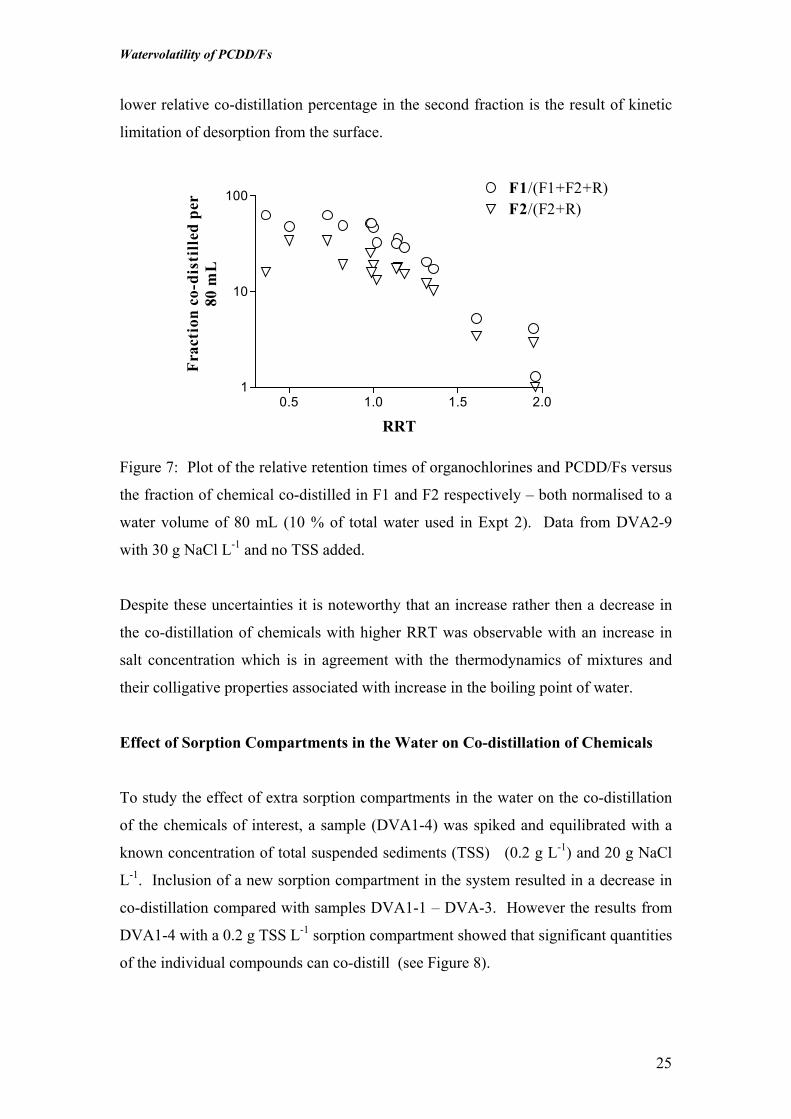
Figure 7: Plot of the relative retention times of organochlorines and PCDD/Fs versusthe fraction of chemical co-distilled in F1 and F2 respectively – both normalised to awater volume of 80 mL (10 % of total water used in Expt 2). Data from DVA2-9with 30 g NaCl L-1 and no TSS added……………………………………………….25
Figure 8: Quantity of PCDD/F congeners co-distilled from water containing 0.2 gtotal suspended sediment……………………………………………………………..26
Figure 9: Plot of the relative retention times of organochlorines and PCDD/Fs versusthe fraction of chemical co-distilled in F1 at different amounts of total suspendedsediments (TSS). Data from DVA2-5 - DVA2-9………………………………..…..27
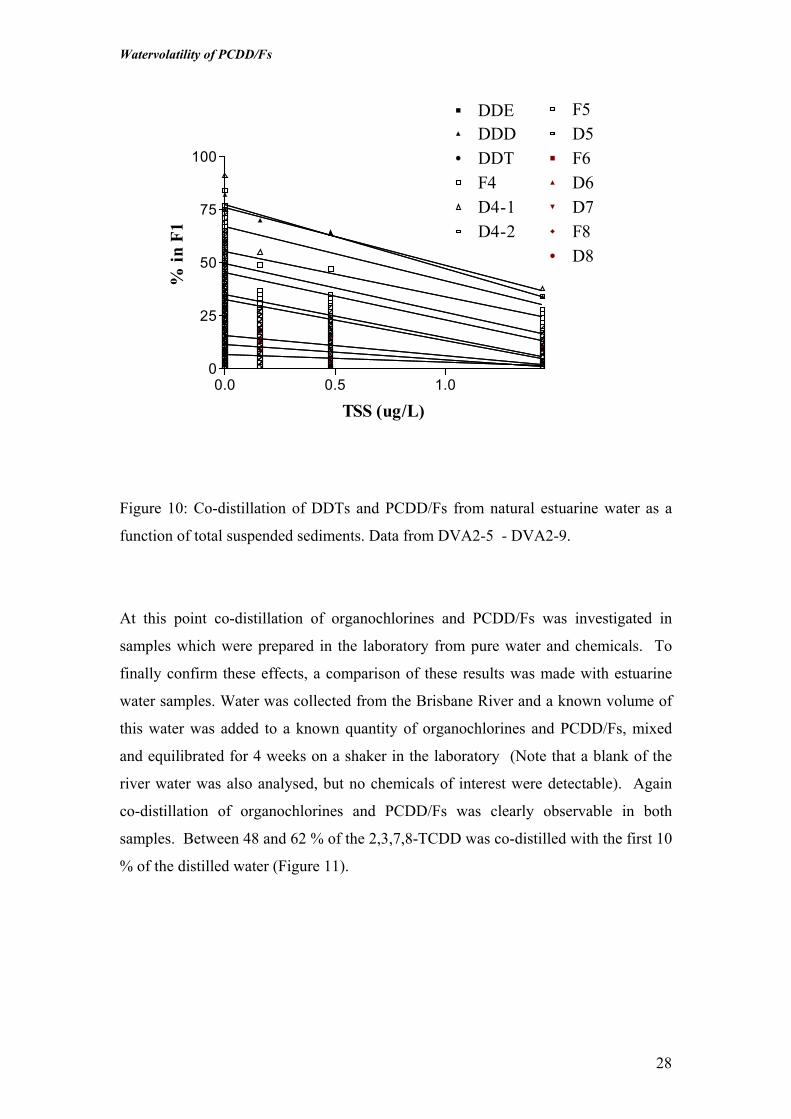
Figure 10: Co-distillation of DDTs and PCDD/Fs from natural estuarine water as afunction of total suspended sediments. Data from DVA2-5 - DVA2-9………..……28
Figure 11: Plot of the relative retention times of organochlorines and PCDD/Fsversus the mean percentage of co-distilled chemicals observed in F1 using watersamples collected from the Brisbane River Estuary………………….………………29

Watervolatility of PCDD/Fs
3
LIST OF TABLES
Table 1: List of chemicals used in the experiment, Molar mass, Henry’s Lawconstant and water solubility data compiled from Mackay et al. 1992, Windholz,1983, Paasivirta et al., 1999 and reviews by Huelster, 1994, Mueller, 1997, Cavanagh2000 and IARC, 1987………………………………………………………..………15
Table 2: Exposure Model Input Parameter including uncertainty……………….….34
Table 3: Animal body burdens and related estimated human daily intake (EHDI)(Table from van Leeuwen, presentation at NRCET, August 2001)………………….37
Table 4: Acceptable intake guidelines of dioxin-like chemicals. Comparison betweenthe standards for human intake of dioxins, furans and dioxin-like PCBs agreed byWHO (1998), EC-SCF (2001) and FAO/WHO (2001)……………...………………37

Watervolatility of PCDD/Fs
4
COMPOUND ABBREVIATIONS
I-TEq 2,3,7,8-Tetrachlorodibenzodioxin toxicity equivalents
PCDDs Polychlorinated dibenzodioxinsTCDD TetrachlorodibenzodioxinPeCDD PentachlorodibenzodioxinHxCDD HexachlorodibenzodioxinHpCDD HeptachlorodibenzodioxinOCDD Octachlorodibenzodioxin
PCDFs Polychlorinated dibenzofuransTCDF TetrachlorodibenzodioxinPeCDF PentachlorodibenzodioxinHxCDF HexchlorodibenzodioxinHpCDF HeptachlorodibenzodioxinOCDF Octachlorodibenzodioxin
HCB HexachlorobenzeneDDE Dichlorodiphenyl ethaneDDT Dichlorodiphenyl trichloroethaneDDD Dichlorodiphenyl dichloroethaneDMA Dimethyl arsenic acid

Watervolatility of PCDD/Fs
5
EXECUTIVE SUMMARY
Studies of Australian Vietnam veterans have revealed greater than expected
mortality, with the highest overall levels of mortality occurring among the Royal
Australian Navy (RAN).
During the Vietnam War, large quantities of phenoxy herbicides (Agent Orange)
contaminated with 2,3,7,8-tetrachlorodibenzodioxin (TCDD), arsenical
herbicides (Agent Blue) and organochlorine pesticides were used. There has
been concern that exposure to these chemicals may have long-term adverse
health effects. TCDD for example is now known to have many toxic effects in
humans, including carcinogenesis.
In RAN veterans, exposure to chemicals such as the TCDD is unlikely to be
related to overhead spraying or other forms of direct contact.
The aim of this study was to investigate the potential for exposure of sailors to
contaminants via drinking water. On Navy ships and Army small ships, potable
water was produced from evaporative distillation of surrounding estuarine
water. This water would have had variable salinity and amounts of suspended
solids. It may have also contained contaminants in solution.
The study was carried out in two phases. First, the co-distillation of organic
pollutants such as dioxins along with water in ship’s distillation units was
examined. Phase One results of this study demonstrated that:
• Co-distillation of organochlorine pesticides and dioxins was observable in
all experiments conducted;
• In pure or saline water, between 75% and 95% of 2,3,7,8-TCDD was co-
distilled with the first 10% of water distilled. Thus, distillation results in
an increase in the contaminant concentration in the distillate;
Watervolatility of PCDD/Fs
6
• The tendency of several other organochlorines to co-distill was greater
than for TCDD. For dioxins a tendency of decrease in co-distillation with
increasing molecular mass was apparent. Hepta- and octachlorinated
dioxins showed little tendency to enrich in the distilled water;
• A compounds’ co-distillation decreased with increasing levels of
suspended solids in the water. This can be attributed to the increase in
sorption (fugacity) capacity in the source water. At a highest level of 1.44
g total suspended solids in the water about 38% of 2,3,7,8-TCDD co-
distilled in the first 10% of water distilled. Nevertheless, even at these
relatively high levels of suspended solids, TCDD was enriched by almost a
factor of 4 in the distillate (assuming only 10% of the water is distilled);
• Co-distillation of dioxins and organochlorines from water collected from
the Brisbane River (water was added to known amount of chemicals of
interest) demonstrated that the process is reproducible using estuarine
water. In these samples 48 – 60% of the TCDD co-distilled within the
first 10% of distilled water.
Overall, Phase One of the study clearly demonstrated that if source water is
contaminated, co-distillation is a process which can result in the contamination
of ships water supplies with chemicals such as dioxins.
In Phase Two of the study the investigations included the potential co-distillation
of the Agent Blue component dimethylarsenic acid, which is now known to be a
potent carcinogen.
In addition, experiments were carried out in which the capacity for de-novo
synthesis of dioxins from the main components of Agent Orange was evaluated.
Evaporative distillation entails heating of the source water using copper
elements. Combustion of the components of Agent Orange has great potential to
produce dioxins. Moreover, copper (which formed part of the distillation unit) is
a known catalyst for dioxin formation.
Watervolatility of PCDD/Fs
7
Finally exposure calculations were carried out for personnel on board ships.
These calculations were based on some of the first analytical results from fish
samples that were caught during the early 1970’s in contaminated waters from
Vietnam and analysed in the 1970’s for TCDD.
Phase Two results of this study were:
• Dimethylarsenic acid does not co-distill at significant levels during
evaporation and thus the drinking water on board of RAN ships was
unlikely to be contaminated with dimethylarsenic acid;
• No de-novo synthesis of TCDD or any other dioxins from the other
components of Agent Orange was detected under the experimental
conditions. However, the copper element on board ships was probably
significantly hotter than in the simulation experiments selected in the
laboratory, and thus these results should not be used as absolute evidence
that such a formation did not occur in the distillation units of the RAN
ships;
• TCDD exposure via drinking water may have been substantial, and it is
likely that solely the consumption of drinking water resulted in exposure
levels that exceeded the recommended Total Monthly Intake (TMI) values
for TCDD of 70 pg / kg bw / month significantly. A TMI of 70 pg/kg bw /
month is a level set by many European authorities; it is also the level
proposed by the draft recommendation of the National Health and
Medical Research Council in Australia.
Overall the findings of this study demonstrate that evaporative distillation of
water does not remove but rather enriches certain contaminants such as dioxins
in drinking water. The study provides some evidence that use in the distillation
process of water contaminated with TCDD would result in contamination of
potable water. Subsequent ingestion by sailors on board ships (as well as

Watervolatility of PCDD/Fs
8
soldiers and airmen, who were passengers) is thus a vector for exposure to these
chemicals.
While it is unlikely that accurate exposure of the personnel on board ships can
be estimated, the study findings suggest that the personnel on board ships were
exposed to biologically significant quantities of dioxins. This may explain some
of the epidemiological findings in this study group.

Watervolatility of PCDD/Fs
9
INTRODUCTION
Studies undertaken by the Australian Government have indicated that Australian
Vietnam veterans experience greater than expected mortality (Crane et al., 1997a) and
that when mortality of two cohorts of conscripted veterans are compared, greater
relative mortality (Crane et al., 1997b). Subsequent studies have revealed validated
elevation in certain types of cancer in the veterans, and in their children, small
increases in some birth defects and the rate of deaths, particularly suicide (AIHW,
1999).
The highest elevation in mortality was among veterans of the Royal Australian Navy,
rather than the land and air forces (Crane et al., 1997a). Uncertainty remains as to
whether this increase in mortality is related to the use of “Agent Orange”
contaminated with polychlorinated dibenzodioxins and dibenzofurans (PCDD/Fs). In
addition to “Agent Orange” and various other Agents that contained dioxin impurities,
“Agent Blue” was the third most commonly used herbicide. It consisted of an
aqueous solution of dimethylarsenic acid (DMA), or more commonly cacodylic acid.
DMA was sprayed primarily in crop destruction missions (50%) or was used in the
control of grasses around base perimeters. Recent research has demonstrated that
DMA is a carcinogen itself (for details see Ng 2002, attached in Appendix II) and
hence in Phase 2 this project was expanded to include preliminary evaluation of
exposure to DMA.
A starting point of the study was that elevated levels of mortality were found in
sailors. These sailors were never present in the areas where “Agent Orange” or any
other Agents were directly employed for defoliation. Hence, prior to this study it was
assumed that the significantly higher incidences of mortality observed in this cohort
could not be related to the use of defoliants.
However, marine vessels such as the troop carrier and supply vessel HMAS Sydney
served for substantial periods in estuarine waters in Vietnam and relied on collection
of potentially contaminated estuarine water, which was then distilled for drinking.
According to personnel on these ships a common procedure was to produce and store
Watervolatility of PCDD/Fs
10
drinking water from the relatively turbid estuaries, while the distilled water that was
produced in open sea was primarily used for the boilers of the vessel’s steam engines.
In the general population, exposure of humans to PCDD/Fs is attributed primarily to
the consumption of contaminated food (e.g. Beck et al., 1989, Liem et al., 2000).
This is due to the physico-chemical properties of these chemicals including their
hydrophobicity and persistence and the resulting accumulation of these chemicals in
lipophilic compartments of plants (Müller et al., 1997) and animals (McLachlan, 1996
1997).
These physico-chemical properties and in particular the exceptionally high sorption
coefficients and very low solubility of PCDD/Fs in water are factors which reduce the
risk of contamination of surface and ground water. Environmental fate models, as
well as experimental evidence, suggest that consumption of contaminated water is a
pathway which can safely be neglected in the calculation of exposure of humans to
these compounds (Hattemer-Frey & Travis, 1989; Fürst, 1998, Liem et al., 2000).
However, in supply ships and other vessels which regularly visited the conflict areas
in Vietnam, the water consumed by the crew has an unusual history. It was often
collected from near-shore marine waters that received runoff from areas which had
been sprayed with Agent Orange and Agent Blue. To make this water suitable for
drinking and other purposes aboard ship the water was distilled aboard.
Evaporative distillation is a process that is suitable for obtaining water which is
relatively free from salts and other high boiling components with a high water
solubility. However, in contrast to their high sorption coefficient, both experimental
data and models have indicated that the Henry’s Law constant of chemicals such as
dioxins is sufficient to allow desorption from natural water surfaces (i.e. Lyman et al.,
1990). It seems feasible that co-distillation could occur during the distillation process
on the marine vessels.
The aim of the study was to undertake laboratory experiments which provide
information to assess whether PCDD/Fs and also DMA can co-distill in significant
quantities in the distillation units of ships. Further, the study aimed to evaluate

Watervolatility of PCDD/Fs
11
potential exposure of PCDD/Fs to personnel aboard ships. The results are useful for
an assessment of exposure pathways of PCDD/Fs to crew and troops aboard ships
which regularly loaded sea water for distillation and subsequent consumption.
MATERIALS AND METHODS
Distillation Experiments with Dioxins and other Organochlorines
The project’s goal was to identify whether significant quantities of potentially harmful
chemicals may have co-distilled into drinking water in the ships which transported
Australian Troops during the Vietnam conflict. The distillation plants used on the
various ships at the time of the conflict all operated using the same principles. In
general, sea water was fed into an evaporator where the water was boiled by a
combination of heating and reduced pressure (vacuum) and the vapour was condensed
in the condenser from where it was pumped into feed tanks (Figure 1). A detailed
description of the operation and function of the distilling plants of ships is given in
Naval Marine Engineering Practice Vol 1 (1959). The aim of this project was to
reproduce the distillation plants principal processes in the laboratory and to assess the
potential for co-distillation of chemicals in the distillation unit. Ultimately, this has
provided information that allows us to evaluate the potential for contamination of
drinking water from distillation of contaminated sea water.
Chemicals Tested
Agent Orange, the key defoliant used during the Vietnam conflict was contaminated
with up to ~ 45 ppm of 2,3,7,8-TCDD and traces of 1,2,3,7,8-PeCDD (Young et al.
1978 quoted in IoM, 1999). It has been estimated that a total of 368 pounds of dioxin
were sprayed in Vietnam over a six-year period (Gough, 1986 quoted in IoM, 1999).
Although the defoliants did not usually contain relevant levels of any of the other
2,3,7,8-chlorine substituted PCDD/Fs, the study was extended to include a range of
other 2,3,7,8-chlorine substituted PCDD/F congeners as well as the relatively
nontoxic 1,2,3,4-TCDD and a range of organochlorine pesticides including DDT,
HCB, lindane and dieldrin. This extension of the compound group allowed us to
assess physico-chemical properties which govern the water volatility of lipophilic
Watervolatility of PCDD/Fs
12
organic chemicals and thus to predict water volatility for compounds which have not
been studied here. In addition to the chemicals that were tested in Phase 1 of the
project, we undertook further studies in Phase 2 of the project using DMA. A list of
the chemicals used, including physico-chemical properties, is provided in Table 1.

Watervolatility of PCDD/Fs
13
Laboratory Distillation Plant
For the purpose of this study a commercially available rotary evaporator (Büchi,
Switzerland) was used. Discussions with seamen and mechanics who served on RAN
vessels during the conflict made certain that the principles by which solvents are
evaporated in rotary evaporators were essentially the same as those used in the Naval
Vessel Distillation Plants. Rotary evaporators such as the one used in this study
essentially function as a batch evaporator. The water to be distilled is contained in a
round bottomed flask with a seal which fits to the steam duct which leads the water
vapour into the condensing chamber (Figure 2). The flask is lowered into a water
bath which is maintained at the temperature of interest (in this study we used 58o C
which is similar to that used in the distillation plants of the ships). In the condensing
chamber, chilled water runs through a condenser coil and the water which condenses
on the coils is collected in a solvent collection flask. The rotary evaporators are
equipped with a pump, which is controlled through a vacuum control unit that allows
accurate control of the vacuum during evaporation of the solvent. For the purpose of
this study, the vacuum in the unit was set initially to 14 kPa (about 14 % of
atmospheric pressure) and then slowly decreased until boiling of the water was
observable. Water was then carefully evaporated since it was important to avoid non-
vapour water containing the chemicals transferring through the condenser to the
collection chambers (‘bumping’).
Distillation Experiments - Variations of Parameters
We studied the process through a series of experiments in which experimental
parameters or compounds were altered. The key parameters which were altered were
salinity of the water and quantity of suspended solids in the water.
For the experiments one litre round bottom flasks were cleaned with toluene and
acetone and once they were dry, were spiked with a solution of the chemicals of
interest. The round bottom flask was slowly swirled to coat the interior surface and to
allow the solvent to evaporate. Once the solvent had evaporated, 1 L of reversed
osmosis water (RO-water) was added and, depending on the variant of the
experiment, known quantities of NaCl and/or sediment were added to the sample.

Watervolatility of PCDD/Fs
14
The round bottom flasks were then sealed, wrapped in aluminum foil and put on a
shaker for at least one week so that the chemicals could equilibrate between the
surface of the round bottom flask and the water.
.
EvaporatorEvaporator
CondenserCondenser
SteamSteam
SeawaterSeawater
CoolingCoolingwaterwater FreshwaterFreshwater
VapourVapour
BrineBrine
Naval Marine Engineering Practice Volume I, 1959
EvaporatorEvaporator
CondenserCondenser
SteamSteam
SeawaterSeawater
CoolingCoolingwaterwater FreshwaterFreshwater
VapourVapour
BrineBrine
Naval Marine Engineering Practice Volume I, 1959
Figure 1: Schematic diagram of the distillation unit on board RAN vessels
Figure 2: Schematic representation of the laboratory distillation unit
Cooling waterout
Cooling waterout
CondenserCondenser
EvaporatorEvaporator
FreshwaterFreshwaterSeawaterSeawaterSeawater
Cooling waterin
Cooling waterin
Cooling waterout
Cooling waterout
CondenserCondenser
EvaporatorEvaporator
FreshwaterFreshwaterSeawaterSeawaterSeawater
Cooling waterin
Cooling waterin

Watervolatility of PCDD/Fs
15
Table 1: List of chemicals used in the experiment, Molar mass, Henry’s Law constantand water solubility data compiled from Mackay et al. 1992, Windholz, 1983,Paasivirta et al., 1999 and reviews by Huelster, 1994, Mueller, 1997, Cavanagh 2000and IARC, 1987.
Compound Molarmass(g)
VapourPressure*
(Pa)
Aqueoussolubility
H (Pa m3
mol-1)Spikedamount
ng/L
RRT
HCB 284.8 0.0023 5 ug/L 131 100 0.36
Lindane 290.8 7-213 E-4 2.2 – 10 mg/L 0.005-1.5 100 0.50
Heptachlor 373.3 0.2 – 0.5 6 – 200 ug/L 18-233 100 0.54
Heptachlorepoxide - 3.5-450 E-4 20-200 ug/L 2-4.3 100 0.59
Aldrin 364.9 0.0008-0.75 10-200 ug/L 1.4-91 100 0.73
Dieldrin 380.9 0.2-9 E-4 20-2000 ug/L 0.02-5.8 100 0.82
DDT 354.5 0.2 – 20 E-4 1-460 ug/L 0.86-7.3 200 0.86
DDE 318.1 1.7 – 10 E-4 1-55 ug/L 0.8-124 200 0.98
DDD 320.1 1-9 E-4 2-160 ug/L 0.27-9 200 1.02
2,3,7,8-TCDD (D4) 322.0 1.2 – 6.2E-4 8-200 ng/L 3.347 40 0.99
1,2,3,4-TCDD 322.0 6.38E-6 640 ng/L 3.8 8.6 1.14
1,2,3,7,8-PeCDD 356.4 4.23E-6 120 ng/L a 0.266 40 1.18
1,2,3,4,7,8-HxCDD 391.0 1.45E-6 4.4 ng/L 1.084 40 1.36
1,2,3,4,6,7,8-HpCDD 425.2 1.77E-7 2.4 ng/L 1.273 40 1.61
OCDD 460.0 1E-10 - 9 E-7 0.074-0.4 ng/L 0.684 60 1.96
2,3,7,8-TCDF 306.0 1.2 – 2E-4 419 ng/L 1.461 40 1.00
1,2,3,7,8-PeCDF 340.4 1.72E-5 236 ng/Lb 0.505 40 1.14
1,2,3,6,7,8-HxCDF 374.9 3.08E-6 17.7 ng/L 1.454 37 1.31
OCDF 443.8 5.0 E-10 1.4 ng/L 0.191 61 1.95
DMA 138.0 n.a. but low 2 kg/kg n.a. butvery low
1000n.a.
RRT was calculated from retention times on a DB1 column; *vapour pressure data representsubcooled liquid vapour pressure’s; a for 1,2,3,4,7-PeCDD; bfor 2,3,4,7,8-PeCDF

Watervolatility of PCDD/Fs
16
For the volatilization study, the rotary evaporator was disassembled and all sections
which could come into contact with the chemicals were thoroughly cleaned to avoid
contamination of the samples. In order to determine the quantity of water which had
been distilled, the mass of the collection flask was determined before the start of the
experiment. The temperature was controlled through a water bath which was set to
580 C as described in the manual for the ships distillation unit. In all experiments the
goal was to slowly distill a fraction of the water and evaluate the amount of dioxins
and organochlorines which co-distilled. Although in the initial proposal it was only
proposed to analyze one distillate it was decided to distill two fractions, a first fraction
of about 10 % of the water and a second fraction with about a further 30 % of the
water. For the distillation process the round bottom flask was attached to the rotary
evaporator and the vacuum in the system was increased until about 13 - 14 % of
atmospheric pressure (14 kPa) was reached. The flask was rotated to increase the
surface area of the water to be distilled and to avoid ‘bumping’. Chilled water (100C)
was circulated through the condenser unit. The experiment was carefully observed
over the first few minutes until the water temperature in the flask had increased to the
assigned temperature to avoid ‘bumping’. Once the system temperature had
equilibrated the vacuum was carefully decreased to a pressure which resulted in a
slow and steady distillation of the water. Markings on the collection flask allowed a
rough assessment of the quantity which had been distilled and in the distilled fraction
1 (F1) about 10 % of the water and in the distilled fraction 2 (F2) a further 30 % of the
water was collected (For details of the collected fraction see Appendix I Table 3.).
Following the distillation of the first fraction F1, the inside of the condenser unit of
the rotary evaporator was rinsed with RO water which was added to the F1 fraction.
Once the second fraction, F2, was distilled the inside of the rotary flask was rinsed
with about 10 mL of acetone followed by dichloromethane, both of which were added
to F2.
Following the distillation the various fractions F1, F2 as well as the remaining non-
distilled water (R) were transferred into separating funnels and subjected to liquid-
liquid partitioning using dichloromethane and hexane. The nonpolar fractions were
combined and concentrated to a small volume (< 500 µl). In the preliminary
Watervolatility of PCDD/Fs
17
experiment and Expt.1 the samples were quantitatively transferred into 50 µl
microvial inserts, concentrated under a gentle stream of nitrogen to almost dryness
and filled with 15 µl of toluene.
For Experiment 2 it was decided to include a clean-up step using H2SO4 and KOH
impregnated silica gel in series in a Pasteur pipette. Samples were eluted using
hexane, the hexane was evaporated and the samples were transferred into vials,
concentrated and filled with toluene as described above.
Since it was of great relevance to this study to detect congeners in all three fractions
(F1, F2 and R) to undertake the mass balance type approach we decided to use the
most sensitive tool available for this study. The fact that known quantities of
standards were added allowed the use of gas chromatography coupled to electron
capture detection where the sample was injected onto columns of varying polarity.
The results from the experiment indicated that mass spectrometric quantification was
sufficiently sensitive for this study. Hence further analysis of PCDD/Fs and
organochlorines were performed on a Gas Chromatograph (DB-5 fused silica column,
30 m, 0.25 mm i.d., 0.24 µm film thickness) interfaced to a quadropole mass
spectrometer operating in selective ion monitoring mode. Organochlorines and
PCDD/Fs were identified using retention times in the standard solution and evaluation
of correct isotope ratios M+ and M2+. Quantification was undertaken by external
calibration against some standard used to spike the samples. (Note that the study did
not require absolute quantification of the concentrations since the aim was to evaluate
the relative proportions of the chemicals of interest in various fractions of the
distillate.)
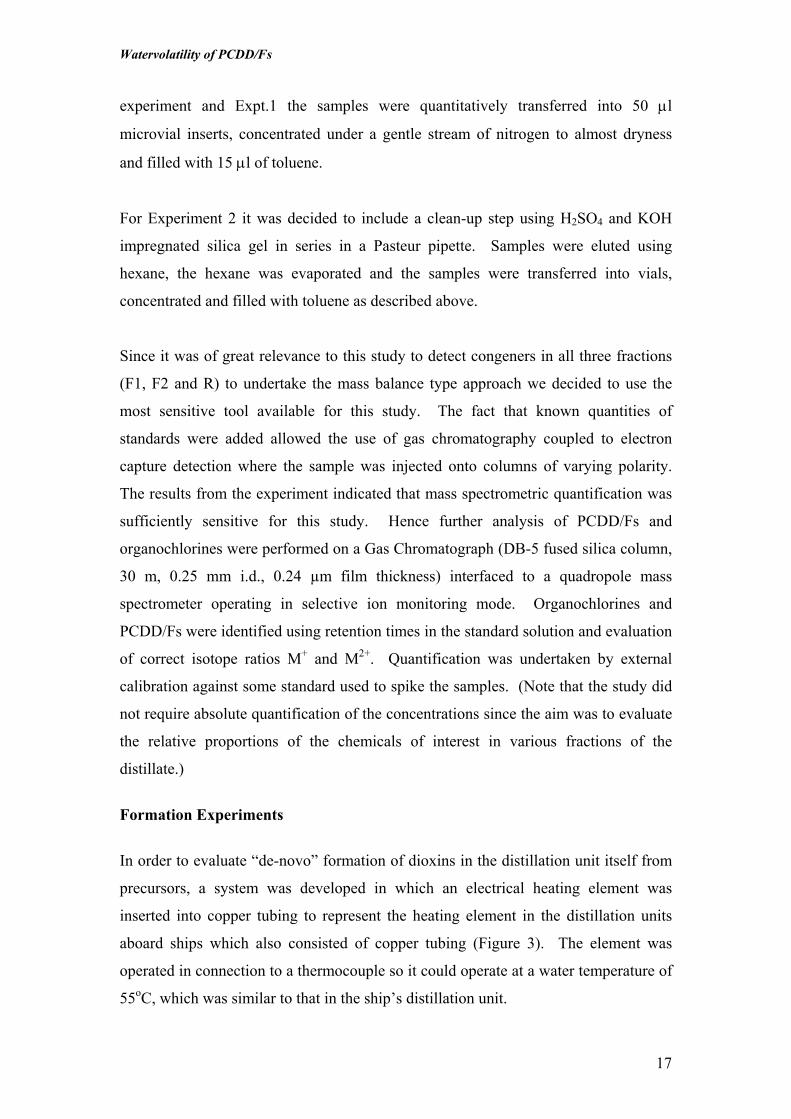
Formation Experiments
In order to evaluate “de-novo” formation of dioxins in the distillation unit itself from
precursors, a system was developed in which an electrical heating element was
inserted into copper tubing to represent the heating element in the distillation units
aboard ships which also consisted of copper tubing (Figure 3). The element was
operated in connection to a thermocouple so it could operate at a water temperature of
55oC, which was similar to that in the ship’s distillation unit.

Watervolatility of PCDD/Fs
18
The copper coated element was then mounted at an angle into glass jars that were
specifically designed to allow the element to be sealed inside while a condenser was
mounted onto the top to make certain that the distilled water was reused in the flask.
The formation experiments were conducted using the Agent Orange components
2,4,5-T and/or 2,4-D, which could act as a precursor for formation of TCDD and
PeCDD. In the formation experiment, empty flasks were spiked with precursors, then
RO water and additionally 30 g NaCl was added to obtain a salinity level similar to
that of an outer estuary. The water was then equilibrated for 5 days or more. The
copper coated heating element and thermocouple were then inserted into the solution
and the opening sealed with Teflon tape. Finally, the condenser was inserted into the
top of the flasks and the thermocouple was set at 55oC in the outer periphery of the
flask. The formation experiments were carried out for 12 hours. In addition to the
test samples, blank samples containing 2,4,5-T and/or 2,4-D were added to water but
not heated, and a blank consisting only of water were also included.
Watervolatility of PCDD/Fs
19
1. Temperature Controller
2. Condenser
3. Teflon Seal
4. Thermometer
5. Copperheader
Figure 3: Experimental set-up of the formation experiments. Agent Orange
components were spiked into the glass vessel and heated up using the copper coated
heating element.
Watervolatility of PCDD/Fs
20
RESULTS AND DISCUSSION
Blanks – Distillation Experiments
The series of blanks included in the study were: undistilled RO water, RO water with
suspended solids, NaCl and water from the Brisbane River. These were analysed
together with fractions F1, F2 and R. None of the compounds of interest were
detected in any of the “blank” samples which were not spiked with the SPIKE
standards used.
Co-distillation of Dioxins and Organochlorines from Pure Water
In Experiment 1 the emphasis was on evaluating the distillation method of RAN
vessels and to determine whether co-distillation is observable. This was initially
tested in the simplest experimental configuration where organochlorine pesticides and
dioxins were added to a flask, equilibrated with RO water and then the sample was
distilled. In the first experiment 14.1 % of the water was distilled and the distilled
water was analysed for the compounds initially added. For this initial experiment the
remaining water was analysed but either due to loss of the compounds, during the
extraction, interferences and/or absence of the compounds no significant quantities
could be detected in the second distillate and the remaining fraction. The results are
thus comparable with a water sample which was spiked and equilibrated but not
distilled and where the compounds were re-extracted from the initial water sample.
The results of the first distillation experiment are shown in Figure 4. These results
clearly demonstrated that organochlorines and dioxins have the potential to co-distill
relatively rapidly. Overall, the relative quantity of the chemicals of interest in the
initially distilled fraction, compared with the concentration in the non-distilled water,
ranged from 113 % to about 13 % (Appendix I, Table 1). Co-distillation was greatest
for the organochlorine pesticides and lower chlorinated PCDD/Fs. These initial results
suggested that almost the entire quantity of chemicals such as hexachlorobenzene or
gamma hexachlorohexane and about 73- 85 % of the DDTs co-distilled with the first
14 % of water. For the polychlorinated dibenzodioxins and dibenzofurans there was a

Watervolatility of PCDD/Fs
21
trend to decrease co-distillation with increase in chlorine number. Interestingly in this
first experiment 2,3,7,8-tetrachlorodibenzodioxin, the most toxic of all PCDD/Fs and
the main contaminant in Agent Orange, was found at about 85 % of the quantity
observed in the nondistilled samples and thus co-distilled the most. In contrast only
about 10 – 20 % of the hepta- and octachlorinated PCDD/Fs were found in the
distilled fractions in the first experiment.
2378
-TC
DF
2378
-TC
DD
1234
-TC
DD
1237
8-Pe
CD
F
1237
8-Pe
CD
D
1236
78-H
xCD
F
1234
78-H
xCD
D
1234
678-
HpC
DD
OC
DF
OC
DD
0
25
50
75
100
Compound
% o
f com
poun
d di
still
edw
ith
14 %
of w
ater
Figure 4: Co-distillation of organochlorines from pure RO water when 14 % (141 mL
of 1000 mL) was distilled. The values represent the quantity in the samples distillate
relative to the total quantity in a control of spiked but non-distilled water.

Watervolatility of PCDD/Fs
22
Effect of Salinity on Co-distillation of Organochlorines
The effect of salinity on co-distillation was assessed in Experiment 1 by evaluating
the co-distillation of dioxins and organochlorines at varying NaCl concentrations. In
addition to the control (with no NaCl) 15 and 30 mg/L NaCl treatments were distilled
after the equilibration period and the different fractions analysed. As observed in
DVA1-1, DVA1-2 and DVA1-3 organochlorines distilled very quickly and were
largely associated with the initial fraction of the distilled water
(Appendix I, Table 1). This was also the case for 2,3,7,8-TCDD of which ~ 95 and 87
% were found in F1 of DVA1-2 and DVA1-3 respectively. In order to compare the
results, the relative fraction of the chemicals co-distilled in the first fraction were
plotted against the relative retention times (RRT) of the chemicals on a DB5 capillary
GC column where the reference value of 1 was attributed to 2,3,7,8-
tetrachlordibenzofuran (See Table 1) (Note that the RRT of chemicals were
determined in Experiment 1 and can be related to physico-chemical properties of the
compounds of interest such as water solubility or vapour pressure, both of which are
likely to influence the water volatility of hydrophobic organic chemicals
significantly). Due to uncertainties in the accurate determination of the most relevant
physico-chemical properties which govern water volatility (i.e. water solubility,
vapour pressure or in combination as Henry’s Law Constants) the authors have not
plotted co-distillation against these properties although it is clear that these govern the
water volatility. To avoid the process of selecting the “best” value from the literature
the authors have decided to use the RRT which is an easily obtainable measure and is
also related to the relevant physico-chemical properties of compounds. Overall the
organochlorines have a RRT less than 1, and the RRT of PCDD/Fs increases with
increasing molar mass).

Watervolatility of PCDD/Fs
23
0.5 1.0 1.5 2.00
50
100
DVA1-2DVA1-3
DVA1-1
RRT
% c
o-di
still
ed w
ith
firs
tFr
acti
on
Figure 5: Plot of the relative retention times of organochlorines and PCDD/Fs versus
the % co-distilled in F1 at various NaCl concentrations (DVA1-1: 0g NaCl L-1;
DVA1-2: 15g NaCl L-1 ; DVA1-3: 30 g NaCl L-1)
The data obtained in Experiment 1 were not suitable to quantify the effect of salinity
on the co-distillation of the compounds of interest (Figure 5). The differences would
be observed best with the compounds which did not rapidly co-distill but overall
showed a good tendency for co-distillation. Unfortunately, interferences in the
chromatogram from DVA1-3 (30g NaCl per litre) did not allow us to interpret the
data from those compounds. Further uncertainties arose from differences in the
amount of water which was distilled at the three NaCl levels. The interpretation was
complicated by the fact that some chemicals such as the organochlorines of interest or
lower chlorinated PCDD/Fs volatilise relatively quickly and are thus depleted in the
remaining water phase (R). Therefore, the quantity which co-distills decreases with
longer distillation times. In contrast, chemicals such as the heptachlorinated
dibenzodioxins and octachlorinated dibenzodioxins and dibenzofurans concentrate in
the R phase with ongoing distillation and a slight increase of co-distillation with
increasing distillation can be expected. In order to evaluate this, a second fraction F2
was distilled in addition to the first fraction F1. The ratio of F1 to F2, normalised to
the amount of water distilled, provides an indication of the extent to which co-
distillation is decreasing/increasing with increasing distillation of the water.
Chemicals for which co-distillation is more rapid than the distillation of water and

Watervolatility of PCDD/Fs
24
which are thus depleted should be relatively enriched in F1 compared to F2. A plot of
the RRT versus the ratio of F1/F2 demonstrates that with increasing RRT the ratio
decreases from > 40 for chemicals such as HCB and approaches 1 for the higher
chlorinated PCDD/Fs (Figure 6). This suggests that most chemicals investigated were
already depleted during the distillation of F2 and only the higher chlorinated
PCDD/Fs have lower concentrations in the distilled water than in the source water if
the sorption compartment in the water (i.e. organic matter and suspended solids) is
very low.
1
10
0.0 0.5 1.0 1.5 2.0
1
10
RRT
(F1/
H2O
F1)/
(F2
/ H2O
F2)
Figure 6: Plot of the relative retention times of organochlorines and PCDD/Fs versus
the ratio of chemical co-distilled in F1 and F2 normalised to the respective water
amount distilled (log 10 scale). Data from DVA2-9 with 30 g NaCl L-1 and no TSS
added.
An alternative way to analyse the results from the co-distillation study is to compare
the fraction of chemical, as % of the total, that was distilled in F1 (F1/(F1+F2+R) to
the co-distilled fraction of the chemical in F2 (i.e. F2/(F2+R)). The data from
DVA2-9, for example, indicate that co-distillation of those chemicals which do
deplete relatively quickly is enhanced in F1 when the results are expressed on a
volume basis (Figure 7). The reason for this behaviour is unclear at this stage but
may suggest that some of the chemical are sorbed to the surface of the glass and the
Watervolatility of PCDD/Fs
25
lower relative co-distillation percentage in the second fraction is the result of kinetic
limitation of desorption from the surface.
0.5 1.0 1.5 2.0
100
1
10
F2/(F2+R)F1/(F1+F2+R)
RRT
Frac
tion
co-
dist
illed
per
80 m
L
Figure 7: Plot of the relative retention times of organochlorines and PCDD/Fs versus
the fraction of chemical co-distilled in F1 and F2 respectively – both normalised to a
water volume of 80 mL (10 % of total water used in Expt 2). Data from DVA2-9
with 30 g NaCl L-1 and no TSS added.
Despite these uncertainties it is noteworthy that an increase rather then a decrease in
the co-distillation of chemicals with higher RRT was observable with an increase in
salt concentration which is in agreement with the thermodynamics of mixtures and
their colligative properties associated with increase in the boiling point of water.
Effect of Sorption Compartments in the Water on Co-distillation of Chemicals
To study the effect of extra sorption compartments in the water on the co-distillation
of the chemicals of interest, a sample (DVA1-4) was spiked and equilibrated with a
known concentration of total suspended sediments (TSS) (0.2 g L-1) and 20 g NaCl
L-1. Inclusion of a new sorption compartment in the system resulted in a decrease in
co-distillation compared with samples DVA1-1 – DVA-3. However the results from
DVA1-4 with a 0.2 g TSS L-1 sorption compartment showed that significant quantities
of the individual compounds can co-distill (see Figure 8).

Watervolatility of PCDD/Fs
26
2378
-TC
DF
2378
-TC
DD
1234
-TC
DD
1237
8-Pe
CD
F
1237
8-Pe
CD
D
1236
78-H
xCD
F
1234
78-H
xCD
D
1234
678-
HpC
DD
OC
DF
OC
DD
0
20
40
60
80
100
F1 (0-165 ml)F2 (166-508 ml)R (492 ml Rest)
Co-
dist
illed
Fra
ctio
n
Figure 8: Quantity of PCDD/F congeners co-distilled from water containing 0.2 g
total suspended sediment.
The results of the first experiment provided the first indication that suspended solids
in the water will affect co-distillation. The main focus of Experiment 2 was to
investigate the effect of TSS in the water on the co-distillation of hydrophobic organic
chemicals. For the purpose of Experiment 2 water samples were spiked with total
suspended sediment to give 0, 0.16, 0.48 and 1.44 g TSS L-1. Then, in accordance
with Experiment 1, samples were equilibrated for at least 2 weeks and about 10 %
(F1) and an additional 30 % (F2) fractions of the water were distilled from the
samples as described above.
Again, in all treatments, significant co-distillation was observed. However, the data
indicated a trend of decreasing co-distillation with an increase in the TSS (Figures 9).
For example, the co-distillation of 2,3,7,8-TCDD with F1 ranged from about 90 % in
one of the control treatments to which no TSS was add to about 38 % in the sample
with 1.44 g TSS L-1. Furthermore the results suggest that the effect of TSS on co-
distillation is compound-specific with a trend of decreasing effect of TSS on co-
distillation efficiency (i.e. the slope of the curve decreases) with increasing compound

Watervolatility of PCDD/Fs
27
RRT (Figure 10). However, the linear regression models using the data set in
Appendix I, Table 2, which have been obtained from the linear regression lines
demonstrate that if any difference in effect between compounds is observable, the
effect of TSS on a decrease in co-distillation is greatest for the higher molar mass
chemicals such as OCDD or TCDD (i.e. the linear regression models in Table 2,
Appendix I, predict that for DDTs or tetra- and pentachlorinated PCDD/Fs an increase
in TSS concentration from 0.5 to 1.5 g L-1 will result in a decrease in co-distillation in
F1 by about 30-50 % compared to 55 – 70 % decrease for hepta- and octachlorinated
PCDD/Fs).
1.0 1.5 2.00
20
40
60
800.16 g/L TSS0.48 g/L TSS
No TSS added
1.44 g/L TSS
No TSS added
RRT
% c
o-di
still
ed w
ith
firs
tFr
acti
on
Figure 9: Plot of the relative retention times of organochlorines and PCDD/Fs versus
the fraction of chemical co-distilled in F1 at different amounts of total suspended
sediments (TSS). Data from DVA2-5 - DVA2-9
Watervolatility of PCDD/Fs
28
0.0 0.5 1.00
25
50
75
100
DDEDDDDDTF4D4-1D4-2
F5D5F6D6D7F8D8
TSS (ug/L)
% in
F1
Figure 10: Co-distillation of DDTs and PCDD/Fs from natural estuarine water as a
function of total suspended sediments. Data from DVA2-5 - DVA2-9.
At this point co-distillation of organochlorines and PCDD/Fs was investigated in
samples which were prepared in the laboratory from pure water and chemicals. To
finally confirm these effects, a comparison of these results was made with estuarine
water samples. Water was collected from the Brisbane River and a known volume of
this water was added to a known quantity of organochlorines and PCDD/Fs, mixed
and equilibrated for 4 weeks on a shaker in the laboratory (Note that a blank of the
river water was also analysed, but no chemicals of interest were detectable). Again
co-distillation of organochlorines and PCDD/Fs was clearly observable in both
samples. Between 48 and 62 % of the 2,3,7,8-TCDD was co-distilled with the first 10
% of the distilled water (Figure 11).

Watervolatility of PCDD/Fs
29
1.0 1.5 2.00
20
40
60
80
RRT
% c
o-di
still
ed w
ith
firs
tFr
acti
on
2,3,7,8-TCDD
Figure 11: Plot of the relative retention times of organochlorines and PCDD/Fs
versus the mean percentage of co-distilled chemicals observed in F1 using water
samples collected from the Brisbane River Estuary.

Watervolatility of PCDD/Fs
30
Phase II – Evaluation of Co-distillation of Dimethylarsenic Acid – Agent Blue.
Background to Agent Blue – dimethyl arsenic acid (DMA)
Properties and environmental fate of DMA: In phase 2 of the project the focus was to
evaluate co-distillation of Agent Blue, better known as dimethylarsenic acid (DMA)
or cacodylic acid. DMA has been and is still used as a contact herbicide. It is still used
in some countries such as the U.S.A. as a defoliant in cotton cultivation but also for
weed control in areas which are not used for crop production (i.e. around buildings,
fences, and in forest management).
Compound Properties
DMA - C2 H7 AS O2 (62) MW: 138.0
Colorless crystals (pure compound). The
technical grade is 65% pure, sodium
chloride being one impurity (62).
MELTING POINT: 192-198oC (pure
compound) (62); 200oC (pure chemical)
SOLUBILITY: 2 kg/kg water at 25oC
(pure compound) (62).
Dimethyl arsenic acid
DMA is a polar compound, highly soluble in water but practically insoluble in organic
solvents. It is a clear yellowish-tan liquid. In Vietnam about 4.4 million liters (1.12
Mil.Gallons) of Agent Blue were used between 1962-1971. Interestingly, Agent Blue
was used for different purposes than Agent Orange. About 50 % of the Agent Blue
was used for crop destruction missions where it was the agent of choice for the
destruction of rice crops. The remaining 50 % of Agent Blue was used around base
perimeters and was applied by helicopters or ground vehicles (Young et al. 1978
quoted in IoM, 1999). Agent Blue is most effective against grassy plants and acts by
absorbing moisture from leaves (desiccation). The application of Agent Blue is
usually in the range of 4.5 – 9 litres per acre; for tall grasses, much higher doses were
used because of the large foliage masses. According to the pesticide manual DMA is
quickly adsorbed on soil particles and ion exchange sites and thus inactivated upon
soil contact. Microbial degradation in the soil is considered to be the key process for
loss of DMA from the soil with 15-80% of DMA being lost in 8 months. On the other
Watervolatility of PCDD/Fs
31
hand, DMA is practically non-volatile and degradation through UV radiation is not a
relevant loss process.
Toxicology of DMA:
The authors of this study are not experts on the toxicity of DMA and therefore asked
Dr Jack Ng, the leader of the Metals and Metalloids Toxicity program at ENTOX and
an expert on arsenic toxicity, to provide a review of DMA and arsenic toxicity to this
report. This review is beyond the scope of this report and therefore provided as an
appendix (Appendix II). The report is provided here but remains the intellectual
property of Dr Ng.
Result of the DMA Distillation Experiment
In this study we investigated whether in addition to Agent Orange contaminants,
Agent Blue may also co-distil and thus drinking water contaminated with DMA may
be a relevant exposure pathway. For the purpose of this study DMA (approximately 1
µg) was placed in a flask and RO water added. The solution was equilibrated as
previously. Three distilled fractions (10 %, 10-30% and 30-90%) as well as the non-
distilled fractions were analysed using ICPMS.
No DMA or only trace levels of DMA, detectable as arsenic, was found in any of the
distilled fractions. In contrast the non-distilled fractions required dilution prior to
analysis since they contained the now concentrated DMA. Since DMA is a very
polar compound with extremely low vapour pressure and high water solubility this
result was in agreement with the working hypothesis that DMA should not co-distill.
This result suggests that DMA is unlikely to have been consumed in substantial
quantities through drinking water that was produced by distillation.
A further issue is that DMA, unlike Agent Orange, was apparently used primarily for
crop destruction and around army bases and not for the defoliation of mangrove areas.
Hence at this point it seems less likely that DMA from the spraying of Agent Blue
contributed significantly to the direct exposure of RAN members on board ships. An
exception, however, may be the potential contamination of food (and in particular
fish) and fresh water that was obtained from Vietnam. At this point some uncertainty

Watervolatility of PCDD/Fs
32
persists to whether food was obtained in significant quantities from Vietnam for
supply on board navy ships.
Formation Study
Formation of PCDD/Fs from Agent Orange components could not be measured in the
water with the present experimental set-up. This aspect of the experimental studies
was not fully satisfactory. The 2,4,5-T used for the experiment was contaminated
with PCDDs which complicates the interpretation of the results (i.e. we would have to
evaluate an increase of TCDD concentration which is much more difficult than the
appearance of a practically non-existent compound). Secondly, there were problems
with determining suitable spiking volumes of Agent Orange components as well as
with the standard solutions for elution. Finally, a key problem of this section of the
study was that the temperature of the surface of the copper in the distillation unit on
board ship was probably about 110 oC while the copper element in the laboratory
experiments were set to heat the water to 60 oC (which is equivalent to the water
temperature in the distillation units on ships). While we can draw few conclusions
from the formation experiments to date we aim to set-up new experiments in near
future in which we hope to resolve most of the problems that disallow any valid
conclusion from this part of the study.
Watervolatility of PCDD/Fs
33
Preliminary Estimation of Dioxin Exposure Uptake by Sailors from Water
A key goal of this study was to attempt an evaluation of exposure of the RAN
personnel aboard ship on duty in Vietnam by consumption of contaminated water as
well as from other potential pathways. The following assessment should only be seen
as a preliminary attempt as still many of the input factors remain uncertain. Firstly,
we have attempted to estimate exposure directly through the consumption of distilled
water. Due to the lack of information on water concentrations of PSDD/Fs from the
period and at sites of interest, we attempted to calculate water concentrations from
concentrations in fish from Vietnam waters taken during the relevant period
(Baughman and Meselson, 1973).
The TCDD concentration in fish described by Baughman and Meselson (1973), gives
an estimate of the fish lipid concentration (2.5 %) and experimentally determined
fish-water bioconcentration factors are available (Loonen et al. 1994). A best estimate
suggests that the TCDD water concentration in the Vietnam waters where Baughman
and Meselson ‘s fish were exposed were in the range of 0.04 – 0.7 ng/L.
The distillation experiments carried out in the present study show that, if we assume
that about 50 % of the water is distilled and the rest is discharged, distillation would
result in an enrichment of TCDD by about a factor of 2 (i.e. 0.08 – 1.4 ng/L). Recent
information suggests that possibly only 5-10 % of the water was distilled which
would increase this enrichment factor to approximately 10-20, depending on the TSP
of the water.
We assumed that on average sailors consumed on average 5 L of this water per day.
The direct consumption of this water would lead to a daily body burden of about 0.4 –
7 ng/day. The water was also used to prepare food and as a result of the hydrophobic
character of the dioxins the TCDD would also accumulate in the food. Hence we may
estimate that the total exposure due to water contaminating food was similar to that of
the direct consumption of drinking water – another 0.4 – 7 ng/day.

Watervolatility of PCDD/Fs
34
Table 2: Exposure Model Input Parameter including uncertainty.
Literature
values used
Estimated
Uncertainty
Reference
A Concentration of TCDD in fish 49 – 1020
ng/kg FW
Large > 10 Baughman &
Meselson, 1973
B Estimated fish lipid content to
calculate fish lipid based
concentration
2.5 % 2-4 Mueller et al.
1997
C Estimated fish lipid based
concentration C=A*100/B
2.8 – 44
ug/kg lipid
See col. A &
B
D Bioconcentration factor
(fish lipid- water)
81000-
170000
Medium –
less 5 – 10
Loonen et al.
1994
E Calculated water concentration
upper estimate using E=C/D$
0.043 – 0.69
ng / L water
Large > 10
F Enrichment factor from
distillation assuming 50 %
water is distilled
2# Low (<2) This study
G Period for which water was
distilled during period in
Vietnam Waters
14 days Low (<5) Personal
Communication
RAN
H Daily portion of water directly
consumed by RAN members
5 L Low (<2) Personal
Communication
RAN$Note that the density of the fish lipid was assumed to be 1 kg/L thus the values in Care directly transformed to a per L lipid basis.#Likely to be substantially underestimated according to recently acquired information.Probably 10 is more appropriate.
Watervolatility of PCDD/Fs
35
Now it is important to estimate the overall exposure period. According to reports
from RAN personnel the rule on board ship was to produce drinking water primarily
during the periods when the ship was in the turbid estuarine water since the water was
less pure and could have caused potential damage to the engines if used in boilers.
While in the pristine water offshore the distillation units produced water primarily for
the ships engine. Hence the drinking water that was produced during the periods in
contaminated waters lasted for a significant portion of the return trip. If we assume
that a 14 days reserve was produced during such a trip, the total body burden of
dioxin through direct consumption of water that originated from distilling in
Vietnamese waters are estimated to be between about 10 ng to 190 ng per journey.
For a 70 kg person the body burden would be in the range of 12 - 200 pg / kg bw per
day for a 14 day period in addition to the background exposure through TCDD and
other dioxin-like chemicals in the food and the environment (It should be noted that
the late 1960s and the early 1970s were probably the peak exposure periods for these
chemicals and the body burden of the population was thus already substantially higher
than at present).
The uncertainty of these exposure assessment figures is relatively large. The key
uncertainties are related to the concentration in the fish and the calculation of the
water concentration from these fish data. Since the anchorage of the Australian RAN
ships near Van Tau were in the vicinity of a large mangrove region that was regularly
sprayed with Agent Orange, it is likely that the water concentrations at the anchorage
were higher than those predicted from the fish data.
Comparison of Exposure Data with Effects
While it is beyond the scope of this study to evaluate effects of dioxin exposure in
RAN members it is of interest to put the exposure data into some perspective relative
to current guidelines and observable effect values. At present (2002) a series of
intake criteria are applied by WHO and various committees in Europe and the key
difference in the guidelines are the exposure period over which the intake value is
calculated. In principle the WHO has targeted a daily intake of 2 pg TEq/kg bw per
day whereas other European committees have expressed their values on weekly
exposure (14 pg kg bw per week) or a monthly value (70 pg kg bw per month). In

Watervolatility of PCDD/Fs
36
terms of risk assessment it is reassuring that various committees developed very
similar values despite following different methods for establishing these intake
values. On the other hand these guidelines are all based on a similar range of
toxicological studies where animal studies and biochemical markers were used to
obtain low observable effect levels for the various endpoints (van Leuuwen 2001, oral
presentation at NRCET) (Table 3). Australia’s NHMRC has recently distributed a
document in which the value of 70 pg per kg bw per month was recommended for
adoption in Australia.
A notable exception to these agreements in international guidelines for dioxin
exposure in humans is the approach taken by the US-EPA who established a
recommended guideline which is more than 2 orders of magnitude lower than the
values set by the WHO/ICPS and various European committees. The US-EPA have
concluded in their recent dioxin-reassessment document that the dioxin background
contamination which is in the range of 0.5 – 2 pg per kg bw per day at the present
may pose a significant cancer risk between 10-2 – 10-3.
In comparison, the exposure of the RAN members from water related sources may
have been 12-200 pg /kg bw /day or 360 – 6000 pg / kg bw / month. This indicates
that in addition to normal background exposure, RAN members may have received
exposure which is one to two orders of magnitude above the acceptable intake values
and at a level above the observed effect levels in experimental animals (Table 3).

Watervolatility of PCDD/Fs
37
Table 3: Animal body burdens and related estimated human daily intake (EHDI)
(Table from van Leeuwen, presentation at NRCET, August 2001)
Table 4: Acceptable intake guidelines of dioxin-like chemicals. Comparison between
the standards for human intake of dioxins, furans and dioxin-like PCBs agreed by
WHO (1998), EC-SCF (2001) and FAO/WHO (2001).
Standard pg / kg bw / day pg / kg bw / week pg / kg bw / month
WHO consultation(1998)
1-4 (7-28) (30- 120)
EC-SCF (2001) (2) 14 (60)
FAO/WHO (2001) (2.3) (16) 70Exposure values in brackets were calculated for the other periods for easiercomparison.
Response Maternal body Human EDI burden (ng/kg bw) (pg/kg bw 1 day)
Rats
Decreased sperm counts 28 14
Immune suppression 50 25
Genital malformations 73 37
Monkeys
Neurobehavioural effects 42 21
Endometriosis 69 35

Watervolatility of PCDD/Fs
38
CONCLUSION
This study evaluated the potential for co-distillation of organic pollutants by ship
distillation units.
This study clearly demonstrated that distillation of water contaminated with
hydrophobic chemicals such as dioxin-like chemicals of organochlorine pesticides
results in contamination of the distilled water. The extent of co-distillation largely
depends on the physico-chemical properties of the compounds of interest. 2,3,7,8-
Tetrachlorodibenzodioxin, the primary contaminant in Agent Orange, the defoliant
used in the Vietnam conflict, co-distils relatively rapidly and thus will be enriched in
the distilled water. Other PCDD/Fs with up to six chlorine substitutions as well as all
organochlorine chemicals investigated also have the tendency to enrich in the distilled
water when compared to the source water.
A relationship between physico-chemical properties and co-distillation is apparent
since with increasing relative retention time the tendency for co-distillation decreased.
The effect of salinity on co-distillation could not be determined, but the studies
indicated that suspended particles or a sorption compartment in the water reduced the
tendency for co-distillation. However, enrichment of TCDD in the distilled water was
still high at 1.4 g TSS L-1. The same was found for water which originated from the
Brisbane River Estuary which suggests that co-distillation of such chemicals is highly
likely.
During this study, it was noted that evaporative distillation is widely used through the
world. Based on the results of this study, the authors strongly recommend that for a
prevention of contamination of all who consume water produced by evaporative
distillation it should be made certain that the source water used to be distilled does not
contain volatile or semivolatile hydrophobic pollutants. If this cannot be guaranteed
we recommend the use of a post-distillation purification step such as a sorption phase
that removes such contaminants. (Activated charcoal or carbon filters would be
suitable for this purpose.)

Watervolatility of PCDD/Fs
39
REFERENCES
AIHW – Australian Institute of Health and Welfare. 1999. Morbidity of Vietnam
veterans: A study of the health of Australia’s veteran community. Vol 3:
Validation Study. AIHW, Canberra.
Baughman, R., and M. Meselson. 1973. An analytical method for detecting TCDD
(Dioxin): Levels of TCDD in samples from Vietnam. Environmental Health
Perspective 5: 27-35.
Beck, H, K Eckart, W Mathar, and R Wittkowski. 1989. PCDD and PCDF body
burden from food intake in the Federal Republic of Germany. Chemosphere
18, no. 1-6: 417-24.
Cavanagh, JE. 2000. Organochlorine Insecticide Usage in the Sugar Industry of the
Herbert and Burdekin River Regions: chemical, biological, and risk
assessments. Unpublished thesis, James Cook University, Australia.
Crane, PJ, DL Barnard, KW Horsley and MA Adena. 1997a. Mortality of Vietnam
Veterans: the veteran cohort study. A report of the 1996 retrospective cohort
study of Australian Vietnam veterans. Department of Veterans’ Affairs,
Canberra. ISBN 0 642 27098 8
Crane, PJ, DL Barnard KW Horsley and MA Adena. 1997b. Mortality of National
Service Vietnam Veterans. A report of the 1996 retrospective cohort study of
Australian Vietnam veterans. Department of Veterans’ Affairs, Canberra.
ISBN 0 642 38363 X.
EC-SCF – EC Health and Consumer Protection Directorate-General. 2001. Opinion of
the Scientific Committee on Food on the Risk Assessment of Dioxins and
Dioxin-like PCBs in Food. (Update based on new scientific information
available since the adoption of the SCF Opinion of 22nd November 2002).
European Commission, Brussels, Belgium, Document CS/CNTM/DIOXIN/20
final. Adopted on 30 May 2001.
FAO/WHO. 2001. 57th JECFA Meeting, Rome, 5-14 June 2001: Summary and
Conclusions, Annex 4, pp24-40.
Watervolatility of PCDD/Fs
40
Fürst, P. 1998. Dioxine in Lebensmittel. Handbuch Dioxine. 1st ed., Ed. M. Oehme,
227-66. Heidelberg: Spektrum Akademischer Verlag.
Hülster, A. 1994. Transfer von polychlorierten Dibenzo-p-dioxinen und
Dibenzofuranen (PCDD/PCDF) aus unterschiedlich stark belasteten Böden in
Nahrungs-und Futterpflanzen. Verlag Ulrich E. Grauer, Germany.
IARC – International Agency for Research on Cancer. 1997. IARC Monographs on
the Evaluation of Carcinogenic Risks to Humans Vol 69. Polychlorinated
dibenzo-p-dioxins and polychlorinated dibenzofurans. World Health
Organisation, France.
IoM – Institute of Medicine 1999. Veterans and Agent Orange, Update 1998.
Washington DC, USA, National Academy Press.
Hattemer-Frey, H. A., and Travis C.C. 1989. Comparison of human exposiure to
dioxin from municipal waste incineration and backgroun environmental
contamination. Chemosphere 18, no. 1643-649.
Liem, D. A. K., P. Fuerst, and C. Rappe. 2000. Exposure of populations to dioxins
and related compounds. Food Additives and Contaminants 17, no. 4: 241-59.
Loonen, H, JR Parsons and HAJ Govers. 1994. Effect of sediment on the
bioaccumulation of a complex mixture of polychlorinated dibenzo-p-dioxins
(PCDDs) and polychlorinated dibenzofurans (PCDFs) by fish. Chemosphere
28, no. 8: 1433-1446.
Lyman, WJ, WF Reehl and DH Rosenblatt. 1990. Handbook of chemical property
estimation methods. Washington DC USA: American Chemical Society.
Mackay, D, W Shiu, and KN Ma. 1992. Illustrated handbook of physical-chemical
properties and environmental fate for organic chemicals Vol 1. Monoaromatic
hydrocarbons chlorobenzenes and PCBs, Lewis Publisher, Chelsea, Mi, USA.
McLachlan, MS. 1997. A simple model to predict accumulation of PCDD/Fs in an
agricultural food chain. Chemosphere 34, no. 5-7: 1263-76.

Watervolatility of PCDD/Fs
41
McLachlan, MS. 1996. Biological uptake and transfer of polychlorinated dibenzo-p-
dioxins and dibenzofurans. Issues in Environmental Science and Technology.
Number 6 ed., R. E. Hester, and R M Harrison, 31-52. Vol. 6. Cambridge UK:
The Royal Society of Chemistry.
Müller, JF. 1997. Occurrence and Distribution Processes of Semivolatile Organic
Chemicals in the Atmosphere and Leaves. Unpublished thesis, Griffith
University, Australia.
Müller, JF, MS McLachlan, DW Hawker, and DW Connell. 1997. Bioconcentration
of persistent semivolatile hydrophobic chemicals in the vegetation/atmosphere
system. In: Ecological Issues and Environmental Impact Assessment. Ed.
Cheremisinoff P.N., 421-42. Houston, Texas, USA: Gulf Publishing.
Naval Marine Engineering Practice, Vol 1. 1959. Ch 12: Auxiliary Machinery. Her
Majesty’s Stationery Office, London.
Paasivirta, J, S Sinkkonen, P Mikkelson, T Rantio, F Wania. 1999. Estimation of
vapor solubilities and Henry’s law constants of selected persistent organic
pollutants as functions of temperature. Chemosphere 39, no. 5: 811-832.
van Leuuwen RFX. August 2000. Health Risk Assessment of dioxins. Oral
presentation at the National Research Center for Environmental Toxicology
(NRCET), Queensland, Australia.
Windholz, M (Ed). 1983. The Merck Index: An encyclopedia of chemicals, drugs and
biologicals. Merck & Co. Inc, United States of America.
WHO – World Health Organisation. 1998. Assessment of the health risks of dioxins:
re-evaluation of the tolerable daily intake (TDI). Executive Summary of the
WHO Consultation, May 25-29, Geneva, Switzerland.

Watervolatility of PCDD/Fs
42
APPENDIX I

Watervolatility of PCDD/Fs
44
Appendix Table 1: Relative quantity of organochlorines and PCDD/Fs. Blue shaded areas mark uncertainty with peaks due to interferences and broad peaks,yellow shaded areas – sample not quantifyable and result based on average of total in other samples – (F2+R)
Blank DVA1-10 NaCl; 0 TSS
DVA1-215 g/L NaCl; 0 TSS
DVA1-330 g/L NaCl; 0 TSS
DVA1-430 g/L NaCl; 0.2 g/L TSS
F1 R F1 R F1 F2 R F1 F2 R
Distilled amount 141 629 92 620 161 343 496 165 343 492
HCB ND 114 ND 100 0 91 9 0 NA NA NA
Lindane ND 93 ND 100 0 69 31 0 NA NA NA
Heptachlor ND 101 ND 100 0 100 0 0 NA NA NA
Aldrin ND 82 3 100 0 100 0 0 NA NA NA
Heptachlorepox. ND 102 1 100 0 94 6 0 NA NA NA
DDE ND 81 ND 96 4 87 11 2 NA NA NA
dieldrin ND 88 ND 100 0 100 0 0 NA NA NA
DDD ND 85 ND 100 0 83 16 1 NA NA NA
DDT ND 73 ND 100 0 85 14 1 NA NA NA
2,3,7,8-TCDF ND 79 5 79 21 84 11 5 25 37 38
2,3,7,8-TCDD ND 85 3 95 5 87 9 3 17 34 49
1,2,3,4-TCDD ND 51 10 65 35 82 11 7 28 43 29
1,2,3,7,8-PeCDF* ND 46 15 48 52 80 0 20 20 7 73
1,2,3,7,8-PeCDD* ND 42 NQ 40 60 84 0 16 14 14 72
1,2,3,6,7,8-HxCDF ND 40 NQ 24 76 65 14 21 6 33 61
1,2,3,4,7,8-HxCDD ND 34 NQ 18 82 57 17 26 7 30 63
1,2,3,4,6,7,8-HpCDD ND 20 NQ 6 94 45 18 37 2 23 75
OCDF ND 16 NQ 3 97 42 12 47 1 16 82
OCDD ND 13 NQ 1 99 40 6 54 1 11 88

Watervolatility of PCDD/Fs
45
Experiment 2DVA2-3
30 g/L NaCl; 0 TSSDVA2-4
Brisbane RiverDVA2-5
Brisbane RiverDVA2-6
0.2 g TSS L-1; 30 g NaCl
F1 F2 R F1 F2 R F1 F2 R F1 F2 R
Distilled amount 78 231 491 64 233 503 84 239 509 84 492
HCB
Lindane
Heptachlor
Aldrin
Heptachlorepox. 46 54 0
DDE 89 9 2 61 29 11 68 13 19 50 27 22
dieldrin
DDD 82 17 1 58 38 4 75 21 4 70 30 0
DDT 88 11 2 62 38 0 64 21 15 24 35 41
2,3,7,8-TCDF 84 9 7 48 36 16 62 18 20 49 29 22
2,3,7,8-TCDD 91 7 3 56 34 10 74 14 12 55 32 13
1,2,3,4-TCDD 78 10 12 46 36 18 57 15 27 38 28 34
1,2,3,7,8-PeCDF* 74 13 13 34 40 26 50 18 33 29 33 38
1,2,3,7,8-PeCDD* 68 15 17 33 40 27 48 16 35 29 30 41
1,2,3,6,7,8-HxCDF 60 17 22 23 36 41 41 13 46 18 26 56
1,2,3,4,7,8-HxCDD 56 18 26 22 35 43 40 12 48 19 25 56
1,2,3,4,6,7,8-HpCDD 28 14 58 10 19 70 19 4 77 14 11 75
OCDF 22 14 64 7 11 82 15 3 82 9 6 84
OCDD 8 7 85 3 5 92 2 2 96 13 4 84Shaded columns – due to interferences no quantification could be performed in this sample – the % are calculated assuming the mean recovery from DVA2-3 and DVA-4.

Watervolatility of PCDD/Fs
46
DVA2-730 g/L NaCl; 0.60 g TSS L-1
DVA2-830 g/L NaCl; 1.8 g TSS L-1
DVA2-930 g/L NaCl; 0 g TSS L-1
F1 F2 R F1 F2 R F1 F2 R
Distilled amount 86 219 495 75 238 487 115 233 452
HCB
Lindane
Heptachlor
Aldrin
Heptachlorepox.
DDE 63 26 11 36 36 29 71 16 13
dieldrin
DDD 64 29 7 34 42 24 75 19 7
DDT 58 31 12 16 46 38 47 20 33
2,3,7,8-TCDF 47 33 20 34 31 35 67 18 15
2,3,7,8-TCDD 64 24 12 38 36 26 75 12 13
1,2,3,4-TCDD 36 33 31 29 29 43 51 26 23
1,2,3,7,8-PeCDF* 31 33 36 21 26 54 46 28 27
1,2,3,7,8-PeCDD* 25 34 41 18 24 58 41 26 32
1,2,3,6,7,8-HxCDF 16 26 58 10 14 76 29 25 46
1,2,3,4,7,8-HxCDD 14 28 58 9 16 74 25 23 53
1,2,3,4,6,7,8-HpCDD 5 13 82 4 9 87 8 9 83
OCDF 3 7 90 3 7 91 6 8 86
OCDD 1 5 94 2 5 93 2 3 95
Watervolatility of PCDD/Fs
47
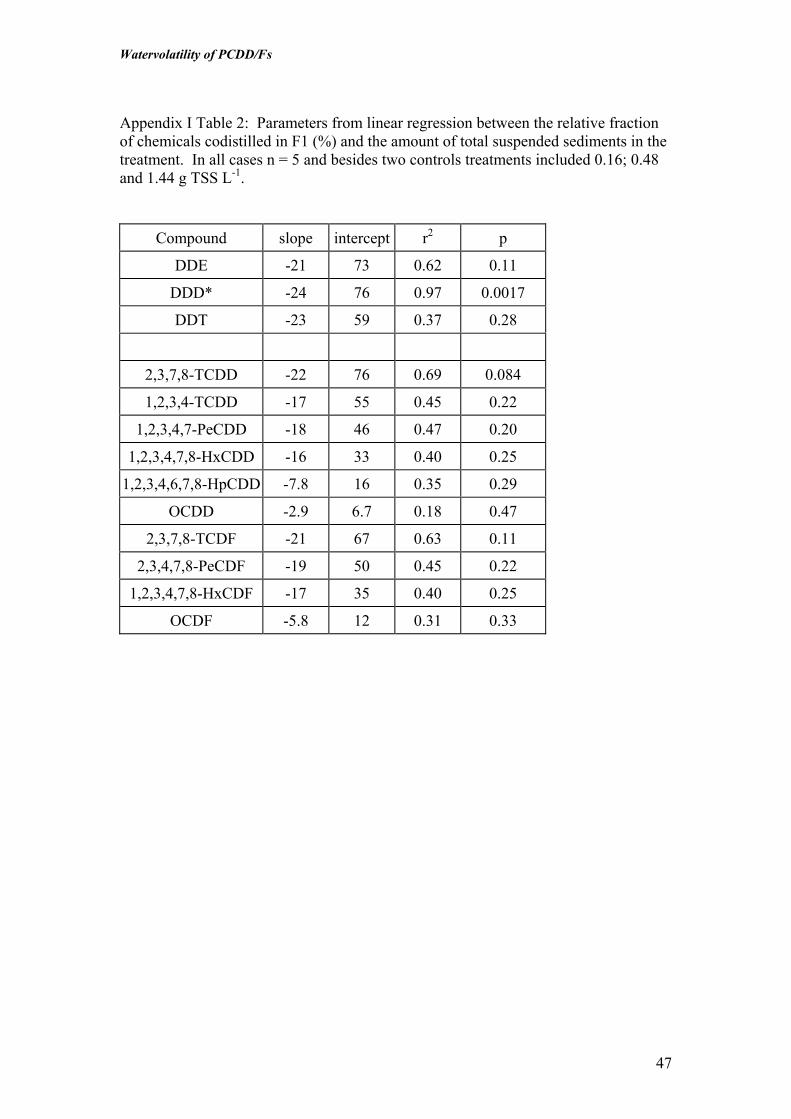
Appendix I Table 2: Parameters from linear regression between the relative fractionof chemicals codistilled in F1 (%) and the amount of total suspended sediments in thetreatment. In all cases n = 5 and besides two controls treatments included 0.16; 0.48and 1.44 g TSS L-1.
Compound slope intercept r2 p
DDE -21 73 0.62 0.11
DDD* -24 76 0.97 0.0017
DDT -23 59 0.37 0.28
2,3,7,8-TCDD -22 76 0.69 0.084
1,2,3,4-TCDD -17 55 0.45 0.22
1,2,3,4,7-PeCDD -18 46 0.47 0.20
1,2,3,4,7,8-HxCDD -16 33 0.40 0.25
1,2,3,4,6,7,8-HpCDD -7.8 16 0.35 0.29
OCDD -2.9 6.7 0.18 0.47
2,3,7,8-TCDF -21 67 0.63 0.11
2,3,4,7,8-PeCDF -19 50 0.45 0.22
1,2,3,4,7,8-HxCDF -17 35 0.40 0.25
OCDF -5.8 12 0.31 0.33

Watervolatility of PCDD/Fs
48
Appendix I Table 3: Experimental set-up for distillation experiments includingquantity of water distilled with each fraction (in mL)
F1 F2 Rest
Experiment 1 – Total Volume 1000 mL
Expt 1: (DVA-1 0- B0) RO Blank Combined
Expt 1: (DVA-1-Bl1) RO – Blank 107 893 (Combined)
Expt 1: (DVA-1-Bl2) RO + TSS Blank Combined
Expt 1: (DVA-1-V1) RO + SPIKE 141 230 629
Expt 1: (DVA-1-V2) RO + 15 g NaCl + Spike 92 288 620
Expt 1: (DVA-1-V3) RO + 30 g NaCl + Spike 161 343 496
Expt 1: (DVA-1-V4) RO + 30 g NaCl + 0.2 g TSS +SPIKE 165 259 575
Expt 1: (DVA-1-R) RO + 30 g NaCl + 0.2 g TSS +SPIKE Combined for recovery
Experiment 2 – Total Volume 800 mL
Expt.2 (DVA-2-1) RO + 24 g NaCl – BLANK 70 280 450
Expt.2 (DVA-2-2) Brisbane River – BLANK 65 230 505
Expt.2 (DVA-2-3) (RO+24 g NaCl+SPIKE) 78 231 491
Expt.2 (DVA-2-4) (Brisbane River + SPIKE) 64 233 503
Expt.2 (DVA-2-5) (Brisbane River + SPIKE) 84 239 477
Expt.2 (DVA-2-6) (RO+24 g NaCl+ 0.16 g TSS + SPIKE) 86 225 489
Expt.2 (DVA-2-7) (RO+24 g NaCl+ 0.48 g TSS + SPIKE) 86 219 495
Expt.2 (DVA-2-8) (RO+24 g NaCl+ 1.44 g TSS + SPIKE) 75 238 487
Expt.2 (DVA-2-9) (RO+24 g NaCl+ 0 g TSS + SPIKE) 115 233 348

Watervolatility of PCDD/Fs
49
Appendix I Table 4: Summary of Experimental variations
Preliminary Expt Experiment 1 Experiment 2
Water used RO-Water RO-Water RO-Water
Brisbane RiverWater
Salinity 0 g NaCl L-1 0 g NaCl L-1
15 g NaCl L-1
30 g NaCl L-1
0 g NaCl L-1
30 g NaCl L-1
Total suspendedsolids
0 g L-1 0 mg L-1
200 mg L-1
0 mg L-1
200 mg L-1
600 mg L-1
1800 mg L-1
Compounds used OC Pesticides Dioxins and OCpesticides
Dioxins and OCpesticides
Clean-up None None Minicolumn
InstrumentalAnalysis
GC-ECD GC-ECD and GC-MS
GC-MS
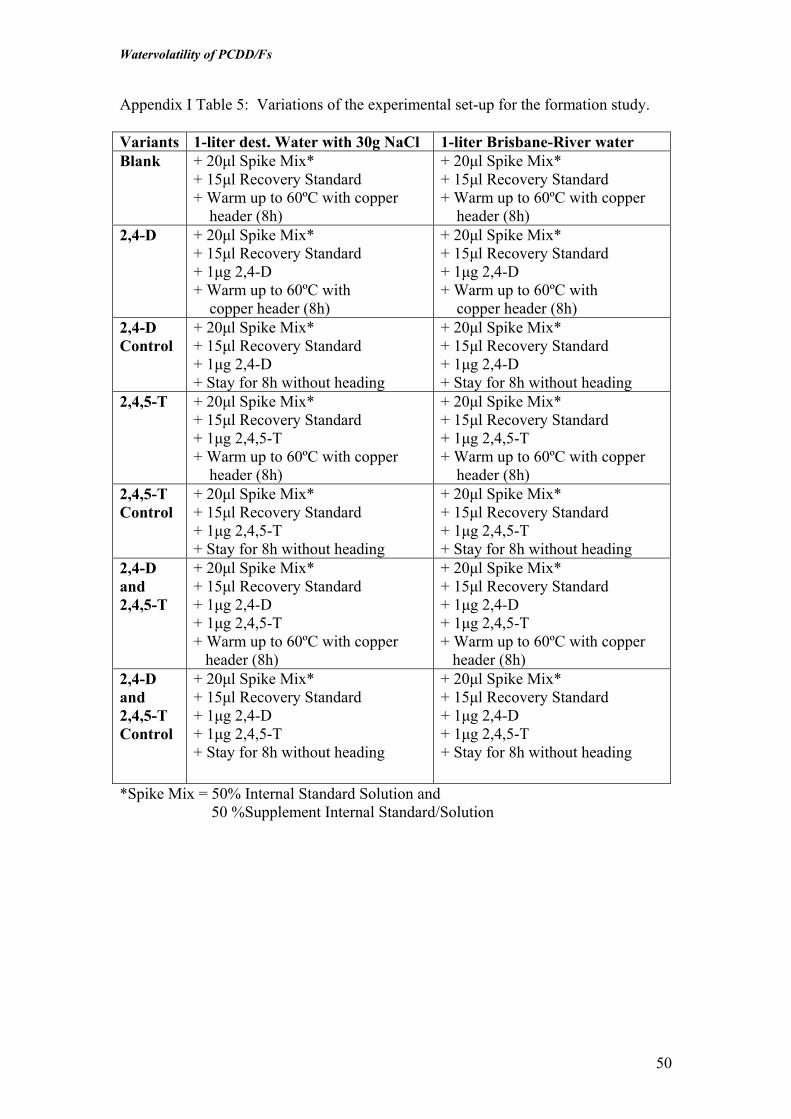
Watervolatility of PCDD/Fs
50
Appendix I Table 5: Variations of the experimental set-up for the formation study.
Variants 1-liter dest. Water with 30g NaCl 1-liter Brisbane-River waterBlank + 20µl Spike Mix*
+ 15µl Recovery Standard+ Warm up to 60ºC with copper header (8h)
+ 20µl Spike Mix*+ 15µl Recovery Standard+ Warm up to 60ºC with copper header (8h)
2,4-D + 20µl Spike Mix*+ 15µl Recovery Standard+ 1µg 2,4-D+ Warm up to 60ºC with copper header (8h)
+ 20µl Spike Mix*+ 15µl Recovery Standard+ 1µg 2,4-D+ Warm up to 60ºC with copper header (8h)
2,4-DControl
+ 20µl Spike Mix*+ 15µl Recovery Standard+ 1µg 2,4-D+ Stay for 8h without heading
+ 20µl Spike Mix*+ 15µl Recovery Standard+ 1µg 2,4-D+ Stay for 8h without heading
2,4,5-T + 20µl Spike Mix*+ 15µl Recovery Standard+ 1µg 2,4,5-T+ Warm up to 60ºC with copper header (8h)
+ 20µl Spike Mix*+ 15µl Recovery Standard+ 1µg 2,4,5-T+ Warm up to 60ºC with copper header (8h)
2,4,5-TControl
+ 20µl Spike Mix*+ 15µl Recovery Standard+ 1µg 2,4,5-T+ Stay for 8h without heading
+ 20µl Spike Mix*+ 15µl Recovery Standard+ 1µg 2,4,5-T+ Stay for 8h without heading
2,4-Dand2,4,5-T
+ 20µl Spike Mix*+ 15µl Recovery Standard+ 1µg 2,4-D+ 1µg 2,4,5-T+ Warm up to 60ºC with copper header (8h)
+ 20µl Spike Mix*+ 15µl Recovery Standard+ 1µg 2,4-D+ 1µg 2,4,5-T+ Warm up to 60ºC with copper header (8h)
2,4-Dand2,4,5-TControl
+ 20µl Spike Mix*+ 15µl Recovery Standard+ 1µg 2,4-D+ 1µg 2,4,5-T+ Stay for 8h without heading
+ 20µl Spike Mix*+ 15µl Recovery Standard+ 1µg 2,4-D+ 1µg 2,4,5-T+ Stay for 8h without heading
*Spike Mix = 50% Internal Standard Solution and 50 %Supplement Internal Standard/Solution

Watervolatility of PCDD/Fs
51
APPENDIX II:

Watervolatility of PCDD/Fs
52
Appendix II A REVIEW OF ARSENIC TOXICITY
Dr. Jack C. Ng, 2002
National Research Centre for Environmental Toxicology (EnTox), The University of
Queensland.
For further information: [email protected]
Sources of arsenic in the environment
Arsenic is an element that occurs widely in rocks, soil, water, air, plants, and animals.
Arsenic ranks 20th in abundance in the earth’s crust (Cullen et al., 1989). Arsenic is a
ubiquitous element. The crust of the earth contains about 2mg/kg of arsenic and is
highest at 620mg/kg in it’s deep inside core (Zheng, 1994). Arsenic is a metalloid
exhibiting chemical and physical properties of both metallic and non-metallic nature.
There are three kinds of arsenic derivatives with the color of grey, yellow and black
respectively. Grey arsenic is also called metallic arsenic and is both a fine thermo-
conductor and electro-conductor and relatively stable at normal temperatures (Wang,
1997). Arsenic can show either electro-positive or electro- negative valence in its
compounds. The valencies of arsenic are 0, -3, 3 and 5. Although arsenic is found in
nature to a small extend in its elemental form, it occurs mostly as inorganic and
organic compounds in either the As (III)(+3) or As (V) (+5) valency state, as in AsF3 and
AsF5 (Welch et al.,1988). Arsenic gains three electrons and forms AsH3 (Arsine)
when reacted with hydrogen, but loses three or five electrons in forming As2O3 or
As2O5. These two forms of arsenic are inorganic species and are the forms most
prevalent in water (Irgolic, 1994; Clifford et al., 1994; USEPA, 2000).
There are numerous natural sources as well as anthropogenic activities that may
introduce arsenic into food and drinking water. The primary natural sources of arsenic
include geological formations such as rocks, soil, and sedimentary deposits,
geothermal activity, and volcanic activity. These contribute to the regional
background base level of arsenic and to abnormal geochemical arsenic conditions in
some local areas. The major present and past sources of arsenic distribution
influenced by human activities include the use of arsenic in wood preservatives,
agricultural uses (including the use as pesticides), industrial uses, mining and smelting
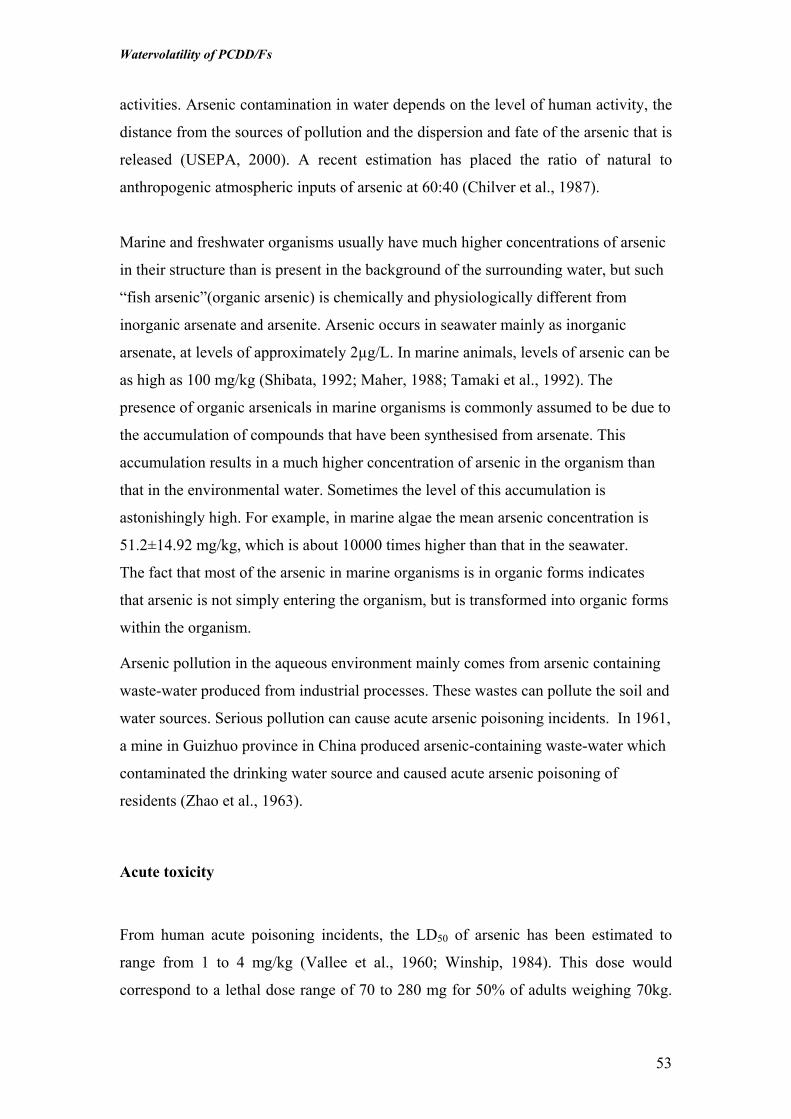
Watervolatility of PCDD/Fs
53
activities. Arsenic contamination in water depends on the level of human activity, the
distance from the sources of pollution and the dispersion and fate of the arsenic that is
released (USEPA, 2000). A recent estimation has placed the ratio of natural to
anthropogenic atmospheric inputs of arsenic at 60:40 (Chilver et al., 1987).
Marine and freshwater organisms usually have much higher concentrations of arsenic
in their structure than is present in the background of the surrounding water, but such
“fish arsenic”(organic arsenic) is chemically and physiologically different from
inorganic arsenate and arsenite. Arsenic occurs in seawater mainly as inorganic
arsenate, at levels of approximately 2µg/L. In marine animals, levels of arsenic can be
as high as 100 mg/kg (Shibata, 1992; Maher, 1988; Tamaki et al., 1992). The
presence of organic arsenicals in marine organisms is commonly assumed to be due to
the accumulation of compounds that have been synthesised from arsenate. This
accumulation results in a much higher concentration of arsenic in the organism than
that in the environmental water. Sometimes the level of this accumulation is
astonishingly high. For example, in marine algae the mean arsenic concentration is
51.2±14.92 mg/kg, which is about 10000 times higher than that in the seawater.
The fact that most of the arsenic in marine organisms is in organic forms indicates
that arsenic is not simply entering the organism, but is transformed into organic forms
within the organism.
Arsenic pollution in the aqueous environment mainly comes from arsenic containing
waste-water produced from industrial processes. These wastes can pollute the soil and
water sources. Serious pollution can cause acute arsenic poisoning incidents. In 1961,
a mine in Guizhuo province in China produced arsenic-containing waste-water which
contaminated the drinking water source and caused acute arsenic poisoning of
residents (Zhao et al., 1963).
Acute toxicity
From human acute poisoning incidents, the LD50 of arsenic has been estimated to
range from 1 to 4 mg/kg (Vallee et al., 1960; Winship, 1984). This dose would
correspond to a lethal dose range of 70 to 280 mg for 50% of adults weighing 70kg.

Watervolatility of PCDD/Fs
54
At non-lethal, but high acute doses, inorganic arsenic can cause gastroenterological
effects, shock, neuritis (continuous pain) and vascular effects in humans (Buchanan,
1962).
Although certain arsenic compounds are toxic to humans, others are not. The toxicity
of arsenic varies greatly with its chemical species, and its toxicity has a strong
relationship with the status of arsenic in the component: inorganic arsenic is believed
to be more toxic than organic arsenicals (Kaise et al., 1992). The LD50 values in rats
for some arsenic species being (in mg/kg): arsine 3, arsenite 14, arsenate 20,
monomethylarsonic acid (MMAA) 700-1800, dimethylarsinic acid (DMAA) 700-
2600, arsenobetaine>10000 and arsenocholine 6500 (Mellan et al., 1956). The
sequence of the toxicity potency of common arsenicals is:
AsH3>As3+>As5+>R-As-X
Chronic toxicity
Long term exposure to arsenic results in chronic arsenic poisoning (arsenicosis). This
has been reported in people who live in endemic areas with higher arsenic
concentrations in drinking water or in burning coal. Arsenicosis has also been
reported in people exposed to arsenic in the workplace. Skin lesions are the typical
symptom of chronic arsenic poisoning. Among these changes the keratosis of the
extremeties of the limbs is very typical of arsenic poisoning. Melanosis and lesions
are common changes. Chronic arsenic poisoning also causes damages including the
respiratory system, digestive system, circulatory system, neural system and renal
system. The most significant consequence is that inorganic arsenic causes cancers in
various organs especially the skin, lung and bladder (ATSDR, 2000; IPCS, 2001).
Episodes of chronic arsenic poisonings are reported around the world from America
to Asia and Europe (Smedley et al., 2001).
A large number of adverse effects have been reported in humans after chronically
exposure to drinking water highly contaminated with inorganic arsenic. The most
Watervolatility of PCDD/Fs
55
common symptoms of inorganic arsenic exposure appear on the skin and occur after
5-15 years of exposure equivalent to 700 µg/day for 70kg adult. They include
alterations in pigmentation and the development of keratoses which are localized
primarily on the palms of the hands, the soles of the feet and the torso. The presence
of hyperpigmentation and keratoses on parts of the body not exposed to the sun is
characteristic of arsenic exposure (Yeh, 1973; Tseng, 1977). Chronic exposure to
inorganic arsenic is often associated with alterations in gastroenterological function
(Morris et al., 1974; Nevens et al.,1990) and development of peripheral vascular
disease (hardening of the arteries to the arms and legs, that can cause pain, numbness,
tingling, infection, gangrene and clots). In Taiwan, black foot disease has been the
most severe manifestation of this effect. Peripheral neuropathy may be present after
long term exposure to inorganic arsenic in drinking water (Hindmarch et al., 1977;
Southwick et al., 1983). People consuming arsenic contaminated water have an
increased risk of diabetes (Lai et al., 1994; Rahman et al., 1998; Tseng et al., 2002).
An increased risk of mortality from diabetes was reported in those occupationally
exposed to arsenic in Sweden (Rahman and Axelson, 1995; Rahman et al., 1998).
Inorganic arsenic entering body by drinking water can cause multi-site cancer in
human body. Asian, Mexican and South American populations with exposures to
arsenic in drinking water generally at or above several hundred micrograms per liter
are reported to have increased risks of skin, bladder, and lung cancer in Taiwan (Chen
et al., 1985), in Argentina (Hopenhayn-Rich et al., 1996) and in Chile (Smith et al.,
1998). The current evidence also suggests that the risks of liver and kidney cancer
may also be increased following exposure to inorganic forms of arsenic. The first
studies of dose–dependent effects of arsenic associated with skin cancer were
observed in Taiwan (Tseng et al., 1968; 1977). Tseng’s reports and other
corroborating studies such as those by Albores et al. (1979) and Cebrian et al. (1983)
on drinking water exposure and exposure to inorganic arsenic in medicines (Cuzick et
al., 1982) and in pesticides (Roth, 1956) led the USEPA to use skin cancer as the
endpoint to classifying inorganic arsenic as a human carcinogen (group A) by the oral
route (USEPA, 1984). It has been estimated that more than 50 million people
worldwide are at risk exposing to elevated levels of arsenic from the environment
(Table 1).

Watervolatility of PCDD/Fs
56
Table 1. Episodes of arsenic caused poisonings and areas of potential arseniccontamination around the world
Country or Area Populationat risk
Sources of Asexposure
Discoverdate
References
Bangladesh 50,000,000 Drinking water:artisan well
1980s Saha(1984)
West Bengal, India 1,000,000 Drinking water:artisan well
1980s Chowdhuryet al., (1999)
Xinjiang, China 100,000 Drinking water:artisan well
1980s Wang(1994);
Cheng (1998)Inner Mongolia,
China600,000 Drinking water:
bores1990s Cheng (1998)
Guizhuo, China 20,000 Burning-coal 1950s Cheng (1998)Taiwan, China 200,000 Artisan well 1950s Tseng and
Chiou (1958)Ronpibool,Thailand, 1,000 Water
contaminatedby tin mining
waste
1980s Choprapwonet al., (1995;
2001)
Mexica 400.000 Drinking water 1983 Cebrian etal., (1983)
Chile 437.000 Drinking water 1971 Sancha et al.,(2001)
Argentina 2,000,000 Drinking water 1981 Sancha et al.,(2001)
Bolivia 20,000 Drinkingwater
1997 Sancha etal., (2001)
Peru 250,000 Drinkingwater
1984 Sancha et al.,(2001)
Vietnam Millions Drinkingwater
2001 Berg et al.,(2001)
Western U S A - Drinkingwater
1988 Welch et al.,(1988)
Hungary 220,000 Drinkingwater
1974 Sancha et al.,(2001)
Romania 36.000 Drinkingwater (bores)
2001 Gurzau et al.,(2001)
Recently Berg et al (2001) reported cases of high levels of arsenic contamination in an
alluvial tract of the Red River in Vietnam as it passes through the city of Hanoi and
the surrounding rural districts. The average arsenic concentration in the ground waters
in this area was found to be 159µg/L, and varied from 1 to 3050 µg/L in rural ground

Watervolatility of PCDD/Fs
57
water samples from private small scale bores. In a highly affected rural area, the
groundwater used directly for drinking water had an average concentration of 430
µg/L. The high arsenic concentrations found in the bores (48% above 50 µg/L and
20% above 150 µg/L) indicate that several million people consuming untreated
groundwater might be at a considerable risk from chronic arsenic poisoning. [The
WHO recommended drinking water guideline
Toxicity of organic arsenicals
Arsenic exists in several forms that vary in toxicity and occurrence. It is important to
consider those forms that can exert toxic effects and to which people may be exposed.
Inorganic arsenic can have adverse effects; arsenite (As+3) and arsenate (As+5) are the
most prevalent toxic forms found in drinking water. Volatile compounds, such as
arsine (AsH3) are very toxic; however arsine is not found in drinking water or food.
Moreover, the primary organic forms (arsenobetaine and arsenocholine) found in fish
and shellfish seem to have little or no toxicity.
Previous studies indicated that the organic arsenicals MMA and DMA that are the
methylation metabolites of the inorganic arsenic were hundreds of times less likely to
produce genetic changes in animal cells than inorganic arsenic. Organic arsenicals are
less reactive in tissues, kill less cells and are more easily excreted in urine. But recent
observations by researchers have challenged the idea that methylation transformation
of inorganic arsenic is a detoxification mechanism (Petrick et al., 2000). These
authors found that the organic arsenic - Monomethylarsonous acid (MMAIII) is more
toxic than arsenite in Chang Human Hepatocytes. The mean LC50 based on LDH
(leakage of lactate dehydrogenase) assay in phosphate media was 6µM for MMAIII
and 68µM for arsenite. Using the assay for K+ leakage in phosphate media, the mean
LC50 was 6.3 µM for MMAIII and 19.8 µM for arsenite. The mean LC50 based on the
XTT [the tetrazolium salt 2,3-bis(2-methoxy-4-nitro-5-sulfophenyl)-2H-tetrazolium-
5-carboxanilide inner salt] assay in phosphate media was 13.6µM for MMAIII and 164
µM for arsenite. The results of these three cytotoxicity assays reveal the following
order of toxicity in Chang Human Hepatocytes:

Watervolatility of PCDD/Fs
58
MMAIII>arsenite>arsenate>MMAv=DMAv
These data demonstrate that MMAIII, an intermediate in inorganic arsenic
methylation, is highly toxic and again raise the question as to whether methylation of
inorganic arsenic is a detoxication process. MMAIII (Monomethylarsonous acid) has
been detected for the first time in the urine of some humans exposed to inorganic
arsenic in their drinking water (Aposhian et al., 2000). A speciation technique for
eight arsenic compounds (special emphasis on identification and quantification of
DMAIII and MMAIII) present in biological samples was developed (Le and Ma, 1997).
The observations (Styblo et al., 1998; Petrick et al., 2000) that organic arsenic
MMAIII is more toxic than inorganic arsenite indicate that (1) future studies
concerning urinary arsenic profiles of arsenic-exposed humans must determine
MMAIII concentrations, (2) previous studies of urinary profiles dealing with humans
exposed to arsenic need to be re-examined and re-evaluated, and (3) since MMAIII is
more toxic than inorganic arsenite, a re-examination is needed of the two hypotheses
which hold that methylation is a detoxication process for inorganic arsenic and that
inorganic arsenite is the major cause of the toxicity and carcinogenicity of inorganic
arsenic.
Mass et al. (2001) reported that DMAIII is 386 fold more potent than AsIII and
summarised the genotoxicity potencies of methylated arsenicals in vitro (single cell
gel assay) as follows:
DMAsIII>MAsIII>>AsIII~AsV>MAsV~DMAsV
The authors implied that trivalent methylated arsenic may be the toxic intermediate
metabolites. However, the role of these methylated arsenicals in arsenic
carcinogenicity in vivo remains unknown. The processes of metabolism of arsenicals
in vivo are very complicated. There are several organs and systems involved in these
processes.

Watervolatility of PCDD/Fs
59
Dimethylarsinic acid (DMAV) - oxidative damage
Yamanaka et al. (1990) first presented a detailed metabolic pathway for arsenic in
oxidative stress, as shown in Figure 1; dimethylarsine (a trivalent arsenic form) is a
minor in vivo metabolite of DMAv produced by a process of reduction in vivo.
Dimethylarsine can react with molecular oxygen forming a (CH3)2As• radical and
superoxide anion. This (CH3)2As• radical can add another molecule of molecular
oxygen and form the (CH3)2AsOO• radical. A hydroxyl radical may be produced via
cellular iron and other transition metals. Exposure to these free radicals can cause
DNA damage such as DNA single-strand breaks (See Figure 1).
Matsui et al. (1999) reported the association of 8-OHdG with arsenic exposure in
humans. They detected the role of oxidative DNA damage in human arsenic
carcinogenesis by studying cases of arsenic–related skin neoplasms and arsenic
keratosis as well as in 11 cases of arsenic unrelated Bowen’s disease. The levels of 8-
Hydroxy-2’-deoxyguanosine were significantly higher in arsenic-related skin
neoplasms than in arsenic–unrelated Bowen’s disease. 8-Hydroxy-2’-deoxyguanosine
was also detected in normal tissue adjacent to arsenic-related Bowen’s diseases
lesions. Yamanaka et al. (2001) reported the urinary 8-OHdG levels (obtained by
sampling from the urinary bladder) in mice gavaged with 720 mg/kg of DMA were
increased to about 3, 3, and 8 times control levels at 3, 6, and 9h after treatment,
respectively (Yamanaka et al., 2001). In a long-term rat carcinogenesis study, hepatic
8-OHdG levels were increased in DMA-treated rats, suggesting an elevated rate of
free radical attack on DNA (Wanibuchi et al., 1997).

Watervolatility of PCDD/Fs
60
Figure 1. Free radicals from DMAv. DMAv may be reduced to a trivalent arsenicform, dimethylarsine. This minor pathway of arsenic metabolism may generate freeradicals such as dimethylarsenic radical, dimethylarsenic peroxy radical, or indirectlygenerate superoxide and hydroxy radical (from Yamanaka et al., 1990).
Arsenic carcinogenicity
Evidence of inorganic arsenic being carcinogenic to humans is sufficient based on
strong epidemiological studies (IARC, 1987; IPCS, 2001). However, the evidence to
demonstrate arsenic is a complete carcinogen to animals is lacking until recently Ng
(1998,1999) successfully demonstrated for the first time the formation of tumours in
laboratory mice chronically exposed for over two years to inorganic arsenic in
drinking water. This animal model is the most successful model for arsenic
carcinogenesis effect and provides the possibility for further in-vivo study of arsenic
carcinogenicity.
As (V)
CH3
CH3
DIMETHYL ARSINE
(GAS)
DIMETHYL ARSINIC
ACID (DMA)
FREE RADICAL PRODUCTION
CH3
CH3
CH3
CH3
SUPEROXIDE RADICAL HYDROXYL RADICAL
S O C
DIMETHYL ARSENIC
PEROXYL RADICAL
DIMETHYLARSENIC
RADICAL
O
O-
As(III) H
CH3
CH3
As
O•
O
O2 •HO •־
As•

Watervolatility of PCDD/Fs
61
Cancer promoter
Much of the previous evidence has suggested that arsenic is a cancer promoter rather
than a carcinogen in animal studies.
The urinary bladder has long been described as a major organ of chemical
carcinogenesis, mostly because the excreted proximate metabolites of ingested
chemicals being kept in the urinary bladder for relatively long duration with
continuous exposure to the urothelium. DMA is the major excreted metabolite of
ingested arsenic in numerous reports about human exposure to inorganic arsenic.
Most of the absorbed DMA is excreted as unchanged DMA in the urine of various
animal species. DMA itself acts as a urinary bladder carcinogen or particularly as a
potent cancer promoter.
The indication that rat bladder was responsive to DMA-induced carcinogenesis first
reported by Yamamoto et al. (1995; 1997). After a long time and many negative
reports of arsenic carcinogenicity in vivo studies, their results are very significant, and
showed that bladder cancer resulted from all four DMA-exposed F344/DuCrj rat
groups after pre-exposed to cancer initiators. Multiple initiators were used through the
carcinogenesis processes in several organs. In the initiated groups, DMA significantly
enhanced the tumour induction in the urinary bladder, kidney, liver, and thyroid
gland. Induction of preneoplastic lesions (glutathione S-transferase placental form-
positive foci in the liver and atypical tubules in the kidneys) was also significantly
increased in DMA-treated groups (see Table 2).
Urinary bladder tumours are so far the most frequently induced tumour type in the
animal carcinogenesis studies. Following the work of Yamamoto et al (1995), at least
3 other research groups achieved the same result. For example, Wanibuchi et al.
(1996) obtained the positive result of rat bladder tumours when only one initiator, N-
butyl-N-(4-hydroxybutyl)nitrosamine was given followed by DMA exposure in 6-
week-old male F344 rats. The development of preneoplastic lesions and tumours
(papillomas and carcinomas) in the urinary bladder was enhanced by the treatment
with DMA in a dose-dependent manner. A significant increase in multiplicity of

Watervolatility of PCDD/Fs
62
tumours (papillomas and carcinomas) was observed even at a relatively low
concentration of DMA (10ppm). On the other hand, no preneoplastic lesions and
tumours were observed in the rats treated with DMA alone. Wanibuchi and
Fukushima (2000) also reported other results in relation to the structure-activity. In
this work, rats were given control, arsenite (17.3ppm), MMA (187 ppm), DMA
(184ppm), or TMAO (182ppm) respectively in their drinking water after initiated with
N-butyl-N-(4-hydroxybutyl)nitrosamine developed 0.4, 0.3, 1.3, 3.8, and 0.9 bladder
tumours per rat. The rat bladder tumour incidence was elevated at the p<0.05 level for
all three methylated arsenicals, with DMA clearly the most active chemical (See
Table 2 and Table 3).
Recent studies have shown that tumours in various organs observed in humans in
arsenic-endemic area can all be induced by arsenicals in animals as a cancer promoter.
The kidney is the major route for the elimination of ingested arsenic from the human
or animal body. Most of the metabolites are methylated, such as DMA, MMA and
TMA. Most reports of the metabolism of ingested arsenic show accumulation of
DMA in the kidney and liver. Studies also reported relatively high accumulation of
ingested DMA in the lung and skin. Besides the results reported by Yamamoto et al
(1995) and Wanibuchi et al (1996; 2000), several more studies report tumours
involving many other organs. Yamanaka et al. (2001) used hairless mice receiving a
topical application of dimethlbenz(a)anthracene (DMBA) with or without the
exposure to ultraviolet B (UVB), a tumour promoter and the administration of DMA
by the oral route promoted not only the formation of papillomas induced by DMBA
alone but also the formation of malignant tumours induced by way of the formation of
atypical keratoses by treatment with DMBA and UVB. In their previous report
(Yamanaka et al., 2000), hairless mice (Hos: HR-1) were treated for 25 weeks with
UVB light at 2KJ/m2 twice per week with or without exposure to 400 or 1000 ppm of
DMA in the drinking water. All three treated groups developed skin cancer, but the
combination of UVB light and 1000 ppm of DMA in the drinking water induced more
tumours per mouse during weeks 13 to 19 than did UVB light exposure alone. No
statistically significant elevations in the percentage of tumour-bearing mice or
tumours per mice occurred with the combination of UVB and 400 ppm DMA
treatment versus UVB treatment alone.
Watervolatility of PCDD/Fs
63
In another study (Yamanaka et al., 1996), male ddY mice initiated with 4-
nitroquinoline 1-oxide (4NQO) known as an initiator of lung tumours and
subsequently exposed to 200 or 400 ppm DMA for 25 weeks in their drinking water
developed lung tumours that were described as adenocarcinomas and adenosquamous
carcinomas. The percentage of mice bearing tumour nodules was increased with the
administration of both 4NQO and DMA than those mice given 4NQO alone, or given
both 4NQO and glycerol. Furthermore, the average number of tumours nodules per
mouse was significantly higher in mice administered DMA than those given glycerol
(known to have potent promoting activity in lung tumourigenesis initiated by
administration of 4NQO in ddY mice).
Wanibuchi et al. (1997) reported that in rats initiated with diethylnitrosamine DMA
(25, 50, or 100 ppm) was active as a promoter in this experimental system for liver
carcinogenesis based on the area stained for glutathione S-transferase placental form-
positive foci. Rat hepatic ODC (Ornithine decarboxylase; it’s activity is often
interpreted as a biomarker for cell proliferation) activity was increased after
administration of both 10 and 50ppm DMA in the drinking water. In a recent
structure-activity study (Wanibuchi and Fukushima, 2000), rats initiated with
diethylnitrosamine developed about 1.5, 2.5, 2.4, and 2.5 glutathione S-transferase
placental form-positive foci/cm2 following exposure to promotional regimens of
control, MMA, DMA, or TMAO, respectively. The number of the liver foci per area
was statistically elevated at the p< 0.05 for all three methylated arsenicals (Table 2).
Transgenic animals have been used for developing arsenic carcinogenesis model.
Since the mechanisms of arsenic carcinogenesis are not clear, different transgenic
animals have been tested in developing the manifestation of the arsenic carcinogenic
effects. Genetically altered rodents were used in anticipation for the rapid
identification of carcinogens. The use of these models holds great promise for
shortening the length of the bioassay and reducing its cost. The enhancement of the
sensitivity of the models could allow agents to be tested at lower doses more relevant
to human exposure.
The p53 gene is a tumour suppression gene, it is a very important gene in preventing
tumour occurrence. Salim et al. (1999) reported the use of p53+/- mice, to which
DMA was given to p53 heterozygous knockout and C57BL/6T wild-type male mice

Watervolatility of PCDD/Fs
64
in their drinking water for 80 weeks. Exposure to 50 or 200 ppm of DMA caused an
increase in the total numbers of spontaneous tumours in wild-type mice and earlier
induction of tumours in the p53 knockout mice.
Ornithine decarboxylase (ODC), an important enzyme in the polyamine biosynthetic
pathway, is aberrantly regulated in epithelial tumours of rodents and humans. In
murine skin, it has been shown that ODC overexpression provides a sufficient
condition for tumour promotion. K6/ODC transgenic mice in which ODC
overexpression was targeted to hair follicle keratinocytes might provide a sensitive
model for identifying genotoxic carcinogens (Chen et al., 2000). A two-stage mouse
skin carcinogenesis experiment in K6/ODC mice was performed by using the initiator
7,12-dimethylbenz[a]anthracene (DMBA, 50 µg, single application), 12-O-
tetradecanoylphorbol-13-acetate (TPA, 5 µg twice per week) and DMA (3.6 mg twice
per week). Twenty weeks after initiation, the average number of tumours per mouse
was 20.7, 19.4, 9.7, and 0.0 in the four treatment groups of DMBA → TPA,
DMBA→ DMA, DMBA → control cream, and acetone vehicle → DMA,
respectively. The DMBA → TPA treatment group responded with an increased
tumour incidence about 2 weeks faster than the DMBA → DMA group.
Microscopically, most tumours in the three responding treatment groups were
squamous papillomas, and some squamous carcinomas with disorderly arrangement
and atypical nuclei (Morikawa et al., 2000).

Watervolatility of PCDD/Fs
65
Table 2. Organic Arsenicals in Various Animal Carcinogenicity Models
ArsenicalType
Animal Species& Strains
Dose & Treatment/Regime
ExposureDuration
ExposurePathway
Results Role of As Reference
DMA Hos:HR-1 femalehairless mice
400 & 1000ppmDMA+UVB
25 weeks Drinkingwater
Skin Cancer Promotor Yamanakaet al., 2000
DMA Hos:HR-1 femalehairless mice
DMA+ DMBA±UVB 25 weeks DMBAtopical DMA
drinkingwater
Skin tumour Promotor Yamanakaet al., 2001
DMA F344/DuCrj malerats
50,100,200,400ppm+DEN,MNU,DMH
BBN,DHPN
30 weeks DrinkingWater &
i.p(Initiator)
Bladder,KidneyLiver &Thyroid
Tumour
Promotor Yamamotoet al., 1995
DMA F344 male rats DMA(0, 2, 10, 25, 50and 100 ppm)±BBN
32 weeks Dinkingwater
Bladdertumour
Promotor Wanibuchiet al., 1996
DMA,MMA,TMAO
F344 male rats MMA(187ppm)DMA(184) TMAO
(182ppm)+BBN
Drinkingwater
Bladdertumour
Promotor Wanibuchiet al .,2000
DMA ddY male mice 200 or 400 ppmDMA+4NQO
25 weeks Drinkingwater
Lung tumour Promotor Yamanakaet al., 1996
DMA F344 male rats 25, 50, or 100ppmDMA +DEN
8 weeks Food andDrinking
water . Denby i.p
Positive in Itotest
Promotor Wanibuchiet al., 1997
MMA, TMAO F344male rats MMA,TMAO + DEN Positive in Itotest
Promotor Wanibuchiet al., 2000
DMA P53- &C57BL/6Tmale mice
50 or 200 ppm 80 weeks Drinkingwater
Tumourincrease &
early inductionof tumour
Promotor Salim et al.,1999
DMA K6/ODC malemice
DMA 3.6 mg twice/week +DMBA or TPA
20 weeks Topicalapplication
Skin tumouraccelerated
Promotor Morikawaet al., 2000
DMA A/J male mice 50, 200 or 400 ppm 25-50weeks
Drinkingwater
Lung tumours Carcinogen Hayashiet al.,1998
DMA F344/DuCrj malerats
0, 12.5, 50, 200 ppm(negative in 0 &
12.5ppm)
104 weeks Drinkingwater
Bladder tumour Carcinogen Weiet al.,1999
DMA F344 female rats 100ppm 24 months Food Bladdertumours
Carcinogen Kitchin2001
DMA B6C3F1 femalemice
500ppm 24 months Drinkingwater
Fibrosarcomasin multiple
organs
Carcinogen Kitchin2001
DMA K6/ODC malemice
10, 100ppm DMA 5 months Drinkingwater
Skin tumour Carcinogen Chenet al .,2000
DMA=Dimethylarsinic acid; MMA=Monomethylarsonic acide; TMAO=Trimethylarsine oxide; As(III)=Arsenite;As(V)= Arsenate; BBN= N-butyl-N-(4-hydroxybutyl)nitrosamine; DEN=diethylnitrosamine; MNU=N-methyl-N-nitrosourea; DMH=1,2-dimethylhydrazine; DHPN= N-bis(2-hydroxypropyl)nitrosamine; 4NQO=4-nitroquinoline-1-oxide; DMBA=7,12-dimethylbenz[а]anthracene; TPA=12 -O-tetradecanoylphorbol-13-acetate; ODC=ornithinedecarboxylase; UVB= Ultraviolet B
Complete carcinogen
Hayashi et al. (1998) used A/J mice given 50, 200, or 400 ppm DMA in drinking
water for either 25 or 50 weeks. At 25 weeks there were no DMA-related pulmonary
tumours. Alveolar adenomas were not increased by DMA administration at 50 weeks.
However, mice fed with the highest dosage (400 ppm) of DMAA for 50 weeks
produced more pulmonary tumours than untreated mice (mean number per animal
1.36 versus 0.50; p<0.05). Increased numbers of lung hyperplasia, papillary
adenomas, and adenocarcinomas were observed after treatment with 50, 200, or 400

Watervolatility of PCDD/Fs
66
ppm of DMA for 50 weeks. In this experiment, DMA is acting as a complete
carcinogen in A/J mice which known to be susceptible to developing pulmonary
tumours that are normally seen in humans exposed to arsenic.
Wei et al. (1998) also tested DMA as a complete carcinogen and found it to be
carcinogenic to rat urinary bladder at 50 and 200 ppm. Total of 144 F344 rats (10
weeks old at the start) were used to determine the carcinogenicity of dimethylarsinic
acid (DMA). DMA (purity 100%) concentrations of 200, 50, 12.5 and 0 ppm were
given to 4 groups of rats in the drinking water respectively for 104 weeks. From
weeks 97 to 104, urinary bladder tumours were observed in 12 of 31, 8 of 31 and none
of 33 in groups 1-3, respectively. No bladder tumours were observed in the negative
control group 4.
An unpublished study work (cited by Kitchin, 2001) was performed by Life Sciences
Research of Israel in support of the U.S. EPA pesticide registration for cacodylic acid
(USEPA, 1994). In this study, female F344 rats exposed for 2 years to up to 100 ppm
DMA in their food developed dose-related transitional cell bladder tumours with
bladder hyperplasia observed in both sexes. Control female rats had 0/59 incidence of
bladder papillomas and carcinomas, while female rats exposed to 100 ppm DMA had
10/58 incidence (17%, p<0.01). Of the female rats that responded to DMA exposure
with bladder tumours, six were classified as carcinomas and four were classified as
papillomas. Female B6C3Fl mice exposed to up to 500ppm DMA in their drinking
water showed only an increase in fibrosarcomas in multiple organs.
ODC (ornithine decarboxylase) activity is induced in epithelial tumours in both
rodents and humans. ODC has been extensively studied in mouse skin and rat liver
carcinogenesis systems and ODC induction is considered as a biomarker for cancer
promotion. Chen et al. (2000) tested ten known carcinogens or noncarcinogens using
the K6/ODC transgenic mouse model. In K6/ODC mice given either 10 ppm DMA,
100 ppm DMA, or 10 ppm arsenite in their drinking water for 5 months, 8, 22, or 15%
of the mice developed skin squamous papillomas, respectively. No tumours were
observed in the control group of K6/ODC transgenic mice not exposed to arsenic and
in nontransgenic littermates given 100 ppm DMA.
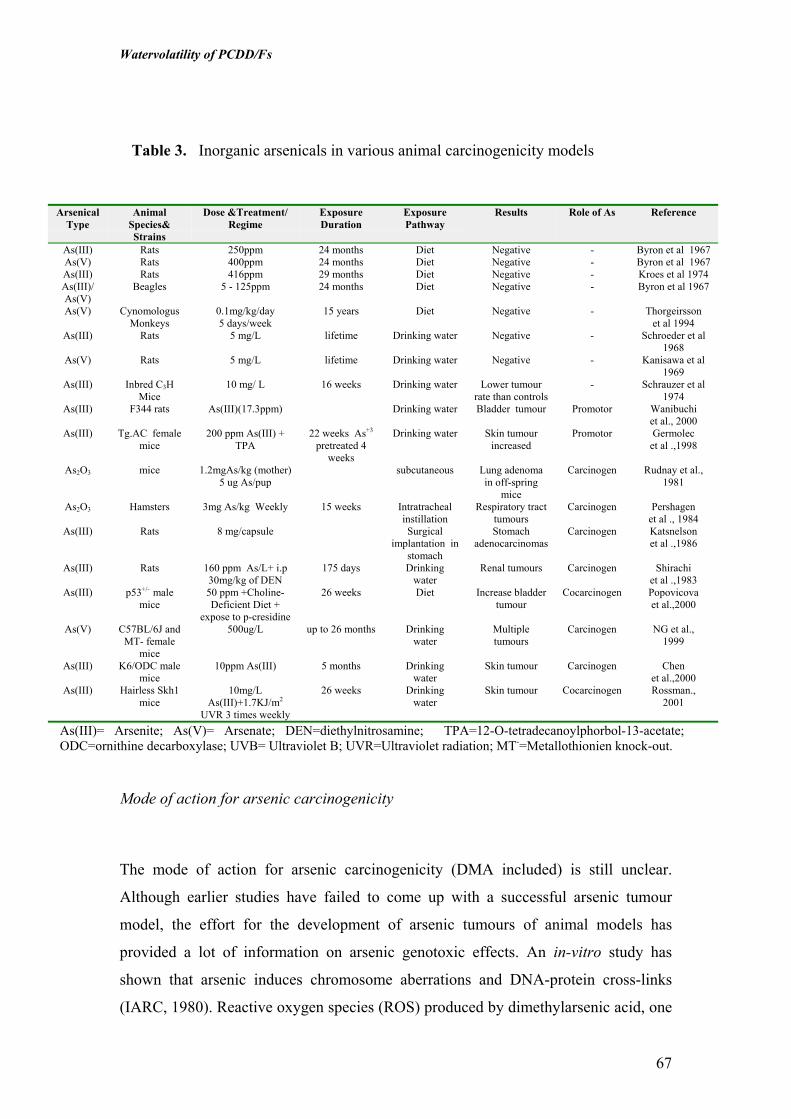
Watervolatility of PCDD/Fs
67
Table 3. Inorganic arsenicals in various animal carcinogenicity models
ArsenicalType
AnimalSpecies&Strains
Dose &Treatment/Regime
ExposureDuration
ExposurePathway
Results Role of As Reference
As(III) Rats 250ppm 24 months Diet Negative - Byron et al 1967As(V) Rats 400ppm 24 months Diet Negative - Byron et al 1967As(III) Rats 416ppm 29 months Diet Negative - Kroes et al 1974As(III)/As(V)
Beagles 5 - 125ppm 24 months Diet Negative - Byron et al 1967
As(V) CynomologusMonkeys
0.1mg/kg/day5 days/week
15 years Diet Negative - Thorgeirssonet al 1994
As(III) Rats 5 mg/L lifetime Drinking water Negative - Schroeder et al1968
As(V) Rats 5 mg/L lifetime Drinking water Negative - Kanisawa et al1969
As(III) Inbred C3HMice
10 mg/ L 16 weeks Drinking water Lower tumourrate than controls
- Schrauzer et al1974
As(III) F344 rats As(III)(17.3ppm) Drinking water Bladder tumour Promotor Wanibuchiet al., 2000
As(III) Tg.AC femalemice
200 ppm As(III) +TPA
22 weeks As+3
pretreated 4weeks
Drinking water Skin tumourincreased
Promotor Germolecet al .,1998
As2O3 mice 1.2mgAs/kg (mother)5 ug As/pup
subcutaneous Lung adenomain off-spring
mice
Carcinogen Rudnay et al.,1981
As2O3 Hamsters 3mg As/kg Weekly 15 weeks Intratrachealinstillation
Respiratory tracttumours
Carcinogen Pershagenet al ., 1984
As(III) Rats 8 mg/capsule Surgicalimplantation in
stomach
Stomachadenocarcinomas
Carcinogen Katsnelsonet al .,1986
As(III) Rats 160 ppm As/L+ i.p30mg/kg of DEN
175 days Drinkingwater
Renal tumours Carcinogen Shirachiet al .,1983
As(III) p53+/- malemice
50 ppm +Choline-Deficient Diet +
expose to p-cresidine
26 weeks Diet Increase bladdertumour
Cocarcinogen Popovicovaet al.,2000
As(V) C57BL/6J andMT- female
mice
500ug/L up to 26 months Drinkingwater
Multipletumours
Carcinogen NG et al.,1999
As(III) K6/ODC malemice
10ppm As(III) 5 months Drinkingwater
Skin tumour Carcinogen Chenet al.,2000
As(III) Hairless Skh1mice
10mg/LAs(III)+1.7KJ/m2
UVR 3 times weekly
26 weeks Drinkingwater
Skin tumour Cocarcinogen Rossman.,2001
As(III)= Arsenite; As(V)= Arsenate; DEN=diethylnitrosamine; TPA=12-O-tetradecanoylphorbol-13-acetate;ODC=ornithine decarboxylase; UVB= Ultraviolet B; UVR=Ultraviolet radiation; MT-=Metallothionien knock-out.
Mode of action for arsenic carcinogenicity
The mode of action for arsenic carcinogenicity (DMA included) is still unclear.
Although earlier studies have failed to come up with a successful arsenic tumour
model, the effort for the development of arsenic tumours of animal models has
provided a lot of information on arsenic genotoxic effects. An in-vitro study has
shown that arsenic induces chromosome aberrations and DNA-protein cross-links
(IARC, 1980). Reactive oxygen species (ROS) produced by dimethylarsenic acid, one

Watervolatility of PCDD/Fs
68
of the major metabolites of inorganic arsenics, were suggested to be involved in the
generation of DNA damage (Yamanaka et al., 1989). Yamanaka and Okada (1994)
also assumed that of the two radicals, dimethylarsenic peroxyl radical and the
superoxide anion radical produced from the reaction between molecular oxygen and
dimethylarsine, the dimethylarsine peroxyl radical plays a dominant role(s) in causing
DNA damage, and at least causing DNA single-strand breaks. Dimethylarsenic acid
has the potential to promote rat liver carcinogenesis, possibly via a mechanism
involving stimulation of cell proliferation and DNA damage caused by ROS
(Wanibuchi et al., 1997). Sodium arsenite produced DNA-protein crosslinks and
arsenic mediated DNA–protein interactions may play a major role in arsenic
carcinogeneses (Dong and Luo, 1993). Arsenic was suggested to enhance the
development of skin neoplasias via chronic stimulation of keratinocyte-derived
growth factors and may be a rare example of a chemical carcinogen that acts as a co-
promoter (Germolec et al., 1998).
Unlike some heavy metals such as cadmium and nickel that bind directly to the DNA,
arsenic showed no direct interaction with DNA. The mechanism of the action of
arsenic as a carcinogen is not well understood but the affecting process can be
inferred from data that suggest arsenic causes large deletion (Hei et al., 1998) or
methylation changes of DNA (Mass and Wang, 1997; Zhao et al., 1997) that could
affect gene expression. The inhibition of the DNA repair function has also been
suggested as one of the mechanisms of inorganic arsenic carcinogenicity (Hartwig,
1998; Tran et al., 2002). The oxidative DNA damage in skin neoplasms related to
arsenic attack is suggested by the in-vivo evidence in arsenic-induced Bowen’s
disease and the cases of bladder tumours among Taiwanese who lived in areas of high
arsenic-contaminated artisan well drinking water (Matsui et al., 1999).
In conclusion, sufficient evidence to establish that both inorganic arsenic and its
methylated forms (DMA and MMA) are either complete carcinogens or cancer
promoters or both although the mode of action for their carcinogenic effects require
further research. The synergistic effects of DMA / MMA and others carcinogenic

Watervolatility of PCDD/Fs
69
compounds have been reported extensively. The potential synergistic effect between
DMA and dioxins remains unknown.

Watervolatility of PCDD/Fs
70
Appendix II: References
Albores, A., Cebrian, M.E., Tellez, I., Valdez, B., 1979. Comparative Study ofChromic Hydroarsenicism in Two Rural Communities in the Region Lagunra ofMexico. (in Spanish). Bol. Officina Sanit. Panam. 86, 196-205.
Aposhian, H.V., Gurzau, E.S., Le, X.C., Gurzau, A., Healy, S.M., Lu, X.F., Ma, M.S.,Yip, L., Zakharyan, R.A., Maiorino, R.M., Dart, R.C., Tircus, M. G., Gonzalez-Ramirez, D., Morgan, D.L., Avram, D., Aposhian, M.M., 2000. Occurrence ofMonomethylarsonous Acid in Urine of Humans Exposed to Inorganic Arsenic.Chem. Res. Toxicol. 13, 693-697.
ATSDR (Agency for Toxic Substances and Disease Registry) 2000. ToxicologicalProfile for Arsenic. U.S. Department of Health and Human Services, Agency forToxic Substances and Disease Registry, Atlanta, GA.
Berg, M., Tran, H.C., Nguyen, T.C., Pham, H.V., Schertenleib, R., Giger, W., 2001.Arsenic Contamination of Groundwater and Drinking Water in Vietnam: AHuman Health Threat. Environmental Science and Technology. 35, 2621-2626.
Buchanan, W. D., 1962. Toxicity of Arsenic Compounds. Elsevier ScientificPublishers. pp v-viii.
Byron, W.R., Bierbower, G.W., Brouwer, J.B., Hansen, W.H., 1967. PathologicChanges in Rats and Dogs from Two-year Feeding of Sodium Arsenite or SodiumArsenate. Toxicol. Appl. Pharmacol. 10, 132-147.
Cebrian, M. E., Albores, A., Aguilar, M., Blakely, E., 1983. Chronic ArsenicPoisoning in the North of Mexico. Human Toxicology. 2, 121- 133.
Chen, C.J., Chuang, Y.C., Lin, T.M., Wu, H.Y., 1985. Malignant Neoplasms AmongResidents of A Blackfoot Disease-Endemic Area in Tainwan: High-arsenicArtesian Well Water and Cancers. Cancer. Res. 45, 5895-5899.
Chen, Y., Lousis, C.M., Susan, K.G., Sawicki, J.A., O’Brien, T.G., 2000. K6/ODCTransgenic Mice as a Sensitive Model for Carcinogen Identification. ToxicologyLetters. 116, 26-35.
Cheng, Z., Zhang, L.L., Yang, F.S., Lu, Z.M., Zhang, X.L., 1998. The Epidemologyand Control of Arsenicosis in China. Journal of Chinese Endemic DiseaseControl. (in Chinese) 13, 342-345.
Chilvers, D. C., Peterson, P. J., 1987. Global cycling of arsenic. In: Hutchinson TC &Meema KM eds. Lead, Mercury, Cadmium and Arsenic in the Environment.Chichester, John Wiley & Sons, pp. 279-303. (SCOPE 31).
Choprapwon, C., 1995. Chronic Arsenic Poisoning in Ronpibool District, NakornSrithammarat Province, Southern Thailand: How Should We Balance BetweenEconomics and Health. Second International Conference on Arsenic Exposure andHealth Effects.
Choprapwon, C., Porapakkham, Y., 2001. Occurrence of Cancer in ArsenicContaminated Area, Ronpibool District, Nakorn Srithmmarat Province, Thailand.Arsenic Exposure and Health Effects IV. 201-206.
Chowdhury, U.K., 1999. The Condition of Arsenic Contamination of UndergroundWater and Prevalent of Arsenicosis in Residents in Bangladesh and West Bangel.Abstract Book of Pan-Asia Pacific Conference on Fluride and Arsenic Research.Shengyang, China.August, 16-20.
Clifford, D., Zhang, Z., 1994. Arsenic Chemistry and Speciation. American WaterWorks Association Annual Conference. New York, NY. June 19-23.

Watervolatility of PCDD/Fs
71
Cullen, W.R., Reimer, K.J., 1989. Arsenic Speciation in the Environment. Chem.Rev.89, 713-764.
Cuzick, J., Evans, S., Gillman, M., Price-Evans, D.A., 1982. Medicinal Arsenic andInternal Malignancies. British Journal of Cancer. 45, 904-911.
Dong, J.T., Luo, X.M., 1993. Arsenic-induced DNA-strand Breaks Associated withDNA-protein Crosslinks in Human Fetal Lung Fibroblasts. Mutat Res. 302, 97-102.
Germolec, D.R., Spalding, J., Hsin-Su, Yu., Chen, G.S., Simeonova, P.P., Humble,M.C., Bruccoleri, A., Boorman, G.A., Foley, J.F., Yoshida, T., Luster, M.I.,1998. Arsenic Enhancement of Skin Neoplasia by Chronic Stimulation of GrowthFactors. American Journal of Pathology. 153, 1775-1785.
Gurzau, E.S., Gurzau, A.E., 2001. Arsenic in Drinking Water from Groundwater inTransylvania, Romania: an Overview. Arsenic Exposure and Health Effects IV.181-184.
Hartwig, A., 1998. Carcinogenicity of Metal Compounds: Possible Role of DNARepair Inhibition. Toxicol Lett.102-103,235-239.
Hayashi, H., Kanisawa, M., Yamanaka, K., Ito, T., Udaka, N., Ohji, H., Okudela, K.,Okada, S., Kitamura, H., 1998. Dimethyarsinic Acid, A Main Metabolite ofInorganic Arsenics, Has Tumourigenicity and Progression Effects in thePulmonary Tumours of A/J Mice. Cancer Letters. 125, 83-88.
Hindmarsh, J. T., McLetchie, O.R., Heffernan, L.P.M., Hayne, O.A., Ellenberger,H.A., McCurdy, R.F., Thiebaux, H.J., 1977. Electromyographic Abnormalities inChronic Environmental Arsenicalism. Analytical Toxicology. 1, 270-276.
Hopenhayn-Rich, C., Biggs, M.L., Fuchs, A., Bergoglio, R., Tello, E.E., Nicolli, H.,Smith, A.H., 1996. Bladder Cancer Mortality Associated With Arsenic inDrinking Water in Argentina. Epidemiology. 7, 117-124.
IARC (International Agency for Research on Cancer), 1980. Some Metals and MetallicCompounds. IARC Monographs on the Envaluation of Carcinogenic Risks toHumans.Vol.23. Lyon, France, International Agency for Research on Cancer.
IARC (International Agency for Research on Cancer), 1987. Arsenic and ArsenicCompounds. pp. 100-206 in IARC Monographs on the Evaluation of CarcinogenicRisks to Humans. Overall Evaluations of Carcinogenicity: An Updating of IARCMonographs 1-42, Suppl.7 . Lyon, France, International Agency for Research OnCancer.
IPCS (International Programme on Chemical Safety), 2001. Environmental HealthCriteria 224. Arsenic and Arsenic Compounds (Second Edition). World HealthOrganization. Geneva.
Irgolic, K. J., 1994. Determination of Total Arsenic and Arsenic Compounds inDrinking Water. In Arsenic: Exposure and Health. Chappell W R, Abernathy C O& Cothern, C R,Eds. Northwood,U.K., Science and Technology Letters:pp.51-60.
Kaise, T., Fukui, S., 1992. The Chemical Form and Acute Toxicity of ArsenicCompounds in Marine Organisms. Appl Organomet Chem. 6, 155-60.
Kanisawa, M., Schroeder, H.A., 1969. Life Term Sudies on the Effect of TraceElements on Spontaneous Tumours in Mice and Rats. Cancer. Res. 29, 892-895.
Katsnelson, B.A., Neizvestnova, Y.M., Blokhin, V.A., 1986. Stomach CarcinogenesisInduction by Chronic Treatment with Arsenic (Russ.). Vopr. Onkol. 32, 68-73.
Kitchin, K.T., 2001. Recent Advances in Arsenic Carcinogenesis: Modes of Action,Animal Model Systems, and Methylated Arsenic Metabolites. Toxicology andApplied Pharmacology.172, 249-261.

Watervolatility of PCDD/Fs
72
Kroes, R., Van, Logten, M.J., Berkvens, J.M., De Vries, T., van Esch, G.J.,1974. Study On the Carcinogenisity of Lead Arsenate and Sodium Arsenate andon the Possible Synergistic Effect of Diethylnitrosamine. Food. Cosmer. Toxicol.12, 671-679.
Lai, M. S., Hsueh, Y.M., Chien, C.J., Shyu, M.P., Chen, S.Y., Kuo, T.L., Wu, M.M.,Tai, T.Y., 1994. Ingested Inorganic Arsenic and Prevalence of Diabetes Mellitus.American Journal of Epidemiology. 139, 484-492.
Le, X.C., Ma, M.S., 1997. Speciation of Arsenic Compounds by using Ion-pairChromatography with Atomic Spectrometry and Mass Spectrometry Detection.Jounal of Chromatography A. 764, 55-64.
Maher, W., Butler, E., 1988. Appl. Organomet. Chem. 2,191-214.
Mass, M.J., Tennant, A., Roop, B.C., Cullen, W.R., Styblo, M., Thomas, D.J.,Kligerman, A.D., 2001. Methylated Trivalent Arsenic Species are Genotoxic.Chem. Res. Toxicol. 14, 355-361.
Mass, M.J., Wang, L., 1997. Arsenic Alters Cytosine Methylation Patterns of thePromoter of the Tumour Suppressor Gene p53 in Human Lung Cells: a Model fora Mechanism of Carcinogenesis. Mutat. Res. 386, 263-277.
Matsui, M., Nishigori, C., Toyokuni, S., Takasa, J., Akaboshi, M., Ishikawa, M.,Imamura, S., Miyachi, Y., 1999. The Role of Oxidative DNA Damage in HumanArsenic Carcinogenisis: Detection of 8-Hydroxy-2’-Deoxyguanosine in Arsenic–Related Bowen’s Disease. The Journal of Investigative Dermatology. 113, 26-31.
Morikawa, T., Wanibuchi, H., Morimura, K., Ogawa, M., Fukushima, S., 2000.Promotion of Skin Carcinogenesis by Dimethylarsinic Acid in Keratin (K6)/ODCTransgenic Mice. Jpn. J. Cancer. Res. 91, 579-581.
Morris, J. S., Schmid, M., Newman, S., Scheuer, P.J., Sherlock, S., 1974. Arsenic andNoncirrhotic Portal Hypertension. Gastroenterology. 66, 86-94.
Nevens, F., Fevery, J., Steenbergen, W.V., Sciot, R., Desmet, V., Groote, J.De., 1990.Arsenic and Noncirrhotic Portal Hypertension: A Report of Eight Cases.Hepatology. 11, 80-85.
Ng, J.C., 1999. Speciation, Bioavailability and Toxicology of Arsenic in theEnvironment. Ph.D. Thesis, University of Queensland, Brisbane, QLD, Australia.
Ng, J.C., Qi, L., Wang, J.P., Xiao, X.L., Shahin, M., Moore, M.R., Prakash, A.S.,2001. Mutations in C57Bl/6J and Metallothionein Knock-out Mice induced byChronic Exposure of Sodium Arsenate in Drinking Water. Arsenic Exposure andHealth Effects IV, 231-242.
Ng, J.C., Seawright, A.A., Qi, L., Garnett, C.M., Moore, M.M., Chriswell, B., 1998.Tumours in Mice Induced by Chronic Exposure of High Arsenic Concentration inDrinking Water [abstract]. Pp. 28: In Book of Abstracts of the Third InternationalConference on Arsenic Exposure and Health Effects, July 12-15, San Diego, Calif.
Pershagen, G., Nordberg, G., Bjorklund, N.E., 1984. Carcinomas of the RespiratoryTract in Hamsters Given Arsenic Trioxide and / or Benzo(а)pyrene by thePulmonary Route. Environ. Res. 34, 227-241.
Petrick, J. S., Ayala-Fierro, F., Cullen, W. R., Carter, D. E., Aposhian, H. V., 2000.Monomethylarsonous acid (MMAIII) is more toxic than arsenite in Chang humanhepatocytes. Toxicology and applied pharmacology, 163, 203-207.
Watervolatility of PCDD/Fs
73
Petrick, J.S., Jagadish, B., Mash, E.A., Aposhian, H.V., 2001. MonomethylarsonousAcid (MMAIII) and Arsenite: LD 50 in Hamsters and in vitro Inhibition ofPyruvate Dehydrogenase. Chem Res Toxicol. 14, 651-656.
Popovicova, J., Moser, G.J., Goldsworthy, T.L., Tice, R.R., 2000. Carcinogenicityand Co-carcinogenicity of Sodium Arsenite in p53+/- Male Mice. Toxicologist. 54,134.
Rahman, M., Axelson, J.O., 1995. Diabetes Mellitus and Arsenic Exposure: a SecondLook at Case-Control Data from a Swedish Copper Smelter. OccupationalEnvironmental Medicine. 52, 773-774.
Rahman, M., Tondel, M., Ahmad, S. A., Axels, C., 1998. Diabetese MellitusAssociated with Arsenic Exposure in Bangladesh. American Journal ofEpidemiology. 148, 198-203.
Rossman, T.G., Uddin, A.N., Burns, F.J., Bosland, M.C., 2001. Arsenite is aCocarcinogen with Solar Ultraviolet Radiation for Mouse Skin: An Animal Modelfor Arsenic Carcinogenesis. Toxicol. Appl. Pharmacol. 176, 64-71.
Roth, F., 1956. Concerning Chronic Arsenic Poisoning of the Moselle Wine Growerswith Special Emphasis on Arsenic Carcinomas. Krebsforschung. 61, 287-319.
Rudnay, P., Borzsonyi, M., 1981. The Tumourigenic Effect of Treatment withArsenic Trioxide (Hung). Magyar. Onkol. 25, 73-77.
Saha, K.C., 1984. Melanokeratosis from Arsenic Contaminated Tubewell Water.Indian J Dermatol. 29, 37-46.
Salim, E.I., Wanibuchi, H., Yamamoto, S., Morimura, K., Fukushima, S., 1999.Carcinogenicity of Dimethylarsinic Acid (DMAA) in p53 Knockout and WildType C57BL/6T Mice. Proc.Am.Assoc. Cancer.Res. 40, 2335.
Sancha, A.M., Castro, M.L., 2001. Arsenic in Latin America: Occurrence, Exposure,Health Effects and Remediation. Arsenic Exposure and Health Effects IV. 87-96.
Schrauzer, G.N., Ishmael, D., 1974. Effects of Selenium and Arsenic on the Genesisof Spontaneous Mammary Tumours in Inbred C3H Mice. Ann. Clin. Lab. Sci. 4,441-447.
Schroeder, H.A., Kanisawa, M., Frost, D.V., Mitchener, M., 1968. Germanium, Tinand Arsenic in Rats: Effect on Growth, Survival, Pathological Lesions and LifeSpan. J. Nutrition. 96, 37-45.
Shibata, Y., Morita, M., Fuwa, K., 1992. Selenium and Arsenic in Biology.Adv.Biophys. 28, 31-80.
Shirachi, D.Y., Johansen, M.G., McGowan, J. P., Tu, S. H., 1983. TumourigenicEffect of Sodium Arsenite in Rat Kidney. Proc. West. Pharmacol. Soc. 26, 413-415.
Smedley, P.L., Kinniburgh, D.G., Huq, I., Luo, Z.D., Nicolli, H.B., 2001.International Perspective on Naturally Occurring Arsenic Problems inGroundwater. Arsenic Exposure and Health Effects IV. 9-25.
Smith, A. H., Goycolea, M., Haque, R., Biggs, M.L., 1998. Marked Increase inBladder and Lung Cancer Mortality in a Region of Northern Chile Due to Arsenicin Drinking Water. American Journal of Epidemiology. 127, 660-669.
Southwick, J. W., Western, A .E., Beck, M.M., Whitley, T., Isaacs, R., Petajan, J.,Hansen, C. D., 1983. An Epidemiological Study of Arsenic in Drinking Water inMillard County, Utah. In Arsenic: Industrial, Biomedical, EnvironmentalPerspectives. Lederer, W. H and Fensterheim, R. J., Eds. New York, VanNostrand Reinhold: pp.210-225.
Styblo, M., Vega, L., Germolec, D. R., Luster, M. I., Del-Razo, L. M., Wang, C.,Cullen, W. R., Thomas, D.J., 1998. Metabolism and toxicity of arsenicals in
Watervolatility of PCDD/Fs
74
cultured cells. In Arsenic Exposure and Health Effecs: Proceedings of the ThirdInternational Conference on Arsenic Exposure and Health Effects (Chappell W R,Abernathy C O, and Calderon R L, Eds.) San Diego, CA, Elsevire Science Ltd.,Oxford U K. pp311-323.
Tamaki, S., Frankenberger, W. T., 1992. Environmental Biochemistry of Arsenic. Jr.Rev. Environ. Contam. Toxicol. 124, 79-110.
Thorgeirsson, U.P., Dalgard, D.W., Reeves, J., Adamson, R.H., 1994. TumourIncidence in a Chemical Carcinogenesis Study of Nonhuman Primates. Regul.Toxicol. Pharmacol. 19,130-151.
Tran, H.P. Prakash A.S., Barnard, R., Chiswell, B., Ng, J.C., 2002. Arsenic inhibitsthe repair of DNA induced by benzo(a)pyrene. Toxicology Letters, 133, 59-67.
Tseng, C.H., Tseng, C.P., Chiou, H.Y., Hsueh, Y.M., Chong, C.K., Chen, C.J., 2002.Epidemiologic Evidence of Diabetognic Effect of Arsenic. Toxicology Letters.133, 69-76.
Tseng, W. P., 1977. Effects and Dose-Response Relationships of Skin Cancer andBlackfoot Disease with Arsenic. Environmental Health Perspectives. 19, 109-119.
Tseng, W. P., Chu, H.M., How, S.W., Fong, J.M., Lin, C.S., Yeh, S., 1968.Prevalence of Skin Cancer in an Endemic Area of Chronic Arsenicism in Taiwan.Journal of the National Cancer Institute. 40, 453-463.
USEPA, 1984. Health Assessment Document for Inorganic Arsenic. Final Report.EPA 600/8-83/021F. U.S. Environmental Protection Agency. Office of Health andEnvironmental Assessment, Environmental Criteria and Assessment Office,Cincinnati, Ohio.
USEPA,1994. Carcinogenicity Peer Review of Cacodylic Acid. Memorandum from S.Malish and E. Rinde to C. Giles-Parker and J. Elllenberger. U.S. EPA, Office ofPesticides and Toxic substances, Wanshington, D.C.
USEPA, 2000 Federal Register. 65(121) /Thursday, June 22, 2000.
Vallee, B.L., Ulmer, D.D., Wacker, W.E.C., 1960. Arsenic Toxicology andBiochemistry. AMA Arch. Ind.Med. 21, 56-75.
Wang, L. F., Huang, J. Z., 1994. Chronic Arsenism From Drinking Water in SomeAreas of Xinjiang, China. In: Arsenic in the Environment, Part II: Human Healthand Ecosystem Effects. Edited by J O Nriagu, John Wiley & Sons, Inc, 159-172.
Wang, L.F., 1997. The Endemic Arsenic Poisoning and Blackfoot Disease. People’sHealth Publishing House of Xinjiang, Urumqi, P. R. China (in Chinese).
Wanibuchi, H., Fukushima, S., 2000. Carcinogenicity of an Organic Arsenic,Dimethylarsenic Acid in Animals. XXIII International Congress of theInternational Academy of Pathology and 14 th World Congress of Academic andEnvironmental Pathology, Nagoya, Japan.
Wanibuchi, H., Hori, T., Meenakshi, V., Ichihara, T., Yamamoto, S., Yano, Y., Otani,S., Nakae, D., Konishi, Y., Fukushima, S., 1997. Promotion of RatHepatocarcinogenesis by Dimethylarsinic Acid: Association with ElevatedOrnithine Decarboxylase Activity and Formation of 8-hydroxydeoxyguanosine inthe Liver. Jpn J Cancer Res. 88, 1149-1154.
Wanibuchi, H., Yamamoto, S., Chen, H., Yoshida, K., Endo, G., Hori, T., Fukushima,S., 1996. Promotion Effects of Dimethylarsinic Acid on N-butyl-N-(4-hydroxybutyl) nitrosamine-induced Urinary Bladder Carcinogenesis in Rats.Carcinogenesis. 17, 2435-2439.
Watervolatility of PCDD/Fs
75
Wei, Li., Wanibuchi, H., Salim, E.I., Yamamoto, S., Yoshida, K., Endo, G.,Fukushima, S., 1998. Promotion of NCI-Black-Reiter Male Rat bladderCarcinogenesis by Dimethylarsinic Acid an Organic Arsenic Compound. CancerLetters. 134, 29-36.
Wei, M., Wanibuchi, H., Yamamoto, S., Wei, Li., Fukushima, S., 1999. UrinaryBladder Carcinogenicity of Dimethylarsinic Acid in Male F344 Rats.Carcinogenesis. 20, 1873-1876.
Welch, A. H., Lico, M. S., Hughes, J. L., 1988. Arsenic in Ground Water of theWestern United States. GROUND WATER. 26, 333-348 May-June.
Winship, K. A., 1984. Toxicity of Inorganic Arsenic Salts. Adverse Drug Reactionsand Acute Poisoning Reviews. 3, 129-160.
Yamamoto, S., Konishi, Y., Matusuda, T., Murai, T., Shibata, M.A., Matsui-Yuasa, I.,Otani, S., Kuroda, K., Endo, G., Fukushima, S., 1995. Cancer Induction by anOrganic Arsenic Compound, Dimethylarsinic Acid (Cacodylic Acid), inF344/DuCrj Rats After Pretreatment with Five Carcinogens. Cancer Research. 55,1271-1276.
Yamamoto, S., Wanibuchi, H., Hori, T., Yano, Y., Matsui-Yuasa, I., Otani, S., Chen,H., Yoshida, K., Kuroda, K., Endo, G., Fukushima, S., 1997. PossibleCarcinogenic Potential of Dimethylarsenic Acid as Assessed in Rat in vivoModels: a Review. Mutation Research. 386, 353-361.
Yamanaka, K., Hoshino, M., Okanoto, M., Sawamura, R., Hasegawa, A., Okada, S.,1990. Induction of DNA Damage by Dimethylarsine, a Metabolite of InorganicArsenics, is for the Major Part Likely Due to its Peroxyl Radical. Biochem.Biophys. Res. Commun. 168, 58-64.
Yamanaka, K., Katsumata, K., Ikuma, K., Hasegawa, A., Nakano, M., Okada, S.,2000. The Role of Orally Administered Dimethylarsinic Acid, A Main Metaboliteof Inorganic Arsenics, In The Promotion And Progression of UVB-induced SkinTumourigenesis in Hairless Mice. Cancer Letters.152, 79-85.
Yamanaka, K., Mizol, M., Kato, K., Hasegawa, A., Nakano, M., Okada, S., 2001.Oral Administration of Dimethyarsinic Acid, a Main Metabolite of InorganicArsenic, In Mice Promotes Skin Tumourigenesis Initiated ByDimethylbenz(a)anthracene with or withour Ultraviolet B as a Promoter.Biological Phamacy Bulletin. 24, 510-514.
Yamanaka, K., Ohba, H., Hasegawa, A., Sawamura, R., Okada, S., 1989.Mutagenicity of Dimethylated Metabolites of Inorganic Arsenics.Chem.Pharm.Bull. 37, 2753-2756.
Yamanaka, K., Ohtsubo, K., Hasegawa, A., Hiroyuki, H., Ohji, H., Kanisawa, M.,Okada S., 1996. Exposure to Dimethyarsinic Acid, A Main Metabolite ofInorganic Arsenics, Strongly Promotes Tumourigenesis Initiated By 4-nitroquinoline 1-oxide in the Lungs of Mice. Carcinogenesis. 17, 767-770.
Yamanaka, K., Okada, S., 1994. Induction of Lung-specific DNA Damage byMetabolically Methylated Arsenics via the Production of Free Radicals. EnvironHealth Perspect. 102 Suppl 3, 37-40.
Yeh, S., 1973. Skin Cancer in Chronic Arsenicism. Hum.Pathol. 4, 469-485.Zhao, P.W., 1963. Report of Arsenic Poisoning Accident in Dan Zai Mercury Mine.
Collection of Sanitation and Antiepidemic Material (Antiepidemic Station ofGuizhou Province, China) (in Chinese).
Zheng, B.S., Yu, X. Y., Zhang, J., 1994. The Geochemistry of Arsenic with Healthand Diseases. (in Chinese).