examination of the armagh observatory annual mean ... · pdf fileexamination of the armagh...
TRANSCRIPT
NASA/TP—2006–214434
Examination of the Armagh Observatory Annual Mean Temperature Record, 1844–2004Robert M. Wilson and David H. HathawayMarshall Space Flight Center, Marshall Space Flight Center, Alabama
July 2006
National Aeronautics andSpace AdministrationIS20George C. Marshall Space Flight CenterMarshall Space Flight Center, Alabama35812

The NASA STI Program Office…in Profile
Since its founding, NASA has been dedicated tothe advancement of aeronautics and spacescience. The NASA Scientific and Technical Information (STI) Program Office plays a keypart in helping NASA maintain this importantrole.
The NASA STI Program Office is operated by Langley Research Center, the lead center for NASA’s scientific and technical information. The NASA STI Program Office provides access to the NASA STI Database, the largest collection of aeronautical and space science STI in the world. The Program Office is also NASA’s institutional mechanism for disseminating the results of its research and development activities. These results are published by NASA in the NASA STI Report Series, which includes the following report types:
• TECHNICAL PUBLICATION. Reports of completed research or a major significant phase of research that present the results of NASA programs and include extensive data or theoretical analysis. Includes compilations of significant scientific and technical data and information deemed to be of continuing reference value. NASA’s counterpart of peer-reviewed formal professional papers but has less stringent limitations on manuscript length and extent of graphic presentations.
• TECHNICAL MEMORANDUM. Scientific and technical findings that are preliminary or of specialized interest, e.g., quick release reports, working papers, and bibliographies that contain minimal annotation. Does not contain extensive analysis.
• CONTRACTOR REPORT. Scientific and technical findings by NASA-sponsored contractors and grantees.
• CONFERENCE PUBLICATION. Collected papers from scientific and technical conferences, symposia, seminars, or other meetings sponsored or cosponsored by NASA.
• SPECIAL PUBLICATION. Scientific, technical, or historical information from NASA programs, projects, and mission, often concerned with subjects having substantial public interest.
• TECHNICAL TRANSLATION. English-language translations of foreign
scientific and technical material pertinent to NASA’s mission.
Specialized services that complement the STI Program Office’s diverse offerings include creating custom thesauri, building customized databases, organizing and publishing research results…even providing videos.
For more information about the NASA STI Program Office, see the following:
• Access the NASA STI Program Home Page at http://www.sti.nasa.gov
• E-mail your question via the Internet to [email protected]
• Fax your question to the NASA Access Help Desk at 301–621–0134
• Telephone the NASA Access Help Desk at 301–621–0390
• Write to: NASA Access Help Desk NASA Center for AeroSpace Information 7121 Standard Drive Hanover, MD 21076–1320 301–621–0390

�
NASA/TP—2006–214434
Examination of the Armagh Observatory Annual Mean Temperature Record, 1844–2004Robert M. Wilson and David H. HathawayMarshall Space Flight Center, Marshall Space Flight Center, Alabama
July 2006
Nat�onal Aeronaut�cs andSpace Adm�n�strat�on
Marshall Space Fl�ght Center • MSFC, Alabama 35812

��
Ava�lable from:
NASA Center for AeroSpace Informat�on Nat�onal Techn�cal Informat�on Serv�ce7121 Standard Dr�ve 5285 Port Royal RoadHanover, MD 21076–1320 Springfield, VA 22161301–621–0390 703–487–4650
Acknowledgments
The authors thank C.J. Butler and colleagues (Armagh Observatory, College H�ll, Armagh, Northern Ireland, Un�ted K�ngdom) for prov�d�ng access to the long-term temperature records at Armagh Observatory, wh�ch are
now ava�lable onl�ne at <http://cl�mate.arm.ac.uk/cal�brated.html>.
���
TABLE OF CONTENTS
1. INTRODUCTION .......................................................................................................................... 1
2. RESULTS AND DISCUSSION ..................................................................................................... 2
3. CONCLUSION ............................................................................................................................... 12
REFERENCES .................................................................................................................................... 14

�v
v
LIST OF FIGURES
1. Annual mean var�at�on of Armagh Observatory temperature, T (lower panel); the aa-geomagnet�c �ndex, aa (m�ddle panel); and sunspot number, R (upper panel). The th�n l�nes are the annual means and the th�ck l�nes are the 10-year mov�ng averages. The numbers 9–23 �n the upper panel refer to sunspot cycles 9–23. See text for add�t�onal remarks ................................................................................................................ 3
2. The res�dual T10 – T10(aa10) (lower panel) and T10 – T10(R10) (upper panel), where T10 �s the 10-year mov�ng average of temperature and T10(aa10) and T10(R10) are the regression fits (T10 versus aa10 and T10 versus R10). See text for deta�ls ................. 4
3. Variation of temperature <T> (lower panel), the aa-geomagnet�c �ndex <aa> (m�ddle panel), and sunspot number <R> (upper panel) averaged over each sunspot cycle 9–23. The th�n l�ne �s the cycl�c average and the th�ck l�ne �s a 2-cycle mov�ng average. See text for deta�ls ..................................................................................... 5
4. Scatterplots of <T> versus <aa> (lower-left panel), <T> versus <R> (lower-r�ght panel), <T>2 versus <aa>2 (upper-left panel) and <T>2 versus <R>2 (upper-r�ght panel). See text and nomenclature for deta�ls ................................................................................... 6
5. The res�dual <T> – <T>aa (lower panel), <T>2 – <T>aa2 (lower-m�ddle panel), <T> – <T>R (upper-m�ddle panel), and <T>2 – <T>R2 (upper panel), where <T>aa is the regression fit for <T> versus <aa>, <T>aa2 is the regression fit for <T>2 versus <aa>2, <T>R is the regression fit for <T> versus <R> and <T>R2 �s the regression fit for <T>2 versus <R>2. See text and nomenclature for deta�ls ........................ 8
6. Scatterplots of average temperature for even-odd Hale cycle group�ngs versus temperature for the even-lead�ng cycle (left panel) and temperature for odd-even Hale cycle group�ngs versus temperature for the odd-lead�ng cycle (r�ght panel). See text and nomenclature for deta�ls ................................................................................... 9
7. Cycl�c var�at�on of average temperature <<T>> (lower panel), the aa-geomagnet�c �ndex <<aa>> (m�ddle panel) and sunspot number <<R>> (upper panel) for Hale cycles 1–7, us�ng the preferred even-odd group�ng of sunspot cycles. See text for deta�ls ................................................................................................................ 10
8. Scatterplots of <<T>> versus <<aa>> (left panel), <<T>> versus <<R>> (m�ddle panel) and <<T>> versus Hale cycle length �n years. See text and nomenclature for deta�ls ......... 11

v�
NOMENCLATURE
aa annual aa-geomagnet�c �ndex
aa10 10-year mov�ng average of the aa-geomagnet�c �ndex
<aa> average aa over a sunspot cycle
<<aa>> average aa over a Hale cycle
<aa>2 2-cycle mov�ng average of <aa>
°C degrees Cent�grade
cl confidence level
r coefficient of correlation
r2 coefficient of determination (amount of variance explained by the inferred regression)
R annual sunspot number
R10 10-year mov�ng average of sunspot number
<R> average R over a sunspot cycle
<<R>> average R over a Hale cycle
<R>2 2-cycle mov�ng average of <R>
se standard error of est�mate
t the t-stat�st�c for �ndependent samples
T annual mean temperature at Armagh Observatory
T10 10-year mov�ng average of T
<T> average T over a sunspot cycle
<T>aa the �nferred regress�on for <T> versus <aa>

v��
NOMENCLATURE (Continued)
<T>aa2 the �nferred regress�on for <T>2 versus <aa>2
<T>R the �nferred regress�on for <T> versus <R>
<T>R2 the �nferred regress�on for <T>2 versus <R>2
<<T>> the average T over a Hale cycle
<T>2 2-cycle mov�ng average of <T>
T10(aa10) the �nferred regress�on of T10 versus aa10
T10(R10) the �nferred regress�on of T10 versus R10
x the �ndependent var�able
y the dependent var�able

v���

1
TECHNICAL PUBLICATION
EXAMINATION OF THE ARMAGH OBSERVATORY ANNUAL MEAN TEMPERATURE RECORD, 1844–2004
1. INTRODUCTION
The Armagh Observatory temperature record �s one of the longest ava�lable for study.1–3 Mean temperature read�ngs based on max�mum and m�n�mum thermometers extend from 1844 to the present, where mean temperature is defined as the mean of the daily maximum and minimum temperatures.
Armagh Observatory3 l�es about 1 km northeast of the center of the anc�ent c�ty of Armagh �n Northern Ireland, being located at latitude 54°21.2́N and longitude 6°38.9́W and situated about 64 m above mean sea level at the top of a small h�ll �n an estate of natural woodland and parkland that measures about 7 ha. Stud�es have shown that �ts rural env�ronment has ensured that the observatory suffers from l�ttle or no urban m�crocl�mat�c effects4 and that the temperature read�ngs can be used as a proxy for study�ng long-term trends �n annual mean temperature for the northern hem�sphere and globe.2,3
The purpose of th�s study, then, �s to exam�ne the extended Armagh Observatory annual mean temperature record spann�ng 1844–2004, �nvest�gat�ng trends �n the data �nd�cat�ve of cl�mat�c change. In part�cular, th�s study updates a prev�ous one that was based on the Armagh data spann�ng 1844–1992.2

2
2. RESULTS AND DISCUSSION
F�gure 1 d�splays the Armagh Observatory annual mean temperature T (1844–2004) �n the lower panel, �n compar�son w�th the annual mean aa-geomagnet�c �ndex (1868–2004) �n the m�ddle panel and the annual mean sunspot number R (1840–2004) �n the top panel, all drawn as th�n l�nes. Ten-year mov�ng averages of each are drawn as the th�ck l�nes, and the numbers appear�ng �n the top panel refer to sunspot cycle numbers 9–23.
Concern�ng T, �t has a mean of 9.215 °C, a standard dev�at�on of 0.521 °C and a med�an of 9.20 °C. For the �nterval 1844–2004, 82 values of T are equal to or above the med�an and 79 values of T are less than the median, occurring in 65 runs. Based on these values, one finds that T appears to be d�str�buted nonrandomly at the 2-percent level of significance (or 98-percent confidence level (cl)).5 Furthermore, the average T for the first half of the record (1844–1923) is significantly lower than the average for the latter half of the record (1924–2004) at the 0.1-percent level of significance (or 99.9-percent cl), based on the t-stat�st�c for �ndependent samples.6 During the first half of the record, the average T measured 9.028 °C, hav�ng a standard dev�at�on of 0.518 °C, wh�le dur�ng the latter half �t measured 9.400 °C, having a standard deviation of 0.455 °C. Thus, there has been a significant warming that appears to vary systemat�cally rather than randomly.
The h�ghest T occurred �n 1846 and measured 10.40 °C, wh�le the lowest T occurred �n 1879 and measured 7.40 °C. The h�ghest T10 (10-year mov�ng average of T) occurred �n 1999 (the last entry) and measured 9.95 °C, wh�le the lowest T10 occurred �n 1883 and measured 8.44 °C. Thus, from 1883 to 1999, T10 has �ncreased 1.51 °C, and for 7 of the last 10 years (end�ng �n 2004), T has exceeded 10 °C, unprecedented �n the preced�ng years of the temperature record.
Concern�ng T10, one finds that it decreased rather smoothly from 1849 (its first entry), having a value of 9.45 °C, to 1883 when the lowest value was seen. Th�s was followed by a rather steady �ncrease to a local peak of 9.58 °C �n 1945, a sl�ght decrease between 1945 and 1982 (to 9.05 °C) and then a sharp �ncrease to �ts h�ghest value recorded so far (through 1999, the end of the T10 record).
For the contemporaneous �nterval 1868–2004, T correlates strongly w�th both aa (r = 0.34, se = 0.44 °C) and R (r = 0.24, se = 0.51 °C), wh�le for the contemporaneous �nterval 1873–1999 T10 correlates strongly w�th aa10 (r = 0.71, se = 0.22 °C) and R10 (r = 0.67, se = 0.23 °C), where the subscr�pt 10 refers to the 10-year mov�ng average (aa10 correlates strongly w�th R10, hav�ng r = 0.933). The �nferred regress�on for T versus aa �s T = 8.639 + 0.029 aa; the �nferred regress�on for T versus R �s T = 9.044 + 0.003 R; the �nferred regress�on for T10 versus aa10 �s T10 = 8.190 + 0.051 aa10; and the �nferred regress�on for T10 versus R10 �s T10 = 8.562 + 0.011 R10. A b�var�ate analys�s us�ng both aa10 and R10 results �n T10 = 8.205 + 0.048 aa10 + 0.001 R10, having a correlation coefficient of 0.71 and a standard error of estimate of 0.22 °C (the bivariate fit offers no significant improvement over the single-variate fits).

3
1840 1860 1880 1900 1920 1940 1960 1980 2000
Calendar Year
Ann
ual M
ean
Tem
pera
ture
(°C
) a
t Arm
agh
Obs
erva
tory
(T)
Ann
ual M
ean
(aa)
–Geo
mag
netic
Inde
x (a
a)
9 10 11 12 13 14 15 16 17 18 19 20 21 22 23
Ann
ual M
ean
Suns
pot N
umbe
r (R
)
7
8
9
10
11
10
0
20
30
40
100
200
Lowest T = 7.40 °CHighest T = 10.40 °C
Lowest T10 = 8.44 °CHighest T10 = 9.95 °C
0
F�gure 1. Annual mean var�at�on of Armagh Observatory temperature, T (lower panel); the aa-geomagnet�c �ndex, aa (m�ddle panel); and sunspot number, R (upper panel). The th�n l�nes are the annual means and the th�ck l�nes are the 10-year mov�ng averages. The numbers 9–23 �n the upper panel refer to sunspot cycles 9–23. See text for add�t�onal remarks.
4
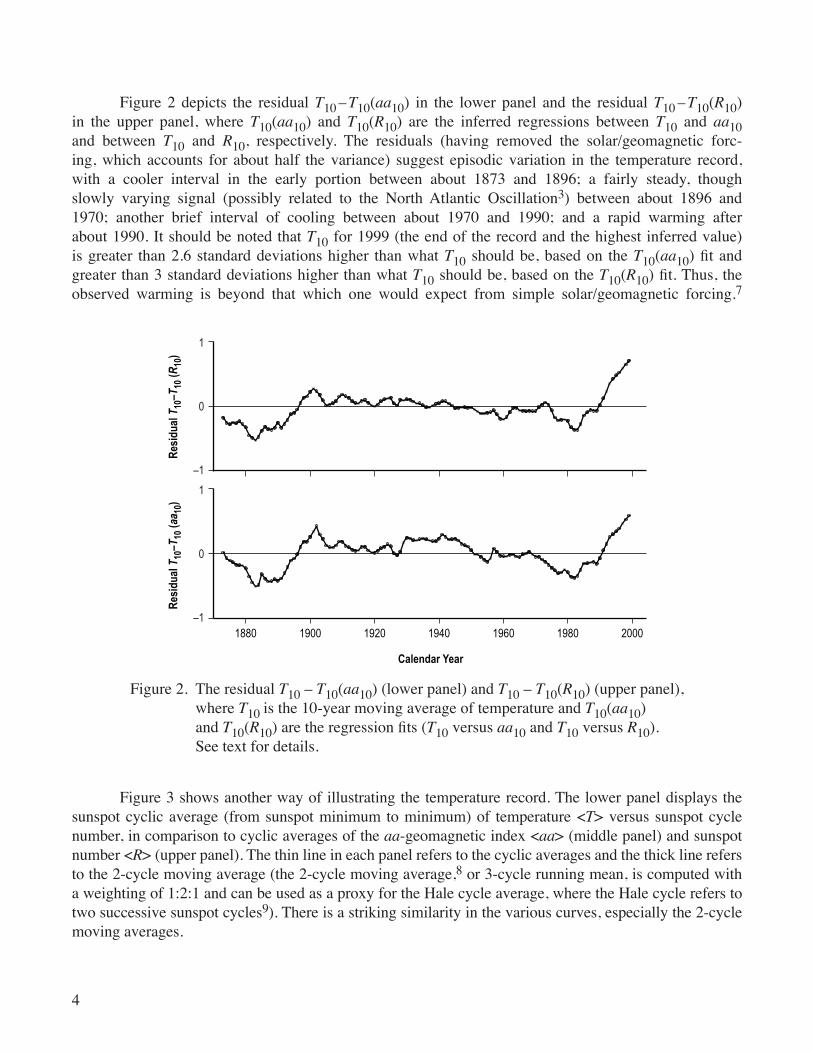
F�gure 2 dep�cts the res�dual T10 – T10(aa10) �n the lower panel and the res�dual T10 – T10(R10) �n the upper panel, where T10(aa10) and T10(R10) are the �nferred regress�ons between T10 and aa10 and between T10 and R10, respect�vely. The res�duals (hav�ng removed the solar/geomagnet�c forc-�ng, wh�ch accounts for about half the var�ance) suggest ep�sod�c var�at�on �n the temperature record, w�th a cooler �nterval �n the early port�on between about 1873 and 1896; a fa�rly steady, though slowly vary�ng s�gnal (poss�bly related to the North Atlant�c Osc�llat�on3) between about 1896 and 1970; another br�ef �nterval of cool�ng between about 1970 and 1990; and a rap�d warm�ng after about 1990. It should be noted that T10 for 1999 (the end of the record and the h�ghest �nferred value) �s greater than 2.6 standard dev�at�ons h�gher than what T10 should be, based on the T10(aa10) fit and greater than 3 standard dev�at�ons h�gher than what T10 should be, based on the T10(R10) fit. Thus, the observed warm�ng �s beyond that wh�ch one would expect from s�mple solar/geomagnet�c forc�ng.7
1880 1900 1920 1940 1960 1980 2000
Calendar Year
Res
idua
lT10
–T10
(aa 10
)R
esid
ualT
10–T
10 (R
10)
1
0
–1
1
0
–1
F�gure 2. The res�dual T10 – T10(aa10) (lower panel) and T10 – T10(R10) (upper panel), where T10 �s the 10-year mov�ng average of temperature and T10(aa10) and T10(R10) are the regression fits (T10 versus aa10 and T10 versus R10). See text for deta�ls.
F�gure 3 shows another way of �llustrat�ng the temperature record. The lower panel d�splays the sunspot cycl�c average (from sunspot m�n�mum to m�n�mum) of temperature <T> versus sunspot cycle number, �n compar�son to cycl�c averages of the aa-geomagnet�c �ndex <aa> (m�ddle panel) and sunspot number <R> (upper panel). The th�n l�ne �n each panel refers to the cycl�c averages and the th�ck l�ne refers to the 2-cycle mov�ng average (the 2-cycle mov�ng average,8 or 3-cycle runn�ng mean, �s computed w�th a we�ght�ng of 1:2:1 and can be used as a proxy for the Hale cycle average, where the Hale cycle refers to two success�ve sunspot cycles9). There �s a str�k�ng s�m�lar�ty �n the var�ous curves, espec�ally the 2-cycle mov�ng averages.

5
Taa
R
20
30
10
60
80
100
40
8 10 12 14 16
Sunspot Cycle Number
18 20 22 24
10
9
8
Figure 3. Variation of temperature <T> (lower panel), the aa-geomagnet�c �ndex <aa> (m�ddle panel), and sunspot number <R> (upper panel) averaged over each sunspot cycle 9–23. The th�n l�ne �s the cycl�c average and the th�ck l�ne �s a 2-cycle mov�ng average. See text for deta�ls.
6
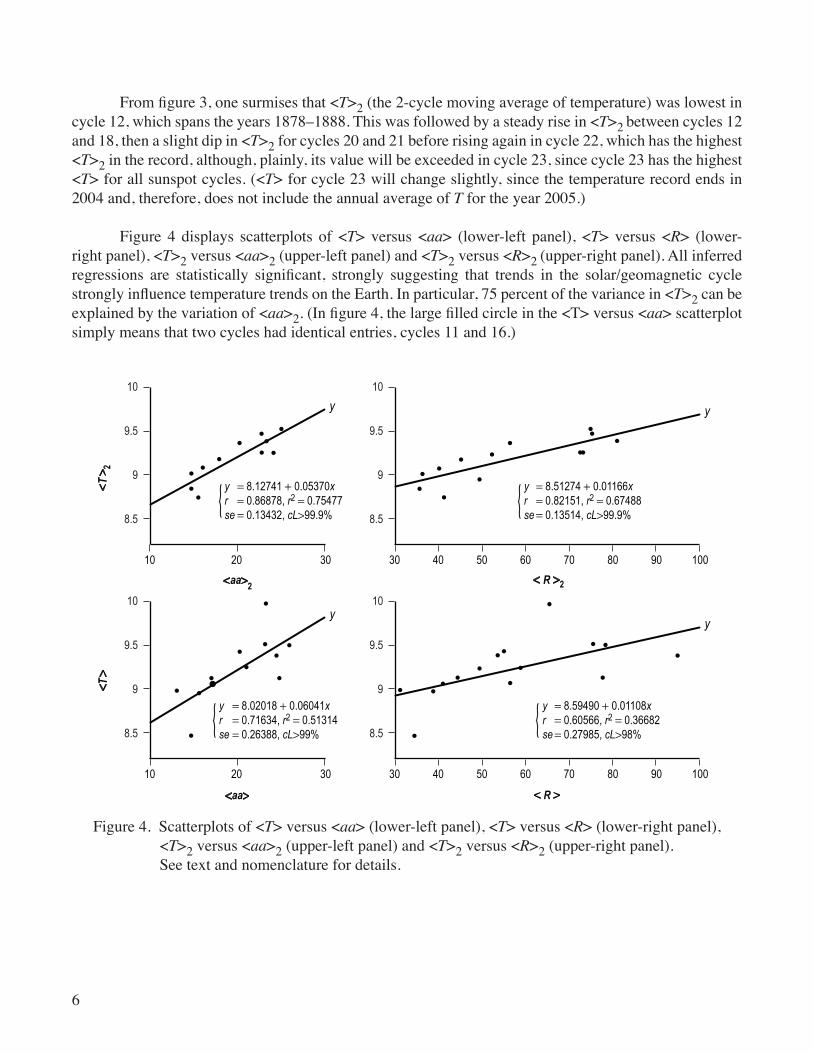
From figure 3, one surmises that <T>2 (the 2-cycle mov�ng average of temperature) was lowest �n cycle 12, wh�ch spans the years 1878–1888. Th�s was followed by a steady r�se �n <T>2 between cycles 12 and 18, then a sl�ght d�p �n <T>2 for cycles 20 and 21 before r�s�ng aga�n �n cycle 22, wh�ch has the h�ghest <T>2 �n the record, although, pla�nly, �ts value w�ll be exceeded �n cycle 23, s�nce cycle 23 has the h�ghest <T> for all sunspot cycles. (<T> for cycle 23 w�ll change sl�ghtly, s�nce the temperature record ends �n 2004 and, therefore, does not �nclude the annual average of T for the year 2005.)
F�gure 4 d�splays scatterplots of <T> versus <aa> (lower-left panel), <T> versus <R> (lower-r�ght panel), <T>2 versus <aa>2 (upper-left panel) and <T>2 versus <R>2 (upper-r�ght panel). All �nferred regressions are statistically significant, strongly suggesting that trends in the solar/geomagnetic cycle strongly influence temperature trends on the Earth. In particular, 75 percent of the variance in <T>2 can be expla�ned by the var�at�on of <aa>2. (In figure 4, the large filled circle in the <T> versus <aa> scatterplot s�mply means that two cycles had �dent�cal entr�es, cycles 11 and 16.)
T
y
y 8.02018 0.06041xr 0.71634, r2 0.51314se 0.26388, cL 99%
aa
y
y 8.59490 0.01108xr 0.60566, r2 0.36682se 0.27985, cL 98%
R
T2
10 20 30
y
y 8.12741 0.05370xr 0.86878, r2 0.75477se 0.13432, cL 99.9%
aa2
30 40 50 60 70 80 90 100
y
y 8.51274 0.01166xr 0.82151, r2 0.67488se 0.13514, cL 99.9%
R 2
10
9.5
9
8.5
10
9.5
9
8.5
10
9.5
9
8.5
10
9.5
9
8.5
10 20 30 30 40 50 60 70 80 90 100
F�gure 4. Scatterplots of <T> versus <aa> (lower-left panel), <T> versus <R> (lower-r�ght panel), <T>2 versus <aa>2 (upper-left panel) and <T>2 versus <R>2 (upper-r�ght panel). See text and nomenclature for deta�ls.

7
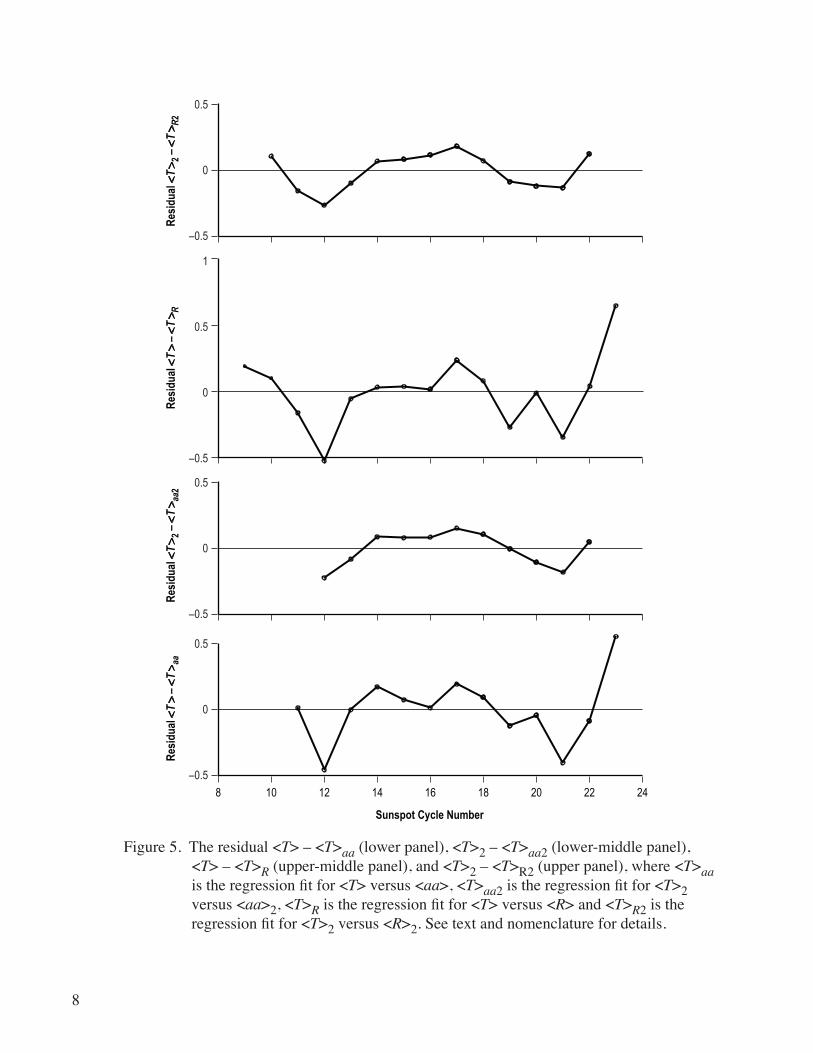
F�gure 5 shows the res�duals of cycl�c temperature, hav�ng removed the effects of the solar/geomagnet�c cycle. The lower panel shows the res�dual <T> – <T>aa, where <T>aa is the regression fit for <T> versus <aa>; the lower-m�ddle panel shows the res�dual <T>2 – <T>aa2, where <T>aa2 �s the regression fit for <T>2 versus <aa>2; the upper-m�ddle panel shows the res�dual <T> – <T>R, where <T>R is the regression fit for <T> versus <R>; and the upper panel shows the res�dual <T>2 – <T>R2, where <T>R2 is the regression fit for <T>2 versus <R>2. The res�dual �s most negat�ve �n cycles 12 and 21, suggest�ng, perhaps, a 9-cycle var�at�on �n temperature. Such a var�at�on may be related to a supposed 90–100 year var�at�on, bel�eved to be embedded �n the solar/geomagnet�c record.10–12 The res�dual for cycle 23 based on <aa> or <R> �s 0.55 °C and 0.65 °C, respect�vely, both be�ng greater than 2 standard deviations higher than that suggested by the regression fits. Hence, during cycle 23 temperatures on Earth are significantly warmer than can be explained simply by solar/geomagnetic forcing.
Because of the highly significant correlations between <T>2 and both <aa>2 and <R>2, �t �s apparent that temperature �s poss�bly related to the Hale cycle, e�ther to the strength of the Hale cycle or, perhaps, �ts length (a Hale cycle cons�sts of two success�ve sunspot cycles, where the magnet�c polar�t�es of lead�ng and follow�ng sunspots �n each of the Sun’s northern and southern hem�sphere reverse from one sunspot cycle to the next, with positive magnetic fields leading in odd-numbered sunspot cycles in the northern hem�sphere). F�gure 6 dep�cts the scatterplots of <<T>> even-odd cycles versus <T> even-lead�ng cycle for each Hale cycle pa�r, grouped as even-odd cycle pa�rs (left panel) and <<T>> odd-even cycles versus <T> odd-lead�ng cycle for each Hale cycle pa�r, grouped as odd-even cycle pa�rs (r�ght panel). The �nferred correlat�on appears strongest for the even-odd cycle group�ng, although both regress�ons are stat�st�cally important. The large filled circle in the right panel simply means that two entries were identical for odd-even cycle pa�rs 9–10 and 19–20. Also, �t should be noted that s�nce an est�mate of <T> can be made for cycle 23, hav�ng <T> = 9.97 °C, one can forecast <<T>> for the odd-even cycle pa�r of cycles 23–24; namely, <<T>>23–24 = 9.99 ± 0.29 °C, th�s be�ng the 90-percent pred�ct�on �nterval.
8
8 10 12 14 16
Sunspot Cycle Number
18 20 22 24
Res
idua
lT
–
Taa
Res
idua
lT
2 –
Taa
2R
esid
ual
T –
T
RR
esid
ual
T2
– T
R2
0.5
0
–0.5
1
0.5
0
–0.5
0.5
0
–0.5
0.5
0
–0.5
F�gure 5. The res�dual <T> – <T>aa (lower panel), <T>2 – <T>aa2 (lower-m�ddle panel), <T> – <T>R (upper-m�ddle panel), and <T>2 – <T>R2 (upper panel), where <T>aa is the regression fit for <T> versus <aa>, <T>aa2 is the regression fit for <T>2 versus <aa>2, <T>R is the regression fit for <T> versus <R> and <T>R2 �s the regression fit for <T>2 versus <R>2. See text and nomenclature for deta�ls.

9
T E
ven-
odd
yy 1.93841 0.79624xr 0.915, r2 0.837se 0.137, cL 99.5%
T Even-leading
T O
dd-e
ven
8 9 9.5 108.5
yy –0.68292 1.07076xr 0.802, r2 0.644se 0.162, cL 95%
T Odd-leading
10
9.5
9
8.58 9 9.5 108.5
10
9.5
9
8.5
F�gure 6. Scatterplots of average temperature for even-odd Hale cycle group�ngs versus temperature for the even-lead�ng cycle (left panel) and temperature for odd-even Hale cycle group�ngs versus temperature for the odd-lead�ng cycle (r�ght panel). See text and nomenclature for deta�ls.
F�gure 7 d�splays the var�at�on of average temperature <<T>> (lower panel) over each Hale cycle even-odd cycle pair, where Hale cycle 1 is defined as sunspot cycles 10 + 11, Hale cycle 2 as sunspot cycles 12 + 13, and so forth. Also shown are the Hale cycle averages of the aa-geomagnet�c �ndex <<aa>> (m�ddle panel) and sunspot number <<R>> (upper panel). Aga�n, very strong resemblance �s apparent between the parameters. For example, there �s a d�p �n <<T>> for Hale cycle 2 (sunspot cycles 12 + 13), a local peak for Hale cycle 5 (sunspot cycles 18 + 19), another local d�p for Hale cycle 6 (sunspot cycles 20 + 21) and a steep r�se to Hale cycle 7 (sunspot cycles 22 + 23). For the current Hale cycle 7, <<T>> averages 9.72 °C, wh�ch �s 1 °C h�gher than the m�n�mum �n Hale cycle 2 (8.72 °C) and wh�ch �s the h�ghest average of all the Hale cycles. (Recall, however, that the average temperature for Hale cycle 7 �s really �ncomplete, because temperature data for the year 2005 has not yet been posted. Inclus�on of the temperature for 2005, however, w�ll not greatly affect the average temperature for Hale cycle 7.)

10
20
25
15
10
20 4
Hale Cycle Number
6 8
Taa
R
Hale Cycle Numbers
1: Cycles 10 112: Cycles 12 133: Cycles 14 154: Cycles 16 175: Cycles 18 196: Cycles 20 217: Cycles 22 23
100
75
50
25
0
10
9.5
9
8.5
F�gure 7. Cycl�c var�at�on of average temperature <<T>> (lower panel), the aa-geomagnet�c �ndex <<aa>> (m�ddle panel) and sunspot number <<R>> (upper panel) for Hale cycles 1–7, us�ng the preferred even-odd group�ng of sunspot cycles. See text for deta�ls.

11
F�gure 8 shows the scatterplots of <<T>> for each Hale cycle even-odd cycle pa�r versus <<aa>> (left panel), <<R>> (m�ddle panel) and Hale cycle length �n years (r�ght panel). In all cases, the �nferred regress�ons are stat�st�cally �mportant. In part�cular, the �nverse correlat�on between <<T>> and the length of the Hale cycle (assoc�at�ng h�gher temperature w�th shorter Hale cycle length) �s qu�te strong (at the 0.2-percent level of significance, or 99.8-percent cl). The inverse correlation has r = –0.937, a coefficient of determ�nat�on r2 = 0.877 (th�s be�ng a measure of the amount of var�ance expla�ned by the �nferred regress�on) and a standard error of est�mate se = 0.115 °C. Prev�ous stud�es have shown the �mportance of the length of the solar cycle—w�th respect to cl�mate.2,13–15 (F�gure 8 has been drawn presum�ng that Hale cycle 7—cycles 22–23—w�ll be 20 years �n length, mean�ng that cycle 24 has �ts onset �n the year 2006.16,17 If Hale cycle 7 �s longer than 20 years, th�s w�ll weaken the correlat�on.)
T
10 20 2515
2
3
4
6
5
7
y
y 7.87843 0.06766xr 0.85528, r2 0.73150se 0.20145, cL 95%
aa
25 75 10050
2
3
46
5
7
1
y
y 8.44483 0.01351xr 0.79130, r2 0.62616se 0.20199, cL 95%
R
22 2420
3
2
4 6
5
7
1
y
y 14.77667–0.25944xr –0.93660, r2 0.87721se 0.11518, cL 99.8%
Hale Cycle Length (years)
10
9.5
9
8.5
10
9.5
9
8.5
10
9.5
9
8.5
F�gure 8. Scatterplots of <<T>> versus <<aa>> (left panel), <<T>> versus <<R>> (m�ddle panel) and <<T>> versus Hale cycle length �n years. See text and nomenclature for deta�ls.

12
3. CONCLUSION
Previously, Wilson2 exam�ned the Armagh Observatory temperature record for the �nterval 1844–1992. The purpose of the present study was to revisit that original study, updating the findings using the corrected and more extens�ve 1844–2004 temperature read�ngs, wh�ch are now ava�lable onl�ne at <http://cl�mate.arm.ac.uk/cal�brated.html>.
The Armagh Observatory temperature record �s one of the longest ava�lable for study. A prom�nent feature of long-term temperature stud�es has been a general warm�ng s�nce the 1880s. Because both sunspot number and the aa-geomagnet�c �ndex have shown s�m�lar secular �ncreases, a strong assoc�at�on between trends �n global temperature on Earth and trends �n the solar/geomagnet�c cycle should be apparent.
The aa-geomagnet�c �ndex was �ntroduced �n 1972 by Mayaud18 to quantify fluctuations in the geomagnetic field, being based on pairs of near-antipodal magnetometers located in England and Australia. The record of the aa-geomagnet�c �ndex extends from 1868 to the present. Geomagnet�c act�v�ty, as character�zed us�ng the aa-geomagnet�c �ndex, �s caused by the solar w�nd, �n part�cular, coronal mass eject�ons and h�gh-speed streams from coronal holes and the assoc�ated changes of the �nterplanetary magnetic field, thereby, affecting the near-Earth interplanetary space.19,20 Hence, the aa-geomagnet�c �ndex should be h�ghly correlated w�th the sunspot cycle. In fact, as noted �n the prev�ous sect�on, aa10 and R10 (the 10-year mov�ng averages) are, �ndeed, h�ghly correlated, hav�ng r = 0.933. While true, the actual m�n�mum annual value of the aa-geomagnet�c �ndex usually lags sunspot m�n�mum (by one year21) and the max�mum annual value almost always occurs dur�ng the decl�n�ng phase of the sunspot cycle (only two exceptions—cycles 12 and 13; see fig. 1). Additionally, evidence exists that the aa-geomagnet�c �ndex can be decomposed �nto two components: one m�m�ck�ng the sunspot cycle and the other (the res�dual) be�ng �nd�cat�ve of recurrent h�gh-speed streams �n the solar w�nd.22,23
In th�s study, �t has been shown that temperature at the Armagh Observatory averaged 9.215 °C dur�ng the �nterval 1844–2004, hav�ng a standard dev�at�on of 0.521 °C and a med�an of 9.20 °C. Furthermore, annual mean temperatures at Armagh Observatory appear to vary systemat�cally and nonrandomly, bear�ng a strong resemblance to the solar/geomagnet�c cycle s�gnatures as expressed us�ng sunspot number and the aa-geomagnet�c �ndex (espec�ally, the 10-year mov�ng averages). The h�ghest T occurred �n 1846 (10.40 °C) and the lowest occurred �n 1879 (7.40 °C), wh�le the h�ghest T10 occurred �n 1999 (the last entry, 9.95 °C) and the lowest �n 1883 (8.44 °C). Thus, from 1883 to 1999, T10 rose 1.51 °C, or about 0.013 °C per year. For 7 of the last 10 years of the temperature record, annual mean temperatures at Armagh Observatory exceeded 10 °C, an unprecedented occurrence �n the record.
While there has been an overall rise (warming) in T10, s�m�lar to r�ses �n sunspot and geomagnet�c act�v�ty, the res�dual of temperature (hav�ng removed the effect of solar/geomagnet�c forc�ng) appears ep�sod�c, w�th �ntervals �nd�cat�ve of both cool�ng and warm�ng. The current warm�ng (through 1999) �s found to exceed that wh�ch one expects based on solar/geomagnet�c forc�ng by more than 2.6 standard dev�at�ons.7

13
Another way of �llustrat�ng temperature var�at�on �s the use of temperature averages over each solar cycle. Averaged �n th�s way, temperature var�at�ons strongly m�m�c those of the solar/geomagnet�c cycle. In part�cular, var�at�ons �n 2-cycle mov�ng averages of the parameters (a proxy for the Hale cycle—two success�ve sunspot cycles) are closely related, w�th <T>2 be�ng lowest �n cycle 12 and h�ghest �n cycle 22 (although �t w�ll undoubtedly be exceeded �n cycle 23). About 75 percent of the var�ance of <T>2 can be expla�ned by the var�at�on �n <aa>2. Furthermore, there may be a 9-cycle var�at�on embedded �n the temperature record, as well (as �n the sunspot record11).
Averages of temperature (<<T>>) over even-odd Hale cycle pa�rs, l�kew�se, strongly assoc�ates w�th s�m�lar averages for the solar/geomagnet�c cycle. Hale cycle 2 (sunspot cycles 12 + 13) has the lowest average temperature (8.72 °C) and Hale cycle 7 (sunspot cycles 22 + 23) has the h�ghest temperature (9.72 °C). While <<T>> correlates strongly aga�nst <<aa>> and <<R>>, an even stronger �nverse correlat�on (r = –0.937) �s found between <<T>> and the length of the Hale cycle, w�th h�gher average temperature be�ng assoc�ated w�th shorter Hale cycle length. Ind�cat�ons are that the next Hale cycle w�ll l�kely see even h�gher average temperature.
In conclus�on, th�s study has shown that solar/geomagnet�c cycle forc�ng �s embedded �n the annual mean temperatures at Armagh Observatory, Northern Ireland. Removal of th�s effect, however, does not fully expla�n, espec�ally, the rap�d r�se �n temperatures now be�ng exper�enced, th�s poss�bly be�ng a strong �nd�cat�on that humank�nd �s contr�but�ng to cl�mat�c change.24

14
REFERENCES
1. Butler, C.J.; and Johnston, D.J.: “A prov�s�onal long mean a�r temperature ser�es for Armagh Observatory,” J. Atmos. Terr. Phys., Vol. 58, p. 1,657, 1996.
2. Wilson, R.M.: “Evidence for solar-cycle forcing and secular variation in the Armagh Observatory temperature record (1844–1992),” J. Geophys. Res., Vol. 103. p. 11,159, 1998.
3. Butler, C.J.; García Suárez, A.M.; Coughl�n, A.D.S.; and Morrell. C.: “A�r temperatures at Armagh Observatory, Northern Ireland, from 1796 to 2002,” J. Climatol., Vol. 25, p. 1,055, 2005.
4. Coughl�n, A.D.S.; and Butler, C.J.: “Is urban spread affect�ng the mean temperature at Armagh Observatory,” Irish Astron. J., Vol. 25, p. 125, 1998.
5. Langley, R.: Practical Statistics Simply Explained, rev. ed., Dover, M�neola, N.Y., p. 322, 1971.
6. Lap�n, L.L.: Statistics for Modern Business Decisions, 2nd ed., Harcourt Brace Jovanov�ch, New York, p. 486, 1978.
7. Solanki, S.K.; Usoskin, I.G.; Kromer, B.; Schűssler; M.; and Beer, J.: “Unusual activity of the Sun dur�ng recent decades compared to the prev�ous 11,000 years,” Nature, Vol. 431, p. 1,084, 2004.
8. Longley-Cook, L.H.: Statistical Problems, Barnes & Noble Books, New York, p. 175, 1970. 9. Howard, R.: “Solar cycle, solar rotat�on and large-scale c�rculat�on,” sec. 2, �n Illustrated Glossary
for Solar Terrestrial and Solar Physics, A. Bruzek and C.J. Durrant (eds.), D. Re�del Publ. Co., Norwell, Mass., p.7, 1977.
10. Hoyt, D.V.; and Schatten, K.H.: The Role of the Sun in Climate Change, Oxford Un�vers�ty Press, New York, 1997.
11. Hathaway, D.H.; Wilson, R.M.; and Reichmann, E.J.: “Group sunspot numbers: Sunspot cycle character�st�cs,” Solar Phys., Vol. 211, p. 357, 2002.
12. Hathaway, D.H.; and Wilson, R.M.: “What the sunspot record tells us about space weather,” Solar Phys., Vol. 224, p. 5, 2004.
13. Fr��s-Chr�stensen, E.; and Lassen, K.: “Length of the solar cycle: An �nd�cator of solar act�v�ty closely assoc�ated w�th cl�mate,” Science, Vol. 254, p. 698, 1991.

15
14. Butler, C.J.: “Max�mum and m�n�mum temperatures at Armagh Observatory, 1844–1992, and the length of the sunspot cycle,” Solar Phys., Vol. 152, p. 35, 1994.
15. Butler, C.J.; and Johnston, D.J.: “The l�nk between the solar dynamo and cl�mate—The ev�dence from a long mean a�r temperature ser�es from Northern Ireland,” Irish Astron. J., Vol. 21, p. 251, 1994.
16. Wilson, RM.; and Hathaway, D.H.: “On the Relation Between Spotless Days and the Sunspot Cycle,” NASA/TP—2005—213608, Marshall Space Fl�ght Center, AL, January 2005.
17. Wilson, R.M.; and Hathaway, D.H.: “An Examination of Sunspot Number Rates of Growth and Decay �n Relat�on to the Sunspot Cycle,” NASA/TP—2006—214433, Marshall Space Fl�ght Center, AL, June 2006.
18. Mayaud, P.N.: “The aa �nd�ces: A 100-year ser�es character�z�ng the magnet�c act�v�ty,” J. Geophys. Res., Vol. 77, p. 6,870, 1972.
19. Lockwood, M; Stamper, R.; Wild, M.N.; Balogh, A.; and Jones, G.: “Our changing sun,” Astron. Geophys., Vol. 40, p. 4.10, 1999.
20. Stamper, R.; Lockwood, M.; Wild, M.N.; and Clark, T.D.G.: Solar causes of the long-term increase �n geomagnet�c act�v�ty,” J. Geophys. Res., Vol. 104, p. 28,325, 1999.
21. Wilson, R.M.: “On the Level of Skill in Predicting Maximum Sunspot Number: A Comparative Study of Single Variate and Bivariate Precursor Techniques,” Solar Phys., Vol. 125, p. 143, 1990.
22. Feynman, J.: “Geomagnet�c and solar w�nd cycles, 1900–1975,” J. Geophys. Res., Vol. 87, p. 6,153, 1982.
23. Hathaway, D.H.; Wilson, R.M.; and Reichmann, E.J.: “A synthesis of solar cycle prediction techn�ques,” J. Geophys. Res., Vol. 104, p. 22,375, 1999.
24. Oreskes, N.: “The scientific consensus on climate change,” Science, Vol. 306, p. 1,686, 2004.

16
REPORT DOCUMENTATION PAGE Form Approved
OMB No. 0704-0188
Public reporting burden for this collection of information is estimated to average 1 hour per response, including the time for reviewing instructions, searching existing data sources, gathering and maintain-ing the data needed, and completing and reviewing the collection of information. Send comments regarding this burden estimate or any other aspect of this collection of information, including suggestions for reducing this burden, to Washington Headquarters Services, Directorate for Information Operation and Reports, 1215 Jefferson Davis Highway, Suite 1204, Arlington, VA 22202-4302, and to the Office of Management and Budget, Paperwork Reduction Project (0704-0188), Washington, DC 20503
1. AGENCY USE ONLY (Leave Blank) 2. REPORT DATE 3. REPORT TYPE AND DATES COVERED
4. TITLE AND SUBTITLE 5. FUNDING NUMBERS
6. AUTHORS
7. PERFORMING ORGANIZATION NAME(S) AND ADDRESS(ES) 8. PERFORMING ORGANIZATION REPORT NUMBER
9. SPONSORING/MONITORING AGENCY NAME(S) AND ADDRESS(ES) 10. SPONSORING/MONITORING AGENCY REPORT NUMBER
11. SUPPLEMENTARY NOTES
12a. DISTRIBUTION/AVAILABILITY STATEMENT 12b. DISTRIBUTION CODE
13. ABSTRACT (Maximum 200 words)
14. SUBJECT TERMS 15. NUMBER OF PAGES
16. PRICE CODE
17. SECURITY CLASSIFICATION OF REPORT
18. SECURITY CLASSIFICATION OF THIS PAGE
19. SECURITY CLASSIFICATION OF ABSTRACT
20. LIMITATION OF ABSTRACT
NSN 7540-01-280-5500 Standard Form 298 (Rev. 2-89)Prescribed by ANSI Std. 239-18298-102
Unclassified Unclassified Unclassified Unl�m�ted
Exam�nat�on of the Armagh Observatory Annual Mean Temperature Record, 1844–2004
Robert M. Wilson and David H. Hathaway
George C. Marshall Space Fl�ght CenterMarshall Space Fl�ght Center, AL 35812
Nat�onal Aeronaut�cs and Space Adm�n�strat�onWashington, DC 20546–0001
Prepared by the Earth and Space Sc�ence Laboratory, Sc�ence and Technology D�rectorate
Unclassified-UnlimitedSubject Category 47Ava�lab�l�ty: NASA CASI 301–621–0390
The long-term annual mean temperature record (1844–2004) of the Armagh Observatory (Armagh, Northern Ireland, Un�ted K�ngdom) �s exam�ned for ev�dence of systemat�c var�at�on, �n part�cular, as related to solar/geomagnet�c forc�ng and secular var�at�on. Indeed, both are apparent �n the temperature record. Mov�ng averages for 10 years of temperature are found to h�ghly correlate aga�nst both 10-year mov�ng averages of the aa-geomagnet�c �ndex and sunspot number, having correlation coefficients of �0.7, inferring that nearly half the variance in the 10-year moving average of temperature can be expla�ned by solar/geomagnet�c forc�ng. The res�duals appear ep�sod�c �n nature, w�th cool�ng seen �n the 1880s and aga�n near 1980. Seven of the last 10 years of the temperature record has exceeded 10 °C, unprecedented in the overall record. Variation of sunspot cyclic averages and 2-cycle moving averages of temperature strongly assoc�ate w�th s�m�lar averages for the solar/geomagnet�c cycle, w�th the res�duals d�splay�ng an apparent 9-cycle var�at�on and a steep r�se �n temperature assoc�ated w�th cycle 23. Hale cycle averages of tem-perature for even-odd pa�rs of sunspot cycles correlate aga�nst s�m�lar averages for the solar/geomagnet�c cycle and, espec�ally, aga�nst the length of the Hale cycle. Ind�cat�ons are that annual mean temperature w�ll l�kely exceed 10 °C over the next decade.
24
M–1166
Techn�cal Publ�cat�onJuly 2006
NASA/TP—2006–214434
Armagh Observatory, temperature records, cl�mat�c change, global warm�ng, solar/geomagnet�c cycles

The NASA STI Program Office…in Profile
Since its founding, NASA has been dedicated tothe advancement of aeronautics and spacescience. The NASA Scientific and Technical Information (STI) Program Office plays a keypart in helping NASA maintain this importantrole.
The NASA STI Program Office is operated by Langley Research Center, the lead center for NASA’s scientific and technical information. The NASA STI Program Office provides access to the NASA STI Database, the largest collection of aeronautical and space science STI in the world. The Program Office is also NASA’s institutional mechanism for disseminating the results of its research and development activities. These results are published by NASA in the NASA STI Report Series, which includes the following report types:
• TECHNICAL PUBLICATION. Reports of completed research or a major significant phase of research that present the results of NASA programs and include extensive data or theoretical analysis. Includes compilations of significant scientific and technical data and information deemed to be of continuing reference value. NASA’s counterpart of peer-reviewed formal professional papers but has less stringent limitations on manuscript length and extent of graphic presentations.
• TECHNICAL MEMORANDUM. Scientific and technical findings that are preliminary or of specialized interest, e.g., quick release reports, working papers, and bibliographies that contain minimal annotation. Does not contain extensive analysis.
• CONTRACTOR REPORT. Scientific and technical findings by NASA-sponsored contractors and grantees.
• CONFERENCE PUBLICATION. Collected papers from scientific and technical conferences, symposia, seminars, or other meetings sponsored or cosponsored by NASA.
• SPECIAL PUBLICATION. Scientific, technical, or historical information from NASA programs, projects, and mission, often concerned with subjects having substantial public interest.
• TECHNICAL TRANSLATION. English-language translations of foreign
scientific and technical material pertinent to NASA’s mission.
Specialized services that complement the STI Program Office’s diverse offerings include creating custom thesauri, building customized databases, organizing and publishing research results…even providing videos.
For more information about the NASA STI Program Office, see the following:
• Access the NASA STI Program Home Page at http://www.sti.nasa.gov
• E-mail your question via the Internet to [email protected]
• Fax your question to the NASA Access Help Desk at 301–621–0134
• Telephone the NASA Access Help Desk at 301–621–0390
• Write to: NASA Access Help Desk NASA Center for AeroSpace Information 7121 Standard Drive Hanover, MD 21076–1320 301–621–0390

NASA/TP—2006–214434
Examination of the Armagh Observatory Annual Mean Temperature Record, 1844–2004Robert M. Wilson and David H. HathawayMarshall Space Flight Center, Marshall Space Flight Center, Alabama
July 2006
National Aeronautics andSpace AdministrationIS20George C. Marshall Space Flight CenterMarshall Space Flight Center, Alabama35812