exam digitization for online grading - stanford...
TRANSCRIPT

Exam Digitization for Online Grading
Catherine [email protected]
Karthik [email protected]
March 20, 2014
Abstract
Grading exams online has many benefits: grading can be done remotely and more efficiently, allfeedback is legible, and regrade requests have ensured integrity. The bottleneck is turning paperexams into a digital format. We propose an exam digitization pipeline that streamlines this process.Given a video of a student flipping through an exam, we extract all pages, apply perspective cor-rection, find which question is answered on which page, and determine the student’s name. We findthat our pipeline can digitize exams with few errors in reasonable time, showing its promise.
1 Overview
Grading exams is time-consuming, tedious, and error prone. Scheduling grading sessions is difficult; it’shard to ensure exam integrity during regrades; and students go on break after finals, preventing themfrom picking up exams. Allowing instructors to grade online addresses many of these concerns. Indeed,instructors can grade remotely, regrade requests have ensured integrity, feedback is legible, and studentsget their exam results digitally.
But online grading has one major bottleneck: exam digitzation. Currently, instructors must scanall exams in, ensure they’re readable, and determine which exam belongs to which student. This addedoverhead can outweigh the benefits of online grading. With this in mind, we propose a four-step pipelineto streamline exam digitization:
1. Given a video of a student flipping through an exam, identify frames that contain exam pages.
2. Extract out the page from each frame and post-process it to improve readability.
3. Determine which questions are answered on which pages. An online grading system can then allowan instructor to quickly navigate to a particular question.
4. Finally, assess which student owns the exam by applying character recognition techniques.
2 Previous work
2.1 Online Grading
Some companies use computer vision techniques to better streamline online grading. Crowdmark [6] andGradeable [7] use QR codes as a way of determining which questions are answered on which pages. Aunique QR code is added to each page of the blank exam to help identify which question it correspondsto. This imposes additional constraints on the exam outline: there must be enough white space at thetop to fit the QR code, it must fit within the margins of the page, and exams must be created on theplatform.
2.2 Computer Vision Techniques
A few research papers discuss text extraction from videos, as this is an important step in video indexingand retrieval systems [14]. Others consider object extraction (e.g. [5], [10]), as it has applications invideo surveillance. We were unable to find previous work that identifies unique pages from a video.
1

Handwritten character recognition (HCR), by contrast, has received much attention from researchpapers. Recently, proposed methods have turned towards utilizing Hidden Markov Models or NeuralNetworks. Handwritten words on clean paper can be recognized with above 85% accuracy, and singlecharacter accuracy has exceeded 95% [2]. HCR can be used to identify monetary amounts on checks,handwritten addresses on mail, and responses to forms [11]. For handwritten texts under noisy conditions,much work is still required in almost all stages of HCR research [2][11].
2.3 Key Main Contributions
Our main contribution is streamlining exam digitization for online grading. We replace slow traditionalscanning by extracting the digitized exam from a video. Further, our pipeline determines which questionsare answered on which pages using a blank copy of the exam, eliminating QR codes. Finally, our systemdetects which student the exam belongs to, allowing scores to be synced to a gradebook without humanintervention.
3 Proposed Method
Our proposed exam digitization pipeline tackles two major challenges: generating exams in a digitalformat and extracting information from them to speed up navigation/grading. We allow students toupload their exam using a video recording. We identify key video frames which contain high-quality,unique pages (3.2) and then segment out the pages and apply perspective correction (3.3). Next, we findwhich question is answered on which page (3.4), and which student the exam belongs to (3.5).
3.1 Data
For 3.2 and 3.3, we collected 5 videos of students flipping through exams for a total of 54 pages.For 3.4 and 3.5, we have 168 scanned student exams with an average of 12 pages per exam. Exams
are anonymized, and no experiments reveal any performance statistics. Further, no exams are or will bereleased.
We use two character datasets totaling 11128 images (214 images for each lowercase/uppercase char-acter) to train our classifier for 3.4. The first was from Rob Kassel at MIT Spoken Language SystemsGroup [9], and the second was from Chars74k [13]. Images from both datasets were collected by writingcharacters on a tablet PC.
3.2 Key Frame Identification
Given an input video of an exam being flipped through, we would like to extract frames that containunique exam pages; that is, we don’t want two extracted frames to contain the same page. The mainidea behind our approach is to identify flipping transitions in the video. If we can identify when the pageis flipped, we can simply take the frame after flipping completes as our next extracted page.
In our first approach, we try to detect motion blurring using edge detection. If we see fewer edges ina frame relative to other frames, we consider it blurred. Blurred frames suggest flipping, so these becomeour transition points. Unfortunately, this strategy failed. When a flip occurs, edges from the page beingflipped disappear, but edges from the page being flipped to appear. These balance each other out insome cases, and we are unable to detect blurring.
Our current approach transforms the previous frame to the current frame with an affine transfor-mation, and subtracts the two pixel-by-pixel. When a single page is displayed for multiple frames, thisdifference will be low, as we’ll be able to find a near perfect affine transform between the frames. Butwhen flips occur, the difference will be high, as two consecutive frames will not correspond at all.
This is evident in figure 1. The blue curve shows the difference between consecutive frames (normal-ized to a scale of 0 to 1), and the red lines show the ground truth of when transitions occur. Maximumsin the blue curve correspond very well to the red lines. Indeed, after applying thresholding to thedifferences, we get figure 2, which almost perfectly corresponds to the ground truth. The blue peakscorrespond to when a flip occurs, and the troughs are periods of stability. We take the set of frames thatoccur at the beginning of troughs (right after the peaks) as our key frames.
2

Figure 1: Frame identification Figure 2: Frame identification with thresholding
3.3 Page Extraction
Figure 3: Page extraction process
Once we have identified key frames in the video, we must extract exam pages out of them. Specifically,given a frame, as shown in figure 3(a), we would like to extract a pristine image of the student’s exampage, as shown in figure 3(d). We accomplish extraction in three steps.
3.3.1 Find Lines
First, we find lines in the image using the Hough transform, and we filter the image to just its edgesusing the Canny edge detector [3]. Each pixel that’s on an edge votes for a line in the Hough space withparameters (r, θ). Note that we represent lines in their polar form here: r = x · cos(θ) + y · sin(θ). Thisallows us to handle vertical lines with finite parameter values (θ = 0).
We take the top 20 lines in the image, and these constitute our consideration set. Results of theHough transform are found in figure 3(b).
3.3.2 Determine Bounding Box
Next, we take all combinations of four lines, and check if they form a rectangle. Since we have 20 linesor fewer, there are at most
(204
)= 4845 combinations to try, which is computationally inexpensive.
Given two lines in polar space, (r1, θ1) and (r2, θ2), we first normalize their angles so that θ1 andθ2 are both in range [0, 180) (a line (r, θ), where θ ≥ 180, is the same as (−r, θ − 180). These twolines are deemed parallel if |θ1 − θ2| < δ1 for some threshold δ1. They are deemed perpendicular if90− δ2 < |θ1 − θ2| < 90 + δ2 for some threshold δ2 (we found δ1 = δ2 = 20 to have good performance).
We look for four lines that can be split into two sets of two lines each, such that lines within sets areparallel and lines between sets are perpendicular. These constitute rectangles in our image. Since theexam page is the largest rectangular object in the video, we look for the rectangle with the largest area,and choose it as our bounding box around the exam. This can be seen in figure 3(c).
3
3.3.3 Correct Perspective
Now we would like to extract the exam and correct it’s perspective so it fills the image, as per figure3(d). To accomplish this, we first find the four corners of the bounding box. The intersection of twolines (r1, θ1) and (r2, θ2) is given by point (x, y), where x and y are given by:
x = r2 · cos(θ2) + sin(θ2) · dy = r2 · sin(θ2)− cos(θ2) · d
where d =sin(θ1) · (r1 · sin(θ1)− r2 · sin(θ2))− cos(θ1) · (r2 · cos(θ2)− r1 · cos(θ1))
−sin(θ1) · cos(θ2) + cos(θ1) · sin(θ2)
Using this, we can determine the four intersection points representing the four corners of the boundingrectangle. We can then compute a perspective transform, H, that maps the top left corner to (0, 0),the top right corner to (width, 0), the bottom left corner to (0, height), and the bottom right corner to(width, height), where width and height are the desired width and height of the corrected image. Hcan be found using SVDs. We apply this perspective transform and get an extracted page, as shown infigure 3(d).
3.3.4 Super-resolution
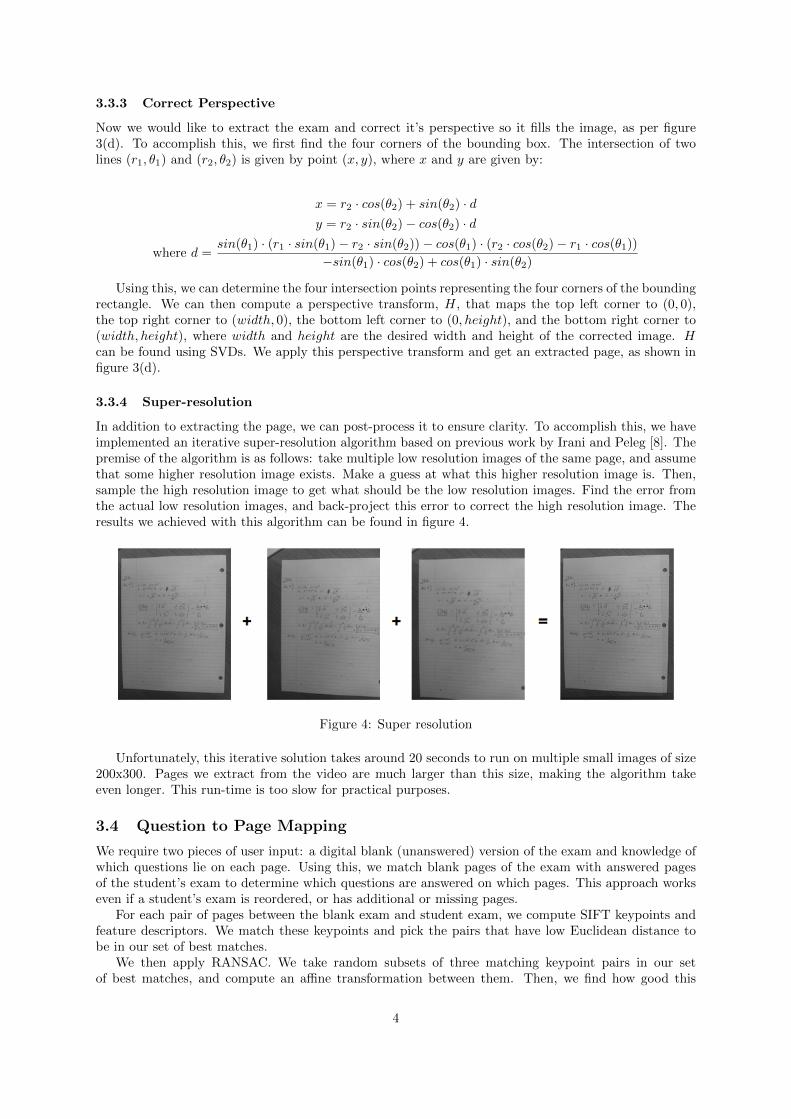
In addition to extracting the page, we can post-process it to ensure clarity. To accomplish this, we haveimplemented an iterative super-resolution algorithm based on previous work by Irani and Peleg [8]. Thepremise of the algorithm is as follows: take multiple low resolution images of the same page, and assumethat some higher resolution image exists. Make a guess at what this higher resolution image is. Then,sample the high resolution image to get what should be the low resolution images. Find the error fromthe actual low resolution images, and back-project this error to correct the high resolution image. Theresults we achieved with this algorithm can be found in figure 4.
Figure 4: Super resolution
Unfortunately, this iterative solution takes around 20 seconds to run on multiple small images of size200x300. Pages we extract from the video are much larger than this size, making the algorithm takeeven longer. This run-time is too slow for practical purposes.
3.4 Question to Page Mapping
We require two pieces of user input: a digital blank (unanswered) version of the exam and knowledge ofwhich questions lie on each page. Using this, we match blank pages of the exam with answered pagesof the student’s exam to determine which questions are answered on which pages. This approach workseven if a student’s exam is reordered, or has additional or missing pages.
For each pair of pages between the blank exam and student exam, we compute SIFT keypoints andfeature descriptors. We match these keypoints and pick the pairs that have low Euclidean distance tobe in our set of best matches.
We then apply RANSAC. We take random subsets of three matching keypoint pairs in our setof best matches, and compute an affine transformation between them. Then, we find how good this
4

transformation is by determining how many keypoints outside of our subset are correctly mapped by it(i.e., we compute the number of inliers). We take the transformation with the most inliers to be thebest.
If the rotation and scale of the best affine transformation are roughly close to 0 and 1, respectively,we deem that the student exam page is a potential match for the blank exam page. We look at potentialmatches across all pages of one student’s exam, and take the student exam page that has the mostkeypoint inliers as the best match. Indeed, we match each page of one student’s exam to a unique blankexam page or no page at all (since some student exams may contain additional pages).
3.5 Student Name Detection
3.5.1 Crop/Clean Student Name
We require user input to identify the bounding box around the name field of the blank exam. We alsoneed a roster of all students in the class. Given these, we transform the front page of each student examto match the front page of the blank exam. Then, we crop out the name given our knowledge of thebounding box.
Often, there is noise in the resulting cropped field, such as a printed line below the student’s name.To remove it, we apply a Canny edge detector to the cropped image and find lines using the Houghtransform. We clear pixels corresponding to lines, except for those that help make up characters. Wealso remove pixels that are not part of a large enough group to constitute a character.
3.5.2 Segmentation and Classification
Next, we segment the image into distinct characters using two approaches: drawing vertical lines, andapplying flood-fill. These approaches are fairly naive, especially when it comes to cursive or crampedhandwriting (see figures 7 and 8). We then train a classifier to identify each character.
3.5.3 Choosing Best Roster Name
Finally, we correct the name outputted by the classifier by choosing the closest name from the roster.Many of the roster names include middle names or suffixes, but these are often omitted on the studentexams. Consequently, we compare the outputted name with different variations of the full name fromthe roster.
We pick the closest name from the roster using two approaches: edit distance and the Needle-man–Wunsch algorithm [12], often used for sequence alignment in computational molecular biology. TheNeedleman-Wunsch algorithm differs from typical edit distance in that its goal is to maximize a stringalignment score, and it gives unique (positive and negative) costs for insertions, deletions, and each typeof substitution (including a letter with itself). For both approaches, we use a learned substitution cost orscore. Because the classifier often mistakens certain letters for others (e.g. N and M), a smaller penaltycan be applied for a substitution between N and M. For the actual score of substitutions between letters,we used the raw proportion that a letter is classified as another, calculated using 10-fold cross-validationon our training set. So if N is classified as M 6% of the time, a match for N and M would give a scoreof 0.06 under Needleman-Wunsch. With edit distance, we take the cost = 1 - score, so N substituted asM would have cost 1 - 0.06 = 0.94.
4 Results
4.1 Key Frame Identification
We ran our key frame identification on 5 videos totaling 54 pages. These videos are relatively clean; theexam is placed on a wood/uniform background and steadily flipped. Of the 54 frames containing pages,53/54 were correctly identified for an accuracy of 98.1%. There were 6 pages that were identified twice,so we had an 11.1% false positive accuracy.
Decreasing our threshold to circumvent false positives resulted in 3 fewer frames being identifiedcorrectly. We would much rather have false positives than fail to identify pages, so we deem the formerresult (53/54 correct) better.
5

Figure 5: Hough Transform doesn’t find left line Figure 6: Bounding box due to background lines
4.2 Page Extraction
We manually extracted 54 frames of pages out of 5 videos to test page extraction. These frames havevarying backgrounds (wood, uniform color) and page orientations (horizontal, vertical, slanted). Afterapplying the algorithm mentioned in 3.3, we manually looked at the results to determine if each page wassuccessfully extracted. We specifically looked for a proper bounding box around the page and accurateperspective correction. Of the 54 pages, 51 were correctly extracted, resulting in an accuracy of 94.4%.
Of the three incorrect cases, there were two primary problems:
1. If the 20 most significant lines in the image don’t include one or more lines necessary for thebounding box, the algorithm fails. This is evident in figure 5, in which we’re unable to identify theleft bounding box line using the Hough transform. You’ll notice that this image has a graph on itwith many grid lines. These grid lines are deemed more significant than the left bounding box lineby the Hough transform. Because of this, we inevitably don’t find the correct bounding box, andfail to extract the full page.
Generalizing this, our algorithm will not work well when there are many dominant lines in an imagethat are not the edges of a page. These lines will make up the majority of our 20 line considerationset and prevent us from finding the correct bounding box.
2. As seen in figure 6, we can sometimes identify superfluous lines outside the page that affect ourresult. On a wood background, our algorithm may identify lines that are in the wood textureitself. These lines can make the bounding box larger than it needs to be. Indeed, since we try tomaximize the area of our bounding box, our algorithm is very susceptible to lines that extend pastthe exam page, as they allow for a greater area. Hence, we require that the background has fewsignificant lines so as to prevent imprecise bounding boxes.
4.3 Question to Page Mapping
To find the best choice of feature detector and descriptor, we tried permutations of SIFT, SURF, andORB on 10 randomly chosen student exams, each with 11 pages. Note that we compared each page of astudent’s exam with each page of the blank exam for a total of 10 ·11 ·11 = 1210 comparisons. Accuraciesand run times are reported in the table below. The best combination was SIFT/SIFT, with an overallaccuracy of 99.3% and a respectable run time of 93 seconds. We also experimented with BRIEF, FAST,GFTT, BRISK, and FREAK, but they had much worse performance.
To match keypoints, we tried both Euclidean distance and FLANN based matchers. There was littledifference in the accuracies, so we only report results with the FLANN matcher in Table 1. The last rowcontains the results of running SIFT/SIFT on all 162 exams in our dataset; we have a total accuracy of99.5%.
6

Detector Descriptor True positive True negative Run-time
ORB SIFT 90.9% (100/110) 99.5% (1094/1100) 87.8sSIFT SIFT 91.8% (101/110) 100% (1100/1100) 93.5sSURF SIFT 97.3% (107/110) 99.8% (1098/1100) 313.8sORB SURF 32.7% (36/110) 99.9% (1099/1100) 76.1sSIFT SURF 0% (0/110) 100% (1100/1100) 72.4sSURF SURF 70% (77/110) 100% (1100/1100) 145.7sORB ORB 0.90% (1/110) 100% (1100/1100) 48.4sSURF ORB 0% (0/110) 100% (1100/1100) 101.3sSIFT SIFT 95.7% (1694/1771) 99.99% (17707/17710) 28m23s
Table 1: Preliminary results from mapping 10 randomly chosen student exams with 11 pages each.Final result is from mapping all exams, achieving very high accuracy.
4.4 Student Name Detection
4.4.1 Crop/Clean Student Name
Finding a transformation between the front page of a student’s exam and the front page of a blank examhad perfect accuracy. The bounding box was chosen to be sufficiently large to contain all student namesafter the transformation.
4.4.2 Basic Segmentation
In one approach, we segmented characters based on whether we could draw a vertical line in betweenthem. Handwritten characters, however, are often slanted; thus, even characters that aren’t touching aresometimes segmented as one (see figure 7).
Figure 7: Segmenting using vertical lines. 5 of the 13 characters are correctly segmented.
In another approach, we identified characters using a flood-fill algorithm. Our algorithm assumesthat a character is comprised of connecting pixels, and applies flood fill to extract them. We use someheuristics to denoise the image to prevent spurious characters from being detected. This can fail in twogeneral cases: it can segment a character with many strokes into many characters, and it can fail tosegment characters with overlapping pixels.
Figure 8: Segmenting using flood-fill. 11 of the 13 characters are correctly segmented.
There are trade-offs to both approaches. The vertical-line approach is better at keeping characterstogether when some strokes are disconnected, such as with the characters i and j. It’s also betterfor characters that can have space between multiple strokes, like T and H. The flood-fill approach, incontrast, works well with slanted handwriting, and does not rely on perfectly vertical characters.
Poor segmentation can greatly affect the performance of the entire pipeline. For illustration, wecompared the pipeline performance on all 168 student exams against the pipeline performance on aselected 37 student exams that we deemed ”easily segmentable”. We found that better segmentationincreases the accuracy of the entire pipeline 3-fold. Results are in table 4.
7

4.4.3 Basic Classification
Once segmentation is complete, we run a classifier on the characters to identify each one. There are twoelements to our character classification: deciding which features to use, and choosing the best classifiertype. The most basic features we can use are pixel values. A more complex metric is a histogramof oriented gradients (HOG), which specifically characterizes shape using gradients. Combined with aspatial pyramid, HOG becomes decently robust to rotation and translation.
For classifiers, we experimented with KNN (using different values of K) and SVMs (with differentvalues of γ). We ran 10-fold cross validation on our training dataset to find the accuracies of theaforementioned features and classifiers. While we trained on 52 labels, we counted a labeling as correct ifit was classified as the uppercase or lowercase character. For our goal of classifying names, this distinctionis relatively unimportant, especially since we use case-insensitive edit distance. Results are summarizedin table 2.
Features Classifier Parameter Dataset(s) Accuracy
Normalized Pixels KNN K = 5 Kassel 77%Normalized Pixels SVM γ = 0 Kassel 20%
HOG KNN K = 5 Kassel 77%HOG KNN K = 5 Chars74K 86%HOG KNN K = 5 Both 79%HOG KNN K = 10 Both 79%HOG KNN K = 20 Both 78%HOG SVM γ = 0 Both 44%HOG SVM γ = 0.1 Both 71%HOG SVM γ = 1 Both 77%HOG SVM γ = 10 Both 82%
Table 2: Results from character classification with 10-fold cross validation.
The best performances from KNN and SVMs were comparable. While the 10-fold cross validationresults show that the performances using pixel values and HOG as features are comparable, using HOGfeatures proved much better when we classifying real images. This was expected, since HOG featuresare more robust to inter-class variability.
We chose to use KNN for future classification since the accuracies were comparable, and because theKNN classifier is much faster in both training and prediction.
Next, we tested character classification on our exam data. To prevent our results from being skewedby segmentation, we collected 37 names that are near-perfectly segmented by our two approaches. Weapplied Gaussian blur and thresholding to these images to make them clearer and more similar to thecharacters in our dataset.
Figure 9: a) Raw image. b) After Gaussian blurring. c) After thresholding.
The 37 names had 412 characters in total. Results are summarized in table 3. Character accuracywas lower because the training set was written with clear strokes on a tablet, much different from the
8

pencil/paper writing in the exams. This is evidenced in the results. Indeed, accuracy was significantlyworse without both thresholding and Gaussian blur.
Blurring without thresholding achieved the worst accuracy, since blurring dampens all of the pixelvalues and reduces the HOG magnitude. Thresholding is therefore needed to remedy this effect fromblurring. But blurring is also vital to thicken the characters and make them clearer. Both blurring andthresholding work in tandem to create the best results.
Gaussian Blur* Thresholding? Character Accuracy
None None 22.6% (93/412)(5, 5), 7 None 14.6% (60/412)
None Yes 23.1% (95/412)(5, 5), 6 Yes 60.4% (249/412)(5, 5), 7 Yes 60.4% (249/412)(5, 5), 9 Yes 60.4% (249/412)(3, 3), 9 Yes 57.3% (236/412)(7, 7), 9 Yes 55.8% (230/412)
Table 3: Results from character classification on selected 37 exams test set.* The Gaussian blur is characterized by: (kernel width, kernel height), standard deviation.
4.4.4 Choosing Best Roster Name
Following classification, we apply edit distance to find the closest roster name to our predicted name.The results are summarized in table 4. We found having a slightly increased deletion cost yielded highestperformance. This makes sense; it is much more likely for our segmentation to group multiple characterstogether than it is to over-segment. Hence, deletions should occur very rarely.
We also ran the same experiments using the Needleman-Wunsch scoring, and we got comparableresults. While the Needleman-Wunsch algorithm had more parameters to tune, the more basic editdistance proved already to be optimal given our training set. We have only included results from themore basic edit distance because their parameters are easier to interpret.
Edit Distance* Test Set Segmentation Roster Name Accuracy
(1, 1, 1) All Vertical-line 29.0% (45/155)(1, 1.5, Variable) All Vertical-line 32.9% (51/155)
(1, 1.5, 1) Segmentable 37 Vertical-line 91.9% (34/37)(1, 1.5, 1) Segmentable 37 Flood-fill 78.4% (29/37)(1, 1.5, 1) All Vertical-line 32.9% (51/155)(1, 1.5, 1) All Flood-fill 30.3% (47/155)
Table 4: Results from the entire pipeline.* The parameters are characterized by: (insertion cost, deletion cost, substitution cost).
5 Conclusion
Our pipeline shows much promise to streamline exam digitization. We eliminate much of the scanningprocess with key frame identification and page extraction. We then proceed to find which questions areanswered on which pages and determine the owner of the exam. The first three steps are done with highaccuracy, curbing the need for manual intervention and saving instructors time.
The last step, name detection, could use improvement in character segmentation. As seen in ourresults, good segmentation can increase name detection accuracies three-fold from 30% to 90%+. Indeed,we achieved 92% accuracy when we could properly segment names. An HMM model that uses the rosterof student names along with our classifier to assign probabilities could prove much more effective thanour current strategy [1]. Various other character segmentation methods also exist [4].
9

References
[1] A. El-Yacoubi et al. “An HMM-Based Approach for Off-Line Unconstrained Handwritten WordModeling and Recognition”. In: IEEE Transactions on Pattern Analysis and Machine Intelligence21.8 (1999), pp. 752 –760.
[2] N. Arica and F. T. Yarman-Vural. “An Overview of Character Recognition Focused on Off-LineHandwriting”. In: IEEE Transactions on Systems, Man, and Cybernetics 31.2 (2001), pp. 216–233.
[3] J. Canny. “A Computational Approach to Edge Detection”. In: IEEE Transactions on PatternAnalysis and Machine Intelligence 8.6 (1986), pp. 679–698.
[4] R. Casey and E. Lecolinet. “A Survey of Methods and Strategies in Character Segmentation”. In:IEEE Transactions on Pattern Analysis and Machine Intelligence 18.7 (1996), pp. 690–706.
[5] A. Cavallaro and T. Ebrahimi. “Video object extraction based on adaptive background and statis-tical change detection”. In: Visual Communications and Image Processing 4310 (2001), p. 465.
[6] Crowdmark. url: https://crowdmark.com/.
[7] Gradeable. url: https://www.gradeable.com/.
[8] M. Irani and S. Peleg. “Improving Resolution by Image Registration”. In: Graphical Models andImage Processing 53.3 (1991), pp. 231–239.
[9] R. Kassel. “A Comparison of Approaches to On-Line Handwritten Character Recognition”. In:MIT Doctoral Dissertation (1996).
[10] C. Kim and J. Hwang. “Fast and automatic video object segmentation and tracking for content-based applications”. In: IEEE Transactions on Circuits and Systems for Video Technology 12.2(2002), pp. 122–129.
[11] S. Madhvanath. “The Role of Holistic Paradigms in Handwritten Word Recognition”. In: IEEETransactions on Pattern Analysis and Machine Intelligence 23.2 (2001), pp. 149–164.
[12] S. Needleman and C. Wunsch. “A General Method Applicable to the Search for Similarities in theAmino Acid Sequence of Two Proteins”. In: Journal of Molecular Biology 48.3 (1970), pp. 443–453.
[13] The Chars74K Dataset. url: http://www.ee.surrey.ac.uk/CVSSP/demos/chars74k/.
[14] J. Zhang and R. Kasturi. “Extraction of Text Objects in Video Documents: Recent Progress”. In:The Eighth IAPR International Workshop on Document Analysis Systems 53.3 (2008), pp. 5–7.
10