ex. 38redistricting.lls.edu/files/nc covington 20170907 new...101 106 107 108 67 76 77 82 83 89 95...
TRANSCRIPT

EX. 38
Case 1:15-cv-00399-TDS-JEP Document 184-38 Filed 09/07/17 Page 1 of 44

!
!
!
!
!
!
!
!
101
106107
10867
7677
82
83
8995
97
98
99
Iredell
Mecklenburg
Stanly
Catawba
Rowan
Cabarrus
Lincoln
Gaston
!
!
!
!
!
!
!
!
101
106107
10867
7677
82
83
8995
97
98
99
Iredell
Mecklenburg
Stanly
Catawba
Rowan
Cabarrus
Lincoln
Gaston
H927-ABK-42-Districts 82 and 83
. H927-ABK-42-Districts 82 and 83 Printed by the NC General Assembly, August 24, 2017.
0 5 10 15 20Miles
LegendGroupings Member by Party
Democratic!
Republican!
DistrictsCounties
Case 1:15-cv-00399-TDS-JEP Document 184-38 Filed 09/07/17 Page 2 of 44

NORTH CAROLINA GENERAL ASSEMBLY
AMENDMENT
House Bill 927
AMENDMENT NO. __________
(to be filled in by
H927-ABK-42 [v.1] Principal Clerk)
Page 1 of 1
Amends Title [NO] Date ,2017
H927-CSBK-31
Representative Speciale
*H927-ABK-42-v-1*
moves to amend the bill on page 23, lines 19-25, by deleting those lines and substituting the 1
following: 2
3
"District 82: Cabarrus County: VTD 01-06, VTD 01-08, VTD 01-09, VTD 01-10, VTD 02-01, 4
VTD 02-02, VTD 02-03, VTD 02-05, VTD 02-06, VTD 02-07, VTD 02-08, VTD 02-09, 5
VTD 03-00, VTD 04-08, VTD 04-09, VTD 04-10, VTD 12-09, VTD 12-12. 6
District 83: Cabarrus County: VTD 04-01, VTD 04-02, VTD 04-03, VTD 04-04, VTD 04-05, 7
VTD 04-06, VTD 04-07, VTD 05-00, VTD 11-01, VTD 11-02, VTD 12-01, VTD 12-02, 8
VTD 12-03, VTD 12-04, VTD 12-05, VTD 12-06, VTD 12-07, VTD 12-08, VTD 12-10, 9
VTD 12-11; Rowan County: VTD 05, VTD 06, VTD 17, VTD 20, VTD 33.". 10
SIGNED ______________________________________________
Amendment Sponsor
SIGNED ______________________________________________
Committee Chair if Senate Committee Amendment
ADOPTED ______________ FAILED ________________ TABLED ______________
Case 1:15-cv-00399-TDS-JEP Document 184-38 Filed 09/07/17 Page 3 of 44
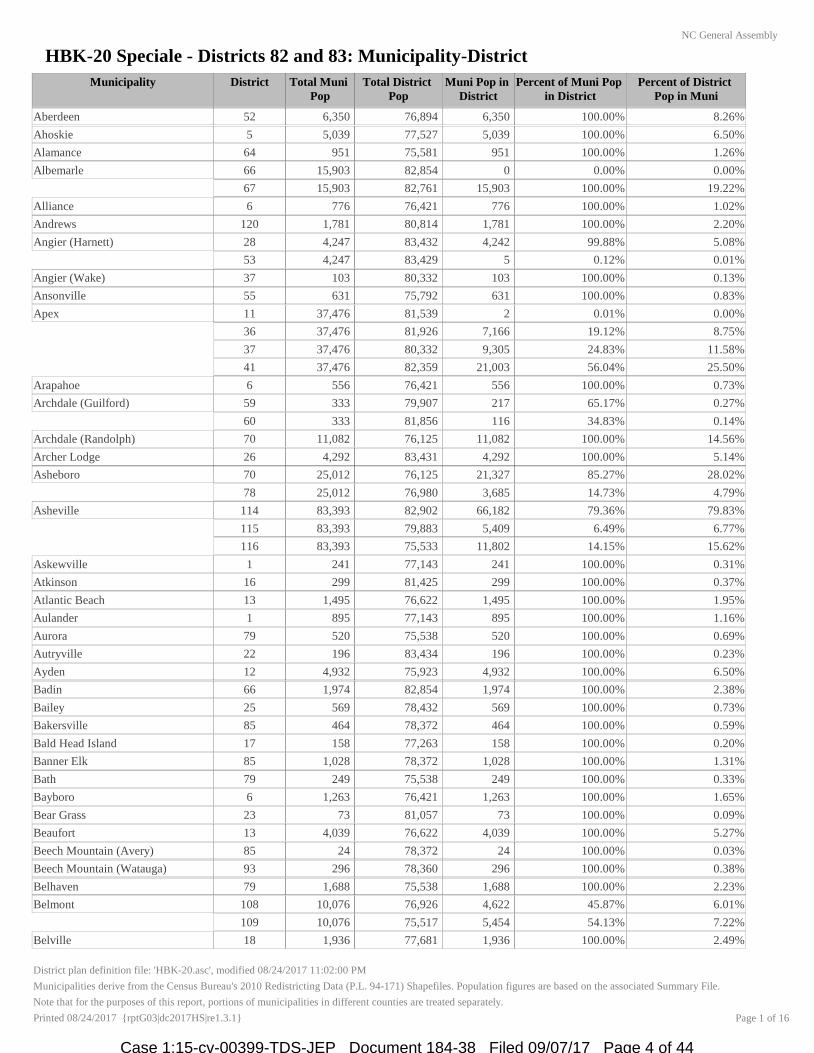
HBK-20 Speciale - Districts 82 and 83: Municipality-District
NC General Assembly
Municipality District Total Muni
Pop
Total District
Pop
Muni Pop in
District
Percent of Muni Pop
in District
Percent of District
Pop in Muni
Aberdeen 52 6,350 76,894 6,350 100.00% 8.26%
Ahoskie 5 5,039 77,527 5,039 100.00% 6.50%
Alamance 64 951 75,581 951 100.00% 1.26%
Albemarle 66 15,903 82,854 0 0.00% 0.00%
67 15,903 82,761 15,903 100.00% 19.22%
Alliance 6 776 76,421 776 100.00% 1.02%
Andrews 120 1,781 80,814 1,781 100.00% 2.20%
Angier (Harnett) 28 4,247 83,432 4,242 99.88% 5.08%
53 4,247 83,429 5 0.12% 0.01%
Angier (Wake) 37 103 80,332 103 100.00% 0.13%
Ansonville 55 631 75,792 631 100.00% 0.83%
Apex 11 37,476 81,539 2 0.01% 0.00%
36 37,476 81,926 7,166 19.12% 8.75%
37 37,476 80,332 9,305 24.83% 11.58%
41 37,476 82,359 21,003 56.04% 25.50%
Arapahoe 6 556 76,421 556 100.00% 0.73%
Archdale (Guilford) 59 333 79,907 217 65.17% 0.27%
60 333 81,856 116 34.83% 0.14%
Archdale (Randolph) 70 11,082 76,125 11,082 100.00% 14.56%
Archer Lodge 26 4,292 83,431 4,292 100.00% 5.14%
Asheboro 70 25,012 76,125 21,327 85.27% 28.02%
78 25,012 76,980 3,685 14.73% 4.79%
Asheville 114 83,393 82,902 66,182 79.36% 79.83%
115 83,393 79,883 5,409 6.49% 6.77%
116 83,393 75,533 11,802 14.15% 15.62%
Askewville 1 241 77,143 241 100.00% 0.31%
Atkinson 16 299 81,425 299 100.00% 0.37%
Atlantic Beach 13 1,495 76,622 1,495 100.00% 1.95%
Aulander 1 895 77,143 895 100.00% 1.16%
Aurora 79 520 75,538 520 100.00% 0.69%
Autryville 22 196 83,434 196 100.00% 0.23%
Ayden 12 4,932 75,923 4,932 100.00% 6.50%
Badin 66 1,974 82,854 1,974 100.00% 2.38%
Bailey 25 569 78,432 569 100.00% 0.73%
Bakersville 85 464 78,372 464 100.00% 0.59%
Bald Head Island 17 158 77,263 158 100.00% 0.20%
Banner Elk 85 1,028 78,372 1,028 100.00% 1.31%
Bath 79 249 75,538 249 100.00% 0.33%
Bayboro 6 1,263 76,421 1,263 100.00% 1.65%
Bear Grass 23 73 81,057 73 100.00% 0.09%
Beaufort 13 4,039 76,622 4,039 100.00% 5.27%
Beech Mountain (Avery) 85 24 78,372 24 100.00% 0.03%
Beech Mountain (Watauga) 93 296 78,360 296 100.00% 0.38%
Belhaven 79 1,688 75,538 1,688 100.00% 2.23%
Belmont 108 10,076 76,926 4,622 45.87% 6.01%
109 10,076 75,517 5,454 54.13% 7.22%
Belville 18 1,936 77,681 1,936 100.00% 2.49%
District plan definition file: 'HBK-20.asc', modified 08/24/2017 11:02:00 PM
Municipalities derive from the Census Bureau's 2010 Redistricting Data (P.L. 94-171) Shapefiles. Population figures are based on the associated Summary File.
Page 1 of 16
Note that for the purposes of this report, portions of municipalities in different counties are treated separately.
Printed 08/24/2017 {rptG03|dc2017HS|re1.3.1}
Case 1:15-cv-00399-TDS-JEP Document 184-38 Filed 09/07/17 Page 4 of 44

HBK-20 Speciale - Districts 82 and 83: Municipality-District
NC General Assembly
Municipality District Total Muni
Pop
Total District
Pop
Muni Pop in
District
Percent of Muni Pop
in District
Percent of District
Pop in Muni
Belwood 111 950 76,148 950 100.00% 1.25%
Benson (Harnett) 53 0 83,429 0 0.00% 0.00%
Benson (Johnston) 28 3,311 83,432 3,311 100.00% 3.97%
Bermuda Run 77 1,725 82,918 1,725 100.00% 2.08%
Bessemer City 110 5,340 75,573 5,340 100.00% 7.07%
Bethania 75 328 79,963 328 100.00% 0.41%
Bethel 8 1,577 75,926 1,577 100.00% 2.08%
Beulaville 4 1,296 81,905 1,296 100.00% 1.58%
Biltmore Forest 116 1,343 75,533 1,343 100.00% 1.78%
Biscoe 66 1,700 82,854 1,700 100.00% 2.05%
Black Creek 24 769 81,234 769 100.00% 0.95%
Black Mountain 115 7,848 79,883 7,848 100.00% 9.82%
Bladenboro 22 1,750 83,434 1,750 100.00% 2.10%
Blowing Rock (Caldwell) 87 49 83,029 49 100.00% 0.06%
Blowing Rock (Watauga) 93 1,192 78,360 1,192 100.00% 1.52%
Boardman 46 157 80,440 157 100.00% 0.20%
Bogue 13 684 76,622 684 100.00% 0.89%
Boiling Spring Lakes 17 5,372 77,263 5,370 99.96% 6.95%
18 5,372 77,681 2 0.04% 0.00%
Boiling Springs 111 4,647 76,148 4,647 100.00% 6.10%
Bolivia 18 143 77,681 143 100.00% 0.18%
Bolton 16 691 81,425 691 100.00% 0.85%
Boone 93 17,122 78,360 17,122 100.00% 21.85%
Boonville 73 1,222 78,189 1,222 100.00% 1.56%
Bostic 112 386 79,547 386 100.00% 0.49%
Brevard 113 7,609 81,089 7,609 100.00% 9.38%
Bridgeton 79 454 75,538 454 100.00% 0.60%
Broadway (Harnett) 53 25 83,429 25 100.00% 0.03%
Broadway (Lee) 51 1,204 83,434 1,204 100.00% 1.44%
Brookford 89 382 77,838 321 84.03% 0.41%
96 382 76,520 61 15.97% 0.08%
Brunswick 16 1,119 81,425 1,119 100.00% 1.37%
Bryson City 119 1,424 75,548 1,424 100.00% 1.88%
Bunn 25 344 78,432 344 100.00% 0.44%
Burgaw 16 3,872 81,425 3,872 100.00% 4.76%
Burlington (Alamance) 63 49,308 75,550 23,248 47.15% 30.77%
64 49,308 75,581 26,060 52.85% 34.48%
Burlington (Guilford) 59 655 79,907 655 100.00% 0.82%
Burnsville 118 1,693 76,322 1,693 100.00% 2.22%
Butner 2 7,591 82,634 7,591 100.00% 9.19%
Cajah's Mountain 87 2,823 83,029 2,823 100.00% 3.40%
Calabash 17 1,786 77,263 1,786 100.00% 2.31%
Calypso 4 538 81,905 538 100.00% 0.66%
Cameron 52 285 76,894 285 100.00% 0.37%
Candor 66 840 82,854 840 100.00% 1.01%
Canton 118 4,227 76,322 4,227 100.00% 5.54%
Cape Carteret 13 1,917 76,622 1,917 100.00% 2.50%
District plan definition file: 'HBK-20.asc', modified 08/24/2017 11:02:00 PM
Municipalities derive from the Census Bureau's 2010 Redistricting Data (P.L. 94-171) Shapefiles. Population figures are based on the associated Summary File.
Page 2 of 16
Note that for the purposes of this report, portions of municipalities in different counties are treated separately.
Printed 08/24/2017 {rptG03|dc2017HS|re1.3.1}
Case 1:15-cv-00399-TDS-JEP Document 184-38 Filed 09/07/17 Page 5 of 44
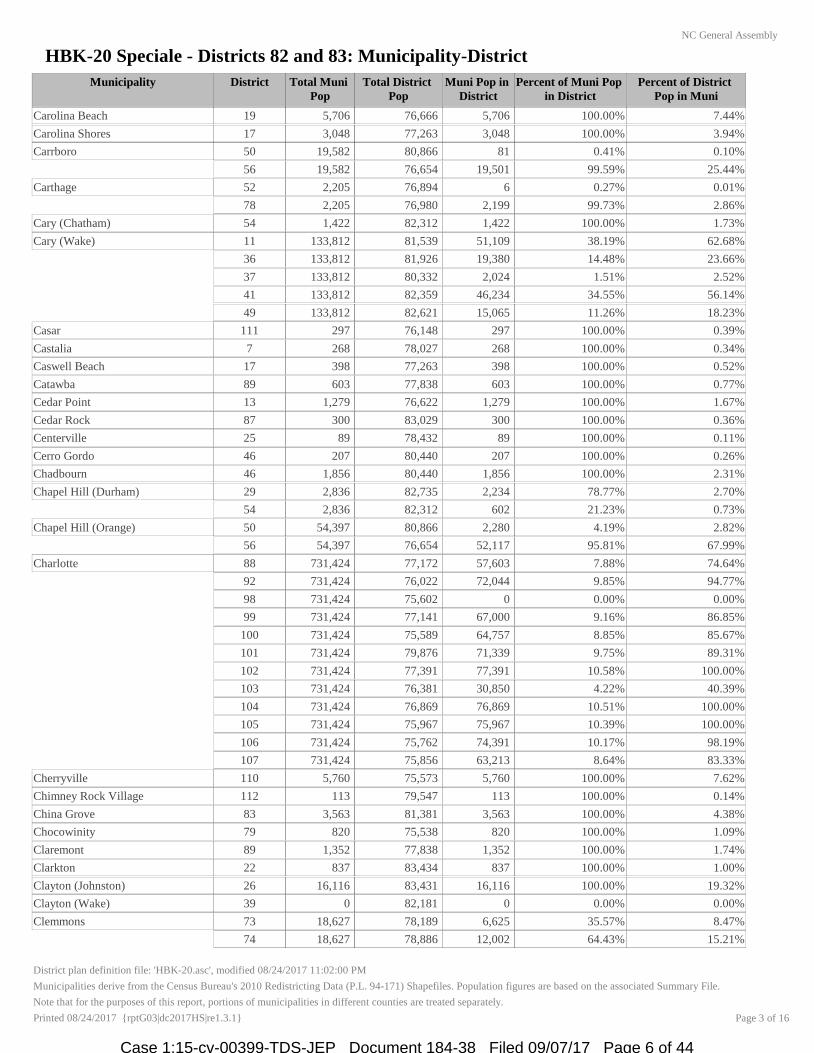
HBK-20 Speciale - Districts 82 and 83: Municipality-District
NC General Assembly
Municipality District Total Muni
Pop
Total District
Pop
Muni Pop in
District
Percent of Muni Pop
in District
Percent of District
Pop in Muni
Carolina Beach 19 5,706 76,666 5,706 100.00% 7.44%
Carolina Shores 17 3,048 77,263 3,048 100.00% 3.94%
Carrboro 50 19,582 80,866 81 0.41% 0.10%
56 19,582 76,654 19,501 99.59% 25.44%
Carthage 52 2,205 76,894 6 0.27% 0.01%
78 2,205 76,980 2,199 99.73% 2.86%
Cary (Chatham) 54 1,422 82,312 1,422 100.00% 1.73%
Cary (Wake) 11 133,812 81,539 51,109 38.19% 62.68%
36 133,812 81,926 19,380 14.48% 23.66%
37 133,812 80,332 2,024 1.51% 2.52%
41 133,812 82,359 46,234 34.55% 56.14%
49 133,812 82,621 15,065 11.26% 18.23%
Casar 111 297 76,148 297 100.00% 0.39%
Castalia 7 268 78,027 268 100.00% 0.34%
Caswell Beach 17 398 77,263 398 100.00% 0.52%
Catawba 89 603 77,838 603 100.00% 0.77%
Cedar Point 13 1,279 76,622 1,279 100.00% 1.67%
Cedar Rock 87 300 83,029 300 100.00% 0.36%
Centerville 25 89 78,432 89 100.00% 0.11%
Cerro Gordo 46 207 80,440 207 100.00% 0.26%
Chadbourn 46 1,856 80,440 1,856 100.00% 2.31%
Chapel Hill (Durham) 29 2,836 82,735 2,234 78.77% 2.70%
54 2,836 82,312 602 21.23% 0.73%
Chapel Hill (Orange) 50 54,397 80,866 2,280 4.19% 2.82%
56 54,397 76,654 52,117 95.81% 67.99%
Charlotte 88 731,424 77,172 57,603 7.88% 74.64%
92 731,424 76,022 72,044 9.85% 94.77%
98 731,424 75,602 0 0.00% 0.00%
99 731,424 77,141 67,000 9.16% 86.85%
100 731,424 75,589 64,757 8.85% 85.67%
101 731,424 79,876 71,339 9.75% 89.31%
102 731,424 77,391 77,391 10.58% 100.00%
103 731,424 76,381 30,850 4.22% 40.39%
104 731,424 76,869 76,869 10.51% 100.00%
105 731,424 75,967 75,967 10.39% 100.00%
106 731,424 75,762 74,391 10.17% 98.19%
107 731,424 75,856 63,213 8.64% 83.33%
Cherryville 110 5,760 75,573 5,760 100.00% 7.62%
Chimney Rock Village 112 113 79,547 113 100.00% 0.14%
China Grove 83 3,563 81,381 3,563 100.00% 4.38%
Chocowinity 79 820 75,538 820 100.00% 1.09%
Claremont 89 1,352 77,838 1,352 100.00% 1.74%
Clarkton 22 837 83,434 837 100.00% 1.00%
Clayton (Johnston) 26 16,116 83,431 16,116 100.00% 19.32%
Clayton (Wake) 39 0 82,181 0 0.00% 0.00%
Clemmons 73 18,627 78,189 6,625 35.57% 8.47%
74 18,627 78,886 12,002 64.43% 15.21%
District plan definition file: 'HBK-20.asc', modified 08/24/2017 11:02:00 PM
Municipalities derive from the Census Bureau's 2010 Redistricting Data (P.L. 94-171) Shapefiles. Population figures are based on the associated Summary File.
Page 3 of 16
Note that for the purposes of this report, portions of municipalities in different counties are treated separately.
Printed 08/24/2017 {rptG03|dc2017HS|re1.3.1}
Case 1:15-cv-00399-TDS-JEP Document 184-38 Filed 09/07/17 Page 6 of 44
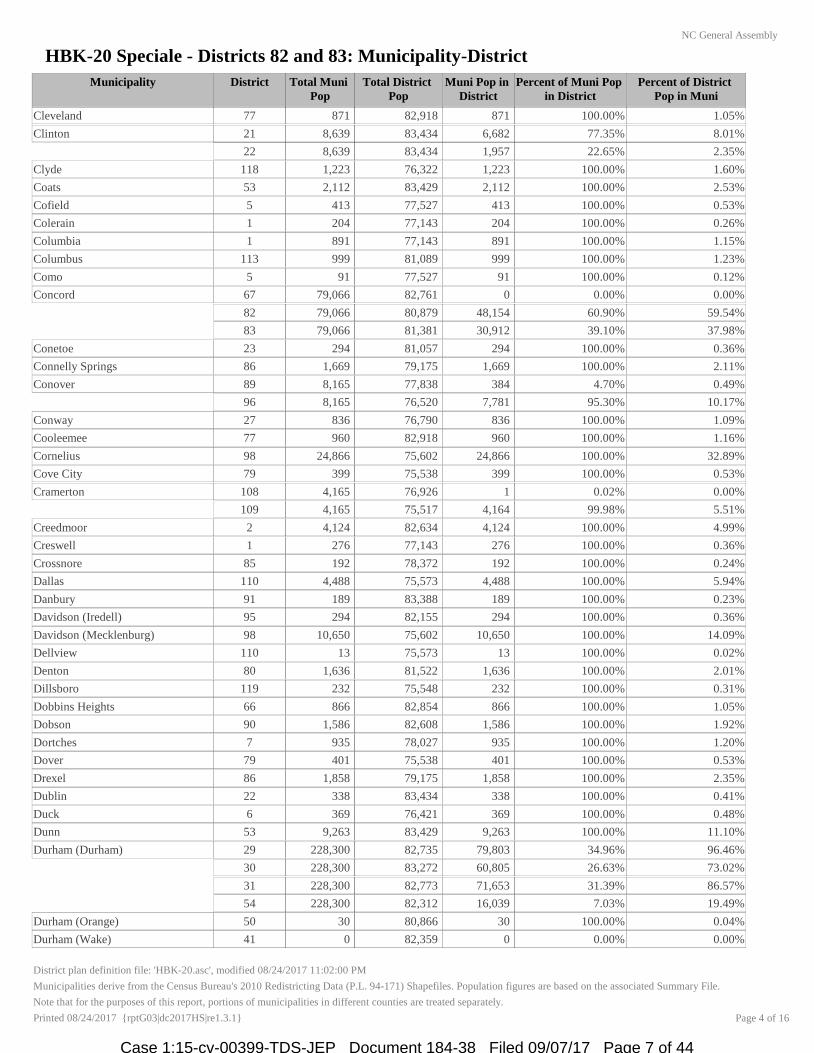
HBK-20 Speciale - Districts 82 and 83: Municipality-District
NC General Assembly
Municipality District Total Muni
Pop
Total District
Pop
Muni Pop in
District
Percent of Muni Pop
in District
Percent of District
Pop in Muni
Cleveland 77 871 82,918 871 100.00% 1.05%
Clinton 21 8,639 83,434 6,682 77.35% 8.01%
22 8,639 83,434 1,957 22.65% 2.35%
Clyde 118 1,223 76,322 1,223 100.00% 1.60%
Coats 53 2,112 83,429 2,112 100.00% 2.53%
Cofield 5 413 77,527 413 100.00% 0.53%
Colerain 1 204 77,143 204 100.00% 0.26%
Columbia 1 891 77,143 891 100.00% 1.15%
Columbus 113 999 81,089 999 100.00% 1.23%
Como 5 91 77,527 91 100.00% 0.12%
Concord 67 79,066 82,761 0 0.00% 0.00%
82 79,066 80,879 48,154 60.90% 59.54%
83 79,066 81,381 30,912 39.10% 37.98%
Conetoe 23 294 81,057 294 100.00% 0.36%
Connelly Springs 86 1,669 79,175 1,669 100.00% 2.11%
Conover 89 8,165 77,838 384 4.70% 0.49%
96 8,165 76,520 7,781 95.30% 10.17%
Conway 27 836 76,790 836 100.00% 1.09%
Cooleemee 77 960 82,918 960 100.00% 1.16%
Cornelius 98 24,866 75,602 24,866 100.00% 32.89%
Cove City 79 399 75,538 399 100.00% 0.53%
Cramerton 108 4,165 76,926 1 0.02% 0.00%
109 4,165 75,517 4,164 99.98% 5.51%
Creedmoor 2 4,124 82,634 4,124 100.00% 4.99%
Creswell 1 276 77,143 276 100.00% 0.36%
Crossnore 85 192 78,372 192 100.00% 0.24%
Dallas 110 4,488 75,573 4,488 100.00% 5.94%
Danbury 91 189 83,388 189 100.00% 0.23%
Davidson (Iredell) 95 294 82,155 294 100.00% 0.36%
Davidson (Mecklenburg) 98 10,650 75,602 10,650 100.00% 14.09%
Dellview 110 13 75,573 13 100.00% 0.02%
Denton 80 1,636 81,522 1,636 100.00% 2.01%
Dillsboro 119 232 75,548 232 100.00% 0.31%
Dobbins Heights 66 866 82,854 866 100.00% 1.05%
Dobson 90 1,586 82,608 1,586 100.00% 1.92%
Dortches 7 935 78,027 935 100.00% 1.20%
Dover 79 401 75,538 401 100.00% 0.53%
Drexel 86 1,858 79,175 1,858 100.00% 2.35%
Dublin 22 338 83,434 338 100.00% 0.41%
Duck 6 369 76,421 369 100.00% 0.48%
Dunn 53 9,263 83,429 9,263 100.00% 11.10%
Durham (Durham) 29 228,300 82,735 79,803 34.96% 96.46%
30 228,300 83,272 60,805 26.63% 73.02%
31 228,300 82,773 71,653 31.39% 86.57%
54 228,300 82,312 16,039 7.03% 19.49%
Durham (Orange) 50 30 80,866 30 100.00% 0.04%
Durham (Wake) 41 0 82,359 0 0.00% 0.00%
District plan definition file: 'HBK-20.asc', modified 08/24/2017 11:02:00 PM
Municipalities derive from the Census Bureau's 2010 Redistricting Data (P.L. 94-171) Shapefiles. Population figures are based on the associated Summary File.
Page 4 of 16
Note that for the purposes of this report, portions of municipalities in different counties are treated separately.
Printed 08/24/2017 {rptG03|dc2017HS|re1.3.1}
Case 1:15-cv-00399-TDS-JEP Document 184-38 Filed 09/07/17 Page 7 of 44
HBK-20 Speciale - Districts 82 and 83: Municipality-District
NC General Assembly
Municipality District Total Muni
Pop
Total District
Pop
Muni Pop in
District
Percent of Muni Pop
in District
Percent of District
Pop in Muni
Earl 111 260 76,148 260 100.00% 0.34%
East Arcadia 22 487 83,434 487 100.00% 0.58%
East Bend 73 612 78,189 612 100.00% 0.78%
East Laurinburg 48 300 83,109 300 100.00% 0.36%
East Spencer 76 1,534 81,908 1,534 100.00% 1.87%
Eastover 45 3,628 79,294 3,628 100.00% 4.58%
Eden 65 15,527 83,430 15,527 100.00% 18.61%
Edenton 1 5,004 77,143 5,004 100.00% 6.49%
Elizabeth City (Camden) 1 45 77,143 45 100.00% 0.06%
Elizabeth City (Pasquotank) 5 18,638 77,527 18,638 100.00% 24.04%
Elizabethtown 22 3,583 83,434 3,583 100.00% 4.29%
Elk Park 85 452 78,372 452 100.00% 0.58%
Elkin (Surry) 90 3,921 82,608 3,921 100.00% 4.75%
Elkin (Wilkes) 94 80 82,984 80 100.00% 0.10%
Ellenboro 112 873 79,547 873 100.00% 1.10%
Ellerbe 66 1,054 82,854 1,054 100.00% 1.27%
Elm City 24 1,298 81,234 1,298 100.00% 1.60%
Elon 64 9,419 75,581 9,419 100.00% 12.46%
Emerald Isle 13 3,655 76,622 3,655 100.00% 4.77%
Enfield 27 2,532 76,790 2,532 100.00% 3.30%
Erwin 53 4,405 83,429 4,405 100.00% 5.28%
Eureka 10 197 83,434 197 100.00% 0.24%
Everetts 23 164 81,057 164 100.00% 0.20%
Fair Bluff 46 951 80,440 951 100.00% 1.18%
Fairmont 47 2,663 82,618 2,663 100.00% 3.22%
Fairview 55 3,324 75,792 3,324 100.00% 4.39%
Faison (Duplin) 4 961 81,905 961 100.00% 1.17%
Faison (Sampson) 21 0 83,434 0 0.00% 0.00%
Faith 76 807 81,908 807 100.00% 0.99%
Falcon (Cumberland) 45 258 79,294 258 100.00% 0.33%
Falcon (Sampson) 22 0 83,434 0 0.00% 0.00%
Falkland 8 96 75,926 96 100.00% 0.13%
Fallston 111 607 76,148 607 100.00% 0.80%
Farmville 8 4,654 75,926 4,654 100.00% 6.13%
Fayetteville 42 200,564 81,439 67,394 33.60% 82.75%
43 200,564 77,725 74,393 37.09% 95.71%
44 200,564 80,973 51,354 25.60% 63.42%
45 200,564 79,294 7,423 3.70% 9.36%
Flat Rock 113 3,114 81,089 3,114 100.00% 3.84%
Fletcher 117 7,187 79,251 7,187 100.00% 9.07%
Forest City 112 7,476 79,547 7,476 100.00% 9.40%
Forest Hills 119 365 75,548 365 100.00% 0.48%
Fountain 8 427 75,926 427 100.00% 0.56%
Four Oaks 28 1,921 83,432 1,921 100.00% 2.30%
Foxfire 52 902 76,894 902 100.00% 1.17%
Franklin 120 3,845 80,814 3,845 100.00% 4.76%
Franklinton 25 2,023 78,432 2,023 100.00% 2.58%
District plan definition file: 'HBK-20.asc', modified 08/24/2017 11:02:00 PM
Municipalities derive from the Census Bureau's 2010 Redistricting Data (P.L. 94-171) Shapefiles. Population figures are based on the associated Summary File.
Page 5 of 16
Note that for the purposes of this report, portions of municipalities in different counties are treated separately.
Printed 08/24/2017 {rptG03|dc2017HS|re1.3.1}
Case 1:15-cv-00399-TDS-JEP Document 184-38 Filed 09/07/17 Page 8 of 44

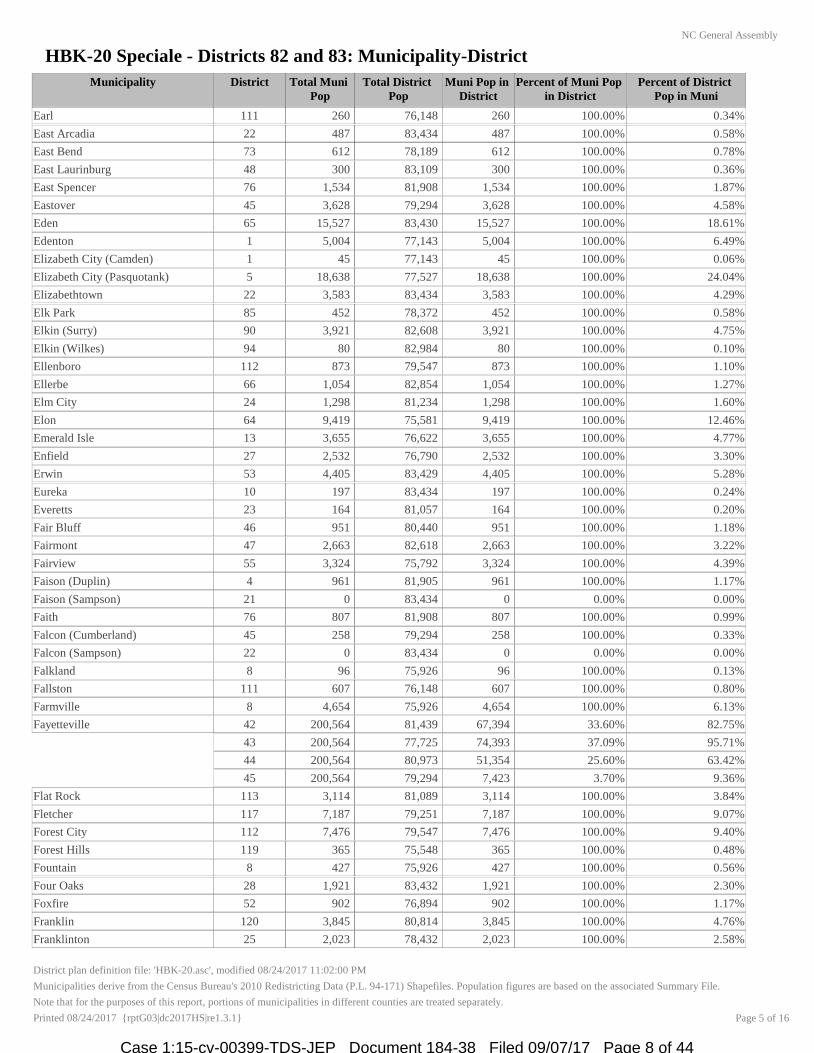
HBK-20 Speciale - Districts 82 and 83: Municipality-District
NC General Assembly
Municipality District Total Muni
Pop
Total District
Pop
Muni Pop in
District
Percent of Muni Pop
in District
Percent of District
Pop in Muni
Franklinville 78 1,164 76,980 1,164 100.00% 1.51%
Fremont 10 1,255 83,434 1,255 100.00% 1.50%
Fuquay-Varina 36 17,937 81,926 228 1.27% 0.28%
37 17,937 80,332 17,709 98.73% 22.04%
Gamewell 87 4,051 83,029 4,051 100.00% 4.88%
Garland 22 625 83,434 625 100.00% 0.75%
Garner 33 25,745 82,642 21,767 84.55% 26.34%
36 25,745 81,926 3,823 14.85% 4.67%
39 25,745 82,181 155 0.60% 0.19%
Garysburg 27 1,057 76,790 1,057 100.00% 1.38%
Gaston 27 1,152 76,790 1,152 100.00% 1.50%
Gastonia 108 71,741 76,926 26,870 37.45% 34.93%
109 71,741 75,517 41,847 58.33% 55.41%
110 71,741 75,573 3,024 4.22% 4.00%
Gatesville 5 321 77,527 321 100.00% 0.41%
Gibson 48 540 83,109 540 100.00% 0.65%
Gibsonville (Alamance) 64 3,148 75,581 3,148 100.00% 4.17%
Gibsonville (Guilford) 59 3,262 79,907 3,262 100.00% 4.08%
Glen Alpine 86 1,517 79,175 1,517 100.00% 1.92%
Godwin 45 139 79,294 139 100.00% 0.18%
Goldsboro 10 36,437 83,434 2,531 6.95% 3.03%
21 36,437 83,434 33,906 93.05% 40.64%
Goldston 54 268 82,312 268 100.00% 0.33%
Graham 63 14,153 75,550 14,153 100.00% 18.73%
Grandfather 85 25 78,372 25 100.00% 0.03%
Granite Falls 87 4,722 83,029 4,722 100.00% 5.69%
Granite Quarry 76 2,930 81,908 2,930 100.00% 3.58%
Grantsboro 6 688 76,421 688 100.00% 0.90%
Green Level 63 2,100 75,550 2,100 100.00% 2.78%
Greenevers 4 634 81,905 634 100.00% 0.77%
Greensboro 57 269,666 82,755 80,164 29.73% 96.87%
58 269,666 82,137 76,171 28.25% 92.74%
59 269,666 79,907 11,283 4.18% 14.12%
60 269,666 81,856 14,170 5.25% 17.31%
61 269,666 81,019 36,131 13.40% 44.60%
62 269,666 80,732 51,747 19.19% 64.10%
Greenville 8 84,554 75,926 48,780 57.69% 64.25%
9 84,554 75,794 34,649 40.98% 45.71%
12 84,554 75,923 1,125 1.33% 1.48%
Grifton (Lenoir) 12 186 75,923 186 100.00% 0.24%
Grifton (Pitt) 12 2,431 75,923 2,431 100.00% 3.20%
Grimesland 9 441 75,794 441 100.00% 0.58%
Grover 111 708 76,148 708 100.00% 0.93%
Halifax 27 234 76,790 234 100.00% 0.30%
Hamilton 23 408 81,057 408 100.00% 0.50%
Hamlet 66 6,495 82,854 6,495 100.00% 7.84%
Harmony 84 531 77,282 531 100.00% 0.69%
District plan definition file: 'HBK-20.asc', modified 08/24/2017 11:02:00 PM
Municipalities derive from the Census Bureau's 2010 Redistricting Data (P.L. 94-171) Shapefiles. Population figures are based on the associated Summary File.
Page 6 of 16
Note that for the purposes of this report, portions of municipalities in different counties are treated separately.
Printed 08/24/2017 {rptG03|dc2017HS|re1.3.1}
Case 1:15-cv-00399-TDS-JEP Document 184-38 Filed 09/07/17 Page 9 of 44

HBK-20 Speciale - Districts 82 and 83: Municipality-District
NC General Assembly
Municipality District Total Muni
Pop
Total District
Pop
Muni Pop in
District
Percent of Muni Pop
in District
Percent of District
Pop in Muni
Harrells (Duplin) 4 23 81,905 23 100.00% 0.03%
Harrells (Sampson) 22 179 83,434 179 100.00% 0.21%
Harrellsville 5 106 77,527 106 100.00% 0.14%
Harrisburg 67 11,526 82,761 3,156 27.38% 3.81%
82 11,526 80,879 8,370 72.62% 10.35%
Hassell 23 84 81,057 84 100.00% 0.10%
Havelock 3 20,735 75,726 20,735 100.00% 27.38%
Haw River 63 2,298 75,550 2,254 98.09% 2.98%
64 2,298 75,581 44 1.91% 0.06%
Hayesville 120 311 80,814 311 100.00% 0.38%
Hemby Bridge 69 1,520 76,381 1,520 100.00% 1.99%
Henderson 32 15,368 83,140 15,368 100.00% 18.48%
Hendersonville 113 13,137 81,089 514 3.91% 0.63%
117 13,137 79,251 12,623 96.09% 15.93%
Hertford 1 2,143 77,143 2,143 100.00% 2.78%
Hickory (Burke) 86 66 79,175 66 100.00% 0.08%
Hickory (Caldwell) 87 18 83,029 18 100.00% 0.02%
Hickory (Catawba) 89 39,926 77,838 5,448 13.65% 7.00%
96 39,926 76,520 34,478 86.35% 45.06%
High Point (Davidson) 80 5,310 81,522 5,310 100.00% 6.51%
High Point (Forsyth) 74 8 78,886 8 100.00% 0.01%
High Point (Guilford) 59 99,042 79,907 33 0.03% 0.04%
60 99,042 81,856 59,653 60.23% 72.88%
61 99,042 81,019 39,356 39.74% 48.58%
High Point (Randolph) 70 11 76,125 11 100.00% 0.01%
High Shoals 110 696 75,573 696 100.00% 0.92%
Highlands (Jackson) 119 4 75,548 4 100.00% 0.01%
Highlands (Macon) 120 920 80,814 920 100.00% 1.14%
Hildebran 86 2,023 79,175 2,023 100.00% 2.56%
Hillsborough 50 6,087 80,866 6,087 100.00% 7.53%
Hobgood 27 348 76,790 348 100.00% 0.45%
Hoffman 66 588 82,854 588 100.00% 0.71%
Holden Beach 17 575 77,263 575 100.00% 0.74%
Holly Ridge 15 1,268 77,307 1,268 100.00% 1.64%
Holly Springs 37 24,661 80,332 24,661 100.00% 30.70%
Hookerton 10 409 83,434 409 100.00% 0.49%
Hope Mills 44 15,176 80,973 5,976 39.38% 7.38%
45 15,176 79,294 9,200 60.62% 11.60%
Hot Springs 118 560 76,322 560 100.00% 0.73%
Hudson 87 3,776 83,029 3,776 100.00% 4.55%
Huntersville 98 46,773 75,602 36,997 79.10% 48.94%
107 46,773 75,856 9,776 20.90% 12.89%
Indian Beach 13 112 76,622 112 100.00% 0.15%
Indian Trail 55 33,518 75,792 51 0.15% 0.07%
68 33,518 76,067 7,845 23.41% 10.31%
69 33,518 76,381 25,622 76.44% 33.54%
Jackson 27 513 76,790 513 100.00% 0.67%
District plan definition file: 'HBK-20.asc', modified 08/24/2017 11:02:00 PM
Municipalities derive from the Census Bureau's 2010 Redistricting Data (P.L. 94-171) Shapefiles. Population figures are based on the associated Summary File.
Page 7 of 16
Note that for the purposes of this report, portions of municipalities in different counties are treated separately.
Printed 08/24/2017 {rptG03|dc2017HS|re1.3.1}
Case 1:15-cv-00399-TDS-JEP Document 184-38 Filed 09/07/17 Page 10 of 44
HBK-20 Speciale - Districts 82 and 83: Municipality-District
NC General Assembly
Municipality District Total Muni
Pop
Total District
Pop
Muni Pop in
District
Percent of Muni Pop
in District
Percent of District
Pop in Muni
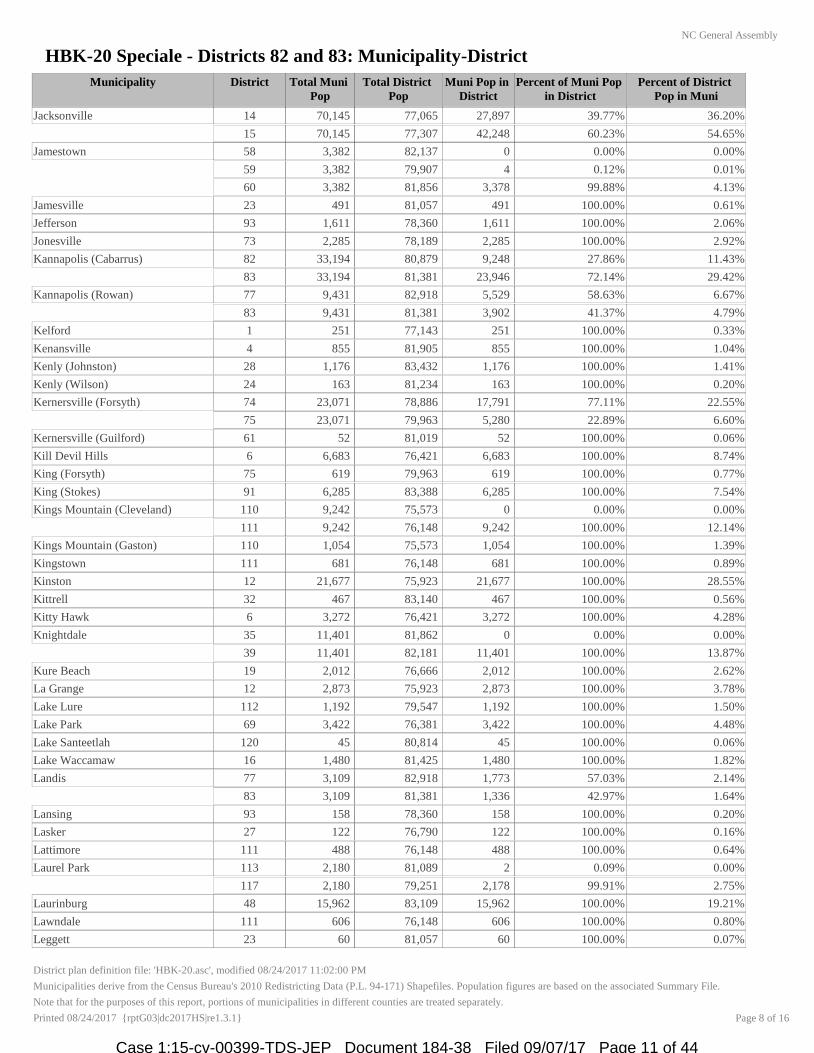
Jacksonville 14 70,145 77,065 27,897 39.77% 36.20%
15 70,145 77,307 42,248 60.23% 54.65%
Jamestown 58 3,382 82,137 0 0.00% 0.00%
59 3,382 79,907 4 0.12% 0.01%
60 3,382 81,856 3,378 99.88% 4.13%
Jamesville 23 491 81,057 491 100.00% 0.61%
Jefferson 93 1,611 78,360 1,611 100.00% 2.06%
Jonesville 73 2,285 78,189 2,285 100.00% 2.92%
Kannapolis (Cabarrus) 82 33,194 80,879 9,248 27.86% 11.43%
83 33,194 81,381 23,946 72.14% 29.42%
Kannapolis (Rowan) 77 9,431 82,918 5,529 58.63% 6.67%
83 9,431 81,381 3,902 41.37% 4.79%
Kelford 1 251 77,143 251 100.00% 0.33%
Kenansville 4 855 81,905 855 100.00% 1.04%
Kenly (Johnston) 28 1,176 83,432 1,176 100.00% 1.41%
Kenly (Wilson) 24 163 81,234 163 100.00% 0.20%
Kernersville (Forsyth) 74 23,071 78,886 17,791 77.11% 22.55%
75 23,071 79,963 5,280 22.89% 6.60%
Kernersville (Guilford) 61 52 81,019 52 100.00% 0.06%
Kill Devil Hills 6 6,683 76,421 6,683 100.00% 8.74%
King (Forsyth) 75 619 79,963 619 100.00% 0.77%
King (Stokes) 91 6,285 83,388 6,285 100.00% 7.54%
Kings Mountain (Cleveland) 110 9,242 75,573 0 0.00% 0.00%
111 9,242 76,148 9,242 100.00% 12.14%
Kings Mountain (Gaston) 110 1,054 75,573 1,054 100.00% 1.39%
Kingstown 111 681 76,148 681 100.00% 0.89%
Kinston 12 21,677 75,923 21,677 100.00% 28.55%
Kittrell 32 467 83,140 467 100.00% 0.56%
Kitty Hawk 6 3,272 76,421 3,272 100.00% 4.28%
Knightdale 35 11,401 81,862 0 0.00% 0.00%
39 11,401 82,181 11,401 100.00% 13.87%
Kure Beach 19 2,012 76,666 2,012 100.00% 2.62%
La Grange 12 2,873 75,923 2,873 100.00% 3.78%
Lake Lure 112 1,192 79,547 1,192 100.00% 1.50%
Lake Park 69 3,422 76,381 3,422 100.00% 4.48%
Lake Santeetlah 120 45 80,814 45 100.00% 0.06%
Lake Waccamaw 16 1,480 81,425 1,480 100.00% 1.82%
Landis 77 3,109 82,918 1,773 57.03% 2.14%
83 3,109 81,381 1,336 42.97% 1.64%
Lansing 93 158 78,360 158 100.00% 0.20%
Lasker 27 122 76,790 122 100.00% 0.16%
Lattimore 111 488 76,148 488 100.00% 0.64%
Laurel Park 113 2,180 81,089 2 0.09% 0.00%
117 2,180 79,251 2,178 99.91% 2.75%
Laurinburg 48 15,962 83,109 15,962 100.00% 19.21%
Lawndale 111 606 76,148 606 100.00% 0.80%
Leggett 23 60 81,057 60 100.00% 0.07%
District plan definition file: 'HBK-20.asc', modified 08/24/2017 11:02:00 PM
Municipalities derive from the Census Bureau's 2010 Redistricting Data (P.L. 94-171) Shapefiles. Population figures are based on the associated Summary File.
Page 8 of 16
Note that for the purposes of this report, portions of municipalities in different counties are treated separately.
Printed 08/24/2017 {rptG03|dc2017HS|re1.3.1}
Case 1:15-cv-00399-TDS-JEP Document 184-38 Filed 09/07/17 Page 11 of 44

HBK-20 Speciale - Districts 82 and 83: Municipality-District
NC General Assembly
Municipality District Total Muni
Pop
Total District
Pop
Muni Pop in
District
Percent of Muni Pop
in District
Percent of District
Pop in Muni
Leland 17 13,527 77,263 2,631 19.45% 3.41%
18 13,527 77,681 10,896 80.55% 14.03%
Lenoir 87 18,228 83,029 18,228 100.00% 21.95%
Lewiston Woodville 1 549 77,143 549 100.00% 0.71%
Lewisville 73 12,639 78,189 10,883 86.11% 13.92%
75 12,639 79,963 1,756 13.89% 2.20%
Lexington 80 18,931 81,522 0 0.00% 0.00%
81 18,931 81,356 18,931 100.00% 23.27%
Liberty 78 2,656 76,980 2,656 100.00% 3.45%
Lilesville 55 536 75,792 536 100.00% 0.71%
Lillington 53 3,194 83,429 3,194 100.00% 3.83%
Lincolnton 97 10,486 78,265 10,486 100.00% 13.40%
Linden 45 130 79,294 130 100.00% 0.16%
Littleton 27 674 76,790 674 100.00% 0.88%
Locust (Cabarrus) 67 215 82,761 215 100.00% 0.26%
Locust (Stanly) 67 2,715 82,761 2,715 100.00% 3.28%
Long View (Burke) 86 752 79,175 752 100.00% 0.95%
Long View (Catawba) 96 4,119 76,520 4,119 100.00% 5.38%
Louisburg 25 3,359 78,432 3,359 100.00% 4.28%
Love Valley 84 90 77,282 90 100.00% 0.12%
Lowell 108 3,526 76,926 3,526 100.00% 4.58%
Lucama 24 1,108 81,234 1,108 100.00% 1.36%
Lumber Bridge 46 94 80,440 94 100.00% 0.12%
Lumberton 46 21,542 80,440 5,785 26.85% 7.19%
47 21,542 82,618 15,757 73.15% 19.07%
Macclesfield 23 471 81,057 471 100.00% 0.58%
Macon 32 119 83,140 119 100.00% 0.14%
Madison 91 2,246 83,388 2,246 100.00% 2.69%
Maggie Valley 118 1,150 76,322 1,039 90.35% 1.36%
119 1,150 75,548 111 9.65% 0.15%
Magnolia 4 939 81,905 939 100.00% 1.15%
Maiden (Catawba) 89 3,308 77,838 3,308 100.00% 4.25%
Maiden (Lincoln) 97 2 78,265 2 100.00% 0.00%
Manteo 6 1,434 76,421 1,434 100.00% 1.88%
Marietta 46 175 80,440 175 100.00% 0.22%
Marion 85 7,838 78,372 7,838 100.00% 10.00%
Mars Hill 118 1,869 76,322 1,869 100.00% 2.45%
Marshall 118 872 76,322 872 100.00% 1.14%
Marshville 55 2,402 75,792 2,402 100.00% 3.17%
Marvin 68 5,579 76,067 5,579 100.00% 7.33%
Matthews 103 27,198 76,381 27,198 100.00% 35.61%
Maxton (Robeson) 47 2,230 82,618 2,230 100.00% 2.70%
Maxton (Scotland) 48 196 83,109 196 100.00% 0.24%
Mayodan 91 2,478 83,388 2,478 100.00% 2.97%
Maysville 13 1,019 76,622 1,019 100.00% 1.33%
McAdenville 108 651 76,926 651 100.00% 0.85%
McDonald 47 113 82,618 113 100.00% 0.14%
District plan definition file: 'HBK-20.asc', modified 08/24/2017 11:02:00 PM
Municipalities derive from the Census Bureau's 2010 Redistricting Data (P.L. 94-171) Shapefiles. Population figures are based on the associated Summary File.
Page 9 of 16
Note that for the purposes of this report, portions of municipalities in different counties are treated separately.
Printed 08/24/2017 {rptG03|dc2017HS|re1.3.1}
Case 1:15-cv-00399-TDS-JEP Document 184-38 Filed 09/07/17 Page 12 of 44
HBK-20 Speciale - Districts 82 and 83: Municipality-District
NC General Assembly
Municipality District Total Muni
Pop
Total District
Pop
Muni Pop in
District
Percent of Muni Pop
in District
Percent of District
Pop in Muni
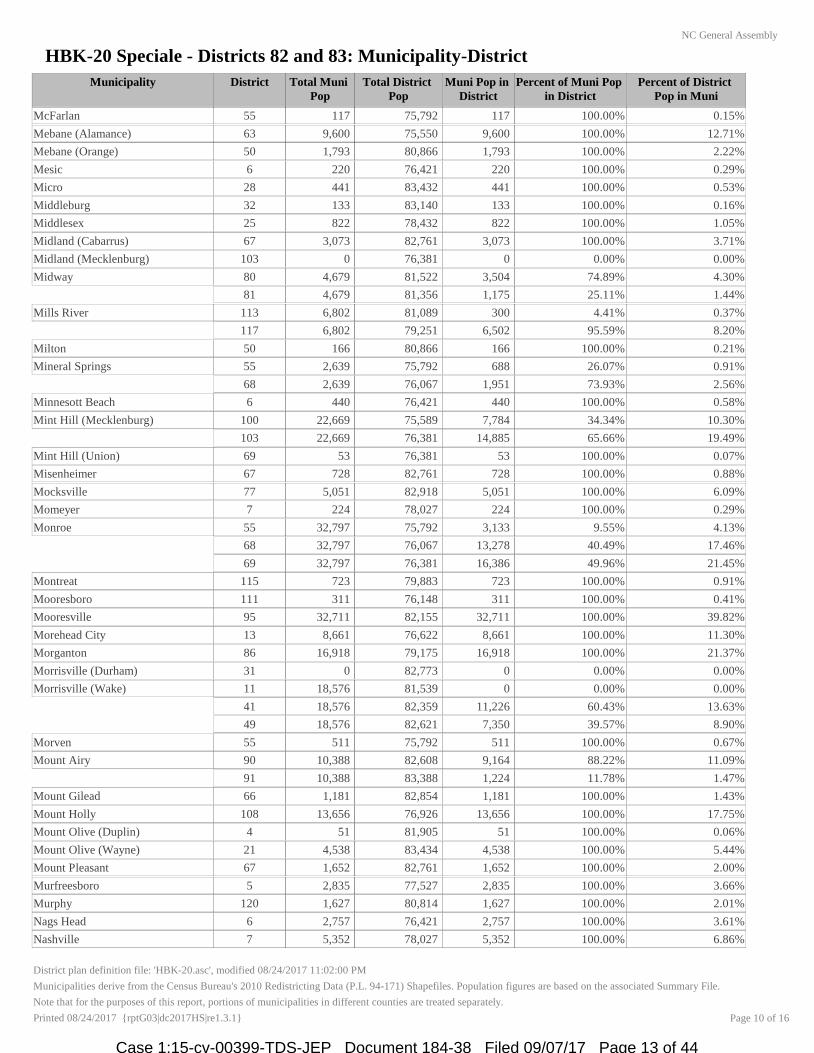
McFarlan 55 117 75,792 117 100.00% 0.15%
Mebane (Alamance) 63 9,600 75,550 9,600 100.00% 12.71%
Mebane (Orange) 50 1,793 80,866 1,793 100.00% 2.22%
Mesic 6 220 76,421 220 100.00% 0.29%
Micro 28 441 83,432 441 100.00% 0.53%
Middleburg 32 133 83,140 133 100.00% 0.16%
Middlesex 25 822 78,432 822 100.00% 1.05%
Midland (Cabarrus) 67 3,073 82,761 3,073 100.00% 3.71%
Midland (Mecklenburg) 103 0 76,381 0 0.00% 0.00%
Midway 80 4,679 81,522 3,504 74.89% 4.30%
81 4,679 81,356 1,175 25.11% 1.44%
Mills River 113 6,802 81,089 300 4.41% 0.37%
117 6,802 79,251 6,502 95.59% 8.20%
Milton 50 166 80,866 166 100.00% 0.21%
Mineral Springs 55 2,639 75,792 688 26.07% 0.91%
68 2,639 76,067 1,951 73.93% 2.56%
Minnesott Beach 6 440 76,421 440 100.00% 0.58%
Mint Hill (Mecklenburg) 100 22,669 75,589 7,784 34.34% 10.30%
103 22,669 76,381 14,885 65.66% 19.49%
Mint Hill (Union) 69 53 76,381 53 100.00% 0.07%
Misenheimer 67 728 82,761 728 100.00% 0.88%
Mocksville 77 5,051 82,918 5,051 100.00% 6.09%
Momeyer 7 224 78,027 224 100.00% 0.29%
Monroe 55 32,797 75,792 3,133 9.55% 4.13%
68 32,797 76,067 13,278 40.49% 17.46%
69 32,797 76,381 16,386 49.96% 21.45%
Montreat 115 723 79,883 723 100.00% 0.91%
Mooresboro 111 311 76,148 311 100.00% 0.41%
Mooresville 95 32,711 82,155 32,711 100.00% 39.82%
Morehead City 13 8,661 76,622 8,661 100.00% 11.30%
Morganton 86 16,918 79,175 16,918 100.00% 21.37%
Morrisville (Durham) 31 0 82,773 0 0.00% 0.00%
Morrisville (Wake) 11 18,576 81,539 0 0.00% 0.00%
41 18,576 82,359 11,226 60.43% 13.63%
49 18,576 82,621 7,350 39.57% 8.90%
Morven 55 511 75,792 511 100.00% 0.67%
Mount Airy 90 10,388 82,608 9,164 88.22% 11.09%
91 10,388 83,388 1,224 11.78% 1.47%
Mount Gilead 66 1,181 82,854 1,181 100.00% 1.43%
Mount Holly 108 13,656 76,926 13,656 100.00% 17.75%
Mount Olive (Duplin) 4 51 81,905 51 100.00% 0.06%
Mount Olive (Wayne) 21 4,538 83,434 4,538 100.00% 5.44%
Mount Pleasant 67 1,652 82,761 1,652 100.00% 2.00%
Murfreesboro 5 2,835 77,527 2,835 100.00% 3.66%
Murphy 120 1,627 80,814 1,627 100.00% 2.01%
Nags Head 6 2,757 76,421 2,757 100.00% 3.61%
Nashville 7 5,352 78,027 5,352 100.00% 6.86%
District plan definition file: 'HBK-20.asc', modified 08/24/2017 11:02:00 PM
Municipalities derive from the Census Bureau's 2010 Redistricting Data (P.L. 94-171) Shapefiles. Population figures are based on the associated Summary File.
Page 10 of 16
Note that for the purposes of this report, portions of municipalities in different counties are treated separately.
Printed 08/24/2017 {rptG03|dc2017HS|re1.3.1}
Case 1:15-cv-00399-TDS-JEP Document 184-38 Filed 09/07/17 Page 13 of 44
HBK-20 Speciale - Districts 82 and 83: Municipality-District
NC General Assembly
Municipality District Total Muni
Pop
Total District
Pop
Muni Pop in
District
Percent of Muni Pop
in District
Percent of District
Pop in Muni
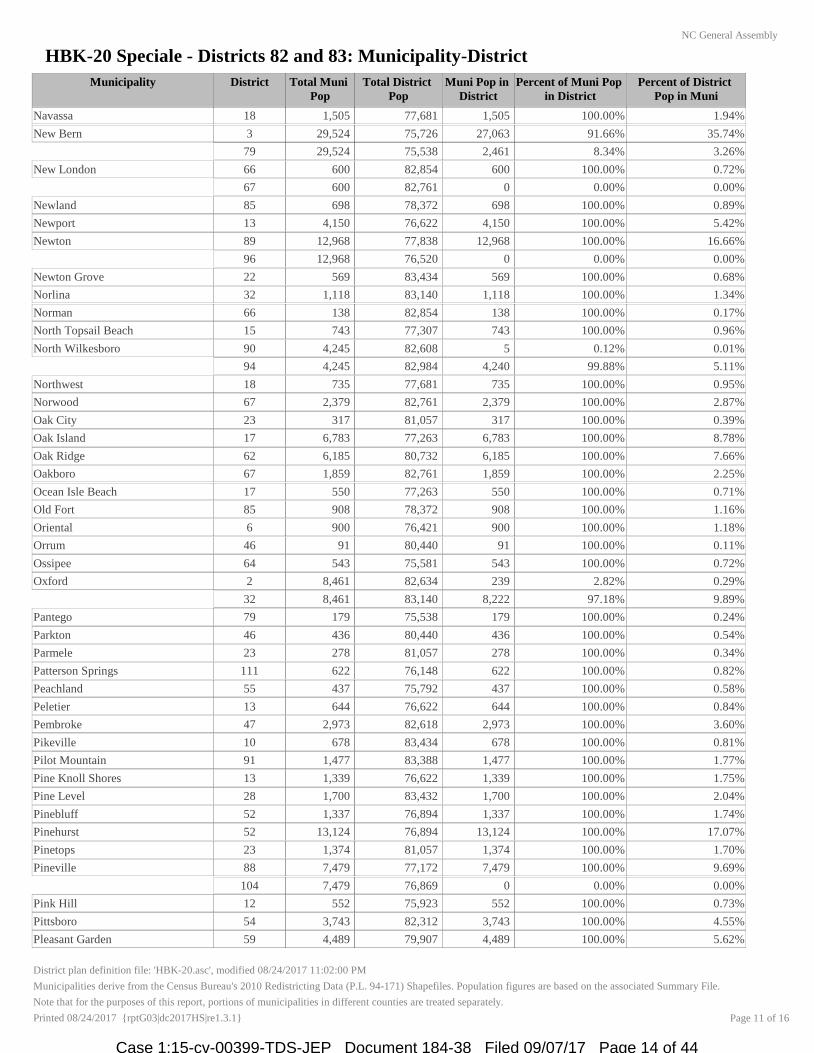
Navassa 18 1,505 77,681 1,505 100.00% 1.94%
New Bern 3 29,524 75,726 27,063 91.66% 35.74%
79 29,524 75,538 2,461 8.34% 3.26%
New London 66 600 82,854 600 100.00% 0.72%
67 600 82,761 0 0.00% 0.00%
Newland 85 698 78,372 698 100.00% 0.89%
Newport 13 4,150 76,622 4,150 100.00% 5.42%
Newton 89 12,968 77,838 12,968 100.00% 16.66%
96 12,968 76,520 0 0.00% 0.00%
Newton Grove 22 569 83,434 569 100.00% 0.68%
Norlina 32 1,118 83,140 1,118 100.00% 1.34%
Norman 66 138 82,854 138 100.00% 0.17%
North Topsail Beach 15 743 77,307 743 100.00% 0.96%
North Wilkesboro 90 4,245 82,608 5 0.12% 0.01%
94 4,245 82,984 4,240 99.88% 5.11%
Northwest 18 735 77,681 735 100.00% 0.95%
Norwood 67 2,379 82,761 2,379 100.00% 2.87%
Oak City 23 317 81,057 317 100.00% 0.39%
Oak Island 17 6,783 77,263 6,783 100.00% 8.78%
Oak Ridge 62 6,185 80,732 6,185 100.00% 7.66%
Oakboro 67 1,859 82,761 1,859 100.00% 2.25%
Ocean Isle Beach 17 550 77,263 550 100.00% 0.71%
Old Fort 85 908 78,372 908 100.00% 1.16%
Oriental 6 900 76,421 900 100.00% 1.18%
Orrum 46 91 80,440 91 100.00% 0.11%
Ossipee 64 543 75,581 543 100.00% 0.72%
Oxford 2 8,461 82,634 239 2.82% 0.29%
32 8,461 83,140 8,222 97.18% 9.89%
Pantego 79 179 75,538 179 100.00% 0.24%
Parkton 46 436 80,440 436 100.00% 0.54%
Parmele 23 278 81,057 278 100.00% 0.34%
Patterson Springs 111 622 76,148 622 100.00% 0.82%
Peachland 55 437 75,792 437 100.00% 0.58%
Peletier 13 644 76,622 644 100.00% 0.84%
Pembroke 47 2,973 82,618 2,973 100.00% 3.60%
Pikeville 10 678 83,434 678 100.00% 0.81%
Pilot Mountain 91 1,477 83,388 1,477 100.00% 1.77%
Pine Knoll Shores 13 1,339 76,622 1,339 100.00% 1.75%
Pine Level 28 1,700 83,432 1,700 100.00% 2.04%
Pinebluff 52 1,337 76,894 1,337 100.00% 1.74%
Pinehurst 52 13,124 76,894 13,124 100.00% 17.07%
Pinetops 23 1,374 81,057 1,374 100.00% 1.70%
Pineville 88 7,479 77,172 7,479 100.00% 9.69%
104 7,479 76,869 0 0.00% 0.00%
Pink Hill 12 552 75,923 552 100.00% 0.73%
Pittsboro 54 3,743 82,312 3,743 100.00% 4.55%
Pleasant Garden 59 4,489 79,907 4,489 100.00% 5.62%
District plan definition file: 'HBK-20.asc', modified 08/24/2017 11:02:00 PM
Municipalities derive from the Census Bureau's 2010 Redistricting Data (P.L. 94-171) Shapefiles. Population figures are based on the associated Summary File.
Page 11 of 16
Note that for the purposes of this report, portions of municipalities in different counties are treated separately.
Printed 08/24/2017 {rptG03|dc2017HS|re1.3.1}
Case 1:15-cv-00399-TDS-JEP Document 184-38 Filed 09/07/17 Page 14 of 44
HBK-20 Speciale - Districts 82 and 83: Municipality-District
NC General Assembly
Municipality District Total Muni
Pop
Total District
Pop
Muni Pop in
District
Percent of Muni Pop
in District
Percent of District
Pop in Muni
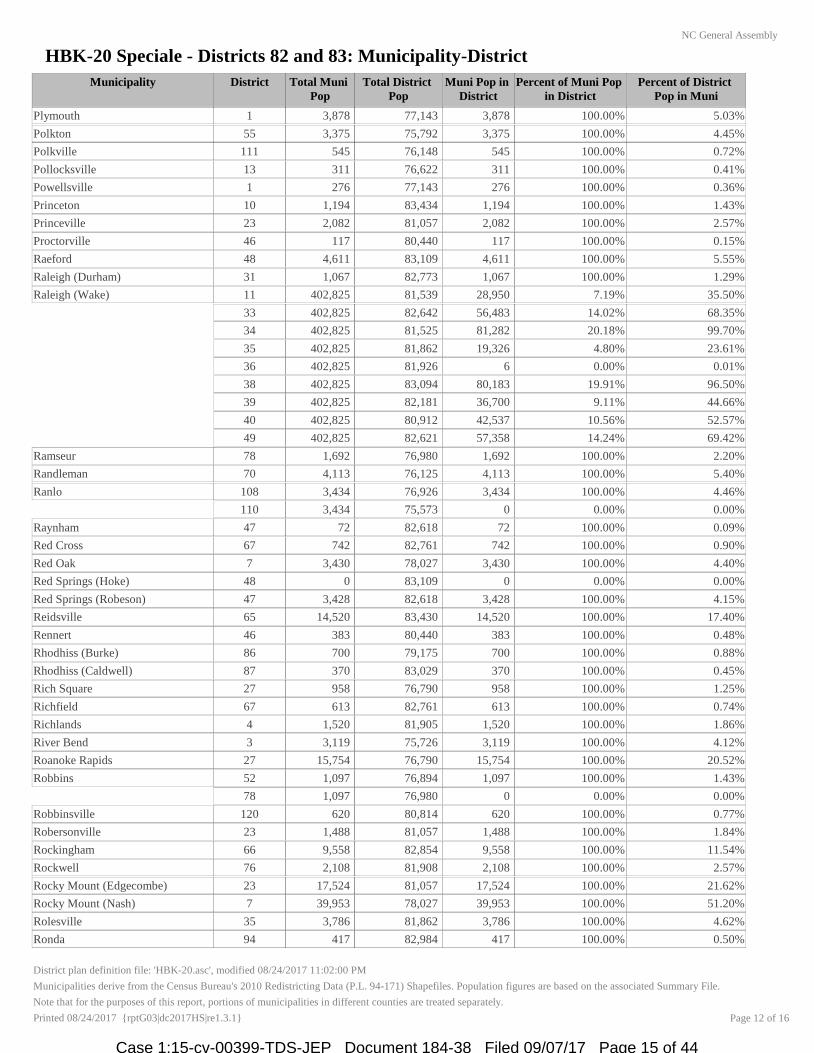
Plymouth 1 3,878 77,143 3,878 100.00% 5.03%
Polkton 55 3,375 75,792 3,375 100.00% 4.45%
Polkville 111 545 76,148 545 100.00% 0.72%
Pollocksville 13 311 76,622 311 100.00% 0.41%
Powellsville 1 276 77,143 276 100.00% 0.36%
Princeton 10 1,194 83,434 1,194 100.00% 1.43%
Princeville 23 2,082 81,057 2,082 100.00% 2.57%
Proctorville 46 117 80,440 117 100.00% 0.15%
Raeford 48 4,611 83,109 4,611 100.00% 5.55%
Raleigh (Durham) 31 1,067 82,773 1,067 100.00% 1.29%
Raleigh (Wake) 11 402,825 81,539 28,950 7.19% 35.50%
33 402,825 82,642 56,483 14.02% 68.35%
34 402,825 81,525 81,282 20.18% 99.70%
35 402,825 81,862 19,326 4.80% 23.61%
36 402,825 81,926 6 0.00% 0.01%
38 402,825 83,094 80,183 19.91% 96.50%
39 402,825 82,181 36,700 9.11% 44.66%
40 402,825 80,912 42,537 10.56% 52.57%
49 402,825 82,621 57,358 14.24% 69.42%
Ramseur 78 1,692 76,980 1,692 100.00% 2.20%
Randleman 70 4,113 76,125 4,113 100.00% 5.40%
Ranlo 108 3,434 76,926 3,434 100.00% 4.46%
110 3,434 75,573 0 0.00% 0.00%
Raynham 47 72 82,618 72 100.00% 0.09%
Red Cross 67 742 82,761 742 100.00% 0.90%
Red Oak 7 3,430 78,027 3,430 100.00% 4.40%
Red Springs (Hoke) 48 0 83,109 0 0.00% 0.00%
Red Springs (Robeson) 47 3,428 82,618 3,428 100.00% 4.15%
Reidsville 65 14,520 83,430 14,520 100.00% 17.40%
Rennert 46 383 80,440 383 100.00% 0.48%
Rhodhiss (Burke) 86 700 79,175 700 100.00% 0.88%
Rhodhiss (Caldwell) 87 370 83,029 370 100.00% 0.45%
Rich Square 27 958 76,790 958 100.00% 1.25%
Richfield 67 613 82,761 613 100.00% 0.74%
Richlands 4 1,520 81,905 1,520 100.00% 1.86%
River Bend 3 3,119 75,726 3,119 100.00% 4.12%
Roanoke Rapids 27 15,754 76,790 15,754 100.00% 20.52%
Robbins 52 1,097 76,894 1,097 100.00% 1.43%
78 1,097 76,980 0 0.00% 0.00%
Robbinsville 120 620 80,814 620 100.00% 0.77%
Robersonville 23 1,488 81,057 1,488 100.00% 1.84%
Rockingham 66 9,558 82,854 9,558 100.00% 11.54%
Rockwell 76 2,108 81,908 2,108 100.00% 2.57%
Rocky Mount (Edgecombe) 23 17,524 81,057 17,524 100.00% 21.62%
Rocky Mount (Nash) 7 39,953 78,027 39,953 100.00% 51.20%
Rolesville 35 3,786 81,862 3,786 100.00% 4.62%
Ronda 94 417 82,984 417 100.00% 0.50%
District plan definition file: 'HBK-20.asc', modified 08/24/2017 11:02:00 PM
Municipalities derive from the Census Bureau's 2010 Redistricting Data (P.L. 94-171) Shapefiles. Population figures are based on the associated Summary File.
Page 12 of 16
Note that for the purposes of this report, portions of municipalities in different counties are treated separately.
Printed 08/24/2017 {rptG03|dc2017HS|re1.3.1}
Case 1:15-cv-00399-TDS-JEP Document 184-38 Filed 09/07/17 Page 15 of 44

HBK-20 Speciale - Districts 82 and 83: Municipality-District
NC General Assembly
Municipality District Total Muni
Pop
Total District
Pop
Muni Pop in
District
Percent of Muni Pop
in District
Percent of District
Pop in Muni
Roper 1 611 77,143 611 100.00% 0.79%
Rose Hill 4 1,626 81,905 1,626 100.00% 1.99%
Roseboro 22 1,191 83,434 1,191 100.00% 1.43%
Rosman 113 576 81,089 576 100.00% 0.71%
Rowland 47 1,037 82,618 1,037 100.00% 1.26%
Roxboro 2 8,362 82,634 8,362 100.00% 10.12%
Roxobel 1 240 77,143 240 100.00% 0.31%
Rural Hall 75 2,937 79,963 2,937 100.00% 3.67%
Ruth 112 440 79,547 440 100.00% 0.55%
Rutherford College 86 1,341 79,175 1,341 100.00% 1.69%
Rutherfordton 112 4,213 79,547 4,213 100.00% 5.30%
Salemburg 22 435 83,434 435 100.00% 0.52%
Salisbury 76 33,662 81,908 31,445 93.41% 38.39%
77 33,662 82,918 2,217 6.59% 2.67%
Saluda (Henderson) 113 12 81,089 12 100.00% 0.01%
Saluda (Polk) 113 701 81,089 701 100.00% 0.86%
Sandy Creek 18 260 77,681 260 100.00% 0.33%
Sandyfield 16 447 81,425 447 100.00% 0.55%
Sanford 51 28,094 83,434 28,094 100.00% 33.67%
Saratoga 24 408 81,234 408 100.00% 0.50%
Sawmills 87 5,240 83,029 5,240 100.00% 6.31%
Scotland Neck 27 2,059 76,790 2,059 100.00% 2.68%
Seaboard 27 632 76,790 632 100.00% 0.82%
Seagrove 78 228 76,980 228 100.00% 0.30%
Sedalia 59 623 79,907 623 100.00% 0.78%
Selma 26 6,073 83,431 5 0.08% 0.01%
28 6,073 83,432 6,068 99.92% 7.27%
Seven Devils (Avery) 85 28 78,372 28 100.00% 0.04%
Seven Devils (Watauga) 93 164 78,360 164 100.00% 0.21%
Seven Springs 10 110 83,434 110 100.00% 0.13%
Severn 27 276 76,790 276 100.00% 0.36%
Shallotte 17 3,675 77,263 3,675 100.00% 4.76%
Sharpsburg (Edgecombe) 23 209 81,057 209 100.00% 0.26%
Sharpsburg (Nash) 7 1,252 78,027 1,252 100.00% 1.60%
Sharpsburg (Wilson) 24 563 81,234 563 100.00% 0.69%
Shelby 110 20,323 75,573 11,240 55.31% 14.87%
111 20,323 76,148 9,083 44.69% 11.93%
Siler City 54 7,887 82,312 7,887 100.00% 9.58%
Simpson 9 416 75,794 416 100.00% 0.55%
Sims 24 282 81,234 282 100.00% 0.35%
Smithfield 26 10,966 83,431 127 1.16% 0.15%
28 10,966 83,432 10,839 98.84% 12.99%
Snow Hill 10 1,595 83,434 1,595 100.00% 1.91%
Southern Pines 52 12,334 76,894 12,334 100.00% 16.04%
Southern Shores 6 2,714 76,421 2,714 100.00% 3.55%
Southport 17 2,833 77,263 2,833 100.00% 3.67%
Sparta 90 1,770 82,608 1,770 100.00% 2.14%
District plan definition file: 'HBK-20.asc', modified 08/24/2017 11:02:00 PM
Municipalities derive from the Census Bureau's 2010 Redistricting Data (P.L. 94-171) Shapefiles. Population figures are based on the associated Summary File.
Page 13 of 16
Note that for the purposes of this report, portions of municipalities in different counties are treated separately.
Printed 08/24/2017 {rptG03|dc2017HS|re1.3.1}
Case 1:15-cv-00399-TDS-JEP Document 184-38 Filed 09/07/17 Page 16 of 44

HBK-20 Speciale - Districts 82 and 83: Municipality-District
NC General Assembly
Municipality District Total Muni
Pop
Total District
Pop
Muni Pop in
District
Percent of Muni Pop
in District
Percent of District
Pop in Muni
Speed 23 80 81,057 80 100.00% 0.10%
Spencer 76 3,267 81,908 3,267 100.00% 3.99%
Spencer Mountain 108 37 76,926 37 100.00% 0.05%
Spindale 112 4,321 79,547 4,321 100.00% 5.43%
Spring Hope 7 1,320 78,027 1,320 100.00% 1.69%
Spring Lake 42 11,964 81,439 11,964 100.00% 14.69%
Spruce Pine 85 2,175 78,372 2,175 100.00% 2.78%
St. Helena 16 389 81,425 389 100.00% 0.48%
St. James 17 3,165 77,263 3,165 100.00% 4.10%
St. Pauls 46 2,035 80,440 2,035 100.00% 2.53%
Staley 78 393 76,980 393 100.00% 0.51%
Stallings (Mecklenburg) 103 399 76,381 399 100.00% 0.52%
Stallings (Union) 68 13,432 76,067 0 0.00% 0.00%
69 13,432 76,381 13,432 100.00% 17.59%
Stanfield 67 1,486 82,761 1,486 100.00% 1.80%
Stanley 108 3,556 76,926 3,550 99.83% 4.61%
110 3,556 75,573 6 0.17% 0.01%
Stantonsburg 24 784 81,234 784 100.00% 0.97%
Star 66 876 82,854 876 100.00% 1.06%
Statesville 84 24,532 77,282 20,541 83.73% 26.58%
95 24,532 82,155 3,991 16.27% 4.86%
Stedman 45 1,028 79,294 1,028 100.00% 1.30%
Stem 2 463 82,634 463 100.00% 0.56%
Stokesdale 62 5,047 80,732 5,047 100.00% 6.25%
Stoneville 65 1,056 83,430 1,056 100.00% 1.27%
Stonewall 6 281 76,421 281 100.00% 0.37%
Stovall 32 418 83,140 418 100.00% 0.50%
Sugar Mountain 85 198 78,372 198 100.00% 0.25%
Summerfield 62 10,232 80,732 10,232 100.00% 12.67%
Sunset Beach 17 3,572 77,263 3,572 100.00% 4.62%
Surf City (Onslow) 15 292 77,307 292 100.00% 0.38%
Surf City (Pender) 16 1,561 81,425 1,561 100.00% 1.92%
Swansboro 14 2,663 77,065 2,663 100.00% 3.46%
Swepsonville 63 1,154 75,550 1,154 100.00% 1.53%
Sylva 119 2,588 75,548 2,588 100.00% 3.43%
Tabor City 46 2,511 80,440 2,511 100.00% 3.12%
Tar Heel 22 117 83,434 117 100.00% 0.14%
Tarboro 23 11,415 81,057 11,415 100.00% 14.08%
Taylorsville 94 2,098 82,984 2,098 100.00% 2.53%
Taylortown 52 722 76,894 722 100.00% 0.94%
Teachey 4 376 81,905 376 100.00% 0.46%
Thomasville (Davidson) 80 26,493 81,522 25,474 96.15% 31.25%
81 26,493 81,356 1,019 3.85% 1.25%
Thomasville (Randolph) 70 264 76,125 264 100.00% 0.35%
Tobaccoville (Forsyth) 75 2,441 79,963 2,441 100.00% 3.05%
Tobaccoville (Stokes) 91 0 83,388 0 0.00% 0.00%
Topsail Beach 16 368 81,425 368 100.00% 0.45%
District plan definition file: 'HBK-20.asc', modified 08/24/2017 11:02:00 PM
Municipalities derive from the Census Bureau's 2010 Redistricting Data (P.L. 94-171) Shapefiles. Population figures are based on the associated Summary File.
Page 14 of 16
Note that for the purposes of this report, portions of municipalities in different counties are treated separately.
Printed 08/24/2017 {rptG03|dc2017HS|re1.3.1}
Case 1:15-cv-00399-TDS-JEP Document 184-38 Filed 09/07/17 Page 17 of 44

HBK-20 Speciale - Districts 82 and 83: Municipality-District
NC General Assembly
Municipality District Total Muni
Pop
Total District
Pop
Muni Pop in
District
Percent of Muni Pop
in District
Percent of District
Pop in Muni
Trent Woods 3 4,155 75,726 4,155 100.00% 5.49%
Trenton 13 287 76,622 287 100.00% 0.37%
Trinity 70 6,614 76,125 6,614 100.00% 8.69%
Troutman 84 2,383 77,282 2,169 91.02% 2.81%
95 2,383 82,155 214 8.98% 0.26%
Troy 66 3,189 82,854 3,189 100.00% 3.85%
Tryon 113 1,646 81,089 1,646 100.00% 2.03%
Turkey 21 292 83,434 292 100.00% 0.35%
Unionville 55 5,929 75,792 337 5.68% 0.44%
69 5,929 76,381 5,592 94.32% 7.32%
Valdese 86 4,490 79,175 4,490 100.00% 5.67%
Vanceboro 79 1,005 75,538 1,005 100.00% 1.33%
Vandemere 6 254 76,421 254 100.00% 0.33%
Varnamtown 17 541 77,263 541 100.00% 0.70%
Vass 52 720 76,894 720 100.00% 0.94%
Waco 110 321 75,573 321 100.00% 0.42%
Wade 45 556 79,294 556 100.00% 0.70%
Wadesboro 55 5,813 75,792 5,813 100.00% 7.67%
Wagram 48 840 83,109 840 100.00% 1.01%
Wake Forest (Franklin) 25 899 78,432 899 100.00% 1.15%
Wake Forest (Wake) 35 29,218 81,862 29,218 100.00% 35.69%
Walkertown 72 4,675 76,245 1,018 21.78% 1.34%
75 4,675 79,963 3,657 78.22% 4.57%
Wallace (Duplin) 4 3,880 81,905 3,880 100.00% 4.74%
Wallace (Pender) 16 0 81,425 0 0.00% 0.00%
Wallburg 80 3,047 81,522 3,047 100.00% 3.74%
Walnut Cove 91 1,425 83,388 1,425 100.00% 1.71%
Walnut Creek 10 835 83,434 835 100.00% 1.00%
Walstonburg 10 219 83,434 219 100.00% 0.26%
Warrenton 32 862 83,140 862 100.00% 1.04%
Warsaw 4 3,054 81,905 3,054 100.00% 3.73%
Washington 79 9,744 75,538 9,744 100.00% 12.90%
Washington Park 79 451 75,538 451 100.00% 0.60%
Watha 16 190 81,425 190 100.00% 0.23%
Waxhaw 55 9,859 75,792 1,604 16.27% 2.12%
68 9,859 76,067 8,255 83.73% 10.85%
Waynesville 119 9,869 75,548 9,869 100.00% 13.06%
Weaverville 115 3,120 79,883 3,120 100.00% 3.91%
Webster 119 363 75,548 363 100.00% 0.48%
Weddington (Mecklenburg) 103 7 76,381 7 100.00% 0.01%
Weddington (Union) 68 9,452 76,067 8,933 94.51% 11.74%
69 9,452 76,381 519 5.49% 0.68%
Weldon 27 1,655 76,790 1,655 100.00% 2.16%
Wendell 35 5,845 81,862 2,091 35.77% 2.55%
39 5,845 82,181 3,754 64.23% 4.57%
Wentworth 65 2,807 83,430 2,807 100.00% 3.36%
Wesley Chapel 68 7,463 76,067 6,877 92.15% 9.04%
District plan definition file: 'HBK-20.asc', modified 08/24/2017 11:02:00 PM
Municipalities derive from the Census Bureau's 2010 Redistricting Data (P.L. 94-171) Shapefiles. Population figures are based on the associated Summary File.
Page 15 of 16
Note that for the purposes of this report, portions of municipalities in different counties are treated separately.
Printed 08/24/2017 {rptG03|dc2017HS|re1.3.1}
Case 1:15-cv-00399-TDS-JEP Document 184-38 Filed 09/07/17 Page 18 of 44

HBK-20 Speciale - Districts 82 and 83: Municipality-District
NC General Assembly
Municipality District Total Muni
Pop
Total District
Pop
Muni Pop in
District
Percent of Muni Pop
in District
Percent of District
Pop in Muni
Wesley Chapel 69 7,463 76,381 586 7.85% 0.77%
West Jefferson 93 1,299 78,360 1,299 100.00% 1.66%
Whispering Pines 52 2,928 76,894 2,928 100.00% 3.81%
Whitakers (Edgecombe) 23 402 81,057 402 100.00% 0.50%
Whitakers (Nash) 7 342 78,027 342 100.00% 0.44%
White Lake 22 802 83,434 802 100.00% 0.96%
Whiteville 16 5,394 81,425 5,394 100.00% 6.62%
Whitsett 59 590 79,907 590 100.00% 0.74%
Wilkesboro 90 3,413 82,608 3 0.09% 0.00%
94 3,413 82,984 3,410 99.91% 4.11%
Williamston 23 5,511 81,057 5,511 100.00% 6.80%
Wilmington 18 106,476 77,681 41,563 39.04% 53.50%
19 106,476 76,666 33,947 31.88% 44.28%
20 106,476 78,488 30,966 29.08% 39.45%
Wilson 24 49,167 81,234 49,167 100.00% 60.53%
Wilson's Mills 26 2,277 83,431 2,277 100.00% 2.73%
28 2,277 83,432 0 0.00% 0.00%
Windsor 1 3,630 77,143 3,630 100.00% 4.71%
Winfall 1 594 77,143 594 100.00% 0.77%
Wingate 55 3,491 75,792 349 10.00% 0.46%
69 3,491 76,381 3,142 90.00% 4.11%
Winston-Salem 71 229,617 75,793 75,779 33.00% 99.98%
72 229,617 76,245 73,464 31.99% 96.35%
73 229,617 78,189 17,422 7.59% 22.28%
74 229,617 78,886 32,875 14.32% 41.67%
75 229,617 79,963 30,077 13.10% 37.61%
Winterville 8 9,269 75,926 0 0.00% 0.00%
9 9,269 75,794 8,391 90.53% 11.07%
12 9,269 75,923 878 9.47% 1.16%
Winton 5 769 77,527 769 100.00% 0.99%
Woodfin 114 6,123 82,902 2,563 41.86% 3.09%
115 6,123 79,883 2,717 44.37% 3.40%
116 6,123 75,533 843 13.77% 1.12%
Woodland 27 809 76,790 809 100.00% 1.05%
Wrightsville Beach 19 2,477 76,666 2,477 100.00% 3.23%
20 2,477 78,488 0 0.00% 0.00%
Yadkinville 73 2,959 78,189 2,959 100.00% 3.78%
Yanceyville 50 2,039 80,866 2,039 100.00% 2.52%
Youngsville 25 1,157 78,432 1,157 100.00% 1.48%
Zebulon (Johnston) 26 0 83,431 0 0.00% 0.00%
Zebulon (Wake) 35 4,433 81,862 381 8.59% 0.47%
39 4,433 82,181 4,052 91.41% 4.93%
Total: 5,250,071
District plan definition file: 'HBK-20.asc', modified 08/24/2017 11:02:00 PM
Municipalities derive from the Census Bureau's 2010 Redistricting Data (P.L. 94-171) Shapefiles. Population figures are based on the associated Summary File.
Page 16 of 16
Note that for the purposes of this report, portions of municipalities in different counties are treated separately.
Printed 08/24/2017 {rptG03|dc2017HS|re1.3.1}
Case 1:15-cv-00399-TDS-JEP Document 184-38 Filed 09/07/17 Page 19 of 44

HBK-20 Speciale - Districts 82 and 83: Split VTD Detail
NC General Assembly
County VTD District Total VTD Pop VTD Pop in District Percent of VTD Pop in District
Alamance 03C 63 2,814 2,491 88.52%
64 2,814 323 11.48%
063 63 4,940 4,090 82.79%
64 4,940 850 17.21%
06W 63 1,973 1,617 81.96%
64 1,973 356 18.04%
Brunswick 04 17 13,819 3,644 26.37%
18 13,819 10,175 73.63%
Buncombe 05.1 114 2,748 1,691 61.54%
115 2,748 1,057 38.46%
100.1 114 9,126 8,524 93.40%
115 9,126 602 6.60%
102.1 114 5,975 1,385 23.18%
116 5,975 4,590 76.82%
104.1 114 3,081 2,345 76.11%
115 3,081 736 23.89%
19.1 114 2,159 1,843 85.36%
116 2,159 316 14.64%
24.1 114 3,211 1,964 61.16%
116 3,211 1,247 38.84%
52.1 115 5,279 3,762 71.26%
116 5,279 1,517 28.74%
57.1 114 3,534 315 8.91%
115 3,534 1,149 32.51%
116 3,534 2,070 58.57%
60.2 114 1,300 164 12.62%
115 1,300 1,136 87.38%
64.1 114 2,671 820 30.70%
115 2,671 1,851 69.30%
70.1 114 3,508 2,418 68.93%
115 3,508 1,090 31.07%
Craven N4 3 6,831 5,069 74.21%
79 6,831 1,762 25.79%
Cumberland G2 43 34,282 29,272 85.39%
45 34,282 5,010 14.61%
Durham 34 29 11,492 9,457 82.29%
31 11,492 2,035 17.71%
Gaston 05 109 4,767 4,132 86.68%
110 4,767 635 13.32%
Harnett PR07 51 17,943 14,553 81.11%
53 17,943 3,390 18.89%
PR08 28 10,373 5,681 54.77%
53 10,373 4,692 45.23%
Haywood IH 118 3,815 3,256 85.35%
119 3,815 559 14.65%
Johnston PR04 10 1,929 413 21.41%
28 1,929 1,516 78.59%
PR27 26 7,226 585 8.10%
28 7,226 6,641 91.90%
District plan definition file: 'HBK-20.asc', modified 08/24/2017 11:02:00 PM
VTDs ('Voting Districts') derive from the Census Bureau's 2010 Redistricting Data Shapefiles. Population figures are based on the associated Summary File.
Page 1 of 3Printed 08/24/2017 {rptG05|dc2017HS|re1.3.1}
Case 1:15-cv-00399-TDS-JEP Document 184-38 Filed 09/07/17 Page 20 of 44
HBK-20 Speciale - Districts 82 and 83: Split VTD Detail
NC General Assembly
County VTD District Total VTD Pop VTD Pop in District Percent of VTD Pop in District
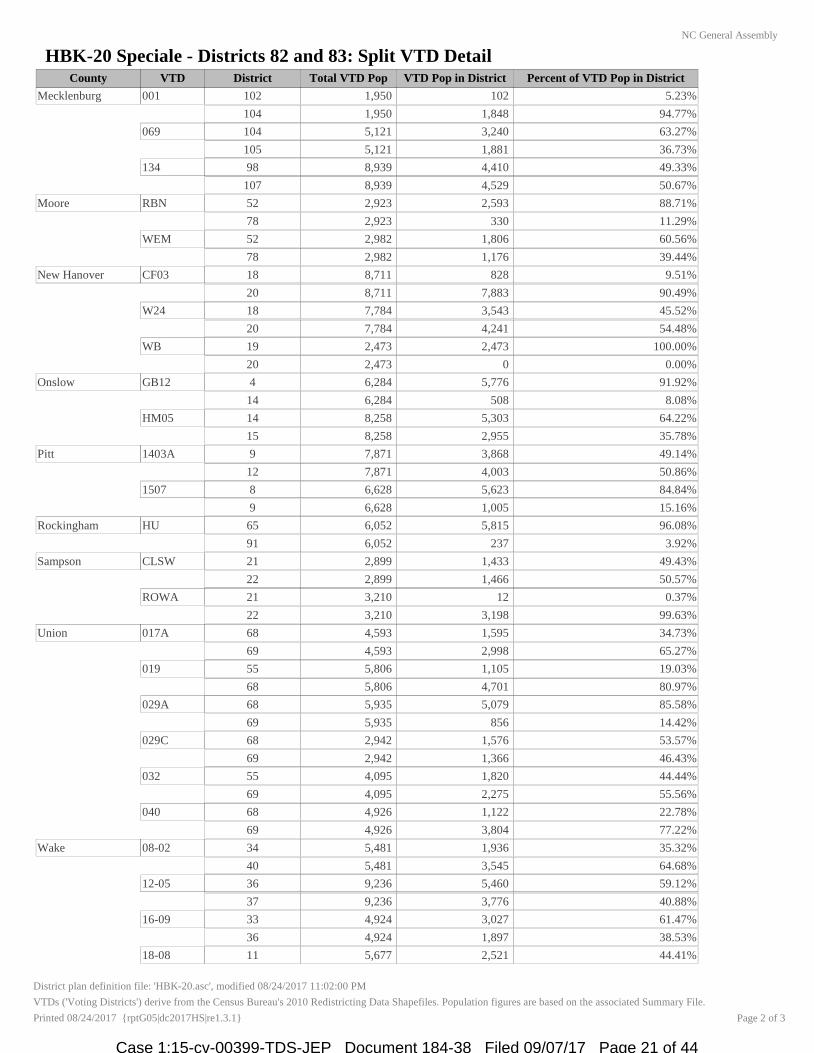
Mecklenburg 001 102 1,950 102 5.23%
104 1,950 1,848 94.77%
069 104 5,121 3,240 63.27%
105 5,121 1,881 36.73%
134 98 8,939 4,410 49.33%
107 8,939 4,529 50.67%
Moore RBN 52 2,923 2,593 88.71%
78 2,923 330 11.29%
WEM 52 2,982 1,806 60.56%
78 2,982 1,176 39.44%
New Hanover CF03 18 8,711 828 9.51%
20 8,711 7,883 90.49%
W24 18 7,784 3,543 45.52%
20 7,784 4,241 54.48%
WB 19 2,473 2,473 100.00%
20 2,473 0 0.00%
Onslow GB12 4 6,284 5,776 91.92%
14 6,284 508 8.08%
HM05 14 8,258 5,303 64.22%
15 8,258 2,955 35.78%
Pitt 1403A 9 7,871 3,868 49.14%
12 7,871 4,003 50.86%
1507 8 6,628 5,623 84.84%
9 6,628 1,005 15.16%
Rockingham HU 65 6,052 5,815 96.08%
91 6,052 237 3.92%
Sampson CLSW 21 2,899 1,433 49.43%
22 2,899 1,466 50.57%
ROWA 21 3,210 12 0.37%
22 3,210 3,198 99.63%
Union 017A 68 4,593 1,595 34.73%
69 4,593 2,998 65.27%
019 55 5,806 1,105 19.03%
68 5,806 4,701 80.97%
029A 68 5,935 5,079 85.58%
69 5,935 856 14.42%
029C 68 2,942 1,576 53.57%
69 2,942 1,366 46.43%
032 55 4,095 1,820 44.44%
69 4,095 2,275 55.56%
040 68 4,926 1,122 22.78%
69 4,926 3,804 77.22%
Wake 08-02 34 5,481 1,936 35.32%
40 5,481 3,545 64.68%
12-05 36 9,236 5,460 59.12%
37 9,236 3,776 40.88%
16-09 33 4,924 3,027 61.47%
36 4,924 1,897 38.53%
18-08 11 5,677 2,521 44.41%
District plan definition file: 'HBK-20.asc', modified 08/24/2017 11:02:00 PM
VTDs ('Voting Districts') derive from the Census Bureau's 2010 Redistricting Data Shapefiles. Population figures are based on the associated Summary File.
Page 2 of 3Printed 08/24/2017 {rptG05|dc2017HS|re1.3.1}
Case 1:15-cv-00399-TDS-JEP Document 184-38 Filed 09/07/17 Page 21 of 44
HBK-20 Speciale - Districts 82 and 83: Split VTD Detail
NC General Assembly
County VTD District Total VTD Pop VTD Pop in District Percent of VTD Pop in District
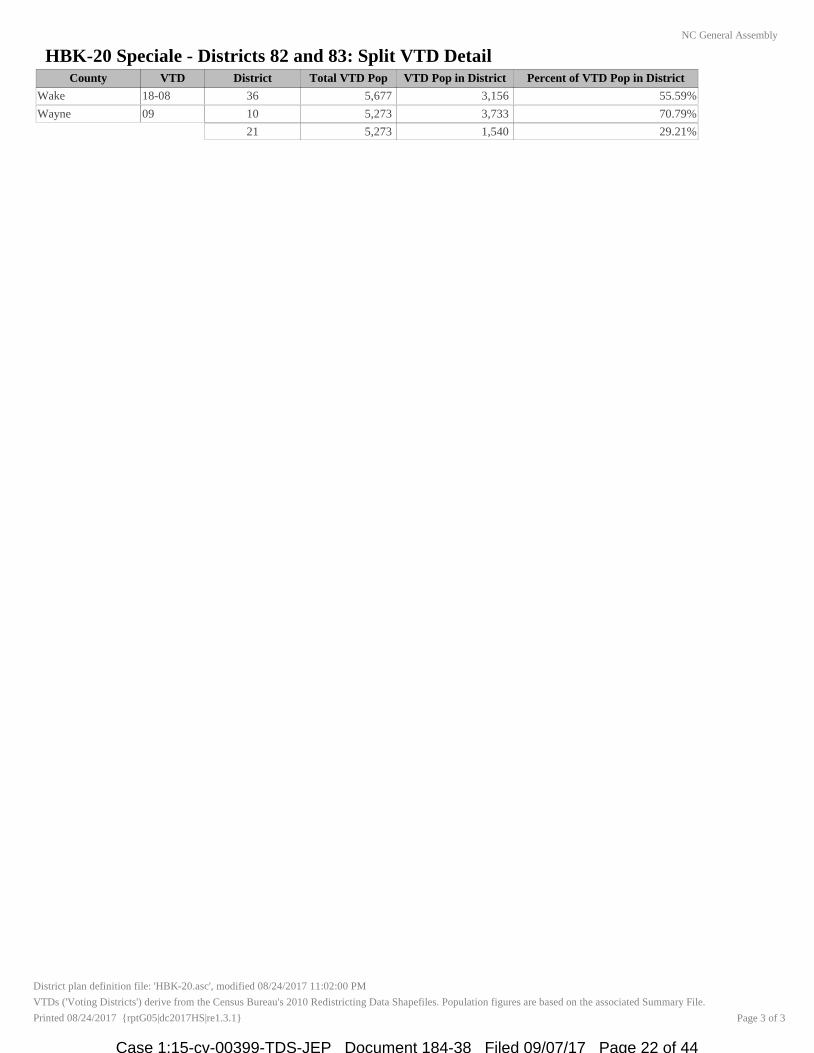
Wake 18-08 36 5,677 3,156 55.59%
Wayne 09 10 5,273 3,733 70.79%
21 5,273 1,540 29.21%
District plan definition file: 'HBK-20.asc', modified 08/24/2017 11:02:00 PM
VTDs ('Voting Districts') derive from the Census Bureau's 2010 Redistricting Data Shapefiles. Population figures are based on the associated Summary File.
Page 3 of 3Printed 08/24/2017 {rptG05|dc2017HS|re1.3.1}
Case 1:15-cv-00399-TDS-JEP Document 184-38 Filed 09/07/17 Page 22 of 44

HBK-20 Speciale - Districts 82 and 83: Population Deviation
NC General Assembly
District Ideal Pop Deviation Deviation %2010 Pop
1 79,462 -2,319 -2.92%77,143
2 79,462 3,172 3.99%82,634
3 79,462 -3,736 -4.70%75,726
4 79,462 2,443 3.07%81,905
5 79,462 -1,935 -2.44%77,527
6 79,462 -3,041 -3.83%76,421
7 79,462 -1,435 -1.81%78,027
8 79,462 -3,536 -4.45%75,926
9 79,462 -3,668 -4.62%75,794
10 79,462 3,972 5.00%83,434
11 79,462 2,077 2.61%81,539
12 79,462 -3,539 -4.45%75,923
13 79,462 -2,840 -3.57%76,622
14 79,462 -2,397 -3.02%77,065
15 79,462 -2,155 -2.71%77,307
16 79,462 1,963 2.47%81,425
17 79,462 -2,199 -2.77%77,263
18 79,462 -1,781 -2.24%77,681
19 79,462 -2,796 -3.52%76,666
20 79,462 -974 -1.23%78,488
21 79,462 3,972 5.00%83,434
22 79,462 3,972 5.00%83,434
23 79,462 1,595 2.01%81,057
24 79,462 1,772 2.23%81,234
25 79,462 -1,030 -1.30%78,432
26 79,462 3,969 4.99%83,431
27 79,462 -2,672 -3.36%76,790
28 79,462 3,970 5.00%83,432
29 79,462 3,273 4.12%82,735
30 79,462 3,810 4.79%83,272
31 79,462 3,311 4.17%82,773
32 79,462 3,678 4.63%83,140
33 79,462 3,180 4.00%82,642
34 79,462 2,063 2.60%81,525
35 79,462 2,400 3.02%81,862
36 79,462 2,464 3.10%81,926
37 79,462 870 1.09%80,332
38 79,462 3,632 4.57%83,094
39 79,462 2,719 3.42%82,181
40 79,462 1,450 1.82%80,912
41 79,462 2,897 3.65%82,359
42 79,462 1,977 2.49%81,439
43 79,462 -1,737 -2.19%77,725
44 79,462 1,511 1.90%80,973
45 79,462 -168 -0.21%79,294
46 79,462 978 1.23%80,440
47 79,462 3,156 3.97%82,618
48 79,462 3,647 4.59%83,109
49 79,462 3,159 3.98%82,621
50 79,462 1,404 1.77%80,866
51 79,462 3,972 5.00%83,434
52 79,462 -2,568 -3.23%76,894
53 79,462 3,967 4.99%83,429
54 79,462 2,850 3.59%82,312
55 79,462 -3,670 -4.62%75,792
56 79,462 -2,808 -3.53%76,654
57 79,462 3,293 4.14%82,755
58 79,462 2,675 3.37%82,137
59 79,462 445 0.56%79,907
60 79,462 2,394 3.01%81,856
61 79,462 1,557 1.96%81,019
62 79,462 1,270 1.60%80,732
63 79,462 -3,912 -4.92%75,550
64 79,462 -3,881 -4.88%75,581
65 79,462 3,968 4.99%83,430
66 79,462 3,392 4.27%82,854
67 79,462 3,299 4.15%82,761
68 79,462 -3,395 -4.27%76,067
69 79,462 -3,081 -3.88%76,381
70 79,462 -3,337 -4.20%76,125
71 79,462 -3,669 -4.62%75,793
72 79,462 -3,217 -4.05%76,245
73 79,462 -1,273 -1.60%78,189
74 79,462 -576 -0.72%78,886
75 79,462 501 0.63%79,963
76 79,462 2,446 3.08%81,908
77 79,462 3,456 4.35%82,918
78 79,462 -2,482 -3.12%76,980
79 79,462 -3,924 -4.94%75,538
80 79,462 2,060 2.59%81,522
81 79,462 1,894 2.38%81,356
82 79,462 1,417 1.78%80,879
District plan definition file: 'HBK-20.asc', modified 08/24/2017 11:02:00 PM
Data Source: 2010 Census Redistricting Data (Public Law 94-171) Summary File. Page 1 of 2
Printed 08/24/2017 {rptS01|dc2017HS|re1.3.1}
Case 1:15-cv-00399-TDS-JEP Document 184-38 Filed 09/07/17 Page 23 of 44
HBK-20 Speciale - Districts 82 and 83: Population Deviation
NC General Assembly
District Ideal Pop Deviation Deviation %2010 Pop
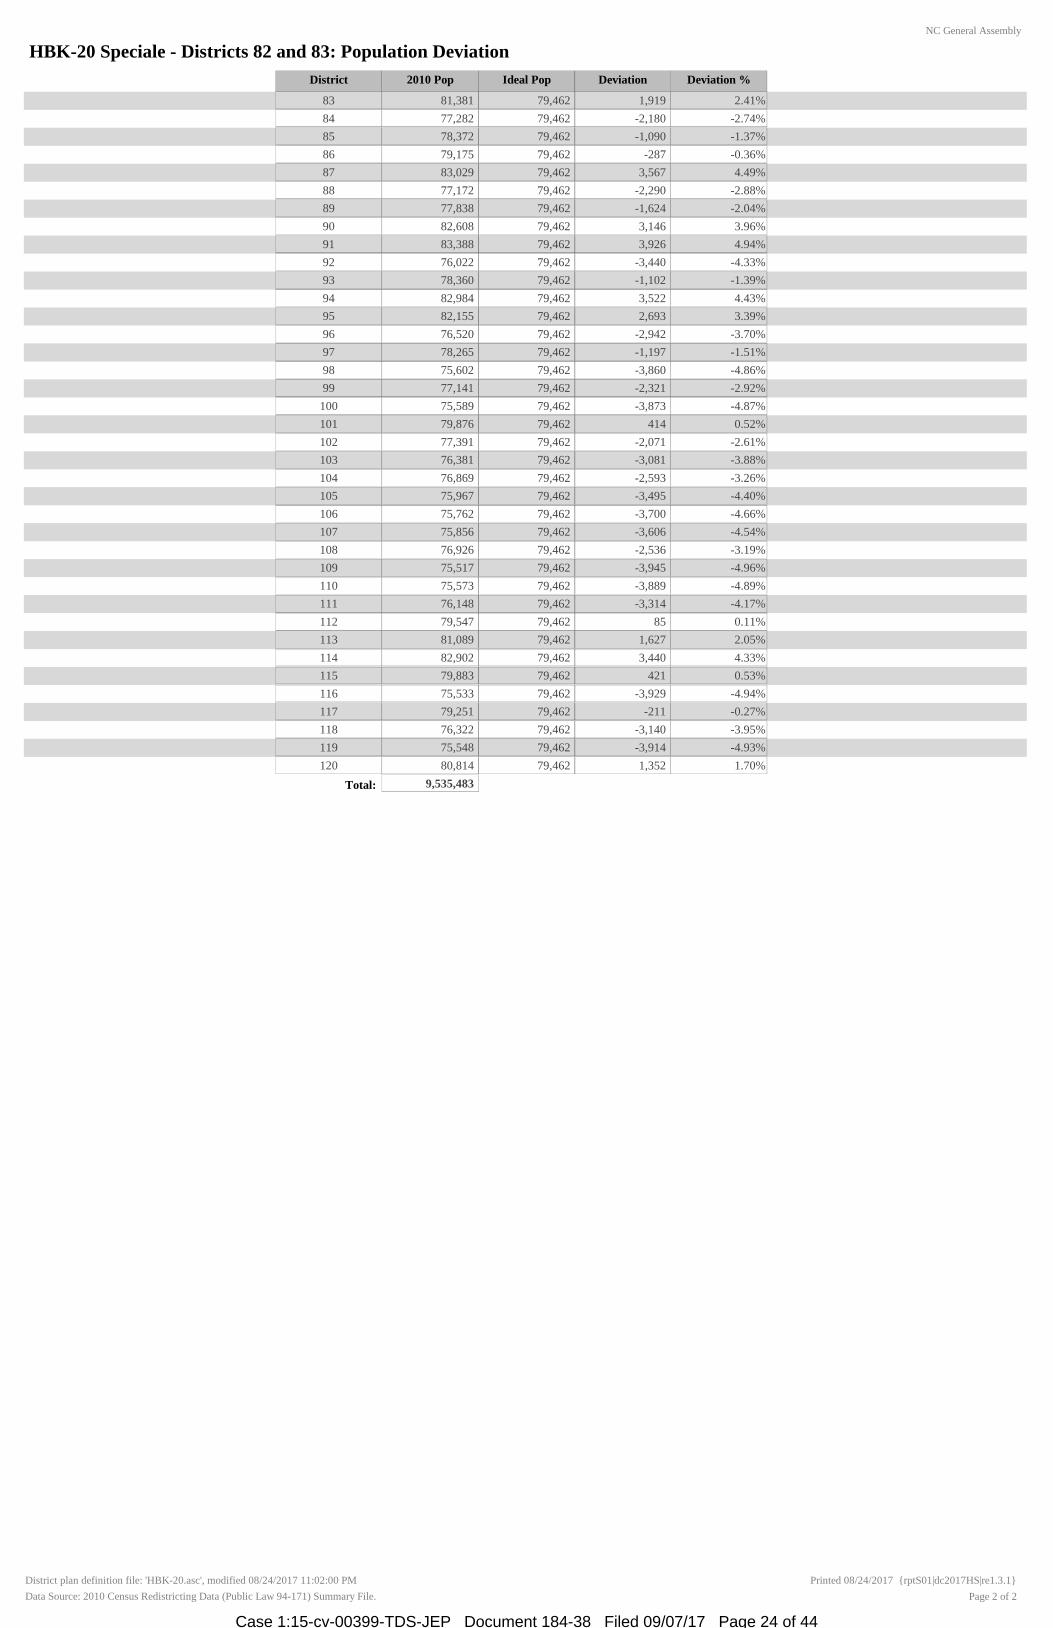
83 79,462 1,919 2.41%81,381
84 79,462 -2,180 -2.74%77,282
85 79,462 -1,090 -1.37%78,372
86 79,462 -287 -0.36%79,175
87 79,462 3,567 4.49%83,029
88 79,462 -2,290 -2.88%77,172
89 79,462 -1,624 -2.04%77,838
90 79,462 3,146 3.96%82,608
91 79,462 3,926 4.94%83,388
92 79,462 -3,440 -4.33%76,022
93 79,462 -1,102 -1.39%78,360
94 79,462 3,522 4.43%82,984
95 79,462 2,693 3.39%82,155
96 79,462 -2,942 -3.70%76,520
97 79,462 -1,197 -1.51%78,265
98 79,462 -3,860 -4.86%75,602
99 79,462 -2,321 -2.92%77,141
100 79,462 -3,873 -4.87%75,589
101 79,462 414 0.52%79,876
102 79,462 -2,071 -2.61%77,391
103 79,462 -3,081 -3.88%76,381
104 79,462 -2,593 -3.26%76,869
105 79,462 -3,495 -4.40%75,967
106 79,462 -3,700 -4.66%75,762
107 79,462 -3,606 -4.54%75,856
108 79,462 -2,536 -3.19%76,926
109 79,462 -3,945 -4.96%75,517
110 79,462 -3,889 -4.89%75,573
111 79,462 -3,314 -4.17%76,148
112 79,462 85 0.11%79,547
113 79,462 1,627 2.05%81,089
114 79,462 3,440 4.33%82,902
115 79,462 421 0.53%79,883
116 79,462 -3,929 -4.94%75,533
117 79,462 -211 -0.27%79,251
118 79,462 -3,140 -3.95%76,322
119 79,462 -3,914 -4.93%75,548
120 79,462 1,352 1.70%80,814
Total: 9,535,483
District plan definition file: 'HBK-20.asc', modified 08/24/2017 11:02:00 PM
Data Source: 2010 Census Redistricting Data (Public Law 94-171) Summary File. Page 2 of 2
Printed 08/24/2017 {rptS01|dc2017HS|re1.3.1}
Case 1:15-cv-00399-TDS-JEP Document 184-38 Filed 09/07/17 Page 24 of 44

HBK-20 Speciale - Districts 82 and 83: Population 2010, US Senate 2010, President 2012NC General Assembly
District Total Pop 18+ Pop Dem Dem % Rep Rep % Lib Lib % Write-In Write-In % Dem Dem % Rep Rep % Lib Lib % Write-In Write-In %
US President 2012: Obama-Romney-Johnson2010 Census US Senate 2010: Marshall-Burr-Beitler
1 77,143 60,226 11,572 46.71% 12,798 51.66% 398 1.61% 6 0.02% 19,188 51.49% 17,761 47.66% 255 0.68% 62 0.17%
2 82,634 64,057 9,138 42.84% 11,711 54.90% 479 2.25% 4 0.02% 16,284 44.54% 19,862 54.33% 322 0.88% 89 0.24%
3 75,726 57,749 6,926 34.46% 12,772 63.55% 390 1.94% 11 0.05% 13,877 41.67% 19,044 57.18% 308 0.92% 77 0.23%
4 81,905 60,243 6,889 39.27% 10,357 59.03% 292 1.66% 6 0.03% 11,345 38.94% 17,541 60.21% 200 0.69% 45 0.15%
5 77,527 60,228 10,791 55.68% 8,307 42.86% 273 1.41% 11 0.06% 20,871 60.75% 13,179 38.36% 249 0.72% 57 0.17%
6 76,421 60,608 8,872 34.50% 16,174 62.90% 661 2.57% 7 0.03% 14,765 38.52% 22,988 59.97% 532 1.39% 50 0.13%
7 78,027 59,741 12,874 49.23% 12,965 49.58% 303 1.16% 8 0.03% 21,791 53.51% 18,673 45.85% 191 0.47% 67 0.16%
8 75,926 58,873 10,135 61.68% 6,095 37.09% 195 1.19% 7 0.04% 22,626 66.47% 11,119 32.66% 254 0.75% 42 0.12%
9 75,794 59,235 7,527 37.19% 12,496 61.74% 210 1.04% 7 0.03% 15,362 42.01% 20,876 57.09% 280 0.77% 50 0.14%
10 83,434 62,414 6,595 29.90% 15,171 68.78% 287 1.30% 3 0.01% 11,116 32.12% 23,262 67.22% 212 0.61% 17 0.05%
11 81,539 64,508 11,704 51.72% 10,205 45.10% 709 3.13% 10 0.04% 24,808 59.62% 15,841 38.07% 856 2.06% 106 0.25%
12 75,923 57,405 10,406 46.00% 11,921 52.70% 282 1.25% 13 0.06% 17,724 49.08% 18,140 50.23% 210 0.58% 40 0.11%
13 76,622 61,839 7,638 28.48% 18,590 69.32% 538 2.01% 52 0.19% 12,458 31.09% 27,181 67.84% 359 0.90% 68 0.17%
14 77,065 56,588 4,167 33.67% 7,902 63.84% 301 2.43% 7 0.06% 9,736 39.75% 14,437 58.94% 253 1.03% 70 0.29%
15 77,307 59,638 3,006 31.19% 6,343 65.81% 284 2.95% 5 0.05% 6,424 34.97% 11,670 63.53% 225 1.22% 50 0.27%
16 81,425 62,717 10,108 39.84% 14,778 58.24% 474 1.87% 14 0.06% 16,124 42.93% 21,036 56.00% 314 0.84% 88 0.23%
17 77,263 64,270 9,560 31.61% 20,050 66.30% 624 2.06% 8 0.03% 15,595 36.15% 27,141 62.91% 333 0.77% 74 0.17%
18 77,681 61,478 11,041 55.09% 8,555 42.68% 437 2.18% 10 0.05% 22,442 61.89% 13,304 36.69% 413 1.14% 100 0.28%
19 76,666 60,681 8,459 32.87% 16,677 64.80% 587 2.28% 14 0.05% 16,301 40.73% 23,121 57.77% 483 1.21% 119 0.30%
20 78,488 63,095 9,000 33.59% 17,209 64.23% 570 2.13% 12 0.04% 16,368 39.38% 24,562 59.09% 499 1.20% 135 0.32%
21 83,434 63,200 11,191 53.12% 9,613 45.63% 259 1.23% 5 0.02% 20,596 59.23% 13,983 40.22% 185 0.53% 6 0.02%
22 83,434 62,843 11,515 44.95% 13,748 53.67% 346 1.35% 8 0.03% 15,691 44.36% 19,380 54.79% 245 0.69% 55 0.16%
23 81,057 61,743 14,653 59.95% 9,513 38.92% 269 1.10% 8 0.03% 24,825 62.80% 14,515 36.72% 147 0.37% 43 0.11%
24 81,234 61,182 13,631 51.47% 12,420 46.90% 428 1.62% 3 0.01% 20,875 53.38% 17,954 45.91% 242 0.62% 38 0.10%
25 78,432 58,921 9,576 42.69% 12,410 55.32% 440 1.96% 8 0.04% 15,958 44.13% 19,772 54.68% 331 0.92% 98 0.27%
26 83,431 58,878 8,065 33.32% 15,596 64.44% 530 2.19% 12 0.05% 15,201 37.28% 25,030 61.38% 437 1.07% 111 0.27%
27 76,790 59,572 13,603 61.65% 8,196 37.14% 261 1.18% 6 0.03% 24,188 66.17% 12,189 33.34% 143 0.39% 35 0.10%
28 83,432 61,508 6,953 31.99% 14,418 66.33% 359 1.65% 8 0.04% 11,855 34.49% 22,137 64.41% 297 0.86% 82 0.24%
29 82,735 67,058 18,865 79.26% 4,545 19.10% 373 1.57% 17 0.07% 38,148 82.20% 7,753 16.71% 435 0.94% 70 0.15%
30 83,272 64,089 17,881 60.80% 11,040 37.54% 478 1.63% 11 0.04% 31,862 67.06% 15,158 31.90% 424 0.89% 70 0.15%
31 82,773 61,422 16,672 78.56% 4,267 20.11% 275 1.30% 8 0.04% 33,340 80.93% 7,466 18.12% 349 0.85% 43 0.10%
32 83,140 63,471 15,476 60.71% 9,595 37.64% 411 1.61% 8 0.03% 26,033 65.34% 13,608 34.16% 154 0.39% 45 0.11%
33 82,642 66,254 13,483 69.46% 5,564 28.67% 351 1.81% 12 0.06% 27,937 72.34% 10,079 26.10% 543 1.41% 61 0.16%
34 81,525 64,976 15,394 50.33% 14,527 47.50% 642 2.10% 23 0.08% 27,560 56.56% 20,389 41.85% 680 1.40% 95 0.19%
35 81,862 57,121 9,236 37.21% 14,998 60.43% 565 2.28% 20 0.08% 19,055 42.91% 24,775 55.80% 480 1.08% 93 0.21%
36 81,926 59,799 10,864 35.93% 18,694 61.83% 668 2.21% 8 0.03% 19,655 41.26% 27,387 57.49% 537 1.13% 58 0.12%
37 80,332 54,852 8,827 36.88% 14,457 60.40% 639 2.67% 12 0.05% 19,102 43.33% 24,319 55.16% 587 1.33% 82 0.19%
38 83,094 59,601 14,163 70.94% 5,433 27.21% 354 1.77% 14 0.07% 29,904 76.88% 8,572 22.04% 358 0.92% 62 0.16%
39 82,181 58,177 14,627 64.63% 7,594 33.55% 402 1.78% 9 0.04% 28,601 69.83% 11,938 29.15% 347 0.85% 72 0.18%
40 80,912 59,480 12,203 36.45% 20,451 61.08% 811 2.42% 18 0.05% 21,540 42.12% 28,992 56.69% 547 1.07% 63 0.12%
41 82,359 55,518 9,441 44.16% 11,298 52.85% 636 2.98% 2 0.01% 22,252 52.85% 19,251 45.72% 541 1.28% 64 0.15%
42 81,439 57,374 8,476 69.63% 3,542 29.10% 150 1.23% 5 0.04% 18,934 73.86% 6,486 25.30% 161 0.63% 55 0.21%
43 77,725 59,350 11,403 65.17% 5,813 33.22% 270 1.54% 11 0.06% 23,644 72.26% 8,782 26.84% 225 0.69% 69 0.21%
44 80,973 59,789 8,858 46.26% 9,916 51.78% 366 1.91% 9 0.05% 17,939 53.66% 15,149 45.31% 292 0.87% 52 0.16%
45 79,294 57,377 7,955 39.32% 11,934 58.98% 335 1.66% 10 0.05% 15,275 42.60% 20,249 56.48% 249 0.69% 80 0.22%
46 80,440 59,587 6,977 43.94% 8,611 54.23% 284 1.79% 7 0.04% 12,303 45.76% 14,327 53.29% 203 0.76% 51 0.19%
47 82,618 60,831 8,315 57.29% 6,015 41.44% 173 1.19% 11 0.08% 17,243 63.29% 9,705 35.62% 221 0.81% 77 0.28%
48 83,109 59,851 9,247 55.26% 7,197 43.01% 281 1.68% 9 0.05% 18,291 58.54% 12,650 40.49% 258 0.83% 46 0.15%
49 82,621 66,094 13,382 49.54% 12,911 47.79% 710 2.63% 11 0.04% 26,848 56.30% 20,053 42.05% 695 1.46% 88 0.18%
50 80,866 62,232 15,177 53.97% 12,277 43.66% 657 2.34% 11 0.04% 24,313 55.84% 18,630 42.79% 471 1.08% 123 0.28%
51 83,434 59,547 7,714 41.44% 10,529 56.56% 364 1.96% 8 0.04% 14,314 44.67% 17,331 54.08% 328 1.02% 72 0.22%
52 76,894 60,407 8,130 31.91% 16,852 66.14% 491 1.93% 7 0.03% 14,828 36.08% 25,925 63.08% 289 0.70% 58 0.14%
53 83,429 62,151 8,067 38.56% 12,447 59.50% 400 1.91% 6 0.03% 13,061 39.03% 20,001 59.78% 325 0.97% 73 0.22%
District plan definition file: 'HBK-20.asc', modified 08/24/2017 11:02:00 PM
Populations values derive from the 2010 Census Redistricting Data (Public Law 94-171) Summary File. Election results were provided by the NC State Board of Elections. Votes that could not be associated with a specific precinct were excluded. Reported statewide totals may therefore be marginally lower than official contest results.
Printed 08/24/2017 {rptS02|dc2017HS|re1.3.1} Page 1 of 3
Case 1:15-cv-00399-TDS-JEP Document 184-38 Filed 09/07/17 Page 25 of 44

HBK-20 Speciale - Districts 82 and 83: Population 2010, US Senate 2010, President 2012NC General Assembly
District Total Pop 18+ Pop Dem Dem % Rep Rep % Lib Lib % Write-In Write-In % Dem Dem % Rep Rep % Lib Lib % Write-In Write-In %
US President 2012: Obama-Romney-Johnson2010 Census US Senate 2010: Marshall-Burr-Beitler
54 82,312 64,361 16,920 53.96% 13,730 43.79% 695 2.22% 10 0.03% 26,235 55.99% 20,057 42.81% 473 1.01% 89 0.19%
55 75,792 57,260 7,418 36.90% 12,345 61.41% 326 1.62% 12 0.06% 13,756 39.49% 20,716 59.48% 275 0.79% 84 0.24%
56 76,654 62,430 19,313 77.49% 5,073 20.35% 522 2.09% 15 0.06% 34,936 78.94% 8,503 19.21% 669 1.51% 151 0.34%
57 82,755 64,200 14,697 81.20% 3,148 17.39% 243 1.34% 11 0.06% 36,447 86.99% 5,069 12.10% 296 0.71% 84 0.20%
58 82,137 62,753 12,047 63.92% 6,487 34.42% 288 1.53% 25 0.13% 27,946 73.09% 9,912 25.92% 286 0.75% 93 0.24%
59 79,907 61,233 9,808 38.24% 15,356 59.87% 480 1.87% 7 0.03% 18,869 42.66% 24,892 56.27% 368 0.83% 106 0.24%
60 81,856 61,808 9,568 57.73% 6,682 40.31% 309 1.86% 16 0.10% 23,485 67.53% 10,974 31.55% 253 0.73% 67 0.19%
61 81,019 63,506 9,721 33.66% 18,550 64.22% 586 2.03% 27 0.09% 19,567 41.33% 27,191 57.44% 446 0.94% 136 0.29%
62 80,732 60,423 9,300 34.11% 17,363 63.68% 595 2.18% 10 0.04% 19,556 41.92% 26,542 56.89% 449 0.96% 107 0.23%
63 75,550 57,278 8,482 38.39% 13,031 58.99% 571 2.58% 8 0.04% 15,509 43.71% 19,573 55.17% 330 0.93% 68 0.19%
64 75,581 58,410 6,964 35.86% 11,981 61.69% 458 2.36% 17 0.09% 13,366 41.39% 18,597 57.58% 267 0.83% 66 0.20%
65 83,430 64,719 7,496 33.32% 14,282 63.48% 706 3.14% 16 0.07% 14,675 39.12% 22,455 59.86% 299 0.80% 84 0.22%
66 82,854 63,058 10,560 46.75% 11,582 51.28% 433 1.92% 11 0.05% 15,910 45.99% 18,384 53.14% 277 0.80% 25 0.07%
67 82,761 62,838 6,873 26.66% 18,400 71.36% 501 1.94% 10 0.04% 11,407 28.39% 28,298 70.44% 422 1.05% 48 0.12%
68 76,067 49,871 5,344 28.78% 12,791 68.88% 426 2.29% 9 0.05% 13,160 35.92% 23,097 63.04% 316 0.86% 66 0.18%
69 76,381 54,263 5,446 30.22% 12,148 67.40% 419 2.32% 11 0.06% 12,576 36.44% 21,460 62.18% 368 1.07% 110 0.32%
70 76,125 57,325 3,558 21.14% 12,749 75.74% 513 3.05% 13 0.08% 8,189 25.84% 23,113 72.94% 343 1.08% 44 0.14%
71 75,793 57,481 9,798 58.11% 6,782 40.22% 275 1.63% 7 0.04% 23,956 69.74% 10,090 29.38% 302 0.88% 0 0.00%
72 76,245 58,071 11,678 66.54% 5,620 32.02% 248 1.41% 5 0.03% 27,128 76.55% 8,076 22.79% 235 0.66% 0 0.00%
73 78,189 59,318 6,106 25.80% 17,032 71.95% 529 2.23% 4 0.02% 12,278 32.31% 25,229 66.40% 441 1.16% 47 0.12%
74 78,886 59,414 7,130 32.40% 14,427 65.57% 435 1.98% 11 0.05% 16,022 40.59% 23,039 58.37% 407 1.03% 0 0.00%
75 79,963 60,453 8,675 32.94% 17,137 65.07% 516 1.96% 8 0.03% 16,896 39.09% 25,912 59.95% 415 0.96% 0 0.00%
76 81,908 62,585 7,822 37.03% 12,787 60.53% 502 2.38% 13 0.06% 15,191 41.45% 20,960 57.20% 360 0.98% 135 0.37%
77 82,918 63,076 6,663 26.24% 18,105 71.29% 617 2.43% 11 0.04% 11,587 28.89% 28,014 69.84% 394 0.98% 117 0.29%
78 76,980 58,404 4,029 21.41% 14,213 75.51% 567 3.01% 13 0.07% 8,233 24.08% 25,560 74.77% 335 0.98% 58 0.17%
79 75,538 58,785 8,646 35.68% 15,108 62.35% 466 1.92% 12 0.05% 14,321 39.25% 21,861 59.92% 236 0.65% 66 0.18%
80 81,522 61,819 4,779 23.10% 15,452 74.68% 458 2.21% 3 0.01% 9,557 26.44% 26,120 72.27% 383 1.06% 81 0.22%
81 81,356 62,187 6,468 30.99% 13,884 66.51% 508 2.43% 14 0.07% 11,067 31.81% 23,263 66.86% 393 1.13% 71 0.20%
82 80,879 57,548 7,263 32.63% 14,500 65.15% 493 2.22% 0 0.00% 15,936 39.26% 24,220 59.67% 433 1.07% 0 0.00%
83 81,381 60,263 7,027 36.70% 11,669 60.95% 445 2.32% 4 0.02% 14,210 42.62% 18,702 56.10% 398 1.19% 29 0.09%
84 77,282 58,924 7,244 32.03% 14,736 65.16% 617 2.73% 18 0.08% 12,673 34.35% 23,733 64.33% 356 0.96% 131 0.36%
85 78,372 62,493 6,014 26.73% 15,873 70.54% 595 2.64% 20 0.09% 9,740 29.02% 23,328 69.50% 389 1.16% 110 0.33%
86 79,175 61,639 7,764 37.95% 12,242 59.83% 450 2.20% 5 0.02% 12,429 38.01% 19,756 60.42% 393 1.20% 119 0.36%
87 83,029 64,243 6,908 31.41% 14,382 65.39% 690 3.14% 15 0.07% 10,898 31.49% 23,229 67.12% 479 1.38% 0 0.00%
88 77,172 58,012 8,592 56.26% 6,372 41.72% 302 1.98% 7 0.05% 21,244 64.97% 11,011 33.68% 342 1.05% 100 0.31%
89 77,838 59,483 6,177 29.81% 13,998 67.55% 532 2.57% 15 0.07% 11,364 32.70% 22,869 65.82% 392 1.13% 122 0.35%
90 82,608 63,899 7,033 31.36% 14,822 66.09% 566 2.52% 6 0.03% 9,925 29.88% 22,762 68.53% 413 1.24% 114 0.34%
91 83,388 64,721 6,313 26.71% 16,743 70.84% 572 2.42% 8 0.03% 10,619 28.87% 25,609 69.62% 456 1.24% 99 0.27%
92 76,022 57,630 10,228 65.20% 5,122 32.65% 325 2.07% 12 0.08% 24,610 71.63% 9,328 27.15% 337 0.98% 84 0.24%
93 78,360 65,985 10,383 39.34% 15,262 57.83% 729 2.76% 18 0.07% 17,118 42.54% 22,103 54.93% 803 2.00% 213 0.53%
94 82,984 64,320 7,877 30.80% 16,981 66.40% 704 2.75% 12 0.05% 10,504 28.63% 25,562 69.68% 499 1.36% 120 0.33%
95 82,155 59,928 5,680 27.90% 14,174 69.63% 496 2.44% 6 0.03% 13,403 33.96% 25,566 64.77% 391 0.99% 112 0.28%
96 76,520 58,080 6,470 31.28% 13,705 66.27% 495 2.39% 11 0.05% 12,700 36.45% 21,665 62.18% 378 1.08% 102 0.29%
97 78,265 59,784 6,958 30.01% 15,653 67.51% 564 2.43% 11 0.05% 11,021 29.97% 25,266 68.71% 369 1.00% 115 0.31%
98 75,602 56,018 6,849 32.00% 14,098 65.88% 445 2.08% 8 0.04% 16,276 39.21% 24,750 59.62% 402 0.97% 83 0.20%
99 77,141 55,130 12,757 73.89% 4,259 24.67% 232 1.34% 16 0.09% 26,889 79.03% 6,836 20.09% 215 0.63% 83 0.24%
100 75,589 56,173 9,157 57.35% 6,485 40.62% 314 1.97% 10 0.06% 21,275 67.14% 10,017 31.61% 329 1.04% 67 0.21%
101 79,876 58,931 12,051 68.58% 5,219 29.70% 291 1.66% 11 0.06% 28,250 74.39% 9,386 24.72% 257 0.68% 82 0.22%
102 77,391 59,231 10,729 74.35% 3,424 23.73% 269 1.86% 8 0.06% 25,970 80.44% 5,905 18.29% 324 1.00% 84 0.26%
103 76,381 56,360 7,849 32.02% 16,157 65.92% 488 1.99% 16 0.07% 16,067 38.44% 25,182 60.25% 416 1.00% 132 0.32%
104 76,869 59,384 9,634 33.26% 18,842 65.05% 476 1.64% 13 0.04% 18,349 39.25% 27,916 59.71% 393 0.84% 95 0.20%
105 75,967 56,011 7,111 32.05% 14,618 65.88% 454 2.05% 5 0.02% 16,507 40.61% 23,709 58.33% 356 0.88% 73 0.18%
106 75,762 57,932 9,986 67.03% 4,694 31.51% 214 1.44% 3 0.02% 23,892 73.26% 8,334 25.55% 299 0.92% 89 0.27%
District plan definition file: 'HBK-20.asc', modified 08/24/2017 11:02:00 PM
Populations values derive from the 2010 Census Redistricting Data (Public Law 94-171) Summary File. Election results were provided by the NC State Board of Elections. Votes that could not be associated with a specific precinct were excluded. Reported statewide totals may therefore be marginally lower than official contest results.
Printed 08/24/2017 {rptS02|dc2017HS|re1.3.1} Page 2 of 3
Case 1:15-cv-00399-TDS-JEP Document 184-38 Filed 09/07/17 Page 26 of 44
HBK-20 Speciale - Districts 82 and 83: Population 2010, US Senate 2010, President 2012NC General Assembly
District Total Pop 18+ Pop Dem Dem % Rep Rep % Lib Lib % Write-In Write-In % Dem Dem % Rep Rep % Lib Lib % Write-In Write-In %
US President 2012: Obama-Romney-Johnson2010 Census US Senate 2010: Marshall-Burr-Beitler
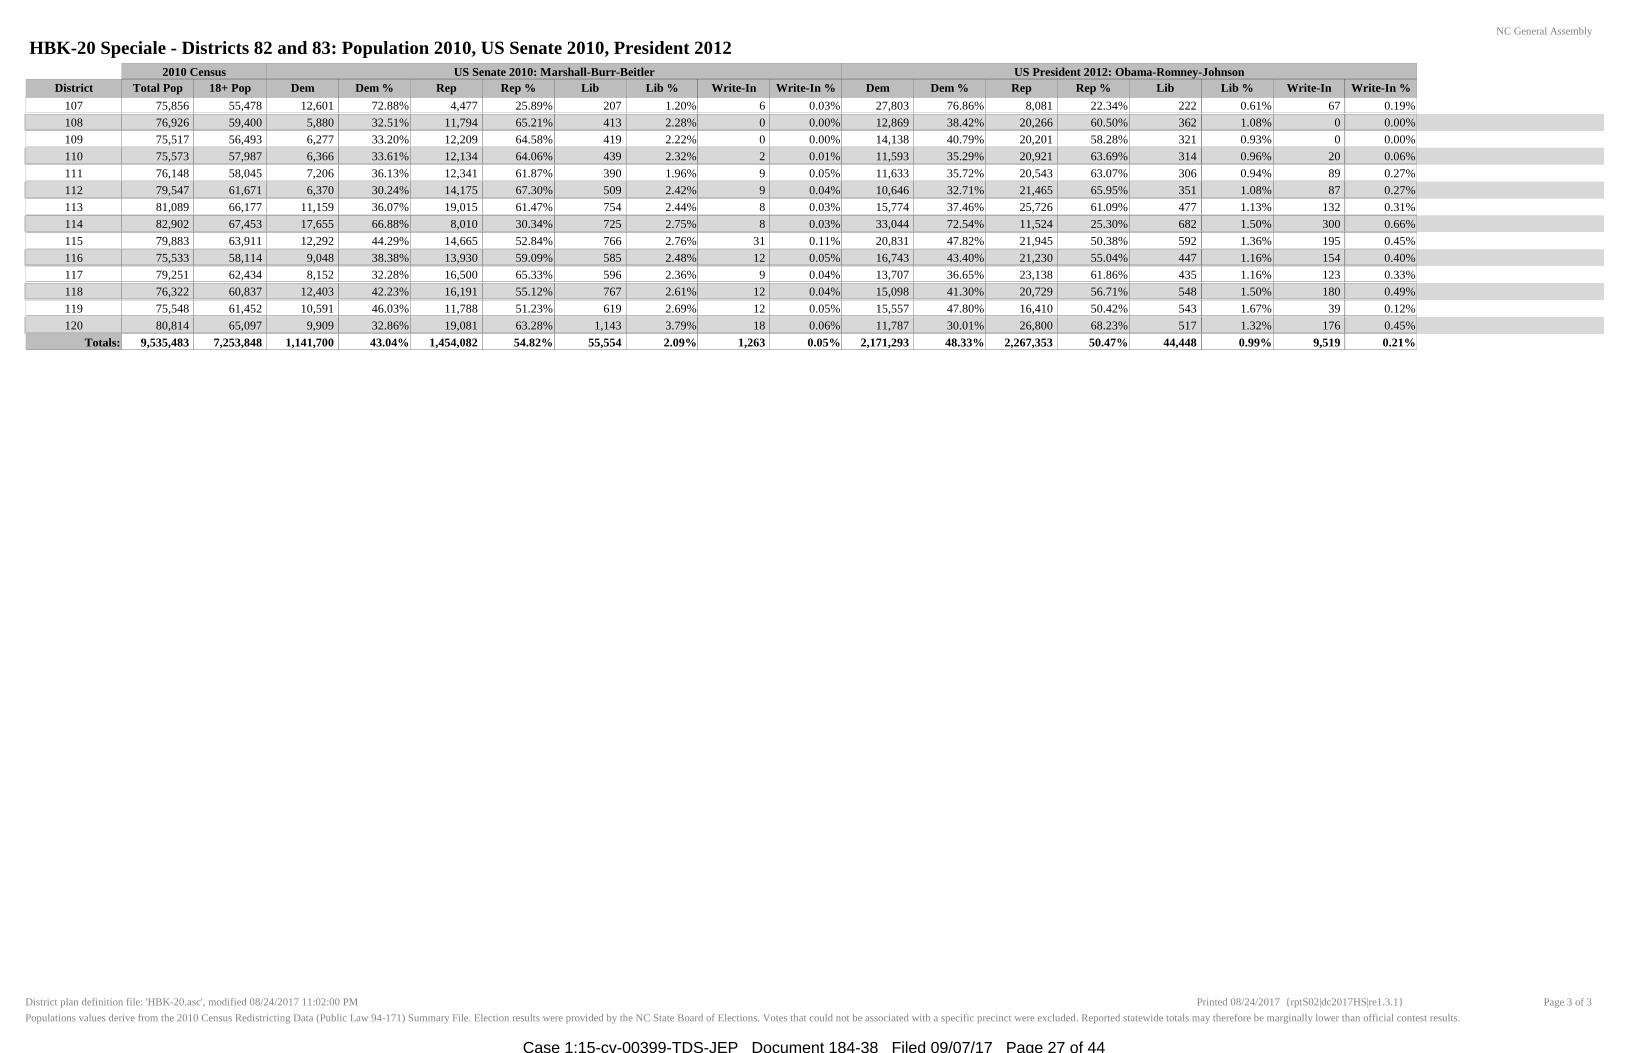
107 75,856 55,478 12,601 72.88% 4,477 25.89% 207 1.20% 6 0.03% 27,803 76.86% 8,081 22.34% 222 0.61% 67 0.19%
108 76,926 59,400 5,880 32.51% 11,794 65.21% 413 2.28% 0 0.00% 12,869 38.42% 20,266 60.50% 362 1.08% 0 0.00%
109 75,517 56,493 6,277 33.20% 12,209 64.58% 419 2.22% 0 0.00% 14,138 40.79% 20,201 58.28% 321 0.93% 0 0.00%
110 75,573 57,987 6,366 33.61% 12,134 64.06% 439 2.32% 2 0.01% 11,593 35.29% 20,921 63.69% 314 0.96% 20 0.06%
111 76,148 58,045 7,206 36.13% 12,341 61.87% 390 1.96% 9 0.05% 11,633 35.72% 20,543 63.07% 306 0.94% 89 0.27%
112 79,547 61,671 6,370 30.24% 14,175 67.30% 509 2.42% 9 0.04% 10,646 32.71% 21,465 65.95% 351 1.08% 87 0.27%
113 81,089 66,177 11,159 36.07% 19,015 61.47% 754 2.44% 8 0.03% 15,774 37.46% 25,726 61.09% 477 1.13% 132 0.31%
114 82,902 67,453 17,655 66.88% 8,010 30.34% 725 2.75% 8 0.03% 33,044 72.54% 11,524 25.30% 682 1.50% 300 0.66%
115 79,883 63,911 12,292 44.29% 14,665 52.84% 766 2.76% 31 0.11% 20,831 47.82% 21,945 50.38% 592 1.36% 195 0.45%
116 75,533 58,114 9,048 38.38% 13,930 59.09% 585 2.48% 12 0.05% 16,743 43.40% 21,230 55.04% 447 1.16% 154 0.40%
117 79,251 62,434 8,152 32.28% 16,500 65.33% 596 2.36% 9 0.04% 13,707 36.65% 23,138 61.86% 435 1.16% 123 0.33%
118 76,322 60,837 12,403 42.23% 16,191 55.12% 767 2.61% 12 0.04% 15,098 41.30% 20,729 56.71% 548 1.50% 180 0.49%
119 75,548 61,452 10,591 46.03% 11,788 51.23% 619 2.69% 12 0.05% 15,557 47.80% 16,410 50.42% 543 1.67% 39 0.12%
120 80,814 65,097 9,909 32.86% 19,081 63.28% 1,143 3.79% 18 0.06% 11,787 30.01% 26,800 68.23% 517 1.32% 176 0.45%
9,535,483 7,253,848 1,141,700 1,454,082 55,554 1,263 2,171,293 2,267,353 44,448 9,519Totals: 43.04% 54.82% 2.09% 0.05% 48.33% 50.47% 0.99% 0.21%
District plan definition file: 'HBK-20.asc', modified 08/24/2017 11:02:00 PM
Populations values derive from the 2010 Census Redistricting Data (Public Law 94-171) Summary File. Election results were provided by the NC State Board of Elections. Votes that could not be associated with a specific precinct were excluded. Reported statewide totals may therefore be marginally lower than official contest results.
Printed 08/24/2017 {rptS02|dc2017HS|re1.3.1} Page 3 of 3
Case 1:15-cv-00399-TDS-JEP Document 184-38 Filed 09/07/17 Page 27 of 44

HBK-20 Speciale - Districts 82 and 83: Governor 2012, Lieutenant Governor 2012, US Senate 2014NC General Assembly
District Dem Dem % Rep Rep % Lib Lib % Write-InWrite-In % Dem Dem % Rep Rep % Rep Rep % Dem Dem % Lib Lib % Write-In Pct_EL14G_USS_WI
Governor 2012: Dalton-McCrory-Howe Lieutenant Governor 2012: Coleman-Forest US Senate 2014: Tillis-Hagan-Haugh
Write-In %Write-In %
1 19,104 52.09% 16,908 46.10% 653 1.78% 80.02% 20,570 57.32% 15,314 42.68% 11,858 47.79% 12,208 49.20% 729 2.94% 17 0.07%0.07%0.02%
2 14,964 41.36% 20,485 56.62% 721 1.99% 110.03% 16,970 48.44% 18,065 51.56% 12,193 52.00% 10,289 43.88% 921 3.93% 44 0.19%0.19%0.03%
3 12,556 38.05% 19,773 59.92% 658 1.99% 120.04% 14,086 43.44% 18,342 56.56% 12,612 56.92% 8,699 39.26% 804 3.63% 43 0.19%0.19%0.04%
4 11,015 38.19% 17,336 60.11% 481 1.67% 90.03% 12,235 43.31% 16,012 56.69% 10,607 58.61% 6,770 37.41% 701 3.87% 20 0.11%0.11%0.03%
5 20,700 61.40% 12,290 36.45% 721 2.14% 30.01% 21,685 65.17% 11,591 34.83% 7,987 40.13% 11,521 57.88% 382 1.92% 15 0.08%0.08%0.01%
6 13,800 36.70% 22,340 59.41% 1,446 3.85% 140.04% 15,559 42.25% 21,269 57.75% 16,135 58.33% 10,543 38.11% 962 3.48% 22 0.08%0.08%0.04%
7 21,049 51.78% 19,219 47.28% 375 0.92% 50.01% 22,227 55.32% 17,950 44.68% 13,321 46.35% 14,633 50.91% 764 2.66% 25 0.09%0.09%0.01%
8 21,272 62.86% 11,935 35.27% 624 1.84% 70.02% 22,701 68.07% 10,649 31.93% 6,095 33.50% 11,528 63.36% 540 2.97% 32 0.18%0.18%0.02%
9 13,954 38.44% 21,716 59.83% 624 1.72% 40.01% 15,785 44.22% 19,914 55.78% 12,511 56.57% 8,912 40.30% 654 2.96% 38 0.17%0.17%0.01%
10 10,584 30.70% 23,479 68.10% 406 1.18% 60.02% 11,878 35.06% 21,998 64.94% 15,412 64.62% 7,489 31.40% 918 3.85% 30 0.13%0.13%0.02%
11 21,518 52.40% 17,791 43.33% 1,743 4.24% 110.03% 24,145 60.33% 15,877 39.67% 9,402 36.09% 15,557 59.72% 1,039 3.99% 54 0.21%0.21%0.03%
12 17,079 47.65% 18,313 51.09% 441 1.23% 120.03% 18,554 52.55% 16,752 47.45% 11,373 48.26% 11,355 48.19% 820 3.48% 17 0.07%0.07%0.03%
13 11,186 27.90% 28,180 70.30% 711 1.77% 100.02% 13,096 33.28% 26,250 66.72% 18,332 63.57% 9,180 31.83% 1,201 4.16% 126 0.44%0.44%0.02%
14 8,602 35.58% 14,927 61.74% 643 2.66% 50.02% 10,111 42.64% 13,602 57.36% 8,982 59.61% 5,359 35.57% 704 4.67% 22 0.15%0.15%0.02%
15 5,745 31.82% 11,786 65.27% 520 2.88% 50.03% 6,792 38.70% 10,759 61.30% 7,085 63.75% 3,460 31.13% 548 4.93% 20 0.18%0.18%0.03%
16 15,315 41.05% 21,295 57.08% 692 1.85% 60.02% 17,254 47.21% 19,293 52.79% 12,611 51.55% 10,386 42.45% 1,421 5.81% 48 0.20%0.20%0.02%
17 13,028 30.49% 28,818 67.45% 874 2.05% 40.01% 16,102 38.50% 25,725 61.50% 18,597 58.14% 11,618 36.32% 1,730 5.41% 39 0.12%0.12%0.01%
18 19,993 56.18% 14,447 40.60% 1,136 3.19% 120.03% 21,986 63.19% 12,809 36.81% 6,879 33.33% 12,754 61.79% 968 4.69% 39 0.19%0.19%0.03%
19 13,581 34.41% 24,684 62.54% 1,193 3.02% 100.03% 16,131 42.05% 22,234 57.95% 14,029 52.05% 11,412 42.34% 1,465 5.44% 48 0.18%0.18%0.03%
20 13,683 33.44% 26,066 63.71% 1,152 2.82% 120.03% 16,044 40.45% 23,624 59.55% 14,896 53.87% 11,396 41.22% 1,311 4.74% 47 0.17%0.17%0.03%
21 19,745 56.96% 14,454 41.70% 452 1.30% 110.03% 20,965 61.42% 13,169 38.58% 8,748 40.67% 12,105 56.28% 628 2.92% 27 0.13%0.13%0.03%
22 15,582 44.23% 19,229 54.58% 416 1.18% 50.01% 17,375 50.23% 17,215 49.77% 12,626 51.58% 10,662 43.56% 1,142 4.67% 49 0.20%0.20%0.01%
23 24,490 62.22% 14,521 36.89% 350 0.89% 10.00% 25,919 66.94% 12,801 33.06% 8,825 34.89% 15,731 62.19% 722 2.85% 17 0.07%0.07%0.00%
24 20,058 51.71% 18,288 47.15% 436 1.12% 80.02% 21,144 55.44% 16,994 44.56% 11,750 45.62% 13,325 51.74% 657 2.55% 24 0.09%0.09%0.02%
25 14,682 40.75% 20,622 57.24% 713 1.98% 130.04% 16,471 46.60% 18,875 53.40% 13,313 52.56% 10,823 42.73% 1,140 4.50% 53 0.21%0.21%0.04%
26 13,500 33.28% 26,142 64.45% 911 2.25% 100.02% 15,454 38.85% 24,322 61.15% 15,810 59.12% 9,838 36.79% 1,051 3.93% 41 0.15%0.15%0.02%
27 23,878 65.27% 12,369 33.81% 331 0.90% 40.01% 25,041 69.33% 11,076 30.67% 8,198 34.09% 15,190 63.16% 647 2.69% 16 0.07%0.07%0.01%
28 10,992 32.01% 22,789 66.37% 543 1.58% 100.03% 12,762 37.94% 20,879 62.06% 13,798 62.33% 7,356 33.23% 928 4.19% 56 0.25%0.25%0.03%
29 35,463 77.32% 9,134 19.92% 1,242 2.71% 250.05% 37,229 82.66% 7,812 17.34% 4,020 14.49% 23,189 83.60% 503 1.81% 27 0.10%0.10%0.05%
30 29,080 61.95% 16,637 35.44% 1,215 2.59% 110.02% 31,249 67.84% 14,812 32.16% 9,863 30.23% 21,982 67.37% 753 2.31% 30 0.09%0.09%0.02%
31 31,088 76.24% 8,713 21.37% 943 2.31% 300.07% 32,663 81.05% 7,639 18.95% 4,068 16.31% 20,384 81.72% 452 1.81% 39 0.16%0.16%0.07%
32 24,908 63.00% 14,186 35.88% 438 1.11% 40.01% 26,603 68.44% 12,266 31.56% 8,903 33.82% 16,633 63.19% 755 2.87% 32 0.12%0.12%0.01%
33 25,445 66.50% 11,674 30.51% 1,141 2.98% 40.01% 27,554 73.40% 9,985 26.60% 5,471 23.58% 16,926 72.94% 767 3.31% 41 0.18%0.18%0.01%
34 24,282 50.25% 22,640 46.85% 1,397 2.89% 80.02% 27,111 57.30% 20,200 42.70% 13,177 38.96% 19,618 58.00% 973 2.88% 57 0.17%0.17%0.02%
35 16,375 37.09% 26,734 60.55% 1,029 2.33% 150.03% 18,534 42.76% 24,815 57.24% 16,257 53.08% 13,398 43.74% 913 2.98% 61 0.20%0.20%0.03%
36 16,512 34.84% 29,686 62.64% 1,187 2.50% 80.02% 19,356 41.76% 26,991 58.24% 18,484 54.29% 14,562 42.77% 934 2.74% 67 0.20%0.20%0.02%
37 16,190 36.99% 26,307 60.10% 1,263 2.89% 140.03% 18,508 43.32% 24,216 56.68% 16,228 53.28% 13,138 43.13% 1,025 3.37% 68 0.22%0.22%0.03%
38 27,623 71.36% 10,131 26.17% 944 2.44% 110.03% 29,459 77.11% 8,745 22.89% 5,219 22.03% 17,826 75.24% 611 2.58% 37 0.16%0.16%0.03%
39 26,440 64.76% 13,558 33.21% 822 2.01% 90.02% 28,552 70.78% 11,785 29.22% 7,175 27.51% 18,189 69.74% 680 2.61% 38 0.15%0.15%0.02%
40 17,767 35.02% 31,793 62.66% 1,159 2.28% 160.03% 20,489 41.22% 29,213 58.78% 20,170 53.02% 16,914 44.46% 905 2.38% 50 0.13%0.13%0.03%
41 18,631 44.80% 21,697 52.18% 1,245 2.99% 120.03% 21,117 52.18% 19,353 47.82% 12,130 43.17% 15,093 53.71% 826 2.94% 52 0.19%0.19%0.03%
42 17,657 70.31% 6,879 27.39% 570 2.27% 70.03% 18,581 74.83% 6,251 25.17% 3,360 24.76% 9,838 72.50% 356 2.62% 15 0.11%0.11%0.03%
43 22,155 68.80% 9,319 28.94% 716 2.22% 130.04% 23,447 73.52% 8,447 26.48% 5,177 28.30% 12,578 68.77% 504 2.76% 32 0.17%0.17%0.04%
44 16,575 50.29% 15,604 47.34% 777 2.36% 40.01% 18,236 56.47% 14,058 43.53% 9,371 46.34% 10,098 49.94% 724 3.58% 28 0.14%0.14%0.01%
45 14,293 40.30% 20,508 57.83% 654 1.84% 100.03% 16,061 46.10% 18,779 53.90% 12,902 55.12% 9,613 41.07% 862 3.68% 28 0.12%0.12%0.03%
46 13,148 49.59% 12,865 48.52% 494 1.86% 90.03% 14,692 56.79% 11,178 43.21% 8,263 51.41% 6,912 43.00% 864 5.38% 34 0.21%0.21%0.03%
47 17,474 65.03% 8,923 33.21% 463 1.72% 100.04% 19,029 72.21% 7,325 27.79% 6,020 38.81% 8,990 57.95% 483 3.11% 20 0.13%0.13%0.04%
48 17,506 57.00% 12,512 40.74% 683 2.22% 110.04% 18,833 62.60% 11,253 37.40% 8,168 39.86% 11,599 56.60% 702 3.43% 25 0.12%0.12%0.04%
49 23,039 48.85% 22,573 47.86% 1,529 3.24% 190.04% 25,948 56.50% 19,977 43.50% 12,523 38.78% 18,812 58.25% 915 2.83% 44 0.14%0.14%0.04%
50 22,427 51.96% 19,641 45.50% 1,079 2.50% 170.04% 24,273 57.34% 18,057 42.66% 11,936 39.20% 17,598 57.80% 884 2.90% 31 0.10%0.10%0.04%
51 13,347 41.90% 17,802 55.89% 695 2.18% 90.03% 14,890 47.81% 16,254 52.19% 10,309 51.33% 8,824 43.94% 912 4.54% 37 0.18%0.18%0.03%
52 13,223 32.47% 26,842 65.91% 647 1.59% 130.03% 14,727 36.95% 25,133 63.05% 18,117 61.71% 10,299 35.08% 918 3.13% 25 0.09%0.09%0.03%
53 12,066 36.20% 20,590 61.78% 654 1.96% 180.05% 13,884 42.31% 18,933 57.69% 12,290 57.33% 8,229 38.39% 881 4.11% 37 0.17%0.17%0.05%
District plan definition file: 'HBK-20.asc', modified 08/24/2017 11:02:00 PM
Data Source: North Carolina State Board of Elections. Votes that could not be associated with a specific precinct were excluded. Reported statewide totals may therefore be marginally lower than official contest results. Page 1 of 3
Printed 08/24/2017 {rptS03|dc2017HS|re1.3.1}
Case 1:15-cv-00399-TDS-JEP Document 184-38 Filed 09/07/17 Page 28 of 44
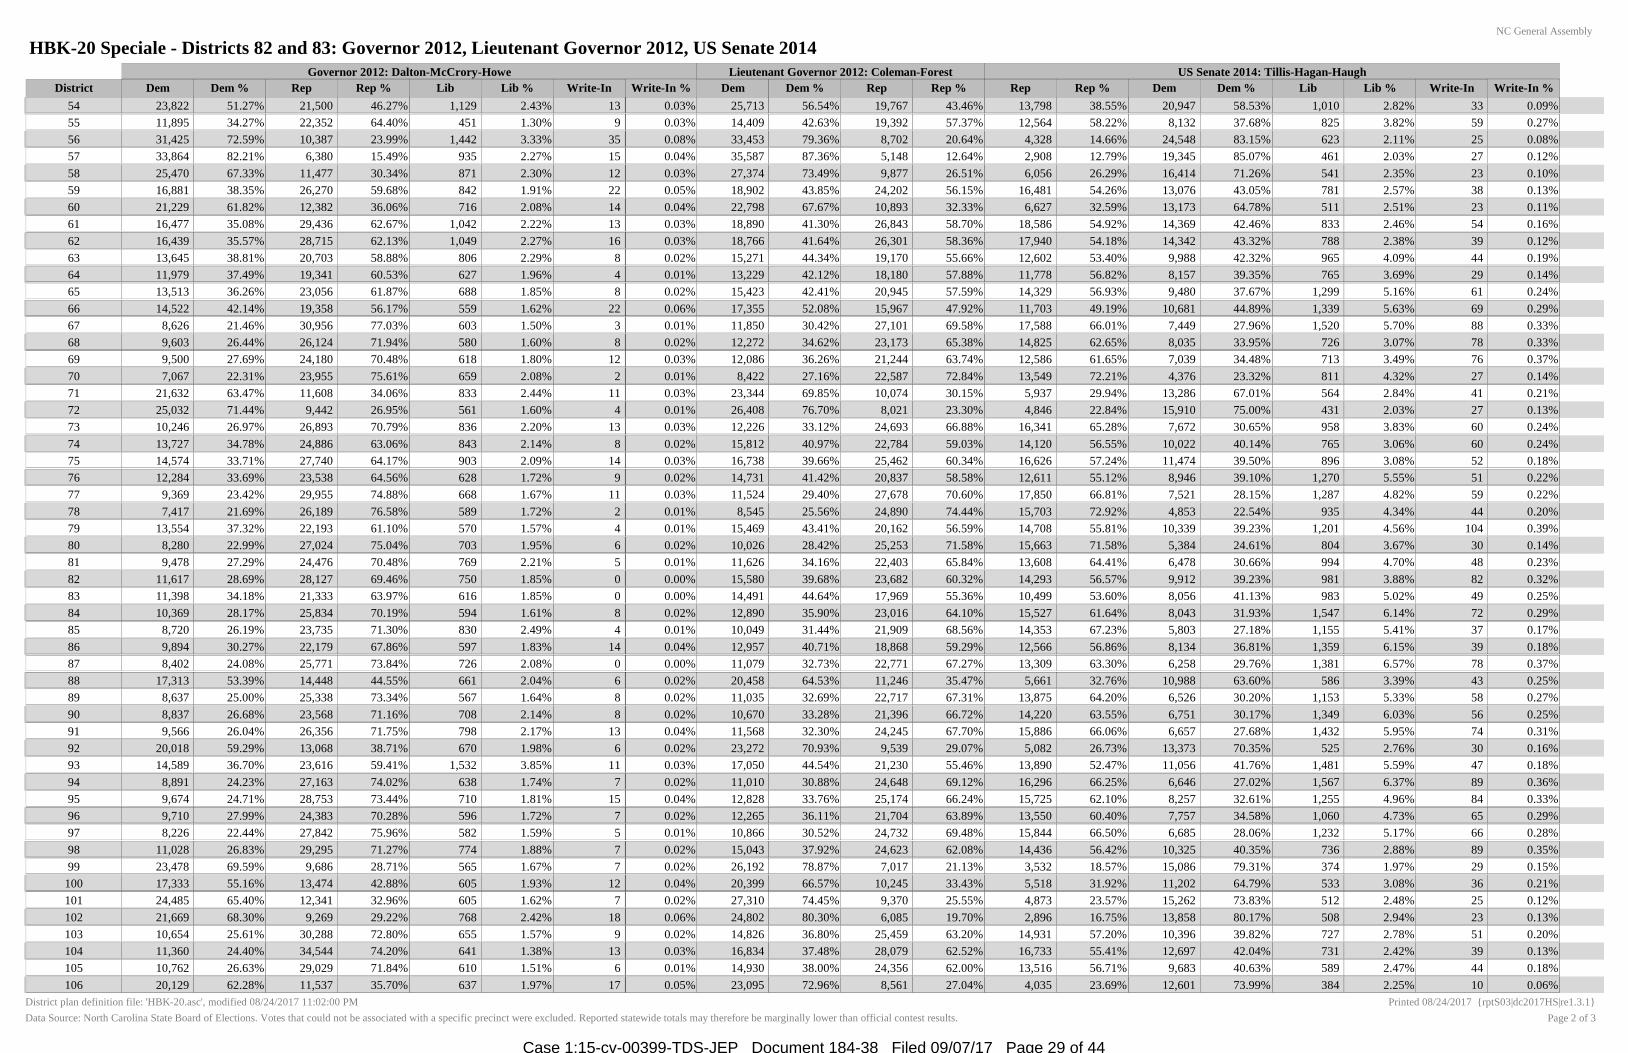
HBK-20 Speciale - Districts 82 and 83: Governor 2012, Lieutenant Governor 2012, US Senate 2014NC General Assembly
District Dem Dem % Rep Rep % Lib Lib % Write-InWrite-In % Dem Dem % Rep Rep % Rep Rep % Dem Dem % Lib Lib % Write-In Pct_EL14G_USS_WI
Governor 2012: Dalton-McCrory-Howe Lieutenant Governor 2012: Coleman-Forest US Senate 2014: Tillis-Hagan-Haugh
Write-In %Write-In %
54 23,822 51.27% 21,500 46.27% 1,129 2.43% 130.03% 25,713 56.54% 19,767 43.46% 13,798 38.55% 20,947 58.53% 1,010 2.82% 33 0.09%0.09%0.03%
55 11,895 34.27% 22,352 64.40% 451 1.30% 90.03% 14,409 42.63% 19,392 57.37% 12,564 58.22% 8,132 37.68% 825 3.82% 59 0.27%0.27%0.03%
56 31,425 72.59% 10,387 23.99% 1,442 3.33% 350.08% 33,453 79.36% 8,702 20.64% 4,328 14.66% 24,548 83.15% 623 2.11% 25 0.08%0.08%0.08%
57 33,864 82.21% 6,380 15.49% 935 2.27% 150.04% 35,587 87.36% 5,148 12.64% 2,908 12.79% 19,345 85.07% 461 2.03% 27 0.12%0.12%0.04%
58 25,470 67.33% 11,477 30.34% 871 2.30% 120.03% 27,374 73.49% 9,877 26.51% 6,056 26.29% 16,414 71.26% 541 2.35% 23 0.10%0.10%0.03%
59 16,881 38.35% 26,270 59.68% 842 1.91% 220.05% 18,902 43.85% 24,202 56.15% 16,481 54.26% 13,076 43.05% 781 2.57% 38 0.13%0.13%0.05%
60 21,229 61.82% 12,382 36.06% 716 2.08% 140.04% 22,798 67.67% 10,893 32.33% 6,627 32.59% 13,173 64.78% 511 2.51% 23 0.11%0.11%0.04%
61 16,477 35.08% 29,436 62.67% 1,042 2.22% 130.03% 18,890 41.30% 26,843 58.70% 18,586 54.92% 14,369 42.46% 833 2.46% 54 0.16%0.16%0.03%
62 16,439 35.57% 28,715 62.13% 1,049 2.27% 160.03% 18,766 41.64% 26,301 58.36% 17,940 54.18% 14,342 43.32% 788 2.38% 39 0.12%0.12%0.03%
63 13,645 38.81% 20,703 58.88% 806 2.29% 80.02% 15,271 44.34% 19,170 55.66% 12,602 53.40% 9,988 42.32% 965 4.09% 44 0.19%0.19%0.02%
64 11,979 37.49% 19,341 60.53% 627 1.96% 40.01% 13,229 42.12% 18,180 57.88% 11,778 56.82% 8,157 39.35% 765 3.69% 29 0.14%0.14%0.01%
65 13,513 36.26% 23,056 61.87% 688 1.85% 80.02% 15,423 42.41% 20,945 57.59% 14,329 56.93% 9,480 37.67% 1,299 5.16% 61 0.24%0.24%0.02%
66 14,522 42.14% 19,358 56.17% 559 1.62% 220.06% 17,355 52.08% 15,967 47.92% 11,703 49.19% 10,681 44.89% 1,339 5.63% 69 0.29%0.29%0.06%
67 8,626 21.46% 30,956 77.03% 603 1.50% 30.01% 11,850 30.42% 27,101 69.58% 17,588 66.01% 7,449 27.96% 1,520 5.70% 88 0.33%0.33%0.01%
68 9,603 26.44% 26,124 71.94% 580 1.60% 80.02% 12,272 34.62% 23,173 65.38% 14,825 62.65% 8,035 33.95% 726 3.07% 78 0.33%0.33%0.02%
69 9,500 27.69% 24,180 70.48% 618 1.80% 120.03% 12,086 36.26% 21,244 63.74% 12,586 61.65% 7,039 34.48% 713 3.49% 76 0.37%0.37%0.03%
70 7,067 22.31% 23,955 75.61% 659 2.08% 20.01% 8,422 27.16% 22,587 72.84% 13,549 72.21% 4,376 23.32% 811 4.32% 27 0.14%0.14%0.01%
71 21,632 63.47% 11,608 34.06% 833 2.44% 110.03% 23,344 69.85% 10,074 30.15% 5,937 29.94% 13,286 67.01% 564 2.84% 41 0.21%0.21%0.03%
72 25,032 71.44% 9,442 26.95% 561 1.60% 40.01% 26,408 76.70% 8,021 23.30% 4,846 22.84% 15,910 75.00% 431 2.03% 27 0.13%0.13%0.01%
73 10,246 26.97% 26,893 70.79% 836 2.20% 130.03% 12,226 33.12% 24,693 66.88% 16,341 65.28% 7,672 30.65% 958 3.83% 60 0.24%0.24%0.03%
74 13,727 34.78% 24,886 63.06% 843 2.14% 80.02% 15,812 40.97% 22,784 59.03% 14,120 56.55% 10,022 40.14% 765 3.06% 60 0.24%0.24%0.02%
75 14,574 33.71% 27,740 64.17% 903 2.09% 140.03% 16,738 39.66% 25,462 60.34% 16,626 57.24% 11,474 39.50% 896 3.08% 52 0.18%0.18%0.03%
76 12,284 33.69% 23,538 64.56% 628 1.72% 90.02% 14,731 41.42% 20,837 58.58% 12,611 55.12% 8,946 39.10% 1,270 5.55% 51 0.22%0.22%0.02%
77 9,369 23.42% 29,955 74.88% 668 1.67% 110.03% 11,524 29.40% 27,678 70.60% 17,850 66.81% 7,521 28.15% 1,287 4.82% 59 0.22%0.22%0.03%
78 7,417 21.69% 26,189 76.58% 589 1.72% 20.01% 8,545 25.56% 24,890 74.44% 15,703 72.92% 4,853 22.54% 935 4.34% 44 0.20%0.20%0.01%
79 13,554 37.32% 22,193 61.10% 570 1.57% 40.01% 15,469 43.41% 20,162 56.59% 14,708 55.81% 10,339 39.23% 1,201 4.56% 104 0.39%0.39%0.01%
80 8,280 22.99% 27,024 75.04% 703 1.95% 60.02% 10,026 28.42% 25,253 71.58% 15,663 71.58% 5,384 24.61% 804 3.67% 30 0.14%0.14%0.02%
81 9,478 27.29% 24,476 70.48% 769 2.21% 50.01% 11,626 34.16% 22,403 65.84% 13,608 64.41% 6,478 30.66% 994 4.70% 48 0.23%0.23%0.01%
82 11,617 28.69% 28,127 69.46% 750 1.85% 00.00% 15,580 39.68% 23,682 60.32% 14,293 56.57% 9,912 39.23% 981 3.88% 82 0.32%0.32%0.00%
83 11,398 34.18% 21,333 63.97% 616 1.85% 00.00% 14,491 44.64% 17,969 55.36% 10,499 53.60% 8,056 41.13% 983 5.02% 49 0.25%0.25%0.00%
84 10,369 28.17% 25,834 70.19% 594 1.61% 80.02% 12,890 35.90% 23,016 64.10% 15,527 61.64% 8,043 31.93% 1,547 6.14% 72 0.29%0.29%0.02%
85 8,720 26.19% 23,735 71.30% 830 2.49% 40.01% 10,049 31.44% 21,909 68.56% 14,353 67.23% 5,803 27.18% 1,155 5.41% 37 0.17%0.17%0.01%
86 9,894 30.27% 22,179 67.86% 597 1.83% 140.04% 12,957 40.71% 18,868 59.29% 12,566 56.86% 8,134 36.81% 1,359 6.15% 39 0.18%0.18%0.04%
87 8,402 24.08% 25,771 73.84% 726 2.08% 00.00% 11,079 32.73% 22,771 67.27% 13,309 63.30% 6,258 29.76% 1,381 6.57% 78 0.37%0.37%0.00%
88 17,313 53.39% 14,448 44.55% 661 2.04% 60.02% 20,458 64.53% 11,246 35.47% 5,661 32.76% 10,988 63.60% 586 3.39% 43 0.25%0.25%0.02%
89 8,637 25.00% 25,338 73.34% 567 1.64% 80.02% 11,035 32.69% 22,717 67.31% 13,875 64.20% 6,526 30.20% 1,153 5.33% 58 0.27%0.27%0.02%
90 8,837 26.68% 23,568 71.16% 708 2.14% 80.02% 10,670 33.28% 21,396 66.72% 14,220 63.55% 6,751 30.17% 1,349 6.03% 56 0.25%0.25%0.02%
91 9,566 26.04% 26,356 71.75% 798 2.17% 130.04% 11,568 32.30% 24,245 67.70% 15,886 66.06% 6,657 27.68% 1,432 5.95% 74 0.31%0.31%0.04%
92 20,018 59.29% 13,068 38.71% 670 1.98% 60.02% 23,272 70.93% 9,539 29.07% 5,082 26.73% 13,373 70.35% 525 2.76% 30 0.16%0.16%0.02%
93 14,589 36.70% 23,616 59.41% 1,532 3.85% 110.03% 17,050 44.54% 21,230 55.46% 13,890 52.47% 11,056 41.76% 1,481 5.59% 47 0.18%0.18%0.03%
94 8,891 24.23% 27,163 74.02% 638 1.74% 70.02% 11,010 30.88% 24,648 69.12% 16,296 66.25% 6,646 27.02% 1,567 6.37% 89 0.36%0.36%0.02%
95 9,674 24.71% 28,753 73.44% 710 1.81% 150.04% 12,828 33.76% 25,174 66.24% 15,725 62.10% 8,257 32.61% 1,255 4.96% 84 0.33%0.33%0.04%
96 9,710 27.99% 24,383 70.28% 596 1.72% 70.02% 12,265 36.11% 21,704 63.89% 13,550 60.40% 7,757 34.58% 1,060 4.73% 65 0.29%0.29%0.02%
97 8,226 22.44% 27,842 75.96% 582 1.59% 50.01% 10,866 30.52% 24,732 69.48% 15,844 66.50% 6,685 28.06% 1,232 5.17% 66 0.28%0.28%0.01%
98 11,028 26.83% 29,295 71.27% 774 1.88% 70.02% 15,043 37.92% 24,623 62.08% 14,436 56.42% 10,325 40.35% 736 2.88% 89 0.35%0.35%0.02%
99 23,478 69.59% 9,686 28.71% 565 1.67% 70.02% 26,192 78.87% 7,017 21.13% 3,532 18.57% 15,086 79.31% 374 1.97% 29 0.15%0.15%0.02%
100 17,333 55.16% 13,474 42.88% 605 1.93% 120.04% 20,399 66.57% 10,245 33.43% 5,518 31.92% 11,202 64.79% 533 3.08% 36 0.21%0.21%0.04%
101 24,485 65.40% 12,341 32.96% 605 1.62% 70.02% 27,310 74.45% 9,370 25.55% 4,873 23.57% 15,262 73.83% 512 2.48% 25 0.12%0.12%0.02%
102 21,669 68.30% 9,269 29.22% 768 2.42% 180.06% 24,802 80.30% 6,085 19.70% 2,896 16.75% 13,858 80.17% 508 2.94% 23 0.13%0.13%0.06%
103 10,654 25.61% 30,288 72.80% 655 1.57% 90.02% 14,826 36.80% 25,459 63.20% 14,931 57.20% 10,396 39.82% 727 2.78% 51 0.20%0.20%0.02%
104 11,360 24.40% 34,544 74.20% 641 1.38% 130.03% 16,834 37.48% 28,079 62.52% 16,733 55.41% 12,697 42.04% 731 2.42% 39 0.13%0.13%0.03%
105 10,762 26.63% 29,029 71.84% 610 1.51% 60.01% 14,930 38.00% 24,356 62.00% 13,516 56.71% 9,683 40.63% 589 2.47% 44 0.18%0.18%0.01%
106 20,129 62.28% 11,537 35.70% 637 1.97% 170.05% 23,095 72.96% 8,561 27.04% 4,035 23.69% 12,601 73.99% 384 2.25% 10 0.06%0.06%0.05%
District plan definition file: 'HBK-20.asc', modified 08/24/2017 11:02:00 PM
Data Source: North Carolina State Board of Elections. Votes that could not be associated with a specific precinct were excluded. Reported statewide totals may therefore be marginally lower than official contest results. Page 2 of 3
Printed 08/24/2017 {rptS03|dc2017HS|re1.3.1}
Case 1:15-cv-00399-TDS-JEP Document 184-38 Filed 09/07/17 Page 29 of 44

HBK-20 Speciale - Districts 82 and 83: Governor 2012, Lieutenant Governor 2012, US Senate 2014NC General Assembly
District Dem Dem % Rep Rep % Lib Lib % Write-InWrite-In % Dem Dem % Rep Rep % Rep Rep % Dem Dem % Lib Lib % Write-In Pct_EL14G_USS_WI
Governor 2012: Dalton-McCrory-Howe Lieutenant Governor 2012: Coleman-Forest US Senate 2014: Tillis-Hagan-Haugh
Write-In %Write-In %
107 24,066 67.23% 11,223 31.35% 499 1.39% 110.03% 26,973 76.68% 8,203 23.32% 4,072 20.43% 15,400 77.28% 420 2.11% 35 0.18%0.18%0.03%
108 10,229 30.60% 22,641 67.73% 553 1.65% 60.02% 12,577 38.66% 19,954 61.34% 11,798 58.37% 7,436 36.79% 940 4.65% 37 0.18%0.18%0.02%
109 11,675 33.74% 22,419 64.79% 501 1.45% 90.03% 13,855 41.00% 19,937 59.00% 12,274 57.67% 8,147 38.28% 804 3.78% 59 0.28%0.28%0.03%
110 10,188 31.08% 22,150 67.56% 443 1.35% 40.01% 11,944 37.40% 19,996 62.60% 12,381 60.75% 6,988 34.29% 961 4.72% 49 0.24%0.24%0.01%
111 10,978 33.85% 21,002 64.75% 447 1.38% 90.03% 12,345 39.08% 19,245 60.92% 12,248 58.87% 7,466 35.89% 1,040 5.00% 50 0.24%0.24%0.03%
112 13,175 40.49% 18,798 57.78% 552 1.70% 100.03% 11,934 37.96% 19,505 62.04% 13,356 60.75% 7,327 33.33% 1,273 5.79% 30 0.14%0.14%0.03%
113 14,513 34.86% 26,056 62.58% 1,053 2.53% 140.03% 15,965 39.13% 24,832 60.87% 17,951 56.94% 12,220 38.76% 1,317 4.18% 39 0.12%0.12%0.03%
114 30,335 67.66% 12,627 28.17% 1,853 4.13% 170.04% 32,363 73.64% 11,584 26.36% 6,689 22.11% 22,389 74.02% 1,142 3.78% 29 0.10%0.10%0.04%
115 18,992 44.03% 22,839 52.94% 1,300 3.01% 80.02% 20,704 48.97% 21,574 51.03% 14,095 45.76% 15,408 50.02% 1,262 4.10% 39 0.13%0.13%0.02%
116 15,055 39.40% 22,073 57.77% 1,069 2.80% 100.03% 16,787 44.87% 20,623 55.13% 13,088 50.68% 11,658 45.14% 1,042 4.03% 38 0.15%0.15%0.03%
117 12,236 33.12% 23,695 64.13% 1,002 2.71% 140.04% 13,677 37.80% 22,505 62.20% 14,898 58.54% 9,518 37.40% 995 3.91% 37 0.15%0.15%0.04%
118 14,554 39.85% 21,033 57.59% 922 2.52% 130.04% 15,851 44.59% 19,698 55.41% 14,379 52.35% 11,489 41.83% 1,537 5.60% 61 0.22%0.22%0.04%
119 14,498 44.69% 16,886 52.05% 1,054 3.25% 20.01% 15,958 50.57% 15,600 49.43% 10,500 46.76% 10,697 47.64% 1,217 5.42% 40 0.18%0.18%0.01%
120 12,098 31.33% 25,139 65.11% 1,357 3.51% 180.05% 13,273 35.22% 24,408 64.78% 18,212 62.59% 9,371 32.21% 1,474 5.07% 40 0.14%0.14%0.05%
1,925,270 2,437,224 94,512 1,191 2,174,021 2,184,891 1,416,834 1,370,303 108,779 5,251Totals: 43.18% 54.67% 2.12% 0.03% 49.88% 50.12% 48.84% 47.23% 3.75% 0.18%0.03%
District plan definition file: 'HBK-20.asc', modified 08/24/2017 11:02:00 PM
Data Source: North Carolina State Board of Elections. Votes that could not be associated with a specific precinct were excluded. Reported statewide totals may therefore be marginally lower than official contest results. Page 3 of 3
Printed 08/24/2017 {rptS03|dc2017HS|re1.3.1}
Case 1:15-cv-00399-TDS-JEP Document 184-38 Filed 09/07/17 Page 30 of 44

HBK-20 Speciale - Districts 82 and 83: President 2016, US Senate 2016, Governor 2016NC General Assembly
District Rep Rep % Dem Dem % Lib Lib % Write-In Write-In % Rep Rep % Dem Dem % Lib Lib % Dem Dem % Rep Rep % Lib Lib %
US President 2016: Trump-Clinton-Johnson US Senate 2016: Burr-Ross-Haugh Governor 2016: Cooper-McCrory-Cecil
1 18,589 51.78% 16,455 45.83% 630 1.75% 229 0.64% 18,358 52.14% 16,040 45.56% 811 2.30% 16,170 45.62% 18,855 53.20% 418 1.18%
2 21,687 56.45% 15,453 40.22% 893 2.32% 385 1.00% 21,503 56.54% 15,299 40.22% 1,232 3.24% 16,542 43.27% 21,035 55.02% 656 1.72%
3 19,500 57.51% 13,102 38.64% 958 2.83% 350 1.03% 19,722 58.75% 12,526 37.32% 1,320 3.93% 13,284 39.49% 19,645 58.40% 709 2.11%
4 19,316 63.27% 10,515 34.44% 536 1.76% 163 0.53% 18,844 62.77% 10,197 33.97% 978 3.26% 10,515 34.80% 19,240 63.67% 463 1.53%
5 14,071 42.89% 17,840 54.38% 677 2.06% 221 0.67% 13,942 43.33% 17,542 54.52% 690 2.14% 17,723 54.83% 14,115 43.67% 483 1.49%
6 26,166 63.13% 13,548 32.69% 1,322 3.19% 413 1.00% 25,754 63.45% 13,548 33.38% 1,290 3.18% 14,719 36.08% 25,069 61.45% 1,010 2.48%
7 17,731 44.94% 20,836 52.81% 588 1.49% 299 0.76% 17,965 45.70% 20,621 52.45% 729 1.85% 21,877 55.47% 17,171 43.54% 389 0.99%
8 11,251 32.48% 22,166 63.99% 878 2.53% 346 1.00% 11,920 34.87% 21,238 62.12% 1,030 3.01% 21,791 63.50% 11,949 34.82% 577 1.68%
9 20,103 53.26% 16,101 42.66% 1,112 2.95% 426 1.13% 20,913 55.89% 15,376 41.09% 1,129 3.02% 16,546 44.07% 20,375 54.27% 626 1.67%
10 24,292 66.90% 11,079 30.51% 680 1.87% 258 0.71% 24,011 66.82% 10,937 30.44% 984 2.74% 11,524 31.87% 24,183 66.89% 449 1.24%
11 13,097 31.16% 26,165 62.26% 1,893 4.50% 873 2.08% 14,675 35.17% 25,423 60.93% 1,628 3.90% 27,513 65.67% 13,139 31.36% 1,242 2.96%
12 17,784 51.92% 15,657 45.71% 569 1.66% 241 0.70% 17,668 52.25% 15,240 45.07% 906 2.68% 15,523 45.65% 18,084 53.18% 397 1.17%
13 29,527 68.85% 11,999 27.98% 967 2.25% 396 0.92% 29,080 68.53% 11,666 27.49% 1,685 3.97% 12,730 29.84% 29,076 68.17% 849 1.99%
14 16,391 60.55% 9,442 34.88% 949 3.51% 289 1.07% 16,089 60.41% 9,134 34.30% 1,410 5.29% 9,540 35.73% 16,350 61.23% 813 3.04%
15 13,635 66.87% 5,838 28.63% 701 3.44% 217 1.06% 13,255 66.19% 5,709 28.51% 1,061 5.30% 6,115 30.44% 13,366 66.54% 606 3.02%
16 24,723 60.82% 14,793 36.39% 868 2.14% 267 0.66% 24,021 60.12% 14,359 35.94% 1,578 3.95% 15,806 39.44% 23,414 58.42% 858 2.14%
17 33,539 64.40% 16,832 32.32% 1,227 2.36% 480 0.92% 32,987 64.27% 16,223 31.61% 2,112 4.12% 18,326 35.57% 32,038 62.18% 1,162 2.26%
18 14,960 39.11% 21,515 56.25% 1,247 3.26% 530 1.39% 15,065 40.15% 20,714 55.20% 1,747 4.66% 22,540 59.77% 14,028 37.20% 1,146 3.04%
19 24,349 55.45% 17,494 39.84% 1,461 3.33% 604 1.38% 24,444 56.44% 16,799 38.79% 2,068 4.77% 19,932 45.80% 22,351 51.36% 1,232 2.83%
20 25,197 54.81% 18,393 40.01% 1,731 3.77% 651 1.42% 25,753 56.83% 17,604 38.84% 1,962 4.33% 20,831 45.79% 23,400 51.43% 1,266 2.78%
21 13,185 40.91% 18,296 56.77% 504 1.56% 241 0.75% 13,302 41.79% 17,819 55.99% 706 2.22% 18,015 56.37% 13,529 42.34% 412 1.29%
22 20,673 57.99% 14,263 40.01% 514 1.44% 197 0.55% 20,313 57.79% 14,021 39.89% 817 2.32% 14,526 41.04% 20,479 57.86% 392 1.11%
23 14,143 38.43% 22,040 59.88% 449 1.22% 173 0.47% 14,165 38.89% 21,496 59.02% 760 2.09% 21,917 59.87% 14,389 39.30% 303 0.83%
24 17,531 45.97% 19,663 51.56% 667 1.75% 274 0.72% 17,641 46.58% 19,435 51.32% 794 2.10% 20,471 53.84% 17,161 45.13% 391 1.03%
25 21,956 56.91% 15,273 39.59% 939 2.43% 411 1.07% 21,764 56.74% 15,352 40.02% 1,242 3.24% 16,618 43.12% 21,215 55.05% 707 1.83%
26 28,331 59.78% 17,038 35.95% 1,483 3.13% 543 1.15% 28,339 60.24% 16,928 35.98% 1,777 3.78% 18,695 39.57% 27,607 58.43% 947 2.00%
27 12,504 36.17% 21,573 62.40% 373 1.08% 123 0.36% 12,390 36.15% 21,326 62.22% 557 1.63% 21,783 63.37% 12,336 35.89% 256 0.74%
28 24,528 66.08% 11,430 30.79% 876 2.36% 284 0.77% 24,192 65.72% 11,427 31.04% 1,192 3.24% 12,526 33.84% 23,877 64.50% 616 1.66%
29 5,172 10.88% 40,386 84.99% 1,171 2.46% 787 1.66% 7,072 15.00% 39,112 82.96% 964 2.04% 40,387 85.64% 6,009 12.74% 761 1.61%
30 13,282 26.62% 34,511 69.18% 1,265 2.54% 829 1.66% 14,956 30.09% 33,506 67.41% 1,242 2.50% 35,040 70.35% 13,947 28.00% 818 1.64%
31 7,429 16.37% 36,169 79.69% 1,136 2.50% 654 1.44% 8,466 18.76% 35,558 78.81% 1,092 2.42% 36,387 80.47% 8,063 17.83% 770 1.70%
32 13,636 35.53% 23,937 62.37% 563 1.47% 241 0.63% 13,731 36.10% 23,622 62.10% 683 1.80% 24,127 63.21% 13,643 35.74% 401 1.05%
33 9,320 22.99% 29,204 72.05% 1,399 3.45% 610 1.50% 10,337 25.71% 28,598 71.13% 1,272 3.16% 29,984 74.32% 9,429 23.37% 934 2.31%
34 16,734 33.58% 30,202 60.61% 1,879 3.77% 1,011 2.03% 19,537 39.31% 28,698 57.74% 1,464 2.95% 31,726 63.65% 17,066 34.24% 1,052 2.11%
35 25,508 49.09% 23,630 45.47% 1,744 3.36% 1,082 2.08% 27,262 52.81% 22,718 44.01% 1,638 3.17% 25,059 48.33% 25,740 49.64% 1,054 2.03%
36 25,495 49.78% 22,974 44.86% 1,903 3.72% 846 1.65% 27,500 53.89% 21,900 42.91% 1,632 3.20% 24,574 47.98% 25,611 50.00% 1,036 2.02%
37 26,427 49.66% 23,556 44.27% 2,295 4.31% 936 1.76% 28,468 53.86% 22,487 42.55% 1,896 3.59% 25,376 47.79% 26,351 49.63% 1,369 2.58%
38 7,962 20.17% 29,883 75.70% 1,056 2.67% 577 1.46% 8,744 22.30% 29,341 74.83% 1,126 2.87% 30,111 76.58% 8,383 21.32% 825 2.10%
39 11,720 27.17% 29,742 68.94% 1,134 2.63% 547 1.27% 12,360 28.82% 29,304 68.32% 1,230 2.87% 30,194 70.17% 12,076 28.06% 760 1.77%
40 25,414 46.70% 25,912 47.62% 2,113 3.88% 976 1.79% 28,593 52.66% 24,242 44.65% 1,463 2.69% 27,552 50.59% 25,895 47.55% 1,016 1.87%
41 17,367 35.18% 29,148 59.04% 1,982 4.01% 876 1.77% 20,218 41.31% 27,134 55.45% 1,585 3.24% 29,804 60.65% 18,119 36.87% 1,218 2.48%
42 6,364 25.50% 17,674 70.81% 647 2.59% 274 1.10% 6,643 26.97% 17,141 69.60% 845 3.43% 17,092 69.47% 6,886 27.99% 627 2.55%
43 8,099 26.20% 21,704 70.20% 798 2.58% 317 1.03% 8,364 27.40% 21,127 69.21% 1,035 3.39% 21,109 69.10% 8,700 28.48% 740 2.42%
44 14,477 44.27% 16,935 51.79% 961 2.94% 329 1.01% 14,728 45.60% 16,387 50.74% 1,184 3.67% 16,797 51.88% 14,827 45.80% 750 2.32%
45 22,325 57.35% 15,292 39.28% 967 2.48% 343 0.88% 22,167 57.66% 15,078 39.22% 1,202 3.13% 15,451 40.04% 22,349 57.91% 792 2.05%
46 16,046 61.47% 9,544 36.56% 396 1.52% 116 0.44% 15,195 59.76% 9,522 37.45% 708 2.78% 9,625 37.45% 15,778 61.39% 300 1.17%
47 11,779 46.41% 12,896 50.81% 520 2.05% 186 0.73% 11,277 45.82% 12,909 52.46% 423 1.72% 12,419 49.71% 12,346 49.42% 216 0.86%
48 14,016 43.58% 17,045 53.00% 831 2.58% 266 0.83% 13,782 43.73% 16,722 53.06% 1,010 3.20% 17,039 53.91% 13,890 43.94% 679 2.15%
49 17,038 32.50% 32,320 61.64% 2,062 3.93% 1,012 1.93% 20,095 38.54% 30,441 58.39% 1,600 3.07% 33,662 64.28% 17,547 33.51% 1,158 2.21%
50 18,683 40.92% 25,213 55.22% 1,226 2.69% 539 1.18% 19,535 43.06% 24,526 54.06% 1,309 2.89% 26,259 57.73% 18,414 40.49% 810 1.78%
51 18,556 54.99% 13,829 40.98% 1,027 3.04% 332 0.98% 18,319 54.87% 13,803 41.34% 1,264 3.79% 14,919 44.49% 17,772 53.00% 840 2.51%
52 26,508 61.46% 14,902 34.55% 1,240 2.87% 482 1.12% 26,850 62.67% 14,595 34.07% 1,396 3.26% 16,149 37.60% 25,907 60.32% 893 2.08%
District plan definition file: 'HBK-20.asc', modified 08/24/2017 11:02:00 PM
Data Source: North Carolina State Board of Elections. Votes that could not be associated with a specific precinct were excluded. Reported statewide totals may therefore be marginally lower than official contest results. Page 1 of 3
Printed 08/24/2017 {rptS04|dc2017HS|re1.3.1}
Case 1:15-cv-00399-TDS-JEP Document 184-38 Filed 09/07/17 Page 31 of 44
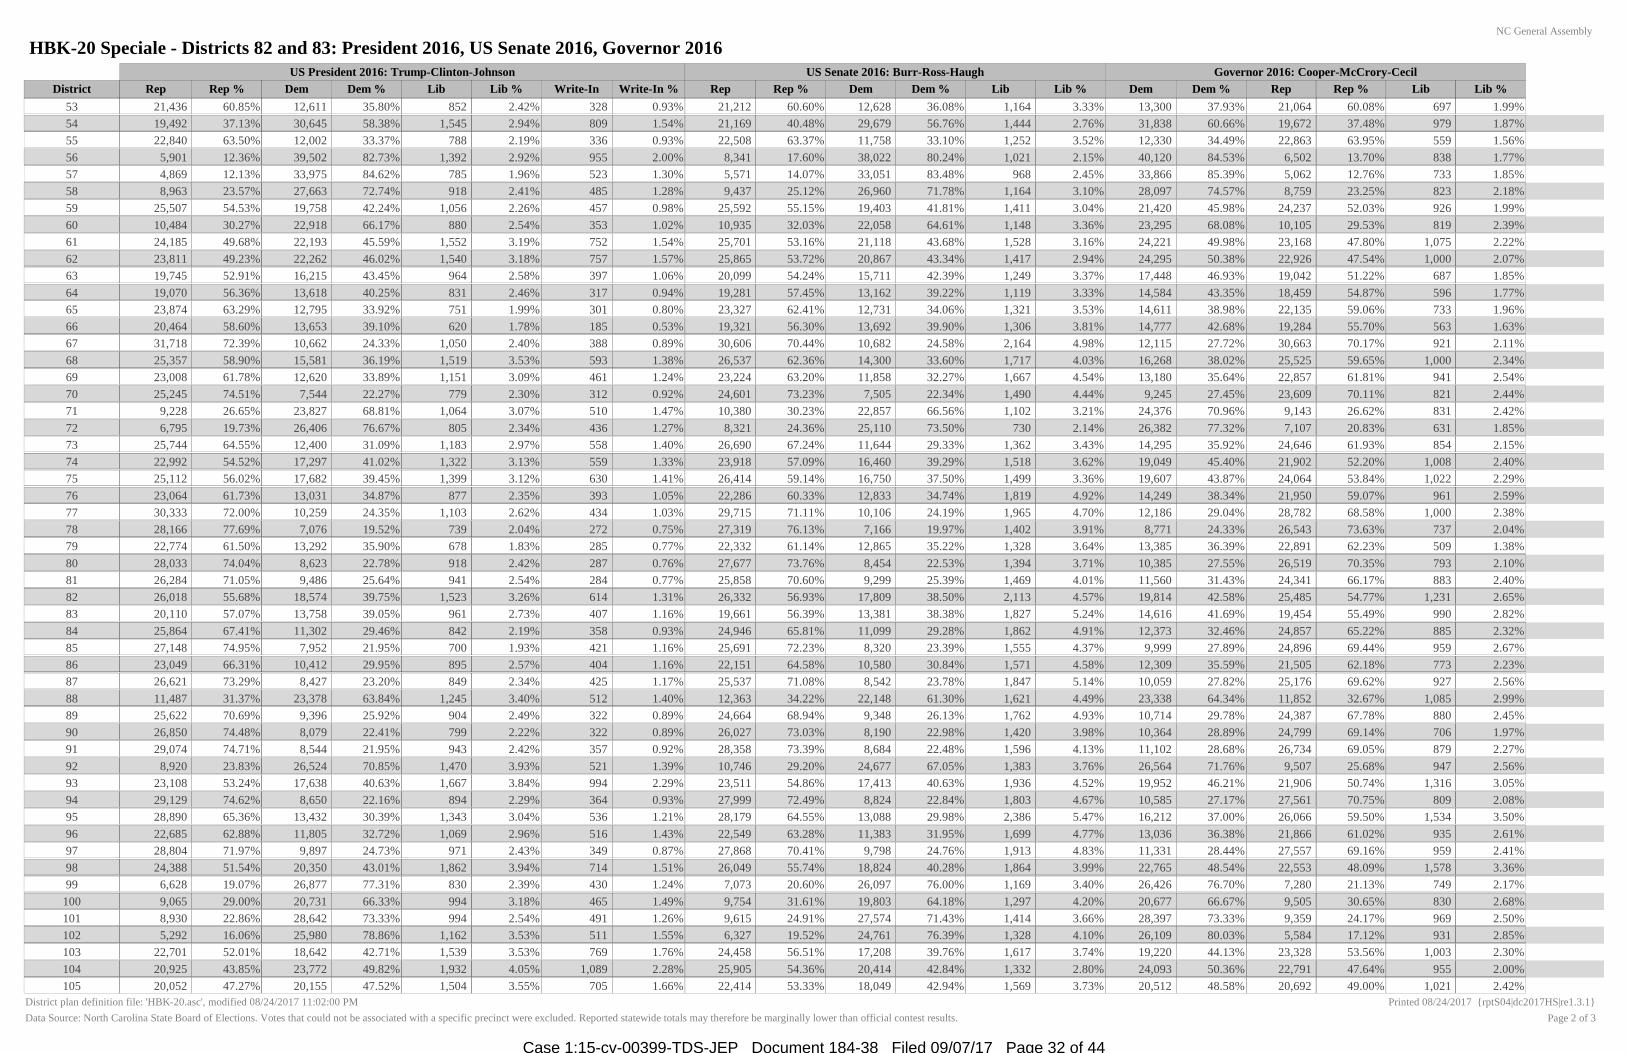
HBK-20 Speciale - Districts 82 and 83: President 2016, US Senate 2016, Governor 2016NC General Assembly
District Rep Rep % Dem Dem % Lib Lib % Write-In Write-In % Rep Rep % Dem Dem % Lib Lib % Dem Dem % Rep Rep % Lib Lib %
US President 2016: Trump-Clinton-Johnson US Senate 2016: Burr-Ross-Haugh Governor 2016: Cooper-McCrory-Cecil
53 21,436 60.85% 12,611 35.80% 852 2.42% 328 0.93% 21,212 60.60% 12,628 36.08% 1,164 3.33% 13,300 37.93% 21,064 60.08% 697 1.99%
54 19,492 37.13% 30,645 58.38% 1,545 2.94% 809 1.54% 21,169 40.48% 29,679 56.76% 1,444 2.76% 31,838 60.66% 19,672 37.48% 979 1.87%
55 22,840 63.50% 12,002 33.37% 788 2.19% 336 0.93% 22,508 63.37% 11,758 33.10% 1,252 3.52% 12,330 34.49% 22,863 63.95% 559 1.56%
56 5,901 12.36% 39,502 82.73% 1,392 2.92% 955 2.00% 8,341 17.60% 38,022 80.24% 1,021 2.15% 40,120 84.53% 6,502 13.70% 838 1.77%
57 4,869 12.13% 33,975 84.62% 785 1.96% 523 1.30% 5,571 14.07% 33,051 83.48% 968 2.45% 33,866 85.39% 5,062 12.76% 733 1.85%
58 8,963 23.57% 27,663 72.74% 918 2.41% 485 1.28% 9,437 25.12% 26,960 71.78% 1,164 3.10% 28,097 74.57% 8,759 23.25% 823 2.18%
59 25,507 54.53% 19,758 42.24% 1,056 2.26% 457 0.98% 25,592 55.15% 19,403 41.81% 1,411 3.04% 21,420 45.98% 24,237 52.03% 926 1.99%
60 10,484 30.27% 22,918 66.17% 880 2.54% 353 1.02% 10,935 32.03% 22,058 64.61% 1,148 3.36% 23,295 68.08% 10,105 29.53% 819 2.39%
61 24,185 49.68% 22,193 45.59% 1,552 3.19% 752 1.54% 25,701 53.16% 21,118 43.68% 1,528 3.16% 24,221 49.98% 23,168 47.80% 1,075 2.22%
62 23,811 49.23% 22,262 46.02% 1,540 3.18% 757 1.57% 25,865 53.72% 20,867 43.34% 1,417 2.94% 24,295 50.38% 22,926 47.54% 1,000 2.07%
63 19,745 52.91% 16,215 43.45% 964 2.58% 397 1.06% 20,099 54.24% 15,711 42.39% 1,249 3.37% 17,448 46.93% 19,042 51.22% 687 1.85%
64 19,070 56.36% 13,618 40.25% 831 2.46% 317 0.94% 19,281 57.45% 13,162 39.22% 1,119 3.33% 14,584 43.35% 18,459 54.87% 596 1.77%
65 23,874 63.29% 12,795 33.92% 751 1.99% 301 0.80% 23,327 62.41% 12,731 34.06% 1,321 3.53% 14,611 38.98% 22,135 59.06% 733 1.96%
66 20,464 58.60% 13,653 39.10% 620 1.78% 185 0.53% 19,321 56.30% 13,692 39.90% 1,306 3.81% 14,777 42.68% 19,284 55.70% 563 1.63%
67 31,718 72.39% 10,662 24.33% 1,050 2.40% 388 0.89% 30,606 70.44% 10,682 24.58% 2,164 4.98% 12,115 27.72% 30,663 70.17% 921 2.11%
68 25,357 58.90% 15,581 36.19% 1,519 3.53% 593 1.38% 26,537 62.36% 14,300 33.60% 1,717 4.03% 16,268 38.02% 25,525 59.65% 1,000 2.34%
69 23,008 61.78% 12,620 33.89% 1,151 3.09% 461 1.24% 23,224 63.20% 11,858 32.27% 1,667 4.54% 13,180 35.64% 22,857 61.81% 941 2.54%
70 25,245 74.51% 7,544 22.27% 779 2.30% 312 0.92% 24,601 73.23% 7,505 22.34% 1,490 4.44% 9,245 27.45% 23,609 70.11% 821 2.44%
71 9,228 26.65% 23,827 68.81% 1,064 3.07% 510 1.47% 10,380 30.23% 22,857 66.56% 1,102 3.21% 24,376 70.96% 9,143 26.62% 831 2.42%
72 6,795 19.73% 26,406 76.67% 805 2.34% 436 1.27% 8,321 24.36% 25,110 73.50% 730 2.14% 26,382 77.32% 7,107 20.83% 631 1.85%
73 25,744 64.55% 12,400 31.09% 1,183 2.97% 558 1.40% 26,690 67.24% 11,644 29.33% 1,362 3.43% 14,295 35.92% 24,646 61.93% 854 2.15%
74 22,992 54.52% 17,297 41.02% 1,322 3.13% 559 1.33% 23,918 57.09% 16,460 39.29% 1,518 3.62% 19,049 45.40% 21,902 52.20% 1,008 2.40%
75 25,112 56.02% 17,682 39.45% 1,399 3.12% 630 1.41% 26,414 59.14% 16,750 37.50% 1,499 3.36% 19,607 43.87% 24,064 53.84% 1,022 2.29%
76 23,064 61.73% 13,031 34.87% 877 2.35% 393 1.05% 22,286 60.33% 12,833 34.74% 1,819 4.92% 14,249 38.34% 21,950 59.07% 961 2.59%
77 30,333 72.00% 10,259 24.35% 1,103 2.62% 434 1.03% 29,715 71.11% 10,106 24.19% 1,965 4.70% 12,186 29.04% 28,782 68.58% 1,000 2.38%
78 28,166 77.69% 7,076 19.52% 739 2.04% 272 0.75% 27,319 76.13% 7,166 19.97% 1,402 3.91% 8,771 24.33% 26,543 73.63% 737 2.04%
79 22,774 61.50% 13,292 35.90% 678 1.83% 285 0.77% 22,332 61.14% 12,865 35.22% 1,328 3.64% 13,385 36.39% 22,891 62.23% 509 1.38%
80 28,033 74.04% 8,623 22.78% 918 2.42% 287 0.76% 27,677 73.76% 8,454 22.53% 1,394 3.71% 10,385 27.55% 26,519 70.35% 793 2.10%
81 26,284 71.05% 9,486 25.64% 941 2.54% 284 0.77% 25,858 70.60% 9,299 25.39% 1,469 4.01% 11,560 31.43% 24,341 66.17% 883 2.40%
82 26,018 55.68% 18,574 39.75% 1,523 3.26% 614 1.31% 26,332 56.93% 17,809 38.50% 2,113 4.57% 19,814 42.58% 25,485 54.77% 1,231 2.65%
83 20,110 57.07% 13,758 39.05% 961 2.73% 407 1.16% 19,661 56.39% 13,381 38.38% 1,827 5.24% 14,616 41.69% 19,454 55.49% 990 2.82%
84 25,864 67.41% 11,302 29.46% 842 2.19% 358 0.93% 24,946 65.81% 11,099 29.28% 1,862 4.91% 12,373 32.46% 24,857 65.22% 885 2.32%
85 27,148 74.95% 7,952 21.95% 700 1.93% 421 1.16% 25,691 72.23% 8,320 23.39% 1,555 4.37% 9,999 27.89% 24,896 69.44% 959 2.67%
86 23,049 66.31% 10,412 29.95% 895 2.57% 404 1.16% 22,151 64.58% 10,580 30.84% 1,571 4.58% 12,309 35.59% 21,505 62.18% 773 2.23%
87 26,621 73.29% 8,427 23.20% 849 2.34% 425 1.17% 25,537 71.08% 8,542 23.78% 1,847 5.14% 10,059 27.82% 25,176 69.62% 927 2.56%
88 11,487 31.37% 23,378 63.84% 1,245 3.40% 512 1.40% 12,363 34.22% 22,148 61.30% 1,621 4.49% 23,338 64.34% 11,852 32.67% 1,085 2.99%
89 25,622 70.69% 9,396 25.92% 904 2.49% 322 0.89% 24,664 68.94% 9,348 26.13% 1,762 4.93% 10,714 29.78% 24,387 67.78% 880 2.45%
90 26,850 74.48% 8,079 22.41% 799 2.22% 322 0.89% 26,027 73.03% 8,190 22.98% 1,420 3.98% 10,364 28.89% 24,799 69.14% 706 1.97%
91 29,074 74.71% 8,544 21.95% 943 2.42% 357 0.92% 28,358 73.39% 8,684 22.48% 1,596 4.13% 11,102 28.68% 26,734 69.05% 879 2.27%
92 8,920 23.83% 26,524 70.85% 1,470 3.93% 521 1.39% 10,746 29.20% 24,677 67.05% 1,383 3.76% 26,564 71.76% 9,507 25.68% 947 2.56%
93 23,108 53.24% 17,638 40.63% 1,667 3.84% 994 2.29% 23,511 54.86% 17,413 40.63% 1,936 4.52% 19,952 46.21% 21,906 50.74% 1,316 3.05%
94 29,129 74.62% 8,650 22.16% 894 2.29% 364 0.93% 27,999 72.49% 8,824 22.84% 1,803 4.67% 10,585 27.17% 27,561 70.75% 809 2.08%
95 28,890 65.36% 13,432 30.39% 1,343 3.04% 536 1.21% 28,179 64.55% 13,088 29.98% 2,386 5.47% 16,212 37.00% 26,066 59.50% 1,534 3.50%
96 22,685 62.88% 11,805 32.72% 1,069 2.96% 516 1.43% 22,549 63.28% 11,383 31.95% 1,699 4.77% 13,036 36.38% 21,866 61.02% 935 2.61%
97 28,804 71.97% 9,897 24.73% 971 2.43% 349 0.87% 27,868 70.41% 9,798 24.76% 1,913 4.83% 11,331 28.44% 27,557 69.16% 959 2.41%
98 24,388 51.54% 20,350 43.01% 1,862 3.94% 714 1.51% 26,049 55.74% 18,824 40.28% 1,864 3.99% 22,765 48.54% 22,553 48.09% 1,578 3.36%
99 6,628 19.07% 26,877 77.31% 830 2.39% 430 1.24% 7,073 20.60% 26,097 76.00% 1,169 3.40% 26,426 76.70% 7,280 21.13% 749 2.17%
100 9,065 29.00% 20,731 66.33% 994 3.18% 465 1.49% 9,754 31.61% 19,803 64.18% 1,297 4.20% 20,677 66.67% 9,505 30.65% 830 2.68%
101 8,930 22.86% 28,642 73.33% 994 2.54% 491 1.26% 9,615 24.91% 27,574 71.43% 1,414 3.66% 28,397 73.33% 9,359 24.17% 969 2.50%
102 5,292 16.06% 25,980 78.86% 1,162 3.53% 511 1.55% 6,327 19.52% 24,761 76.39% 1,328 4.10% 26,109 80.03% 5,584 17.12% 931 2.85%
103 22,701 52.01% 18,642 42.71% 1,539 3.53% 769 1.76% 24,458 56.51% 17,208 39.76% 1,617 3.74% 19,220 44.13% 23,328 53.56% 1,003 2.30%
104 20,925 43.85% 23,772 49.82% 1,932 4.05% 1,089 2.28% 25,905 54.36% 20,414 42.84% 1,332 2.80% 24,093 50.36% 22,791 47.64% 955 2.00%
105 20,052 47.27% 20,155 47.52% 1,504 3.55% 705 1.66% 22,414 53.33% 18,049 42.94% 1,569 3.73% 20,512 48.58% 20,692 49.00% 1,021 2.42%
District plan definition file: 'HBK-20.asc', modified 08/24/2017 11:02:00 PM
Data Source: North Carolina State Board of Elections. Votes that could not be associated with a specific precinct were excluded. Reported statewide totals may therefore be marginally lower than official contest results. Page 2 of 3
Printed 08/24/2017 {rptS04|dc2017HS|re1.3.1}
Case 1:15-cv-00399-TDS-JEP Document 184-38 Filed 09/07/17 Page 32 of 44

HBK-20 Speciale - Districts 82 and 83: President 2016, US Senate 2016, Governor 2016NC General Assembly
District Rep Rep % Dem Dem % Lib Lib % Write-In Write-In % Rep Rep % Dem Dem % Lib Lib % Dem Dem % Rep Rep % Lib Lib %
US President 2016: Trump-Clinton-Johnson US Senate 2016: Burr-Ross-Haugh Governor 2016: Cooper-McCrory-Cecil
106 7,622 22.42% 24,886 73.20% 952 2.80% 539 1.59% 8,421 25.05% 24,052 71.55% 1,145 3.41% 24,815 73.54% 8,084 23.96% 846 2.51%
107 7,868 21.04% 28,142 75.25% 886 2.37% 500 1.34% 8,416 22.77% 27,293 73.84% 1,251 3.38% 27,988 75.41% 8,221 22.15% 903 2.43%
108 21,977 61.91% 12,155 34.24% 963 2.71% 405 1.14% 21,400 61.05% 11,934 34.04% 1,722 4.91% 13,133 37.22% 21,326 60.44% 824 2.34%
109 21,849 58.81% 13,856 37.29% 1,026 2.76% 424 1.14% 21,752 59.21% 13,385 36.43% 1,600 4.36% 14,614 39.57% 21,473 58.14% 845 2.29%
110 23,363 67.95% 10,064 29.27% 685 1.99% 272 0.79% 22,465 66.14% 10,103 29.74% 1,399 4.12% 11,006 32.21% 22,520 65.90% 648 1.90%
111 23,088 67.78% 10,066 29.55% 621 1.82% 290 0.85% 22,172 65.93% 10,185 30.29% 1,272 3.78% 11,069 32.68% 22,235 65.64% 569 1.68%
112 25,060 72.71% 8,351 24.23% 717 2.08% 339 0.98% 23,380 69.04% 9,131 26.96% 1,353 4.00% 10,575 31.07% 22,633 66.49% 831 2.44%
113 27,846 61.60% 15,495 34.27% 1,152 2.55% 715 1.58% 27,107 60.73% 15,907 35.64% 1,619 3.63% 17,776 39.74% 25,806 57.69% 1,150 2.57%
114 10,675 21.88% 35,226 72.20% 1,424 2.92% 1,464 3.00% 10,943 22.71% 35,335 73.32% 1,918 3.98% 36,921 76.30% 9,880 20.42% 1,589 3.28%
115 22,578 48.02% 21,856 46.49% 1,453 3.09% 1,127 2.40% 22,563 48.39% 22,221 47.66% 1,839 3.94% 24,377 52.10% 21,034 44.95% 1,382 2.95%
116 22,462 52.07% 18,367 42.57% 1,409 3.27% 903 2.09% 22,583 52.90% 18,335 42.95% 1,776 4.16% 20,574 48.00% 20,962 48.91% 1,323 3.09%
117 25,251 60.45% 14,625 35.01% 1,235 2.96% 660 1.58% 24,962 60.51% 14,605 35.40% 1,688 4.09% 16,583 40.08% 23,567 56.96% 1,227 2.97%
118 25,826 63.62% 13,002 32.03% 1,152 2.84% 616 1.52% 24,143 60.30% 14,050 35.09% 1,845 4.61% 16,169 40.08% 22,971 56.94% 1,202 2.98%
119 19,623 54.48% 14,434 40.08% 1,323 3.67% 637 1.77% 18,853 53.03% 15,016 42.24% 1,683 4.73% 17,194 48.15% 17,362 48.62% 1,156 3.24%
120 30,691 72.91% 9,871 23.45% 1,030 2.45% 501 1.19% 28,591 69.53% 10,931 26.58% 1,600 3.89% 12,825 31.06% 27,221 65.92% 1,249 3.02%
2,359,749 2,180,316 129,929 59,397 2,392,439 2,119,696 167,190 2,300,381 2,296,039 102,72949.90% 46.10% 2.75% 1.26% 51.13% 45.30% 3.57% 48.95% 48.86% 2.19%Totals:
District plan definition file: 'HBK-20.asc', modified 08/24/2017 11:02:00 PM
Data Source: North Carolina State Board of Elections. Votes that could not be associated with a specific precinct were excluded. Reported statewide totals may therefore be marginally lower than official contest results. Page 3 of 3
Printed 08/24/2017 {rptS04|dc2017HS|re1.3.1}
Case 1:15-cv-00399-TDS-JEP Document 184-38 Filed 09/07/17 Page 33 of 44
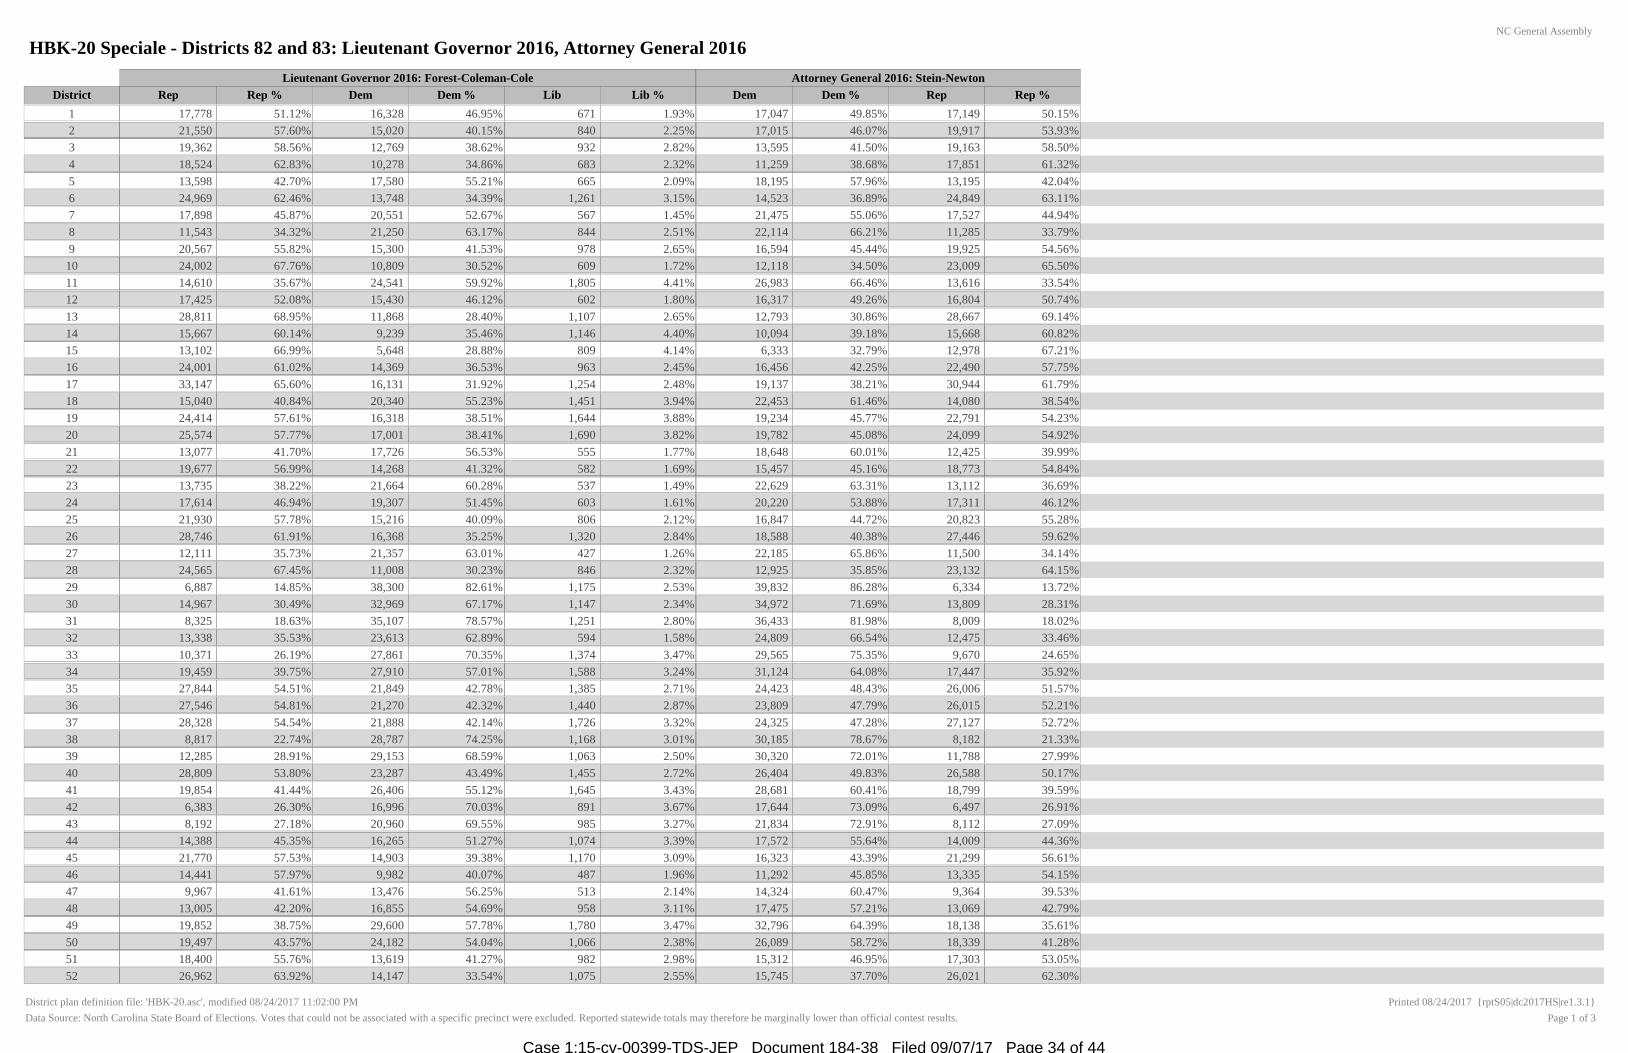
HBK-20 Speciale - Districts 82 and 83: Lieutenant Governor 2016, Attorney General 2016NC General Assembly
District Rep Rep % Dem Dem % Lib Lib % Dem Dem % Rep Rep %
Lieutenant Governor 2016: Forest-Coleman-Cole Attorney General 2016: Stein-Newton
1 17,778 51.12% 16,328 46.95% 671 1.93% 17,047 49.85% 17,149 50.15%
2 21,550 57.60% 15,020 40.15% 840 2.25% 17,015 46.07% 19,917 53.93%
3 19,362 58.56% 12,769 38.62% 932 2.82% 13,595 41.50% 19,163 58.50%
4 18,524 62.83% 10,278 34.86% 683 2.32% 11,259 38.68% 17,851 61.32%
5 13,598 42.70% 17,580 55.21% 665 2.09% 18,195 57.96% 13,195 42.04%
6 24,969 62.46% 13,748 34.39% 1,261 3.15% 14,523 36.89% 24,849 63.11%
7 17,898 45.87% 20,551 52.67% 567 1.45% 21,475 55.06% 17,527 44.94%
8 11,543 34.32% 21,250 63.17% 844 2.51% 22,114 66.21% 11,285 33.79%
9 20,567 55.82% 15,300 41.53% 978 2.65% 16,594 45.44% 19,925 54.56%
10 24,002 67.76% 10,809 30.52% 609 1.72% 12,118 34.50% 23,009 65.50%
11 14,610 35.67% 24,541 59.92% 1,805 4.41% 26,983 66.46% 13,616 33.54%
12 17,425 52.08% 15,430 46.12% 602 1.80% 16,317 49.26% 16,804 50.74%
13 28,811 68.95% 11,868 28.40% 1,107 2.65% 12,793 30.86% 28,667 69.14%
14 15,667 60.14% 9,239 35.46% 1,146 4.40% 10,094 39.18% 15,668 60.82%
15 13,102 66.99% 5,648 28.88% 809 4.14% 6,333 32.79% 12,978 67.21%
16 24,001 61.02% 14,369 36.53% 963 2.45% 16,456 42.25% 22,490 57.75%
17 33,147 65.60% 16,131 31.92% 1,254 2.48% 19,137 38.21% 30,944 61.79%
18 15,040 40.84% 20,340 55.23% 1,451 3.94% 22,453 61.46% 14,080 38.54%
19 24,414 57.61% 16,318 38.51% 1,644 3.88% 19,234 45.77% 22,791 54.23%
20 25,574 57.77% 17,001 38.41% 1,690 3.82% 19,782 45.08% 24,099 54.92%
21 13,077 41.70% 17,726 56.53% 555 1.77% 18,648 60.01% 12,425 39.99%
22 19,677 56.99% 14,268 41.32% 582 1.69% 15,457 45.16% 18,773 54.84%
23 13,735 38.22% 21,664 60.28% 537 1.49% 22,629 63.31% 13,112 36.69%
24 17,614 46.94% 19,307 51.45% 603 1.61% 20,220 53.88% 17,311 46.12%
25 21,930 57.78% 15,216 40.09% 806 2.12% 16,847 44.72% 20,823 55.28%
26 28,746 61.91% 16,368 35.25% 1,320 2.84% 18,588 40.38% 27,446 59.62%
27 12,111 35.73% 21,357 63.01% 427 1.26% 22,185 65.86% 11,500 34.14%
28 24,565 67.45% 11,008 30.23% 846 2.32% 12,925 35.85% 23,132 64.15%
29 6,887 14.85% 38,300 82.61% 1,175 2.53% 39,832 86.28% 6,334 13.72%
30 14,967 30.49% 32,969 67.17% 1,147 2.34% 34,972 71.69% 13,809 28.31%
31 8,325 18.63% 35,107 78.57% 1,251 2.80% 36,433 81.98% 8,009 18.02%
32 13,338 35.53% 23,613 62.89% 594 1.58% 24,809 66.54% 12,475 33.46%
33 10,371 26.19% 27,861 70.35% 1,374 3.47% 29,565 75.35% 9,670 24.65%
34 19,459 39.75% 27,910 57.01% 1,588 3.24% 31,124 64.08% 17,447 35.92%
35 27,844 54.51% 21,849 42.78% 1,385 2.71% 24,423 48.43% 26,006 51.57%
36 27,546 54.81% 21,270 42.32% 1,440 2.87% 23,809 47.79% 26,015 52.21%
37 28,328 54.54% 21,888 42.14% 1,726 3.32% 24,325 47.28% 27,127 52.72%
38 8,817 22.74% 28,787 74.25% 1,168 3.01% 30,185 78.67% 8,182 21.33%
39 12,285 28.91% 29,153 68.59% 1,063 2.50% 30,320 72.01% 11,788 27.99%
40 28,809 53.80% 23,287 43.49% 1,455 2.72% 26,404 49.83% 26,588 50.17%
41 19,854 41.44% 26,406 55.12% 1,645 3.43% 28,681 60.41% 18,799 39.59%
42 6,383 26.30% 16,996 70.03% 891 3.67% 17,644 73.09% 6,497 26.91%
43 8,192 27.18% 20,960 69.55% 985 3.27% 21,834 72.91% 8,112 27.09%
44 14,388 45.35% 16,265 51.27% 1,074 3.39% 17,572 55.64% 14,009 44.36%
45 21,770 57.53% 14,903 39.38% 1,170 3.09% 16,323 43.39% 21,299 56.61%
46 14,441 57.97% 9,982 40.07% 487 1.96% 11,292 45.85% 13,335 54.15%
47 9,967 41.61% 13,476 56.25% 513 2.14% 14,324 60.47% 9,364 39.53%
48 13,005 42.20% 16,855 54.69% 958 3.11% 17,475 57.21% 13,069 42.79%
49 19,852 38.75% 29,600 57.78% 1,780 3.47% 32,796 64.39% 18,138 35.61%
50 19,497 43.57% 24,182 54.04% 1,066 2.38% 26,089 58.72% 18,339 41.28%
51 18,400 55.76% 13,619 41.27% 982 2.98% 15,312 46.95% 17,303 53.05%
52 26,962 63.92% 14,147 33.54% 1,075 2.55% 15,745 37.70% 26,021 62.30%
District plan definition file: 'HBK-20.asc', modified 08/24/2017 11:02:00 PM
Data Source: North Carolina State Board of Elections. Votes that could not be associated with a specific precinct were excluded. Reported statewide totals may therefore be marginally lower than official contest results. Page 1 of 3
Printed 08/24/2017 {rptS05|dc2017HS|re1.3.1}
Case 1:15-cv-00399-TDS-JEP Document 184-38 Filed 09/07/17 Page 34 of 44
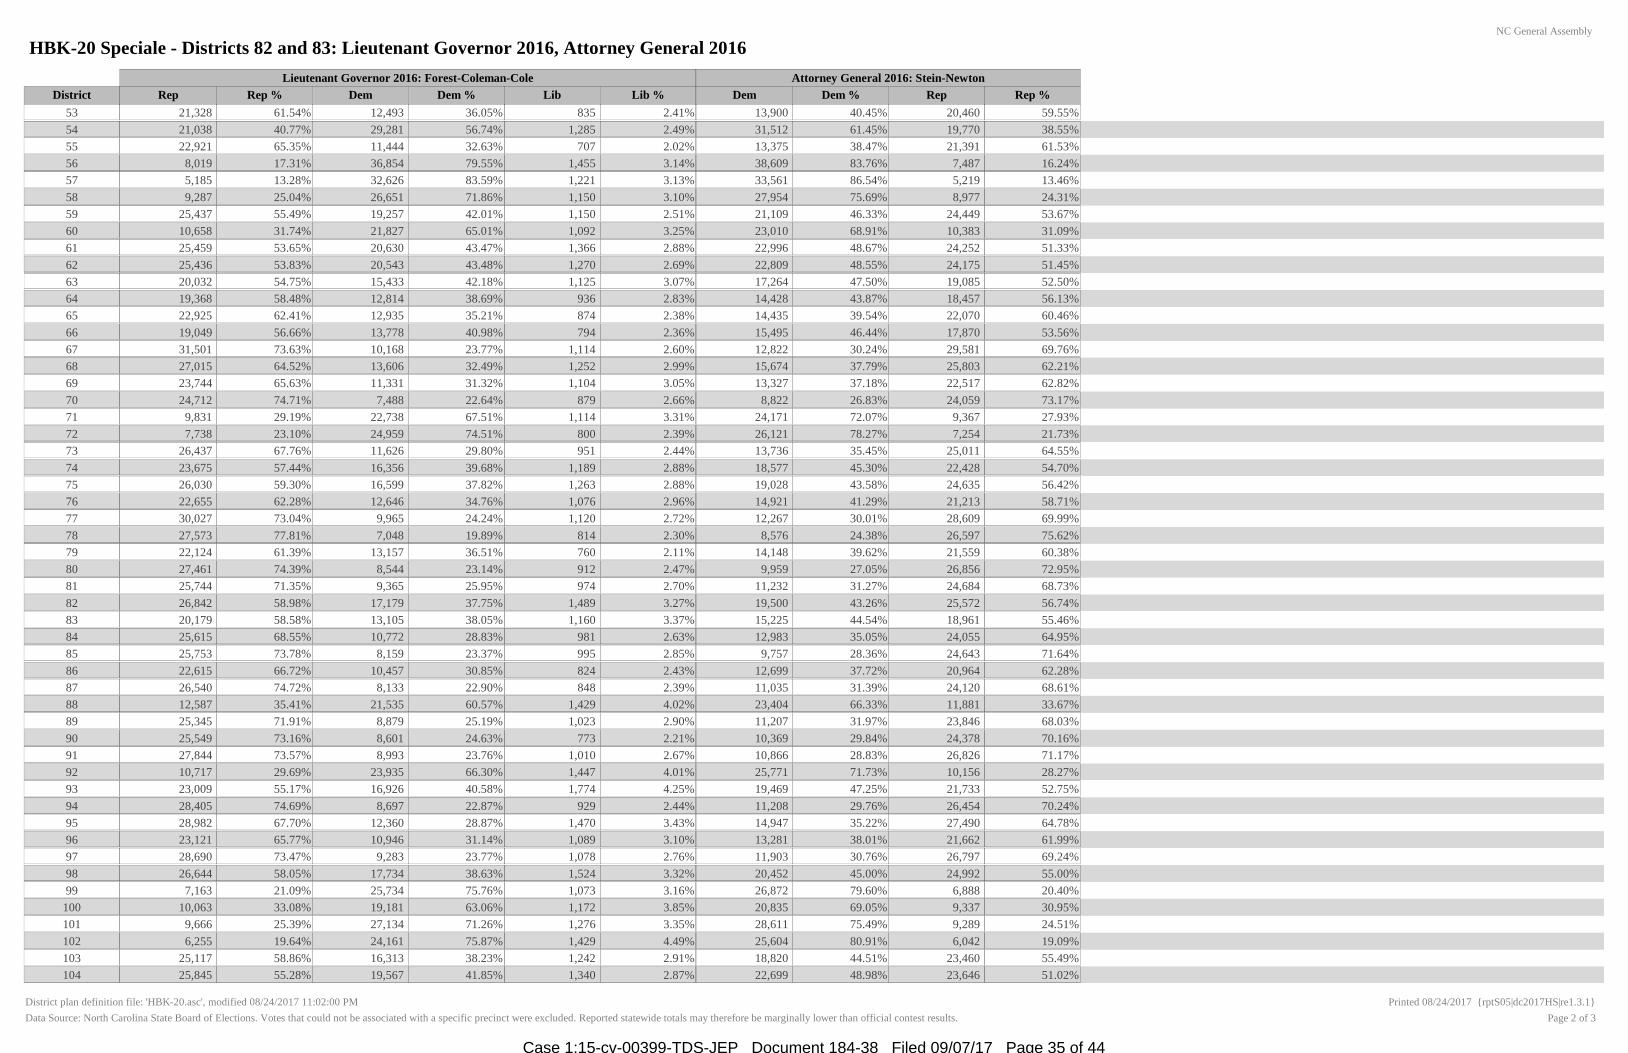
HBK-20 Speciale - Districts 82 and 83: Lieutenant Governor 2016, Attorney General 2016NC General Assembly
District Rep Rep % Dem Dem % Lib Lib % Dem Dem % Rep Rep %
Lieutenant Governor 2016: Forest-Coleman-Cole Attorney General 2016: Stein-Newton
53 21,328 61.54% 12,493 36.05% 835 2.41% 13,900 40.45% 20,460 59.55%
54 21,038 40.77% 29,281 56.74% 1,285 2.49% 31,512 61.45% 19,770 38.55%
55 22,921 65.35% 11,444 32.63% 707 2.02% 13,375 38.47% 21,391 61.53%
56 8,019 17.31% 36,854 79.55% 1,455 3.14% 38,609 83.76% 7,487 16.24%
57 5,185 13.28% 32,626 83.59% 1,221 3.13% 33,561 86.54% 5,219 13.46%
58 9,287 25.04% 26,651 71.86% 1,150 3.10% 27,954 75.69% 8,977 24.31%
59 25,437 55.49% 19,257 42.01% 1,150 2.51% 21,109 46.33% 24,449 53.67%
60 10,658 31.74% 21,827 65.01% 1,092 3.25% 23,010 68.91% 10,383 31.09%
61 25,459 53.65% 20,630 43.47% 1,366 2.88% 22,996 48.67% 24,252 51.33%
62 25,436 53.83% 20,543 43.48% 1,270 2.69% 22,809 48.55% 24,175 51.45%
63 20,032 54.75% 15,433 42.18% 1,125 3.07% 17,264 47.50% 19,085 52.50%
64 19,368 58.48% 12,814 38.69% 936 2.83% 14,428 43.87% 18,457 56.13%
65 22,925 62.41% 12,935 35.21% 874 2.38% 14,435 39.54% 22,070 60.46%
66 19,049 56.66% 13,778 40.98% 794 2.36% 15,495 46.44% 17,870 53.56%
67 31,501 73.63% 10,168 23.77% 1,114 2.60% 12,822 30.24% 29,581 69.76%
68 27,015 64.52% 13,606 32.49% 1,252 2.99% 15,674 37.79% 25,803 62.21%
69 23,744 65.63% 11,331 31.32% 1,104 3.05% 13,327 37.18% 22,517 62.82%
70 24,712 74.71% 7,488 22.64% 879 2.66% 8,822 26.83% 24,059 73.17%
71 9,831 29.19% 22,738 67.51% 1,114 3.31% 24,171 72.07% 9,367 27.93%
72 7,738 23.10% 24,959 74.51% 800 2.39% 26,121 78.27% 7,254 21.73%
73 26,437 67.76% 11,626 29.80% 951 2.44% 13,736 35.45% 25,011 64.55%
74 23,675 57.44% 16,356 39.68% 1,189 2.88% 18,577 45.30% 22,428 54.70%
75 26,030 59.30% 16,599 37.82% 1,263 2.88% 19,028 43.58% 24,635 56.42%
76 22,655 62.28% 12,646 34.76% 1,076 2.96% 14,921 41.29% 21,213 58.71%
77 30,027 73.04% 9,965 24.24% 1,120 2.72% 12,267 30.01% 28,609 69.99%
78 27,573 77.81% 7,048 19.89% 814 2.30% 8,576 24.38% 26,597 75.62%
79 22,124 61.39% 13,157 36.51% 760 2.11% 14,148 39.62% 21,559 60.38%
80 27,461 74.39% 8,544 23.14% 912 2.47% 9,959 27.05% 26,856 72.95%
81 25,744 71.35% 9,365 25.95% 974 2.70% 11,232 31.27% 24,684 68.73%
82 26,842 58.98% 17,179 37.75% 1,489 3.27% 19,500 43.26% 25,572 56.74%
83 20,179 58.58% 13,105 38.05% 1,160 3.37% 15,225 44.54% 18,961 55.46%
84 25,615 68.55% 10,772 28.83% 981 2.63% 12,983 35.05% 24,055 64.95%
85 25,753 73.78% 8,159 23.37% 995 2.85% 9,757 28.36% 24,643 71.64%
86 22,615 66.72% 10,457 30.85% 824 2.43% 12,699 37.72% 20,964 62.28%
87 26,540 74.72% 8,133 22.90% 848 2.39% 11,035 31.39% 24,120 68.61%
88 12,587 35.41% 21,535 60.57% 1,429 4.02% 23,404 66.33% 11,881 33.67%
89 25,345 71.91% 8,879 25.19% 1,023 2.90% 11,207 31.97% 23,846 68.03%
90 25,549 73.16% 8,601 24.63% 773 2.21% 10,369 29.84% 24,378 70.16%
91 27,844 73.57% 8,993 23.76% 1,010 2.67% 10,866 28.83% 26,826 71.17%
92 10,717 29.69% 23,935 66.30% 1,447 4.01% 25,771 71.73% 10,156 28.27%
93 23,009 55.17% 16,926 40.58% 1,774 4.25% 19,469 47.25% 21,733 52.75%
94 28,405 74.69% 8,697 22.87% 929 2.44% 11,208 29.76% 26,454 70.24%
95 28,982 67.70% 12,360 28.87% 1,470 3.43% 14,947 35.22% 27,490 64.78%
96 23,121 65.77% 10,946 31.14% 1,089 3.10% 13,281 38.01% 21,662 61.99%
97 28,690 73.47% 9,283 23.77% 1,078 2.76% 11,903 30.76% 26,797 69.24%
98 26,644 58.05% 17,734 38.63% 1,524 3.32% 20,452 45.00% 24,992 55.00%
99 7,163 21.09% 25,734 75.76% 1,073 3.16% 26,872 79.60% 6,888 20.40%
100 10,063 33.08% 19,181 63.06% 1,172 3.85% 20,835 69.05% 9,337 30.95%
101 9,666 25.39% 27,134 71.26% 1,276 3.35% 28,611 75.49% 9,289 24.51%
102 6,255 19.64% 24,161 75.87% 1,429 4.49% 25,604 80.91% 6,042 19.09%
103 25,117 58.86% 16,313 38.23% 1,242 2.91% 18,820 44.51% 23,460 55.49%
104 25,845 55.28% 19,567 41.85% 1,340 2.87% 22,699 48.98% 23,646 51.02%
District plan definition file: 'HBK-20.asc', modified 08/24/2017 11:02:00 PM
Data Source: North Carolina State Board of Elections. Votes that could not be associated with a specific precinct were excluded. Reported statewide totals may therefore be marginally lower than official contest results. Page 2 of 3
Printed 08/24/2017 {rptS05|dc2017HS|re1.3.1}
Case 1:15-cv-00399-TDS-JEP Document 184-38 Filed 09/07/17 Page 35 of 44

HBK-20 Speciale - Districts 82 and 83: Lieutenant Governor 2016, Attorney General 2016NC General Assembly
District Rep Rep % Dem Dem % Lib Lib % Dem Dem % Rep Rep %
Lieutenant Governor 2016: Forest-Coleman-Cole Attorney General 2016: Stein-Newton
105 22,913 55.44% 17,133 41.45% 1,287 3.11% 19,598 47.84% 21,369 52.16%
106 8,550 25.79% 23,420 70.66% 1,176 3.55% 24,690 75.03% 8,218 24.97%
107 8,546 23.39% 26,870 73.54% 1,124 3.08% 28,191 77.62% 8,126 22.38%
108 22,310 64.29% 11,377 32.79% 1,013 2.92% 13,450 39.21% 20,851 60.79%
109 22,545 62.11% 12,803 35.27% 950 2.62% 14,882 41.40% 21,065 58.60%
110 23,200 68.91% 9,752 28.97% 715 2.12% 11,596 34.80% 21,723 65.20%
111 22,768 68.36% 9,875 29.65% 661 1.98% 11,856 36.00% 21,073 64.00%
112 23,864 71.32% 8,660 25.88% 937 2.80% 9,906 29.88% 23,248 70.12%
113 27,273 61.90% 15,470 35.11% 1,314 2.98% 16,730 38.29% 26,962 61.71%
114 10,534 22.22% 34,662 73.10% 2,218 4.68% 36,615 77.84% 10,425 22.16%
115 22,047 48.06% 22,007 47.98% 1,816 3.96% 23,858 52.43% 21,647 47.57%
116 21,972 52.39% 18,326 43.70% 1,641 3.91% 19,951 47.93% 21,673 52.07%
117 25,457 62.47% 14,037 34.45% 1,255 3.08% 15,539 38.46% 24,861 61.54%
118 23,864 60.56% 14,093 35.76% 1,451 3.68% 15,949 40.83% 23,111 59.17%
119 18,801 53.70% 14,824 42.34% 1,385 3.96% 16,595 47.85% 18,084 52.15%
120 28,296 69.92% 10,903 26.94% 1,271 3.14% 11,790 29.51% 28,166 70.49%
2,390,619 2,084,975 132,360 2,294,855 2,276,276Totals: 51.88% 45.25% 2.87% 50.20% 49.80%
District plan definition file: 'HBK-20.asc', modified 08/24/2017 11:02:00 PM
Data Source: North Carolina State Board of Elections. Votes that could not be associated with a specific precinct were excluded. Reported statewide totals may therefore be marginally lower than official contest results. Page 3 of 3
Printed 08/24/2017 {rptS05|dc2017HS|re1.3.1}
Case 1:15-cv-00399-TDS-JEP Document 184-38 Filed 09/07/17 Page 36 of 44

Measures of Compactness08/24/2017
Plan Name:Plan Type:Date:Time:Administrator:
HBK-20
08/24/201711:00:15PM
Sum
Mean
Max
Std. Dev.
Min
N/A
0.700.41
0.20
0.09
0.130.710.320.11
N/A
DISTRICT ReockPolsby-Popper
1 0.49 0.182 0.43 0.493 0.37 0.334 0.44 0.375 0.25 0.276 0.33 0.247 0.50 0.358 0.51 0.399 0.40 0.2710 0.36 0.2311 0.36 0.3012 0.36 0.3413 0.24 0.2214 0.39 0.2815 0.55 0.3716 0.31 0.2217 0.48 0.3018 0.51 0.3319 0.20 0.2820 0.36 0.2021 0.32 0.1422 0.49 0.2323 0.35 0.2424 0.53 0.7125 0.52 0.3226 0.39 0.3127 0.52 0.4028 0.38 0.2429 0.39 0.3430 0.40 0.3931 0.50 0.3732 0.53 0.5133 0.42 0.3134 0.44 0.3335 0.37 0.3136 0.31 0.2137 0.40 0.3838 0.31 0.2539 0.33 0.2640 0.52 0.35
1
Case 1:15-cv-00399-TDS-JEP Document 184-38 Filed 09/07/17 Page 37 of 44
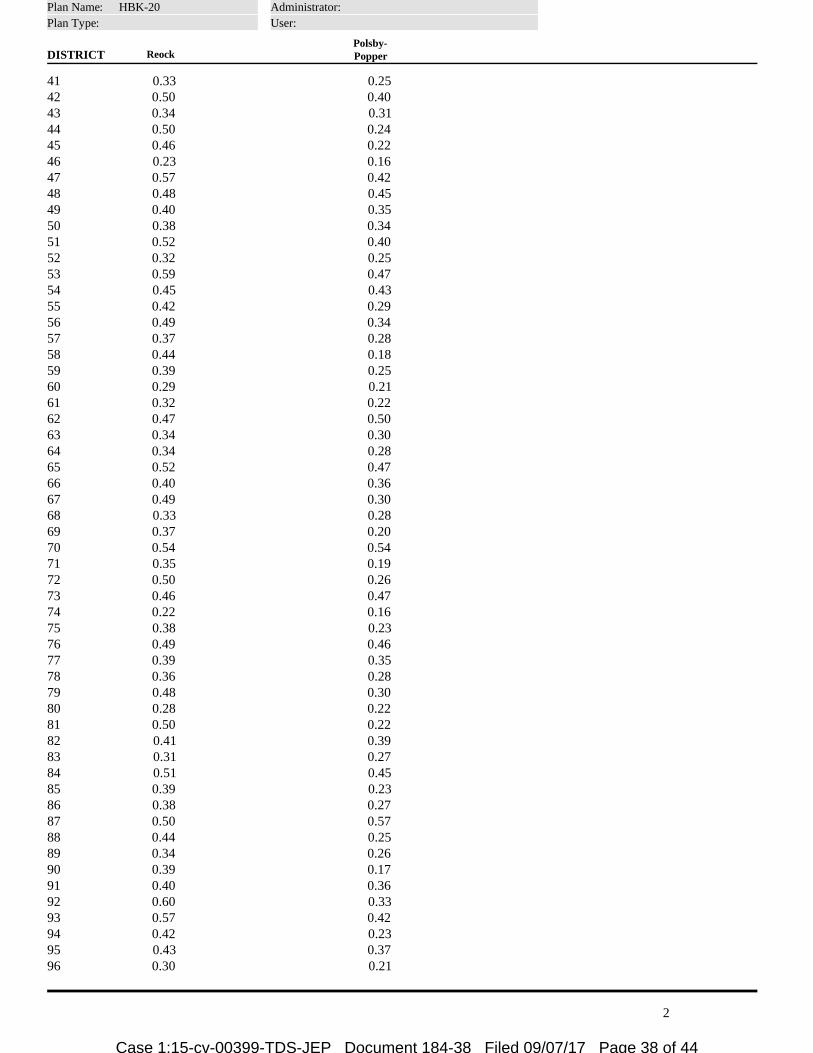
DISTRICT Reock
Plan Name: HBK-20Plan Type:
Administrator:User:
Polsby-Popper
41 0.33 0.2542 0.50 0.4043 0.34 0.3144 0.50 0.2445 0.46 0.2246 0.23 0.1647 0.57 0.4248 0.48 0.4549 0.40 0.3550 0.38 0.3451 0.52 0.4052 0.32 0.2553 0.59 0.4754 0.45 0.4355 0.42 0.2956 0.49 0.3457 0.37 0.2858 0.44 0.1859 0.39 0.2560 0.29 0.2161 0.32 0.2262 0.47 0.5063 0.34 0.3064 0.34 0.2865 0.52 0.4766 0.40 0.3667 0.49 0.3068 0.33 0.2869 0.37 0.2070 0.54 0.5471 0.35 0.1972 0.50 0.2673 0.46 0.4774 0.22 0.1675 0.38 0.2376 0.49 0.4677 0.39 0.3578 0.36 0.2879 0.48 0.3080 0.28 0.2281 0.50 0.2282 0.41 0.3983 0.31 0.2784 0.51 0.4585 0.39 0.2386 0.38 0.2787 0.50 0.5788 0.44 0.2589 0.34 0.2690 0.39 0.1791 0.40 0.3692 0.60 0.3393 0.57 0.4294 0.42 0.2395 0.43 0.3796 0.30 0.21
2
Case 1:15-cv-00399-TDS-JEP Document 184-38 Filed 09/07/17 Page 38 of 44
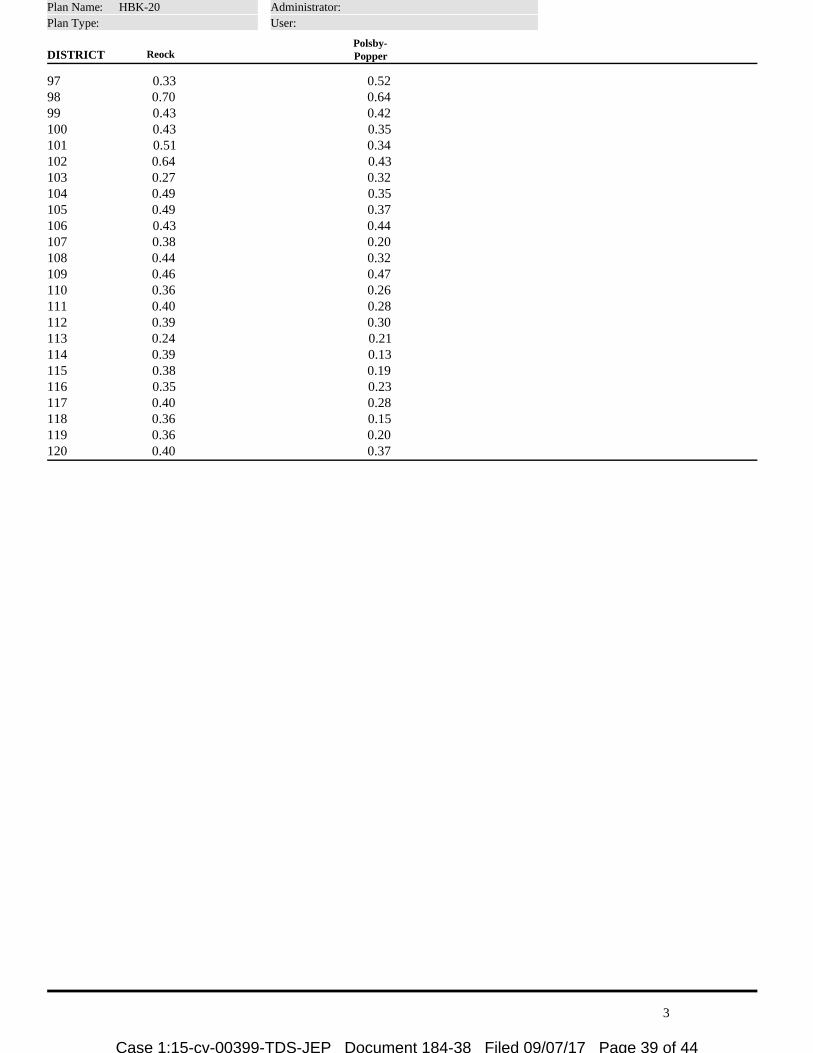
DISTRICT Reock
Plan Name: HBK-20Plan Type:
Administrator:User:
Polsby-Popper
97 0.33 0.5298 0.70 0.6499 0.43 0.42100 0.43 0.35101 0.51 0.34102 0.64 0.43103 0.27 0.32104 0.49 0.35105 0.49 0.37106 0.43 0.44107 0.38 0.20108 0.44 0.32109 0.46 0.47110 0.36 0.26111 0.40 0.28112 0.39 0.30113 0.24 0.21114 0.39 0.13115 0.38 0.19116 0.35 0.23117 0.40 0.28118 0.36 0.15119 0.36 0.20120 0.40 0.37
3
Case 1:15-cv-00399-TDS-JEP Document 184-38 Filed 09/07/17 Page 39 of 44
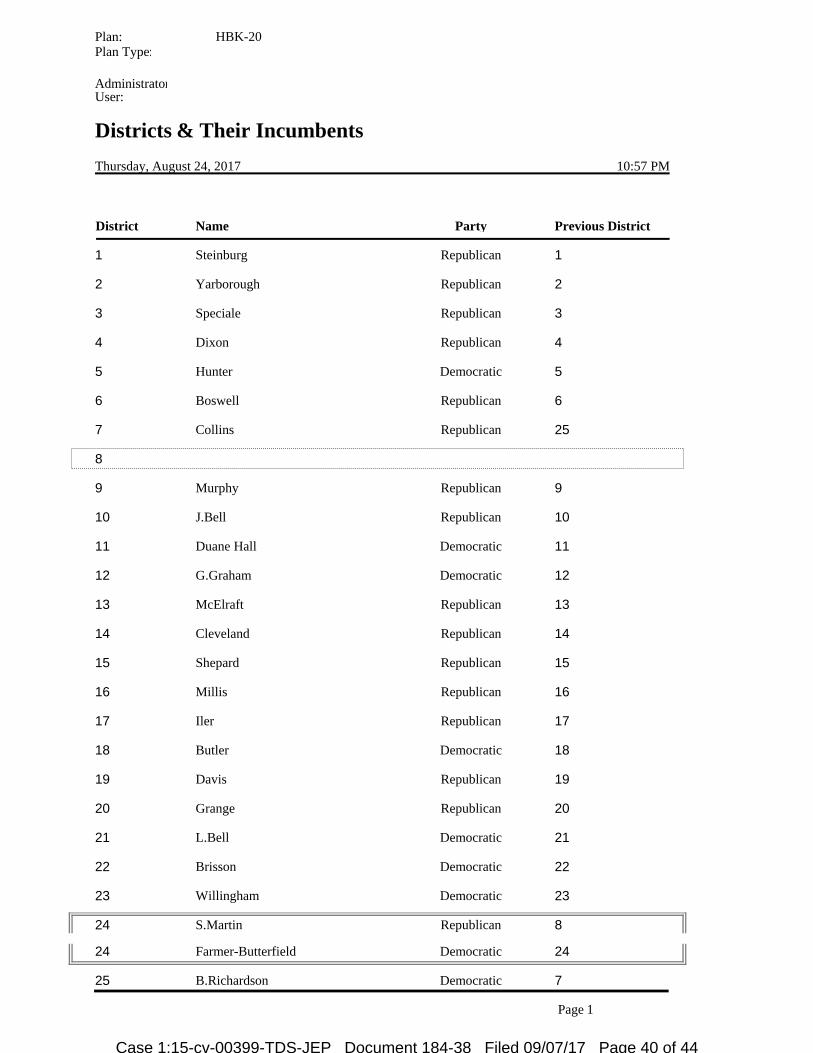
Districts & Their Incumbents
Thursday, August 24, 2017 10:57 PM
Plan:Plan Type:
AdministratorUser:
HBK-20
District Name Party Previous District
Steinburg Republican1 1
Yarborough Republican2 2
Speciale Republican3 3
Dixon Republican4 4
Hunter Democratic5 5
Boswell Republican6 6
Collins Republican7 25
8
Murphy Republican9 9
J.Bell Republican10 10
Duane Hall Democratic11 11
G.Graham Democratic12 12
McElraft Republican13 13
Cleveland Republican14 14
Shepard Republican15 15
Millis Republican16 16
Iler Republican17 17
Butler Democratic18 18
Davis Republican19 19
Grange Republican20 20
L.Bell Democratic21 21
Brisson Democratic22 22
Willingham Democratic23 23
S.Martin Republican24 8
Farmer-Butterfield Democratic24 24
B.Richardson Democratic25 7
Page 1
Case 1:15-cv-00399-TDS-JEP Document 184-38 Filed 09/07/17 Page 40 of 44

District Name Party
Plan:Type:
HBK-20 Administrator: User:
Previous District
White Republican26 26
Wray Democratic27 27
Strickland Republican28 28
Black Democratic29 29
Morey Democratic30 30
Michaux Democratic31 31
Garrison Democratic32 32
Gill Democratic33 33
G.Martin Democratic34 34
Malone Republican35 35
Dollar Republican36 36
Williams Republican37 37
Holley Democratic38 38
Jackson Democratic39 39
John Democratic40 40
Adcock Democratic41 41
Lucas Democratic42 42
Floyd Democratic43 43
W.Richardson Democratic44 44
Szoka Republican45 45
Brenden Jones Republican46 46
C.Graham Democratic47 47
Pierce Democratic48 48
Ball Democrat49 49
Meyer Democratic50 50
Sauls Republican51 51
Reives Democratic51 54
Boles Republican52 52
Lewis Republican53 53
54
Brody Republican55 55
Page 2
Case 1:15-cv-00399-TDS-JEP Document 184-38 Filed 09/07/17 Page 41 of 44
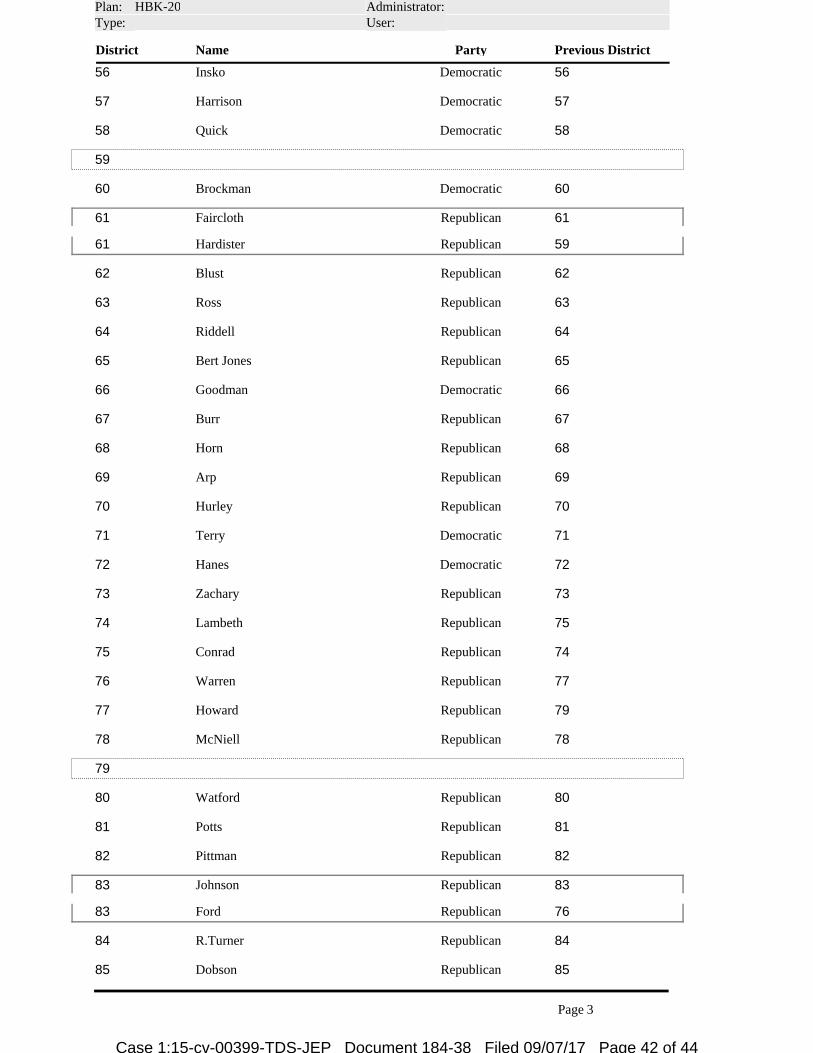
District Name Party
Plan:Type:
HBK-20 Administrator: User:
Previous District
Insko Democratic56 56
Harrison Democratic57 57
Quick Democratic58 58
59
Brockman Democratic60 60
Faircloth Republican61 61
Hardister Republican61 59
Blust Republican62 62
Ross Republican63 63
Riddell Republican64 64
Bert Jones Republican65 65
Goodman Democratic66 66
Burr Republican67 67
Horn Republican68 68
Arp Republican69 69
Hurley Republican70 70
Terry Democratic71 71
Hanes Democratic72 72
Zachary Republican73 73
Lambeth Republican74 75
Conrad Republican75 74
Warren Republican76 77
Howard Republican77 79
McNiell Republican78 78
79
Watford Republican80 80
Potts Republican81 81
Pittman Republican82 82
Johnson Republican83 83
Ford Republican83 76
R.Turner Republican84 84
Dobson Republican85 85
Page 3
Case 1:15-cv-00399-TDS-JEP Document 184-38 Filed 09/07/17 Page 42 of 44
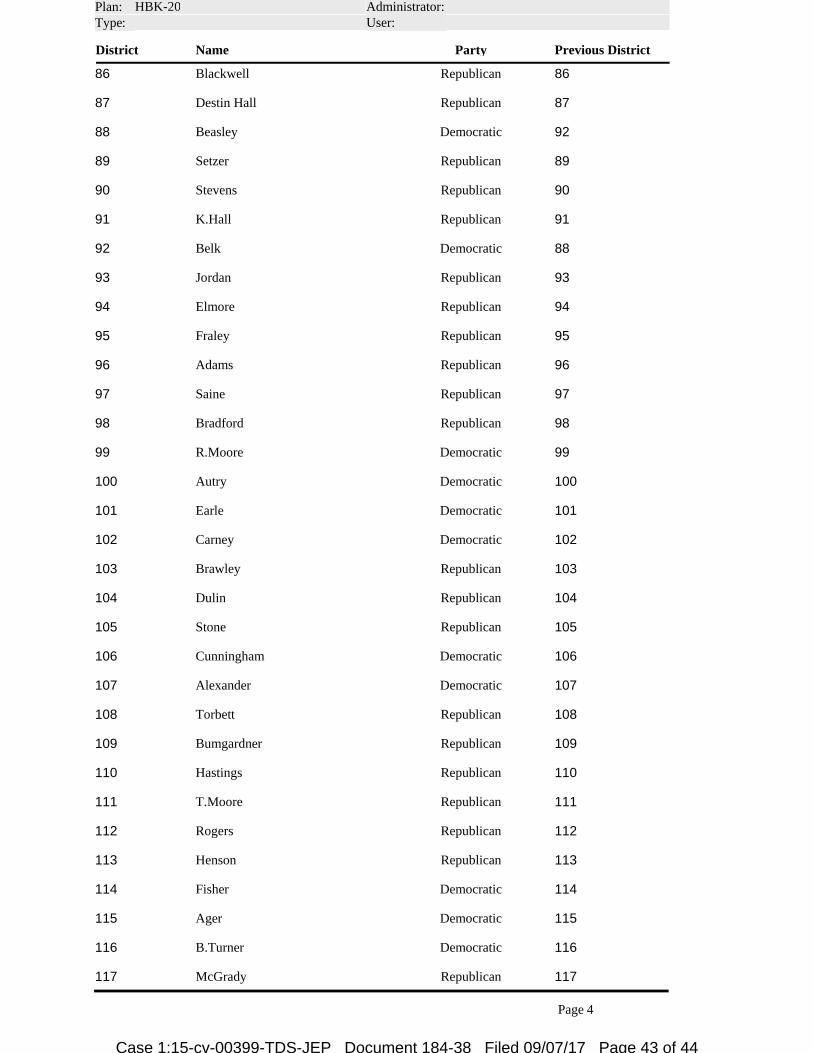
District Name Party
Plan:Type:
HBK-20 Administrator: User:
Previous District
Blackwell Republican86 86
Destin Hall Republican87 87
Beasley Democratic88 92
Setzer Republican89 89
Stevens Republican90 90
K.Hall Republican91 91
Belk Democratic92 88
Jordan Republican93 93
Elmore Republican94 94
Fraley Republican95 95
Adams Republican96 96
Saine Republican97 97
Bradford Republican98 98
R.Moore Democratic99 99
Autry Democratic100 100
Earle Democratic101 101
Carney Democratic102 102
Brawley Republican103 103
Dulin Republican104 104
Stone Republican105 105
Cunningham Democratic106 106
Alexander Democratic107 107
Torbett Republican108 108
Bumgardner Republican109 109
Hastings Republican110 110
T.Moore Republican111 111
Rogers Republican112 112
Henson Republican113 113
Fisher Democratic114 114
Ager Democratic115 115
B.Turner Democratic116 116
McGrady Republican117 117
Page 4
Case 1:15-cv-00399-TDS-JEP Document 184-38 Filed 09/07/17 Page 43 of 44
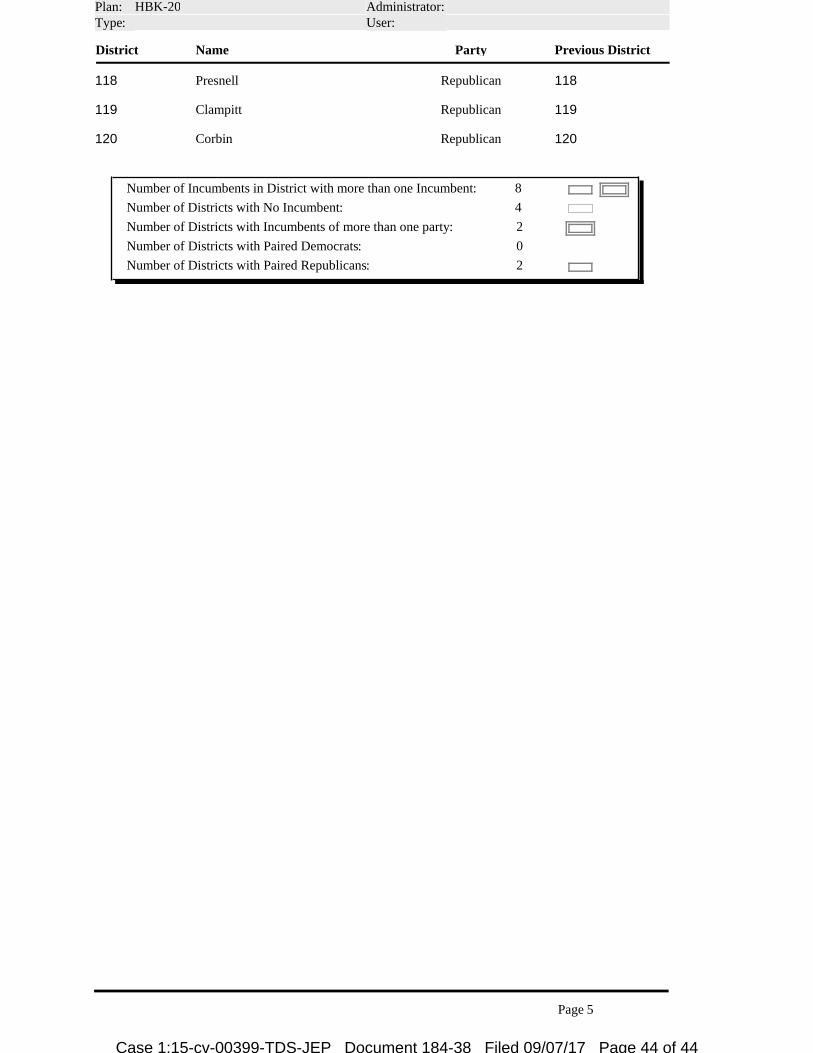
District Name Party
Plan:Type:
HBK-20 Administrator: User:
Previous District
Presnell Republican118 118
Clampitt Republican119 119
Corbin Republican120 120
8
4
Number of Incumbents in District with more than one Incumbent:
Number of Districts with No Incumbent:
2
0
2
Number of Districts with Incumbents of more than one party:
Number of Districts with Paired Democrats:
Number of Districts with Paired Republicans:
Page 5
Case 1:15-cv-00399-TDS-JEP Document 184-38 Filed 09/07/17 Page 44 of 44